temple university multipurpose health - penn state … · the temple university multipurpose health...
TRANSCRIPT

Multipurpose Health Science Center
Temple University
3500 N. Broad St. Philadelphia, Pennsylvania 19140 Michael Wiegmann
[TECHNICAL ASSIGNMENT 3] Michael Wiegmann – Structural Option – Faculty Advisor Prof. Hanagan

Temple University Multipurpose Health Science Center
– Michael Wiegmann – TECHNICAL ASSIGNMENT 3 – Structural
2 | P a g e
Table of Contents Executive Summary……………………………………..…………………….…Page 3
Introduction ……………………………………………….……………..………..Page 4 Structural System ……………………………………………….……………....Page Codes applied…………………………………………………………………….…Page 7
Loads and Load Cases…………………………………………………….……..Page 8
Lateral Force Distribution ……………………………………………..……..Page 13 Torsion ……………………………………………..……………………………….…Page 18
Strength Check………………………………………….………………………….Page 20 Overturning Moments………………………………………………………….Page 22 Story Drifts……………………………………………..…………………………….Page 23 Conclusions…………………………………………………………………………. Page 24
Appendix……………………………………………..……………………………….Page 26

Temple University Multipurpose Health Science Center
– Michael Wiegmann – TECHNICAL ASSIGNMENT 3 – Structural
3 | P a g e
Executive Summary The purpose of this report is to investigate the lateral system of the Temple University Multipurpose
Health Science Center. Wind and seismic forces in various load combinations were applied to a RAM Structural System model – including hand back‐up calculation – in order to check the lateral system strength, drift, and shear, and impacts on the foundations including overturning.
The health science center is a new 480,000 square foot, $150 million addition to Temple University’s medical campus north of Center City Philadelphia, Pennsylvania. The 13 story building contains offices, a café, and a large library, with spaces primarily allocated to laboratories, classrooms, and their support facilities. The architectural features are governed by the concept of expressing internal functions externally, where the curved glass façade of the east elevation indicating the office areas with the brick rectangle behind it expressing the laboratories and classrooms, and the oval tower expressing student meeting and studying spaces.
Built on a previous parking lot, the steel framed building will connect to an existing building via a bridge and tunnel. Foundations consist of 40% footings and 60% caissons which terminate at solid bedrock, present at 30’ to 50’ depths. The lateral system consists of concentric braced frames in the E‐W direction, with moment frames in the N‐S direction, all of which are supported by caissons. The floor system consists of composite steel decking.
The lateral analysis of this building includes load determination, distribution, and calculation of torsional shears, with checks for strength, overturning moment, and story drift. Lateral load analysis yielded a wind base shear of 1525 kips in the East‐West direction and 506 kips in the North‐South direction, while seismic analysis resulted in a 1001 kips base shear acting in both directions. These loads were then manually distributed vertically, and then laterally distributed using a RAM Structural System model. Wind load combinations in the East‐West direction and seismic load combinations in the North‐South direction controlled the distribution. Relative stiffness was checked manually, since it is the guiding concept behind these distributions. After the relative stiffness of the frames was calculated, the story shear given by the RAM output could be manually checked. Significant discrepancies were most likely due to the simplified analysis method used to determine the relative stiffness of the frames.
An analysis of torsional shear was also included using center of mass and geometry, which was verified by hand. It was found that torsional shear was greatest for both controlling load conditions due to the asymmetrical base of the building, but the seismic torsional shear was especially high due to the size of the base shear in the North‐South direction, which was much higher than the wind load combinations in the same direction.
Since member sizes were included in the computer model, the output member forces were compared to the capacities listed in the design documents, yielding satisfactory results. Additionally, an overturning moment of nearly 40,000 k‐ft was calculated using story shear data and compared to bearing capacities derived from the design documents. Both tension capacity (3077 kips) and compressions bearing capacities (3014 kips) proved adequate to resist the overturning moment reactions of 1035 kips of a typical frame. Lastly, a story drift analysis yielded wind load drifts under the allowable 6”, but seismic loads did not meet restrictions with drifts around 13”. This is most likely due to a combination of analysis error and the fact that the building was not specifically designed for seismic loading.

Temple University Multipurpose Health Science Center
– Michael Wiegmann – TECHNICAL ASSIGNMENT 3 – Structural
4 | P a g e
Introduction
Building Description The Temple University Multipurpose Health Science Center is a new 480,000 square
foot, $150 million addition to Temple University’s medical campus north of Center City Philadelphia, Pennsylvania. The 13 story building contains offices, a café, and a large library, with spaces primarily allocated to laboratories, classrooms, and their support facilities. The architectural features are governed by the concept of expressing internal functions externally, where the curved glass façade of the east elevation indicating the office areas with the brick rectangle behind it expressing the laboratories and classrooms, and the oval tower expressing student meeting and studying spaces.
Figure 1: Temple University Multipurpose Health Science Center. Image from www.temple.edu/medicine/
Report Topics This report will continue with a description of the loads and load cases, as well as which
had the most significant impact on the lateral system. This will be followed by a description of how these loads were distributed to the lateral system via hand calculations and a computer model. Strength, overturning moment, and drift are checks included in the analysis as well. Lastly, a conclusion draws together the finding of this report. This is followed with the appendix which includes additional calculations.
Temple University Multipurpose Health Science Center
– Michael Wiegmann – TECHNICAL ASSIGNMENT 3 – Structural
5 | P a g e
Structural Description Soils & Foundations
Built on a previous parking lot, the steel framed building will connect to an existing building via a bridge and tunnel. The geotechnical survey indicated solid bedrock at 30’ to 50’ depths, compact micaceous silty fines to coarse sand gravel at slightly shallower depths, and a similar, but less compact soil near the surface.
Foundations consist of 40% footings and 60% caissons which terminate at solid bedrock. Footing thickness ranges from 1’4” to 4’4”, with sizes generally ranging from 4’x4’ to 9’x9’. The deep foundation system consists of steel columns sitting on concrete piers, caps and caissons. These vary in diameter from 36” to 96” and bear down to bedrock. Basements slabs are located at 15’ to 25’ depths, have welded wire reinforcement, and are typically 6” thick, with 8”‐12” thick slabs in areas exposed to weather or with heavier loading.
The concrete used is 28‐day, normal weight concrete at f’c=4000 psi for most areas, with the primary exception being concrete exposed to weather‐for example, the truck ramp‐ which is also air‐entrained, normal weight at f’c=5000. Reinforcing is grade 60.
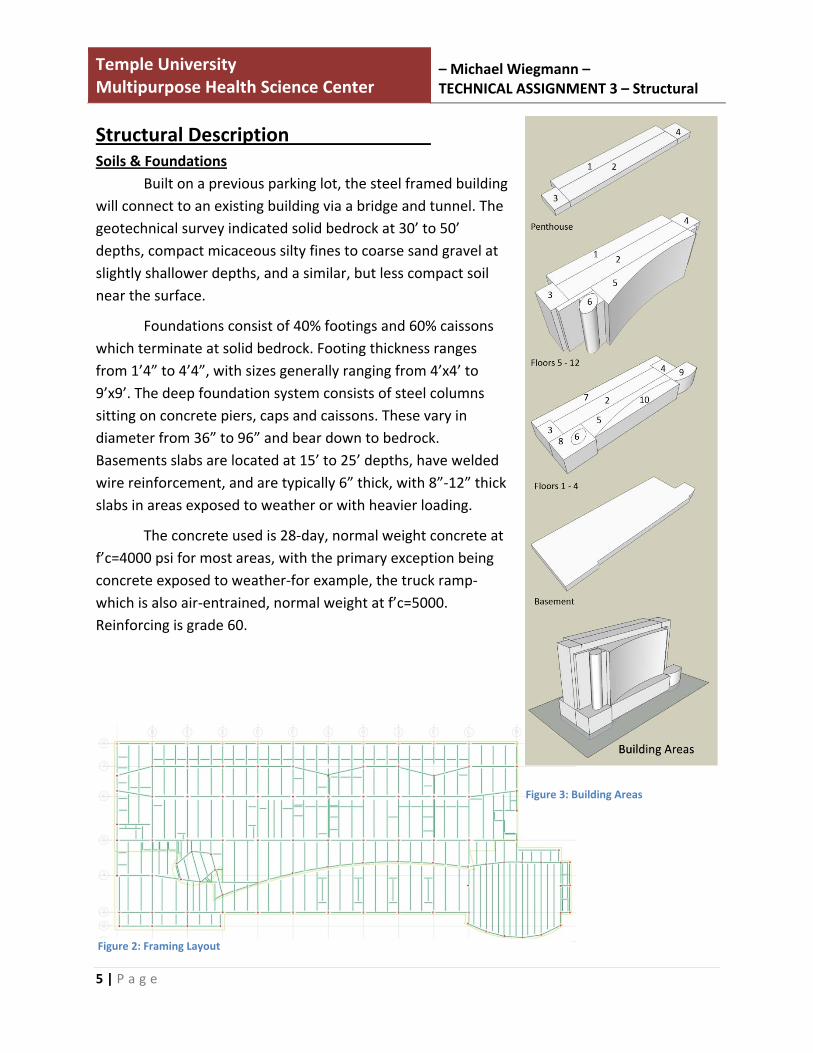
Figure 3: Building Areas
Figure 2: Framing Layout

Temple University Multipurpose Health Science Center
– Michael Wiegmann – TECHNICAL ASSIGNMENT 3 – Structural
6 | P a g e
Steel Framing Due to the irregularities in the building
form the framing layout varies significantly within a floor, but remains similar vertically. See figures 2 3, and 4 for a graphic representation.
The primary lateral system shown in figure 4 consists of five concentrically braced frames labeled 0 through 4in the E‐W direction (short direction), with two large moment frames labeled 6 and 7in the N‐S direction (long direction). At the penthouse levels, braced frames are solely used for both directions, connecting to the primary frames. These frames consist mostly of W‐shapes, with L‐shapes used in the penthouse levels. All of the frames bear down on caissons with approximately 3,100 kip capacities.
The gravity system consists of composite steel decking running in the N‐S direction, perpendicularly to the beams. Slabs are typically 2.5”, f’c=4,000 psi, NWC on 3”deep, 20 gage, galvanized composite steel deck, with welded wire reinforcement. Floor loads are carried to from beams, to girders to columns, which are usually two levels in height. Special framing occurs in the library (area 8), the three story atrium space (area 10), and the auditorium (area 9) due to the large open spaces.
This building also has three transfer trusses which take column point loads from above and redistribute them to offset columns at a lower level. Two of these trusses are located between the first and second floors, are 15’4” deep, and span 46.5’ in order to clear space for the loading dock below. A third truss is located between the 5th and 6th floors, is 14’8” deep, and spans 62’ in order to relocate columns for corridors on lower levels.
Figure 4: From top to bottom: E‐W lateral system, N‐S lateral system, overall framing

Temple University Multipurpose Health Science Center
– Michael Wiegmann – TECHNICAL ASSIGNMENT 3 – Structural
7 | P a g e
Applicable Codes
Below are listed the codes used by the original designers.
• IBC 2003 (Philadelphia building code)
• ASCE7‐02
• Concrete: o ACI 318 “Building Code Requirements for Structural Concrete” o ACI 316 “Manual of Standard Practice for Detailing Concrete Structures” o ACI 301, 302, 304, 305, 306, 308, 311, 318, 347
• Steel: o AISC “Specifications for Design, Fabrication and Erection of Structural Steel for
Buildings” o AISC “Code of Standard Practice for Steel Buildings and Bridges” o American Welding Society (AWS) D1.1 “Structural Welding Code – Steel.” o American Welding Society (AWS) D1.1 “Structural Welding Code – Steel.” o ASTM A6 “ General Requirements for Rolled Steel Plates, Shapes, Sheet Piling, and
Bars for Structural Use.” o ASTM A325 “Specifications for Structural Joints” o Steel Deck Institute “Design Manual for Composite Decks, Form Decks, and Roof
Decks”
For this design and analysis IBC 2006 and ASCE7‐05 will be used

Temple University Multipurpose Health Science Center
– Michael Wiegmann – TECHNICAL ASSIGNMENT 3 – Structural
8 | P a g e
Loads and Load Cases Live & Dead Loads
The loads in tables 1 and 2 were determined by reviewing the building documents and noting the loads used by the original designers, who based their loading off of the IBC 2003, the adopted building code of Philadelphia, Pennsylvania.
Design dead loads, found in table 3 were not presented in the building documents, so material unit weights and ASCE 7‐05 Minimum Design Dead Loads were used to make dead load assumptions.
Table 1: Loads Live Loads
Area Load (psf)
Slab on Grade 150Truck Drive Aisle 300High Density Storage Area 300Elevated Frame Slabs 150Office/corridor 100Library 150Roof 30Penthouse 150
Dead Loads
Load (psf)
Decking 50.1Girders & Beams 7 Mech/Elec 20
Total 77.1
Snow Loads Flat‐roof snow load 22 psfSnow Exposure Factor 0.9Snow Load Importance Factor 1.1
Thermal Factor 1
Temple University Multipurpose Health Science Center
– Michael Wiegmann – TECHNICAL ASSIGNMENT 3 – Structural
9 | P a g e
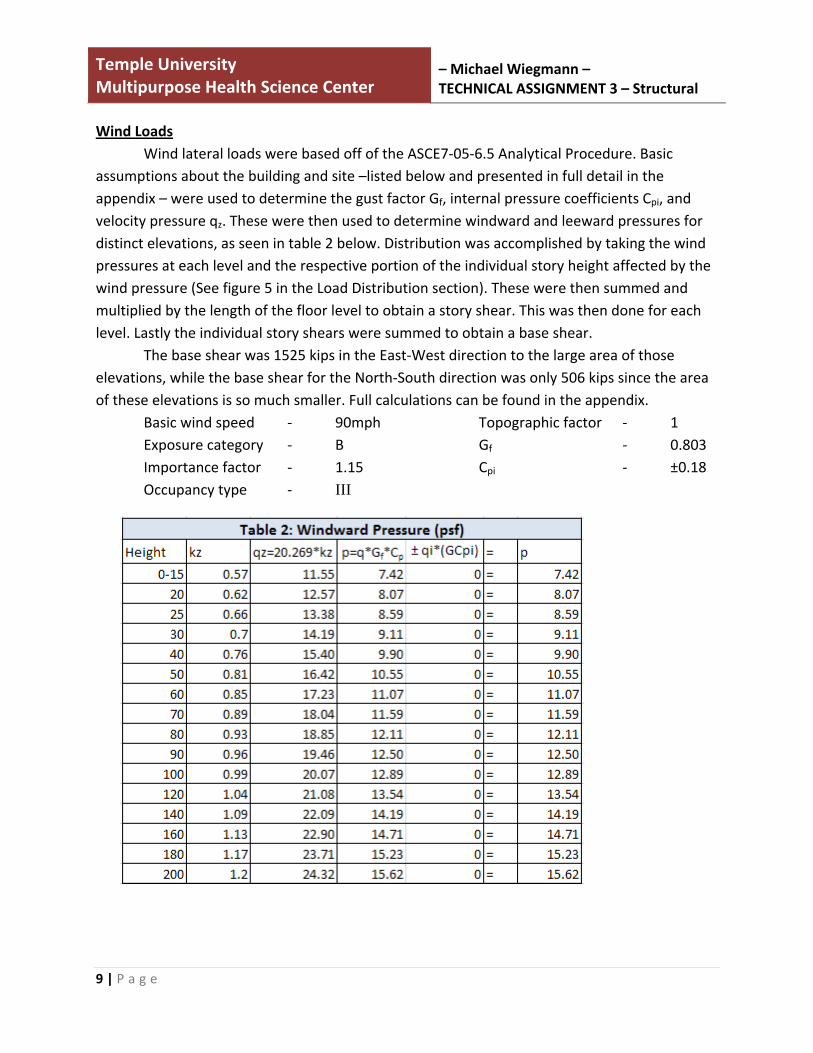
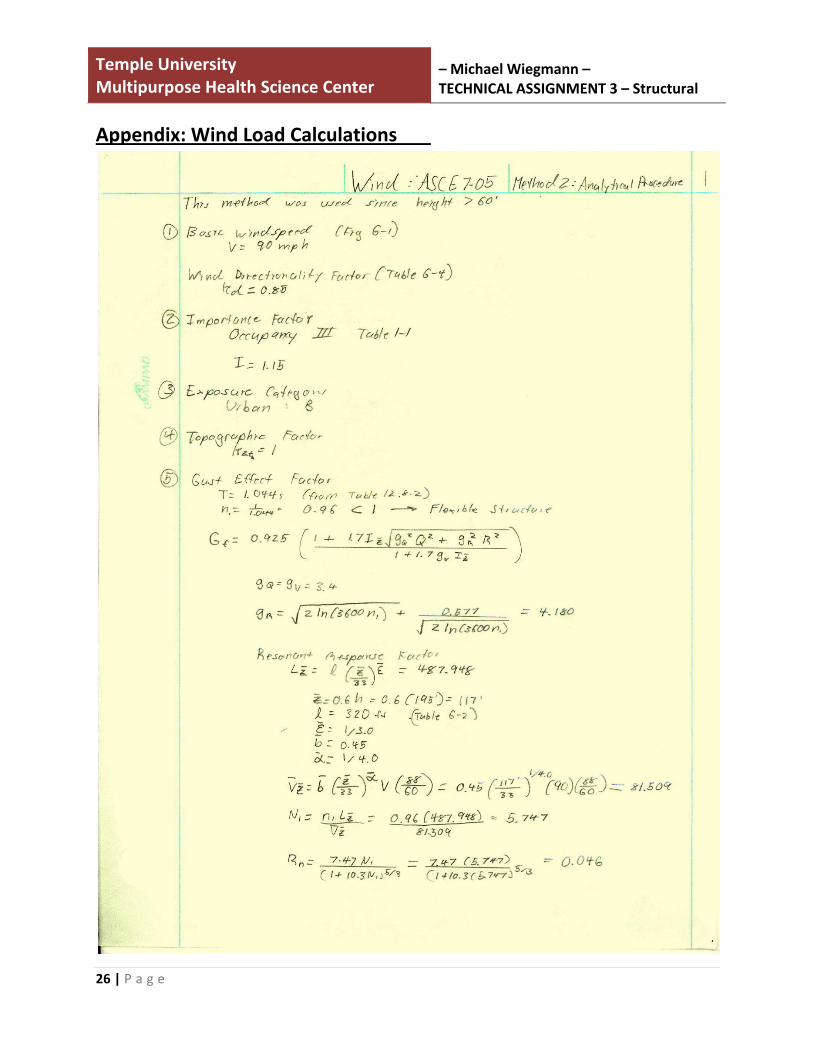
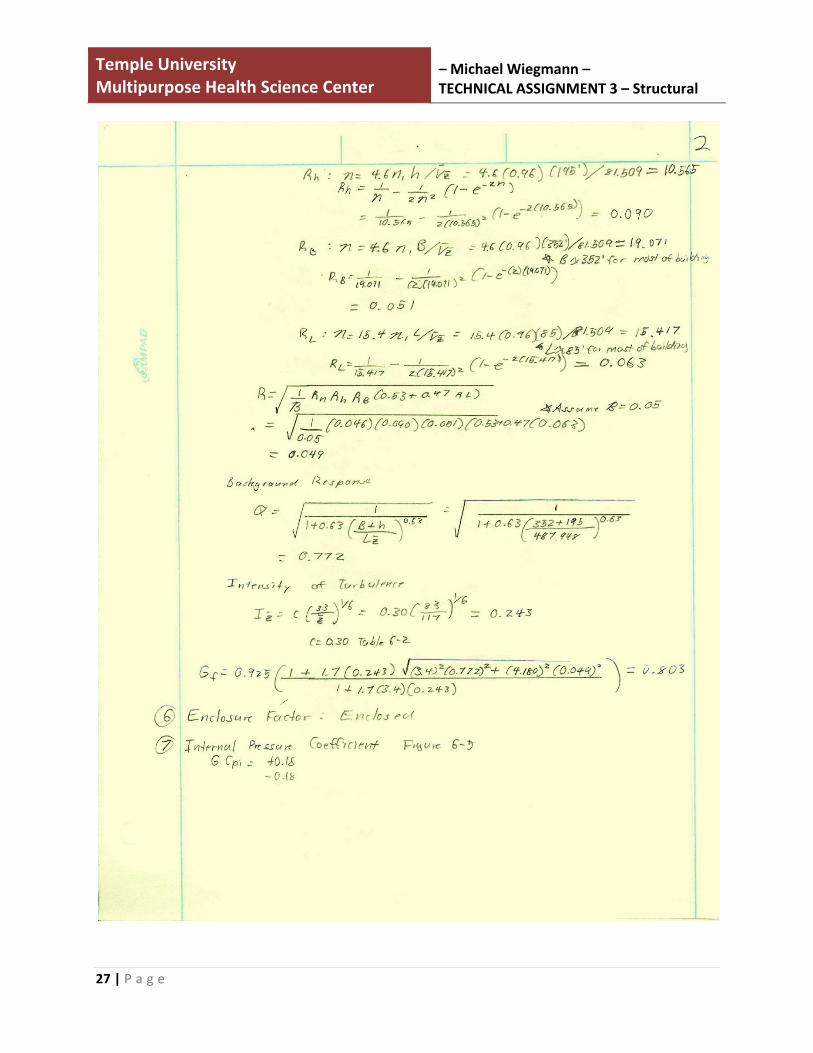
Wind Loads Wind lateral loads were based off of the ASCE7‐05‐6.5 Analytical Procedure. Basic assumptions about the building and site –listed below and presented in full detail in the appendix – were used to determine the gust factor Gf, internal pressure coefficients Cpi, and velocity pressure qz. These were then used to determine windward and leeward pressures for distinct elevations, as seen in table 2 below. Distribution was accomplished by taking the wind pressures at each level and the respective portion of the individual story height affected by the wind pressure (See figure 5 in the Load Distribution section). These were then summed and multiplied by the length of the floor level to obtain a story shear. This was then done for each level. Lastly the individual story shears were summed to obtain a base shear.
The base shear was 1525 kips in the East‐West direction to the large area of those elevations, while the base shear for the North‐South direction was only 506 kips since the area of these elevations is so much smaller. Full calculations can be found in the appendix. Basic wind speed ‐ 90mph Exposure category ‐ B Importance factor ‐ 1.15 Occupancy type ‐ III
Topographic factor ‐ 1 Gf ‐ 0.803 Cpi ‐ ±0.18

Temple University Multipurpose Health Science Center
– Michael Wiegmann – TECHNICAL ASSIGNMENT 3 – Structural
10 | P a g e
Figure 5: Wind load diagram

Temple University Multipurpose Health Science Center
– Michael Wiegmann – TECHNICAL ASSIGNMENT 3 – Structural
11 | P a g e
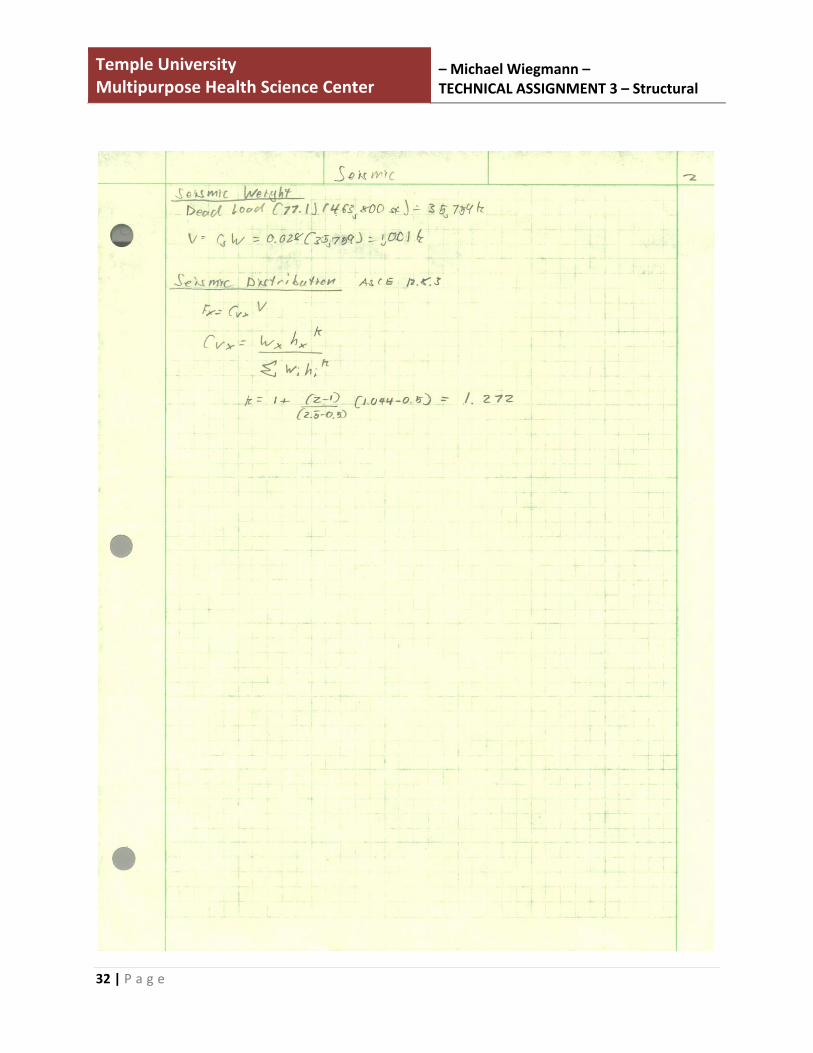
Seismic Loads The ASCE7‐05 code was used to investigate the seismic loads for the building which were expected to be relatively low, given the building’s location in Philadelphia, Pennsylvania. The Equivalent lateral Force Procedure (ASCE 12.8.2) was used to obtain a base sheer for the building. A direct comparison with the structural notes within the design documents was not possible since the base shear was not indicated in the notes or specifications; however, the notes did state that structural system was not specifically detailed for seismic loads. It also provided various seismic data which were used for this analysis including the site class, C, and the spectral response coefficients: SDS=0.219, SD1=0.068. The estimated dead weight of 77.1psf was used to calculate the building base shear of 1001 kips.
Below appears the ASCE equation for determining the vertical distribution of seismic loads, which is found in table 3, of the Lateral Force Distribution Section. This was accomplished by multiplying the base shear by the appropriate Cvx, which is a function of floor area, height, building weight, and the seismic response coefficient.

Temple University Multipurpose Health Science Center
– Michael Wiegmann – TECHNICAL ASSIGNMENT 3 – Structural
12 | P a g e
Load Combinations The following IBC 2006 load combinations were analyzed using RAM Structural System. The second and third groups of Load combinations had the most significant impact on the lateral system, while the bold underlined load combinations controlled. 1.4D 1.2D + 1.6Lr 1.2D + 1.6S 1.2D + 1.6Lr + 0.5S 1.2D + 1.6S + 0.5Lr 1.2D + 1.6Lr ± 0.8W 1.2D + 1.6S ± 0.8W 1.2D + 0.5S + 0.5Lr ± 1.6W 1.2D + 0.5S ± 1.6W 0.9D ± 1.6W 1.2D ± 1.6W 1.2D + 0.5Lr ± 1.6W 0.9D±1.0E 1.2D ± 1.0E

Temple University Multipurpose Health Science Center
– Michael Wiegmann – TECHNICAL ASSIGNMENT 3 – Structural
13 | P a g e
Lateral Force Distribution Lateral loads in the Temple University Multipurpose Health Science Center are resisted
through a combination of braced frames and moment frames. The loads acting on these frames were determined through a combination of hand calculations and computer modeling. The vertical lateral distributions were manually imputed into a RAM Structural System model, shown below. The floors of the building were modeled as rigid diaphragms which allowed the relative stiffness of the different frames to be determined by hand. The relative stiffness of the frames was then used by the RAM model with various dead, live, wind and seismic load combinations to determine individual story shears, and frame loads.
Figure 6: RAM Framing Model

Temple University Multipurpose Health Science Center
– Michael Wiegmann – TECHNICAL ASSIGNMENT 3 – Structural
14 | P a g e
A detailed analysis of the lateral resisting system was made possible by creating a RAM Structural System model. Five concentrically braced frames ‐ labeled 0 through 4 ‐ provide the primary resistance to East‐West lateral loading, while two primary moment frames ‐ labeled 6 and 7 ‐ provide resistance to North‐South loading. There are also two other frames in this direction ‐ labeled 5 and 8 – which provide lateral resistance for the two story library and penthouse, respectively. It is assumed that all of the lateral loads are transferred to these frames.
Figure 7: Above: E‐W braced frames. Below: N‐S moment frames

Temple University Multipurpose Health Science Center
– Michael Wiegmann – TECHNICAL ASSIGNMENT 3 – Structural
15 | P a g e
The floors of the building were modeled as rigid diaphragms, which is an acceptable assumption for a composite steel deck floor system. Forces applied to these rigid diaphragms are then transferred through the floor to the lateral elements via relative stiffness. Relative stiffness for this building was determined through a separate computer model of the lateral forms. Unit loads were applied to each individual story level of each frame, resulting in displacements. The inverse of these displacements results in the stiffness of each frame, so that each frame can be compared to the others on a floor by floor basis. One floor two, for example, the stiffness of frame # 1 is higher than the rest, indicating that it will take a higher percentage of the lateral loading, dependent on its distance to the center of rigidity (see table below). This topic is further discussed in the Torsion section.

Temple University Multipurpose Health Science Center
– Michael Wiegmann – TECHNICAL ASSIGNMENT 3 – Structural
16 | P a g e
Once the structural model was completed, it was possible to insert the loading. Wind analysis resulted in a base shear of 1525 kips in the East‐West direction, and 506 kips in the North‐South direction, while seismic analysis resulted in a 1001 kips base shear acting in both directions. These analyses as well as the vertical distributions of these loads were determined by hand and entered into the model (See previous wind and seismic load section). It is important to note that resultant wind loads act at the geometric center of the building while seismic loads act at the center of mass. These were determined by the model but verified by hand.
The lateral loads will also combine with gravity loads to further increase displacements and loads in the lateral framing, known as the P‐delta effect. This justifies the used of the various multiple load combinations presented; however, it was determined through the computer modeling that the effect of these loads were minimal and greatly outweighed by the lateral loads.
Once entered into the model, the computer distributed the loads according to relative stiffness, giving displacements, story shears, and member forces. Not surprisingly, wind controlled in the East‐West direction with the 1.2 D + 0.5 Lp ±1.6W load combination due to the large surface area of that elevation. In the North‐South direction, seismic loads controlled with the 1.2 D± 1.0E load combination, which isn’t surprising either since the seismic base shear was nearly double that of the wind base shear in this direction. The resulting story shears of the two controlling cases are presented in table 5; however, a full list of all 37 load cases analyzed by RAM is available upon request.

Temple University Multipurpose Health Science Center
– Michael Wiegmann – TECHNICAL ASSIGNMENT 3 – Structural
17 | P a g e
Frame shears are also presented in table 6 in order to demonstrate the distribution according to relative stiffness as well as to provide a comparison to hand calculations. The hand calculations were made by distributing the floor shears to the various frames using a calculated relative stiffness factor. This is the compared to the RAM value for frame story shears. The differences between the hand‐calculated frame story shears and RAM calculate frame story shears are similar for only a few of the frames, which is most likely due to the fact that the hand calculations are a simplification. An example of one frame is placed below, in order to demonstrate the comparison as well as show the RAM calculated values. A complete set of calculations for all of the frames is available in the appendix.
Table 6: Frame Shear Comparison
Relative Stiffness Properties Frame Shear Check
Frame #0
Hs Hs(KSF*CN) ∑(KSF*CN) RAM Value Level Disp Y KSF = 1/Disp CN KSF*CN (KSF*CN) / ∑(KSF*CN)
Roof 0.00 505.05 73.54 37141.41 0.256565 114.77 29.45 60.42Mez. 0.00 444.44 75.51 33560.00 0.262375 362.53 95.12 138.71Pent. 0.00 813.01 76.16 61918.70 0.133853 544.6 72.90 85.0611th 0.00 854.70 76.09 65034.19 0.155041 744.53 115.43 56.2110th 0.00 869.57 76.04 66121.74 0.154729 ‐1141.39 ‐176.61 310.699th 0.00 934.58 76.05 71074.77 0.161370 1140.44 184.03 190.478th 0.00 1000.00 75.93 75930.00 0.163852 1337.44 219.14 249.317th 0.00 1063.83 75.75 80585.11 0.161531 1523.59 246.11 304.536th 0.00 1282.05 75.46 96743.59 0.175581 1704.53 299.28 328.195th 0.00 1408.45 74.94 105549.30 0.210597 1922.07 404.78 536.174th 0.00 1136.36 73.99 84079.55 0.131078 2117.78 277.59 371.013rd 0.00 1388.89 72.22 100305.56 0.141186 2300.82 324.84 387.282nd 0.00 1562.50 71.76 112125.00 0.178369 2463.78 439.46 346.311st

Temple University Multipurpose Health Science Center
– Michael Wiegmann – TECHNICAL ASSIGNMENT 3 – Structural
18 | P a g e
Torsion Torsion occurs when there is an eccentricity between the center of rigidity and the
center of mass (for seismic loads), or center of geometry (for wind loads). Torsional shear forces are dependent on the relative stiffness of a floors lateral framing, its eccentricity, and the story shear. If the eccentricities and loadings are high enough, torsional shear can have significant additive affects on lateral systems. Table 7 contains the calculations for finding eccentricity in this building. Wind controlled in the East‐West (y) direction, so the center of geometry for this direction used, while the center of mass was used in the other direction, in which seismic controlled.
The eccentricities for wind loads were not too large in this building, and were limited to the penthouse floors where the controlling combined story loading was minimal, resulting in minimal shears. An example of one of the East‐West frames, seen in table 8, demonstrates the torsional shear equation as well some of the typical torsional shear forces seen in the building. A complete set of torsional calculations for all of the frames can be found in the appendix, which shows how the torsional shear was greatest on the lowest floors. This is expected since the building geometry greatly increased in size in one direction on these floors, creating a significant eccentricity.

Temple University Multipurpose Health Science Center
– Michael Wiegmann – TECHNICAL ASSIGNMENT 3 – Structural
19 | P a g e
The seismic eccentricities and controlling combined story loads were large enough to combine to create very significant torsional shear values, as seen in table 9. Once again, the larger base geometry created a greater eccentricity and larger shear values. This will have a significant effect on the sizing of the lateral system in the North‐South direction.
Table9: Torsional Shear Frame #6
e Hs e*Hs(KSF*CN) ∑(KSF*CN) Level Disp Y KSF = 1/Disp CN KSF*CN (KSF*CN) / ∑(KSF*CN
2) Roof 0.00302 331.13 96.99 32114.54 0.010059 11.51 114.77 13.29Mez. 0.00376 265.96 97.74 25993.59 0.008058 9.43 362.53 27.55Pent. 0.00397 251.89 98.91 24913.32 0.006324 15.51 544.6 53.4111th 0.00311 321.54 98.27 31596.75 0.006411 15.01 744.53 71.6510th 0.00288 347.22 99.36 34498.58 0.006308 16.14 1141.39 116.219th 0.00283 353.36 95.73 33825.41 0.006607 12.46 1140.44 93.898th 0.00273 366.30 94.71 34690.81 0.006690 11.46 1337.44 102.547th 0.00267 374.53 93.46 35002.21 0.006804 10.22 1523.59 105.946th 0.00255 392.16 91.17 35751.33 0.007004 8.04 1704.53 95.985th 0.00223 448.43 88.37 39625.96 0.007214 2.99 1922.07 41.464th 0.00245 408.16 87.40 35671.80 0.007263 10.19 2117.78 156.733rd 0.00247 404.86 78.82 31909.27 0.008276 31.37 2300.82 597.342nd 0.00219 456.62 67.81 30961.60 0.007340 26.90 2463.78 486.441st ‐ ‐

Temple University Multipurpose Health Science Center
– Michael Wiegmann – TECHNICAL ASSIGNMENT 3 – Structural
20 | P a g e
Strength Check Since the existing member sizes were used in the RAM model, a strength check was
performed by comparing the frame member loads found through the RAM model with the original design. The basic frame shears have already been backed up with hand calculations, which should support this analysis. The following images demonstrate that the capacities of the braced frame’s members are adequate. Discrepancies occur because the RAM model was created without all of the gravity members in place in order to simplify the lateral analysis. Also, the 1st floor was modeled as the ground level in order to obtain accurate story drift, but this reduced the amount of load reaching the braces on the lowest level.
Figure 8: Strength check. Model left, original right.

Temple University Multipurpose Health Science Center
– Michael Wiegmann – TECHNICAL ASSIGNMENT 3 – Structural
21 | P a g e
Figure 9:Strength check continued. Model left, original right.

Temple University Multipurpose Health Science Center
– Michael Wiegmann – TECHNICAL ASSIGNMENT 3 – Structural
22 | P a g e
Overturning Moments
Overturning moments were calculated in order to check the lateral frame’s stability. Frame story shears were multiplied by their heights to get the overturning moment. Reactions were then found and compared to the bearing capacities listed in the structural notes, which is 60,000psf end bearing, and 2000psf tensile.
Table 10: Bearing Capacity
Story Shear Height Moment
Roof 60.42 194.46 11749.27 Mez. 78.29 181.50 14209.64 Pent. ‐53.65 163.75 ‐8785.19 11th ‐141.28 148.67 ‐21004.1 10th ‐254.47 134.00 ‐34099 9th 501.15 119.33 59802.23 8th 58.84 104.67 6158.783 7th 55.23 90.00 4970.7 6th 23.65 75.33 1781.555 5th 207.99 60.67 12618.75 4th ‐165.16 46.00 ‐7597.36 3rd 16.27 30.67 499.0009 2nd ‐40.96 15.33 ‐627.917 1st ‐351.23 0.00 0
Sum 39676.39 Bay width: 38.333' Reactions 1035.045
Caisson size: 96" Ø 8'
Bearing capacity: 60,000psf 3014.4
> 1035, ok
Caisson depth: 35' Allowable side resistance: 7000psf
3077.2 >1035, ok

Temple University Multipurpose Health Science Center
– Michael Wiegmann – TECHNICAL ASSIGNMENT 3 – Structural
23 | P a g e
Story Drifts
The final check for this report is an analysis of the story drift. The IBC limits overall, as well as story drift to H/400. That means an overall building drift less than six inches for this building. The maximum drift value was just a hair under the limit for the wind load case but the seismic loading resulted in twice the allowable drift. This is a bit high; however, the original design documents indicate that the building is not specifically detailed for seismic, which is at least a partial explanation. Otherwise, the wind load story drift is also acceptable.
Table 11: Story Drift E‐W N‐S Level Height Disp ΔDisp H/400 Disp ΔDisp H/400 Roof 194.46 5.99 1.01 0.03 ok 13.54 0.17 0.03 fail Mez. 181.50 4.98 0.61 0.04 ok 13.37 0.25 0.04 fail Pent. 163.75 4.37 0.44 0.04 ok 13.12 0.68 0.04 fail 11th 148.67 3.93 0.36 0.04 ok 12.44 0.84 0.04 fail 10th 134.00 3.57 0.14 0.04 ok 11.6 1.01 0.04 fail 9th 119.33 3.43 0.44 0.04 ok 10.59 1.19 0.04 fail 8th 104.67 2.99 0.46 0.04 ok 9.4 1.3 0.04 fail 7th 90.00 2.53 0.447 0.04 ok 8.1 1.38 0.04 fail 6th 75.33 2.083 0.963 0.04 ok 6.72 1.33 0.04 fail 5th 60.67 1.12 0.45 0.04 ok 5.39 1.4 0.04 fail 4th 46.00 0.67 0 0.04 ok 3.99 1.55 0.04 fail 3rd 30.67 0.67 0.37 0.04 ok 2.44 1.49 0.04 fail 2nd 15.33 0.3 0.3 0.04 ok 0.95 0.95 0.04 fail 1st 0.00 0 0 0.00 ‐ 0 0 0.00 ‐
Max: H/400 6" 6"
>5.99, ok <13.54, fail
Temple University Multipurpose Health Science Center
– Michael Wiegmann – TECHNICAL ASSIGNMENT 3 – Structural
24 | P a g e
Conclusions
The purpose of this technical report was to analyze the lateral system of the Temple University Multipurpose Health Science Center. This analysis included load determination, distribution, and calculation of torsional shears, with checks for strength, overturning moment, and story drift. Lateral load analysis yielded a wind base shear of 1525 kips in the East‐West direction and 506 kips in the North‐South direction, while seismic analysis resulted in a 1001 kips base shear acting in both directions. These loads were then manually distributed vertically, and then laterally distributed using a RAM Structural System model. Wind load combinations in the East‐West direction and seismic load combinations in the North‐South direction controlled the distribution. Relative stiffness was checked manually, since it is the guiding concept behind these distributions. After the relative stiffness of the frames was calculated, the story shear given by the RAM output could be manually checked. Significant discrepancies were most likely due to the simplified analysis method used to determine the relative stiffness of the frames.
An analysis of torsional shear was also included using center of mass and geometry, which was verified by hand. It was found that torsional shear was greatest for both controlling load conditions due to the asymmetrical base of the building, but the seismic torsional shear was especially high due to the size of the base shear in the North‐South direction, which was much higher than the wind load combinations in the same direction.
Since member sizes were included in the computer model, the output member forces were compared to the capacities listed in the design documents, yielding satisfactory results. Additionally, an overturning moment of nearly 40,000 k‐ft was calculated using story shear data and compared to bearing capacities derived from the design documents. Both tension capacity (3077 kips) and compressions bearing capacities (3014 kips) proved adequate to resist the overturning moment reactions of 1035 kips of a typical frame. Lastly, a story drift analysis yielded wind load drifts under the allowable 6”, but seismic loads did not meet restrictions with drifts around 13”. This is most likely due to a combination of analysis error and the fact that the building was not specifically designed for seismic loading.

Temple University Multipurpose Health Science Center
– Michael Wiegmann – TECHNICAL ASSIGNMENT 3 – Structural
25 | P a g e
Temple University Multipurpose Health Science Center
– Michael Wiegmann – TECHNICAL ASSIGNMENT 3 – Structural
26 | P a g e
Appendix: Wind Load Calculations
Temple University Multipurpose Health Science Center
– Michael Wiegmann – TECHNICAL ASSIGNMENT 3 – Structural
27 | P a g e

Temple University Multipurpose Health Science Center
– Michael Wiegmann – TECHNICAL ASSIGNMENT 3 – Structural
28 | P a g e

Temple University Multipurpose Health Science Center
– Michael Wiegmann – TECHNICAL ASSIGNMENT 3 – Structural
29 | P a g e
Table 6: Windward Pressure (psf) Height kz qz=20.269*kz p=q*Gf*Cp ± qi*(GCpi) = p
0‐15 0.57 11.55 7.42 0 = 7.42 20 0.62 12.57 8.07 0 = 8.07 25 0.66 13.38 8.59 0 = 8.59 30 0.7 14.19 9.11 0 = 9.11 40 0.76 15.40 9.90 0 = 9.90 50 0.81 16.42 10.55 0 = 10.55 60 0.85 17.23 11.07 0 = 11.07 70 0.89 18.04 11.59 0 = 11.59 80 0.93 18.85 12.11 0 = 12.11 90 0.96 19.46 12.50 0 = 12.50 100 0.99 20.07 12.89 0 = 12.89 120 1.04 21.08 13.54 0 = 13.54 140 1.09 22.09 14.19 0 = 14.19 160 1.13 22.90 14.71 0 = 14.71 180 1.17 23.71 15.23 0 = 15.23 200 1.2 24.32 15.62 0 = 15.62

Temple University Multipurpose Health Science Center
– Michael Wiegmann – TECHNICAL ASSIGNMENT 3 – Structural
30 | P a g e
Table 7: Detailed Calculations ‐ N‐S Windward Leeward Windward kips Leeward kips Total Kips Floor Height Elevation Bldtg Width PLF vert W PLF vert L Bldg Load Bldg Load 1 15.33 0 160.1667 0.00 0.00 0.00 0.00 0.00 2 15.33 15.33 160.1667 120.50 145.89 19.30 23.37 42.67 3 15.33 30.66 160.1667 145.21 145.97 23.26 23.38 46.64 4 14.67 45.99 160.1667 158.84 142.80 25.44 22.87 48.31 5 14.67 60.66 109.8334 203.29 171.28 22.33 18.81 41.14 6 14.67 75.33 109.8334 177.70 139.71 19.52 15.34 34.86 7 14.67 90 109.8334 186.20 139.63 20.45 15.34 35.79 8 14.67 104.67 109.8334 196.87 139.63 21.62 15.34 36.96 9 14.67 119.34 109.8334 202.96 139.63 22.29 15.34 37.63 10 14.67 134.01 109.8334 208.86 139.63 22.94 15.34 38.28 11 15.08 148.68 109.8334 218.86 141.61 24.04 15.55 39.59 Penthouse 15.67 163.76 109.8334 232.26 146.37 25.51 16.08 41.59 Mezzanine 15.04 179.43 109.8334 230.18 142.24 25.28 15.62 40.90 Roof 0 194.47 109.8334 123.83 75.45 13.60 8.29 21.89 Total 285.58 220.66 506.24

Temple University Multipurpose Health Science Center
– Michael Wiegmann – TECHNICAL ASSIGNMENT 3 – Structural
31 | P a g e
Appendix: Seismic Load Calculations
Temple University Multipurpose Health Science Center
– Michael Wiegmann – TECHNICAL ASSIGNMENT 3 – Structural
32 | P a g e
Temple University Multipurpose Health Science Center
– Michael Wiegmann – TECHNICAL ASSIGNMENT 3 – Structural
33 | P a g e
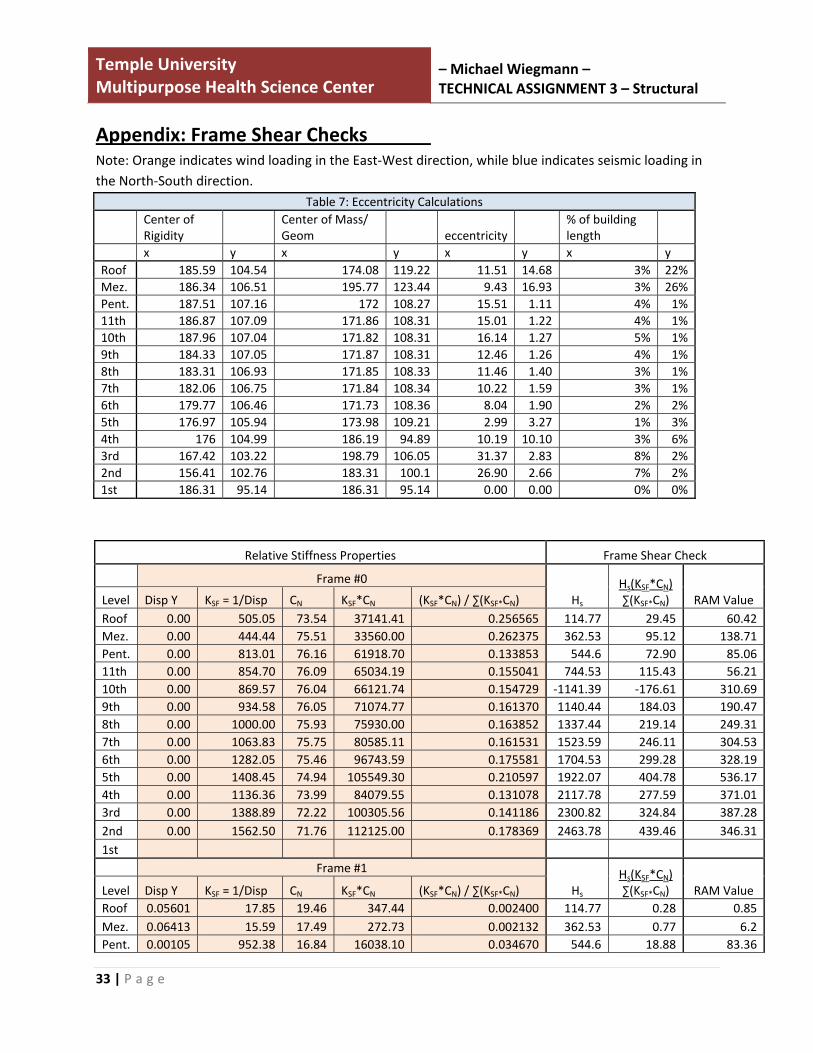
Appendix: Frame Shear Checks Note: Orange indicates wind loading in the East‐West direction, while blue indicates seismic loading in the North‐South direction.
Table 7: Eccentricity Calculations
Center of Rigidity
Center of Mass/ Geom eccentricity
% of building length
x y x y x y x yRoof 185.59 104.54 174.08 119.22 11.51 14.68 3% 22%Mez. 186.34 106.51 195.77 123.44 9.43 16.93 3% 26%Pent. 187.51 107.16 172 108.27 15.51 1.11 4% 1%11th 186.87 107.09 171.86 108.31 15.01 1.22 4% 1%10th 187.96 107.04 171.82 108.31 16.14 1.27 5% 1%9th 184.33 107.05 171.87 108.31 12.46 1.26 4% 1%8th 183.31 106.93 171.85 108.33 11.46 1.40 3% 1%7th 182.06 106.75 171.84 108.34 10.22 1.59 3% 1%6th 179.77 106.46 171.73 108.36 8.04 1.90 2% 2%5th 176.97 105.94 173.98 109.21 2.99 3.27 1% 3%4th 176 104.99 186.19 94.89 10.19 10.10 3% 6%3rd 167.42 103.22 198.79 106.05 31.37 2.83 8% 2%2nd 156.41 102.76 183.31 100.1 26.90 2.66 7% 2%1st 186.31 95.14 186.31 95.14 0.00 0.00 0% 0%
Relative Stiffness Properties Frame Shear Check
Frame #0
Hs Hs(KSF*CN) ∑(KSF*CN) RAM Value Level Disp Y KSF = 1/Disp CN KSF*CN (KSF*CN) / ∑(KSF*CN)
Roof 0.00 505.05 73.54 37141.41 0.256565 114.77 29.45 60.42Mez. 0.00 444.44 75.51 33560.00 0.262375 362.53 95.12 138.71Pent. 0.00 813.01 76.16 61918.70 0.133853 544.6 72.90 85.0611th 0.00 854.70 76.09 65034.19 0.155041 744.53 115.43 56.2110th 0.00 869.57 76.04 66121.74 0.154729 ‐1141.39 ‐176.61 310.699th 0.00 934.58 76.05 71074.77 0.161370 1140.44 184.03 190.478th 0.00 1000.00 75.93 75930.00 0.163852 1337.44 219.14 249.317th 0.00 1063.83 75.75 80585.11 0.161531 1523.59 246.11 304.536th 0.00 1282.05 75.46 96743.59 0.175581 1704.53 299.28 328.195th 0.00 1408.45 74.94 105549.30 0.210597 1922.07 404.78 536.174th 0.00 1136.36 73.99 84079.55 0.131078 2117.78 277.59 371.013rd 0.00 1388.89 72.22 100305.56 0.141186 2300.82 324.84 387.282nd 0.00 1562.50 71.76 112125.00 0.178369 2463.78 439.46 346.311st Frame #1
Hs Hs(KSF*CN) ∑(KSF*CN) RAM Value Level Disp Y KSF = 1/Disp CN KSF*CN (KSF*CN) / ∑(KSF*CN)
Roof 0.05601 17.85 19.46 347.44 0.002400 114.77 0.28 0.85Mez. 0.06413 15.59 17.49 272.73 0.002132 362.53 0.77 6.2Pent. 0.00105 952.38 16.84 16038.10 0.034670 544.6 18.88 83.36
Temple University Multipurpose Health Science Center
– Michael Wiegmann – TECHNICAL ASSIGNMENT 3 – Structural
34 | P a g e
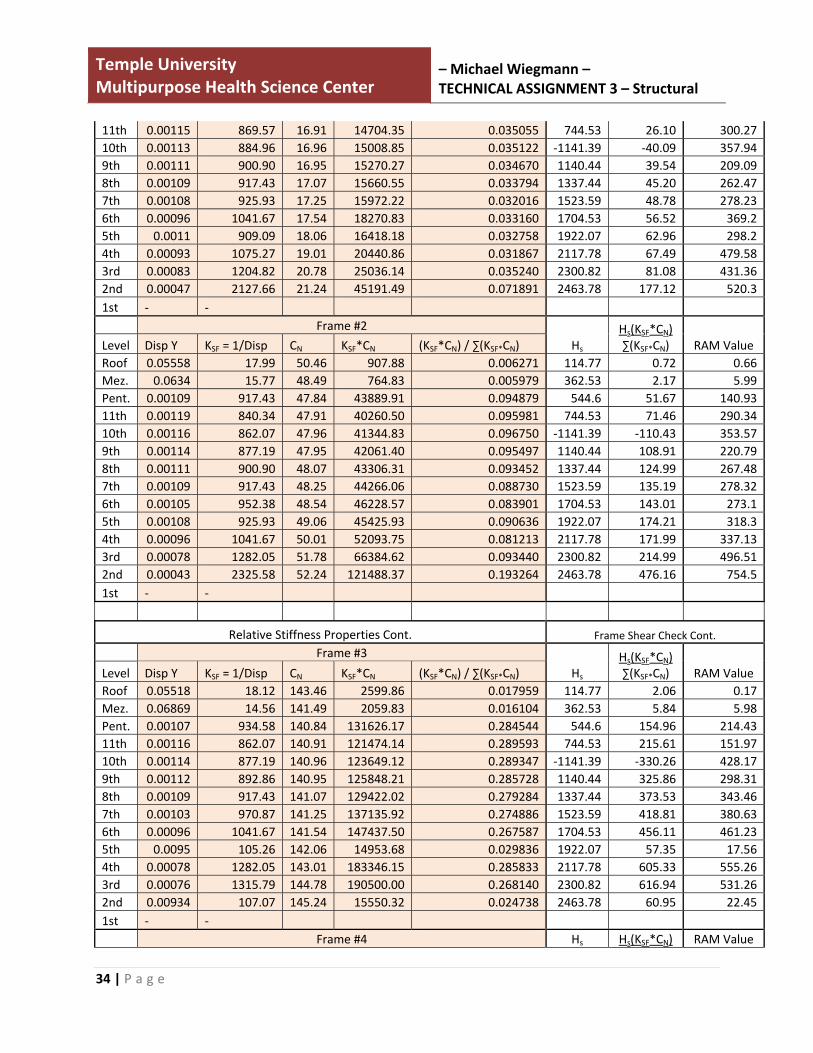
11th 0.00115 869.57 16.91 14704.35 0.035055 744.53 26.10 300.2710th 0.00113 884.96 16.96 15008.85 0.035122 ‐1141.39 ‐40.09 357.949th 0.00111 900.90 16.95 15270.27 0.034670 1140.44 39.54 209.098th 0.00109 917.43 17.07 15660.55 0.033794 1337.44 45.20 262.477th 0.00108 925.93 17.25 15972.22 0.032016 1523.59 48.78 278.236th 0.00096 1041.67 17.54 18270.83 0.033160 1704.53 56.52 369.25th 0.0011 909.09 18.06 16418.18 0.032758 1922.07 62.96 298.24th 0.00093 1075.27 19.01 20440.86 0.031867 2117.78 67.49 479.583rd 0.00083 1204.82 20.78 25036.14 0.035240 2300.82 81.08 431.362nd 0.00047 2127.66 21.24 45191.49 0.071891 2463.78 177.12 520.31st ‐ ‐ Frame #2
Hs Hs(KSF*CN) ∑(KSF*CN) RAM Value Level Disp Y KSF = 1/Disp CN KSF*CN (KSF*CN) / ∑(KSF*CN)
Roof 0.05558 17.99 50.46 907.88 0.006271 114.77 0.72 0.66Mez. 0.0634 15.77 48.49 764.83 0.005979 362.53 2.17 5.99Pent. 0.00109 917.43 47.84 43889.91 0.094879 544.6 51.67 140.9311th 0.00119 840.34 47.91 40260.50 0.095981 744.53 71.46 290.3410th 0.00116 862.07 47.96 41344.83 0.096750 ‐1141.39 ‐110.43 353.579th 0.00114 877.19 47.95 42061.40 0.095497 1140.44 108.91 220.798th 0.00111 900.90 48.07 43306.31 0.093452 1337.44 124.99 267.487th 0.00109 917.43 48.25 44266.06 0.088730 1523.59 135.19 278.326th 0.00105 952.38 48.54 46228.57 0.083901 1704.53 143.01 273.15th 0.00108 925.93 49.06 45425.93 0.090636 1922.07 174.21 318.34th 0.00096 1041.67 50.01 52093.75 0.081213 2117.78 171.99 337.133rd 0.00078 1282.05 51.78 66384.62 0.093440 2300.82 214.99 496.512nd 0.00043 2325.58 52.24 121488.37 0.193264 2463.78 476.16 754.51st ‐ ‐
Relative Stiffness Properties Cont. Frame Shear Check Cont.
Frame #3
Hs Hs(KSF*CN) ∑(KSF*CN) RAM Value Level Disp Y KSF = 1/Disp CN KSF*CN (KSF*CN) / ∑(KSF*CN)
Roof 0.05518 18.12 143.46 2599.86 0.017959 114.77 2.06 0.17Mez. 0.06869 14.56 141.49 2059.83 0.016104 362.53 5.84 5.98Pent. 0.00107 934.58 140.84 131626.17 0.284544 544.6 154.96 214.4311th 0.00116 862.07 140.91 121474.14 0.289593 744.53 215.61 151.9710th 0.00114 877.19 140.96 123649.12 0.289347 ‐1141.39 ‐330.26 428.179th 0.00112 892.86 140.95 125848.21 0.285728 1140.44 325.86 298.318th 0.00109 917.43 141.07 129422.02 0.279284 1337.44 373.53 343.467th 0.00103 970.87 141.25 137135.92 0.274886 1523.59 418.81 380.636th 0.00096 1041.67 141.54 147437.50 0.267587 1704.53 456.11 461.235th 0.0095 105.26 142.06 14953.68 0.029836 1922.07 57.35 17.564th 0.00078 1282.05 143.01 183346.15 0.285833 2117.78 605.33 555.263rd 0.00076 1315.79 144.78 190500.00 0.268140 2300.82 616.94 531.262nd 0.00934 107.07 145.24 15550.32 0.024738 2463.78 60.95 22.451st ‐ ‐ Frame #4 Hs Hs(KSF*CN) RAM Value

Temple University Multipurpose Health Science Center
– Michael Wiegmann – TECHNICAL ASSIGNMENT 3 – Structural
35 | P a g e
Level Disp Y KSF = 1/Disp CN KSF*CN (KSF*CN) / ∑(KSF*CN) ∑(KSF*CN)
Roof 0.00198 505.05 205.46 103767.68 0.716805 114.77 82.27 62Mez. 0.00223 448.43 203.49 91251.12 0.713409 362.53 258.63 159.03Pent. 0.00097 1030.93 202.84 209113.40 0.452053 544.6 246.19 29.5811th 0.00114 877.19 202.91 177991.23 0.424330 744.53 315.93 19.7310th 0.00112 892.86 202.96 181214.29 0.424053 ‐1141.39 ‐484.01 518.519th 0.00109 917.43 202.95 186192.66 0.422735 1140.44 482.10 166.218th 0.00102 980.39 203.07 199088.24 0.429618 1337.44 574.59 226.887th 0.00092 1086.96 203.25 220923.91 0.442837 1523.59 674.70 275.196th 0.00084 1190.48 203.54 242309.52 0.439771 1704.53 749.60 288.025th 0.00064 1562.50 204.06 318843.75 0.636172 1922.07 1222.77 731.094th 0.00068 1470.59 205.01 301485.29 0.470009 2117.78 995.38 378.183rd 0.00063 1587.30 206.78 328222.22 0.461993 2300.82 1062.96 458.262nd 0.00062 1612.90 207.24 334258.06 0.531739 2463.78 1310.09 771.961st ‐ ‐ Totals
Level ∑(KSF*CN) Roof 144764.26 Mez. 127908.51 Pent. 462586.27 11th 419464.41 10th 427338.82 9th 440447.31 8th 463407.11 7th 498883.22 6th 550990.02 5th 501190.84 4th 641445.60 3rd 710448.54 2nd 628613.25 1st

Temple University Multipurpose Health Science Center
– Michael Wiegmann – TECHNICAL ASSIGNMENT 3 – Structural
36 | P a g e
Relative Stiffness Properties Cont. Frame Shear Check Cont.
Frame #5
Hs Hs(KSF*CN) ∑(KSF*CN) RAM Value Level Disp Y KSF = 1/Disp CN KSF*CN (KSF*CN) / ∑(KSF*CN)
Roof ‐ ‐ ‐ Mez. ‐ ‐ ‐ Pent. ‐ ‐ ‐ 11th ‐ ‐ ‐ 10th ‐ ‐ ‐ 9th ‐ ‐ ‐ 8th ‐ ‐ ‐ 7th ‐ ‐ ‐ 6th ‐ ‐ ‐ 5th ‐ ‐ ‐ 4th ‐ ‐ ‐ 3rd ‐ ‐ ‐ 2nd 0.00737 135.69 131.14 17793.65 0.29 1094.87 313.1454 143.131st ‐ ‐ Frame #6
Hs Hs(KSF*CN) ∑(KSF*CN) RAM Value Level Disp Y KSF = 1/Disp CN KSF*CN (KSF*CN) / ∑(KSF*CN)
Roof 0.00302 331.13 96.99 32114.54 0.975553 138.35 134.97 134.77Mez. 0.00376 265.96 97.74 25993.59 0.787568 182.6 143.81 5.69Pent. 0.00397 251.89 98.91 24913.32 0.625449 334.56 209.25 26.911th 0.00311 321.54 98.27 31596.75 0.630023 470.31 296.31 69.610th 0.00288 347.22 99.36 34498.58 0.626735 585.87 367.19 54.499th 0.00283 353.36 95.73 33825.41 0.632482 702.39 444.25 58.218th 0.00273 366.30 94.71 34690.81 0.633596 796.88 504.90 46.587th 0.00267 374.53 93.46 35002.21 0.635863 878.17 558.40 40.56th 0.00255 392.16 91.17 35751.33 0.638488 938.75 599.38 28.845th 0.00223 448.43 88.37 39625.96 0.637451 992.94 632.95 18.724th 0.00245 408.16 87.40 35671.80 0.634729 1078.72 684.69 21.133rd 0.00247 404.86 78.82 31909.27 0.652291 1116.92 728.56 55.082nd 0.00219 456.62 67.81 30961.60 0.497670 1094.87 544.88 69.221st ‐ ‐ Frame #7
Hs Hs(KSF*CN) ∑(KSF*CN) RAM Value Level Disp Y KSF = 1/Disp CN KSF*CN (KSF*CN) / ∑(KSF*CN)
Roof ‐ ‐ ‐ Mez. ‐ ‐ ‐ Pent. 0.00406 246.31 60.57 14919.36 0.374551 334.56 125.31 166.9111th 0.00323 309.60 59.93 18554.98 0.369977 470.31 174.00 68.6410th 0.00297 336.70 61.02 20546.33 0.373265 585.87 218.68 60.669th 0.00292 342.47 57.39 19655.00 0.367518 702.39 258.14 57.738th 0.00281 355.87 56.37 20061.42 0.366404 796.88 291.98 48.997th 0.00275 363.64 55.12 20044.58 0.364137 878.17 319.77 38.536th 0.00261 383.14 52.83 20242.38 0.361512 938.75 339.37 34.695th 0.00222 450.45 50.03 22537.21 0.362549 992.94 359.99 35.24

Temple University Multipurpose Health Science Center
– Michael Wiegmann – TECHNICAL ASSIGNMENT 3 – Structural
37 | P a g e
4th 0.00239 418.41 49.06 20528.28 0.365271 1078.72 394.03 62.173rd 0.00238 420.17 40.48 17009.50 0.347709 1116.92 388.36 27.792nd 0.00219 456.62 29.47 13457.81 0.216318 1094.87 236.84 112.251st ‐ ‐
Relative Stiffness Properties Cont. Frame Shear Check Cont.
Frame #8
Hs Hs(KSF*CN) ∑(KSF*CN) RAM Value Level Disp Y KSF = 1/Disp CN KSF*CN (KSF*CN) / ∑(KSF*CN)
Roof 0.03958 25.27 31.85 804.76 0.024447 138.35 3.38 2.96Mez. 0.00465 215.05 32.60 7011.29 0.212432 182.6 38.79 41.18Pent. ‐ ‐ ‐ 11th ‐ ‐ ‐ 10th ‐ ‐ ‐ 9th ‐ ‐ ‐ 8th ‐ ‐ ‐ 7th ‐ ‐ ‐ 6th ‐ ‐ ‐ 5th ‐ ‐ ‐ 4th ‐ ‐ ‐ 3rd ‐ ‐ ‐ 2nd ‐ ‐ ‐ 1st ‐ ‐ ‐ Totals
Level ∑(KSF*CN) Roof 32919.30 Mez. 33004.88 Pent. 39832.68 11th 50151.74 10th 55044.91 9th 53480.41 8th 54752.23 7th 55046.79 6th 55993.71 5th 62163.17 4th 56200.08 3rd 48918.77 2nd 62213.06 1st
Temple University Multipurpose Health Science Center
– Michael Wiegmann – TECHNICAL ASSIGNMENT 3 – Structural
38 | P a g e
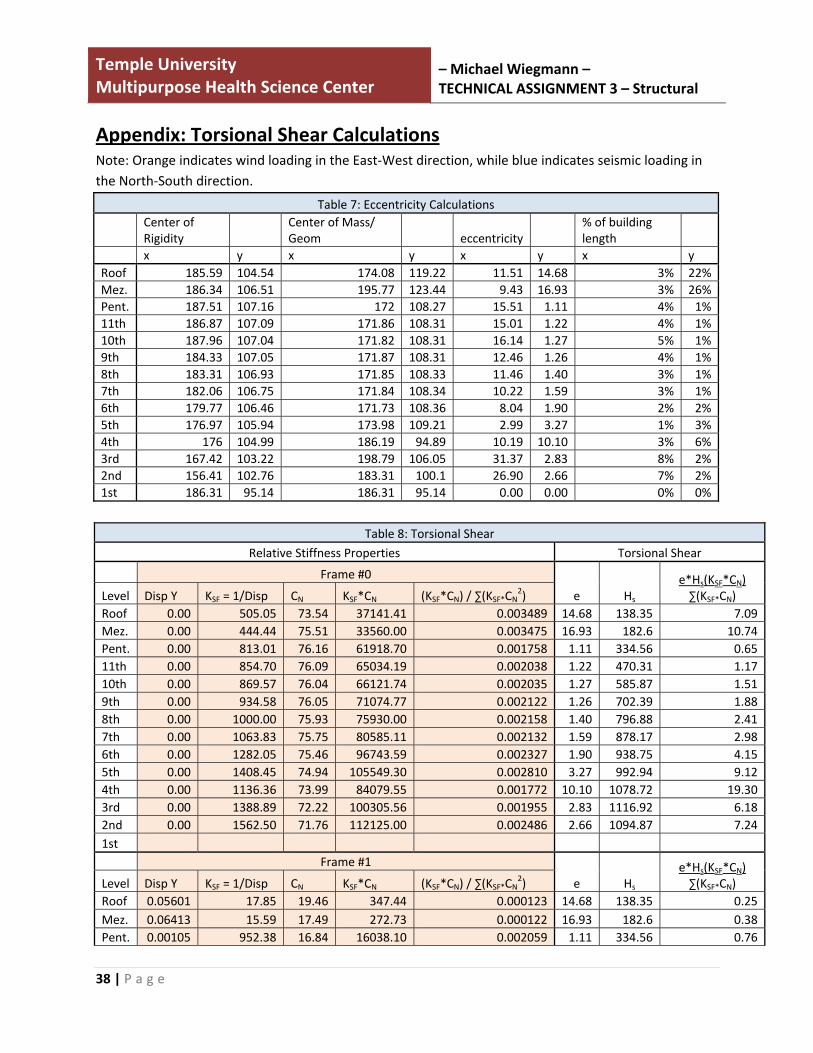
Appendix: Torsional Shear Calculations Note: Orange indicates wind loading in the East‐West direction, while blue indicates seismic loading in the North‐South direction.
Table 7: Eccentricity Calculations
Center of Rigidity
Center of Mass/ Geom eccentricity
% of building length
x y x y x y x yRoof 185.59 104.54 174.08 119.22 11.51 14.68 3% 22%Mez. 186.34 106.51 195.77 123.44 9.43 16.93 3% 26%Pent. 187.51 107.16 172 108.27 15.51 1.11 4% 1%11th 186.87 107.09 171.86 108.31 15.01 1.22 4% 1%10th 187.96 107.04 171.82 108.31 16.14 1.27 5% 1%9th 184.33 107.05 171.87 108.31 12.46 1.26 4% 1%8th 183.31 106.93 171.85 108.33 11.46 1.40 3% 1%7th 182.06 106.75 171.84 108.34 10.22 1.59 3% 1%6th 179.77 106.46 171.73 108.36 8.04 1.90 2% 2%5th 176.97 105.94 173.98 109.21 2.99 3.27 1% 3%4th 176 104.99 186.19 94.89 10.19 10.10 3% 6%3rd 167.42 103.22 198.79 106.05 31.37 2.83 8% 2%2nd 156.41 102.76 183.31 100.1 26.90 2.66 7% 2%1st 186.31 95.14 186.31 95.14 0.00 0.00 0% 0%
Table 8: Torsional Shear
Relative Stiffness Properties Torsional Shear
Frame #0
e Hs e*Hs(KSF*CN) ∑(KSF*CN) Level Disp Y KSF = 1/Disp CN KSF*CN (KSF*CN) / ∑(KSF*CN
2) Roof 0.00 505.05 73.54 37141.41 0.003489 14.68 138.35 7.09Mez. 0.00 444.44 75.51 33560.00 0.003475 16.93 182.6 10.74Pent. 0.00 813.01 76.16 61918.70 0.001758 1.11 334.56 0.6511th 0.00 854.70 76.09 65034.19 0.002038 1.22 470.31 1.1710th 0.00 869.57 76.04 66121.74 0.002035 1.27 585.87 1.519th 0.00 934.58 76.05 71074.77 0.002122 1.26 702.39 1.888th 0.00 1000.00 75.93 75930.00 0.002158 1.40 796.88 2.417th 0.00 1063.83 75.75 80585.11 0.002132 1.59 878.17 2.986th 0.00 1282.05 75.46 96743.59 0.002327 1.90 938.75 4.155th 0.00 1408.45 74.94 105549.30 0.002810 3.27 992.94 9.124th 0.00 1136.36 73.99 84079.55 0.001772 10.10 1078.72 19.303rd 0.00 1388.89 72.22 100305.56 0.001955 2.83 1116.92 6.182nd 0.00 1562.50 71.76 112125.00 0.002486 2.66 1094.87 7.241st Frame #1
e Hs e*Hs(KSF*CN) ∑(KSF*CN) Level Disp Y KSF = 1/Disp CN KSF*CN (KSF*CN) / ∑(KSF*CN
2) Roof 0.05601 17.85 19.46 347.44 0.000123 14.68 138.35 0.25Mez. 0.06413 15.59 17.49 272.73 0.000122 16.93 182.6 0.38Pent. 0.00105 952.38 16.84 16038.10 0.002059 1.11 334.56 0.76

Temple University Multipurpose Health Science Center
– Michael Wiegmann – TECHNICAL ASSIGNMENT 3 – Structural
39 | P a g e
11th 0.00115 869.57 16.91 14704.35 0.002073 1.22 470.31 1.1910th 0.00113 884.96 16.96 15008.85 0.002071 1.27 585.87 1.549th 0.00111 900.90 16.95 15270.27 0.002045 1.26 702.39 1.818th 0.00109 917.43 17.07 15660.55 0.001980 1.40 796.88 2.217th 0.00108 925.93 17.25 15972.22 0.001856 1.59 878.17 2.596th 0.00096 1041.67 17.54 18270.83 0.001891 1.90 938.75 3.375th 0.0011 909.09 18.06 16418.18 0.001814 3.27 992.94 5.894th 0.00093 1075.27 19.01 20440.86 0.001676 10.10 1078.72 18.263rd 0.00083 1204.82 20.78 25036.14 0.001696 2.83 1116.92 5.362nd 0.00047 2127.66 21.24 45191.49 0.003385 2.66 1094.87 9.861st ‐ ‐ Frame #2
e Hs e*Hs(KSF*CN) ∑(KSF*CN) Level Disp Y KSF = 1/Disp CN KSF*CN (KSF*CN) / ∑(KSF*CN
2) Roof 0.05558 17.99 50.46 907.88 0.000124 14.68 138.35 0.25Mez. 0.0634 15.77 48.49 764.83 0.000123 16.93 182.6 0.38Pent. 0.00109 917.43 47.84 43889.91 0.001983 1.11 334.56 0.7411th 0.00119 840.34 47.91 40260.50 0.002003 1.22 470.31 1.1510th 0.00116 862.07 47.96 41344.83 0.002017 1.27 585.87 1.509th 0.00114 877.19 47.95 42061.40 0.001992 1.26 702.39 1.768th 0.00111 900.90 48.07 43306.31 0.001944 1.40 796.88 2.177th 0.00109 917.43 48.25 44266.06 0.001839 1.59 878.17 2.576th 0.00105 952.38 48.54 46228.57 0.001728 1.90 938.75 3.085th 0.00108 925.93 49.06 45425.93 0.001847 3.27 992.94 6.004th 0.00096 1041.67 50.01 52093.75 0.001624 10.10 1078.72 17.693rd 0.00078 1282.05 51.78 66384.62 0.001805 2.83 1116.92 5.702nd 0.00043 2325.58 52.24 121488.37 0.003700 2.66 1094.87 10.771st ‐ ‐
Relative Stiffness Properties Cont. Torsional Shear Cont. Frame #3
e Hs e*Hs(KSF*CN) ∑(KSF*CN) Level Disp Y KSF = 1/Disp CN KSF*CN (KSF*CN) / ∑(KSF*CN
2) Roof 0.05518 18.12 143.46 2599.86 0.000125 14.68 138.35 0.25Mez. 0.06869 14.56 141.49 2059.83 0.000114 16.93 182.6 0.35Pent. 0.00107 934.58 140.84 131626.17 0.002020 1.11 334.56 0.7511th 0.00116 862.07 140.91 121474.14 0.002055 1.22 470.31 1.1810th 0.00114 877.19 140.96 123649.12 0.002053 1.27 585.87 1.539th 0.00112 892.86 140.95 125848.21 0.002027 1.26 702.39 1.798th 0.00109 917.43 141.07 129422.02 0.001980 1.40 796.88 2.217th 0.00103 970.87 141.25 137135.92 0.001946 1.59 878.17 2.726th 0.00096 1041.67 141.54 147437.50 0.001891 1.90 938.75 3.375th 0.0095 105.26 142.06 14953.68 0.000210 3.27 992.94 0.684th 0.00078 1282.05 143.01 183346.15 0.001999 10.10 1078.72 21.783rd 0.00076 1315.79 144.78 190500.00 0.001852 2.83 1116.92 5.852nd 0.00934 107.07 145.24 15550.32 0.000170 2.66 1094.87 0.501st ‐ ‐ Frame #4 e Hs e*Hs(KSF*CN)

Temple University Multipurpose Health Science Center
– Michael Wiegmann – TECHNICAL ASSIGNMENT 3 – Structural
40 | P a g e
Level Disp Y KSF = 1/Disp CN KSF*CN (KSF*CN) / ∑(KSF*CN2) ∑(KSF*CN)
Roof 0.00198 505.05 205.46 103767.68 0.003489 14.68 138.35 7.09Mez. 0.00223 448.43 203.49 91251.12 0.003506 16.93 182.6 10.84Pent. 0.00097 1030.93 202.84 209113.40 0.002229 1.11 334.56 0.8311th 0.00114 877.19 202.91 177991.23 0.002091 1.22 470.31 1.2010th 0.00112 892.86 202.96 181214.29 0.002089 1.27 585.87 1.559th 0.00109 917.43 202.95 186192.66 0.002083 1.26 702.39 1.848th 0.00102 980.39 203.07 199088.24 0.002116 1.40 796.88 2.367th 0.00092 1086.96 203.25 220923.91 0.002179 1.59 878.17 3.046th 0.00084 1190.48 203.54 242309.52 0.002161 1.90 938.75 3.855th 0.00064 1562.50 204.06 318843.75 0.003118 3.27 992.94 10.124th 0.00068 1470.59 205.01 301485.29 0.002293 10.10 1078.72 24.983rd 0.00063 1587.30 206.78 328222.22 0.002234 2.83 1116.92 7.062nd 0.00062 1612.90 207.24 334258.06 0.002566 2.66 1094.87 7.471st ‐ ‐ Totals
Level ∑(KSF*CN) Roof 144764.26 Mez. 127908.51 Pent. 462586.27 11th 419464.41 10th 427338.82 9th 440447.31 8th 463407.11 7th 498883.22 6th 550990.02 5th 501190.84 4th 641445.60 3rd 710448.54 2nd 628613.25 1st

Temple University Multipurpose Health Science Center
– Michael Wiegmann – TECHNICAL ASSIGNMENT 3 – Structural
41 | P a g e
Relative Stiffness Properties Cont. Torsional Shear Cont. Frame #5
e Hs e*Hs(KSF*CN) ∑(KSF*CN) Level Disp Y KSF = 1/Disp CN KSF*CN (KSF*CN) / ∑(KSF*CN
2) Roof ‐ ‐ ‐ Mez. ‐ ‐ ‐ Pent. ‐ ‐ ‐ 11th ‐ ‐ ‐ 10th ‐ ‐ ‐ 9th ‐ ‐ ‐ 8th ‐ ‐ ‐ 7th ‐ ‐ ‐ 6th ‐ ‐ ‐ 5th ‐ ‐ ‐ 4th ‐ ‐ ‐ 3rd ‐ ‐ ‐ 2nd 0.00737 135.69 131.14 17793.65 0.002181 26.90 2463.78 144.54570121st ‐ ‐ Frame #6
e Hs e*Hs(KSF*CN) ∑(KSF*CN) Level Disp Y KSF = 1/Disp CN KSF*CN (KSF*CN) / ∑(KSF*CN
2) Roof 0.00302 331.13 96.99 32114.54 0.010059 11.51 114.77 13.29Mez. 0.00376 265.96 97.74 25993.59 0.008058 9.43 362.53 27.55Pent. 0.00397 251.89 98.91 24913.32 0.006324 15.51 544.6 53.4111th 0.00311 321.54 98.27 31596.75 0.006411 15.01 744.53 71.6510th 0.00288 347.22 99.36 34498.58 0.006308 16.14 1141.39 116.219th 0.00283 353.36 95.73 33825.41 0.006607 12.46 1140.44 93.898th 0.00273 366.30 94.71 34690.81 0.006690 11.46 1337.44 102.547th 0.00267 374.53 93.46 35002.21 0.006804 10.22 1523.59 105.946th 0.00255 392.16 91.17 35751.33 0.007004 8.04 1704.53 95.985th 0.00223 448.43 88.37 39625.96 0.007214 2.99 1922.07 41.464th 0.00245 408.16 87.40 35671.80 0.007263 10.19 2117.78 156.733rd 0.00247 404.86 78.82 31909.27 0.008276 31.37 2300.82 597.342nd 0.00219 456.62 67.81 30961.60 0.007340 26.90 2463.78 486.441st ‐ ‐ Frame #7
e Hs e*Hs(KSF*CN) ∑(KSF*CN) Level Disp Y KSF = 1/Disp CN KSF*CN (KSF*CN) / ∑(KSF*CN
2) Roof ‐ ‐ ‐ Mez. ‐ ‐ ‐ Pent. 0.00406 246.31 60.57 14919.36 0.006184 15.51 544.6 52.2311th 0.00323 309.60 59.93 18554.98 0.006173 15.01 744.53 68.9910th 0.00297 336.70 61.02 20546.33 0.006117 16.14 1141.39 112.689th 0.00292 342.47 57.39 19655.00 0.006404 12.46 1140.44 90.998th 0.00281 355.87 56.37 20061.42 0.006500 11.46 1337.44 99.627th 0.00275 363.64 55.12 20044.58 0.006606 10.22 1523.59 102.866th 0.00261 383.14 52.83 20242.38 0.006843 8.04 1704.53 93.775th 0.00222 450.45 50.03 22537.21 0.007246 2.99 1922.07 41.644th 0.00239 418.41 49.06 20528.28 0.007445 10.19 2117.78 160.66
Temple University Multipurpose Health Science Center
– Michael Wiegmann – TECHNICAL ASSIGNMENT 3 – Structural
42 | P a g e
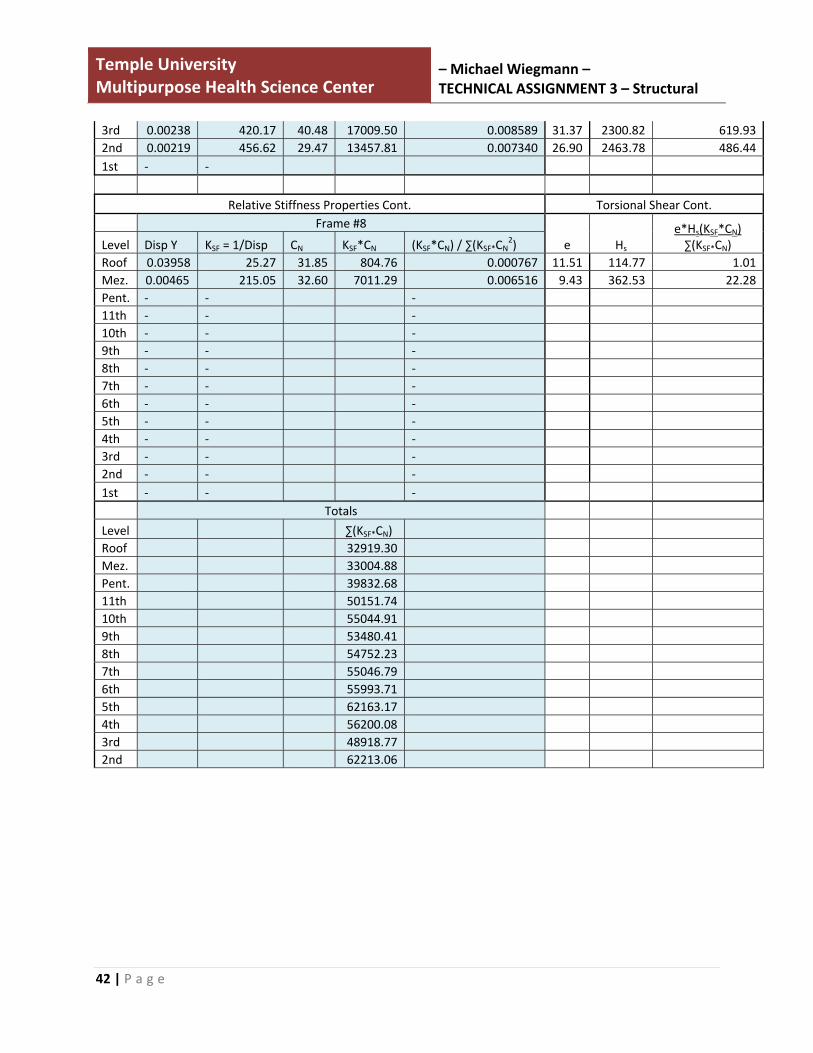
3rd 0.00238 420.17 40.48 17009.50 0.008589 31.37 2300.82 619.932nd 0.00219 456.62 29.47 13457.81 0.007340 26.90 2463.78 486.441st ‐ ‐
Relative Stiffness Properties Cont. Torsional Shear Cont. Frame #8
e Hs e*Hs(KSF*CN) ∑(KSF*CN) Level Disp Y KSF = 1/Disp CN KSF*CN (KSF*CN) / ∑(KSF*CN
2) Roof 0.03958 25.27 31.85 804.76 0.000767 11.51 114.77 1.01Mez. 0.00465 215.05 32.60 7011.29 0.006516 9.43 362.53 22.28Pent. ‐ ‐ ‐ 11th ‐ ‐ ‐ 10th ‐ ‐ ‐ 9th ‐ ‐ ‐ 8th ‐ ‐ ‐ 7th ‐ ‐ ‐ 6th ‐ ‐ ‐ 5th ‐ ‐ ‐ 4th ‐ ‐ ‐ 3rd ‐ ‐ ‐ 2nd ‐ ‐ ‐ 1st ‐ ‐ ‐ Totals
Level ∑(KSF*CN) Roof 32919.30 Mez. 33004.88 Pent. 39832.68 11th 50151.74 10th 55044.91 9th 53480.41 8th 54752.23 7th 55046.79 6th 55993.71 5th 62163.17 4th 56200.08 3rd 48918.77 2nd 62213.06