template structure of local aggregate assessment for north
TRANSCRIPT
Local Aggregate Assessment
for the North Yorkshire Sub-region First Review February 2015
North Yorkshire County Council
City of York Council
Yorkshire Dales National Park Authority
North York Moors National Park Authority

2
Contents Summary
3
Part A – Introduction and context
Overview
Aggregate resources in the North Yorkshire Sub-region
5
5
7
Part B – Monitoring
Existing minerals sites and infrastructure
Aggregate sales and reserves
Consumption within the sub-region and movements of aggregate
within and across the sub-regional boundary
Aggregates landbanks in the North Yorkshire sub-region
12
12
15
27
31
Part C – Assessment of future supply
Aggregates supply requirements in the North Yorkshire sub-
region
Potential approaches to identifying future requirements
Other relevant local information influencing supply of and demand
for aggregate
Conclusions on future supply capability
Key messages for minerals plans, cross-boundary liaison and
34
34
39
42
49
52
Appendix 1 – Information relating to specific sites and facilities 55
Appendix 2 - Further information on movements of aggregate into the
Sub-region
Appendix 3 - Demand forecasting Appendix 4 - Summary information on housing completions and projected housing growth
64
67
73
Glossary 74
Key Sources 76

3
Summary
1. This Local Aggregates Assessment (LAA) for the North Yorkshire sub-region has been
produced jointly by North Yorkshire County Council, City of York Council and the Yorkshire Dales and North York Moors National Park Authorities in response to new requirements introduced in the National Planning Policy Framework in March 2012. It constitutes a review of the first Local Aggregates Assessment for the sub-region, which was published in January 2013.
2. The sub-region is an important supplier of aggregates minerals such as sand and gravel
and crushed rock, as well as alternative sources of secondary and recycled aggregate. This LAA:
Summarises available information on the supply of aggregate within, and movements of aggregates into and out of, the sub-region;
Identifies a basis for establishing future requirements for aggregates from the region over the period to 2030;
Summarises key issues which may impact on the supply of aggregates and identifies the extent to which it is likely that future supply requirements can be met;
Identifies a range of factors which may need to be considered in the preparation of minerals plans, addressed through co-ordination with other planning authorities, or may require on-going review.
Key conclusions from this LAA are: Currently all aggregates produced in the sub-region are from the North Yorkshire County Council and Yorkshire Dales National Park areas, with no production from the City of York and North York Moors National Park areas. Aggregates supplied from the sub-region are of significance at a regional level and beyond. Although there has been a decline in production over the past few years, in response to economic conditions, the strategic significance of aggregate supply from the sub-region is likely to remain high and may increase, particularly for concreting sand and gravel. The sub-region has high overall reserves of crushed rock but reserves of sand and gravel are more limited and there is a need to identify further resources suitable for working to cover the period to 2030. There is also potential for shortfall in supply of Magnesian Limestone in particular in the mid term in the absence of release of further reserves. This LAA suggests future provision for sand and gravel at an overall annual rate equivalent to 2.62mt and for crushed rock at an annual rate of 3.75mt for the period 2014 to 2030 for the North Yorkshire County Council, City of York Council and North York Moors National Park Authority minerals plan area. These levels are around 25% and 16% higher respectively than that derived using 10 year average sales. Unless new permissions are granted, and if recent levels of sales are maintained, there is potential for reserves of high PSV aggregate in the Yorkshire Dales National Park to be significantly reduced in the mid term.

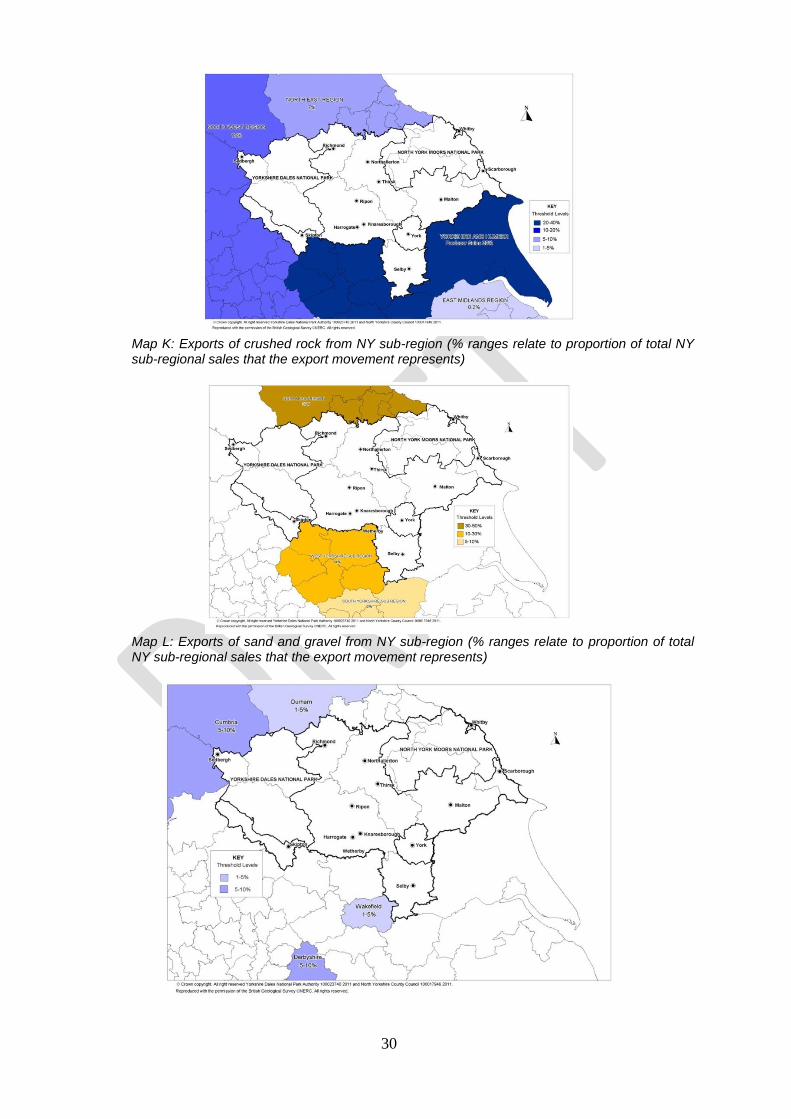
4
There is no expectation of a substantial near term shift in the overall balance of supply from the main sources of aggregate produced in the sub-region (ie crushed rock, land won sand and gravel and secondary and recycled aggregate) although a number of factors, discussed further in Part C of the LAA, have been identified which could impact on this in the mid to long term. A range of factors including matters relating to resource distribution and the presence of substantial areas of National Park and other important designations are likely to place increasing constraints on the supply of aggregates in the longer term. A number of cross-boundary movements of aggregate to/from other areas have been identified which should be considered further through preparation of local minerals plans. A number of matters relating to aggregate supply and demand have been identified which should be kept under review through future updates to this LAA.

5
Part A – Introduction and Context Overview 3. This is the second Local Aggregates Assessment (LAA) to be prepared for the North
Yorkshire sub-region (NY sub-region), following on from the first such assessment, which was published in January 2013. The North Yorkshire sub-region comprises the Mineral Planning Authorities of North Yorkshire County Council (NYCC), City of York Council (CYC), Yorkshire Dales National Park Authority (YDNPA) and North York Moors National Park Authority (NYMNPA) combined (See Map A). The main purpose of the LAA is to set out information on the current supply of, and demand for, aggregate minerals (including primary land won aggregates, marine aggregates and secondary and recycled aggregate materials) within the sub-region and to inform understanding of the options that may be available for the future supply of aggregate. It is therefore expected that the LAA will help contribute to the evidence base for the development of strategic policies for aggregates, to be incorporated in minerals plans, although the LAA itself does not contain any such policies. In this respect no account has therefore been taken of the wide range of environmental or other constraints which may have a bearing upon the amount and distribution of future supply (with the exception of the acknowledgement of the Government's policy approach for aggregates provision in National Parks). The ability and suitability of North Yorkshire to meet the needs identified, bearing in mind the presence of environmental and other constraints, will be explored through the production of minerals plans and through liaising with other MPAs under the Duty to Cooperate1.
4. This LAA is presented in three main sections. Part A summarises the national and local
context leading to its preparation and provides an overview of aggregate resources in the sub-region. Part B presents monitoring information on matters such as sales, reserves and movement of aggregate minerals and minerals infrastructure (with additional information in Appendix 1). Part C deals with the assessment of future supply requirements for aggregates and contains conclusions and suggestions for further work.
5. A requirement for the production of LAAs was introduced in the National Planning Policy
Framework (NPPF) published in March 2012. It states that Mineral Planning Authorities (MPAs) should plan for a steady and adequate supply of aggregates by “Preparing an annual LAA, either individually or jointly by agreement with another or other mineral planning authorities, based on a rolling average of 10 years sales data and other relevant local information, and an assessment of all supply options (including marine dredged, secondary and recycled sources)”.
6. The NPPF further indicates that MPAs should make provision for the land-won and other
elements of their LAAs in their minerals plans taking account of the advice of the Aggregates Working Parties (AWPs) and the National Coordinating Group as appropriate. More detailed guidance on the preparation of LAAs was published as part of a range of new online planning guidance in March 2014. This confirms that the key role of LAAs is to provide:
a forecast of the demand for aggregates based on both the rolling average of 10-years sales data and other relevant local information;
an analysis of all aggregate supply options, as indicated by landbanks, mineral plan allocations and capacity data e.g. marine licences for marine aggregate extraction, recycled aggregates and the potential throughputs from wharves. This
1 The Duty to Cooperate (introduced via the Localism Act 2011) means that planning authorities will be expected to
address strategic issues in conjunction with other authorities who have to deal with the same issues.

6
analysis should be informed by planning information, the aggregate industry and other bodies such as local enterprise partnerships; and
an assessment of the balance between demand and supply, and the economic and environmental opportunities and constraints that might influence the situation. It should conclude if there is a shortage or a surplus of supply and, if the former, how this is being addressed.
7. At the time of preparation of the first LAA there was no active AWP in the Yorkshire and
Humber region. An AWP was constituted during 2013 and, at a meeting on 25 July 2013, agreed the content of the first LAA. The views of the AWP will feed into the preparation of this second LAA.
8. Within the NY sub-region local mineral plans are at a range of stages of preparation. A
joint minerals and waste plan for the three authorities, North Yorkshire County Council, City of York Council and North York Moors National Park Authority is being produced. A first consultation was completed in June 2013 and an Issues and Options consultation took place in early 2014. Maintaining supply of aggregate minerals has been identified as a key issue to address in the Joint Plan. A Publication version of the Yorkshire Dales National Park Local Plan 2015-2030 is due to be issued in July 2015.
9. The decision to prepare a sub-regional LAA reflects the outcome of Regional level
discussions between MPAs in the Yorkshire and Humber area in June and July 2012, at which there was broad agreement that a sub-regional approach, for each of the four Yorkshire and Humber sub-regions, was likely to be appropriate. This reflected a number of considerations including the fact that some data on aggregates is only available at a sub-regional level, that there are known interactions between some parts of the sub-region in terms of aggregates supply, and the existence of established working relationships which facilitate a combined approach on a sub-regional basis.
10. It was also recognised that LAAs prepared within the Y&H region should reflect, as
necessary, interactions in aggregates supply matters both between Y&H sub-regions and across the Regional boundary where necessary. Accordingly, this LAA takes account of available information on the movement of aggregate into and out of the sub-region and its constituent MPAs.
11. National planning policy in the NPPF requires LAAs to be prepared on an annual basis. It
is therefore expected that the information in the LAA will be updated accordingly and therefore help contribute to the on-going monitoring of patterns and trends in aggregates supply relevant to the sub-region.

7
Map A: North Yorkshire sub-regional boundary
Aggregate resources in the NY sub-region
12. The geology of the sub-region is very varied but contains extensive deposits of minerals with potential for use as aggregate, spanning a number of geological periods. Deposits of commercial interest fall into two main types, sand and gravel and crushed rock.
a. Crushed rock
Map B: Distribution of crushed rock resources in NY sub-region
8
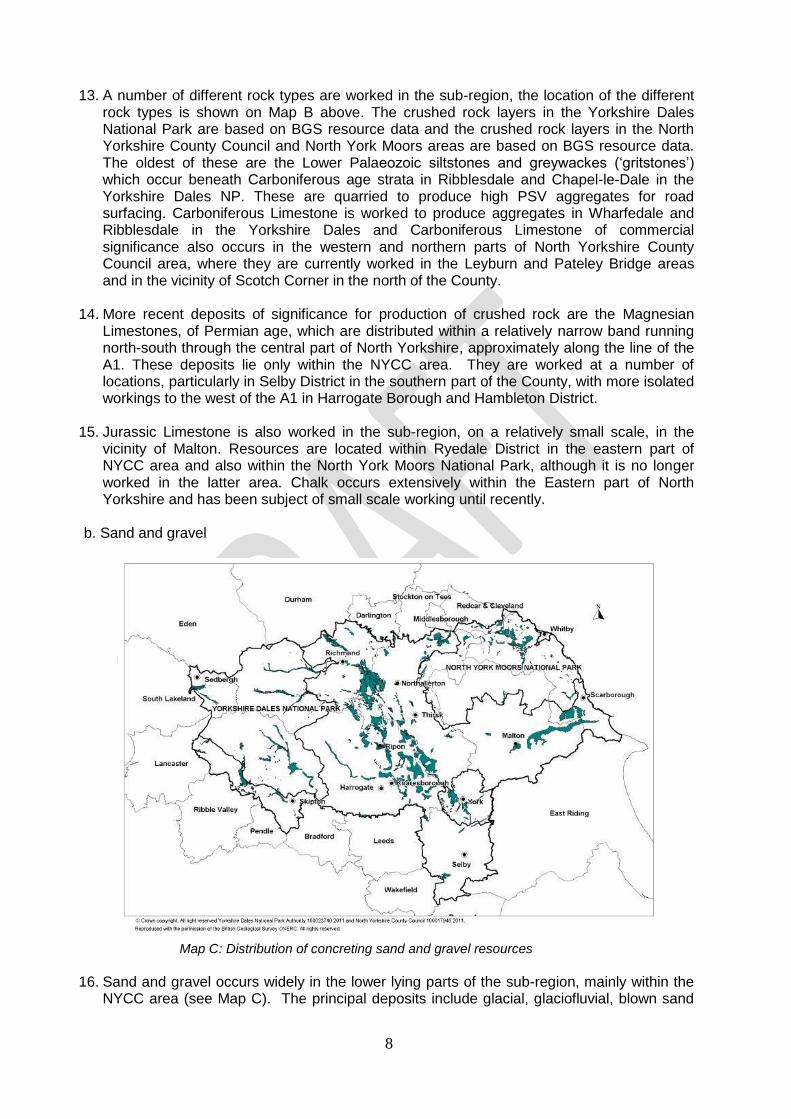
13. A number of different rock types are worked in the sub-region, the location of the different
rock types is shown on Map B above. The crushed rock layers in the Yorkshire Dales National Park are based on BGS resource data and the crushed rock layers in the North Yorkshire County Council and North York Moors areas are based on BGS resource data. The oldest of these are the Lower Palaeozoic siltstones and greywackes (‘gritstones’) which occur beneath Carboniferous age strata in Ribblesdale and Chapel-le-Dale in the Yorkshire Dales NP. These are quarried to produce high PSV aggregates for road surfacing. Carboniferous Limestone is worked to produce aggregates in Wharfedale and Ribblesdale in the Yorkshire Dales and Carboniferous Limestone of commercial significance also occurs in the western and northern parts of North Yorkshire County Council area, where they are currently worked in the Leyburn and Pateley Bridge areas and in the vicinity of Scotch Corner in the north of the County.
14. More recent deposits of significance for production of crushed rock are the Magnesian
Limestones, of Permian age, which are distributed within a relatively narrow band running north-south through the central part of North Yorkshire, approximately along the line of the A1. These deposits lie only within the NYCC area. They are worked at a number of locations, particularly in Selby District in the southern part of the County, with more isolated workings to the west of the A1 in Harrogate Borough and Hambleton District.
15. Jurassic Limestone is also worked in the sub-region, on a relatively small scale, in the
vicinity of Malton. Resources are located within Ryedale District in the eastern part of NYCC area and also within the North York Moors National Park, although it is no longer worked in the latter area. Chalk occurs extensively within the Eastern part of North Yorkshire and has been subject of small scale working until recently.
b. Sand and gravel
Map C: Distribution of concreting sand and gravel resources
16. Sand and gravel occurs widely in the lower lying parts of the sub-region, mainly within the
NYCC area (see Map C). The principal deposits include glacial, glaciofluvial, blown sand
9
and beach deposits and river terrace sand and gravel. River terrace and glaciofluvial deposits tend to form the most significant resources of commercial interest and are worked extensively in the central and northern parts of the NYCC area, particularly in the Swale and Ure valleys but also in the Vale of Pickering to the east. Sand from much older geological deposits is also worked, on a relatively small scale, in Selby District.
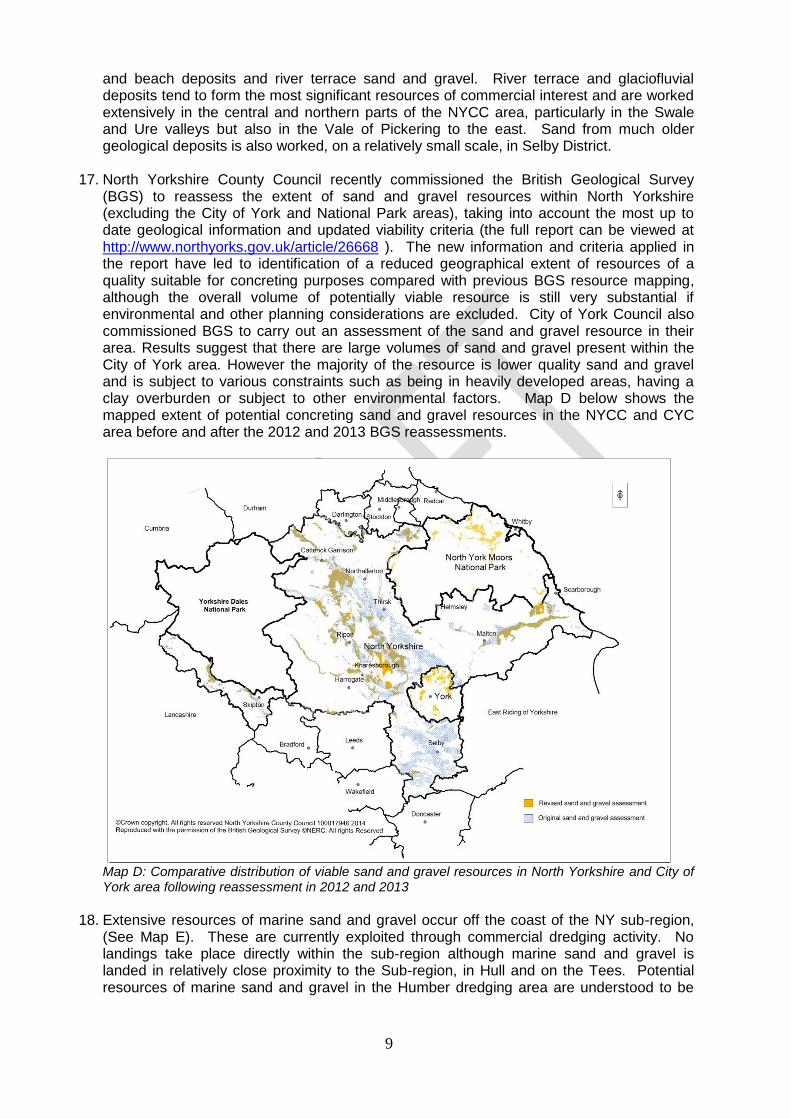
17. North Yorkshire County Council recently commissioned the British Geological Survey
(BGS) to reassess the extent of sand and gravel resources within North Yorkshire (excluding the City of York and National Park areas), taking into account the most up to date geological information and updated viability criteria (the full report can be viewed at http://www.northyorks.gov.uk/article/26668 ). The new information and criteria applied in the report have led to identification of a reduced geographical extent of resources of a quality suitable for concreting purposes compared with previous BGS resource mapping, although the overall volume of potentially viable resource is still very substantial if environmental and other planning considerations are excluded. City of York Council also commissioned BGS to carry out an assessment of the sand and gravel resource in their area. Results suggest that there are large volumes of sand and gravel present within the City of York area. However the majority of the resource is lower quality sand and gravel and is subject to various constraints such as being in heavily developed areas, having a clay overburden or subject to other environmental factors. Map D below shows the mapped extent of potential concreting sand and gravel resources in the NYCC and CYC area before and after the 2012 and 2013 BGS reassessments.
Map D: Comparative distribution of viable sand and gravel resources in North Yorkshire and City of York area following reassessment in 2012 and 2013
18. Extensive resources of marine sand and gravel occur off the coast of the NY sub-region,
(See Map E). These are currently exploited through commercial dredging activity. No landings take place directly within the sub-region although marine sand and gravel is landed in relatively close proximity to the Sub-region, in Hull and on the Tees. Potential resources of marine sand and gravel in the Humber dredging area are understood to be

10
very extensive. Leeds City Council commissioned a Marine Aggregates Study2, which was jointly funded by mineral planning authorities in the Yorkshire and Humber area, to assess the future potential for increasing the amount of marine dredged sand and gravel supplied into the Yorkshire and Humber Region. Further discussion on this is included later in the LAA. The current extent of the Humber dredging area is shown on Map H on page 13)
Map E: Marine sand and gravel resources in East Inshore and East Offshore areas.
3
c. Secondary and recycled aggregates
19. Sand and gravel and crushed rock comprise primary aggregate sources. However, other materials may be able to substitute for primary aggregates for some end uses and these may comprise either secondary aggregate4 or recycled aggregate5. Within the NY sub-region secondary aggregates currently include two main potential sources; colliery spoil arising from deep mining of coal in Selby District (NYCC area) and combustion ash from power generation, also arising within Selby District. Recycled aggregate often arises on a more dispersed and intermittent basis, usually in association with particular construction projects and hence tends to be associated with more developed parts of the sub-region. Although specific data is not available, it is therefore considered likely that NYCC and CYC supply most of the recycled aggregate originating within the sub-region, although there are also a small number of facilities in the NYMNP area (see map J on page 15).
2 URS Marine Aggregates Study, Final, January 2014.
3 BGS; The Mineral Resources of East Inshore and East Offshore Marine Plan Areas, Southern Northern Sea.
2011 4 Secondary aggregates are derived from a range of materials which may be used as aggregate, including power
station ash and colliery spoil. 5 Recycled aggregates can be sourced from construction and demolition waste, highway maintenance waste and
excavation and utility operations and which can then be reused as aggregate.

11
Principal uses of aggregate supplied from the sub-region
20. Aggregates worked in the sub-region serve a range of end uses and markets, generally dependant on the quality and properties of the material. In summary, the main end uses/markets for the main types of aggregate worked in the sub-region are as follows:
Deposit Principle uses/markets Main Occurrences
Glacial, Glacio-fluvial and river terrace sands and gravel
Concreting sand and gravel Principally central and northern NYCC area, including valleys of the Rivers Swale and Ure and Vales of Mowbray and York, Derwent and Leven valleys, City of York
Blown sand and Permian sands
Mortar sand Selby area and other isolated occurrences (NYCC area), large volumes occur in northern CYC area with smaller pockets in the south of CYC.
Marine sand and gravel Concreting sand and gravel. Beach replenishment
Offshore (Humber dredging area)
Chalk (not currently being worked within the sub-region)
Generally lower grade uses such as constructional fill
Eastern NYCC area (Ryedale and Scarborough Districts)
Jurassic Limestone Generally lower grade uses such as constructional fill. May in some instances be capable of use as concrete aggregate and other higher specification end uses
Eastern NYCC area (Ryedale District, North York Moors National Park)
Magnesian Limestone Lower grade uses such as constructional fill. Higher quality Magnesian Limestone (principally the Upper Magnesian Limestone) can be used as concrete aggregate and uncoated roadstone
NYCC area only (narrow north-south outcrop passing through parts of Richmondshire, Harrogate and Selby Districts)
Carboniferous Limestone
Concreting aggregate and coated and uncoated roadstone
Yorkshire Dales National Park, relatively limited distribution in Northern and Western NYCC (principally within Richmondshire and Craven Districts, with isolated occurrence in Harrogate Borough)
Palaeozoic gritstone High PSV aggregate for specialist surfacing requirements
Yorkshire Dales National Park (Western part)
Colliery spoil Bulk and constructional fill and road construction. May be used as a partial replacement for higher grade aggregate in higher specification end uses
Active production at Kellingley colliery (Selby District of NYCC area) but colliery is now expected to close at the end of 2015. A major completed and landscaped spoil disposal mound is located at Sherburn-in-Elmet (Selby District)
Power station ash Ash comprises two main types: Pulverised Fuel Ash (PFA) and Furnace Bottom Ash (FBA). PFA is typically used in lightweight block manufacture and as a partial replacement for higher grade aggregate in higher specification end uses.
Active production at Drax and Eggborough power stations in Selby District (NYCC area). Previously deposited ash occurs in ash disposal facilities at Drax and at Gale Common and Brotherton Ings, also in Selby District
Recycled aggregate Generally lower grade uses such as constructional fill. May be used as a partial replacement for higher grade aggregate in higher specification end uses
Generally produced in association with construction and demolition activity. Distribution therefore variable and intermittent but generally within more developed parts of the sub-region

12
Part B - Monitoring Existing minerals sites and infrastructure
21. The overall distribution of quarries and minerals supply infrastructure in the NY sub-region
is shown on the following maps. More information on specific sites and facilities is set out in Appendix 1.
Map F: Active and dormant sand and gravel sites in the NY sub-region
Map G: Active and dormant crushed rock sites in the NY sub-region

13
22. Production of primary aggregate currently only takes place in two of the four MPAs in the sub-region; NYCC and YDNP. The majority of current aggregates quarries and infrastructure are located within the NYCC area, although there are also major and important quarries in the YDNP. Extraction of crushed rock has taken place in the NYMNP on a relatively small scale until 2007. There is no recent history of aggregate working within the CYC area.
23. Dormant primary aggregate sites are only present in the NYCC Plan area. There are some dormant sand and gravel sites (which are generally thought to contain material which is not of concreting quality) but the majority are crushed rock sites, mainly Carboniferous Limestone. Reserves in dormant sites do not count towards the landbank6 until such time as updated working and reclamation schemes have been approved.
24. A number of licensed marine aggregate dredging areas are located in relatively close proximity to the coast of the NY sub-region (see Map H). The Crown Estate produces summary statistics each year on marine aggregate. This indicates that marine aggregate is landed in the Yorkshire and Humber landward region at Hull, and at wharves on the Tees and the Tyne in the North East region.
Map H: Licensed marine dredging areas and application areas in the Humber dredging region
7
25. Supply of aggregate is supported by a range of associated infrastructure such as ready-
mixed concrete and coating plants, shown on Map I below. The map also shows the locations of known infrastructure such as wharves and railheads, including known facilities not currently used for minerals transport.
6 The landbank is the sum in tonnes of all permitted reserves for which valid planning permissions are extant. This
includes current non-working sites but excludes dormant sites and “inactive sites” (set out under the Planning and Compensation Act 1991 and Environment Act 1995, for which a review is required before operations can commence or resume). 7 Crown Estates Briefing Note: Issue 3 Marine Aggregates Opportunities, Region: Humber, May 2012.

14
Map I: Minerals supply and transport infrastructure
26. The majority of the concrete making, coated roadstone and block making facilities in the sub-region are located within the NYCC area. Some are present on operational extraction sites and others are standalone facilities located on industrial estates or where they are easily accessible.
27. There are several canal and river wharves present in the sub-region but, currently, none are being used to transport minerals, although the wharf at Drax power station has recently been used for transport of secondary aggregate. A list of wharves is provided in Appendix 1. Appendix 1 also includes a list of railheads and rail sidings which are present within the sub-region. Some are used for transporting non-aggregates minerals including coal, such as at Kellingley Colliery and at Eggborough and Drax power stations, as well as potash from Boulby mine. The railhead at Drax was also used for the transport of secondary aggregate in 2012. Others are used to transport aggregate, including; an export railhead at Swinden Quarry, in YDNP; Ribblehead sidings which are used to transport stone from Ingleton Quarry (also located in the YDNP) and the YDNPA has approved the construction of a railhead at Arcow Quarry to be used by both Arcow and Dry Rigg quarries. An import railhead at the Potter Group site in Selby is also in use for reception of aggregate. Some of the other rail heads and sidings have been used, or might have the potential to be developed, for minerals transport as referred to in the table in Appendix 1.
28. Map J below shows the main known locations of secondary aggregate production and sites producing recycled aggregate. There are 3 sites in the sub-region which currently can supply secondary aggregate on a significant scale. Two of the sites are coal fired power stations at Eggborough and Drax, which produce Furnace Bottom Ash (FBA) and Pulverised Fuel Ash (PFA). The third site is a deep coal mine (Kellingley Colliery) which produces colliery spoil which can also be used as aggregate. However, this site is now expected to close at the end of 2015. Ash and colliery spoil not sold for use as secondary aggregate are disposed of at dedicated waste disposal sites at Barlow and Gale Common ash disposal facilities and, in the case of colliery spoil, at a disposal facility at Womersley, all of which are located in Selby District. Ash from Ferrybridge power station, in West Yorkshire, is also disposed of at the Gale Common facility. Ash has been recovered from

15
both the Barlow and Gale Common sites for sale and therefore these facilities also represent potential sources of secondary aggregate.
29. Recycled aggregate tends to be sourced from construction, demolition and excavation waste. As shown on the map there are many waste sites which are known to deal with Construction and Demolition waste (C&D waste). Recycling of such waste (and hence the production of recycled aggregate) is often dealt with at temporary sites and sites exempt from permitting by the Environment Agency and hence good quality data on locations of production and amounts produced is not available.
Map J: Known secondary and recycled aggregate supply locations
Aggregate sales and reserves a. Sales
30. As noted earlier in this LAA, a range of types of aggregate are supplied by the NY sub-
region. Available information is summarised below. Unless otherwise stated, data is derived mainly from surveys carried out by the Yorkshire and Humber Regional Aggregates Working Party (YHRAWP) or directly by NYCC. For the years 2010 and 2011 only NYCC and YDNP survey information is available as there was no active aggregates working party. This may influence the direct comparability of figures between 2009 and 2010, and between 2010 and 2013. Any such differences are not considered to be significant at a strategic level. For the purposes of reporting 2013 data, and for subsequent years, it has been agreed that crushed rock sales from Wakefield Metropolitan District Council area will be included within NYCC figures. This is because the figure cannot be reported separately for confidentiality reasons and the main reserve in Wakefield is worked through a processing plant located within North Yorkshire. This impacts on the direct comparability of crushed rock sales figures compared with earlier years. Not all data on sales and

16
consumption is available at MPA level, some is only available at sub-regional or North Yorkshire County Council and YDNP level.
i) Primary land won aggregate
Sand and Gravel (mt) Crushed Rock (mt)
NYCC YDNP NYMNP CYC NYCC YDNP (crushed rock total – limestone and high psv aggregate)
YDNP (high PSV aggregate only)
NYMNP CYC
2004 2.8 0 0 4.2 3.8 0.9 0.2 0 2005 2.8 0 0 3.9 4.0 1.1 0.1 0 2006 2.7 0 0 3.8 3.8 1.0 0.1 0 2007 2.7 0 0 4.3 4.0 1.0 0.1 0 2008 2.3 0 0 3.8 3.8 1.0 0 0 2009 1.7 0 0 2.6 2.6 0.9 0 0 2010 1.6 0 0 2.9 2.6 0.8 0 0 2011 1.7 0 0 1.9 2.6 0.9 0 0 2012 1.6 0 0 2.4 2.6 0.8 0 0 2013 1.5 0 0 2.8
8 2.9 0.8 0 0
Average 2.1 0 0 3.3 3.3 0.9 0 0
Table 1: Historic sales of landwon aggregate by MPA and aggregate type 2004 - 2013
Figure 1: Sand and gravel and crushed rock sales in NY sub region, 2004 – 2013
31. For the purposes of reporting sand and gravel reserves and landbanks data (but not sales
data) in previous YHRAWP surveys, concreting sand and gravel from the NYCC area has been subdivided into two main production areas (a northwards distribution area and a southwards distribution area) reflecting the fact that, typically, quarries in the northern part of the County (mainly in the valley of the River Swale in the Catterick/Scorton area) tend to supply most of their production northwards into the Tees Valley/Durham areas whereas sites elsewhere in North Yorkshire (principally the Ure Valley and the Vale of Pickering) supply most of their sales into the NY sub-region or to markets in West and South
8 Includes sales from reserves located in Wakefield but processed via plant in North Yorkshire
0
0.5
1
1.5
2
2.5
3
3.5
4
4.5
5
20
04
20
05
20
06
20
07
20
08
20
09
20
10
20
11
20
12
20
13
mill
ion
to
nn
es
S & G NYCC CR NYCCCR YDNP (CR total – limestone and high psv ) CR YDNP (high PSV )CR NYMNP
17
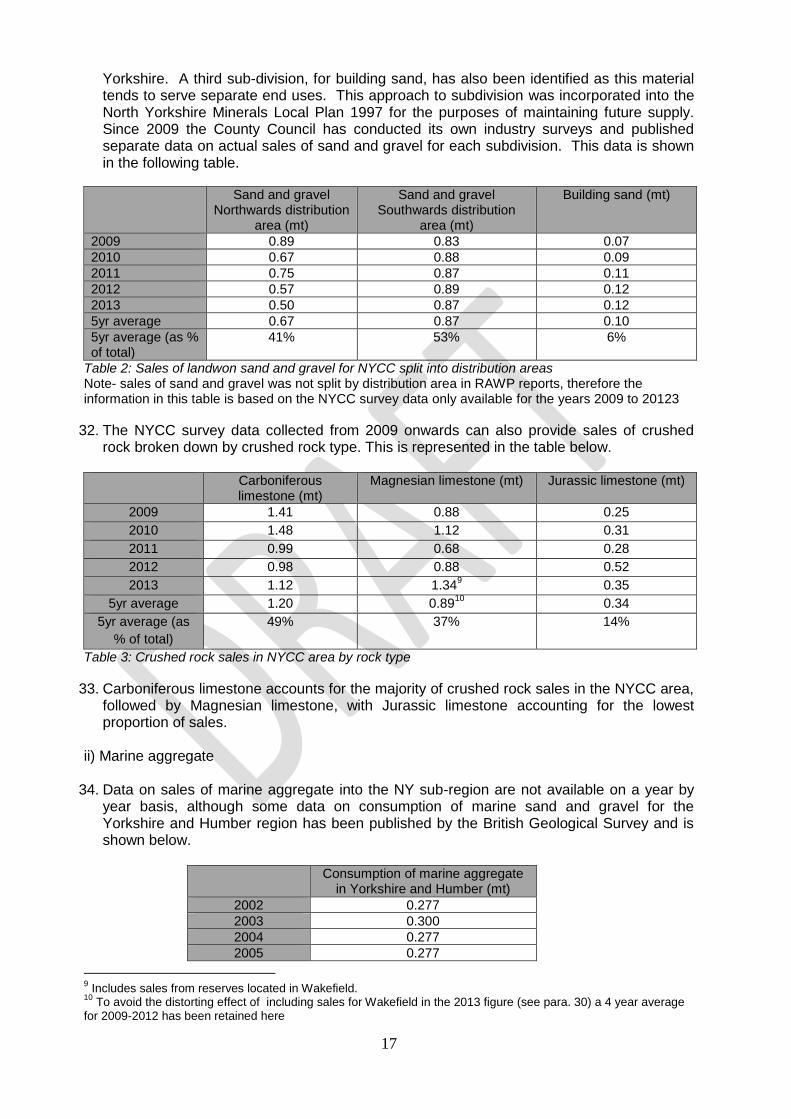
Yorkshire. A third sub-division, for building sand, has also been identified as this material tends to serve separate end uses. This approach to subdivision was incorporated into the North Yorkshire Minerals Local Plan 1997 for the purposes of maintaining future supply. Since 2009 the County Council has conducted its own industry surveys and published separate data on actual sales of sand and gravel for each subdivision. This data is shown in the following table.
Sand and gravel Northwards distribution
area (mt)
Sand and gravel Southwards distribution
area (mt)
Building sand (mt)
2009 0.89 0.83 0.07
2010 0.67 0.88 0.09
2011 0.75 0.87 0.11
2012 0.57 0.89 0.12
2013 0.50 0.87 0.12
5yr average 0.67 0.87 0.10
5yr average (as % of total)
41% 53% 6%
Table 2: Sales of landwon sand and gravel for NYCC split into distribution areas Note- sales of sand and gravel was not split by distribution area in RAWP reports, therefore the information in this table is based on the NYCC survey data only available for the years 2009 to 20123
32. The NYCC survey data collected from 2009 onwards can also provide sales of crushed rock broken down by crushed rock type. This is represented in the table below.
Carboniferous
limestone (mt) Magnesian limestone (mt) Jurassic limestone (mt)
2009 1.41 0.88 0.25
2010 1.48 1.12 0.31
2011 0.99 0.68 0.28
2012 0.98 0.88 0.52
2013 1.12 1.349 0.35
5yr average 1.20 0.8910
0.34
5yr average (as
% of total)
49% 37% 14%
Table 3: Crushed rock sales in NYCC area by rock type
33. Carboniferous limestone accounts for the majority of crushed rock sales in the NYCC area, followed by Magnesian limestone, with Jurassic limestone accounting for the lowest proportion of sales.
ii) Marine aggregate
34. Data on sales of marine aggregate into the NY sub-region are not available on a year by year basis, although some data on consumption of marine sand and gravel for the Yorkshire and Humber region has been published by the British Geological Survey and is shown below.
Consumption of marine aggregate in Yorkshire and Humber (mt)
2002 0.277
2003 0.300
2004 0.277
2005 0.277
9 Includes sales from reserves located in Wakefield.
10 To avoid the distorting effect of including sales for Wakefield in the 2013 figure (see para. 30) a 4 year average
for 2009-2012 has been retained here

18
2006 0.322
2007 0.322
2008 0.322
2009 0.322
2010 0.234
2011 0.234
2012 0.234
2013 0.234
Table 4: Consumption of marine aggregate in Yorkshire and Humber between 2002 - 2013
35. The figures in the above table are recorded in the BGS Minerals Yearbooks which are
currently available through to 2013, although the original data is based on the consumption of aggregates survey, which is collated by region and is carried out once every four years, hence why the same figure appears for four consecutive years. In the 2003 report the figure appears to have been rounded up, hence the apparent change in figure for this year.
36. Of the marine aggregate dredged for construction from the Humber dredging region in
2013, 61% was delivered to the continent, 26% was delivered to the Humber region (which includes landings in the Tyne, Tees and Humber estuaries) with the remainder being delivered to the Thames Estuary. Of the marine aggregate landed in the Humber region in 2013 approximately 15% was landed at Hull11. Sales/consumption into the Yorkshire and Humber region are detailed above. According to the Crown Estate,12 over the past 10 years on average 76%13 of the permitted tonnage has been dredged from the Humber Region and at present there is an opportunity to dredge approximately 2.1mt more per annum.
37. Based on further information supplied from BGS (utilising the national collation of the 2009 aggregates monitoring survey), of the total marine sand and gravel consumed in the North Yorkshire sub region in 2009 between 50 and 60% (0.02-0.04mt) was supplied via South Tyneside MBC and the remaining 40 to 50% (0.016-0.02mt) was supplied via Stockton on Tees MBC. Therefore, in that year all the marine sand and gravel supplied into the North Yorkshire sub-region came from landings in the North East landward region.
38. The graph below illustrates the trend in landings of marine dredged sand and gravel between 2002 and 2013 in the North East Region and the Yorkshire and Humber Region. Data is provided for the NE region because this includes landings on Teesside and Tyneside, which were known to supply into the NY sub-region in 2009.
11
Crown Estate Marine Aggregates Summary of Statistics, 2013 12
Crown Estates Briefing Note: Issue 3 Marine Aggregates Opportunities, Region: Humber, May 2012 13
In 2013 less than half the tonnage permitted was actually removed.

19
Figure 2: Marine dredged aggregates landing at Yorkshire and Humber and North East Ports
14
39. There is substantially more landed in the North East Region than the Yorkshire and Humber Region. Landings in both Regions have reduced substantially since 2007 in line with the trend in sales of landwon aggregate.
iii) Secondary and recycled aggregate
40. NYCC is the only MPA in the NY sub-region which has significant sources of secondary aggregate. These are mainly in the form of ash from coal fired power stations at Drax and Eggborough and colliery spoil from Kellingley Colliery (although this site is due to close at the end of 2015). Ash from a third power station, Ferrybridge, is generated just outside the Sub-region but is also currently disposed of at a facility (Gale Common) inside the Sub-region. The graph below shows the trend in sales of ash and colliery spoil over the past 10 years. Specific data on sales of recycled aggregate are not available.
Figure 3: Sales of secondary aggregate in the North Yorkshire sub-region
14
Yorkshire and Humber RAWP and North East RAWP 2001 to 2009 and Crown Estates Marine Aggregates, Summary of Statistics 2010, 2011, 2012 and 2013
0
0.2
0.4
0.6
0.8
1
1.2
20
04
20
05
20
06
20
07
20
08
20
09
20
10
20
11
20
12
20
13
mill
ion
to
nn
es
Yorkshire & Humber North East
0
0.5
1
1.5
2
2.5
20
04
20
05
20
06
20
07
20
08
20
09
20
10
20
11
20
12
20
13
mill
ion
to
nn
es
PFA (mt) FBA (mt) Total Ash (mt) Colliery Spoil (mt)

20
Discussion on aggregate sales
41. The above tables and graphs illustrate the position in relation to sales of sand and gravel, crushed rock, marine and secondary aggregate in the NY sub-region. The overall trend in sand and gravel sales had been relatively constant until 2007, since when there was a significant drop over the two years to 2009. Since then sales have fluctuated around a lower level. Through the availability of more detailed NYCC survey data for the NYCC plan area, it has been possible to identify sand and gravel sales data separately for northwards and southwards distribution areas (concreting sand and gravel) and building sand, for the past 5 years. Production in the southern distribution area has stayed relatively constant, but production in the northern distribution area has fluctuated more and output of building sand has increased.
42. Another potential source of sand and gravel is from marine aggregate which is landed at the Humber Estuary and consumed in the Yorkshire and Humber Region. However, available data suggests that the relatively small amount of marine aggregate sold into the NY sub-region has been supplied from wharves or ports in the North East region. The total consumed in 2009 was between 0.036mt and 0.044mt. The overall amount of marine aggregate consumed in the Yorkshire and Humber Region prior to 2009 was around 0.3mt per annum, dropping to less than 0.25mt in 2010, 2011, 2012 and 2013, the most recent year for which data is available.
43. The trend in crushed rock production levels has generally been very similar for both NYCC and the YDNP, with both showing a significant overall decline in production over the past 3 to 4 years, compared to previous relatively steady levels. However, sales of crushed rock within both NYCC and the YDNP have increased slightly in recent years. Sales of high PSV stone from the YDNP have remained more stable over the past 10 years.
44. The main secondary aggregates available in the sub-region are ash, from Drax and Eggborough coal fired power stations, together with ash from Ferrybrige power station which is disposed of in North Yorkshire, and colliery spoil from Kellingley Colliery. The average amount of ash used for secondary aggregate over the past 10 years is 1.4mt per annum, with 79% coming from PFA and 21% from FBA. The average amount of colliery spoil used as secondary aggregate over the past 10 years is relatively small at c.0.0815mt per annum. Ash and colliery spoil which does not get sold as secondary aggregate from the point of production is disposed of at dedicated waste sites, although these may in themselves represent a further source of supply if re-working of deposited material were to take place.
45. The amount of secondary and recycled materials produced is dependent upon the primary process to which it relates, because the material is a by-product. Changes in the processes which lead to the production of material with potential for use as a secondary aggregate may also be significant, to the extent that they may impact on the properties and quality of secondary aggregate. Data shows that, in recent years, FBA is generally fully utilised whereas availability of PFA and colliery spoil exceeds utilisation. Sales of PFA increased over the period 2010 to 2012 but have since reduced. The reason for this is not known. The conversion to biomass fuel of a proportion of generation capacity at Drax and Eggborough power stations may have some impact on availability of material with potential for use as secondary aggregate over the next few years and beyond, although consultation on the first LAA indicated mixed views from operators on the potential significance of this. Other constraints noted by operators during consultation were the designation of PFA by the Environment Agency as a waste requiring disposal at a licensed or exempt site and the need for it to be in accordance with a WRAP Quality Protocol to be considered a by-product. Sale of ash from the Gale Common ash disposal site in Selby District is currently
15
Source: UK Coal email 5 Sept 2014
21
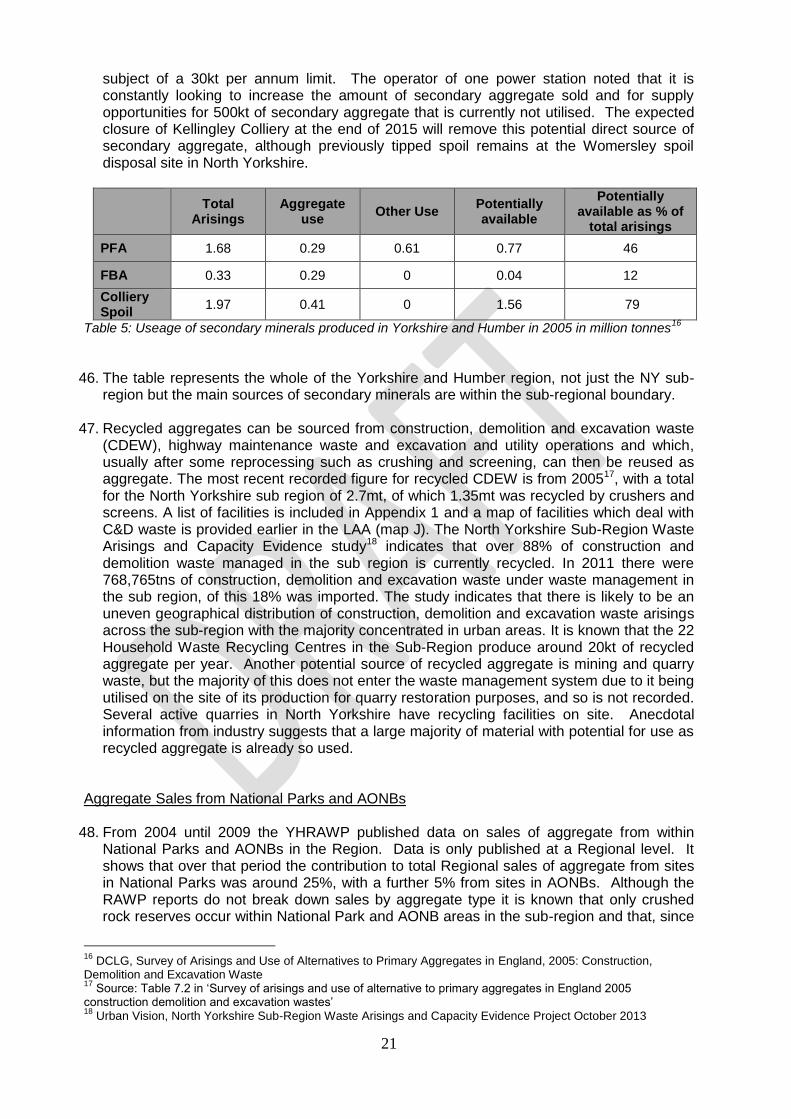
subject of a 30kt per annum limit. The operator of one power station noted that it is constantly looking to increase the amount of secondary aggregate sold and for supply opportunities for 500kt of secondary aggregate that is currently not utilised. The expected closure of Kellingley Colliery at the end of 2015 will remove this potential direct source of secondary aggregate, although previously tipped spoil remains at the Womersley spoil disposal site in North Yorkshire.
Total Arisings
Aggregate use
Other Use Potentially available
Potentially available as % of
total arisings
PFA 1.68 0.29 0.61 0.77 46
FBA 0.33 0.29 0 0.04 12
Colliery Spoil
1.97 0.41 0 1.56 79
Table 5: Useage of secondary minerals produced in Yorkshire and Humber in 2005 in million tonnes16
46. The table represents the whole of the Yorkshire and Humber region, not just the NY sub-region but the main sources of secondary minerals are within the sub-regional boundary.
47. Recycled aggregates can be sourced from construction, demolition and excavation waste
(CDEW), highway maintenance waste and excavation and utility operations and which, usually after some reprocessing such as crushing and screening, can then be reused as aggregate. The most recent recorded figure for recycled CDEW is from 200517, with a total for the North Yorkshire sub region of 2.7mt, of which 1.35mt was recycled by crushers and screens. A list of facilities is included in Appendix 1 and a map of facilities which deal with C&D waste is provided earlier in the LAA (map J). The North Yorkshire Sub-Region Waste Arisings and Capacity Evidence study18 indicates that over 88% of construction and demolition waste managed in the sub region is currently recycled. In 2011 there were 768,765tns of construction, demolition and excavation waste under waste management in the sub region, of this 18% was imported. The study indicates that there is likely to be an uneven geographical distribution of construction, demolition and excavation waste arisings across the sub-region with the majority concentrated in urban areas. It is known that the 22 Household Waste Recycling Centres in the Sub-Region produce around 20kt of recycled aggregate per year. Another potential source of recycled aggregate is mining and quarry waste, but the majority of this does not enter the waste management system due to it being utilised on the site of its production for quarry restoration purposes, and so is not recorded. Several active quarries in North Yorkshire have recycling facilities on site. Anecdotal information from industry suggests that a large majority of material with potential for use as recycled aggregate is already so used.
Aggregate Sales from National Parks and AONBs
48. From 2004 until 2009 the YHRAWP published data on sales of aggregate from within National Parks and AONBs in the Region. Data is only published at a Regional level. It shows that over that period the contribution to total Regional sales of aggregate from sites in National Parks was around 25%, with a further 5% from sites in AONBs. Although the RAWP reports do not break down sales by aggregate type it is known that only crushed rock reserves occur within National Park and AONB areas in the sub-region and that, since
16
DCLG, Survey of Arisings and Use of Alternatives to Primary Aggregates in England, 2005: Construction, Demolition and Excavation Waste 17
Source: Table 7.2 in ‘Survey of arisings and use of alternative to primary aggregates in England 2005 construction demolition and excavation wastes’ 18
Urban Vision, North Yorkshire Sub-Region Waste Arisings and Capacity Evidence Project October 2013

22
2007 when crushed rock production ceased in the NYMNPA area, only the Yorkshire Dales NP contributed to sales from within National Parks. Sales from within AONBs all occur within the NYCC area (Nidderdale and Howardian Hills AONBs). The proportion of supply from such sources remained relatively steady over that period, although the 2009 YHRAWP report notes a slight upward trend in sales from National Parks. The report also notes that, as quarries in these areas include some of the region’s major production sites, with relatively high levels of sales and reserves, there is no indication of a significant decrease in the proportion of sales from within National Park and AONB designations in the short to medium term.
b. Reserves
49. A range of types of aggregate are permitted for working in the NY sub-region. Available
data on reserves is summarised below. i) Primary landwon aggregate
Sand and Gravel (mt)
Crushed Rock (mt)
Carboniferous Limestone
Magnesian Limestone
Jurassic Limestone
Chalk High PSV
North Yorkshire County Council
18.63
77.52
17.21
19
9.64
Some available
reserves but site closed by
operator
-
Yorkshire Dales
National Park
- 78.37 - - -
6.99
North York Moors
National Park
- - - - -
-
City of York Council
- - - - -
-
Total
18.63 155.89 17.21 9.64 Some available
reserves but site closed by
operator
6.99
Table 6: Reserves of primary landwon aggregate, by MPA and aggregate type at end of 2013
19
Includes reserves in Wakefield

23
Figure 4: Reserves of primary landwon aggregate, by MPA and aggregate type at end of 2013.
50. The table and graph below illustrate the trend over time in reserves for sand and gravel and
crushed rock in the NYCC area and the Yorkshire Dales National Park. Reserves of crushed rock in the North York Moors National Park were exhausted in 2007 and there are no reserves in the City of York area. It can be seen that reserves of sand and gravel are substantially lower than for crushed rock. The large majority of overall aggregate reserves comprise Carboniferous Limestone, and these are split between NYCC and the YDNP.
NYCC sand and gravel reserves
NYCC crushed rock reserves
YDNP crushed rock reserves*
2002 31.28 110.51 143.12
2003 28.95 109.61 139.17
2004 28.04 105.35 137.28
2005 24.29 108.30 131.83
2006 22.85 105.20 128.00
2007 20.65 101.10 124.00
2008 20.02 100.50 120.20
2009 18.42 103.90 106.24
2010 17.98 101.00 103.63
2011 16.24 97.70 104.49
2012 14.620
97.00 89.21
2013 18.63 104.3721
85.36
Table 7: Reserves of sand and gravel and crushed rock over time by MPA area. *the fall in reserves in the YDNP area between 2008 and 2009 results partially from reassessment of reserves by operators for the 2009 Annual Monitoring survey, whereas reserves for 2006, 2007 and
20
This is the total permitted reserve figure at the end of 2012. It does not include a further 4.5mt of sand and gravel in an extension to Wykeham Quarry in a permission which was, at the end of 2012, awaiting completion of a S106 legal agreement. The agreement was subsequently completed and the permission issued in March 2013. It should be noted that reserves for 2012 quoted in the published AWP Annual Monitoring Report 2013 include the 4.5mt additional tonnage. 21
Includes reserves in Wakefield therefore not directly comparable with previous years.
0
10
20
30
40
50
60
70
80
90
Sand and Gravel(mt)
CarboniferousLimestone (mt)
MagnesianLimetone (mt)
JurassicLimestone (mt)
Chalk (mt) High PSV (mt)
Crushed rock
North Yorkshire County Council Yorkshire Dales National Park
North York Moors National Park City of York Council
24
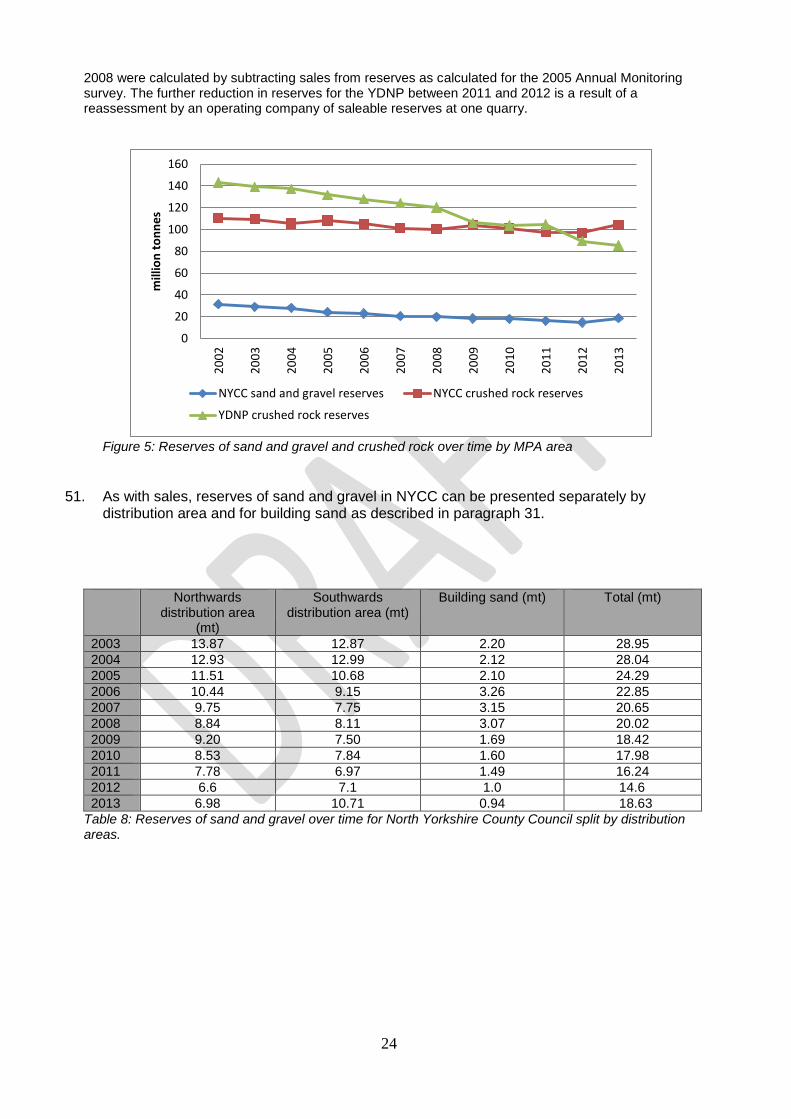
2008 were calculated by subtracting sales from reserves as calculated for the 2005 Annual Monitoring survey. The further reduction in reserves for the YDNP between 2011 and 2012 is a result of a reassessment by an operating company of saleable reserves at one quarry.
Figure 5: Reserves of sand and gravel and crushed rock over time by MPA area
51. As with sales, reserves of sand and gravel in NYCC can be presented separately by distribution area and for building sand as described in paragraph 31.
Northwards
distribution area (mt)
Southwards distribution area (mt)
Building sand (mt) Total (mt)
2003 13.87 12.87 2.20 28.95
2004 12.93 12.99 2.12 28.04
2005 11.51 10.68 2.10 24.29
2006 10.44 9.15 3.26 22.85
2007 9.75 7.75 3.15 20.65
2008 8.84 8.11 3.07 20.02
2009 9.20 7.50 1.69 18.42
2010 8.53 7.84 1.60 17.98
2011 7.78 6.97 1.49 16.24
2012 6.6 7.1 1.0 14.6
2013 6.98 10.71 0.94 18.63
Table 8: Reserves of sand and gravel over time for North Yorkshire County Council split by distribution areas.
0
20
40
60
80
100
120
140
160
20
02
20
03
20
04
20
05
20
06
20
07
20
08
20
09
20
10
20
11
20
12
20
13
mill
ion
to
nn
es
NYCC sand and gravel reserves NYCC crushed rock reserves
YDNP crushed rock reserves

25
Figure 6: Reserves of landwon sand and gravel for North Yorkshire County Council over time split by distribution areas.
Discussion on primary aggregate reserves
52. Within the sub-region sand and gravel reserves only exist within the NYCC area. Both NYCC and the YDNP have reserves of crushed rock. The largest overall reserve, over 150mt, is for Carboniferous Limestone which is present in both MPA areas. The YDNP also has a reserve of around 7mt of high PSV stone. In addition to Carboniferous Limestone, NYCC also has much smaller reserves of Magnesian and Jurassic Limestone. The trend for all aggregate reserves has been for a gradual decline over time, although some years have seen a slight increase when new permissions have been granted. Comparability of the trend in reserves for the NYCC is affected for 2013 by the inclusion of some reserves of Magnesian Limestone in Wakefield, which have been included within NYCC figures for confidentiality reasons and to reflect the fact that, whilst located in Wakefield, the reserves are worked through processing plant located in North Yorkshire.
53. As with sales, the sand and gravel reserve in NYCC is further broken down into a northern distribution area, southwards distribution area and building sand. The reserves in all categories have generally declined over time, although the southwards distribution area reserves increased significantly in 2013 compared with the previous year due to the grant of a new permission at Wykeham Quarry.
54. In accordance with Government advice on landbanks, only reserves for which valid planning permissions are extant are included within the reserve figures presented in the LAA. This includes reserves in sites which are currently not working but excludes dormant and inactive sites, (set out under the Planning and Compensation Act 1991 and Environment Act 1995 for which a review is required before operations can commence or resume).
55. The only MPA in the sub-region with such sites is NYCC. Reserves in dormant sites comprise a range of rock types including sand and gravel, Carboniferous Limestone, Magnesian Limestone and Jurassic Limestone but good data on potentially viable reserves is not available and the assistance of the industry in resolving this uncertainty will be required. However, it is likely that the majority of reserves in dormant sites comprise Carboniferous Limestone at sites in Richmondshire (Leyburn area) and Craven (Skipton area), with lesser amounts of Magnesian and Jurassic Limestone. Reserves of dormant sand and gravel are likely to be very limited and are not thought to be of concreting quality.
0
2
4
6
8
10
12
14
16
20
03
20
04
20
05
20
06
20
07
20
08
20
09
20
10
20
11
20
12
20
13
mill
ion
to
nn
es
Northwards distribution area (mt) Southwards distribution area (mt)
Building sand (mt)
26
56. Substantial reserves of Carboniferous Limestone are thought to exist in dormant sites in the Leyburn area and working schemes are currently being brought forward by operators in this area to enable access to these.
Sand and Gravel
Crushed Rock Carboniferous
limestone Magnesian limestone
Jurassic limestone
Chalk High PSV
North Yorkshire County Council
?
Estimated at in excess of 30mt
?
?
None
-
Yorkshire Dales National Park
-
None
-
-
-
None
North York Moors National Park
-
-
-
-
-
-
City of York Council
-
-
-
-
-
-
Total
?
Estimated at in excess of 30mt
?
?
None
None
Table 9: Estimated reserves in dormant and inactive sites by MPA and aggregate type
ii) Marine aggregates
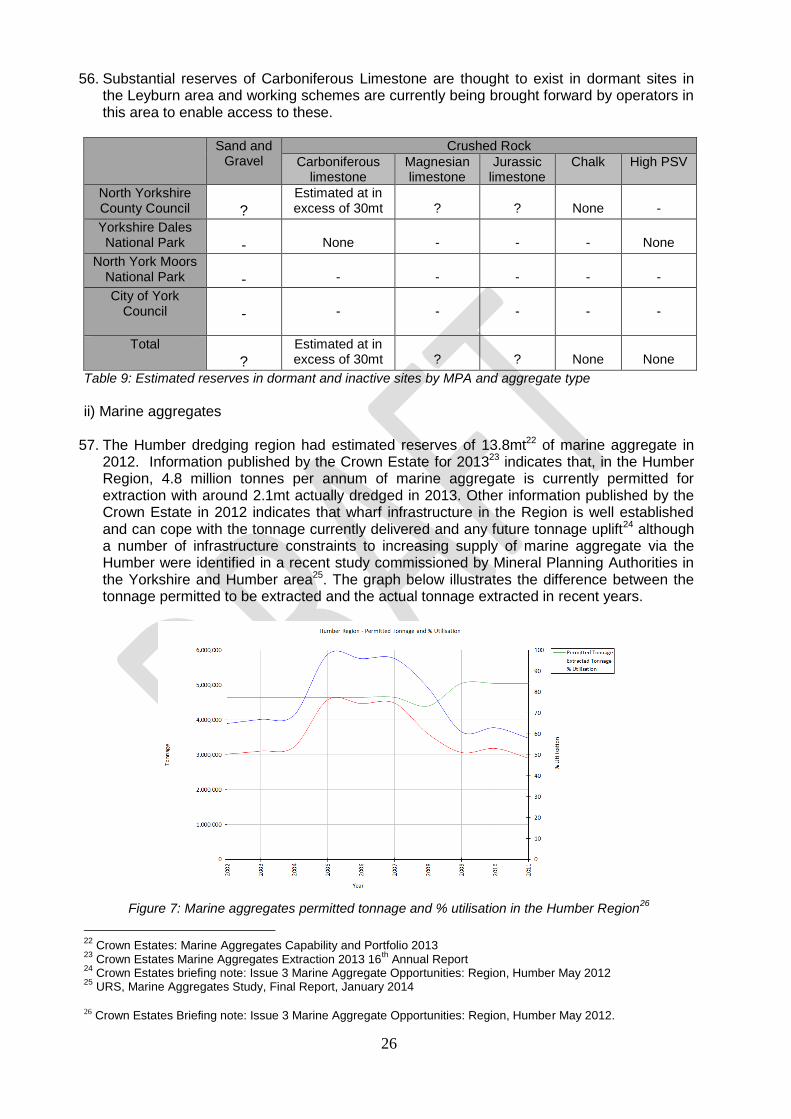
57. The Humber dredging region had estimated reserves of 13.8mt22 of marine aggregate in 2012. Information published by the Crown Estate for 201323 indicates that, in the Humber Region, 4.8 million tonnes per annum of marine aggregate is currently permitted for extraction with around 2.1mt actually dredged in 2013. Other information published by the Crown Estate in 2012 indicates that wharf infrastructure in the Region is well established and can cope with the tonnage currently delivered and any future tonnage uplift24 although a number of infrastructure constraints to increasing supply of marine aggregate via the Humber were identified in a recent study commissioned by Mineral Planning Authorities in the Yorkshire and Humber area25. The graph below illustrates the difference between the tonnage permitted to be extracted and the actual tonnage extracted in recent years.
Figure 7: Marine aggregates permitted tonnage and % utilisation in the Humber Region
26
22
Crown Estates: Marine Aggregates Capability and Portfolio 2013 23
Crown Estates Marine Aggregates Extraction 2013 16th
Annual Report 24
Crown Estates briefing note: Issue 3 Marine Aggregate Opportunities: Region, Humber May 2012 25
URS, Marine Aggregates Study, Final Report, January 2014
26 Crown Estates Briefing note: Issue 3 Marine Aggregate Opportunities: Region, Humber May 2012.

27
Consumption within the sub-region and movements of aggregate within and across the sub-regional boundary
58. Data on consumption of aggregate within the North Yorkshire sub-region is available through the 4 yearly detailed annual monitoring surveys conducted by the RAWPs and collated by British Geological Survey on behalf of central Government27. The most recent published data is for 2009 and is presented below, with information for other Y&H sub-regions and for 2005 for comparison.
59. The data indicates that in 2009 a little over 3mt of primary aggregate, mainly crushed rock, was consumed in the sub-region. As shown in Table 1, total sales of primary aggregate extracted in the sub-region in 2009 were around 7mt, principally crushed rock, making the sub-region a substantial net exporter of aggregate. Sales of both sand and gravel and crushed rock exceeded consumption by at least 100%, with all sales of sand and gravel being from the NYCC area and all sales of crushed rock from sites in either the NYCC area or YDNP. Total consumption of primary aggregate in the sub-region was greater in 2009 than in 2005. Whilst it is expected that demand would have been suppressed in 2009 relative to 2005, as a result of the economic downturn, major road building activity (A1(M) upgrade) was taking place in the NYCC area during 2009 and that may have helped support demand for crushed rock in particular. Total consumption of primary aggregates in other Yorkshire and Humber sub-regions was reduced in 2009 compared to 2005.
Consuming sub-region
Land won sand and gravel
Marine sand and gravel
Sand and gravel total
Crushed rock
Aggregates total (2009)
Aggregates total 2005 (for comparison)
North Yorks
769kt 40kt 809kt 2,322kt 3,131kt 2,591kt
West Yorks
810kt - 810kt 2,332kt 3,142kt 3,488kt
South Yorks
719kt - 719kt 2,106kt 2,825kt 3,226kt
Humber 549kt 194kt 743kt 789kt 1,533kt 2,540kt
Table 10: Consumption of primary aggregate in the Yorkshire and Humber Region 2009 and 2005 Source: Collation of the results of the 2009 and 2005 Aggregate Minerals Surveys
60. Exports take place from the sub-region to other sub-regions within Y&H, as well as to other Regions, making the area an important supplier of aggregate at a wide geographical scale. Although there is a substantial net balance of exports, aggregates are also imported into the sub-region. This is likely to be a result of market forces and commercial decisions, as well as the need to import any particular types of aggregate which cannot be supplied from within the sub-region as a result of geological or resource constraints. There is therefore a relatively complex overall picture of imports and exports and these are likely to change over time.
61. Published information does not include detailed data on imports at MPA or sub-regional
level and it should be noted that information on movements is not comprehensive, mainly as a result of data collection methodologies, confidentiality restrictions and incomplete returns from industry. The most recent relatively comprehensive data is for 2009. Data is also provided for 2005 to help provide a comparison. Where possible, information has also been presented on the proportion of producer sales/recipient consumption that the export/import movement represents, to help provide an indication of relative significance. The Yorkshire and Humber AWP will be collecting further information on the distribution of
27 A 2013 survey on consumption is not being carried out but one is expected to take place for 2014.
28
aggregates sales as part of the 2014 Annual Survey. This should allow updated information on movements to be published in the next review of this LAA.
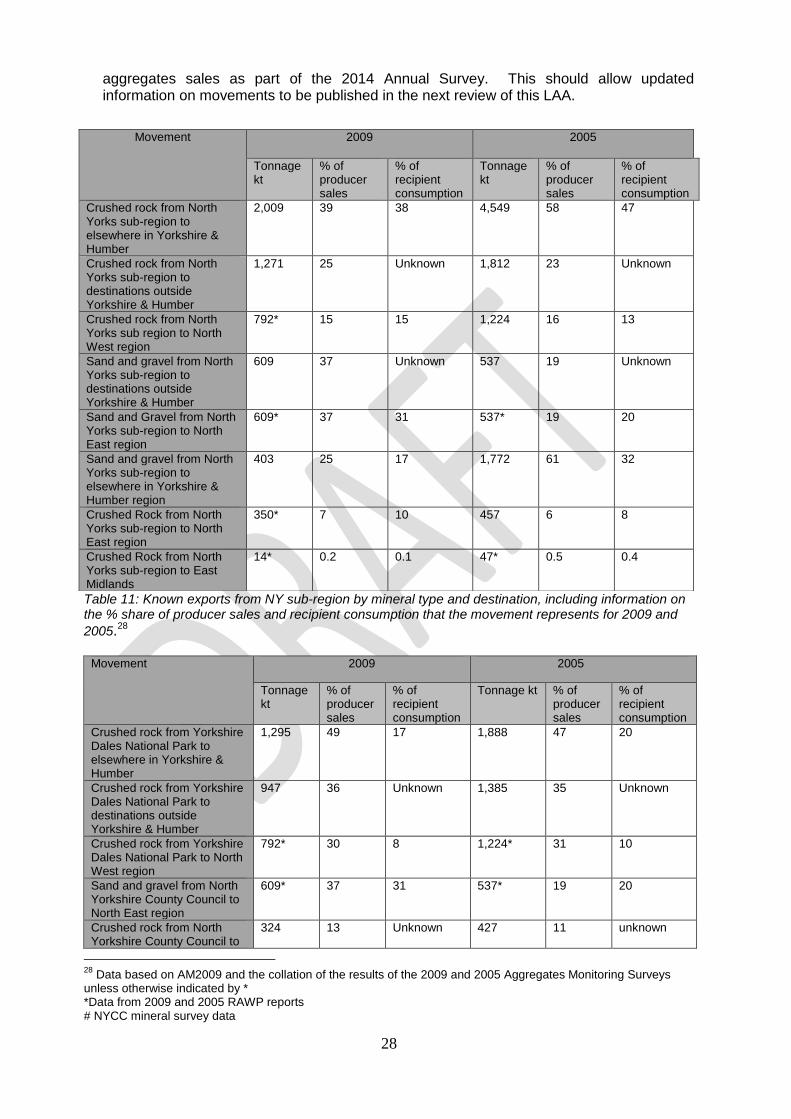
Table 11: Known exports from NY sub-region by mineral type and destination, including information on the % share of producer sales and recipient consumption that the movement represents for 2009 and
2005.28
Movement 2009 2005
Tonnage kt
% of producer sales
% of recipient consumption
Tonnage kt % of producer sales
% of recipient consumption
Crushed rock from Yorkshire Dales National Park to elsewhere in Yorkshire & Humber
1,295 49 17 1,888 47 20
Crushed rock from Yorkshire Dales National Park to destinations outside Yorkshire & Humber
947 36 Unknown 1,385 35 Unknown
Crushed rock from Yorkshire Dales National Park to North West region
792* 30 8 1,224* 31 10
Sand and gravel from North Yorkshire County Council to North East region
609* 37 31 537* 19 20
Crushed rock from North Yorkshire County Council to
324 13 Unknown 427 11 unknown
28
Data based on AM2009 and the collation of the results of the 2009 and 2005 Aggregates Monitoring Surveys unless otherwise indicated by * *Data from 2009 and 2005 RAWP reports # NYCC mineral survey data
Movement 2009 2005
Tonnage kt
% of producer sales
% of recipient consumption
Tonnage kt
% of producer sales
% of recipient consumption
Crushed rock from North Yorks sub-region to elsewhere in Yorkshire & Humber
2,009 39 38 4,549 58 47
Crushed rock from North Yorks sub-region to destinations outside Yorkshire & Humber
1,271 25 Unknown 1,812 23 Unknown
Crushed rock from North Yorks sub region to North West region
792* 15 15 1,224 16 13
Sand and gravel from North Yorks sub-region to destinations outside Yorkshire & Humber
609 37 Unknown 537 19 Unknown
Sand and Gravel from North Yorks sub-region to North East region
609* 37 31 537* 19 20
Sand and gravel from North Yorks sub-region to elsewhere in Yorkshire & Humber region
403 25 17 1,772 61 32
Crushed Rock from North Yorks sub-region to North East region
350* 7 10 457 6 8
Crushed Rock from North Yorks sub-region to East Midlands
14* 0.2 0.1 47* 0.5 0.4

29
Movement 2009 2005
Tonnage kt
% of producer sales
% of recipient consumption
Tonnage kt % of producer sales
% of recipient consumption
outside Yorkshire & Humber region
Crushed rock from North Yorkshire County Council to North East region
323* 12 9 427* 11 12
Crushed rock from North Yorkshire County Council to West Yorkshire
250# 11 11 No data identified
No data identified
No data identified
Sand and gravel from North Yorkshire County Council to West Yorkshire
240# 14 30 No data identified
No data identified
No data identified
Crushed rock from North Yorkshire County Council to South Yorkshire
177# 8 8 No data identified
No data identified
No data identified
Sand and gravel from North Yorkshire County Council to South Yorkshire
107# 6 15 No data identified
No data identified
No data identified
Crushed Rock from Yorkshire Dales National Park to North East region
27 1 1 30 1 1
Crushed Rock from Yorkshire Dales National Park to East Midlands region
14 1 >1 47 1 1
Table 12: known exports by MPA by mineral type and destination, including information on the % share of producer sales and recipient consumption that the movement represents. For 2009, with comparator information for 2005 where available
29
62. In order to supplement the information on movements contained in the 4-yearly collations, direct contact has been made with BGS to request any available supplementary information to indicate the level of imports or consumption of aggregate at either MPA or sub-regional level. This information, together with a brief analysis of aggregates movements into or out of the sub-region is presented in Appendix 2. However, in summary the data appears to suggest that there are a relatively small number of particularly important inter-relationships in aggregates supply. These include a high volume of sales of crushed rock from the YDNP to other locations within Yorkshire and Humber and to the North West Region and a high volume of sales of crushed rock from NYCC to West and South Yorkshire and the North East region. Sales of sand and gravel to the North east region and to West and South Yorkshire also appear to be important30. Volumes of imports are generally much lower but the larger movements into the sub-region appear to include crushed rock from Cumbria and Derbyshire and, to a lesser extent, crushed rock from Durham and Wakefield and sand and gravel from East Riding. This information is presented in summary in the maps below.
29
Data based on AM2009 and the collation of the results of the 2009 and 2005 Aggregates Monitoring Surveys unless otherwise indicated by* or # * Data from 2009 and 2005 RAWP reports 30
Durham County Council, in response to consultation on the first LAA indicate that, although actual data is not available, they consider that the majority of the flows of both sand and gravel and crushed rock from North Yorkshire to the NE Region will be to destinations in the Tees Valley. They consider that any future increased provision within the Tees Valley area could lead to a significant reduction in the scale of importation from North Yorkshire.
30
Map K: Exports of crushed rock from NY sub-region (% ranges relate to proportion of total NY sub-regional sales that the export movement represents)
Map L: Exports of sand and gravel from NY sub-region (% ranges relate to proportion of total NY sub-regional sales that the export movement represents)

31
Map M: Imports of crushed rock into the NY sub-region (% ranges reflect proportion of total NY sub-regional consumption that the import movement represents).
Map N: Imports of sand and gravel into the NY sub-region (% ranges reflect proportion of total NY sub-regional consumption that the import movement represents).
Aggregates landbanks in the North Yorkshire sub-region
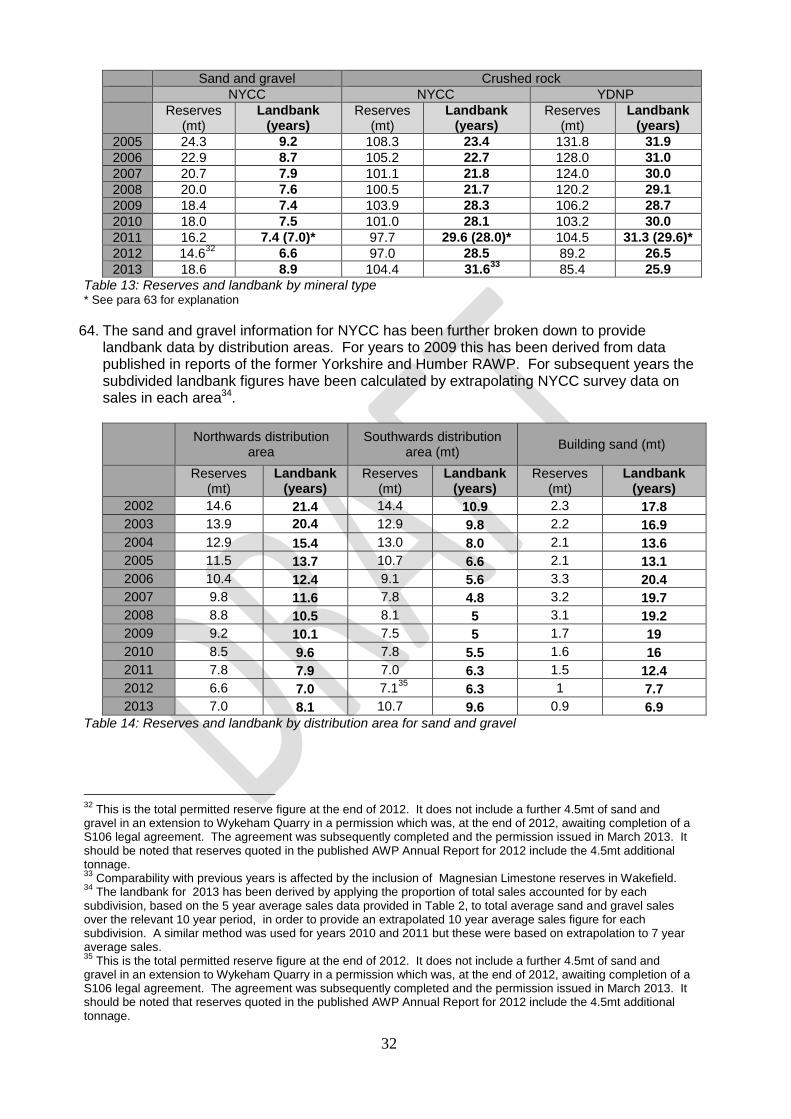
63. The following table shows landbank levels over the past 12 years for which data is available, utilising reserves data from Table 7. Landbank data for years up to and including 2008 are taken from YHRAWP reports and are based on the agreed sub-regional apportionment in the former RSS31. For 2009, the data is taken from the RAWP AM2009 report, which calculated landbanks using average sales over the preceding 7 years. Since the NPPF was not published until 2012, landbanks for 2010 and 2011 are also shown based on 7 years average sales in accordance with advice from the YHRAWP at that time, with the landbank figure for 2011 based on 10 year average sales (derived from Table 1) shown in brackets for comparison. For 2012 and subsequent years the landbank will be calculated on the basis of average sales over the previous 10 years, or such other approach as may be agreed via the LAA, in accordance with current Government advice. The different methodologies used for calculating the landbank should be borne in mind when considering the trend in landbank levels. Landbanks are not included for York and the NYMNP due to the fact that no reserves exist in these areas. The NPPF states that landbanks should be provided for as far as is practical from outside National Parks, and therefore future contributions from National Parks will need to be considered in the light of this as part of the plan preparation process.
Sand and gravel Crushed rock
NYCC NYCC YDNP
Reserves (mt)
Landbank (years)
Reserves (mt)
Landbank (years)
Reserves (mt)
Landbank (years)
2002 31.3 14.7 110.5 12.3 143.1 34.7
2003 29.0 11.0 109.6 23.7 139.2 33.7
2004 28.0 10.7 105.4 22.7 137.3 33.3
31
The Regional Strategy for Yorkshire and Humber (RSS) was revoked with effect from 22 February 2013, with the exception of policies relating to the York Green Belt, which have been retained.
32
Sand and gravel Crushed rock
NYCC NYCC YDNP
Reserves (mt)
Landbank (years)
Reserves (mt)
Landbank (years)
Reserves (mt)
Landbank (years)
2005 24.3 9.2 108.3 23.4 131.8 31.9
2006 22.9 8.7 105.2 22.7 128.0 31.0
2007 20.7 7.9 101.1 21.8 124.0 30.0
2008 20.0 7.6 100.5 21.7 120.2 29.1
2009 18.4 7.4 103.9 28.3 106.2 28.7
2010 18.0 7.5 101.0 28.1 103.2 30.0
2011 16.2 7.4 (7.0)* 97.7 29.6 (28.0)* 104.5 31.3 (29.6)*
2012 14.632
6.6 97.0 28.5 89.2 26.5
2013 18.6 8.9 104.4 31.633
85.4 25.9
Table 13: Reserves and landbank by mineral type * See para 63 for explanation
64. The sand and gravel information for NYCC has been further broken down to provide landbank data by distribution areas. For years to 2009 this has been derived from data published in reports of the former Yorkshire and Humber RAWP. For subsequent years the subdivided landbank figures have been calculated by extrapolating NYCC survey data on sales in each area34.
Northwards distribution
area Southwards distribution
area (mt) Building sand (mt)
Reserves
(mt) Landbank
(years) Reserves
(mt) Landbank
(years) Reserves
(mt) Landbank
(years)
2002 14.6 21.4 14.4 10.9 2.3 17.8
2003 13.9 20.4 12.9 9.8 2.2 16.9
2004 12.9 15.4 13.0 8.0 2.1 13.6
2005 11.5 13.7 10.7 6.6 2.1 13.1
2006 10.4 12.4 9.1 5.6 3.3 20.4
2007 9.8 11.6 7.8 4.8 3.2 19.7
2008 8.8 10.5 8.1 5 3.1 19.2
2009 9.2 10.1 7.5 5 1.7 19
2010 8.5 9.6 7.8 5.5 1.6 16
2011 7.8 7.9 7.0 6.3 1.5 12.4
2012 6.6 7.0 7.135
6.3 1 7.7
2013 7.0 8.1 10.7 9.6 0.9 6.9
Table 14: Reserves and landbank by distribution area for sand and gravel
32
This is the total permitted reserve figure at the end of 2012. It does not include a further 4.5mt of sand and gravel in an extension to Wykeham Quarry in a permission which was, at the end of 2012, awaiting completion of a S106 legal agreement. The agreement was subsequently completed and the permission issued in March 2013. It should be noted that reserves quoted in the published AWP Annual Report for 2012 include the 4.5mt additional tonnage. 33
Comparability with previous years is affected by the inclusion of Magnesian Limestone reserves in Wakefield. 34
The landbank for 2013 has been derived by applying the proportion of total sales accounted for by each subdivision, based on the 5 year average sales data provided in Table 2, to total average sand and gravel sales over the relevant 10 year period, in order to provide an extrapolated 10 year average sales figure for each subdivision. A similar method was used for years 2010 and 2011 but these were based on extrapolation to 7 year average sales. 35
This is the total permitted reserve figure at the end of 2012. It does not include a further 4.5mt of sand and gravel in an extension to Wykeham Quarry in a permission which was, at the end of 2012, awaiting completion of a S106 legal agreement. The agreement was subsequently completed and the permission issued in March 2013. It should be noted that reserves quoted in the published AWP Annual Report for 2012 include the 4.5mt additional tonnage.

33
Figure 8: Landbanks by distribution area
65. The NPPF advises that a landbank of at least 7 years for sand and gravel should be
maintained. The overall sand and gravel landbank in the NYCC area (and hence for the whole of the sub-region) had been declining gradually over the past 10 years and at the end of 2012 had reached a level of 6.6 years based on 10 year average sales36. For 2013 the overall landbank has increased above the 7 year minimum as a result of the grant of new permissions. This has mainly impacted on the southwards distribution area but the northwards distribution area was also in excess of 7 years. This is partially a result of reserves reassessment. The building sand landbank has reduced to around the 7 year threshold.
66. A number of planning applications for extraction of sand and gravel resources are currently under consideration including at sites within both the northwards and southwards distribution areas. In combination these include nearly 20mt of potential reserves. Permission has been granted at one of these sites (Marfield Quarry) for a further c.4mt of reserves, subject to completion of a legal agreement.
67. Commercially viable sand and gravel resources are not thought to exist in the Yorkshire Dales or North York Moors National Parks and, in any event, national policy constraints would be likely to be a substantial obstacle to the development of any viable resources that could be identified. An updated assessment of potential sand and gravel resources in the City of York area was undertaken by BGS for City of York Council during 2013, utilising the same methodology applied in the recent re-assessment of sand and gravel resources in the North Yorkshire County Council area. The assessment concludes that good quality sand and gravel resources are not common in the City of York area. In particular, glaciofluvial sediments, which are the most extensively worked resources within North Yorkshire, are not as common in the York area and are generally of poorer quality. Sterilisation by surface development is also a significant factor. Glacial sand and gravel deposits in the York area are also found to be not as common or as prospective. The study indicates that significant quantities of blown sand are present to the north of the City, containing significant tonnages of fine sand. However these are expected to be only suitable for building sand, not concreting and are subject of a range of constraints to
36
See Table 26 for alternative landbank figures based on the suggested approach to demand forecasting set out later in this LAA.
0
5
10
15
20
25
20
02
20
03
20
04
20
05
20
06
20
07
20
08
20
09
20
10
20
11
20
12
20
13
mill
ion
to
nn
es
Northwards distribution area (mt) Landbank (years)
Southwards distribution area (mt) Landbank (years)
Building sand (mt) Landbank (years)
34
development. There has not been any apparent interest from the minerals industry in the development of resources within York.
68. Crushed rock is currently extracted in two MPA’s in the sub-region, NYCC and YDNP. The minimum landbank recommended by the NPPF for crushed rock is 10 years. The landbank for crushed rock in NYCC is currently between 25 and 30 years. Since preparation of the first LAA permission has been granted for an extension to Kirk Smeaton and Potgate Quarries (both Magnesian Limestone). Unlike sand and gravel only a relatively small volume of new potential crushed rock reserves are contained in undetermined planning applications current at the time of preparation of this updated LAA, comprising a total of up to 2.9mt of Magnesian Limestone in proposed extensions to Jackdaw Crag Quarry and Went Edge Quarry. There are no current applications for additional reserves at YDNP quarries, although there are on-going discussions about possible future proposals.
69. As noted earlier, the NPPF states that landbanks for non-energy minerals should be provided for from outside National Parks as far as is practical. Substantial reserves and resources of crushed rock exist in the YDNP but the availability of new reserves is likely to be heavily influenced by the effect of national policy restrictions. Permitted reserves of crushed rock in the YDNP have declined by around 50mt over the past 10 years, partly as a result of reassessment of reserves by industry, but are still large relative to sales. However, the extent to which reserves will be replenished (if at all) as current reserves are worked out is not yet known, although it is reasonable to assume that in the longer term reserves will continue to diminish.
70. Extraction of crushed rock ceased in 2007 in the NYMNP, upon closure of Spaunton Quarry. Extraction of limestone for use as aggregate had also previously taken place at Spikers Hill quarry in the North York Moors National Park although this ceased prior to 2005. There are therefore no other remaining permitted reserves and, whilst there is current commercial interest in limestone aggregate extraction from land adjacent to the former Spikers Hill Quarry, national policy constraints suggest that it may be unlikely that future reserves will become available in the NYMNP. Crushed rock resources do not occur within the City of York area.
Part C - Assessment of future supply
Aggregates supply requirements in the NY sub-region National and regional policy and guidance
71. Guidelines for aggregates supply in England have been published by central Government and over recent years have provided a basis for the identification of future requirements for aggregate minerals at the national and regional levels, as part of a managed system of aggregates supply. The most recent figures were published in the National and Regional Guidelines for Aggregate Supply in England 2005-2020, published in June 2009 and these Guidelines remain extant. The key Regional guideline figures are reproduced below. The table also shows figures from the previous (2003) Guidelines, which covered the period 2001-2016, for comparison purposes and as these figures provided the basis for the sub-regional apportionment contained in the former RSS.

35
Table 15: Comparison of National and Regional apportionment guidelines for England published in 2009 and 2003
72. At a national level the current guidelines recommend generally lower levels of provision of
land-won aggregate than the previous 2003 figures. However, for Yorkshire and Humber, the current guideline figure for sand and gravel is slightly higher than in the 2003 guidelines, whereas the crushed rock figure is slightly lower. The published guideline figures for sand and gravel and crushed rock also include assumptions, set out in the Guidelines, about the amount of supply that will come from other sources such as marine dredged sand and gravel, alternatives to primary aggregates such as secondary and recycled materials, and imports from outside England. For Yorkshire and the Humber a substantial contribution from secondary and recycled aggregate is envisaged in the Guidelines, whereas the expected contribution from marine aggregates and imports from outside England is small.
73. National planning guidance on LAAs published in March 2014, indicates that the two main roles of the aggregates Guidelines are to:
a) provide an indication of the total amount of aggregate provision that the Mineral Planning Authorities, collectively within each Aggregate Working Party, should aim to provide.
b) provide individual Mineral Planning Authorities, where they are having difficulty in obtaining data, with some understanding or context of the overall demand and possible sources that might be available in their Aggregate Working Party area.
74. This reflects the policy approach in the NPPF, which states that MPAs should still take into
account published National and Sub National Guidelines on future provision which should be used as a guideline when planning for the future demand for and supply of aggregates. The NPPF also indicates that Aggregate Working Parties will continue to play a role in providing advice on planning for the future supply of aggregate (and in the preparation of Local Aggregates Assessments such as this).
75. The 2009 aggregates Guidelines have not been subject to apportionment37 in the Yorkshire and Humber area. The Regional Spatial Strategy for Yorkshire and Humber (now revoked) contained an agreed apportionment of the previous 2003 Guidelines and followed an approach of allocating each sub-region a pro-rata amount proportionate to each sub-region’s historic share of total regional production over the 5 year period 1997-2001. The 2003 Guidelines are now substantially out of date. In 2010 the YHRAWP advised that the apportionment contained in the former RSS should no longer be used and it is therefore not considered to represent an appropriate basis for future planning. As the RSS itself has been revoked the apportionment it contained is presented below for information only and as a comparison with actual sales over recent years (see Table 1).
37
Apportionment is a process whereby higher level guidelines for aggregates supply are broken down to a lower geographical level (such as sub-region or MPA level) on an agreed basis
Region Land-won Provision Assumptions
Land-won Sand &
Gravel (mt)
Land-won Crushed Rock
(mt)
Marine Sand & Gravel (mt)
Alternative Materials
(mt)
Net Imports to England
(mt)
2005-2020
2001-2016
2005-2020
2001-2016
2005-2020
2001-2016
2005-2020
2001-2016
2005-2020
2001-2016
Yorkshire & Humber
78 73 212 220 5 3 133 128 3 0
England 1028 1068 1492 1618 259 230 993 919 136 169

36
Area Land-won sand and gravel (mt)
Land-won crushed rock (mt)
North Yorkshire - North Yorkshire
CC - Yorkshire Dales
NP - North York
Moors NP
42.1 (42.1)
140.8 (74.0) (66.0)
(0.8)
South Yorkshire 13.0 53.5
West Yorkshire 5.5 17.8
Humber - East Riding - North
Lincolnshire
12.4 (8.3) (4.1)
7.9 (5.3) (2.6)
TOTAL 73.0 220.0
Table 16: Sub-regional apportionments for aggregates in the Yorkshire and Humber Region, 2001 to 2016 (mt) as incorporated into former RSS 2008.
76. The YHRAWP advised in 2010 that, on an interim basis pending updated guidance,
aggregates provision (and landbank calculation) in the Region should be assessed on the basis of historic sales averaged over the previous 7 year period, rather than using the agreed sub-regional apportionment contained in RSS. This approach was reflected in YHRAWP published data on landbanks for the 2009 calendar year (published in 2010). Planning Practice Guidance on LAAs (March 2014) and the NPPF now advise that LAAs should include a forecast of demand for aggregates based on the average of 10 years sales data and other relevant local information. They should also look at average sales over the last 3 years in particular to identify the general trend of demand, as part of consideration of whether it might be appropriate to increase supply. Comparative figures for 10 year and 3 year average sales are provided in Table 17 below.
77. With regard to calculation of landbanks, the March 2014 Planning Practice Guidance
advises that these should be calculated annually, with the length of the landbank being the sum in tonnes of all permitted reserves for which valid permissions are extant, divided by the annual rate of future demand based on the latest annual Local Aggregate Assessment. The NPPF also states that MPAs should seek to maintain a landbank of at least 7 years of land-won sand and gravel and 10 years of crushed rock.
78. Taking into account current policy and guidance referred to above, the approach in this
LAA is therefore to use the 2009 aggregates Guidelines as an indicator against which any other sources of information about possible future requirements can be compared and in particular against which to compare an approach using an average of 10 years sales data.
79. It should be noted that, although the RSS and previous YHRAWP reports show a crushed
rock apportionment for the Yorkshire Dales and North York Moors National Parks, current national planning policy for minerals states that when dealing with planning applications, MPAs should; ‘As far as is practical, provide for the maintenance of landbanks of non-energy minerals from outside National Parks, the Broads, Areas of Outstanding Natural Beauty and World Heritage sites, Scheduled Monuments and Conservation Areas’ (NPPF) and that planning permission for major development in such areas should be refused except in exceptional circumstances. The existence of an apportionment for the National Parks in RSS should not therefore be taken as an indication that the National Parks could or should continue to maintain a 10 year landbank of crushed rock reserves.
80. In practice the Yorkshire Dales National Park has a substantial landbank of crushed rock
and is expected to be able to continue maintaining supply over the period to 2030 and beyond. In the case of the NYMNP, whilst the apportionment in the former RSS for the

37
NYMNP was met prior to the closure of the quarries, there is currently no production of aggregate and any previous sales of crushed rock over the past 10 years were from sites which have now closed. The potential future role of both National Parks in terms of supply of aggregate will be a matter to be addressed in statutory land use plans for minerals.
Comparison of actual sales with apportionment
81. In the following tables and graphs, which compare actual sales with the former agreed sub-regional apportionment, information is only provided for the NYCC area, on the basis that the NPPF requires landbanks to be maintained outside National Parks as far as practical and this will have implications for apportionments which will be determined through the plan making process. The apportionment figures for the years 2004 to 2008 are based on the sub-regional apportionment of the 2003 National and Regional Aggregate Guidelines for 2003 – 2016 as contained in former RSS. For 2009 to 2011 the apportionment is based on average sales over the previous 7 year period in accordance with advice from the YHRAWP extant at the time. For 2012 and 2013, for the purposes of the Table below and pending finalisation of any alternative local approach, 10 years average sales has been used as an initial basis for apportionment. Information on average sales over the most recent 3 years for which data is available is also included to facilitate monitoring of trends in line with current Government guidance. It should be noted that crushed rock sales for 2013 include sales from reserves located in Wakefield but processed in North Yorkshire.
Sand and gravel (mt) (NYCC) Crushed rock (mt) (NYCC)
Sales Agreed Apportionment
Sales Agreed Apportionment
2004 2.8 2.63 4.2 4.63
2005 2.8 2.63 3.9 4.63
2006 2.7 2.63 3.8 4.63
2007 2.7 2.63 4.3 4.63
2008 2.3 2.63 3.8 4.63
2009 1.7 2.5* 2.6 3.67*
2010 1.6 2.4* 2.9 3.6*
2011 1.7 2.2* 1.9 3.3*
2012 1.6 2.2# 2.4 3.4
#
2013 1.5 2.1# 2.9 3.3#
10 Year Average 2.1 - 3.3 -
3 year average 1.6 - 2.9 -
Table 17: Sales relative to previous apportionment by mineral type * based on 7 years average sales
# based on 10 years average sales
0
0.5
1
1.5
2
2.5
3
20
04
20
05
20
06
20
07
20
08
20
09
20
10
20
11
20
12
20
13
mill
ion
to
nn
es
Sales Agreed Apportionment

38
Figure 9: Trend in sales relative to apportionment for sand and gravel in the NYCC area
Figure 10: Trend in sales relative to apportionment for crushed rock in the NYCC area
82. The data shows that, until 2008, sales of sand and gravel broadly reflected the sub-regional
apportionment of the 2003 Guidelines contained in former RSS. Since then, sales have been between 0.5mt and 0.8mt per annum below the apportioned figure. For crushed rock, sales from NYCC have (from 2004) been variable but consistently below the RSS apportionment until 2011, when a further significant reduction occurred to a level of less than half of the RSS apportionment figure. In 2012 and 2013 sales recovered slightly but were still well below the RSS apportionment figure, even allowing for the inclusion of sales from reserves in Wakefield average sales of both sand and gravel and crushed rock over the most recent three years were significantly below the longer term average.
83. In order to provide a further indicative comparison between actual sales over the past 10 years and the level of requirements envisaged in the 2009 Guidelines (which, as noted above, have not been subject to any formal sub-regional apportionment) the table below shows a hypothetical sub-regional apportionment of the 2009 Guidelines. This has been calculated by allocating a proportion of the total 2009 Regional Guideline figure for Yorkshire and Humber to the North Yorkshire sub-region on a pro-rata basis based on average historic sales for the 10 year period 2000-2009 (the most recent 10 year averaging period for which data is available for the whole Y&H Region). It is emphasised that this is presented here for broad comparison purposes only and the approach has not been subject of any agreement within the Region.
Sand and Gravel
(mt) Crushed Rock (mt)
NY sub region
Y & H Region
NY sub region
NYCC only
Y & H Region
2000 2.6 4.7 7.9 3.8 14.9
2001 2.6 5.2 8.2 3.9 15.8
2002 2.5 5.0 8.4 4.1 15.8
2003 2.5 4.8 8.0 3.7 14.7
2004 2.8 4.8 8.2 4.2 12.7
2005 2.8 4.7 8.1 3.9 12.7
2006 2.7 4.7 7.7 3.8 11.7
2007 2.7 4.7 8.4 4.3 12.1
2008 2.3 4.0 7.6 3.8 10.9
2009 1.7 3.2 5.3 2.6 7.7
0
0.5
1
1.5
2
2.5
3
3.5
4
4.5
5
20
04
20
05
20
06
20
07
20
08
20
09
20
10
20
11
20
12
20
13
mill
ion
to
nn
es
Sales Agreed Apportionment

39
Sand and Gravel
(mt) Crushed Rock (mt)
NY sub region
Y & H Region
NY sub region
NYCC only
Y & H Region
10 Year Average 2.5 4.6 7.8 3.8 12.9
NY sub region sales as % of Y&H total 55% 60% 29%
Indicative total requirement 2005-2020 from Regional Guidelines 78mt 212mt
Hypothetical apportionment 2005-2020 42.9mt 61.5mt 127.2mt
Hypothetical apportionment 2005-2020 expressed on an annual basis 2.68mt 3.84mt 7.95mt
Table 18: Hypothetical sub-regional apportionment of 2009 National and Regional Guidelines
84. The hypothetical sub-regional apportionment of the 2009 Guidelines referred to above is, at
2.68mt per annum for sand and gravel, very similar to the former RSS apportionment of 2.63mt based on the 2003 Guidelines. However, as noted earlier both values are significantly higher than average sales over the past 10 years of 2.1mt (and particularly so when compared with the past 3 years) and unless sales recover rapidly to a level substantially higher than average sales over the past 10 years, it is very unlikely that 10 year average sales would reach the overall levels envisaged in the hypothetical apportionment figures for the period to 2020. Such a scenario is considered unlikely based on current levels of sales, although there is less certainty about the longer term trend in demand.
85. For crushed rock the hypothetical sub-regional apportionment of the 2009 Guidelines is, at
3.84mt per annum for NYCC, substantially below the former RSS apportionment of 4.63mt. However, it remains over 15% higher than average sales of 3.3mt over the past 10 years. As with sand and gravel, it is considered very unlikely that sales of crushed rock in the sub-region will rise to a level such that the hypothetical apportionment figures for the period to 2020 would be reached when sales are averaged over a 10 year period.
86. As with the NYCC area, sales of crushed rock from the Yorkshire Dales National Park
reduced significantly between 2007 and 2009, (although sales of high PSV aggregate from the National park have remained relatively steady). The proportionate contribution to total sub-regional supply from the NYCC area and the YDNP has remained broadly similar over the past 10 years. As noted earlier, national policy prioritises the maintenance of landbanks from outside National Parks and Areas of Outstanding Natural Beauty.
Potential approaches to identifying future requirements
87. A range of methods could be used to help identify the potential scale of future requirements for aggregate. It is considered that any method used should be compatible with national policy and guidance, be relatively straightforward to calculate and lead to a realistic forecast capable of being monitored.
88. The use of historic average sales over the previous 10 year period as an indicator of future
requirements has disadvantages in that it is essentially backward looking and does not anticipate future changes in aggregates supply patterns or economic trends, or take into account any emerging environmental issues or constraints. However, it has the advantage of simplicity and transparency. It was also the approach adopted in the first LAA for the North Yorkshire sub-region (2013), which was developed in consultation with industry and a number of other stakeholders. Although national guidance requires account to be taken
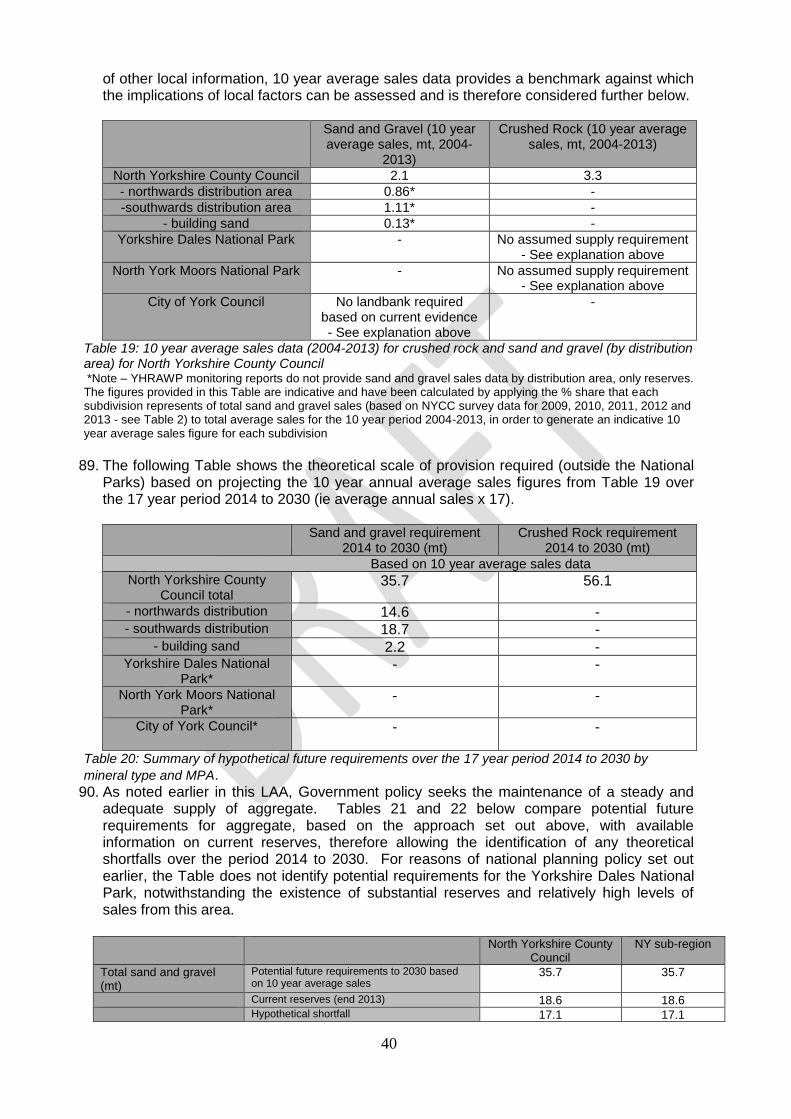
40
of other local information, 10 year average sales data provides a benchmark against which the implications of local factors can be assessed and is therefore considered further below.
Sand and Gravel (10 year average sales, mt, 2004-
2013)
Crushed Rock (10 year average sales, mt, 2004-2013)
North Yorkshire County Council 2.1 3.3
- northwards distribution area 0.86* -
-southwards distribution area 1.11* -
- building sand 0.13* -
Yorkshire Dales National Park - No assumed supply requirement - See explanation above
North York Moors National Park - No assumed supply requirement - See explanation above
City of York Council
No landbank required
based on current evidence - See explanation above
-
Table 19: 10 year average sales data (2004-2013) for crushed rock and sand and gravel (by distribution area) for North Yorkshire County Council *Note – YHRAWP monitoring reports do not provide sand and gravel sales data by distribution area, only reserves. The figures provided in this Table are indicative and have been calculated by applying the % share that each subdivision represents of total sand and gravel sales (based on NYCC survey data for 2009, 2010, 2011, 2012 and 2013 - see Table 2) to total average sales for the 10 year period 2004-2013, in order to generate an indicative 10 year average sales figure for each subdivision
89. The following Table shows the theoretical scale of provision required (outside the National
Parks) based on projecting the 10 year annual average sales figures from Table 19 over the 17 year period 2014 to 2030 (ie average annual sales x 17).
Sand and gravel requirement 2014 to 2030 (mt)
Crushed Rock requirement 2014 to 2030 (mt)
Based on 10 year average sales data
North Yorkshire County Council total
35.7 56.1
- northwards distribution 14.6 - - southwards distribution 18.7 -
- building sand 2.2 - Yorkshire Dales National
Park* - -
North York Moors National Park*
- -
City of York Council*
- -
Table 20: Summary of hypothetical future requirements over the 17 year period 2014 to 2030 by
mineral type and MPA. 90. As noted earlier in this LAA, Government policy seeks the maintenance of a steady and
adequate supply of aggregate. Tables 21 and 22 below compare potential future requirements for aggregate, based on the approach set out above, with available information on current reserves, therefore allowing the identification of any theoretical shortfalls over the period 2014 to 2030. For reasons of national planning policy set out earlier, the Table does not identify potential requirements for the Yorkshire Dales National Park, notwithstanding the existence of substantial reserves and relatively high levels of sales from this area.
North Yorkshire County
Council NY sub-region
Total sand and gravel (mt)
Potential future requirements to 2030 based on 10 year average sales
35.7 35.7
Current reserves (end 2013) 18.6 18.6
Hypothetical shortfall 17.1 17.1

41
Northwards distribution (mt)
Potential future requirements to 2030 14.6 14.6
Current reserves (end 2013) 7.0 7.0
Hypothetical shortfall 7.6 7.6
Southwards distribution (mt)
Potential future requirements to 2030 18.7 18.7
Current reserves (end 2013) 10.7 10.7
Hypothetical shortfall 8.0 8.0
Building sand (mt) Potential future requirements to 2030 2.2 2.2
Current reserves (end 2013) 0.9 0.9
Hypothetical shortfall 1.3 1.3
Table 21: sand and gravel Indicative requirements and shortfalls 2014 – 2030
North Yorkshire County Council
Yorkshire Dales National Park
North York Moors National Park
City of York
Council
Sub regional
total
Total crushed rock (mt)
Potential future requirements to 2030 based on 10 year average sales
56.1 Figure not provided due to national policy constraints
- - -
Current reserves (end 2013)
104.4# 85.4 - - 189.8#
Hypothetical shortfall No shortfall - - - -
Carboniferous Limestone*
(mt)
Potential future requirements to 2030
27.5 Figure not provided due to national policy constraints
- - -
Current reserves (end 2013)
77.5 78.4 - - 155.9
Hypothetical shortfall No shortfall - - - -
Magnesian Limestone*
(mt)
Potential future requirements to 2030
20.8 - - - 20.8
Current reserves (end 2013)
17.2# - - - 17.2#
Hypothetical shortfall 3.6# - - - 3.6#
Jurassic Limestone*
(mt)
Potential future requirements to 2030
7.9 - - - 7.9
Current reserves (end 2013)
9.6 - - - 9.6
Hypothetical shortfall No shortfall - - - -
Chalk* (mt) Potential future requirements to 2030 based on 10 year average sales
Not identified separately from other crushed rock resources
- - - -
Current reserves (end 2013)
- - - - -
Hypothetical shortfall - - - - -
High PSV (mt)
Potential future requirements to 2030 based on 10 year average sales
- Figure not provided due to national policy
constraints -
- - Figure not provided due to national policy constraints
Current reserves (end 2013)
- 7.0 - - 7.0
Hypothetical shortfall - - - - -
Table 22: Crushed rock Indicative requirements and shortfalls 2014 - 2030 * YHRAWP monitoring reports do not provide crushed rock sales data by rock type (with the exception of Carboniferous Limestone and high psv gritstone in the YDNP). The figures provided in this Table are indicative and have been calculated by applying the % share that each rock type represents of total crushed rock sales (based on NYCC survey data for 2009, 2010, 2011, 2012 and 2013 see Table 3) to the total potential crushed rock requirement for the period to 2030, in order to generate an indicative overall requirement for each rock type # These figures include Magnesian Limestone reserves located in Wakefield but worked through a processing plant located in North Yorkshire.
91. The above assessment shows that, on the basis of this methodology for establishing future
requirements, further reserves of sand and gravel would need to be made available to
42
ensure an adequate and steady supply over the period to 2030. It is likely that at least the large majority of these reserves would need to be sourced from the NYCC area, primarily for geological reasons. The scale of the shortfall (17mt) may be impacted substantially by the outcome of a number of current planning applications for sand and gravel extraction which, in total, contain an estimated 20.9mt of reserves. If all are permitted, the reserves in these applications would eliminate the identified overall shortfall to 2030. NYCC resolved in 2014 to grant permission for one of these applications (an extension to Marfield Quarry, containing an estimated 4mt), subject to completion of a legal agreement but this new reserve is not reflected in the reserve and landbank figures presented in this LAA, which presents the position as at the end of 2013. Permission was also granted in 2014 for a further 0.4mt of sand and gravel and fill in a Borrow Pit to serve A1 upgrading in North Yorkshire, although this is not concreting quality material. For crushed rock the assessment suggests that, in overall terms, there are adequate reserves with permission to ensure adequate supply though to 2030. Permission was granted in 2014 for an extension to Potgate Quarry containing 1.2mt of reserves. This reserve is not reflected in the figures presented in this LAA. Current applications for extraction of a total of up to 2.9mt of Magnesian Limestone at Jackdaw Crag Quarry and Went Edge Quarry would, if permitted, also help reduce any theoretical shortfall in this particular crushed rock type.
Alternative methods of identifying future demand 93. As noted earlier, a 10 year historic sales approach does not take into account a range of other local factors which may impact on potential future demand for aggregate. Consultation with the minerals industry38 has also suggested that other factors should be taken into consideration, particularly for sand and gravel. Further consideration of a potential approach to predicting demand for aggregate for the NYCC area is contained in Appendix 3. Other relevant local information influencing supply of and demand for aggregate 94. Guidance on the preparation of Local Aggregates Assessments indicates that it is also necessary to give consideration to a range of other matters which might impact on supply of aggregate, in order to gain an overall view of the capability of the Sub-region to match potential demand with supply. In the analysis that follows ‘near term’, ‘mid term’ and ‘long term’ are used to indicate issues that might arise over a time horizon of 0-5 years, 6-15 years and 16 years or beyond respectively.
i) Geographical distribution of reserves and markets
Reserves (and resources) of primary aggregate are not evenly distributed across the sub-region. The following considerations are likely to be particularly important in determining or influencing future supply:
Sand and gravel reserves and the very large majority of resources are all located within the NYCC area, particularly within the north-central part of the NYCC area, but with significant potential resources and some reserves in the east around the Vale of Pickering. There is no realistic potential for the YDNP or NYMNP to contribute to supply and the potential for supply from the City of York is also likely to be very limited, particularly for concreting quality sand and gravel.
38
Eg Forecasting Demand for Aggregates Minerals - Discussion Paper July 2014 and North Yorkshire County Council, City of York Council and North York Moors National Park Authority Minerals and Waste Joint Plan Issues and Options Consultation February 2014.
43
Principle markets for sand and gravel are the internal North Yorkshire market, the North East Region and West/South Yorkshire. Available information suggests a relatively clear distinction between reserves in the northernmost part of NYCC which mainly serve markets in the NE region, and reserves elsewhere which serve markets within North Yorkshire and adjacent areas in West and South Yorkshire39. The landbank of reserves in both these areas is relatively low compared with sales. The geographical distribution of available reserves may, in future, affect the ability of NYCC to continue to meet current patterns of supply without increased haulage distances. Ongoing availability of sand and gravel in the Vale of Pickering area is likely to be important in maintaining local supply of aggregate in the Scarborough area without the need for long distance haulage. A recent (March 2013) permission for a major extension to Wykeham Quarry will be significant in addressing this issue.
Crushed rock resources and reserves are more widespread across the sub-region than sand and gravel, with current reserves distributed approximately equally between the NYCC and YDNP areas. The overall scale of reserves of limestone currently available in both the NYCC and YDNP areas is such that near term changes in availability of supply or supply patterns are not expected. However, in the longer term it is likely that policy constraints to future working in the YDNP will impact on the availability of supply from that area, although this is not expected to be significant over the period to 2030. Reserves of high PSV gritstone in the YDNP are important in serving a wider geographical area with this relatively specialist product although, as noted elsewhere in this LAA, there are potential policy and environmental constraints to future availability of this material.
Within NYCC reserves of Magnesian Limestone in relation to supply are relatively low. These reserves (and resources) are located mainly within the southern part of North Yorkshire, relatively remote from other sources of crushed rock in the sub-region. Future availability of supply of this material may become a factor in the mid term if the previous balance of supply between the different types of crushed rock worked in the NY sub-region is to be maintained. Resources of Jurassic Limestone in the Ryedale area of NYCC are also relatively remote from other sources of crushed rock and are likely to be important in maintaining a local source of supply of crushed rock in the eastern part of the sub-region. Near term constraints on availability of this material are not envisaged but could become more relevant in the mid-term.
ii) Availability of different main types of aggregate
There are a wide range of types of aggregate produced in the sub-region and to some extent these have differing capabilities to serve particular end uses. The following considerations are likely to be particularly relevant in the context of future supply:
At a broad level different types of aggregate may be substitutable for certain types of end use. This factor has been recognised by the Competition Commission in their recent investigation into the aggregates, cement and ready mix market40. In particular they note that, based on views expressed by the minerals industry, the use of one or other of sand and gravel or crushed rock appears to be largely influenced by geology and local availability and that “sand and gravel aggregates are likely to be a close substitute for crushed rock aggregates for RMX41 and concrete block production (where both are available) but are not a good substitute for crushed rock
39
Consultation on a draft of the first LAA indicated support from the Mineral Products Association and Durham County Council to the maintenance of a sub-divided landbank for sand and gravel. 40
Eg Aggregates, Cement and Ready-mix Concrete Market Investigation: Updated Statement of Issues, Competition Commission 26 November 2012. 41
Ready Mixed Concrete

44
aggregates for use in asphalt applications, and may only be a partial substitute in general construction applications”. At a NY sub-regional level, concreting purposes represents the predominant end use for primary aggregate (sand and gravel and crushed rock combined), representing over one-third of all sales of sand and gravel and crushed rock across the sub-region (and around 80% of all sales of sand and gravel from NYCC). This suggests there may, in principle, be potential for greater substitution of crushed rock for sand and gravel and that any shortfall in availability of sand and gravel could, to some extent, be made up through increased supply of crushed rock. This point has also been raised by a supplier of crushed rock in the NYCC area in response to Issues and Options consultation on the North Yorkshire, York and North York Moors Minerals and Waste Local Plan. Other important uses of aggregate produced in the sub-region (in terms of the proportion of overall sales) are crushed rock for coated and uncoated roadstone and constructional fill). These uses are less likely to be substitutable but given the scale of crushed rock reserves this is not likely to be of high significance.
Consultation with industry during preparation of the first LAA suggested that substitution of sand and gravel by crushed rock is more likely to take place in the absence of availability of sand and gravel for concrete (eg for geological or planning reasons) and where the local market is accustomed to the practice, and that customers may still specify sand and gravel even where this is difficult or expensive to obtain. Industry also comment that partial substitution already occurs for geological reasons with material sourced from North Yorkshire, for example mixing of coarse limestone aggregate in the NE region with sand and gravel fines from North Yorkshire, and therefore production of sand and gravel from North Yorkshire is likely to still be needed even if substitution becomes more likely. It was commented by industry that substitution has drawbacks including greater wear on plant and equipment, a more “hungry” mix of cement and aggregate and a greater average distance of sources of crushed rock to major markets, leading to increased carbon miles. Industry also expressed the view that the NY sub-region is not yet at a point where sand and gravel production cannot continue sustainably alongside crushed rock production for the long term.
Available information suggests that marine sand and gravel is readily capable of substituting for landwon sand and gravel for concreting purposes42 and may be used in a mix with crushed rock. It can represent a premium product which can reduce the amount of cement required for a given concrete strength. Although substitution of marine aggregate for land won sources may not impact substantially on markets within the sub-region, it could potentially impact on key markets outside the sub-region but served by it (particularly in the West and South Yorkshire areas). A study of this potential has been commissioned by minerals planning authorities within the Yorkshire and Humber area and has concluded that, in the short term, a significant increase in supply into the Yorkshire and Humber Region is unlikely but becomes increasingly likely in the medium term and inevitable in the longer term (20 years and beyond for the purposes of the study). To enable marine aggregate to become more readily available investment will be required in supply-related infrastructure, although it is likely that the majority of this would need to be located outside the North Yorkshire sub-region in order that it could serve key market areas in West and South Yorkshire. Increased use of marine aggregate in markets currently supplied by quarries in North Yorkshire would reduce the pressure on sand and gravel supply from the North Yorkshire sub-region. In response to consultation during preparation of this LAA Leeds City Council have commented that a planning application for a new canal wharf in Leeds for the receipt of up to 120ktpa of marine aggregate has been
42
E.g. The strategic importance of the marine aggregate industry to the UK (BGS Research Report, OR/07/019, 2007)

45
received. They further comment that downward pressure on land won supply of sand and gravel from North Yorkshire may assist moves to safeguard wharfs and rail sidings in Leeds and move towards an approach where a greater overall proportion of supply in West Yorkshire is provided from marine sources.
The Competition Commission also note that “Secondary and recycled aggregates appear to be imperfect substitutes for primary aggregates because they cannot be used to replace primary aggregates in all applications. For low specification uses there is a substantial degree of substitutability. For the production of asphalt there also appears to be a substantial degree of substitutability, although the figures may be inflated by the inclusion of asphalt planings. For RMX and concrete block production there seems to be very little scope for substitution.” (NB Consultation with power station operators during preparation of the first LAA suggests that secondary aggregate is being used as a replacement for both RMX and block manufacture, with FBA being particularly important in concrete block manufacture). One power station operator has indicated that secondary aggregate sold form the station plays a substantial role as a replacement aggregate over an extensive area, replacing primary aggregates in Co. Durham, West and South Yorkshire and Humberside, Derbyshire, Cheshire and further afield. It is therefore possible that, subject to their availability, there is some potential for an increased proportion of supply to be provided by secondary and recycled aggregate, in substitute for some elements of sand and gravel supply, although it is not possible to quantify this.
A recent decision by North Yorkshire County Council to grant permission for a major new waste recovery facility at Allerton Park Quarry in central North Yorkshire would, if the development is implemented, lead to the production of up to 37kt per annum of recycled Incinerator Bottom Ash with potential for use as a secondary aggregate. This would represent a new and additional source of alternative aggregate in the sub-region. The potential for further development of energy from waste capacity in the Sub-region (such as that proposed in a current application for a major EfW facility at Kellingley Colliery in southern North Yorkshire) could also lead to further availability of such material in future. On the other hand, a known source of secondary aggregate, Kellingley Colliery, is expected to close by the end of 2015. Therefore it is not expected that there is likely to be an overall increase in the proportion of supply met by secondary and recycled materials.
iii) Planning and infrastructure constraints and issues
Planning and infrastructure issues and constraints may also impact on supply. Key factors which can be identified at this time include:
Available information suggests that there are no immediate constraints on the overall supply of aggregate from the sub-region. However, constraints on supply of sand and gravel could arise in the relatively near term as a result of on-going depletion of the landbank, potentially impacting on security of supply to the North Yorkshire internal market, the West and South Yorkshire areas and into the North East Region. The potential for this may be influenced significantly by the outcome of a number of current planning applications for new sand and gravel reserves within the NYCC area, which in combination contain around 20mt of sand and gravel. Reserves in these applications are split approximately equally between the NYCC northwards and southwards distribution areas. The potential substitutability of crushed rock for sand and gravel for concreting uses (see above) may help offset the effect of any reduced supply of sand and gravel. Similarly, in the medium term and beyond marine aggregate may be able to play a greater role in offsetting the effects of any sand and gravel supply constraints in North Yorkshire.
46
There are a number of important aggregates production sites in the sub-region where temporary planning permissions will expire over the next few years (see Appendix 1). The outcome of any applications for renewal of permission for these sites, as well as the potential for acceptable extensions in depth or area to release further reserves, could have a significant impact on availability of supply, particularly for sand and gravel but also for high PSV aggregate, Magnesian Limestone and to a lesser extent Jurassic Limestone. Release of reserves at dormant sites (through agreement to new working and reclamation schemes) could also impact positively on longer term availability of crushed rock. In particular, submissions are currently being prepared by mineral operators for new schemes of working relating to dormant Carboniferous Limestone resources in the Leyburn area. If submitted and subsequently approved these schemes could add significantly to the overall permitted reserve and landbank of crushed rock in the NYCC area. Access from these reserves to the A1 and key external markets will be facilitated by construction of the Bedale, Aiskew and Leeming Bypass on which work has recently commenced.
In the YDNP, Swinden and Horton Quarries are major producers of limestone aggregate and have planning permissions until 2030 and 2042 respectively. Both quarries have reserves that are adequate to maintain their planned levels of production over the currently permitted lives. These quarries are therefore expected to maintain their contribution to supplies of limestone aggregate, principally within the YH Region and to the NW Region.
The three high PSV quarries in the YDNP, Dry Rigg, Arcow and Ingleton, currently have planning permission to 2021, 2015 and 2018 respectively. Comparable high PSV material is not available from other parts of the NY sub-region. Although potential future resources of high PSV material are limited by geological conditions at the three existing quarries, it is expected that planning applications will be submitted for additional reserves and/or extended lives at some of these sites at least. The operating companies at Ingleton and Arcow Quarries have indicated that applications for working additional reserves over an extended time period are likely to be submitted in 2015. In addition, there are significant additional resources beneath the base of the Carboniferous Limestone in Horton Quarry. Only part of this resource has planning permission at present, but the operator has indicated the intention to seek planning approval to work the full resource. At this time, the planning authority does not have sufficiently detailed, publically available information to quantify these additional resources, but if approved these schemes would significantly increase the reserves of high PSV stone. These and related issues will be addressed in the YDNP Local Plan, a Publication version of which is due to be issued in July 2015. It is not expected that there will be a shortfall in supply in the short to medium term, but it is recognised that until schemes are submitted and approved the actual extent of future reserves cannot be stated with certainty. Accordingly discussions are on-going with Cumbria County Council, the nearest authority with quarries producing high PSV stone, so that they remain aware of the current situation in the YDNP. Detailed information about high PSV resources in the UK and related matters is contained in the Capita Symonds report: ‘The Sustainable Use of High Specification Aggregates for Skid-Resistant Road Surfacing in England’ (November 2004). This report was published in 2004 and it would be useful for the work to be brought up to date.
With regard to major infrastructure constraints and opportunities which may impact on supply in overall terms, the current works to upgrade the A1(T) to motorway standard between Leeming to Barton may have implications for access to some areas of sand and gravel resource in the area south of Catterick, as well as potentially representing a significant source of demand for aggregate in the NY sub-region. As noted above, construction of the Bedale, Aiskew and Leeming bypass

47
(now underway) will facilitate road access to/from reserves of crushed rock in the Leyburn area.
The YDNP is in discussions with operating companies on the establishment of rail sidings to serve the Ribblesdale quarries. Planning applications for the construction of a railhead at Arcow Quarry to be used to transport stone from both Arcow and Dry Rigg Quarries have been approved by the Yorkshire Dales National Park Planning Committee.
The NPPF states that, as far as is practical, landbanks of non-energy minerals should be provided for outside of National Parks and AONBs. As mentioned previously within this LAA, the fact that two of the MPAs in the sub-region are National Parks and that there are two AONBs in the NYCC area could have a significant bearing on the amount and pattern of aggregates production in the sub-region in the mid to long term as a result of policy and environmental constraints. This will need to be addressed through the production of minerals plans.
There are likely to be a range of other planning and environmental constraints to further aggregate extraction in the NYCC area, including landscape, historic environment, biodiversity and agricultural land quality constraints and the prevalence of airfield safeguarding zones, as well as accessibility issues taking into account the highly rural nature of the area.
iv) Potential influences on supply from factors external to the NY sub-region
Available information demonstrates that there are significant flows of aggregate across the sub-regional boundary. As a substantial net exporter of a range of types of aggregate (with a correspondingly low relative reliance on imports) supply constraints outside the sub-region are unlikely to impact substantially on availability of aggregate supplies within it. However, it is possible that increased demand elsewhere (for example as a result of growing shortages of local supply in markets served by the NY sub-region) could increase demand for exports and/or lead to changes in the pattern of movements of aggregate across the sub-regional boundary. Possible influences that can be identified at this stage include:
Growing shortfalls in concreting sand and gravel in the West and South Yorkshire areas (as identified in Local Aggregates Assessments for West Yorkshire and for Doncaster and Rotherham)) leading to increased demand for aggregate worked in North Yorkshire. This would be most likely to impact on reserves in the NYCC southwards distribution area, which lie in closest proximity to the West and South Yorkshire areas, but could also place greater pressure on reserves in the northwards distribution area despite the longer haulage distances involved. Consultation with industry during preparation of the first LAA resulted in the view that resources in West Yorkshire are likely to be less than indicated in Local Plans and that North Yorkshire is likely to remain a key source of supply, whereas the acute shortage of concreting sand and gravel in South Yorkshire is more likely to be made up by imports from the East Midlands. Pressure on NY sand and gravel resources to supply into West and South Yorkshire could also arise through any increasing constraints on supply of sand and gravel from other established supply areas such as the Idle Valley area in northern Nottinghamshire, as identified by Nottinghamshire County Council in their Local Aggregate Assessment43, which concludes that resource depletion in the Idle Valley is likely to be the biggest factor potentially influencing exports to South Yorkshire. The Doncaster Local Aggregate Assessment t 2013, states that South
43
Nottinghamshire Minerals Local Plan, Local Aggregate Assessment July 2013

48
Yorkshire has an adequate supply of sand and gravel in the short term, but further reserves will need to be made available from alternative sources to ensure a steady and adequate supply. They also noted that production of sand and gravel in Nottinghamshire is moving southward away from the Idle Valley, which could impact on supply later on in the plan period. A joint position statement relating to aggregates supply into Doncaster and Rotherham from Nottinghamshire and Derbyshire has been completed by the relevant authorities to help safeguard the aggregates supply position. A possible approach to factoring in increased demand on North Yorkshire sand and gravel, arising from constraints on availability in West and South Yorkshire, was included in the Forecasting Demand for Aggregates Minerals Discussion Paper July 2014 and incorporated in the forecasting methodology outlined in Appendix 3. Consultation during preparation of the first NY Sub-region LAA also indicated that the proposed HS2 rail route through West Yorkshire transects two areas of search for sand and gravel, which could impact on availability of the resource.
Any tendency for increased supply into West or South Yorkshire could have corresponding implications for the ability for the sub-region to continue to supply sand and gravel into the NE Region, particularly the Tees Valley, which is the principle export market for sand and gravel worked in the Sub-region. The Tees Valley area currently does not produce any land won aggregate to help meet local requirements, although some importation of marine aggregates takes place. There is therefore a substantial reliance on supply from surrounding areas, mainly North Yorkshire and Durham. If the level of supply from either North Yorkshire or Durham is reduced then there is likely to be increased pressure on the other Authority to increase their level of supply. The Joint Local Aggregate Assessment for Durham, Northumberland and Tyne and Wear (April 2013) indicates that Durham will not require any extra provision of either sand or gravel or crushed rock during the period up to 2030 as there are sufficient reserves with planning permission or in the pipeline to deliver the supply requirements over the Plan period. Tees Valley authorities have indicated that there is potential for increased levels of marine dredged sand and gravel to be supplied into Tees Valley, which could ease pressure on land won supply from North Yorkshire, but this is unlikely to occur in the short term. It is understood that mineral planning authorities in the Tees Valley area are now producing a first Local Aggregates Assessment for the Tees Valley and the content of this will need to be taken into account in future reviews of the North Yorkshire LAA. A consultation draft44 published in February 2015 does not suggest any expectation of a significantly increased supply of aggregate from the Tees Valley area in future.
Increased demand for crushed rock for concreting purposes in the West and South Yorkshire areas, as a partial replacement for sand and gravel from NY or elsewhere, could place increased pressure on higher quality crushed rock reserves, including those in the Yorkshire Dales National Park. The extent to which any increased crushed rock supply from the East Midlands into the Y&H region might fulfil this role instead could be significant in terms of the scale of any effect on the NY sub-region. The existence of substantial reserves and resources of aggregate grade crushed rock in Derbyshire, compared to many other areas of the country, along with the importance of maintaining supply in order to sustain and stimulate national economic growth, is acknowledged in the joint Local Aggregates Assessment for Derbyshire County Council, Derby City Council and the Peak District National Park (2013). The LAA states that there is a large enough landbank of aggregate grade crushed rock to be able to supply current markets as required through the plan period up to 2030.
Potential increased supply of marine aggregate into the main urban centres in West and South Yorkshire as an alternative to land won supply could affect future supply
44
Draft Tees Valley Joint Local Aggregates Assessment February 2015
49
patterns from the NY sub-region. A recent study45 suggests that in the medium to long term the supply of marine aggregate is likely to increase provided there is investment made into the infrastructure required to land and transport it.
Imports from further away (including from overseas sources) in response to increased road haulage costs or other commercial factors might also occur. The extent to which this may occur is currently unknown.
95. The likelihood of any of the above issues arising and the extent to which they may impact on availability of aggregate will be strongly influenced by a range of factors, including commercial decisions taken by industry. They are identified here in order to facilitate monitoring of future trends in supply patterns and to help inform coordination between relevant mineral planning authorities within and around the Yorkshire and Humber area. 96. Overall this assessment concludes that there is no basis to assume a substantially different pattern of supply in the near term, compared to that which has operated in recent years, although in the mid to longer term it is more likely that changes in supply patterns may start to occur in response to some of the factors identified above. This assessment will need to be kept under review in order to identify any emerging trends in supply and demand.
Conclusions on future supply capability 97. Available information suggests that the following conclusions regarding the capability of the North Yorkshire sub-region to maintain future supply of aggregate would be reasonable: Crushed rock supply 98. There is good potential to maintain the overall supply of limestone crushed rock from within the sub-region over the period to 2030 at levels similar to those sustained in recent years and in line with the indicative requirements set out in Table 31 (see Appendix 3). This would be dependent on ongoing supply of currently permitted resources from within the Yorkshire Dales National Park and from within AONBs in NYCC.46 However, unless new permissions are granted, there is potential for reserves of high PSV aggregate and Magnesian Limestone in particular to be significantly reduced in the mid term. 99. In the longer term, maintenance of an adequate overall supply of crushed rock is likely to be dependent on the granting of permissions for an extension of the time period for completion of development at some quarry sites. Extensions to working areas (where possible) may also be beneficial at some sites in order to help maintain production capacity, unless output at other remaining sites could be increased. A range of physical, economic and environmental constraints could impact on this, although it should also be noted that crushed rock reserves and production are spread across a substantial number of sites and operators, which should help with flexibility in terms of the ability to match changes in demand with corresponding adjustments in supply. It is also likely that resources in dormant sites would be able to make a significant contribution to crushed rock supply in the mid term and beyond.
45
URS, Marine Aggregates Study, Final Report January 2014 46
Durham County Council, has indicated that it intends to seek to make provision for further working of Carboniferous Limestone in order to help maintain the scale of historic sales.

50
Sand and gravel supply 100. Future supply of sand and gravel from the sub-region is dependent on the availability of supply from the NYCC area, for geological reasons. In the absence of new reserves being brought forward, current reserves would become exhausted in the mid-term. This would have a substantial impact on supply into the adjacent NE Region and elsewhere in the Yorkshire and Humber Region. 101. Supply constraints outside the NY sub-region, and the probable lack of opportunity for development of significant alternative sand and gravel resources within the sub-region but outside the NYCC area, are likely to result in the strategic significance of NYCC’s resources of concreting sand and gravel being maintained or increased over time47.
102. Maintenance of supply in both northwards and southwards distribution areas, and for building sand, will be important in helping to maintain an appropriate overall balance of supply of sand and gravel. In the absence of more specific information it is considered that the total sand and gravel requirement should be sub-divided across the northwards and southwards distribution areas and for building sand in accordance with their current average share of the total (ie 41% Northwards distribution area, 53% Southwards distribution area and 6% Building Sand). 103. The outcome of a number of current planning applications for sand and gravel working in NYCC will be important in determining the future scale of any additional provision that may be required over the period to 2030. Maintenance of supply will also be influenced by the ongoing availability of reserves at a number of sites subject to temporary permissions and where the current expiry date is likely to pre-date exhaustion of current permitted reserves. As with crushed rock sand, albeit to a lesser extent, reserves and production of sand and gravel is spread across a number of sites and operators, providing some flexibility to match changes in demand with corresponding levels of supply. 104. The extent of any trend to substitute (or partially substitute) crushed rock for sand and gravel for certain key end uses such as ready-mix concrete may also have an impact on supply and requirements in future (see discussion earlier in this LAA). It is unlikely that any reserves in dormant sites would have a significant direct impact on the overall sand and gravel supply position. There is less pressure on reserves of building sand but some additional resources are likely to be needed to maintain supply in the mid to longer term. Marine aggregate supply 105. Data suggests that the current contribution from marine aggregate to overall supply of aggregate within the NY sub-region is relatively small. The expected ongoing availability of resources in dredging areas in the Humber dredging region, together with the availability of existing landing infrastructure in the Humber and Tees Estuaries (outside but relatively close to the NY sub-region) suggests that there is potential for this supply to be maintained and increased. 106. A recent study has identified potential for a significant increase in supply of marine sand and gravel into the Yorkshire and Humber region. Should such a scenario occur it may impact on the scale of future requirements for landwon aggregate from the NY sub-region in the mid to longer term. However it is considered reasonable to assume at this stage that the proportion of overall supply in both the Yorkshire and Humber region and the NY sub-region
47
Durham County Council indicated, in response to consultation on the first LAA, that on the basis of current and expected permitted reserves and subject to the commercial decisions on operators in respect of sites not currently worked, it may be able to make a greater contribution to supply of sand and gravel into the adjacent Tyne and Wear and Tees Valley sub-regions as well as being self-sufficient in its own needs.
51
will remain broadly static, or only increase relatively slightly, in the short term. Safeguarding of relevant infrastructure in line with national policy will be important in helping to support supply capability in future. Secondary aggregate supply 107. It is reasonable to assume that there is capability to maintain supply of secondary aggregate at levels similar to those prevailing in recent years, at least in the near term. It is likely that levels of supply of some secondary aggregate, particularly PFA and colliery spoil, could be increased if suitable markets could be identified. However, availability of secondary aggregate within the sub-region is directly linked to the future success of those industries which give rise to them. The intended closure of Kellingley Colliery at the end of 2015 is an example of this. Any further unforeseen change, such as the closure of a major producer, could impact significantly on availability of secondary aggregate and place correspondingly greater pressure on other aggregate resources in the sub-region (or lead to alternative, more remote sources of supply, being used, or the re-location elsewhere of existing operations reliant on supply of such materials). There may also be the potential for the marketability of secondary aggregate to be impacted adversely by the expected partial conversion of current electricity generation capacity in the sub-region from coal to biomass burning. However, there are large volumes of power station ash and colliery spoil in existing disposal facilities (at Barlow and Gale Common ash disposal facilities and Womersley spoil disposal facility) which could represent a potential ongoing source of supply. Upward revision of the current 30kt per annum limit on export of ash from the Gale Common site could theoretically increase supply from this particular source. 108. There is potential for a new, relatively small scale, supply of secondary aggregate to become available in the near term in the form of Incinerator Bottom Ash from the proposed Allerton Waste Recovery Facility in central NYCC. This would provide a source of secondary aggregate in a part of the NY sub-region away from current secondary sources, which are all located in Selby District. Further proposals for EfW capacity in or close to the sub-region (Such as proposals for EfW capacity at Kellingley Colliery and Ferrybridge Power Station) could lead to additional such sources of supply. Recycled aggregate supply 109. Good quality data on the supply, or availability, of recycled aggregate does not exist. In the absence of more data it is considered reasonable to assume that, in line with the position understood to prevail generally across the country, the majority of material potentially suitable for use as recycled aggregate is already put to beneficial use. Production of this LAA has not revealed any specific data that would suggest that an alternative position prevails in the NY sub-region. It is therefore considered realistic to assume that the proportionate contribution to overall supply from recycled aggregate sources in the sub-region is likely to remain broadly in line with levels prevailing over recent years. Imports from elsewhere 110. Available information suggests that imports of aggregate into the NY sub-region are currently relatively small, both in absolute terms and particularly as a proportion of total consumption. However, the existence of some rail linked infrastructure in the Selby area, currently used for the import of aggregate on a relatively small scale, suggests that there is some potential for import of aggregate from sources a significant distance away. The extent to which this may occur in future is likely to be dependent on commercial decisions by industry as well as the continued availability of the necessary transport infrastructure.

52
111. Greater potential for significantly increased rail haulage of aggregate from more remote sources is likely to exist for imports into major urban areas in and around the West and South Yorkshire. This could have an indirect impact on supply from the NY sub-region by offsetting some of the demand currently met by supply from the sub-region and/or could help mitigate the impact of any shortfall in supply from the sub-region that may emerge in the mid or longer term. The existence of very substantial resources of limestone in the East Midlands region, including at sites with rail links, may be relevant in this respect. In response to consultation on a draft of this LAA, Leeds City Council have indicated that there is current interest in development of a new rail-linked aggregate unloading facility in Leeds for receipt of crushed rock worked outside the Yorkshire and Humber area.
Key messages for minerals plans, cross-boundary liaison and future review Key messages for local planning in the NY sub-region
112. Taking into account the range of information presented in this updated LAA for the NY Sub-region, a number of key messages emerge which are likely to be of relevance to preparation of minerals local plans in and around the sub-region. These are summarised below:
1) Assessment of future supply requirements on the basis of an assumed annual equivalent demand of 2.62mtpa for sand and gravel and 3.75mtpa for crushed rock for the period 2014 to 2030 is considered appropriate for the NYCC area.
2) There is a need to address future provision of sand and gravel from the NYCC area to ensure on-going supply capability for the sub-region. An indicative shortfall of around 26mt for 2014 to 2030 has been identified in this assessment. The actual scale of new provision needed to be made will be influenced by the outcome of a number of current planning applications for sand and gravel working.
3) In order to maintain current supply patterns for concreting sand and gravel without increasing overall haulage distances, it is likely that further sand and gravel provision in both the NYCC northwards and southwards distribution areas would be needed.
4) Some further provision of building sand (an indicative total of 1.7mt) is also likely to be required in order to maintain supply over the period 2014 to 2030.
5) Consideration should be given to the extent to which further resources of Magnesian Limestone should be made available from within the NYCC area, in order to maintain a balance of supply between the main types of crushed rock currently worked in the area. Reserves in dormant crushed rock sites in the NYCC area are also likely to become of more significance in contributing to future supply.
6) Consideration should also be given to the extent of any potential to maintain supply of high PSV aggregate from the YDNP area. Liaison between Cumbria County Council and the YDNPA in relation to supply of high PSV aggregate would be useful and is already taking place.
7) A number of existing quarry sites are likely to require extensions of time and/or extensions in working area in order to help maintain the broad level and distribution of production capacity that currently exists.
53
Key issues for cross-boundary liaison 113. Preparation of this LAA has also allowed identification of a number of cross-boundary relationships relevant to aggregate supply which may be of particular relevance. These include: A. Imports
1) Stockton on Tees and Tyneside Councils in respect of imports of marine sand and gravel
2) East Riding Council in respect of imports of land won sand and gravel
3) Durham Council in respect of imports of crushed rock and sand and gravel
4) Cumbria County Council in respect of imports of crushed rock and sand and gravel
5) Derbyshire County Council in respect of imports of crushed rock
6) Wakefield Metropolitan District Council in respect of imports of crushed rock
B. Exports
1) Sand and gravel and crushed rock exports from the NYCC area to the North East Region (expected to include particularly Durham and the Tees Valley authorities)
2) Crushed rock exports from the YDNP to the NW region (expected to include particularly Lancashire, Cumbria and Greater Manchester)
3) Crushed rock exports from both the YDNP and NYCC area to destinations elsewhere in Yorkshire and Humber, particularly in West and South Yorkshire
4) Sand and gravel exports from NYCC to West and South Yorkshire
Key matters that should be kept under review 114. In addition to routine monitoring of sales, reserves and landbanks, preparation of this first LAA has identified a number of issues where on-going monitoring and/or review will be particularly important. These are:
1) The trend in supply of marine aggregate into main markets currently served by landwon concreting aggregate from the NY sub-region should be monitored.
2) The trend in the balance of supply between land won sand and gravel and crushed rock from the sub-region should be monitored.
3) The potential for significant change in the availability of supply of secondary aggregate from key sources, as well as the potential introduction of any significant new sources, should be kept under review.
4) Where practicable, the trend in balance of consumption met by imports from outside the sub-region should be monitored, as well as the extent to which imports from elsewhere may impact on supply into key markets currently served by the NY sub-region.

54
5) Where practicable, the trend in exports from the sub-region to key external markets should be monitored.
6) Delivery, or proposed delivery, of any significant new aggregates minerals supply infrastructure or infrastructure that may impact on supply of aggregate. 7) Any proposed major infrastructure projects that may give rise to unforeseen high level of demand for aggregate in the NY sub-region.

55
Appendix 1 – Information relating to specific sites and facilities Aggregates quarries in the NYCC area (with active permissions
48)
Location Status at August 2014
Comment on significance Potential supply capability to 2030 (near term = 5 years or less) (Mid term = 6 to 15 years) (Longer tem = 16 years +)
Crushed rock quarries
Carboniferous Limestone
Skipton Rock Craven District Mothballed Large reserves but not been worked for extensive period of time. The only active crushed rock permission in the Craven area of NYCC. Permission expires in 2042
Has capability to make substantial additional contribution to supply subject to commercial decision by operator. Has potential to offset any reduced production from the YDNP
Pateley Bridge Harrogate Borough
Active Largest production unit in NYCC area. Remote location in AoNB but supplies markets in West Yorks. Extraction permitted until 2047, estimated 17 years’ worth of reserves in 2011
May become exhausted around 2030
Barton/Duckett Hill Richmondshire District
Mothballed Close to NYCC boundary with NE region. Proximity to A1(M). Recent permission for extension, Estimated life of site is to 2028 or beyond
May become exhausted around 2030
Forcett Richmondshire District
Active Close to NYCC boundary with NE region. In close proximity to A66. Permission currently expires in 2016, site has been mothballed since June 2012
Extension of time and/or extension to permitted working area may be needed to maintain supply capability beyond near term
Leyburn Richmondshire District
Active Located on edge of Yorkshire Dales and is close to Wensley Quarry. Relatively remote from SRN. Permission for extraction until 2042. Has substantial shared dormant reserves with Wensley Quarry in adjoining Cote Pastures IDO area
Potential to maintain supply to 2030 and beyond
Low Grange Quarry Richmondshire District
Active Located close to NYCC boundary with NE region. Extracts limestone, also has concrete silos on site. Permission expires 2042.
Potential to maintain supply to 2030 and beyond
Wensley Richmondshire District
Active Located on edge of Yorkshire Dales and is close to Leyburn Quarry.
Potential to maintain supply to 2030 and beyond
48
Active permissions are sites with valid permissions which may be working or mothballed on a temporary basis (and for which new working and reclamation schemes are not required before working can recommence)

56
Aggregates quarries in the NYCC area (with active permissions
48)
Location Status at August 2014
Comment on significance Potential supply capability to 2030 (near term = 5 years or less) (Mid term = 6 to 15 years) (Longer tem = 16 years +)
Relatively remote from SRN. Permission for extraction until 2042. Has substantial shared dormant reserves with Leyburn Quarry in adjoining Cote Pastures IDO area
Magnesian Limestone
Potgate Harrogate Borough
Active Located north of Ripon and mainly supplies the North Yorkshire market. Has permission for extraction until June 2022.
Extension of time and/or extension to permitted working area may be needed to maintain supply capability beyond mid term. Lateral extension permitted in 2015 containing 1.5mt additional reserves
Gebdykes Hambleton District Active Located north of Masham and mainly supplies the North Yorkshire market. Permitted for extraction until 2039
Potential to maintain supply to 2030 and beyond
Barnsdale Bar Selby District Active Located near to southern boundary of Selby District adjacent to A1(M). Part of the site now falls within the adjoining Doncaster Metropolitan Council area. Permitted for extraction until 2025, Estimated remaining reserve of 8 years
Extension of time and/or extension to permitted working area may be needed to maintain supply capability beyond mid term
Brotherton/Foxcliffe Selby District Mothballed The site is near the A1(M) in the Selby District. It has been mothballed since 2008 due to the economic downturn. Permitted for extraction until December 2020, Estimated lifespan of 2 years from recommencement
Limited future supply capability.
Smeaton/Went Edge
Selby District Active Located near the NYCC boundary with Wakefield, close to the A1(M). Extraction on the site is allowed until 2023. Application for extension recently granted
Extension of time and/or extension to permitted working area may be needed to maintain supply capability beyond mid term. Further application for extension currently under consideration
Jackdaw Crag Selby District Active Located near Tadcaster in Selby District. Current permission allows extraction until 2014
Extension of time and/or extension to permitted working area may be needed to maintain supply

57
Aggregates quarries in the NYCC area (with active permissions
48)
Location Status at August 2014
Comment on significance Potential supply capability to 2030 (near term = 5 years or less) (Mid term = 6 to 15 years) (Longer tem = 16 years +)
capability beyond near term. Application for extension currently under consideration
Darrington Quarry Selby District Extraction complete in North Yorkshire
Straddles the boundary with Wakefield. Extraction in North Yorkshire complete, with working continuing in Wakefield area. Mineral is processed in North Yorkshire. Current permission for processing site expires in December 2012, but application submitted to extend this by 20 years.
Output from this site contributes to NYCC sales but no corresponding reserve in NYCC area. Reserve within Wakefield expected to last into longer term
Newthorpe Quarry Selby District Mothballed Located near the boundary with Wakefield. Currently mothballed due to economic downturn. Estimated life span is 20 years from recommencement. Permission for extraction runs until 2042
Potential to maintain supply to 2030 and beyond
Jurassic Limestone
Newbridge Ryedale District Active Located near Pickering in the Ryedale District and supplies the North Yorkshire area. Permission was granted in 2009 to extend the site. Permission expires in 2022.
Extension of time and/or extension to permitted working area may be needed to maintain supply capability beyond mid term
Settrington Ryedale District Active Located on the outskirts of Malton in Ryedale. It is a relatively small quarry. The expiry date for the permission is January 2015
Extension of time and/or extension to permitted working area may be needed to maintain supply capability beyond short term
Wath Ryedale District Mothballed Located near Hovingham in Ryedale and in the Howardian Hills AONB. Permission expires in October 2023. The site is currently mothballed
Estimated remaining life of 20 years at end 2012. Extension of time may be needed to maintain supply capability in mid term. Potential to make contribution to supply subject to commercial decision by operator
Whitewall Ryedale District Active Located south of Norton in Ryedale. Permission expires in 2023. Estimated remaining life of the current reserves is 12 years
Extension of time and/or extension to permitted working area may be needed to maintain supply capability beyond mid term
Hovingham Ryedale District Mothballed Located near Hovingham Has potential to make

58
Aggregates quarries in the NYCC area (with active permissions
48)
Location Status at August 2014
Comment on significance Potential supply capability to 2030 (near term = 5 years or less) (Mid term = 6 to 15 years) (Longer tem = 16 years +)
in the Ryedale District. Currently mothballed. It is located in the Howardian Hills AONB and the permission runs until February 2042
contribution to supply subject to commercial decision by operator
Chalk
Knapton Ryedale District Mothballed Located east of Malton and has produced chalk but further working not expected. Restoration of the site is to be complete by 2037
No significant future supply capability?
Flixton Scarborough Borough
Mothballed Near Flixton Village in Scarborough District. Has produced chalk. Permitted until 2042 but is currently mothballed.
Limited future supply capability subject to commercial decision by operator?
Sand and gravel quarries
Concreting sand and gravel
Marfield Harrogate Borough
Active Located north of Masham.. Current permission allows extraction until 2020. Estimated lifespan of the current permitted area is approximately 11 years.
Extension of time and/or extension to permitted working area may be needed to maintain supply capability beyond mid term. Application for 4mt extension granted in 2014 subject to legal agreement.
Ripon Harrogate Borough
Active Located near North Stainley, north of Ripon. An application to extend the site is currently under consideration. Current permission allows extraction until 2015. Estimated 7 years reserves in the current permitted area.
Extension of time and/or extension to permitted working area may be needed to maintain supply capability beyond near term. Site is subject of current application for extension (4mt/13-15 years)
Ripon City Harrogate Borough
Active Located to the south east of Ripon. Extension recently permitted with 7 year life.
Extension of time and/or extension to permitted working area may be needed to maintain supply capability beyond mid term
Manor House Farm Hambleton District Mothballed Also known as Ellerton Quarry. Sand and gravel was transported to neighbouring Kiplin Hall Quarry for processing but this has now ceased. Site is currently mothballed. The permission is due to expire in December 2030
Has potential to make contribution to supply subject to commercial decision by operator
Nosterfield Hambleton District Active Located 8km north of Ripon near West
Extension of time and/or extension to

59
Aggregates quarries in the NYCC area (with active permissions
48)
Location Status at August 2014
Comment on significance Potential supply capability to 2030 (near term = 5 years or less) (Mid term = 6 to 15 years) (Longer tem = 16 years +)
Tanfield. Adjacent to Thornborough Henges Scheduled Ancient Monument. An application to extend the site is currently under consideration. Currently permitted for extraction until October 2014. with approximately 3 years reserves remaining
permitted working area may be needed to maintain supply capability beyond near term. Site is subject to current application for extension (2mt)
Bridge Farm/Pallett Hill
Richmondshire District
Active Located north of Catterick Village. Permission for extraction runs until 2017
Extension of time and/or extension to permitted working area may be needed to maintain supply capability beyond near term
Kiplin Hall Richmondshire District
Closed Located just north of Great Langton in Richmondshire. Extraction completed in 2011 and site is currently being restored. Plant authorised to be retained until 2017
May have future supply capability to process material from adjacent Ellerton site
Scorton Richmondshire District
Active Located near Scorton in Richmondshire and incorporates the previously separate Tancred Quarry site. Permission authorises extraction until 2017
Extension of time and/or extension to permitted working area may be needed to maintain supply capability beyond near term
Ings Farm Ryedale District Active Small site located near Yedingham in Ryedale District. Produces small amount of sand and gravel. Permitted for extraction until 2042
Understood to have long term supply capability at low output
Wykeham Scarborough Borough
Active Located 6km west of Scarborough. Permission for an extension has recently been granted. Life of new permission is 20 years from commencement of development.
Supply capability to 2030 and beyond.
Building sand
West Heslerton Ryedale District Active Building sand site located in Ryedale district. A screening opinion relating to potential extension of the site has been sought. Permission for extraction currently until 2020. Estimated remaining reserves of 7 years
Extension of time and/or extension to permitted working area may be needed to maintain supply capability beyond mid term
Mill Balk Selby District Mothballed Building sand site located in Selby District. Site is currently mothballed.
Has potential to make contribution to supply subject to commercial
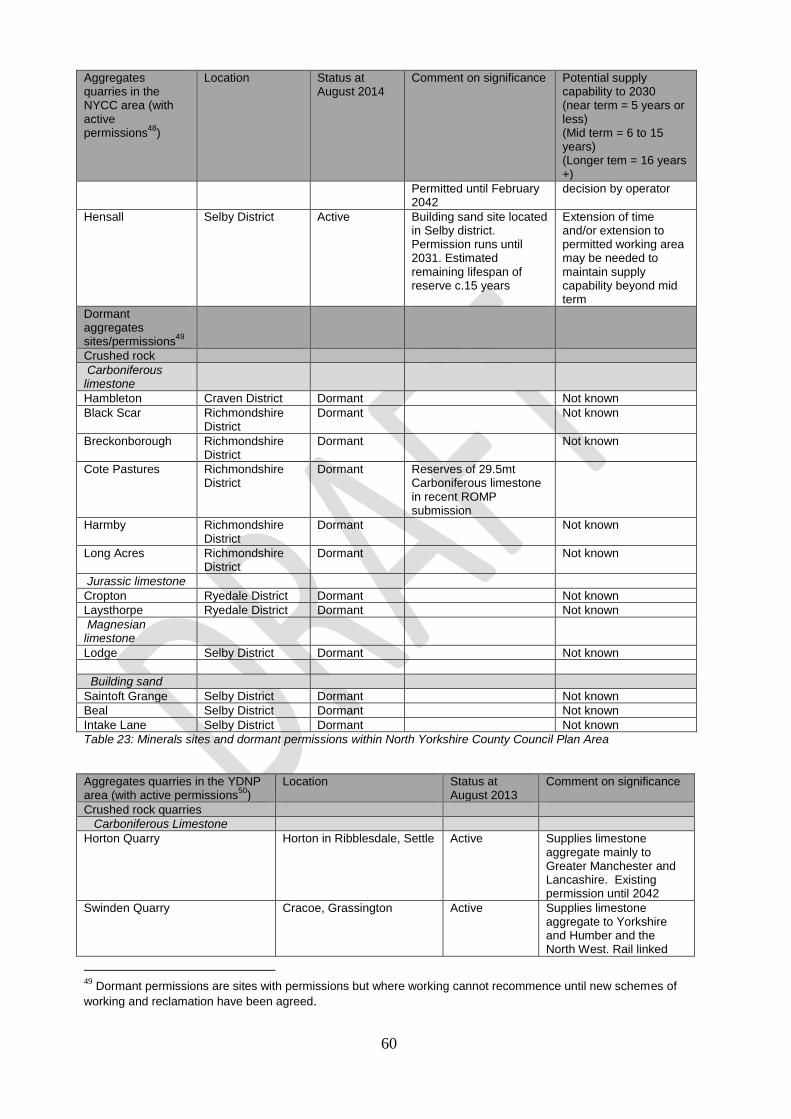
60
Aggregates quarries in the NYCC area (with active permissions
48)
Location Status at August 2014
Comment on significance Potential supply capability to 2030 (near term = 5 years or less) (Mid term = 6 to 15 years) (Longer tem = 16 years +)
Permitted until February 2042
decision by operator
Hensall Selby District Active Building sand site located in Selby district. Permission runs until 2031. Estimated remaining lifespan of reserve c.15 years
Extension of time and/or extension to permitted working area may be needed to maintain supply capability beyond mid term
Dormant aggregates sites/permissions
49
Crushed rock
Carboniferous limestone
Hambleton Craven District Dormant Not known
Black Scar Richmondshire District
Dormant Not known
Breckonborough Richmondshire District
Dormant Not known
Cote Pastures Richmondshire District
Dormant Reserves of 29.5mt Carboniferous limestone in recent ROMP submission
Harmby Richmondshire District
Dormant Not known
Long Acres Richmondshire District
Dormant Not known
Jurassic limestone
Cropton Ryedale District Dormant Not known
Laysthorpe Ryedale District Dormant Not known
Magnesian limestone
Lodge Selby District Dormant Not known
Building sand
Saintoft Grange Selby District Dormant Not known
Beal Selby District Dormant Not known
Intake Lane Selby District Dormant Not known
Table 23: Minerals sites and dormant permissions within North Yorkshire County Council Plan Area
Aggregates quarries in the YDNP area (with active permissions
50)
Location Status at August 2013
Comment on significance
Crushed rock quarries
Carboniferous Limestone
Horton Quarry Horton in Ribblesdale, Settle Active Supplies limestone aggregate mainly to Greater Manchester and Lancashire. Existing permission until 2042
Swinden Quarry Cracoe, Grassington Active Supplies limestone aggregate to Yorkshire and Humber and the North West. Rail linked
49
Dormant permissions are sites with permissions but where working cannot recommence until new schemes of
working and reclamation have been agreed.

61
with trains to Leeds, Hull and Teesside (non-aggregate). Existing permission until 2030
High PSV aggregate
Arcow Quarry Helwith Bridge, Settle Active High PSV stone supplied mainly to North and West Yorkshire, Greater Manchester and Lancashire. Existing permission until 2015. Railhead approved for use by Arcow and Dry Rigg Quarries
Dry Rigg Quarry Helwith Bridge, Settle Active High PSV stone, including for slurry seals, with sales throughout Great Britain. Existing permission until 2021
Ingleton Quarry Ingleton Active High PSV stone, including surface dressing and slurry seals, with sales mainly to North and West Yorkshire and the North West. Existing permission until 2018. Some export by rail to Leeds through Ribblehead sidings
Table 24: Minerals sites within the Yorkshire Dales National Park
Significant rail/water transport infrastructure in the NY sub-region
Location (MPA area and District if applicable)
Status at August 2013
Comment
Transport
Railheads/ railway sidings
Swinden Quarry YDNP Active Railhead, aggregate trains to Leeds, Hull and non-aggregates to Teesside
Ribblehead YDNP Active Use of railhead for transport of Ingleton stone to Leeds and also used for timber.
Kellingley Colliery railhead NYCC, Selby District Active Transports coal to power stations. Colliery expected to close end 2015
Eggborough Power Station railway sidings
NYCC, Selby District Active Coal transported from Immingham/Goole
Selby Depot railhead NYCC, Selby District Active Cemex and Potter Group import of aggregates
Great Heck railhead NYCC, Selby District Active Plasmor and Tarmac transport lightweight blocks and import aggregate
Drax Power Station railway sidings NYCC, Selby District Active Transportation of gypsum, coal and secondary aggregate
Gascoigne Wood railway sidings NYCC, Selby District Not currently used for minerals transport
Formerly used to transport coal to Drax Power Station. Mining ceased in 2004
Hellifield railway sidings NYCC, Craven District Not currently used for minerals transport
Have been considered in the past for potential use for minerals transport
Milford railway sidings NYCC, Selby District Not currently used for minerals
Between Ferrybridge and Monk Fryston

62
Significant rail/water transport infrastructure in the NY sub-region
Location (MPA area and District if applicable)
Status at August 2013
Comment
transport
Redmire railway sidings and railhead
NYCC, Richmondshire District
Not currently used for minerals transport
Previously used for minerals transport from former Redmire Quarry. Could load under license
Boulby Mine NYMNP Active Transport potash and other minerals from Boulby mine
Wharves
River Ouse, Nr Drax Power Station
NYCC, Selby District Active Transports ash from Drax to Goole Dock for export to Europe. Has been used for the transport of secondary aggregate
Kellingley Colliery canal wharf NYCC, Selby District Not currently used for minerals transport
Coal and colliery spoil have been transported in the past, but not currently used for freight. Colliery expected to close end 2015
Whitley Aire and Calder Navigation Canal, A19 crossing
NYCC, Selby District Not currently used for minerals transport
No longer used for freight, currently in private ownership
Whitby Port NYCC, Scarborough District Not currently used for minerals transport
Not usually used for freight
River Ouse, Westfield Foods Wharf, Selby
NYCC, Selby District Not currently used for minerals transport
Occasional use for rice transport
River Ouse, Potter Group, Selby NYCC, Selby District Not currently used for minerals transport
Maintain wharfage rights along river frontage, not been used for some time
River Ouse, BOCM, Olympia Mill Wharf, Selby
NYCC, Selby District Not currently used for minerals transport
Not currently used, in poor condition.
Heck Lane Wharf NYCC, Selby District Not currently used for minerals transport
Not currently used, in poor condition
Queen Staithes Wharf City of York Not currently used for minerals transport
Used to moor boats
Dukes Wharf (Terrys Avenue) City of York Not currently used for minerals transport
Used to moor boats
Table 25: Transport infrastructure used (or with potential for) minerals transport in NY sub-region
Ancillary minerals infrastructure Location (MPA area and district if applicable)
Status at August 2013
Comment
Concrete batching
Fairfield Way, Whitby Business Park
NYMNP/Scarborough District
Active Stand alone facility
Snaygill Industrial Estate, Skipton NYCC/Craven District Active Stand alone facility
Standard Way, Northallerton NYCC/Hambleton District Active Stand alone facility
Thirsk Industrial Estate, Thirsk NYCC/Hambleton District Active Stand alone facility
Pickhill, Thirsk NYCC/Hambleton District Active Stand alone facility
Eldmire Mill, Dalton, Thirsk NYCC/Hambleton District Active Stand alone facility
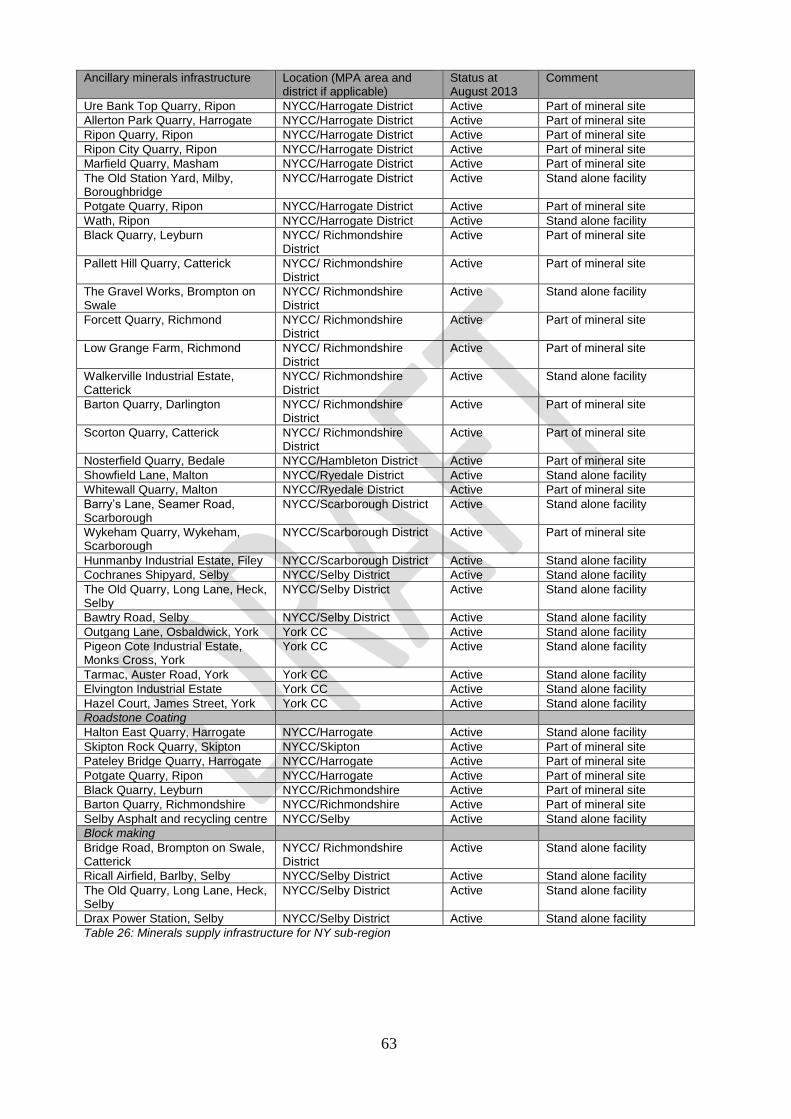
63
Ancillary minerals infrastructure Location (MPA area and district if applicable)
Status at August 2013
Comment
Ure Bank Top Quarry, Ripon NYCC/Harrogate District Active Part of mineral site
Allerton Park Quarry, Harrogate NYCC/Harrogate District Active Part of mineral site
Ripon Quarry, Ripon NYCC/Harrogate District Active Part of mineral site
Ripon City Quarry, Ripon NYCC/Harrogate District Active Part of mineral site
Marfield Quarry, Masham NYCC/Harrogate District Active Part of mineral site
The Old Station Yard, Milby, Boroughbridge
NYCC/Harrogate District Active Stand alone facility
Potgate Quarry, Ripon NYCC/Harrogate District Active Part of mineral site
Wath, Ripon NYCC/Harrogate District Active Stand alone facility
Black Quarry, Leyburn NYCC/ Richmondshire District
Active Part of mineral site
Pallett Hill Quarry, Catterick NYCC/ Richmondshire District
Active Part of mineral site
The Gravel Works, Brompton on Swale
NYCC/ Richmondshire District
Active Stand alone facility
Forcett Quarry, Richmond NYCC/ Richmondshire District
Active Part of mineral site
Low Grange Farm, Richmond NYCC/ Richmondshire District
Active Part of mineral site
Walkerville Industrial Estate, Catterick
NYCC/ Richmondshire District
Active Stand alone facility
Barton Quarry, Darlington NYCC/ Richmondshire District
Active Part of mineral site
Scorton Quarry, Catterick NYCC/ Richmondshire District
Active Part of mineral site
Nosterfield Quarry, Bedale NYCC/Hambleton District Active Part of mineral site
Showfield Lane, Malton NYCC/Ryedale District Active Stand alone facility
Whitewall Quarry, Malton NYCC/Ryedale District Active Part of mineral site
Barry’s Lane, Seamer Road, Scarborough
NYCC/Scarborough District Active Stand alone facility
Wykeham Quarry, Wykeham, Scarborough
NYCC/Scarborough District Active Part of mineral site
Hunmanby Industrial Estate, Filey NYCC/Scarborough District Active Stand alone facility
Cochranes Shipyard, Selby NYCC/Selby District Active Stand alone facility
The Old Quarry, Long Lane, Heck, Selby
NYCC/Selby District Active Stand alone facility
Bawtry Road, Selby NYCC/Selby District Active Stand alone facility
Outgang Lane, Osbaldwick, York York CC Active Stand alone facility
Pigeon Cote Industrial Estate, Monks Cross, York
York CC Active Stand alone facility
Tarmac, Auster Road, York York CC Active Stand alone facility
Elvington Industrial Estate York CC Active Stand alone facility
Hazel Court, James Street, York York CC Active Stand alone facility
Roadstone Coating
Halton East Quarry, Harrogate NYCC/Harrogate Active Stand alone facility
Skipton Rock Quarry, Skipton NYCC/Skipton Active Part of mineral site
Pateley Bridge Quarry, Harrogate NYCC/Harrogate Active Part of mineral site
Potgate Quarry, Ripon NYCC/Harrogate Active Part of mineral site
Black Quarry, Leyburn NYCC/Richmondshire Active Part of mineral site
Barton Quarry, Richmondshire NYCC/Richmondshire Active Part of mineral site
Selby Asphalt and recycling centre NYCC/Selby Active Stand alone facility
Block making
Bridge Road, Brompton on Swale, Catterick
NYCC/ Richmondshire District
Active Stand alone facility
Ricall Airfield, Barlby, Selby NYCC/Selby District Active Stand alone facility
The Old Quarry, Long Lane, Heck, Selby
NYCC/Selby District Active Stand alone facility
Drax Power Station, Selby NYCC/Selby District Active Stand alone facility
Table 26: Minerals supply infrastructure for NY sub-region

64
Appendix 2 – further information on movements of aggregate into the Sub-region
The information in this appendix is intended to supplement information on minerals movements already provided in the main body of the LAA. It is based on further information supplied by BGS utilising data in the 2009 Collation of Aggregate Minerals Surveys for England and Wales. Due to the methodology by which sub-regional data was collected and collated during the Aggregates Minerals Survey process, it is not possible to break the data down to MPA level, so it was supplied by BGS at sub-regional level. In order to preserve confidentiality, BGS supplied the data on imports from outside the NY sub-region grouped on a percentage range basis, reflecting the contribution made by various MPAs to total supply in the sub-region. Data was provided as a % of total sub-regional consumption (i.e. imports plus indigenous supply combined) met by imports of either marine dredged aggregate, sand and gravel or crushed rock. The percentage range figures provided by BGS were then converted to tonnage ranges, by applying the percentage range figures to total known sub-regional consumption expressed in tonnes, thereby providing the indicative volume of sub-regional consumption met by imports from particular MPA sources. In order to gain an indication of the relative significance of imports, data on known total consumption was also used to express the indicative volume of imports from each source as a percentage of total sub-regional consumption. Sales from each producing area, where known, were also used to provide an indication of the proportion of total sales from the source MPA that the export to the North Yorkshire sub-region represents. The information is summarised in the following Table.
Movement 2009
% of total NY sub-regional consumption for this aggregate type that the import represents**
Tonnage kt (% range from column 1 expressed as tonnage, based on total sub-regional consumption derived from Table 12)
% of recipient consumption for sand and gravel or crushed rock
% of producer sales
Marine sand and gravel supplied to North Yorks sub region from South Tyneside
50 to 60 20 to 24 2.5 to 3 Unknown
Marine sand and gravel supplied to North Yorks sub region from Stockton –on-Tees
40 to 50 16 to 20 2 to 2.5 Unknown
Land won sand and gravel supplied to North Yorks sub region from quarries within North Yorks
78 600 74 35
Land won sand and gravel supplied to North Yorks sub region from quarries within East Riding
5 to 10 38 to 60 5 to 7 4 to 7
Land won sand and gravel supplied to North Yorks sub region from quarries within Doncaster
1 to 5 8 to 38 1 to 5 1 to 3
Land won sand and gravel supplied to North Yorks sub region from quarries within Durham
1 to 5 8 to 38 1 to 5 4 to 19
Land won sand and gravel supplied to North Yorks sub region from quarries within Cumbria
1 to 5 8 to 38 1 to 5 2 to 7
Crushed rock supplied to North Yorks sub region from quarries within North Yorks
63 1463 63 56
Crushed rock supplied to North Yorks sub region from quarries within Yorkshire Dales NP
17 395 17 15
Crushed rock supplied to North Yorks sub region from quarries within Cumbria
5 to 10 116 to 232 5 to 10 4 to 8
Crushed rock supplied to North Yorks sub 5 to 10 116 to 232 5 to 10 1 to 3
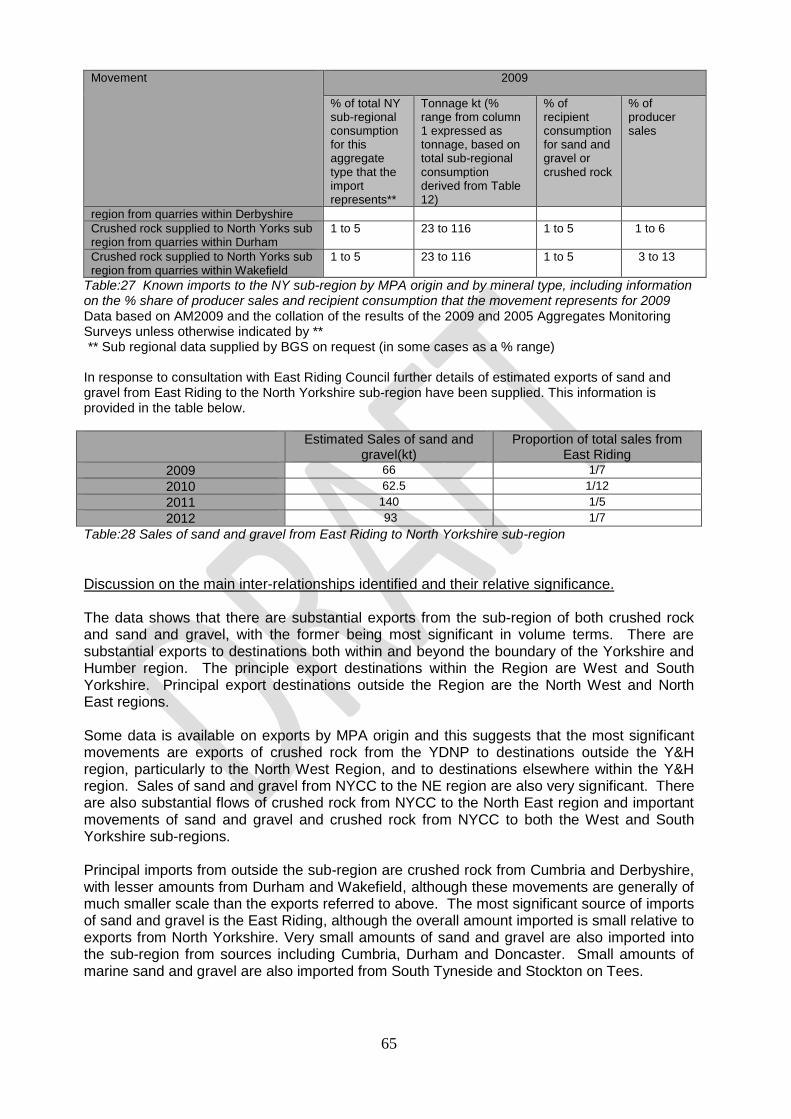
65
Movement 2009
% of total NY sub-regional consumption for this aggregate type that the import represents**
Tonnage kt (% range from column 1 expressed as tonnage, based on total sub-regional consumption derived from Table 12)
% of recipient consumption for sand and gravel or crushed rock
% of producer sales
region from quarries within Derbyshire
Crushed rock supplied to North Yorks sub region from quarries within Durham
1 to 5 23 to 116 1 to 5 1 to 6
Crushed rock supplied to North Yorks sub region from quarries within Wakefield
1 to 5 23 to 116 1 to 5 3 to 13
Table:27 Known imports to the NY sub-region by MPA origin and by mineral type, including information on the % share of producer sales and recipient consumption that the movement represents for 2009
Data based on AM2009 and the collation of the results of the 2009 and 2005 Aggregates Monitoring Surveys unless otherwise indicated by ** ** Sub regional data supplied by BGS on request (in some cases as a % range) In response to consultation with East Riding Council further details of estimated exports of sand and gravel from East Riding to the North Yorkshire sub-region have been supplied. This information is provided in the table below.
Estimated Sales of sand and gravel(kt)
Proportion of total sales from East Riding
2009 66 1/7
2010 62.5 1/12
2011 140 1/5
2012 93 1/7
Table:28 Sales of sand and gravel from East Riding to North Yorkshire sub-region
Discussion on the main inter-relationships identified and their relative significance. The data shows that there are substantial exports from the sub-region of both crushed rock and sand and gravel, with the former being most significant in volume terms. There are substantial exports to destinations both within and beyond the boundary of the Yorkshire and Humber region. The principle export destinations within the Region are West and South Yorkshire. Principal export destinations outside the Region are the North West and North East regions. Some data is available on exports by MPA origin and this suggests that the most significant movements are exports of crushed rock from the YDNP to destinations outside the Y&H region, particularly to the North West Region, and to destinations elsewhere within the Y&H region. Sales of sand and gravel from NYCC to the NE region are also very significant. There are also substantial flows of crushed rock from NYCC to the North East region and important movements of sand and gravel and crushed rock from NYCC to both the West and South Yorkshire sub-regions. Principal imports from outside the sub-region are crushed rock from Cumbria and Derbyshire, with lesser amounts from Durham and Wakefield, although these movements are generally of much smaller scale than the exports referred to above. The most significant source of imports of sand and gravel is the East Riding, although the overall amount imported is small relative to exports from North Yorkshire. Very small amounts of sand and gravel are also imported into the sub-region from sources including Cumbria, Durham and Doncaster. Small amounts of marine sand and gravel are also imported from South Tyneside and Stockton on Tees.
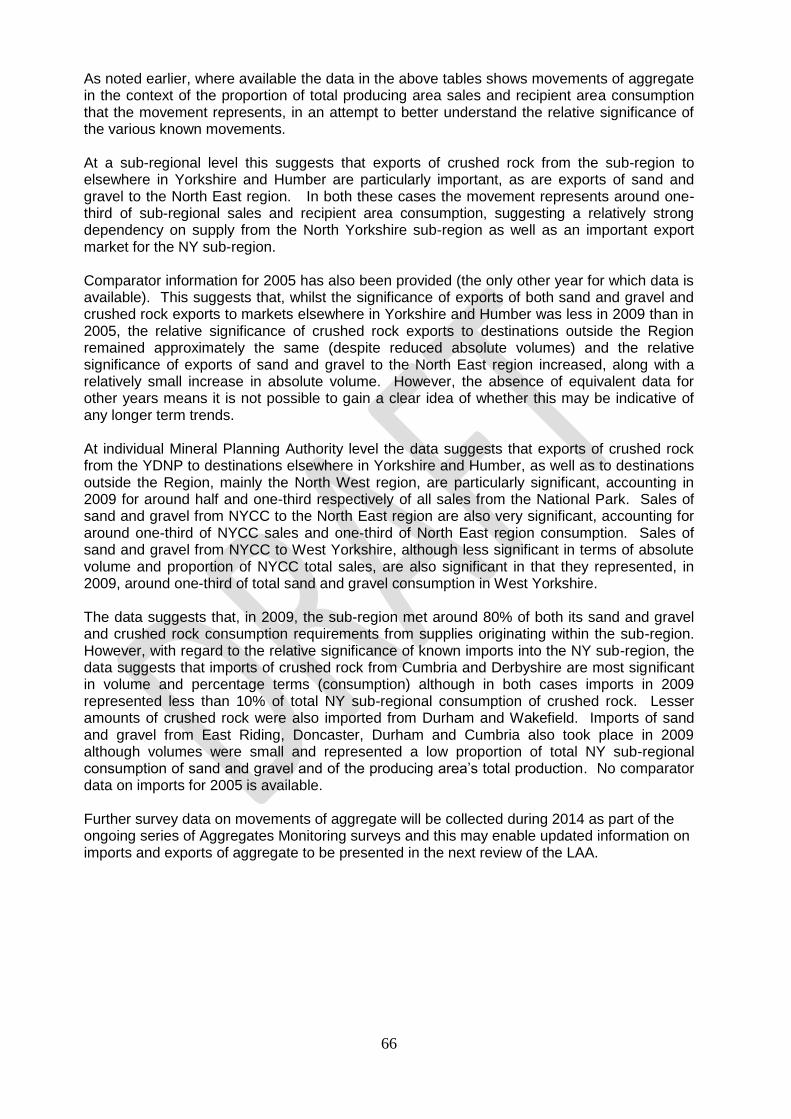
66
As noted earlier, where available the data in the above tables shows movements of aggregate in the context of the proportion of total producing area sales and recipient area consumption that the movement represents, in an attempt to better understand the relative significance of the various known movements. At a sub-regional level this suggests that exports of crushed rock from the sub-region to elsewhere in Yorkshire and Humber are particularly important, as are exports of sand and gravel to the North East region. In both these cases the movement represents around one-third of sub-regional sales and recipient area consumption, suggesting a relatively strong dependency on supply from the North Yorkshire sub-region as well as an important export market for the NY sub-region. Comparator information for 2005 has also been provided (the only other year for which data is available). This suggests that, whilst the significance of exports of both sand and gravel and crushed rock exports to markets elsewhere in Yorkshire and Humber was less in 2009 than in 2005, the relative significance of crushed rock exports to destinations outside the Region remained approximately the same (despite reduced absolute volumes) and the relative significance of exports of sand and gravel to the North East region increased, along with a relatively small increase in absolute volume. However, the absence of equivalent data for other years means it is not possible to gain a clear idea of whether this may be indicative of any longer term trends. At individual Mineral Planning Authority level the data suggests that exports of crushed rock from the YDNP to destinations elsewhere in Yorkshire and Humber, as well as to destinations outside the Region, mainly the North West region, are particularly significant, accounting in 2009 for around half and one-third respectively of all sales from the National Park. Sales of sand and gravel from NYCC to the North East region are also very significant, accounting for around one-third of NYCC sales and one-third of North East region consumption. Sales of sand and gravel from NYCC to West Yorkshire, although less significant in terms of absolute volume and proportion of NYCC total sales, are also significant in that they represented, in 2009, around one-third of total sand and gravel consumption in West Yorkshire. The data suggests that, in 2009, the sub-region met around 80% of both its sand and gravel and crushed rock consumption requirements from supplies originating within the sub-region. However, with regard to the relative significance of known imports into the NY sub-region, the data suggests that imports of crushed rock from Cumbria and Derbyshire are most significant in volume and percentage terms (consumption) although in both cases imports in 2009 represented less than 10% of total NY sub-regional consumption of crushed rock. Lesser amounts of crushed rock were also imported from Durham and Wakefield. Imports of sand and gravel from East Riding, Doncaster, Durham and Cumbria also took place in 2009 although volumes were small and represented a low proportion of total NY sub-regional consumption of sand and gravel and of the producing area’s total production. No comparator data on imports for 2005 is available. Further survey data on movements of aggregate will be collected during 2014 as part of the ongoing series of Aggregates Monitoring surveys and this may enable updated information on imports and exports of aggregate to be presented in the next review of the LAA.
67
Appendix 3 Demand forecasting for the North Yorkshire County Council, City of York and North York Moors National Park Authority Minerals and Waste Joint Plan i) Demand for aggregate arises from a wide range of construction activity. The extent and nature of activity in the construction sector of the economy will therefore be a key influence on the amount and types of aggregate required. Activity in the construction sector will itself be influenced by wider economic conditions as well as the effects of a range of plans and strategies for future growth. Construction activity has been heavily impacted by recent recession, as demonstrated by the recent trend in sales of aggregate and this is reflected in current 10 year average sales. Although there has been recent growth in the economy, there is some uncertainty about the future economic outlook. ii) In July 2014 NYCC, CYC and the NYMNPA produced and consulted on a Discussion Paper on demand forecasting (which is available via the Minerals and Waste Joint Plan web pages) as part of work towards preparation of a Joint Minerals and Waste Plan for the three Authority areas. This identified a range of issues that could be relevant to generating a forecast of demand for aggregate (particularly sand and gravel) for the area covered by the Joint Plan. It considered a range of methods including linking future demand to general growth in the economy, growth in population and growth in house building. It also considered how supply constraints outside the area could impact on demand for aggregate originating within it. The Paper recognised a number of difficulties and uncertainties around forecasting demand but suggested an approach based on linking future demand to the predicted rate of change in the amount of house building across the main market areas served by the Plan, in order to generate an additional ‘increment’ of demand to add to the historic sales average. It also identified two specific issues relating to the potential impact of future supply constraints in West and South Yorkshire and made a further incremental allowance for these, in order to generate an overall forecast for sand and gravel. iii) In summary the methodology looked at previous housing completions over a 10 year period 2003/4 to 2012/13 for the main market areas served by the Plan area (ie North Yorkshire, West Yorkshire, South Yorkshire and Tees Valley) and compared this with projected house building rates over the same geographical area as set out in adopted or emerging local plans. Using the most up to date data available at the time of preparation of this revised LAA (see summary in Appendix 4) this indicates a 53%51 uplift in house building compared with previous rates. It then assumed that house building accounts for 15% of total demand for sand and gravel (based on a figure quoted by the Construction Products Association52) and then ‘grew’ 15% of total sales by 53% in order to generate an increment to add to the 10 year historic sales figure. Further allowances were then made to reflect the impact of possible supply constraints in West and South Yorkshire and the effect these could have on demand for sand and gravel in the Plan area. These allowances were added on to the overall projected figure to generate a total forecast of demand53. iv) Whilst this approach helps address some of the concerns associated with relying solely on a historic sales average, it also has a number of disadvantages. There is uncertainty about the exact nature of the link between house building and demand for sand and gravel; robust
51
The equivalent figure used in the Forecasting Demand for Aggregates Minerals Paper (July 2014), based on earlier data 0n housing completions and projections, was 85%. More recent information in the draft Tees valley Joint LAA (February 2015) indicates a slightly higher proposed housing growth figure compared with that provided in Appendix 4 but this is not considered to be significant in the context of the overall total. 52
Eg Construction Products Association Press Release 14 April 2014. 53
The methodology used for this is explained in the Forecasting Demand for Aggregates Minerals Paper (July 2014).

68
data on past housing completions is not available over a long time period and projected future housing requirements are also subject to change as local plans are prepared and reviewed. Furthermore, industry has expressed the view that such an approach may not be appropriate for predicting future demand for crushed rock. v) In response to the July 2014 Discussion Paper the Mineral Products Association raised a number of further issues and suggested an alternative approach to linking future demand to housing growth, by assuming that housing growth represents a proxy for total demand for sand and gravel rather than just 15%, reflecting the relationship between house building and other related infrastructure requirements which may generated demand for aggregate. The Councils had some concerns about this suggested methodology, particularly with regard to the assumptions made about the use of house building as a proxy for total demand (for example this LAA concludes elsewhere that the impact of major infrastructure projects in the area on overall demand is expected to be neutral) and in relation to the likelihood that some increased demand arising from house building outside the NY Sub-region would be likely to fall on other supply areas. It is not therefore considered appropriate to carry it forward for the purposes of this LAA. vi) A potential approach would be to assume that house building is a proxy for 50% of total demand. This would in effect allow an additional element for demand related to house building, such as associated infrastructure and employment development, whilst recognising that there is also uncertainty about the exact nature of the link between house building and demand, that major infrastructure projects are expected to have a neutral impact on demand across the Sub-region and that local housing trajectories are subject to change including potential downward revision in some cases. Based on the current 10 year average sales figure of 2.1mt this approach would lead to an additional 0.56mt pa of demand for sand and gravel. A further consideration with this methodology is that it is considered unlikely that increased demand generated by growth in house building will step up immediately to the predicted higher level, taking into account current low levels of sales and an expectation that rates of house building may increase over time as the economy recovers and local plans are implemented. Therefore if this method were utilised it may be appropriate to assume a progressive build up in demand over a five year period to the projected higher level of 2.66mtpa (see Table 29). vii) A further issue, addressed elsewhere in the LAA and in the Demand Forecasting discussion paper (July 2014), is the expectation that supply constraints in West and South Yorkshire may result in additional demand for concreting sand and gravel being ‘transferred’ onto North Yorkshire. More information about this is contained in the Discussion Paper and in subsequent sections in the LAA dealing with other factors which might impact on demand. The assumed effect of these factors is to lead to a total additional demand of around 1.5mt. viii) Consideration also needs to be given to the potential impact on demand of major ‘one-off’ infrastructure projects that could give rise to a significant additional requirement for aggregate. ix) Work commenced in 2014 on an upgrade of the A1(T) between Leeming and Barton to motorway standard. Approval has also been given for construction of the Bedale, Aiskew and Leeming bypass in North Yorkshire and work is now commencing. Both of these projects are likely to give rise to a requirement for significant quantities of aggregate. However, A1 upgrading has been proceeding progressively within the Sub-region over a substantial number of years and any associated demand is already likely to be reflected in sales over recent years and hence would be reflected in the scale of any future requirements identified through a historic averaging method. Permission has also been granted for the supply of 0.4mt of aggregate from a borrow pit to serve the current upgrading works, thus partially offsetting demand on established supply sources. Although A1 upgrading work in North Yorkshire is now substantially complete or underway, the Chancellor announced on 1st December 2014 that a number of specific road improvement schemes around the country are to be funded.
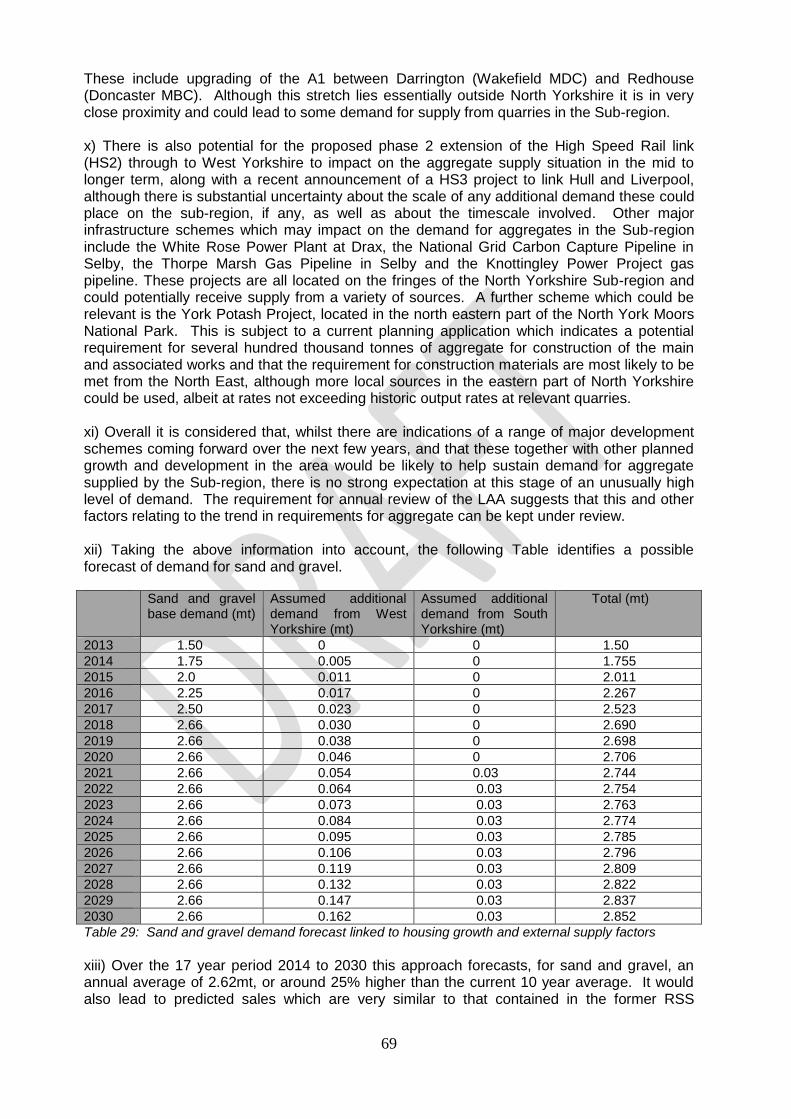
69
These include upgrading of the A1 between Darrington (Wakefield MDC) and Redhouse (Doncaster MBC). Although this stretch lies essentially outside North Yorkshire it is in very close proximity and could lead to some demand for supply from quarries in the Sub-region. x) There is also potential for the proposed phase 2 extension of the High Speed Rail link (HS2) through to West Yorkshire to impact on the aggregate supply situation in the mid to longer term, along with a recent announcement of a HS3 project to link Hull and Liverpool, although there is substantial uncertainty about the scale of any additional demand these could place on the sub-region, if any, as well as about the timescale involved. Other major infrastructure schemes which may impact on the demand for aggregates in the Sub-region include the White Rose Power Plant at Drax, the National Grid Carbon Capture Pipeline in Selby, the Thorpe Marsh Gas Pipeline in Selby and the Knottingley Power Project gas pipeline. These projects are all located on the fringes of the North Yorkshire Sub-region and could potentially receive supply from a variety of sources. A further scheme which could be relevant is the York Potash Project, located in the north eastern part of the North York Moors National Park. This is subject to a current planning application which indicates a potential requirement for several hundred thousand tonnes of aggregate for construction of the main and associated works and that the requirement for construction materials are most likely to be met from the North East, although more local sources in the eastern part of North Yorkshire could be used, albeit at rates not exceeding historic output rates at relevant quarries. xi) Overall it is considered that, whilst there are indications of a range of major development schemes coming forward over the next few years, and that these together with other planned growth and development in the area would be likely to help sustain demand for aggregate supplied by the Sub-region, there is no strong expectation at this stage of an unusually high level of demand. The requirement for annual review of the LAA suggests that this and other factors relating to the trend in requirements for aggregate can be kept under review. xii) Taking the above information into account, the following Table identifies a possible forecast of demand for sand and gravel.
Sand and gravel base demand (mt)
Assumed additional demand from West Yorkshire (mt)
Assumed additional demand from South Yorkshire (mt)
Total (mt)
2013 1.50 0 0 1.50
2014 1.75 0.005 0 1.755
2015 2.0 0.011 0 2.011
2016 2.25 0.017 0 2.267
2017 2.50 0.023 0 2.523
2018 2.66 0.030 0 2.690
2019 2.66 0.038 0 2.698
2020 2.66 0.046 0 2.706
2021 2.66 0.054 0.03 2.744
2022 2.66 0.064 0.03 2.754
2023 2.66 0.073 0.03 2.763
2024 2.66 0.084 0.03 2.774
2025 2.66 0.095 0.03 2.785
2026 2.66 0.106 0.03 2.796
2027 2.66 0.119 0.03 2.809
2028 2.66 0.132 0.03 2.822
2029 2.66 0.147 0.03 2.837
2030 2.66 0.162 0.03 2.852
Table 29: Sand and gravel demand forecast linked to housing growth and external supply factors
xiii) Over the 17 year period 2014 to 2030 this approach forecasts, for sand and gravel, an annual average of 2.62mt, or around 25% higher than the current 10 year average. It would also lead to predicted sales which are very similar to that contained in the former RSS

70
apportionment (2.63mtpa - see Table 17) and the hypothetical sub-regional apportionment of the 2009 National and Regional Guidelines (2.68mtpa - see Table 18). The figure is also similar to typical pre-recession sales. xiv) A further and more straightforward alternative approach would be to add a simple percentage uplift to the 10 year historic sales average. This would reflect a general expectation of future growth in demand for aggregate in response to increased rates of house building and associated infrastructure, as well as reflecting the fact that the current 10 year average sales figure is heavily influenced by recession and is substantially lower than ‘typical’ pre-recession levels. An uplift of 25% for both sand and gravel and crushed rock would lead to figures of 2.63mt and 4.13mt respectively averaged over the period 2014 to 2030. The following table compares the outcome of the various methods considered. Forecast Method Sand and gravel (mt) Crushed rock (mt)
10 year average sales (total 2014-2030) 35.7 56.1
10 year average sales (annual equivalent) 2.1 3.3
Linked to house building (total 2014-2030) 44.5 N/A
Linked to house building (annual equivalent) 2.62 N/A
25% uplift (total 2014-230) 44.7 70.2
25% uplift (annual equivalent) 2.63 4.13
Former RSS apportionment (total 2014-2030) 44.7 78.7
Former RSS apportionment (annual equivalent) 2.63 4.63
Hypothetical apportionment of 2009 Guidelines (total 2014-2030)
45.6 65.3
Hypothetical apportionment of 2009 Guidelines (annual equivalent)
2.68 3.84
Table 30: Comparison of potential approaches to demand forecasting xv) The implications of the above approaches to forecasting on potential shortfalls in aggregate over the period to 2030 are summarised in Table 31 below. Forecast Method Sand and Gravel (mt) Crushed Rock (NYCC
area only) (mt) Total requirement 2014-2030 (10 year average sales method)
Requirement 35.7 56.1
Reserves 18.6 104.4
Shortfall 17.1 Nil
Total requirement 2014-2030 (Link to housing growth/external supply factors method)
Requirement 44.5 N/A
Reserves 18.6 N/A
Shortfall 25.9 N/A
Total requirement 2014-2030 (25% uplift on 10 year average method)
Requirement 44.7 70.2
Reserves 18.6 104.4
Shortfall 26.1 Nil
Total requirement 2014-2030 (Hypothetical apportionment of 2009 Guidelines method)
Requirement 45.6 65.3
Reserves 18.6 104.4
Shortfall 27.0 Nil
Table 31: Indicative shortfalls to 2030 by forecast method
Conclusions on approach to forecasting demand to 2030
xvi). A number of potential approaches to predicting future demand for the NYCC area have been considered during preparation of this LAA. Local factors likely to influence the scale of demand have been taken into account, including factors arising outside the NY Sub-region. Consideration has also been given to ten year and three year average historic sales levels

71
and the content of former and current national and regional guidelines for aggregates, as well as previous sub-regional apportionments. In considering demand, account needs to be taken of the fact that current 10 year average sales (and three year average sales in particular) are strongly affected by the recent recession.
xvii) The requirement in national policy and guidance for account to be taken of other local factors indicates that relying solely on current 10 year average sales as a basis for predicting future requirements, as suggested in the first NY Sub-region LAA, is unlikely to be appropriate. Local information does suggest that there is a reasonable expectation of increased demand, particularly for sand and gravel, compared with the current 10 year average level. This arises mainly as a result of expected significant growth in house building across markets served by the Sub-region and the likelihood that house building will, in turn, give rise to a requirement for other built infrastructure generating demand for aggregate. xviii) However the wide range of factors that may impact on demand, and the difficulties of establishing a clear, quantifiable link between any particular factor and the scale of demand for aggregate that may fall on the area, is a significant constraint to deriving a robust forecast. xviv) However, there is a high degree of consistency between a forecast for sand and gravel derived through a link to growth in house building and the level of demand which persisted prior to the recent recession. There is also a good degree of consistency with the level of demand envisaged in the previous sub-regional apportionment set out in the former RSS, and with a theoretical sub-regional apportionment of the current (2009) National and Regional Guidelines on the same basis. Together, these factors suggest that the approach, combined with a further allowance for external factors which may impact on demand for sand and gravel, should be sufficiently robust for current forward planning purposes. Such an approach leads to predicted demand for sand and gravel of around 2.62mt annual equivalent averaged over the period 2014 to 2030, with an overall upward trend in demand from 1.7mt in 2014 to 2.85mt in 2030. This level of predicted demand is around 25% higher than that derived purely on the basis of 10 year average sales. xx) For crushed rock, aggregates industry representatives have expressed the view that there is more uncertainty about the future level of demand. In general terms it is likely that there will be some growth in demand for crushed rock, compared with recent low levels of sales, in response to general growth in the economy and, to some extent, the influence of other factors such as predicted higher rates of house building. However, the market for crushed rock is wider than for sand and gravel, with a wider range of opportunities for delivering supply to key markets also served by the NY Sub-region54. The current high level of reserves of crushed rock in the NY Sub-region also suggests that the precise level of any forecast demand is of less significance, in terms of the implications for delivery of future supply, than is the case for sand and gravel. The various approaches considered in this LAA range above and below an annual equivalent level of 4mt, compared with current 10 year average sales in the NYCC area of around 3.3mt. It is therefore considered reasonable to assume an annual demand of around 3.75 mt per annum for the NYCC area for current forward planning purposes. xxi) If this approach to future demand is adopted then, in accordance with the advice in National Planning Practice Guidance that landbanks should be calculated on the basis of the annual demand figure contained in the most recent Local Aggregates Assessment, current (end 2013) landbanks in the NYCC area would be as follows:
54
This statement may not apply to more scarce types of crushed rock, particularly high psv aggregate, which is
very limited in distribution

72
Reserves at end 2013 (mt)
Annual forecast demand (mt)
Landbank at end 2013 (years)
Sand and gravel (total) 18.6 2.62 7.1
Sand and gravel (northwards)
7.0 (1.07) 6.5
Sand and gravel (southwards)
10.7 (1.39) 7.7
Building sand 0.9 (0.16) 5.6
Crushed rock (all) (NYCC only)
104.4 3.75 27.8
Table 32: Landbanks at end 2013 calculated in accordance with proposed demand forecast

73
Appendix 4 - Summary data on housing completions and future requirements
The following table compares historic completions with projected future requirements. A 10
year period has been used in each case in in order to facilitate comparison with 10 year
average aggregate sales data and the availability of 10 year housing completions data in local
authority AMRs
Sub-region Actual completions
2003/4-2012/13 10 year forecast requirements 2015-2024
% change
West Yorkshire 69,406 107,828 +55%
South Yorkshire 38,835 52,292 +35%
North Yorkshire 23,904 41,830 +75%
Tees Valley 14,268 21,78055
+53%
Total 146,413 223,730 +53%
Table 33: Comparison of 10 year forecast requirements 2015-2024 for key aggregate market areas and actual completions for the 10 year period 2003/4-2012/13
55
More recent information in the draft Tees Valley Joint Local Aggregates Assessment (February 2013) indicates
that this figure is now 23,954
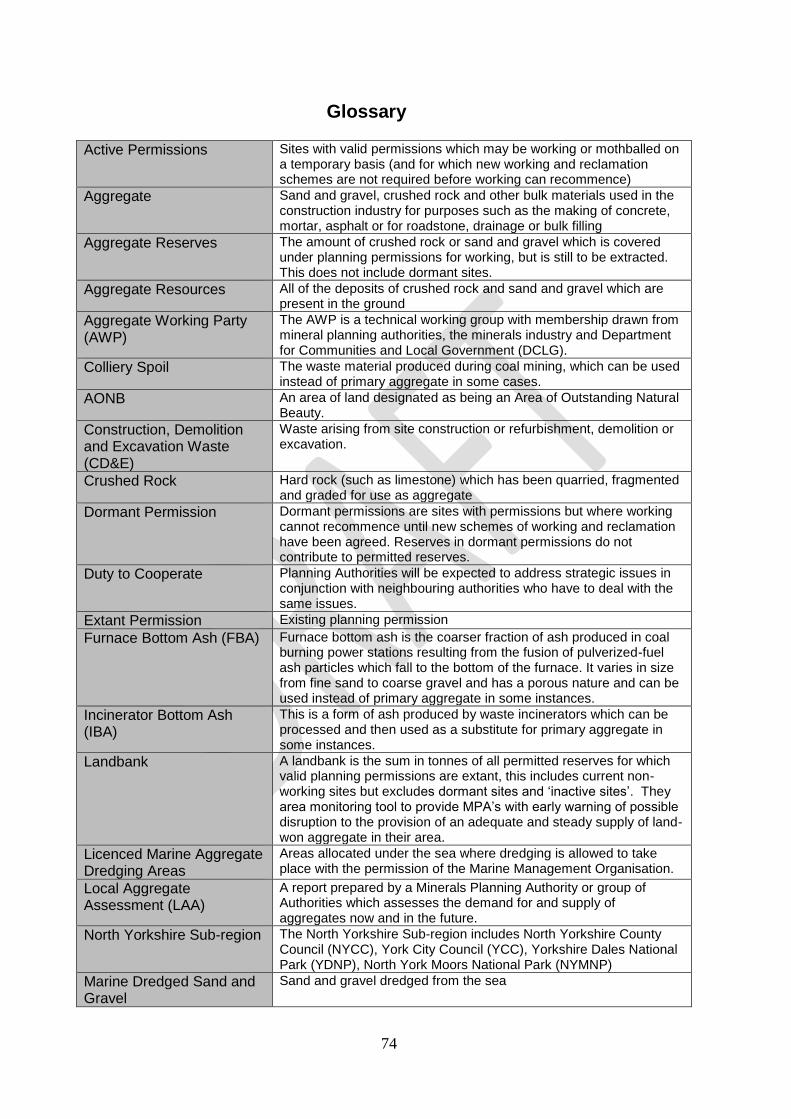
74
Glossary Active Permissions Sites with valid permissions which may be working or mothballed on
a temporary basis (and for which new working and reclamation schemes are not required before working can recommence)
Aggregate Sand and gravel, crushed rock and other bulk materials used in the construction industry for purposes such as the making of concrete, mortar, asphalt or for roadstone, drainage or bulk filling
Aggregate Reserves The amount of crushed rock or sand and gravel which is covered under planning permissions for working, but is still to be extracted. This does not include dormant sites.
Aggregate Resources All of the deposits of crushed rock and sand and gravel which are present in the ground
Aggregate Working Party (AWP)
The AWP is a technical working group with membership drawn from mineral planning authorities, the minerals industry and Department for Communities and Local Government (DCLG).
Colliery Spoil The waste material produced during coal mining, which can be used instead of primary aggregate in some cases.
AONB An area of land designated as being an Area of Outstanding Natural Beauty.
Construction, Demolition and Excavation Waste (CD&E)
Waste arising from site construction or refurbishment, demolition or excavation.
Crushed Rock Hard rock (such as limestone) which has been quarried, fragmented and graded for use as aggregate
Dormant Permission Dormant permissions are sites with permissions but where working cannot recommence until new schemes of working and reclamation have been agreed. Reserves in dormant permissions do not contribute to permitted reserves.
Duty to Cooperate Planning Authorities will be expected to address strategic issues in conjunction with neighbouring authorities who have to deal with the same issues.
Extant Permission Existing planning permission
Furnace Bottom Ash (FBA) Furnace bottom ash is the coarser fraction of ash produced in coal burning power stations resulting from the fusion of pulverized-fuel ash particles which fall to the bottom of the furnace. It varies in size from fine sand to coarse gravel and has a porous nature and can be used instead of primary aggregate in some instances.
Incinerator Bottom Ash (IBA)
This is a form of ash produced by waste incinerators which can be processed and then used as a substitute for primary aggregate in some instances.
Landbank A landbank is the sum in tonnes of all permitted reserves for which valid planning permissions are extant, this includes current non-working sites but excludes dormant sites and ‘inactive sites’. They area monitoring tool to provide MPA’s with early warning of possible disruption to the provision of an adequate and steady supply of land-won aggregate in their area.
Licenced Marine Aggregate Dredging Areas
Areas allocated under the sea where dredging is allowed to take place with the permission of the Marine Management Organisation.
Local Aggregate Assessment (LAA)
A report prepared by a Minerals Planning Authority or group of Authorities which assesses the demand for and supply of aggregates now and in the future.
North Yorkshire Sub-region The North Yorkshire Sub-region includes North Yorkshire County Council (NYCC), York City Council (YCC), Yorkshire Dales National Park (YDNP), North York Moors National Park (NYMNP)
Marine Dredged Sand and Gravel
Sand and gravel dredged from the sea

75
Minerals Planning Authority (MPA)
The Local Authority responsible for the control of mineral extraction and waste management development, through forward planning, determining of planning applications, monitoring and enforcement
Primary Aggregate Crushed rock and sand and gravel which is extracted directly from the ground.
Polished Stone Value aggregate(PSV)
High PSV aggregates are used in surfacing roads as they have a high skid resistance and so are an important mineral
Pulverised Fuel Ash (PFA) Also known as fly ash, pulverised fuel ash (PFA) is the ash resulting from the burning of pulverised coal in coal-fired electricity power stations. The ash is very fine and it is removed from the flue gases and can be used as a replacement for primary aggregate in some instances
Recycled Aggregate Can be sourced from construction and demolition waste, highway maintenance waste and excavation and utility operations and then be reused as aggregate.
Regional Spatial Strategy (RSS)
A Regional level of Strategic Planning which core strategies need to be broadly consistent with. The RSS was revoked in 2013
Sand and Gravel Rock which nature has already broken into fragments mostly by weathering and by erosion during the ice age.
Secondary Aggregate Derived from a range of materials which may be used as aggregate, including power station ash and colliery spoil
Sub Regional Apportionment
The splitting of regional supply guidelines for aggregate minerals between planning authorities or sub regions
76
Key Sources
BGS, City of York sand and gravel assessment 2013 BGS, Mineral safeguarding areas for the City of York, 2013 BGS, Minerals safeguarding areas for North York Moors National Park Authority, 2013 BGS, Minerals Yearbooks, years 2002 to 2011 BGS, North Yorkshire sand and gravel assessment, 2011 BGS, The Minerals Resources of East Inshore and East Offshore Marine Plan Areas, Southern Northern Sea. 2011 BGS, The strategic importance of the marine aggregate industry to the UK, Research Report OR/07/019, 2007 Capita Symonds, ‘The Sustainable Use of High Specification Aggregates for Skid-Resistant Road Surfacing in England’ (November 2004). Competition Commission, Aggregate, Cement and Ready-mix Concrete Market Investigation: Updated Statement of Issues, 26 November 2012 Derbyshire County Council, Derby City Council and the Peak District National Park, Local Aggregate Assessment 2013 DCLG, Collation of results of 2005 aggregate minerals survey for England and Wales. DCLG, Collation of results of 2009 aggregate minerals survey for England and Wales. DCLG, Guidance on Managed Aggregate Supply System, (MASS) 2012 DCLG, National and regional guidelines for aggregate provision in England 2001 - 2016 DCLG, National and regional guidelines for aggregate provision in England 2005 - 2020 DCLG, National Planning Policy Framework, March 2012 DCLG, Survey of arisings and use of alternatives to primary aggregates in England 2005 construction, demolition and excavation waste. Doncaster Local 2013 Government Office for Yorkshire and the Humber, 2008, Regional Spatial Strategy to 2026 HSMO, Environment Act 1995 HMSO, Localism Act 2011 HMSO, Planning and compensation Act 1991

77
Joint Local Aggregate Assessment for County Durham, Northumberland and Tyne and Wear, April 2013 North East Regional Aggregate Working Party annual reports, 2001 to 2009 North Yorkshire County Council, Minerals Local Plan 1997 NYCC, CYC, NYMNPA, Forecasting Demand for Aggregate Minerals Discussion Paper, July 2014 NYCC, CYC, NYMNA, Local Aggregates Assessment January 2013 Nottinghamshire County Council, Minerals Local Plan Background Paper: Aggregates – sand and gravel. Options for meeting shortfalls. January 2012. Nottinghamshire Minerals Local Plan, Local Aggregates Assessment, July 2013 Planning4minerals: A guide on Aggregates Tees Valley Joint Local Aggregates Assessment (Draft February 2015) The Crown Estate, Minerals Planning Briefing Note: Issue 3, Marine Aggregate Opportunities; Region Humber, May 2012 The Crown Estate, Marine Aggregate Reserves, 2008 The Crown Estate, Marine Aggregates, Summary of Statistics 2010, 2011 and 2012 Urban Vision, North Yorkshire Sub-region Waste Arisings and Capacity Evidence Project, October 2013 URS, Marine Aggregates Study, Final Report, January 2014 WRAP, Quality Protocol, Aggregates from Inert Waste: End of waste criteria for the production of aggregates from inert waste, October 2013 Yorkshire Dales National Park, Local Plan Options Consultation, September 2013 Yorkshire and Humber Regional Aggregate Working Party, YHRAWP reports 2002 to 2009 and 2012 and 2013