temperature measurement 4 - kishore karuppaswamy | …€¦ · · 2016-05-10temperature...
TRANSCRIPT

561
Temperature Measurement
4
4.1APPLICATION AND SELECTION 565
Introduction 565Orientation Tables 565International Practical Temperature
Scale 570Temperature Sensors 572
Nonelectric Temperature Sensors 572Liquid-in-Glass Thermometers 572Bimetallic Thermometers 573Filled System Thermometers 573Bistate/Phase Change Sensors 573
Electronic Thermometers/Sensors 573Thermocouples 573Resistance Temperature Detectors 574Thermistors 575Radiation Pyrometers 575Solid-State Sensors 578Heat-Flow and Thermal-Conductivity
Sensors 578Intelligent Transmitters and Remote
Input/Output (I/O) 579Fieldbus Structures 580Advanced Transmitters 580
Temperature Measurement Applications 581High Temperature Measurement 581Speed of Response 581Surface Measurement 581Measuring the Temperature of Solids 582Averaging Measurements 584Narrow Span Measurements 584
Installation Considerations 584Temperature Transmitters in Place of Direct
Wiring 584Lower Wiring Costs 584Protect Signals from Plant Noise 584Stop Ground Loops 586Reduce Hardware and Stocking
Costs 586Match the Best Sensor to the
Application 586Enhance Accuracy and Stability 586Simplify Engineering and Prevent
Miswiring 586Ease Future Upgrades 586Lower Maintenance Time and
Expense 586Avoid Lead Wire Imbalances 587
Calibration/Certification 587Agency Approvals for Hazardous
Areas 587Safety-Related Applications 587
References 588Bibliography 588
4.2BIMETALLIC THERMOMETERS 590
Bimetallic Springs 591Thermometers 591Dial Orientation and Size 592Advantages and Disadvantages 592
Bibliography 592
© 2003 by Béla Lipták

562
Temperature Measurement
4.3CALIBRATORS AND SIMULATORS 594
Temperature Calibration Baths 595Simulators 596Conclusions 596Bibliography 596
4.4CONES, CRAYONS, LABELS, PAINTS, ANDPELLETS 599
Introduction 600Color Indicators 600
Paints and Pellets 600Crayons 600
Pyrometric Cones 601The Ceramics Industry 601Bar and Hole Indicators 602
Engine Test Research 603References 603Bibliography 603
4.5FIBER-OPTIC THERMOMETERS 604
Thermometer Design 605The Optical Fiber Thermometer (OFT)
Sensors 606Conclusions 607References 608Bibliography 608
4.6FILLED-BULB AND GLASS-STEM THERMOMETERS 610
Glass-Stem Thermometers 611Filled Thermal Systems 612Bulbs, Wells, and Capillaries 612
Class I: Liquid-Filled Systems 614Class II: Vapor Systems 615
Class IIA Systems 615Class IIB Systems 615Class IIC Systems 616Class IID Systems 616
Class III: Gas-Filled Systems 616Class V: Mercury-Filled Systems 617
Ambient-Temperature Compensation 617Effects of Bulb Elevation 618Barometric Errors 619Conclusions 619Reference 619Bibliography 619
4.7INTEGRATED CIRCUITRY TRANSISTORS AND DIODES 620
Introduction 620Integrated Circuit Temperature Sensors 621Diode-Type Temperature Sensors 621Reference 622Bibliography 622
4.8MISCELLANEOUS AND DISCONTINUED SENSORS 623
Self-Measuring Devices 623Acoustic Time Domain Reflectometry 624Carbon Resistors 624Capacitance Cable for Detecting Hot Spots 624Fluidic Sensors 625Johnson Noise Thermometer 625Liquid Crystals 625Paramagnetic Salts 625Spectroscopic Temperature Measurement 626Thermography 626Fiber Bragg Grating Temperature Sensors 626Discontinued Temperature Sensors 626
Pneumatic and Suction Pyrometers 626Suction Pyrometers 626Pneumatic Pyrometers 627
Quartz Crystal Thermometry 627Advantages and Disadvantages 628
References 629Bibliography 629
4.9RADIATION AND INFRARED PYROMETERS 630
Introduction 631Theoretical Relationships 632
The Theoretical and Real Targets 633Emittance, Emissivity 633
Selecting the Radiation Pyrometer 634Radiation Pyrometer Designs 635
Total Radiation Pyrometers 635Narrow-Band Pyrometers 635Ratio Pyrometers 636Manual Optical Pyrometers 637Automatic Optical and IR Pyrometers 638
Detectors 638Thermal Detectors 638Photo-Detectors 639
Selection 639Installations and Accessories 640Advances and New Developments 641Summary 641
Advantages 642Disadvantages 642
© 2003 by Béla Lipták

Contents of Chapter 4
563
Definitions 642Reference 643Bibliography 643
4.10RESISTANCE TEMPERATURE DETECTORS 645
Resistance Temperature Detector Basics 647Detectors and Their Applications 647
Industrial RTD Construction Requirements 648Platinum RTDs 648Base-Metal RTDs 649
Balco 649Copper 649
Measuring the RTD Resistance 649Two-Wire RTDs 649Three-Wire RTDs 650Four-Wire RTDs 651
Sensor Construction 652Thermowells 653Installation 653
Transmitters 654Intelligent Transmitters 654A/D Converters, Digital Protocols 655
Advantages and Limitations 655Reference 655Bibliography 655
4.11TEMPERATURE SWITCHES AND THERMOSTATS 657
Introduction 658Electronic Temperature Switches 658
Input from Transmitter 659Input Directly from Sensor 659Installation Considerations 659
In The Control Room 659Field Mounting 660
Availability and Reliability 660Electromechanical Temperature Switches 660
Features Required for Industrial Applications 661
Safety Considerations 661Thermostats 661
Electromechanical Designs 661Pneumatic Designs 662
Pneumatic-Bimetallic 662Throttling 662Offset Error 662Design Features 663Advanced Features 663
Adjustable Gains or Proportional Bands 663
Dual Set Points 663
Limited Control Range 663Zero Energy Band Control 663Split Range Control 663
Electrical/Electronic Designs 664Recent Advances 664Bibliography 665
4.12THERMISTORS 666
Introduction 667Historical Note 667Resistance-Temperature Characteristic 667Sensor Types 668Temperature Measurement 668
Microammeter Readout 668Wheatstone Bridge 669Digital Instrumentation 670
Thermistors Combined with Resistors 670Self-Heating Effect 670Applications 671Calibration and Testing 671Advantages and Limitations 671References 672Bibliography 672
4.13THERMOCOUPLES 673
Theory of Operation 675Interpreting the Generated Voltage 675Laws of Intermediate Temperatures and
Metals 676Cold Junction Compensation 676Multiplexing 678Hardware Compensation 678
Measuring the EMF Generated 678Transmitter Location and Noise 679Intelligent Transmitters 679
Thermocouple Types 679ISA Types J, S, and T 679ISA Types B, E, K, R, and N 679
Thermocouple Construction and Protection 682Measuring Junction Designs 682Extension Wires 682Sheath Materials 683Thermowells 683Surface Temperature Detectors 684Specialized Detectors 684
Needle Sensors 684Suction Pyrometers 685
Installation and Protection 685Multiple Thermocouples 685
Average Temperatures and Temperature Differences 685
© 2003 by Béla Lipták

564
Temperature Measurement
Thermopiles 685Thermocouple Burnout 685Protection Against Noise 686
Normal Mode Noise 687Calibration, Diagnostics,
and Transmission 687Calibration 687Diagnostics 687Transmission 687
Intelligent Transmitters 688Advantages and Limitations 688Thermocouple Tables 688
Converting Millivoltage to Temperature 694
Example 1 694Example 2 695
Converting Temperature to Millivoltage 695
Example 1 695Example 2 695
References 696Bibliography 696
4.14THERMOWELLS 697
Introduction 698Thermowell Types 698
Protection Tubes 698Sheaths 698
Thermowell Installation 699Immersion Depth 699Thermowell Time Constants 700
References 703Bibliography 703
4.15ULTRASONIC AND SONIC THERMOMETERS 705
Operating Principle 705Ranges and Applications 705Boiler/Furnace Applications 706
Conclusions 707References 707Bibliography 707
© 2003 by Béla Lipták

565
4.1 Application and Selection
D. RALL
(1969)
B. G. LIPTÁK
(1982, 1995)
L. W. MOORE, B. ADLER
(2003)
Partial List of Suppliers
: ABB (www.abb.com)Foxboro/Invensys (www.foxboro.com/temp)Honeywell (www.iac.honeywell.com/ichome)Hukseflux (www.hukseflux.com)Kamstrup (www.kamstrup-process.com)Mathis Instruments Ltd. (www.mathis.unb.ca)Moore Industries-International Inc. (www.miinet.com/products/ca_temperature.shtml)Rosemount/Emerson (www.rosemount.com/products/temperature/)Siemens (www.sea.siemens.com)Yokogawa (www.yokogawa.com)
INTRODUCTION
Temperature is as fundamental a physical concept as the threebasic quantities of mechanics: mass, length, and time. Tem-perature is an expression that denotes a physical conditionof matter. Yet, the idea of temperature is a relative one, arrivedat by a number of conflicting theories. Classic kinetic theorydepicts heat as a form of energy associated with the activityof the molecules of a substance. These minute particles ofall matter are assumed to be in continuous motion that issensed as heat. Temperature is a measure of this heat.
To standardize on the temperature of objects under vary-ing conditions, several scales have been devised. The Fahr-enheit scale arbitrarily assigns the number 32 to the freezingpoint of water and the number 212 to the boiling point ofwater. The interval is divided into 180 equal parts. The Cen-tigrade or Celsius scale defines the freezing point of the waterto be 0, and its boiling point to be 100.
In line with the classic theory, some relation to the pointwhere molecular motion is at a minimum had to be estab-lished, and the Kelvin scale, using Centigrade divisions, wasdrawn. Zero Kelvin was determined to be 273.19
°
C. TheRankine scale places its zero at 459.61
°
F and uses Fahrenheitdivisions in the same arbitrary way in which Lord Kelvinused the Celsius scale.
Orientation Tables
The range in temperature within the universe varies 18 ordersof magnitude. It ranges from the near absolute zero of blackspace to the billions of degrees in the nuclear fusion processdeep within the stars. But the practical range on earth can be
considered as extending from 1
°
R upward about 5 decadesto around 20,000
°
R. This is still a tremendous range, and nosingle sensor could possibly cover it.
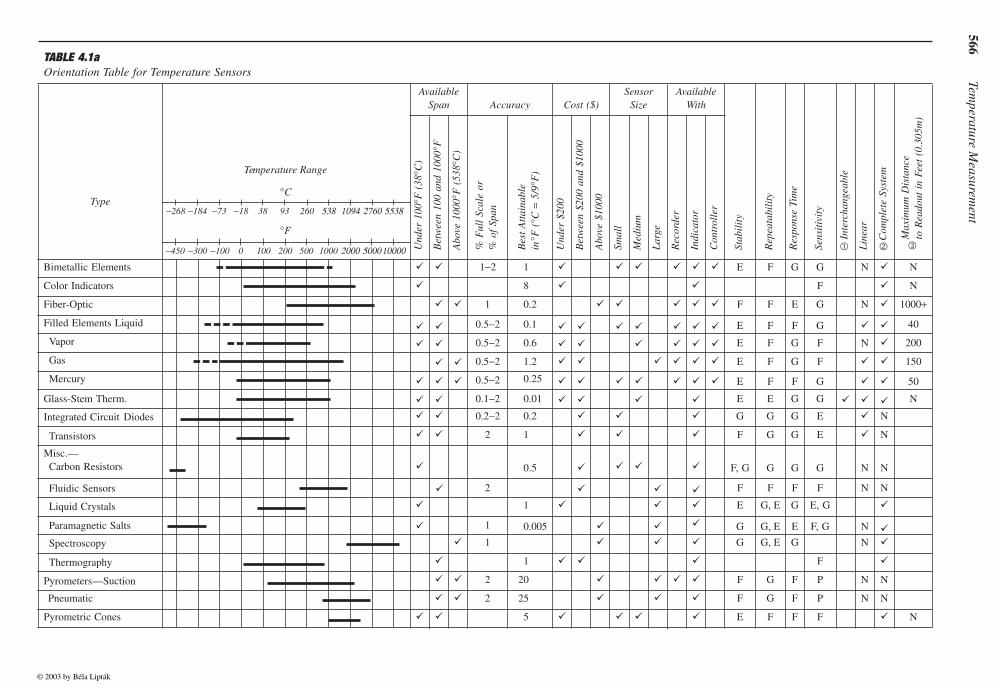
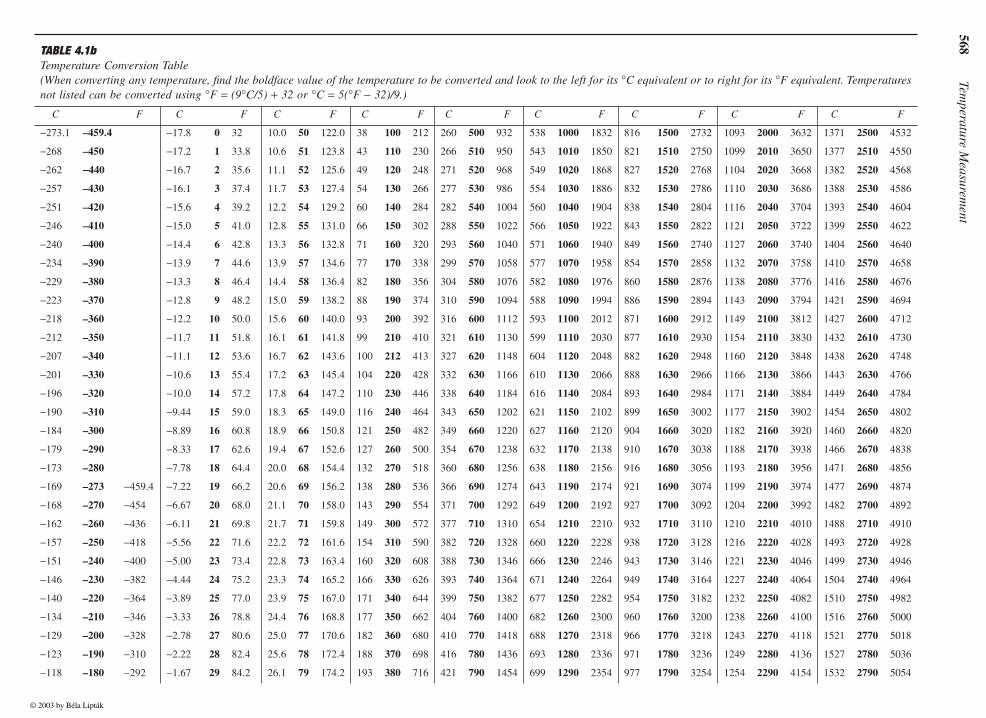
Table 4.1a provides the reader of this handbook with anorientation table containing information on the ranges and otherfeatures of the various temperature sensors. Table 4.1b is a con-version table, which is convenient when one has to go fromFahrenheit to Centigrade units and back. Therefore, one of therestrictions on the temperature sensor concerns the temperaturerange over which it can stay reasonably accurate. Table 4.1c pro-vides the approximate temperature ranges of each sensor type.The many types of sensors are listed on the left, while some oftheir characteristics are shown horizontally across the top. If itis not known what general type of sensor will do a specific job,the table can help point the way to the right selection.
Once the class of sensors has been found, the data in thetable will give a rough idea of the applicability of that design.When the possible choices of selection have been narrowed downto a few instrument types, the reader should turn to the corre-sponding sections of this chapter. In the front of each sectionthere is a listing of range, accuracy, cost, and vendors. Inspectingthese briefly, one can determine if the instrument generally meetsthe requirements or not. If it does, one should read the sectionfor a description of the design and its available variations in detail.If some of the features are unacceptable, one should proceed tothe next choice noted in the orientation table (Table 4.1a).
Temperature sensors should be selected to meet the require-ments of specific applications. Sensor Selection Table 4.1d canassist the reader in this task.
1
If the application engineer deter-mines the required temperature range, the nature of the infor-mation required (point or average temperature), and the natureof the process environment, this table can be used to determine
© 2003 by Béla Lipták
566
Temperature M
easurement
TABLE 4.1aOrientation Table for Temperature Sensors
Available Span Accuracy Cost ($)
Sensor Size
Available With
Type
Temperature Range
Und
er 1
00°F
(38
°C)
Bet
wee
n 10
0 an
d 10
00°F
Abo
ve 1
000°
F (
538°
C)
% F
ull
Scal
e or
% o
f Sp
an
Bes
t A
ttai
nabl
ein
°F (
°C =
5/9
°F)
Und
er $
200
Bet
wee
n $2
00 a
nd $
1000
Abo
ve $
1000
Smal
l
Med
ium
Lar
ge
Rec
orde
r
Indi
cato
r
Con
trol
ler
Stab
ilit
y
Rep
eata
bili
ty
Res
pons
e Ti
me
Sens
itiv
ity
Inte
rcha
ngea
ble
Lin
ear
Com
plet
e Sy
stem
Max
imum
Dis
tanc
eto
Rea
dout
in
Feet
(0.
305m
)
Bimetallic Elements 1−2 1 E F G G N N
Color Indicators 8 F N
Fiber-Optic 1 0.2 F F E G N 1000+
Filled Elements Liquid 0.5−2 0.1 E F F G 40
Vapor 0.5−2 0.6
E F G F N 200
Gas 0.5−2 1.2 E F G F 150
Mercury 0.5−2 0.25 E F F G 50
Glass-Stem Therm. 0.1−2 0.01 E E G G N
Integrated Circuit Diodes 0.2−2 0.2 G G G E N
Transistors 2 1 F G G E N
Misc.—Carbon Resistors 0.5 F, G G G G N N
Fluidic Sensors 2 F F F F N N
Liquid Crystals 1 E G,
,
E G E, G
Paramagnetic Salts 1 0.005 G G E E F, G N Spectroscopy 1 G G, E G N
Thermography 1 F
Pyrometers —Suction 2 20 F G F P N N
Pneumatic 2 25 F G F P N N
Pyrometric Cones 5 E F F F N
−268 −184 −73 −18 38 93 260 538 1094 2760 5538
−450 −300 −100 0 100 200 500 1000 2000 5000 10000
°F
°C
© 2003 by Béla Lipták

4.1A
pplication and Selection
567
Radiation Pyrometers—Optical & Ratio 1–2 2–10 F F G G N 100
Narrow & Wide Band 0.5–2 5 F F E G N 100
Quartz Crystals 0.1 0.2 E G G E N 1000
Resistance Bulbs—Nickel 0.25 0.3 G, E E G E N N 1000
Platinum 0.15 0.2 E E G G, E N 3000
Thermistors 0.2 0.02 F G E E N N 3000
Thermocouples—
Type T 0.1 1.5 G G G G N N 3000
Type J 0.1 2.5 G G G G N N 3000
Type K 0.1 2.5
G G G G N 3000
Types R & S 0.1 4 G G E E N N 3000
Ultrasonic 5 G F, G E E, G N N
N–No or NoneE–ExcellentG–GoodF–Fair
Terminology Interchangeable sensor, without recalibration of entire system.
Without special compensation.
system is not considered to be complete. System is complete when sensor and readout is sold as a single unit. When several readouts can be used with the same sensor,
Recommended
Available but notrecommended
© 2003 by Béla Lipták
568
Temperature M
easurement
TABLE 4.1b
Temperature Conversion Table(When converting any temperature, find the boldface value of the temperature to be converted and look to the left for its
°
C equivalent or to right for its
°
F equivalent. Temperaturesnot listed can be converted using
°
F
=
(9
°
C/5)
+
32 or
°
C
=
5(
°
F
−
32)/9.)
C F C F C F C F C F C F C F C F C F
−
273.1
–459.4
−
17.8
0
32 10.0
50
122.0 38
100
212 260
500
932 538
1000
1832 816
1500
2732 1093
2000
3632 1371
2500
4532
−
268
–450
−
17.2
1
33.8 10.6
51
123.8 43
110
230 266
510
950 543
1010
1850 821
1510
2750 1099
2010
3650 1377
2510
4550
−
262
−−−−
440
−
16.7
2
35.6 11.1
52
125.6 49
120
248 271
520
968 549
1020
1868 827
1520
2768 1104
2020
3668 1382
2520
4568
−
257
–430
−
16.1
3
37.4 11.7
53
127.4 54
130
266 277
530
986 554
1030
1886 832
1530
2786 1110
2030
3686 1388
2530
4586
−
251
–420
−
15.6
4
39.2 12.2
54
129.2 60
140
284 282
540
1004 560
1040
1904 838
1540
2804 1116
2040
3704 1393
2540
4604
−
246
–410
−
15.0
5
41.0 12.8
55
131.0 66
150
302 288
550
1022 566
1050
1922 843
1550
2822 1121
2050
3722 1399
2550
4622
−
240
–400
−
14.4
6
42.8 13.3
56
132.8 71
160
320 293
560
1040 571
1060
1940 849
1560
2740 1127
2060
3740 1404
2560
4640
−
234
–390
−
13.9
7
44.6 13.9
57
134.6 77
170
338 299
570
1058 577
1070
1958 854
1570
2858 1132
2070
3758 1410
2570
4658
−
229
–380
−
13.3
8
46.4 14.4
58
136.4 82
180
356 304
580
1076 582
1080
1976 860
1580
2876 1138
2080
3776 1416
2580
4676
−
223
–370
−
12.8
9
48.2 15.0
59
138.2 88
190
374 310
590 1094 588 1090 1994 886 1590 2894 1143 2090 3794 1421 2590 4694
−218 –360 −12.2 10 50.0 15.6 60 140.0 93 200 392 316 600 1112 593 1100 2012 871 1600 2912 1149 2100 3812 1427 2600 4712
−212 –350 −11.7 11 51.8 16.1 61 141.8 99 210 410 321 610 1130 599 1110 2030 877 1610 2930 1154 2110 3830 1432 2610 4730
−207 –340 −11.1 12 53.6 16.7 62 143.6 100 212 413 327 620 1148 604 1120 2048 882 1620 2948 1160 2120 3848 1438 2620 4748
−201 –330 −10.6 13 55.4 17.2 63 145.4 104 220 428 332 630 1166 610 1130 2066 888 1630 2966 1166 2130 3866 1443 2630 4766
−196 –320 −10.0 14 57.2 17.8 64 147.2 110 230 446 338 640 1184 616 1140 2084 893 1640 2984 1171 2140 3884 1449 2640 4784
−190 –310 −9.44 15 59.0 18.3 65 149.0 116 240 464 343 650 1202 621 1150 2102 899 1650 3002 1177 2150 3902 1454 2650 4802
−184 –300 −8.89 16 60.8 18.9 66 150.8 121 250 482 349 660 1220 627 1160 2120 904 1660 3020 1182 2160 3920 1460 2660 4820
−179 –290 −8.33 17 62.6 19.4 67 152.6 127 260 500 354 670 1238 632 1170 2138 910 1670 3038 1188 2170 3938 1466 2670 4838
−173 –280 −7.78 18 64.4 20.0 68 154.4 132 270 518 360 680 1256 638 1180 2156 916 1680 3056 1193 2180 3956 1471 2680 4856
−169 –273 −459.4 −7.22 19 66.2 20.6 69 156.2 138 280 536 366 690 1274 643 1190 2174 921 1690 3074 1199 2190 3974 1477 2690 4874
−168 –270 −454 −6.67 20 68.0 21.1 70 158.0 143 290 554 371 700 1292 649 1200 2192 927 1700 3092 1204 2200 3992 1482 2700 4892
−162 –260 −436 −6.11 21 69.8 21.7 71 159.8 149 300 572 377 710 1310 654 1210 2210 932 1710 3110 1210 2210 4010 1488 2710 4910
−157 –250 −418 −5.56 22 71.6 22.2 72 161.6 154 310 590 382 720 1328 660 1220 2228 938 1720 3128 1216 2220 4028 1493 2720 4928
−151 –240 −400 −5.00 23 73.4 22.8 73 163.4 160 320 608 388 730 1346 666 1230 2246 943 1730 3146 1221 2230 4046 1499 2730 4946
−146 –230 −382 −4.44 24 75.2 23.3 74 165.2 166 330 626 393 740 1364 671 1240 2264 949 1740 3164 1227 2240 4064 1504 2740 4964
−140 –220 −364 −3.89 25 77.0 23.9 75 167.0 171 340 644 399 750 1382 677 1250 2282 954 1750 3182 1232 2250 4082 1510 2750 4982
−134 –210 −346 −3.33 26 78.8 24.4 76 168.8 177 350 662 404 760 1400 682 1260 2300 960 1760 3200 1238 2260 4100 1516 2760 5000
−129 –200 −328 −2.78 27 80.6 25.0 77 170.6 182 360 680 410 770 1418 688 1270 2318 966 1770 3218 1243 2270 4118 1521 2770 5018
−123 –190 −310 −2.22 28 82.4 25.6 78 172.4 188 370 698 416 780 1436 693 1280 2336 971 1780 3236 1249 2280 4136 1527 2780 5036
−118 –180 −292 −1.67 29 84.2 26.1 79 174.2 193 380 716 421 790 1454 699 1290 2354 977 1790 3254 1254 2290 4154 1532 2790 5054
© 2003 by Béla Lipták

4.1A
pplication and Selection569
−112 –170 −274 −1.11 30 86.0 26.7 80 176.0 199 390 734 427 800 1472 704 1300 2372 982 1800 3272 1260 2300 4172 1538 2800 5072
−107 –160 −256 −0.56 31 87.8 27.2 81 177.8 204 400 752 432 810 1490 710 1310 2390 988 1810 3290 1266 2310 4190 1543 2810 5090
−101 –150 −238 0 32 89.6 27.8 82 179.6 210 410 770 438 820 1508 716 1320 2408 993 1820 3308 1271 2320 4208 1549 2820 5108
−95.6 −140 −220 0.56 33 91.4 28.3 83 181.4 216 420 788 443 830 1526 721 1330 2426 999 1830 3326 1277 2330 4226 1554 2830 5126
−90.0 –130 −202 1.11 34 93.2 28.9 84 183.2 221 430 806 449 840 1544 727 1340 2444 1004 1840 3344 1282 2340 4244 1560 2840 5144
−84.4 –120 −184 1.67 35 95.0 29.4 85 185.0 227 440 824 454 850 1562 732 1350 2462 1010 1850 3362 1288 2350 4262 1566 2850 5162
−78.9 –110 −166 2.22 36 96.8 30.0 86 186.8 232 450 842 460 860 1580 738 1360 2480 1016 1860 3380 1293 2360 4282 1571 2860 5180
−73.3 –100 −148 2.78 37 98.6 30.6 87 188.6 238 460 860 466 870 1598 743 1370 2498 1021 1870 3398 1299 2370 4298 1577 2870 5198
−67.8 –90 −130 3.33 38 100.4 31.1 88 190.4 243 470 878 471 880 1616 749 1380 2516 1027 1880 3416 1304 2380 4316 1582 2880 5216
−62.2 –80 −112 3.89 39 102.2 31.7 89 192.2 249 480 896 477 890 1634 754 1390 2534 1032 1890 3434 1310 2390 4334 1588 2890 5234
−56.7 –70 −94 4.44 40 104.0 32.2 90 194.0 254 490 914 482 900 1652 760 1400 2552 1038 1900 3452 1316 2400 4352 1593 2900 5252
−51.1 –60 −76 5.00 41 105.8 32.8 91 195.8 488 910 1670 766 1410 2570 1043 1910 3470 1321 2410 4370 1599 2910 5270
−45.6 –50 −58 5.56 42 107.6 33.3 92 197.6 493 920 1688 771 1420 2588 1049 1920 3488 1327 2420 4388 1604 2920 5288
−40.0 –40 −40 6.11 43 109.4 33.9 93 199.4 499 930 1706 777 1430 2606 1054 1930 3506 1332 2430 4406 1610 2930 5306
−34.4 –30 −22 6.67 44 111.2 34.4 94 201.2 504 940 1724 782 1440 2624 1060 1940 3524 1338 2440 4424 1616 2940 5324
−28.9 –20 −4 7.22 45 113.0 35.0 95 203.0 510 950 1742 788 1450 2642 1066 1950 3542 1343 2450 4442 1621 2950 5342
−23.3 –10 14 7.78 46 114.8 35.6 96 204.8 516 960 1760 793 1460 2660 1071 1960 3560 1349 2460 4460 1627 2960 5360
−17.8 0 32 8.33 47 116.6 36.1 97 206.6 521 970 1778 799 1470 2678 1077 1970 3578 1354 2470 4478 1632 2970 5378
8.89 48 118.4 36.7 98 208.4 527 980 1796 804 1480 2696 1082 1980 3596 1360 2480 4496 1638 2980 5396
9.44 49 120.2 37.2 99 210.2 532 990 1814 810 1490 2714 1088 1990 3614 1366 2490 4514 1643 2990 5414
© 2003 by Béla Lipták

570 Temperature Measurement
the suitability of various sensors to that application. The suit-ability for the application may range from using a bimetallicdial thermometer for a water tank with an accuracy of ±2 to5°F (1 to 3°C) to a temperature transmitter assembly with aresistance temperature detector (RTD) that can measure within±0.02°F (0.01°C).
International Practical Temperature Scale
The International Practical Temperature Scale is the basis ofmost present-day temperature measurements. The scale wasestablished by an international commission in 1948 with atext revision in 1960.2 A revision3 of the scale was formally
TABLE 4.1cTemperature Sensor Accuracy and Range
Sensor TypeUseful Range
°F*Maximum Range
°F*Accuracy
Standard GradeAccuracy
Premium Grade
Thermocouples
Type J Iron vs. Constantan 32 to 1382 −346 to 2192 ±4°F or 0.75%** ±2°F or 0.4%
Type K Chromal vs. Alumel −238 to 2282 −454 to 2502 ±4°F or 0.75% >32°F±4°F or 2% <32°F**
±2°F or 0.4%
Type T Copper vs. Constantan −328 to 662 −454 to 752 ±2°F or 0.75% >32°F±2°F or 1.5% <32°F**
±0.9°F or 0.4%
Type E Nickel-Chromium vs. Constantan −274 to 1832 −454 to 1855 ±3°F or 0.5% >32°F±3°F or 1% <32°F**
±1.8°F or 0.4%
Type C Tungston-5% Rhenium vs. Tungston-26% Rhenium
0 to 4200 −32 to 4208 8°F to 7671% to 4200
n/a
Type R Plat-13% Rhodium vs. Plat 32 to 2642 −40 to 3214 2.7°F or 0.25%** 1.1°F or 0.1%
Type S Plat-10% Rhodium vs. Plat 32 to 2642 −40 to 3214 2.7°F or 0.25%** 1.1°F or 0.1%
Type B Plat-30% Rhodium vs.Plat-6% Rhodium
32 to 3092 32 to 3308 0.9°F over 1472°F n/a
Tungston vs. Tungston-26% Rhenium 32 to 4200 0 to 4200 ±8°F for 32 to 800°F±1% for 800 to 4200°F
n/a
Tungston-5% Rhenium vs. Tungston 26%-Rhenium
32 to 4200 0 to 4200 ±8°F for 32 to 800°F±1% for 800 to 4200°F
n/a
Tungston-3% Rhenium vs. Tungston 25%-Rhenium
32 to 4200 0 to 4200 ±8°F for 32 to 800°F±1% for 800 to 4200°F
n/a
Resistance Thermometers
Platinum Class A RTD Alpha = 0.0385 −328 to 1000 −328 to 1562 °F = ±(0.27 + 0.0036*[t])***
Platinum Class B RTD Alpha = 0.0385 −328 to 1000 −328 to 1562 °F = ±(0.54 + 0.009*[t])***
Nickel 672 RTDCopper 427 RTD
−94 to 572−130 to 500
±0.2 to 0.5% FS±0.2 to 0.5% FS
±0.09°F spans <90°F
Thermistor −150 to 600±0.18°F spans <135°F±0.36°F spans <212°F
Solid State −67 to 300 ±3.6°F for 32 to 250°F
Non-Electric
Liquid In Glass Thermometers −40 to 700 ±1 Scale Division
Bi-Metallic Thermometers −100 to 1000 ±1% FS
Filled System Thermometers −320 to 1200 ±1% FS
Phase Change 100 to 3000 ±1°F
NOTES
* °C = 5/9 (°F − 32) and −°C = 5/9 (°F + 32)** Error is greater of two designations*** t = temperature span
© 2003 by Béla Lipták

4.1A
pplication and Selection571
TABLE 4.1dTemperature Sensor Selection Table
Measured Temperature Under 500°C Above 500°C
Reading1 Point Average Point Average
Hostile Environment2 No Yes No Yes No Yes No Yes
Interference3 No Yes No Yes No Yes No Yes No Yes No Yes No Yes No Yes
Sensors4 Color Indicators G(L) G(L) G(L) G(L) G(L) G(L) G(L) G(L)
Bimetallic Units G F G(P) F(P)
Filled Elements G F G(P) F(P) G(L) F F(P) F(P)
Resistance Bulbs (RTDs) E F E(P) F(P) E F E(P) F(P) E F G(P) F(P) G(L) F G(P, L) F(P, L)
Thermistors E(L) F G(P) F(P) E(L) F G(P) F(P)
Thermocouples G F G(P) F(P) F(L) F(L) F(L) F(L) E F E(P) F(P) F(L) F(L) F(L, P) F(L, P)
Quartz Crystals E(L) F
Radiation Pyrometers E(L) G(L) E(L) G(L) E(A, L) G(A, L) E(A, L) G(A, L)
Infrared Pyrometers E(L) E(L) E(L) G(L) E(L) E(L) E(L) E(L)
Spectroscopic (Fraunhofer) Sensors A A
Thermopile G(A) F(A) G(A) F(A)
Acoustic Time Domain Reflectometry (TDR) D D D D D D D D
CODE LETTERS: D - in developmentL - limitedF - fairG - goodE - excellentP - protective well reduces speed of responseA - detects the average temperature of an areaEXAMPLE: G(D)—This combination of code letters refers to a device which is a good selection for the particular service, but is not yet commercially available.1 This device either detects a point or the average temperature of some section of the process or of the refractory.2 The term “hostile environment” here is used to mean processes such as fluid beds, where the sensor is likely to experience the mechanical impact of high velocity solid particles.3 “Interference” refers to need to overcome temperature interferences due to hot refractories or to temperature differences between the carrier gas and the solid particles in it.4 For considerations of measurement error, span, cost stability, response time, linearity, materials of construction, etc., refer to the text.
© 2003 by Béla Lipták

572 Temperature Measurement
adopted in 1990 and is reproduced in Tables 4.1e and 4.3a.Reproducible temperature points established by physical con-stants of readily available materials define the scale. Interpo-lation between these fixed points is made by platinum resis-tance thermometers when the temperature is below 1832°F(1000°C), and by platinum-platinum and 10% rhodium ther-mocouples (TCs) when it is higher. The National Institutesof Standards and Technology (NIST—formerly the NationalBureau of Standards) has capability for calibrating tempera-ture-measuring devices against these primary temperaturepoints. These devices are secondary standards that are thenused by manufacturers and users to calibrate other equipment.
NIST’s capability for calibrating temperature-measuringdevices is illustrated in Figure 4.1f. This figure also showsthe error (uncertainty) of other thermometers at differenttemperatures.
TEMPERATURE SENSORS
It is believed that Galileo invented the liquid-in-glass ther-mometer around 1592. Thomas Seebeck discovered the prin-ciple behind the TC—the existence of the thermoelectriccurrent—in 1821. The same year Sir Humphry Davy notedthe temperature dependence of metals, but C.H. Meyers didnot build the RTD until 1932. The development of tempera-ture sensors was a slow process until the middle of the 20thcentury. Today the application engineer can select fromamong over 20 different types of thermometers. In addition,the old practice of using only filled system thermometers,RTDs, or TCs throughout a particular industrial plant isgiving way to the practice of selecting each temperaturesensor for a particular application, just as each level or flowmeter is individually selected. This requires a better under-standing of the features and capabilities of the many ther-mometers on the market.
Nonelectric Temperature Sensors
Liquid-in-Glass Thermometers Most versions have usedmercury or alcohol as the liquid. The element mercury isliquid in the temperature range of about −40 to 700°F (−38.9to 356.7°C).17 As a liquid, mercury expands as it gets warmer;its expansion rate is linear and can be accurately calibrated.
TABLE 4.1ePrimary Temperature Points Defined by the International Prac-tical Temperature Scale (IPTS-90)
Equilibrium Point °K °C
Triple Point of Hydrogen 13.81 −259.34
Liquid/Vapor Phase of Hydrogen at 25/76Std. Atmosphere
17.042 −256.108
Boiling Point of Hydrogen 20.28 −252.87
Boiling Point of Neon 27.102 −246.048
Triple Point of Oxygen 54.361 −218.789
Boiling Point of Oxygen 90.188 −182.962
Triple Point of Water 273.16 .01
Boiling Point of Water 373.15 100
Freezing Point of Zinc 692.73 419.58
Freezing Point of Silver 1235.08 961.93
Freezing Point of Gold 1337.58 1064.43
FIG 4.1fUncertainties in calibrating different temperature sensors at various temperatures. (From NBS Technical Note No. 262.)
OnePartin
Platinum ResistanceThermometer
Accuracies Based upon Limits ofError Assigned to Calibration Results
NBS Capability in ReproducingTemperature Scales
Helium 4VaporPressure
Germanium Resistors
Liquid in GlassThermometers
Diodes
Base Metal Thermocouples
AcousticTherm
BaseMetalThermocouples
Standard PlatinumThermocouple
Platinum MetalThermocouples
Standard OpticalPyrometer
Optical Pyrometers
Temperature, °Κ
Unc
erta
inty
1 10 100 1000 10,000 100,00010
103
105
107
© 2003 by Béla Lipták
4.1 Application and Selection 573
Because of mercury’s toxicity and the strict governing laws,the use of the mercury-in-glass thermometer has declined.One manufacturer has recently introduced a line of thermom-eters with a proprietary fill liquid offering the performanceof mercury with none of the toxicity concerns.8 For highaccuracy applications, laboratory grade and reference stan-dard models are available with calibration certification toNIST standards.
Bimetallic Thermometers Bonding two dissimilar metalswith different coefficients of expansion produces a bimetallicelement. These are used in bimetallic thermometers, temper-ature switches, and thermostats having a range of 100 to1000°F (−73 to 537°C). When manufactured as a helix orcoil, its movement with a change in temperature can move apointer over a dial scale to indicate temperature. Dial ther-mometers ranging from pocket size to 5 in. dials are offeredwith a variety of local and remote mounting configurations.
Many process applications require use of a thermal wellto allow for the removal or replacement of the thermometerwhile the process is pressurized.9 Other designs includeswitches for on-off control that range from the simple wallthermostat to more rugged industrial models for simple pro-cess control or over-temperature protection. Other configu-rations include snap disk switches often used for over-temperature alarm and control. Low-end models are used inhome furnaces, clothes dryers, and coffee makers. More rug-ged units find application in automobiles, trucks, and indus-trial machinery as over-temperature limits.
Filled System Thermometers Filled system thermometershave been used for decades. They have a useful range of 320to 1200°F (200 to 650°C). Applications vary in sophisticationfrom those for commercial appliances like cooking ovens andthose used in heating, ventilation, and air conditioning(HVAC), to rugged industrial units suitable for a variety ofapplications. The filled system element can operate switchmechanisms as in ovens or for industrial shutdown controls.Some models have an analog output that may be connectedto remote locations. Thermal systems filled with solid mate-rials or mercury have all but disappeared. Most countriesmandate the removal of any mercury-filled devices due to itsextreme toxicity.
There are some models that use a vapor fill, but thesesuffer in applications where the temperature crosses thevapor/liquid point and causes liquification and loss of per-formance (typical is 0.25% per 25°F/14°C). Liquid filledunits are the most popular, but consideration must be givento offsets due to the weight of the liquid head and compen-sation for capillary length. Thermocouples and RTDs arereplacing filled systems in industrial process control applica-tions. The low cost of electronic devices to read the outputof TCs and RTDs and to indicate or control, together withthe ability to locate the sensor independently of the receivingdevice, has made electronic means more attractive.9
Bistate/Phase Change Sensors These low cost nonelectricsensors are made from heat-sensitive fusible crystalline solidsthat change decisively from a solid to a liquid with a differentcolor at a fixed temperature depending on the blend of ingre-dients. They are available as crayons, lacquers, pellets, orlabels over a wide range of temperatures from 100 to 3000°F(38 to 1650°C). They offer a very inexpensive method forsurface temperature visual verification within about 1°F.Monitoring minimum and maximum temperatures duringshipment of perishable goods is a common application.
Electronic Thermometers/Sensors
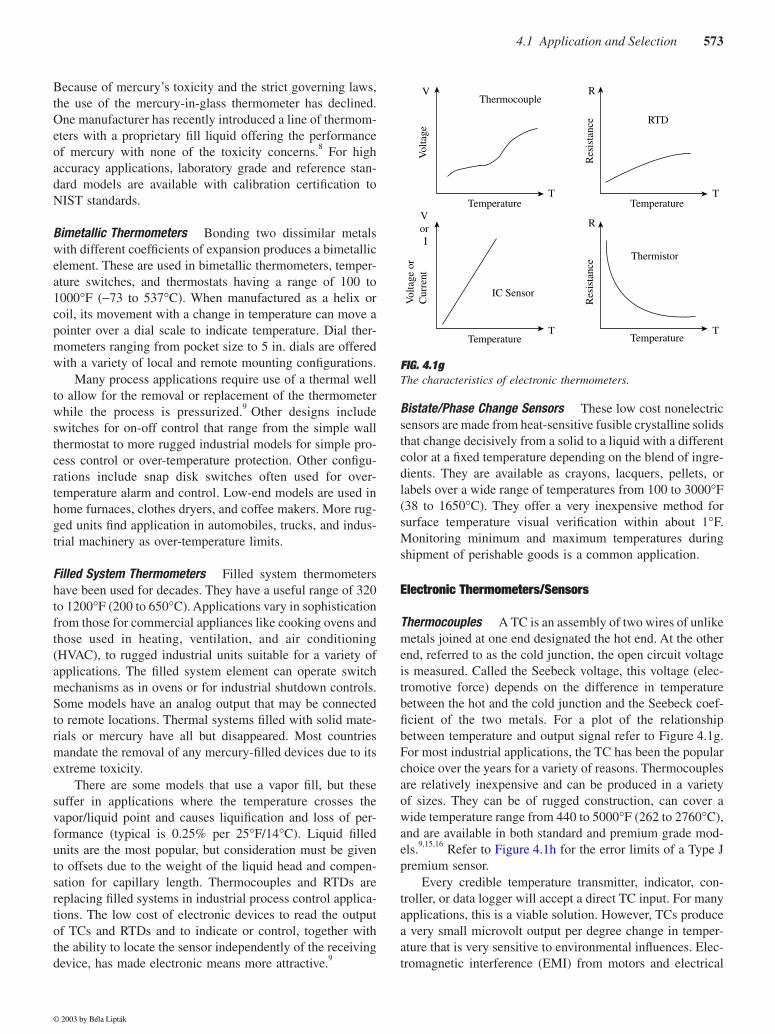
Thermocouples A TC is an assembly of two wires of unlikemetals joined at one end designated the hot end. At the otherend, referred to as the cold junction, the open circuit voltageis measured. Called the Seebeck voltage, this voltage (elec-tromotive force) depends on the difference in temperaturebetween the hot and the cold junction and the Seebeck coef-ficient of the two metals. For a plot of the relationshipbetween temperature and output signal refer to Figure 4.1g.For most industrial applications, the TC has been the popularchoice over the years for a variety of reasons. Thermocouplesare relatively inexpensive and can be produced in a varietyof sizes. They can be of rugged construction, can cover awide temperature range from 440 to 5000°F (262 to 2760°C),and are available in both standard and premium grade mod-els.9,15,16 Refer to Figure 4.1h for the error limits of a Type Jpremium sensor.
Every credible temperature transmitter, indicator, con-troller, or data logger will accept a direct TC input. For manyapplications, this is a viable solution. However, TCs producea very small microvolt output per degree change in temper-ature that is very sensitive to environmental influences. Elec-tromagnetic interference (EMI) from motors and electrical
FIG. 4.1gThe characteristics of electronic thermometers.
RTD
TemperatureTemperature
Temperature Temperature
Res
ista
nce
Res
ista
nce
Vol
tage
Vol
tage
or
Cur
rent
Thermocouple
T T
T T
V
R
R
Vor I
Thermistor
IC Sensor
© 2003 by Béla Lipták

574 Temperature Measurement
distribution and especially radio frequency interference (RFI)from walkie-talkies can produce dramatic errors in measuringcircuits in these instruments. The user should insist on a noisereduction spec and an RFI immunity spec that will minimizethese effects. A top quality instrument will offer Commonmode noise rejection of 100 db, Normal mode rejection ofabout 70 db, and RFI immunity of 10 to 30 V/m.
There are some applications where a bare TC with anexposed junction may be used either by itself or inserted intoa protective well. For most process applications, the TC ismanufactured with a protective outer sheath that uses aninsulating material to electrically separate the TC from thesheath and provide mechanical and environmental protection.In some cases, the TC junction is placed in direct contactwith the tip of the sheath to increase speed of response. Thesesensors demand the use of an electrically isolated measure-ment circuit. Even insulated TCs will eventually suffer froma breakdown of the insulation and the TC tip will contact thesheath and associated well. It is virtually assured that aground loop will be present that will cause measurementerrors. These errors are usually insidious in that they usuallyvary over time and may go unnoticed. Recommended practiceis to always use an instrument with full isolation to eliminatethis concern.9,10,12
Another consideration for applying TCs is that their lowoutput (about 40 µV/°C) limits the minimum span of eventhe best transmitters to about 60°F (35°C). RTDs are the usualchoice for narrow span applications.
The most misunderstood drawback of using TCs is theirinherent drift. The junction of the two dissimilar metalsbegins to degrade to some degree immediately after manu-facture. For some types, used at low temperatures, this mayonly be a few degrees per year and may be calibrated out ofthe system. Other types used at higher temperatures degrademuch more quickly. Consideration must also be given to anyTC extension wire that is used for long wiring runs from thefield location to the measurement instrument. Not only is itsaccuracy only about half as good as a TC, but also it is oftensubjected to harsh environmental conditions as it passesthrough the plant that will cause significant degradation and
drift. Some plants replace their extension wire on a regularbasis to minimize this effect.
Installing a top quality transmitter in the connection headof the TC will minimize many of the problems and concernsdescribed above. Refer to Intelligent Temperature Transmit-ters in a later paragraph of this section.
Resistance Temperature Detectors RTDs are constructedof a resistive material with leads attached and usually placedinto a protective sheath. The resistive material may be plat-inum, nickel, or copper with the most common by far beingplatinum. The relationship between the resistance change ofan RTD vs. temperature is referred to as its alpha curve (seeFigure 4.1g). The instrument used with the RTD must beconfigured to use the same alpha curve as the RTD or sig-nificant errors will occur.
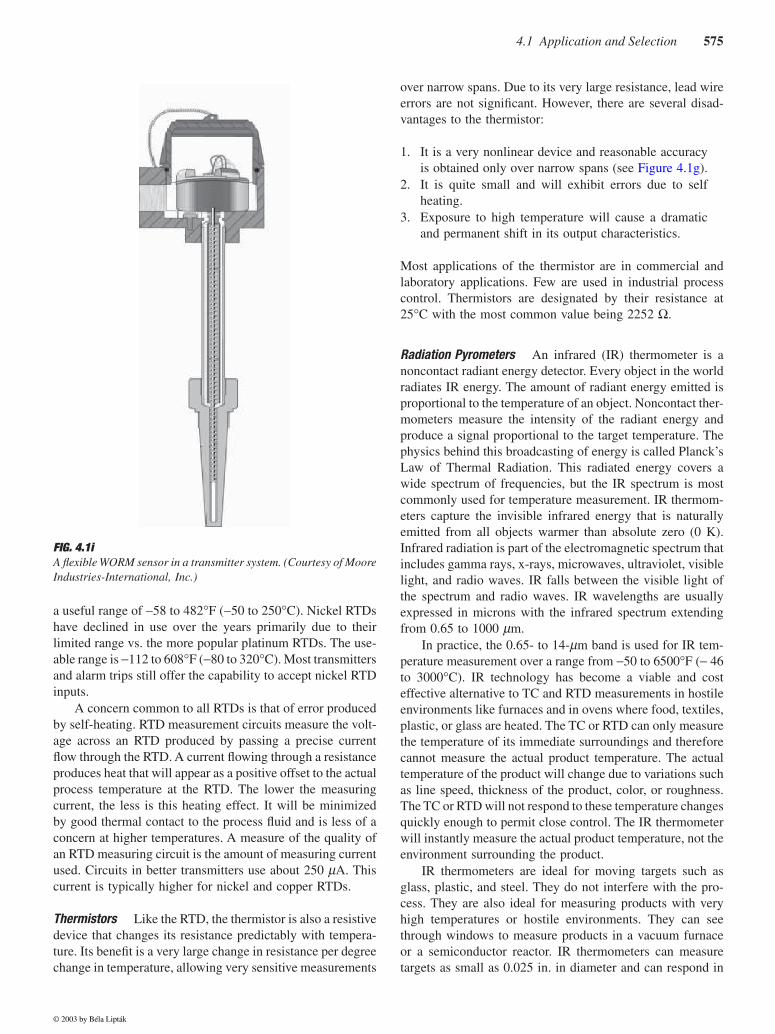
As with TCs, there are some applications where anexposed sensor is suitable for the purpose. More commonlythey are manufactured with a protective sheath that providesa hermetic seal to protect the sensor from moisture and/orcontamination.14 These protective sheaths are offered in avariety of lengths to provide the proper insertion into theprocess to obtain a representative measurement. The sheathedelements are often installed into a protective well to isolatethe sensor from the process. One manufacturer offers a uni-versal model that has only a 1 in. long sheath, but has longleads encased in a spiraled spring. The unit may be cut inthe field to fit in any length of thermal well. This greatlyreduces the requirements for stocking sensors in varyinglengths.7,11 Figure 4.1i shows this flexible sensor mountedwith a transmitter.
There are very few applications for a 2-wire RTD sincethe error introduced by the leads can cause significant error.Measurement circuits that accept 3-wire inputs include amethod of minimizing the effects of lead wire resistance aslong as the outer legs are equal. However, factors such asterminal corrosion and loose connections can create signifi-cant differences between the lead resistances seen by themeasurement circuit. A single ohm of difference betweenthe legs is reflected as a 4.7°F (2.6°C) error.13 Using a 4-wiremeasuring circuit eliminates this problem. The design engi-neer should consider any of the leading brands of temperaturetransmitters that accept 4-wire RTD inputs as a standardfeature. Direct connection to remote devices with 3-wireextension cable will often produce errors that can be signif-icant and will vary with environmental conditions. Refer tointelligent temperature transmitters later in this section formore detail.
Copper RTDs are most commonly used to sense the wind-ing temperature of motors, generators, and turbines. Connect-ing them to an alarm trip provides an over-temperature shut-down function. Historically, 10-Ω copper RTDs were thenorm, and accurate measurements of the small change inresistance change with temperature limited the accuracy toabout ±1 to 2°F (1.6°C). Many users have now opted for 100Ω or even 1000 Ω units to get higher resolution. They have
FIG. 4.1hThe error limits of an iron-constantan thermocouple manufacturedto meet the “special” limits of ISA.
Spec
ifie
d E
rror
Lim
its, °
F
Reference 32°F Cold Junction
Hot Junction Temperature, °F
500
530
1000 1500 20000
–2
–4
–6
–8
2
4
68
© 2003 by Béla Lipták
4.1 Application and Selection 575
a useful range of −58 to 482°F (−50 to 250°C). Nickel RTDshave declined in use over the years primarily due to theirlimited range vs. the more popular platinum RTDs. The use-able range is −112 to 608°F (−80 to 320°C). Most transmittersand alarm trips still offer the capability to accept nickel RTDinputs.
A concern common to all RTDs is that of error producedby self-heating. RTD measurement circuits measure the volt-age across an RTD produced by passing a precise currentflow through the RTD. A current flowing through a resistanceproduces heat that will appear as a positive offset to the actualprocess temperature at the RTD. The lower the measuringcurrent, the less is this heating effect. It will be minimizedby good thermal contact to the process fluid and is less of aconcern at higher temperatures. A measure of the quality ofan RTD measuring circuit is the amount of measuring currentused. Circuits in better transmitters use about 250 µA. Thiscurrent is typically higher for nickel and copper RTDs.
Thermistors Like the RTD, the thermistor is also a resistivedevice that changes its resistance predictably with tempera-ture. Its benefit is a very large change in resistance per degreechange in temperature, allowing very sensitive measurements
over narrow spans. Due to its very large resistance, lead wireerrors are not significant. However, there are several disad-vantages to the thermistor:
1. It is a very nonlinear device and reasonable accuracyis obtained only over narrow spans (see Figure 4.1g).
2. It is quite small and will exhibit errors due to selfheating.
3. Exposure to high temperature will cause a dramaticand permanent shift in its output characteristics.
Most applications of the thermistor are in commercial andlaboratory applications. Few are used in industrial processcontrol. Thermistors are designated by their resistance at25°C with the most common value being 2252 Ω.
Radiation Pyrometers An infrared (IR) thermometer is anoncontact radiant energy detector. Every object in the worldradiates IR energy. The amount of radiant energy emitted isproportional to the temperature of an object. Noncontact ther-mometers measure the intensity of the radiant energy andproduce a signal proportional to the target temperature. Thephysics behind this broadcasting of energy is called Planck’sLaw of Thermal Radiation. This radiated energy covers awide spectrum of frequencies, but the IR spectrum is mostcommonly used for temperature measurement. IR thermom-eters capture the invisible infrared energy that is naturallyemitted from all objects warmer than absolute zero (0 K).Infrared radiation is part of the electromagnetic spectrum thatincludes gamma rays, x-rays, microwaves, ultraviolet, visiblelight, and radio waves. IR falls between the visible light ofthe spectrum and radio waves. IR wavelengths are usuallyexpressed in microns with the infrared spectrum extendingfrom 0.65 to 1000 µm.
In practice, the 0.65- to 14-µm band is used for IR tem-perature measurement over a range from −50 to 6500°F (− 46to 3000°C). IR technology has become a viable and costeffective alternative to TC and RTD measurements in hostileenvironments like furnaces and in ovens where food, textiles,plastic, or glass are heated. The TC or RTD can only measurethe temperature of its immediate surroundings and thereforecannot measure the actual product temperature. The actualtemperature of the product will change due to variations suchas line speed, thickness of the product, color, or roughness.The TC or RTD will not respond to these temperature changesquickly enough to permit close control. The IR thermometerwill instantly measure the actual product temperature, not theenvironment surrounding the product.
IR thermometers are ideal for moving targets such asglass, plastic, and steel. They do not interfere with the pro-cess. They are also ideal for measuring products with veryhigh temperatures or hostile environments. They can seethrough windows to measure products in a vacuum furnaceor a semiconductor reactor. IR thermometers can measuretargets as small as 0.025 in. in diameter and can respond in
FIG. 4.1iA flexible WORM sensor in a transmitter system. (Courtesy of MooreIndustries-International, Inc.)
© 2003 by Béla Lipták

576 Temperature Measurement
10 ms to a temperature change. IR instruments operate atvarious wavelengths and Figure 4.1j shows the standardwavelengths that are available from most manufacturers.Each bar represents a series of instruments. The shortestwavelength band utilized is 0.65 µm and the longest is 8 to14 µm. An instrument using a 0.65-µm wavelength canmeasure the higher range temperatures from 1400 to 6500°F(700 to 3600°C). Instruments with sensitivity to the 8- to 14-µm range can measure down to −50°F (−45°C).
Here are some guidelines for applications for the variouswavelengths:
1. Wavelength bands centered on 0.65 and 2.6 µm areused for metals and can see through quartz windows.Fiber-optic systems for remote sensor applications areoptional. Two color systems in these bands use slightlydiffering wavelengths to make their measurement.
2. The 3.4-µm band (±0.05 µm) and the 7.9-µm band(±0.15 µm) are used to measure thin plastic films. Atthese wavelengths, films as thin as 0.001 in. are opaqueand only the surface temperature is measured.
3. The 5-µm band (±0.2 µm) is used to measure glasswindows and containers.
4. The 7.9-µm band is also utilized for ceramics and verythin glass.
5. The 8- to 14-µm wavelength is probably most com-monly used for low temperature applications for tex-tiles, paper, and food. It also is a very commonwavelength for portable infrared thermometers.
Distance does not affect the measurement. Models areavailable that can measure from 1 to 300 ft (0.3 to 91 m).However, IR sensors measure the energy from a circular spoton the target, and the size of that spot is a function of thedistance between the sensor and target. The farther away fromthe target the sensor is, the larger the spot (Figure 4.1k).Consequently, distance is limited by the size of the objectyou want to measure. Some models offer a low power laser
that facilitates proper aiming. Where a direct line of sight tothe target is not possible, models with a fiber-optic connectedsensor system often can solve the problem. Fiber opticsallows installations into difficult locations up to 30 ft fromthe instrument. They can withstand ambient up to 400°F(200°C) without cooling. The lowest target temperature forthese systems is about 1300°F (705°C). At least one manu-facturer offers an instrument with an optical aiming systemthat may be viewed on a TV monitor to ensure proper aimat the target.
There are many applications for wire drawing, annealing,and vacuum furnaces where the sighting must be madethrough dirty windows. Other applications have small win-dows, obstructions in the sight path, or dusty atmosphereslike those found in steel mills. For all these applications, theTwo-Color or Ratio Thermometer provides an excellent solu-tion.20 This instrument utilizes two detectors operating at twowavelengths to measure one hot target. They can measuretemperatures from 500°F (250°C) up to 6500°F (3500°C)and, by using sensors with two different wavelengths, caneliminate the interference problems. In addition, they canmeasure targets that do not completely fill the optical spotsize of the instrument.
The installation of an IR thermometer requires attentionto detail to ensure successful operation. Figures 4.1l and 4.1m
FIG. 4.1jInfrared spectrum for practical measurement. (Courtesy of Ircon.)
Wavelengths (mm)1 2 3 4 5 6 7 8 9 10 11 12 13 14
FIG. 4.1kTypical target sizes and distances of portable infrared thermome-ters. (Courtesy of Wahl Instruments Inc.)
75'(23 m)40'
(12m)
12"(305 mm)
20'(6 m)
3" Dia. (26 mm)
6"(152 mm)
© 2003 by Béla Lipták
4.1 Application and Selection 577
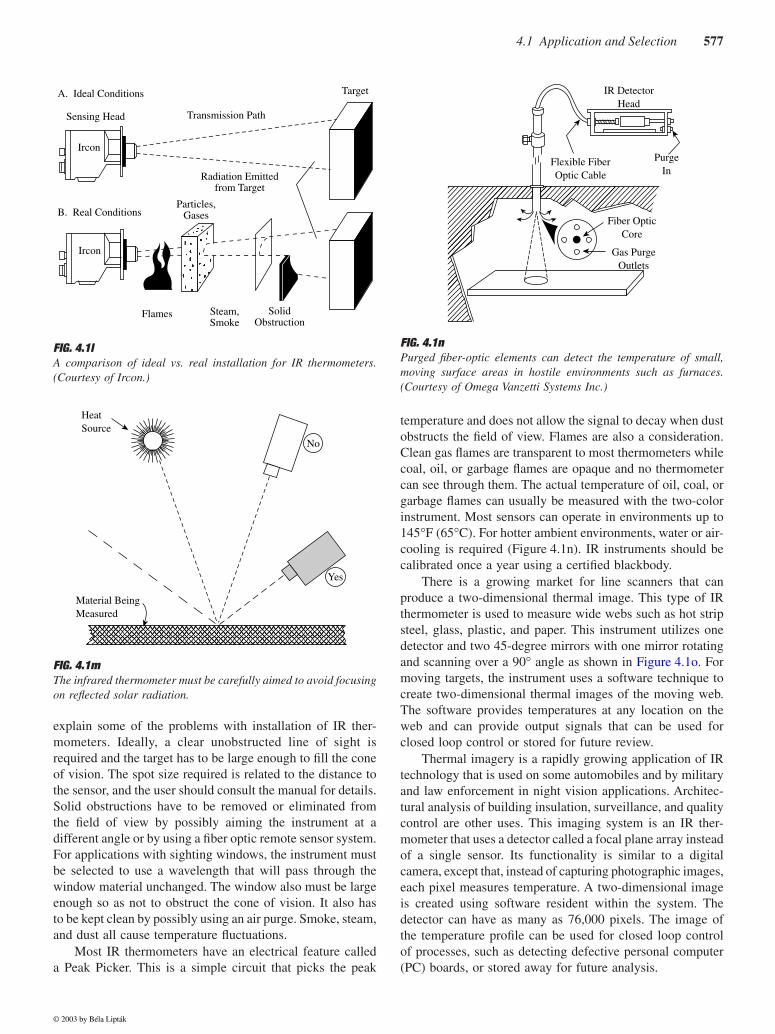
explain some of the problems with installation of IR ther-mometers. Ideally, a clear unobstructed line of sight isrequired and the target has to be large enough to fill the coneof vision. The spot size required is related to the distance tothe sensor, and the user should consult the manual for details.Solid obstructions have to be removed or eliminated fromthe field of view by possibly aiming the instrument at adifferent angle or by using a fiber optic remote sensor system.For applications with sighting windows, the instrument mustbe selected to use a wavelength that will pass through thewindow material unchanged. The window also must be largeenough so as not to obstruct the cone of vision. It also hasto be kept clean by possibly using an air purge. Smoke, steam,and dust all cause temperature fluctuations.
Most IR thermometers have an electrical feature calleda Peak Picker. This is a simple circuit that picks the peak
temperature and does not allow the signal to decay when dustobstructs the field of view. Flames are also a consideration.Clean gas flames are transparent to most thermometers whilecoal, oil, or garbage flames are opaque and no thermometercan see through them. The actual temperature of oil, coal, orgarbage flames can usually be measured with the two-colorinstrument. Most sensors can operate in environments up to145°F (65°C). For hotter ambient environments, water or air-cooling is required (Figure 4.1n). IR instruments should becalibrated once a year using a certified blackbody.
There is a growing market for line scanners that canproduce a two-dimensional thermal image. This type of IRthermometer is used to measure wide webs such as hot stripsteel, glass, plastic, and paper. This instrument utilizes onedetector and two 45-degree mirrors with one mirror rotatingand scanning over a 90° angle as shown in Figure 4.1o. Formoving targets, the instrument uses a software technique tocreate two-dimensional thermal images of the moving web.The software provides temperatures at any location on theweb and can provide output signals that can be used forclosed loop control or stored for future review.
Thermal imagery is a rapidly growing application of IRtechnology that is used on some automobiles and by militaryand law enforcement in night vision applications. Architec-tural analysis of building insulation, surveillance, and qualitycontrol are other uses. This imaging system is an IR ther-mometer that uses a detector called a focal plane array insteadof a single sensor. Its functionality is similar to a digitalcamera, except that, instead of capturing photographic images,each pixel measures temperature. A two-dimensional imageis created using software resident within the system. Thedetector can have as many as 76,000 pixels. The image ofthe temperature profile can be used for closed loop controlof processes, such as detecting defective personal computer(PC) boards, or stored away for future analysis.
FIG. 4.1lA comparison of ideal vs. real installation for IR thermometers.(Courtesy of Ircon.)
FIG. 4.1mThe infrared thermometer must be carefully aimed to avoid focusingon reflected solar radiation.
A. Ideal Conditions
Sensing Head
Ircon
Transmission Path
Target
B. Real Conditions
Radiation Emittedfrom Target
Particles,Gases
Flames Steam,Smoke
SolidObstruction
Ircon
HeatSource
No
Yes
Material BeingMeasured
FIG. 4.1nPurged fiber-optic elements can detect the temperature of small,moving surface areas in hostile environments such as furnaces.(Courtesy of Omega Vanzetti Systems Inc.)
IR DetectorHead
Fiber OpticCore
Gas PurgeOutlets
PurgeIn
Flexible FiberOptic Cable
© 2003 by Béla Lipták

578 Temperature Measurement
Most manufacturers of IR instruments continue to refineexisting products and offer enhanced capability with newermodels. One new model offers bidirectional digital network-ing communications. Multiple sensors can connect to hostsystems for monitoring, control, and diagnostics. The designengineer is strongly urged to consult with multiple vendorsto get recommendations for selecting the proper instrumentfor each application.
Solid-State Sensors The small solid-state sensor convertsa temperature input into a proportional current output over arange of −67 to 300°F (−55 and 150°C) (see Figure 4.1g). Itis especially suited for PC boards or heat sink mounting forspecial temperature measurement and control applicationswhere solid-state reliability, linearity, and accuracy arerequired. They can be used to determine minimum, average,and differential temperatures, in addition to being used forTC cold junction compensation and temperature controlapplications. With prices beginning under $10, these sensorsare gaining popularity. Diodes are typically used in cryogenicapplications over a range of −455 to 396°F (−271 to 202°C)and can be accurate to 0.05°C when properly calibrated.
Heat-Flow and Thermal-Conductivity Sensors The accuratemeasurements of heat flow through thermal insulators and ofthe thermal conductivity of construction materials are bothimportant. Such measurements are of interest not only toarchitects, but also to engineers who are involved with safetyand energy conservation.
A common heat flowmeter design involves the placingof a thin plate of known thermal conductivity on a heat-radiating surface. It has been found that the heat flow throughthese elements is directly related to the temperature differencethrough them. This temperature difference is often detectedby thermopiles—a large and even number of TCs connectedin series in such a manner that their high-temperature junc-tions are on the inside and their low-temperature junctionsare on the outside surface of the sensing element (Figure 4.1p).The heat flows that are encountered in different processesrange from about 10 k-cal/m2h through freezer walls to about
100,000 k-cal/m2h through the shells of water-cooled electricfurnaces. The thickness of the sensor plates is a few milli-meters, and the plates are made of rubber, organic materials,or other heat-resistant materials, sometimes contained in athin, stainless steel disk case.
The heat-flow distribution frequently varies with thedirection of heat flow. For example, Figure 4.1q shows that
FIG. 4.1oSchematic of line scanner IR thermometer. (Courtesy of Ircon.)
Lens
Fixed Mirror
Detector
RotatingMirror
ReferenceSources
Window
Target
90°
FIG. 4.1pKnowing the thermal conductivity (λ) and the sensor plate thickness(d), the measurement of temperature difference (∆T) can be con-verted into heat flow (Q), because Q = (λd) ∆T.
FIG. 4.1qThe measurement of surface heat loss from an insulated steam pipe.(Courtesy of Showa Denko K.K.)
Q
AI
λ/d
Low
Jun
ctio
ns
Hig
h Ju
nctio
ns
−
−+ +
−+−+
−+
−+
350 kcal/m2h
200φ mm Pipe
Insulation100 mm thick
(32.5°C)430°C
70Atm.
(120°C)90 kcal/m2h
(20.0°C)
110 kcal/m2/h
© 2003 by Béla Lipták
4.1 Application and Selection 579
the heat loss from the top of a steam pipe was found to bemuch more than through the bottom surface. Such findingsare usually explained by noting that heat flow from a surfaceis not only a function of the surface temperature, but also ofthe effects of coating. It has been found that if a surface iscoated with bright and glistening aluminum paint, it willradiate much less heat at the same temperature as a surfacewhere the coating has worn off. Sensor elements can mea-sure the variations in heat flow at different points on manyshells, from liquefied petroleum gas (LPG) tank walls toelectric and blast furnace shells, and their readings canreveal the erosion of linings as well as other hard-to-detectphenomena.
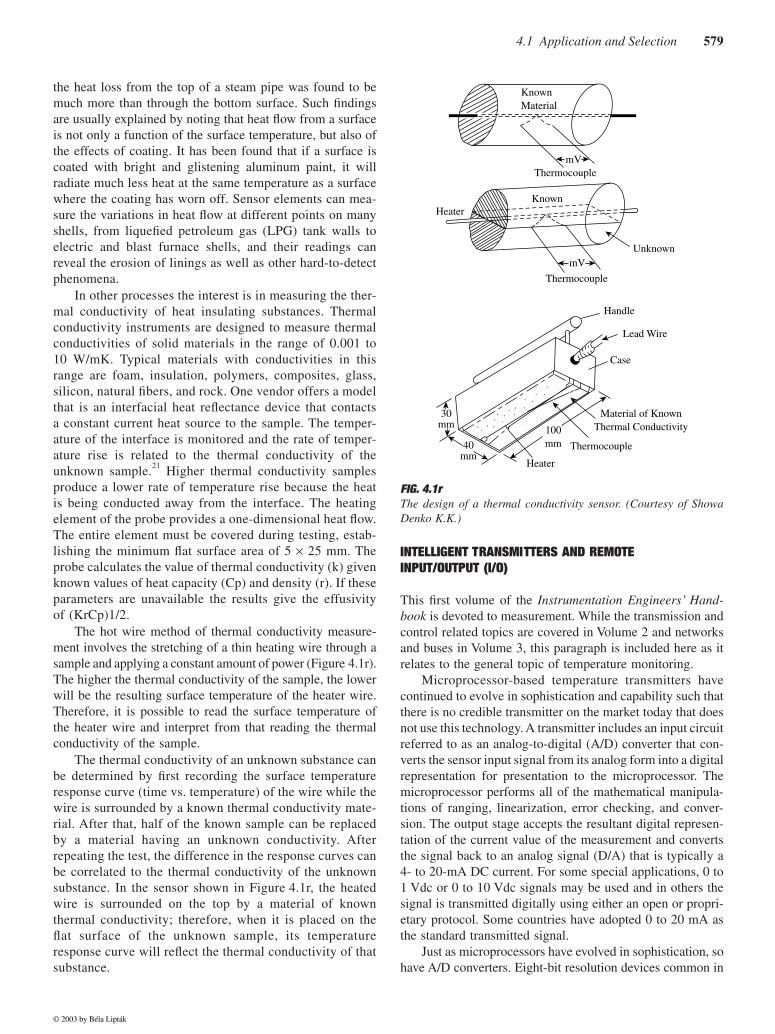
In other processes the interest is in measuring the ther-mal conductivity of heat insulating substances. Thermalconductivity instruments are designed to measure thermalconductivities of solid materials in the range of 0.001 to10 W/mK. Typical materials with conductivities in thisrange are foam, insulation, polymers, composites, glass,silicon, natural fibers, and rock. One vendor offers a modelthat is an interfacial heat reflectance device that contactsa constant current heat source to the sample. The temper-ature of the interface is monitored and the rate of temper-ature rise is related to the thermal conductivity of theunknown sample.21 Higher thermal conductivity samplesproduce a lower rate of temperature rise because the heatis being conducted away from the interface. The heatingelement of the probe provides a one-dimensional heat flow.The entire element must be covered during testing, estab-lishing the minimum flat surface area of 5 × 25 mm. Theprobe calculates the value of thermal conductivity (k) givenknown values of heat capacity (Cp) and density (r). If theseparameters are unavailable the results give the effusivityof (KrCp)1/2.
The hot wire method of thermal conductivity measure-ment involves the stretching of a thin heating wire through asample and applying a constant amount of power (Figure 4.1r).The higher the thermal conductivity of the sample, the lowerwill be the resulting surface temperature of the heater wire.Therefore, it is possible to read the surface temperature ofthe heater wire and interpret from that reading the thermalconductivity of the sample.
The thermal conductivity of an unknown substance canbe determined by first recording the surface temperatureresponse curve (time vs. temperature) of the wire while thewire is surrounded by a known thermal conductivity mate-rial. After that, half of the known sample can be replacedby a material having an unknown conductivity. Afterrepeating the test, the difference in the response curves canbe correlated to the thermal conductivity of the unknownsubstance. In the sensor shown in Figure 4.1r, the heatedwire is surrounded on the top by a material of knownthermal conductivity; therefore, when it is placed on theflat surface of the unknown sample, its temperatureresponse curve will reflect the thermal conductivity of thatsubstance.
INTELLIGENT TRANSMITTERS AND REMOTE INPUT/OUTPUT (I/O)
This first volume of the Instrumentation Engineers’ Hand-book is devoted to measurement. While the transmission andcontrol related topics are covered in Volume 2 and networksand buses in Volume 3, this paragraph is included here as itrelates to the general topic of temperature monitoring.
Microprocessor-based temperature transmitters havecontinued to evolve in sophistication and capability such thatthere is no credible transmitter on the market today that doesnot use this technology. A transmitter includes an input circuitreferred to as an analog-to-digital (A/D) converter that con-verts the sensor input signal from its analog form into a digitalrepresentation for presentation to the microprocessor. Themicroprocessor performs all of the mathematical manipula-tions of ranging, linearization, error checking, and conver-sion. The output stage accepts the resultant digital represen-tation of the current value of the measurement and convertsthe signal back to an analog signal (D/A) that is typically a4- to 20-mA DC current. For some special applications, 0 to1 Vdc or 0 to 10 Vdc signals may be used and in others thesignal is transmitted digitally using either an open or propri-etary protocol. Some countries have adopted 0 to 20 mA asthe standard transmitted signal.
Just as microprocessors have evolved in sophistication, sohave A/D converters. Eight-bit resolution devices common in
FIG. 4.1rThe design of a thermal conductivity sensor. (Courtesy of ShowaDenko K.K.)
KnownMaterial
mV
mV
Thermocouple
Thermocouple
Thermocouple
HeaterKnown
Unknown
Handle
Lead Wire
Case
Material of KnownThermal Conductivity
Heater
100mm40
mm
30mm
© 2003 by Béla Lipták

580 Temperature Measurement
the 1960s provided a resolution of about ±0.4%. In 2000, thefirst 21-bit resolution A/D was used in a temperature trans-mitter providing a resolution of ±0.00005%. D/A convertershave also evolved with resolutions increasing from 8-bit upto the 18-bit versions used in the better transmitters beginningin 2000. The result of combining these technologies is a uni-versal transmitter that accepts inputs from any TC, RTD, mV,resistance, or potentiometer signal; checks its own calibrationon every measurement cycle; has minimal drift over a wideambient temperature range; incorporates self-diagnostics; andis configured using pushbuttons or simple PC software.
The reconfiguration process is quick and convenient, andit tends to allow for lower inventories by making the trans-mitters interchangeable. Some transmitters are capable ofhandling dual RTD elements. This allows for temperatureaveraging, temperature difference measurement, or automaticRTD sensor switchover if the primary sensor fails in a redun-dant installation. Due to terminal limitations, these modelscan only accept dual 3-wire RTDs. Caution must be used tominimize lead resistance differences to reduce the error.
Fieldbus Structures
In the 1980s, another level of capability was added to fielddevices. Rosemount developed the Highway AddressableRemote Transducer (HART) protocol to enable detailedinformation about the setup and operation of the device tobe superimposed onto the 4- to 20-mA signal. This protocolwas soon released to the public domain. The HART Com-munication Foundation promotes its use in industry and sup-ports its maintenance and growth. The benefits of remoteconfiguration and access to diagnostics have encouraged thedramatic increase in use of HART-enabled instruments.22
During this same time period, a variety of proprietaryprotocols emerged supported by many of the larger manu-facturers that provided comparable benefits of remote setupand diagnostics. Unlike the HART protocol, these productswere limited to use within the manufacturer’s system. In the1990s, a trend emerged for more open protocols to enableplug-and-play of instruments from varying manufacturers towork as part of a fieldbus structure.
Two that have emerged as leaders are Foundation Field-bus and Profibus. Each has their proponents and supportgroups that have been promoting their acceptance. Temper-ature transmitters, as well as other field and control roomdevices, must incorporate the specific fieldbus technology tobe used in these systems. The support tends to favor usingfieldbus technology for new plant construction and majorupgrades where all new instrumentation and cabling wouldbe required. Existing plants with properly functioning legacyinstruments are more likely to stay with existing technology.
In 1979, Modicon introduced the MODBUS protocol asa means of exchanging data between field devices and con-trollers. This protocol serves as a means to share data amongmultiple vendor devices. It is now owned by Schneider Auto-mation and is freely available for use. There are several
temperature multiplexers on the market that can communi-cate with a host system using MODBUS, MODBUS Plus, orMODBUS TCP/IP protocols.23
Ethernet communication has been used for interconnectionof digital equipment in offices and control rooms for manyyears. Its use is now migrating out onto the factory floor. Thereare a variety of products introduced beginning in 2002 thatwill interface process measurements, including temperature,over high speed Ethernet links to host systems using OPC(object linking and embedding for process control) servers.
There is more to making a measurement than the trans-mitter itself. The weakest link in virtually all measurementsis the temperature sensor. The vast majority of temperaturemeasurements are made with either a TC or an RTD. As withthe electronic devices described above, sensors have alsodemonstrated dramatic increases in precision and reliabilityover the years. Higher purity materials and improved manu-facturing processes have provided sensors that more closelymatch theoretical curves and exhibit lower drift than sensorsof the 1980s and the 1990s. It has been generally acceptedthat the more closely a sensor matched its ideal characteris-tics, the more accurate the measurement will be since trans-mitter measuring circuits refer to the ideal data to make themeasurement.
Advanced Transmitters
More advanced transmitters incorporate the ability to matchthe sensor to the transmitter to minimize this error. Onemethod uses the Callander van Deusen method, which definesthree experimentally determined constants that define thetemperature/resistance relationship specific to an RTD. Byentering these data from the RTD tag into the transmitter’sfirmware, the sensor and transmitter become a calibratedsystem. Typical accuracies for this technique are about±0.4°F. For higher precision, at least one vendor offers a bathcalibration technique that allows the transmitter to captureactual values output by the RTD or TC at specific tempera-tures. This method provides system accuracies of about±0.02°F (0.1°C) for RTDs and about ±2°F (1°C) for TCmeasurements. Maximum performance is gained by selectingthe trim points to bracket the operating point.24
Direct connection of temperature sensors to input sub-systems of distributed control systems (DCSs) or program-mable logic controllers (PLCs) is an alternative to using atemperature transmitter for each measurement. This maysound like a way to cut costs. In actuality, on an installedbasis, it is more expensive, far less accurate, and not as robust.It may be suitable for less demanding data acquisition orcontrol applications where wider variations in the measure-ment can be tolerated. The benefits of using transmittersinclude higher precision, sensor-transmitter systems cali-brated to the range of interest, better RFI immunity and noiserejection, transmitter diagnostics, lower wiring costs, lessexpensive input/output (I/O) cards, faster loop checks, andshorter start-ups.
© 2003 by Béla Lipták

4.1 Application and Selection 581
The array of intelligent temperature transmitters on themarket seems almost endless. Some common features of theleading models are: universal inputs from any TC, RTD, mV,resistance or potentiometer; loop-powered with 4–20 mAoutput; digital outputs, and configuration with pushbuttons,PC software, or a handheld configurator. Choices must bemade for which protocol is required: HART, FoundationFieldbus, Profibus, vendor proprietary, Ethernet, or just 4 to20 mA. Some field locations will benefit from local indicationand this feature is optional with most manufacturers. Thereis a considerable cost and performance benefit afforded bypurchasing the sensor and transmitter as a system. This savescost by offering single source responsibility. For applicationswhere it is prudent to separate the sensor from the transmitter,DIN (Deutsch Industrie Norm) rail-mounted transmittersmay be grouped in a marshalling cabinet at a convenientlocation.
TEMPERATURE MEASUREMENT APPLICATIONS
High Temperature Measurement
There are two viable methods for measuring temperaturesup to 2000°F (1100°C): special high-temperature TCs andIR pyrometers. At high temperatures TCs are installed intoprotective wells or protection tubes. When installed horizon-tally, wells tend to droop causing binding on the TC elementwhen it must be removed for replacement and a new oneinserted. The latest design of a TC incorporates a 1 in. sheathwith a flexible cable that can easily be inserted into evenbadly drooping wells.11 Upper limit for this sensor is about2000°F (1100°C). Ceramic wells do not suffer from droopbut have other limitations of low surface strength, brittleness,and low erosion resistance. IR pyrometers offer a very viablenoncontact method to measure temperatures all the way upto 6500°F (3600°C) and would be the best choice for mostapplications. Refer to the detailed description above for addi-tional detail.
Speed of Response
The fundamental problem of measuring the temperature of afluid is one of assuring strong thermal coupling. For a fluidtemperature measurement to have meaning, the sensor mustcome to equilibrium with the temperature of the fluid. Thedifference between the equilibrium temperature of the sensorand the fluid temperature is a direct error. The most commonprocess temperature measurements are made with TC andRTD sensors. Commercial and laboratory applications oftenuse exposed TC beads or RTD elements to obtain fastresponse in clean environments.
Refer to Figure 4.1s for representative mounting config-urations. There are very few industrial measurements wherean exposed sensor would be used. This is because the processof taking the sensor out of service would release pressure or
product from the pipe or vessel where the measurement isbeing made. Therefore, most applications use thermal wellsto isolate the sensor from the process. Accordingly, the massof the well and the piping into which it is inserted are thedominant causes of thermal lag and conduction errors. Theseerrors can be almost insignificant for processes with stable tem-peratures and rapid flow. However, for dynamic temperaturefluctuations or where there is little flow across the sensor, theerrors can be large.
There are various designs of high speed of response sen-sors but most are limited by being manufactured with a pro-tective sheath that runs the length of the well providing a longand massive path for thermal losses. A new design uses lowmass RTDs or TCs in a 1 in. (2.54 cm) sheath to minimize thiseffect.11 To further increase the response, the sensor is springloaded against the tip of the well and inserted with thermallyconductive grease. One well manufacturer offers a finned ther-mal well providing dramatic improvement in the response.25
Fast response is especially valuable for gas applications.Some of the better transmitters update their output severaltimes per second and therefore are rarely the limiting factorin the measurement.
Surface Measurement
Measuring the surface temperatures of moving objects likewebs of paper, plastics, textiles, and metals of rotating cylin-ders (such as calendar rolls, rotary kilns, or drier cans) requires
FIG. 4.1sFluid stream sensor configurations.
FlowOmnidirectional
FlowOmnidirectional
Thermocouple BeadInsulator andWire Support
A-Thermocouple Bead for Measuring Temperature of Low Velocity, Low Temperature Fluids
B-Resistance Thermometer Element for Measuring Temperature of Low Velocity, Low Temperature Fluids
FlowDirection
Flow
Shielding
TemperatureSensor(Thermocoupleor ResistanceThermometer)
Suction ToMaintain Flowover Sensor
Direction
C-Thermocouple or Resistance Element inside Perforated Housing for Mechanical Protection (Predominantly Sensitive to Cross-Axis Flow; Some Radiation Shielding Afforded by Housing)
D-Asperated Shielded Gas Stream Temperature Sensor for High Temperature, High Velocity Gases (Highly Directional Characteristics)
Active ResistanceThermometerLength insideProtective Cover
© 2003 by Béla Lipták

582 Temperature Measurement
special consideration. IR pyrometers offer a cost effectivemethod as described above for many industrial applications.They offer many advantages, including high accuracy and fastresponse, and are especially suited to moving surfaces. How-ever, for stationary surfaces, often a less sophisticated and lesscostly method is called for. The phase shift products offer avisual measurement but have no other output.
There are a variety of mounting methods where either aTC or an RTD may be affixed to the outside of a pipe or vesseland be connected to a transmitter or data logger to get contin-uous information. The design of the mounting hardware andits proper installation are critical in obtaining a representativesurface temperature. The thermodynamics of the applicationare complicated by the thermal losses to the surrounding atmo-sphere, thermal lag of the wall of the vessel or pipe, and therate of change of the medium. A properly designed system willuse a low mass sensor with high speed of response insertedinto a fixture that places the sensor tip as close as possible tothe surface being measured. Refer to Figures 4.1t, 4.1u, and4.1v for some typical examples of mounting configurations.
Measuring the Temperature of Solids
Determination of the allowable size and configuration of thesensor requires some knowledge of the heating or cooling
conditions together with an estimate of the magnitude of thetemperature gradients that are likely to exist in the region inwhich the measurement is to be made. A simple rule-of-thumb indicator to determine if significant gradients arelikely to be present is the magnitude of the Biot modulus(hL/K), where h is the surface heat transfer coefficient, L isthe smallest dimension of the solid, and K is the thermalconductivity of the solid. If this modulus is over 0.2, signif-icant temperature gradients are likely to exist in the solid,and care should be exercised in choosing the size, location,and orientation of the sensor within the solid. If the Biotmodulus is less than 0.2, no significant gradient is expectedand a measurement anywhere on or within the solid shouldgive identical results regardless of size or configuration ofthe sensor. If significant gradients are likely to exist, themaximum rate of heat transfer to the surface of the solid mustbe known or estimated, and the maximum gradient at thepoint measurement must be determined. The following rela-tionship allows the maximum gradient at the surface of asolid to be calculated:
4.1(1)
FIG. 4.1tMounting configurations for surface mounted thermocouple and RTD sensors. (Courtesy of Moore Industries-International, Inc.)
Assemblies for Surface Measurements
25 mm(1.00 in.)
6 mm(0.25 in.)
13 mm(0.50 in.)
Pipe O.D.50 to 304 mm
2 to 12 in.
RetainingWasher
1/2-in.NPT
Pipe Mount Platefor Remote Mount Pipe Mount Plate
for Remote Mount
Pipe Mount Platefor Remote Mount
Flexible
Telflon-coated wires
with 24 or 36 in.
Spring FlexibleTelflon-coated wires
with 24 or 36 in.Spring
FlexibleTelflon-coated wires
with 24 or 36 in.Spring
∆∆
T
X
q
K=
© 2003 by Béla Lipták

4.1 Application and Selection 583
where∆T/∆X = temperature gradient at the surface
q = heat transfer rate per unit area at the surfaceK = thermal conductivity of solid
Under certain conditions of heating or cooling, if mea-surements at points other than the surface are important, itmay be necessary to evaluate anticipated heat transfer con-ditions and resulting temperature gradients.4,5
On the basis of this gradient, it is possible to establishlimits on the size of the sensing device. For example, thelength of any one of the three dimensions of the sensor (leadwires excluded) should not be greater than the distancebetween two points of the process that are different intemperature by more than the acceptable measurement error.It is assumed that the sensors are in satisfactory thermalcoupling with the process material, which is not always thecase. If the thermal coupling is poor, the sensor will notreflect the true temperature history that was experienced bythe solid. This condition can produce dynamic errors.6
The best thermal coupling is achieved by direct bondingof the sensor, such as welding a TC to the solid surface orinto a cavity within the solid. The bond line between thesensor and the solid should be kept as thin as possible andshould not fracture or fail during thermal cycling. Variousepoxy and ceramic cements, with fillers to improve their
FIG. 4.1uThermocouple-type surface temperature sensor designs. (Courtesy of Syscon International Inc.)
Annealing Wire
BrushShapes
Brush Sensor
Tube and Conduit Mills
Calender RollsWebs-Paper, Cloth,Metal, SheetPlastic Finishing
Rotary Ejection Nozzles
Lamps, Bottles, Cans, Annealing,Drying, Pasteurizing
Coating Rolls Area Spot Recording and Averagingof Temperatures: Emprinting and Finishing
Noncontact Sensor
Packaging, Painting,Annealing, Drying Foods
Bather Touch Sensor
FIG. 4.1vRTD-based surface-temperature detector. (Courtesy of Wahl Instru-ments Inc.)
Probe Shank
Epoxy Seal
Glass Substrate Epoxy
Silver Solder Joints
Insulation
Copper Wire
Platinum Wire
.010"(0.25 mm)PlatinumSurface
Platinum.0005" Dia.(0.01 mm)Wire Coil
© 2003 by Béla Lipták

584 Temperature Measurement
conductivity, have been successfully used for such bonding.For example, a flat RTD, which is bonded to a surface witha 0.005 in. (0.1 mm) thick epoxy bond line will produce alag time of about 1 s. This will give a dynamic error equalto the rate of temperature rise of the surface, because adynamic error of 25°F (14°C) corresponds to a rate of surfacetemperature change of 25°F/s.6
Methods of installing temperature sensors on or withinsolid bodies are shown in Figure 4.1w.
Averaging Measurements
There are different considerations depending on the applica-tion. The solution is different for liquids, gasses, or solidsand also depends on the accuracy and speed of responserequired and what is to be done with the measurement results.For a temperature profile in a storage tank that is to be usedfor volume correction for inventory, an array of high accuracyRTDs would be the appropriate choice. There is one manu-facturer that can supply a flexible array of almost any lengthfor easy field installation. The receiving device would thenaverage the input from the various sensors and exclude thosenot covered by product based on the level measurement.There are tank-gauging companies that specialize in thisapplication.
For a high temperature reactor or furnace, the sensingarray would use TCs to generate the signal that can then beaveraged in software by a receiving device. For large air ductsfor furnaces or clean room circulation, a highly accurateaverage temperature is obtained by using an RTD sensor thatis constructed with a continuous resistive element so as toeliminate hot spots. This special RTD should be a 4-wireconstruction and be used with a 4-wire measuring circuit likewhat would be found in a high quality transmitter to obtainan accurate temperature measurement. For gas flow in pipesan RTD and transmitter assembly is an appropriate choice.If the application is for temperature compensation for a massflow calculation, a 4-wire RTD trimmed to match a qualitytransmitter will provide the highest accuracy. Such systemsare available with accuracies of ±0.02°F (0.01°C).
For stationary or moving surfaces of almost any size, theIR pyrometer is the best choice over any range.
Narrow Span Measurements
When the operating point of an application is stable, higheraccuracy can be achieved by reducing the span of the mea-suring instrument. For example, when measuring temperatureof a process that operates at 125° with a variation of ±10°,a range of 0 to 150° would be well suited. An instrumentranged from 0 to 600° would have 4 times less resolution.TCs are generally limited to a minimum span of about 63 to180°F (35 to 82°C), depending on type, while spans using a1000-Ω Platinum RTD with a high quality transmitter maybe as low as 2°F (1°C). Matching a sensor to its transmitteroffers the highest possible accuracy.
INSTALLATION CONSIDERATIONS
When making temperature measurements, two ways havetraditionally been employed to get process readings from thepoint of measurement back to a monitoring and controlsystem.
One method is to utilize sensor extension wires to carrythe low-level signals (Ω or mV) generated by field-mountedRTD or TC sensors. Another is to install temperature trans-mitters at or near the measurement point. The transmitteramplifies and conditions the sensor signal and transmits itover a twisted wire pair back to the control room.
Direct wiring strategies have generally been consideredless expensive and sometimes easier. Transmitter use, becauseof cost considerations, was often reserved for important loopsand applications where signal and loop integrity was a must.
Today, highly functional, yet very affordable, micro-processor-based field-mount temperature transmitters arecomparable in price to direct wiring strategies. There areadditional advantages of using intelligent transmitters thatwill, in most applications, also save considerable time andmaintenance headaches. This is especially true when the mea-surement point is located a long distance from the readoutand control system.
Temperature Transmitters in Place of Direct Wiring
Lower Wiring Costs Direct wiring sensors to a control sys-tem requires the use of sensor extension wires. Not only areextension wires fragile, they also cost three times more thanthe common shielded copper wire used for a temperaturetransmitter’s 4 to 20 mA signal. Using the less expensivewires, transmitters can pay for themselves in wire and conduitcosts alone. The longer the wire run, the greater the potentialsavings.
In retrofit situations, temperature transmitters can beinstalled at the sensor, and the in-place RTD or TC extensionwires can be used to transmit the 4 to 20 mA back to thecontrol system. There is no need to run new copper wires toaccommodate the 4 to 20 mA. No additional installationtime or material costs (including conduit) are incurred, andyou still get all of the advantages of using temperaturetransmitters.
Protect Signals from Plant Noise Common in nearly everyindustrial environment, RFI and EMI can negatively affectprocess signals. Some of the common sources include mobileand stationary radio, television, and hand-held walkie-talkies;radio-controlled overhead cranes; radar; induction heatingsystems; static discharge; high-speed power switching ele-ments; high AC current conductors; large solenoids andrelays; transformers; AC and DC motors; welders; and evenfluorescent lighting.
If there is one or more of these in your plant, RFI/EMIproblems are likely. The result is sometimes just a minor incon-venience. Other times it can be as serious as a plant shutdown.
© 2003 by Béla Lipták
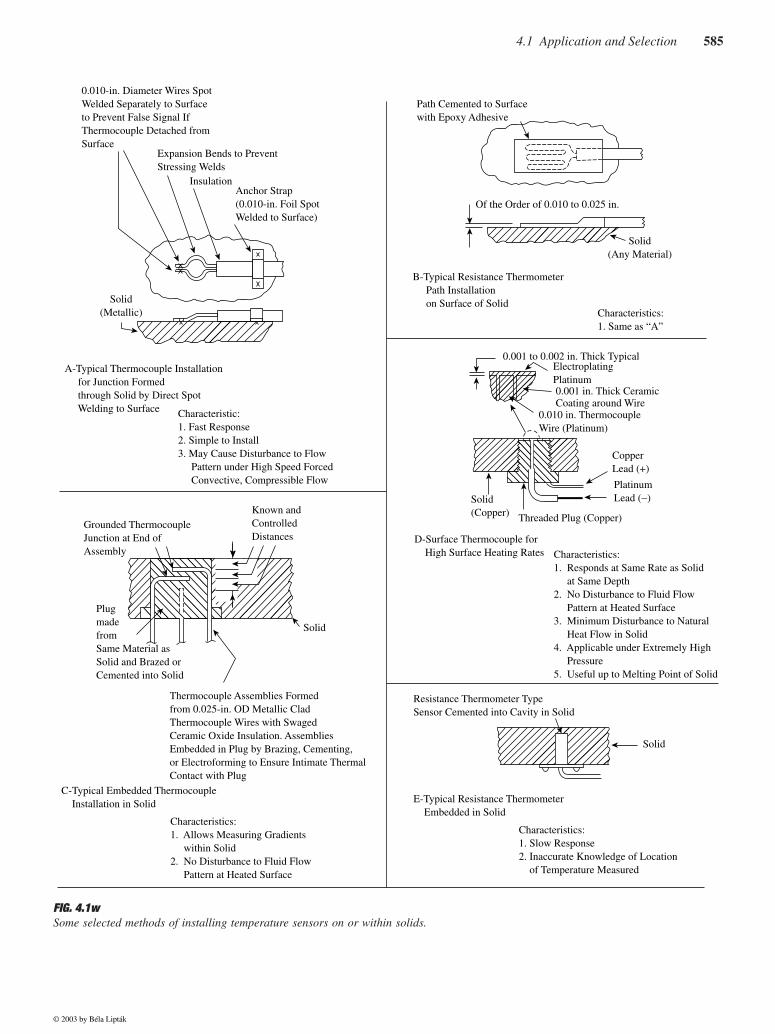
4.1 Application and Selection 585
FIG. 4.1wSome selected methods of installing temperature sensors on or within solids.
0.010-in. Diameter Wires SpotWelded Separately to Surfaceto Prevent False Signal IfThermocouple Detached fromSurface
Expansion Bends to PreventStressing Welds
InsulationAnchor Strap(0.010-in. Foil SpotWelded to Surface)
Solid(Metallic)
A-Typical Thermocouple Installation for Junction Formed through Solid by Direct Spot Welding to Surface Characteristic:
1. Fast Response2. Simple to Install3. May Cause Disturbance to Flow Pattern under High Speed Forced Convective, Compressible Flow
Path Cemented to Surfacewith Epoxy Adhesive
Of the Order of 0.010 to 0.025 in.
Solid(Any Material)
B-Typical Resistance Thermometer Path Installation on Surface of Solid
Characteristics:1. Same as “A”
0.001 to 0.002 in. Thick TypicalElectroplatingPlatinum0.001 in. Thick CeramicCoating around Wire
0.010 in. ThermocoupleWire (Platinum)
CopperLead (+)
Solid(Copper)
PlatinumLead (−)
Threaded Plug (Copper)Grounded ThermocoupleJunction at End ofAssembly
Known andControlledDistances
PlugmadefromSame Material asSolid and Brazed orCemented into Solid
Solid
Thermocouple Assemblies Formedfrom 0.025-in. OD Metallic CladThermocouple Wires with SwagedCeramic Oxide Insulation. AssembliesEmbedded in Plug by Brazing, Cementing, or Electroforming to Ensure Intimate ThermalContact with Plug
D-Surface Thermocouple for High Surface Heating Rates Characteristics:
1. Responds at Same Rate as Solid at Same Depth2. No Disturbance to Fluid Flow Pattern at Heated Surface3. Minimum Disturbance to Natural Heat Flow in Solid4. Applicable under Extremely High Pressure5. Useful up to Melting Point of Solid
C-Typical Embedded Thermocouple Installation in Solid
Characteristics:1. Allows Measuring Gradients within Solid2. No Disturbance to Fluid Flow Pattern at Heated Surface
Resistance Thermometer TypeSensor Cemented into Cavity in Solid
Solid
E-Typical Resistance Thermometer Embedded in Solid
Characteristics:1. Slow Response2. Inaccurate Knowledge of Location of Temperature Measured
© 2003 by Béla Lipták

586 Temperature Measurement
In a direct wiring scheme, the low-level signals generated byan RTD (Ω) or TC (mV) are particularly susceptible to thesignal degrading effects of RFI/EMI. Compounding the prob-lem, sensor extension wires can behave much like anRFI/EMI antenna by actually drawing plant noise to thewires, and affecting weak, low-level signals.
Conversely, a properly designed temperature transmittereffectively negates the effects of incoming RFI noise byconverting a sensor’s low-level signal to a high-level analogsignal (typically 4 to 20 mA). This amplified signal is resis-tant to RFI/EMI and can accurately withstand long distancetransmission from the field, through a noisy plant, back tothe control room. When specifying a transmitter, alwayscheck for RFI/EMI protection. If there is no specificationgiven, it is usually because the instrument is not designed toresist noise. It will probably not perform very well in a noisyplant environment. RFI immunity is specified in standard IEC1000–4–3. A spec of 10 V/m is considered acceptable.
Stop Ground Loops Make sure to choose an isolated trans-mitter. A transmitter’s input/output/power signal isolationprotects against signal inaccuracies caused by ground loops.This is important even when using ungrounded TCs becausetheir insulation will eventually break down.
Reduce Hardware and Stocking Costs With direct wiring,it is necessary to match the sensor type to input-specific DCSand PLC input cards. Sensor input-specific cards usually costa lot more per point than a 4- to 20-mA input card. And sincenumerous sensor types are routinely used in a plant, a largenumber of different cards must be ordered and kept on handas spares. This is not only expensive, but can result in a lotof confusion when installing, maintaining, and replacingequipment. Temperature transmitters incorporate powerfulmicroprocessors that allow them to be easily configured toaccommodate nearly any sensor input type. Their 4- to 20-mAoutput signal is control-system ready. This allows standard-ization and stocking of less expensive 4- to 20-mA DCS andPLC input cards.
Match the Best Sensor to the Application In an intelligenttemperature transmitter strategy, the user can simply changeout the sensor and reconfigure the transmitter to accommo-date the different sensor type. The loop’s twisted pair wiringand existing 4- to 20-mA input boards do not even have tobe touched. Because it is difficult to predict what sensor youwill end up with as process changes are made over the years,make sure to select a universal transmitter that configures toaccept all common temperature sensor types and temperatureranges.
Enhance Accuracy and Stability Using temperature trans-mitters can substantially enhance measurement accuracy.DCS and PLC systems measure readings over the entire (verywide) range of a sensor. Measuring a narrower range pro-duces far more accurate measurements. Transmitters can be
calibrated to any range within a sensor’s overall capabilities.Their measurements are more precise than is possible withmost direct wiring strategies. Better transmitters deliver accu-racy ratings of ±0.23°F (±0.13°C) when paired with a com-mon Platinum 100 RTD sensor over a 200°F (111°C) span.
If better accuracy is required, transmitters can be trimmedto precisely match a particular sensor. Even though sensorsare designed to have a high degree of conformance to anestablished curve, each one (even precision sensors) will varyto some degree from their stated specification. Transmitterswithout matching capability assume that the sensor matchesits published curve. To properly determine the measurementaccuracy, the actual sensor offset error must be combinedwith the transmitter error.
Simplify Engineering and Prevent Miswiring In place of num-erous sensor lead-wire and DCS/PLC input board combina-tions, engineering designs and drawings will only need toshow one wire type (twisted wire pair) and one input boardtype (4 to 20 mA). This one wire and one input board systemmeans maintenance is greatly simplified, and the chances ofloop miswiring are virtually eliminated.
Ease Future Upgrades Throughout the lifetime of a pro-cess, enhancements are routinely made to accommodate themanufacture of upgraded or even completely new products.Process changes may require different measurement rangesor greater temperature accuracy than was previously required.Either of these conditions may necessitate a change in thetype of sensors that are used.
In a direct wired system, changing sensors generallymeans removing existing extension wire and pulling newwire. This is because extension wire must be matched to thesensor type. Additional costs are incurred when the controlsystem’s costly input boards (if also sensor-type dependent)must be replaced to accommodate the new sensors.
Lower Maintenance Time and Expense Temperature trans-mitters have come a long way since the days of fixed-range,inflexible instruments. High quality transmitters are not onlyuniversal in regards to input type and range, they also incor-porate powerful sensor diagnostics that save considerabletime and money.
Temperature transmitters with intelligent diagnostic capa-bilities continuously monitor sensor operation and quicklyfind and diagnose sensor failures. If a wire breaks or other-wise stops sending a signal during operation, the transmittersends the output upscale or downscale to warn of sensorburnout or other unwanted conditions. Furthermore, thesetransmitters can tell you which wire has broken via an errormessage on an integral digital display, using their PC con-figuration software, or via HART diagnostics. Specific faultmessages eliminate the work of removing the sensor orchecking all of the lead wires to diagnose a problem. Duringstart-ups, in the middle of the night or in the middle of winter,this can be a huge timesaving advantage.
© 2003 by Béla Lipták
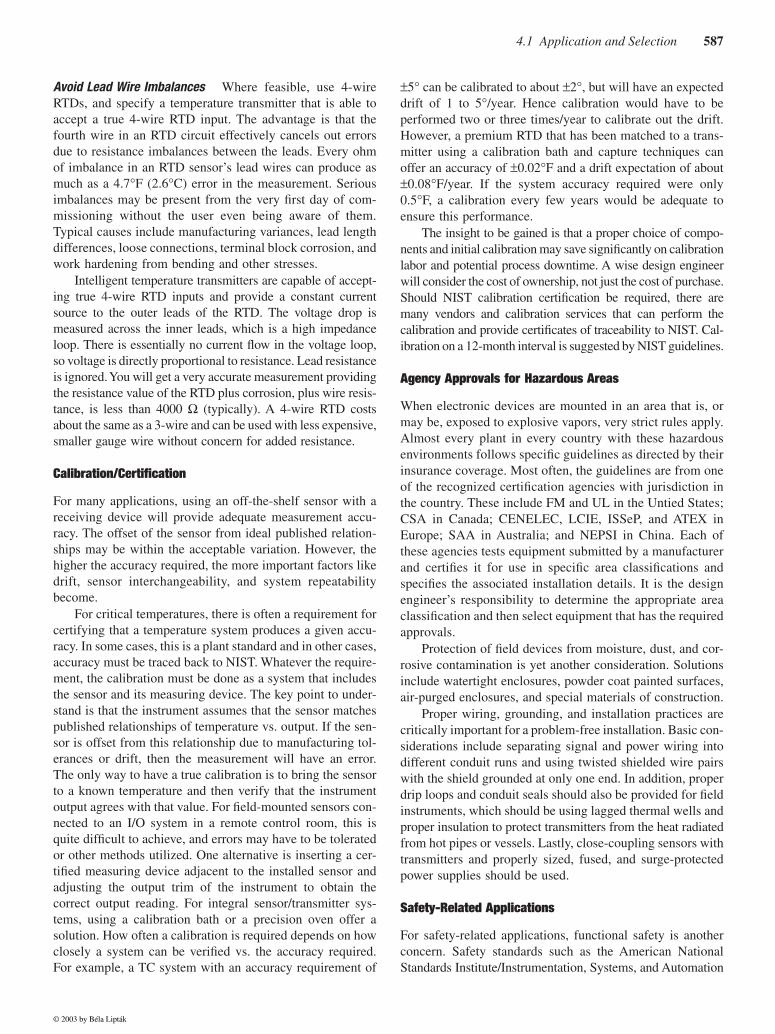
4.1 Application and Selection 587
Avoid Lead Wire Imbalances Where feasible, use 4-wireRTDs, and specify a temperature transmitter that is able toaccept a true 4-wire RTD input. The advantage is that thefourth wire in an RTD circuit effectively cancels out errorsdue to resistance imbalances between the leads. Every ohmof imbalance in an RTD sensor’s lead wires can produce asmuch as a 4.7°F (2.6°C) error in the measurement. Seriousimbalances may be present from the very first day of com-missioning without the user even being aware of them.Typical causes include manufacturing variances, lead lengthdifferences, loose connections, terminal block corrosion, andwork hardening from bending and other stresses.
Intelligent temperature transmitters are capable of accept-ing true 4-wire RTD inputs and provide a constant currentsource to the outer leads of the RTD. The voltage drop ismeasured across the inner leads, which is a high impedanceloop. There is essentially no current flow in the voltage loop,so voltage is directly proportional to resistance. Lead resistanceis ignored. You will get a very accurate measurement providingthe resistance value of the RTD plus corrosion, plus wire resis-tance, is less than 4000 Ω (typically). A 4-wire RTD costsabout the same as a 3-wire and can be used with less expensive,smaller gauge wire without concern for added resistance.
Calibration/Certification
For many applications, using an off-the-shelf sensor with areceiving device will provide adequate measurement accu-racy. The offset of the sensor from ideal published relation-ships may be within the acceptable variation. However, thehigher the accuracy required, the more important factors likedrift, sensor interchangeability, and system repeatabilitybecome.
For critical temperatures, there is often a requirement forcertifying that a temperature system produces a given accu-racy. In some cases, this is a plant standard and in other cases,accuracy must be traced back to NIST. Whatever the require-ment, the calibration must be done as a system that includesthe sensor and its measuring device. The key point to under-stand is that the instrument assumes that the sensor matchespublished relationships of temperature vs. output. If the sen-sor is offset from this relationship due to manufacturing tol-erances or drift, then the measurement will have an error.The only way to have a true calibration is to bring the sensorto a known temperature and then verify that the instrumentoutput agrees with that value. For field-mounted sensors con-nected to an I/O system in a remote control room, this isquite difficult to achieve, and errors may have to be toleratedor other methods utilized. One alternative is inserting a cer-tified measuring device adjacent to the installed sensor andadjusting the output trim of the instrument to obtain thecorrect output reading. For integral sensor/transmitter sys-tems, using a calibration bath or a precision oven offer asolution. How often a calibration is required depends on howclosely a system can be verified vs. the accuracy required.For example, a TC system with an accuracy requirement of
±5° can be calibrated to about ±2°, but will have an expecteddrift of 1 to 5°/year. Hence calibration would have to beperformed two or three times/year to calibrate out the drift.However, a premium RTD that has been matched to a trans-mitter using a calibration bath and capture techniques canoffer an accuracy of ±0.02°F and a drift expectation of about±0.08°F/year. If the system accuracy required were only0.5°F, a calibration every few years would be adequate toensure this performance.
The insight to be gained is that a proper choice of compo-nents and initial calibration may save significantly on calibrationlabor and potential process downtime. A wise design engineerwill consider the cost of ownership, not just the cost of purchase.Should NIST calibration certification be required, there aremany vendors and calibration services that can perform thecalibration and provide certificates of traceability to NIST. Cal-ibration on a 12-month interval is suggested by NIST guidelines.
Agency Approvals for Hazardous Areas
When electronic devices are mounted in an area that is, ormay be, exposed to explosive vapors, very strict rules apply.Almost every plant in every country with these hazardousenvironments follows specific guidelines as directed by theirinsurance coverage. Most often, the guidelines are from oneof the recognized certification agencies with jurisdiction inthe country. These include FM and UL in the Untied States;CSA in Canada; CENELEC, LCIE, ISSeP, and ATEX inEurope; SAA in Australia; and NEPSI in China. Each ofthese agencies tests equipment submitted by a manufacturerand certifies it for use in specific area classifications andspecifies the associated installation details. It is the designengineer’s responsibility to determine the appropriate areaclassification and then select equipment that has the requiredapprovals.
Protection of field devices from moisture, dust, and cor-rosive contamination is yet another consideration. Solutionsinclude watertight enclosures, powder coat painted surfaces,air-purged enclosures, and special materials of construction.
Proper wiring, grounding, and installation practices arecritically important for a problem-free installation. Basic con-siderations include separating signal and power wiring intodifferent conduit runs and using twisted shielded wire pairswith the shield grounded at only one end. In addition, properdrip loops and conduit seals should also be provided for fieldinstruments, which should be using lagged thermal wells andproper insulation to protect transmitters from the heat radiatedfrom hot pipes or vessels. Lastly, close-coupling sensors withtransmitters and properly sized, fused, and surge-protectedpower supplies should be used.
Safety-Related Applications
For safety-related applications, functional safety is anotherconcern. Safety standards such as the American NationalStandards Institute/Instrumentation, Systems, and Automation
© 2003 by Béla Lipták

588 Temperature Measurement
Society 84.01, IEC 61508, and IEC 61511 offer guidance formaximizing reliability and availability of devices used insafety related applications. The higher the Safety IntegrityLevel (SIL) required, the higher the availability of the devicesin the loop must be to perform their designated task. Toprevent nuisance failure situations, consideration is given tothe reliability of the devices.
To verify that an instrument loop meets specific SILs,reliability data on all of the loop devices must be used inverification equations as suggested by the standards. Leadingtransmitter manufacturers offer these data in the form ofFailure Modes, Effects, and Diagnostic Analysis reports. Fail-ure probability data from these reports are used in the equa-tions to verify that the loop components selected provide therequired SIL. High reliability instruments do not necessarilydemand a premium price. It seems a wise choice to standard-ize within a plant on products that offer documented reliabil-ity data from recognized third-party agencies for all applica-tions, not just those that are safety related. It is clear thathigher reliability requires less maintenance and produces lessdowntime of the process.
References
1. Lipták, B.G., “Overview of Coal Conversion Process Instrumentation,”Argonne National Laboratory Publication ANL-FE-49628-TM01,May 1980.
2. Stimson, H.F., “International Practical Temperature Scale of 1948, TextRevision of 1960,” NBS Monograph 37, 1961.
3. NBS Special Publication 300, Vol. II, January 1969.4. Giedt, W.H., Principles of Engineering Heat Transfer, New York: Van
Nostrand, 1957.5. Carslow, H.S. and Jaeger, J.C., Conduction of Heat in Solids, London:
Oxford, 1947.6. Rall, D.L. and Hornbaker, D.R., “A Rational Approach to the Defini-
tion of a Meaningful Response Time for Surface Temperature Trans-fer,” 21st Annual Instrumentation, Systems, and Automation SocietyConference, New York, October 22–27, 1966.
7. Editor, “Universal Sensor Saves Time and Money,” Canadian ProcessEquipment and Control News, April 2001.
8. Miller & Weber, Inc., Ridgewood, NY, www.millerweber.com,9. Omega Engineering, Stamford, CT, www.omega.com/temperature/Z/
pdf/z013–015.pdf.10. Omega Engineering, Stamford, CT, www.omega.com/temperature/
Z/zsection.asp.11. Moore Industries, North Hills, CA, www.miinet.com.12. Thermocouple Technical Reference Data, ISE Inc., Cleveland, OH,
instserv.com/orphn/rmocoupl.htm.13. Davis Inotek Instruments, www.inotek.com/Catalog/pyromation1th.html.14. Thin Film RTD Temperature Sensors: Series 300, Burns Engineering,
Minnetonka, MN, www.burnsengineering.com/product/p3.htm.15. Thermocouple Table Downloads, Temperatures.com, Brecksville, OH,
www.temperatures.com/tctables.html.16. Thermo Electric Co., Inc., Saddle Brook, NJ, www.thermo-electric-
direct.com/thermo/id10.html.17. Wika Instrument Corporation, Lawrenceville, GA, www.wika.com/
B00.html.18. Omega Engineering, Stamford, CT, www.omega.com/pdf/temperature/
Z/pdf/z086.pdf.
19. Omega Engineering, Stamford, CT, www.omega.com/pdf/temperature/Z/pdf/z088–089.pdf.
20. Omega Engineering, Stamford, CT, www.omega.com/pdf/temperature/Z/pdf/z067–069.pdf.
21. PETA Solutions, U.K., www.thermal-instruments.com/.22. Hart Communication Foundation, Austin, TX, www.hartcomm.org/.23. Schneider Electric, Palatine, IL, www.modicon.com/Default.htm.24. Madden, J.R., “Sensor-to-Transmitter Trimming Offers Precise Tem-
perature Calibration,” Control Engineering Magazine, October 2001.25. ThermoSync Temperature Management System, PGI International,
Houston, TX, www.pgiint.com/thermosync/.
Bibliography
Ackland, K., Selecting the right infrared temperature sensor, InTech, June 1998.Adler, C.B., “Reliability Aspects of Temperature Measurement,” Instrumen-
tation, Systems, and Automation Society Conference, Chicago, 2001.Bediones, D. and Wang, T.P., “Criteria for the Selection of Thermocouples
Versus RTD’s in Industrial Applications,” Paper #91–0300, Instrumen-tation, Systems, and Automation Society, Toronto, 1991.
Bidini, G., “A Method for the Thermo-Fluid Dynamic Design of Gas TurbineTotal Temperature Probes,” Paper #91–0511, Instrumentation, Systems,and Automation Society Conference, Toronto, 1991.
Bliss, P. and Morgan, R.K., “Errors in Temperature Measurement,” Instru-mentation Technology, March 1971.
Bluestein, I., “Understanding Contact Temperature Sensors,” Sensors,October 2001.
Bonkowski, J., “Infrared Thermometry,” Measurements and Control, February1984.
Carlson, D.R., “Temperature Measurement in Process Control,” InTech,October 1990.
Carlson D.R., “Transmitting a Remote Temperature,” Control, April 1989.Desmarais, R. and Breuer, J., “How to Select and Use the Right Temperature
Sensor,” Sensors, January 2001.Hage, J., “Smart Temperature Transmitter Accents Accuracy,” Control,
September 1999.Hall, J., “Applying Temperature Sensors,” Instruments and Control Systems,
June 1980.Hashemian, H.M. and Peterson, K.M., “Assuring Accurate Temperature
Measurement,” InTech, October 1989.Hormuth, G.A., “Ways to Measure Temperature,” Control Engineering,
Reprint No. 948, 1971.Instrumentation, Systems, and Automation Society Standards, Mc96, Tem-
perature Measurement, TC Research Triangle Park, NC, 1982.Instrumentation, Systems, and Automation Society Standards, SP 1.5, Noncon-
tacting Temperature Measurement Devices, Research Triangle Park, NC.Jutila, J.M., “Temperature Instrumentation,” Instrumentation Technology,
February 1980.Kreider, K., “Thermocouple Research at NIST,” Paper #91–0301, Instrument
Society of America Conference, Toronto, 1991.Krigman, A., “Temperature Instrumentation: Recent Patent Activity,” InTech,
August 1983.Langan, P.E. and Ironside, D.S., “Calibration Ensures Accurate Temperature
Measurement,” InTech, October 1989.Lear, R., “A Review of Cryogenic Temperature Sensors,” Instrument Society
of America Conference, Houston, TX, October 1992.Leewis, W., “The International Temperature Scale of 1990,” Paper
#91–0302, Instrument Instrumentation, Systems, and AutomationSociety Conference, 1991.
Lipták, B.G., “Overview of Coal Conversion Process Instrumentation,”Argonne National Laboratories Publication ANL-FE-49628-TM01,Argonne, IL, 1969.
Magison, E., “Selecting the Right Temperature Sensor,” InTech, February 1993.Magison, E., Temperature measurement, InTech, October 25, 2001.
© 2003 by Béla Lipták

4.1 Application and Selection 589
Peacock, G.R., “Radiation Thermometry: Temperature Measurement with-out Contact,” Paper #91–0305, Instrumentation, Systems, and Auto-mation Society Conference, Toronto, 1991.
Peterson, W., “Choosing the Right Temperature Transmitter,” InTech, April 1991.Plumb, H.H., “Temperature: Its Measure and Control in Science and Indus-
try,” 5th Symposium on Temperature, National Bureau of Standards,American Institute of Physics, Instrumentation, Systems, and Automa-tion Society, Chicago, 1971.
Prentice, G.R., “Seven Reasons Why Temperature Transmitters are BetterThan Direct Wiring,” Process Heating, June 1999.
Schooley, J.F., “State of the Art of the Instrumentation for High TemperatureThermometry,” Publication Number ANL-78–7, Argonne NationalLaboratories Symposium, Argonne, IL, 1977.
Shepard, R.L. et al., “Development of Long Life, High Reliability, RemotelyOperated Johnson Noise Thermometer,” Paper #91–0306, Instrumen-tation, Systems, and Automation Society Conference, Toronto, 1991.
Stockham, R., “Temperature Transmitters Take the Lead Over Direct Wir-ing,” Control and Instrumentation, 1999 Product Survey Directory.
Volbrecht, A. and Gordon, W., “Temperature Measurement: Making Senseof it All,” Sensors, June 1998.
© 2003 by Béla Lipták