temperature functions in biology and their application … · van't hoff's rule by...
TRANSCRIPT

OIKOS 49: 177-190. Copenhagen 1987
Temperature functions in biology and their application to algal growth constants
Gunnel Ahlgren
Ahlgren, G. 1987. Temperature functions in biology and their application to algal growth constants. - Oikos 49: 177-190.
Various kinds of temperature rules have been proposed for biological use, but rea- sons for choosing one before another have seldom been given. Arguments for such choices should include both theoretical and mathematical-statistical aspects. In this paper the relationships of algal growth constants, such as ~t (maximum specific growth rate), q0 (minimum nutrient content of the algae), Y (yield coefficient) and Ks (half- saturation constant for growth) with temperature (t) were investigated. The growth constants were estimated from growth experiments with the green alga Scenedesmus quadricauda performed in batch and P-limited chemostat cultures at t between 3 and 25°C. Additional growth data from different algal populations were estimated from 14C experiments in an incubator and in the field (0-20°C). The dependence of both (A and AZ (assimilation number) on t was generally de- scribed better by Belehradek's equation based on a "physical view", i.e., the rate of biological processes is more likely controlled by physical processes such as diffusion and viscosity than by equations of Berthelot's or Van't Hoff-Arrhenius' types, which were derived from chemical processes. Within smaller t intervals, Burckhardt-Har- vey's equation (linear) often gave an equally good fit. For Scenedesmus the parameter q0 can be described by a 2nd degree polynomial. The limit value of Y at ,t = 0 versus t can also be best described by Belehradek's equation. Both Ks and Y at ut = - seem to be independent of t. Many examples from zoology also show statistically the most accurate fit to Belehra- dek's equation. On the whole, biological processes seldom show exponential in- creases with t. For example, the RGT-rule (Q0l), which is so widely used even today, often gives artificial "breaks" in the temperature coefficients. An equation of Beleh- radek's type should therefore be more generally accepted, also because its par- ameters appear to have some ecological significance.
G. Ahlgren, Inst. of Limnology, Univ. of Uppsala, Box 557, S-75122 Uppsala, Swe- den.
1. Introduction
The amount of data on algal growth constants, such as (t (maximum specific growth rate), qo (minimum nutrient content of the algae), Y (yield coefficient, i.e., biomass produced/nutrient consumed) and Ks (half-saturation constant for growth), estimated at different tempera- tures, is increasing (e.g., Goldman 1979, Zevenboom 1980, Rhee and Gotham 1981, Tilman et al. 1981, Me- chling and Kilham 1982), and it is clear that tempera- ture has an influence on some of the constants. How-
ever, to establish general models of algal growth for use
Accepted 23 October 1986 © OIKOS
in long-term predictions, it is necessary to express this temperature effect in quantitative terms. A further in- terest for such quantitative descriptions is the increasing "thermal pollution" emitted by different kinds of energy plants, e.g., coal and nuclear power stations, and the cooling of lake waters through "heat pumps". Hitherto, such descriptions only exist for the growth constant {t (Eppley 1972, Goldman and Carpenter 1974). Their ex- ponential functions are not identical but the similarity is apparent (see Fig. 5). Eppley based his function on data from batch cultures of laboratory algae, using in fact Berthelot's equation from 1862 (incorrectly named as
12 OIKOS 49:2 (1987) 177
This content downloaded from 128.95.220.71 on Wed, 24 May 2017 16:12:31 UTCAll use subject to http://about.jstor.org/terms
SJC_203

Van't Hoff's rule by Eppley). Goldman and Carpenter, on the other hand, based their results on data from con- tinuous cultures and used Arrhenius' (1889) equation. Fewer data exist on the growth constants Y, qo and Ks, and no temperature functions are established. Some of the data of qo and Ks point to a U-shaped relationship (Goldman 1977, 1979, Ahlgren 1978a, Goldman and Mann 1980, Mechling and Kilham 1982). A limited tem- perature range has also been considered, mostly be- tween 10 and 20°C.
From a general point of view, the study of the influ- ence of temperature on growth and metabolism can be traced back far into the past, and various kinds of tem- perature rules, more or less adequate, have been pro- posed for biological use. Living matter is a heterogen- ous system where reactions take place at the interfaces, and it cannot be expected that a single temperature for- mula should hold for all biological processes. All tem- perature formulae in biology are, therefore, of merely descriptive value (Belehradek 1935). However, the net velocity of the whole depends on the slowest stage, which may be diffusion. As the main purpose of my pro- ject was to describe quantitatively the dependence of growth constants on temperature, it was necessary to make a literature study on the temperature rules used in biology. This is summarized in a separate section (Sect. 2), giving reasons for choosing the rules which are most useful for testing biological data.
The present paper also describes results from growth experiments with the green alga Scenedesmus quad- ricauda Turp. performed in batch and chemostat cul- tures at temperatures between 3 and 25°C. Additional 14C experiments were performed with different algae in an incubator at different temperatures as well as field studies, even under ice. As some of the temperature rules tested contain an important scale correction con- stant (a = biological zero), some growth experiments were also added in order to estimate that constant for
the different algae tested.
2. Temperature rules used in biology
Belehradek (1935) made an extensive examination of the formulae used in biological processes. They can be divided into three groups:
Group I (Rules of thermal sums): The most important are (not seen):
Reaumur (1735) (and others) Burckhardt (1860) Harvey (1911)
y.t=K
y(t-a)= K v= k-t
where y = time, t = temperature, K and k = constants, a = minimum temperature (biological zero), v = velocity.
If, in Harvey's equation, k is put equal to 1/K and v is the reciprocal of time (k = 1/K and v = 1/y), this for- mula (3) becomes identical with Reaumur's (1) equa- tion. Analogously, if y = 1/v and K = 1/k in Bur- ckhardt's equation, it turns into
v = k(t-a) (4)
i.e., a linear form where the Y-intercept =-k and a = -Y-intercept/k or a = X-intercept. The four equa- tions 1 to 4 are, thus, mathematical forms of the well- known "rule of thermal sums" (see e.g., Winberg 1971:47).
Group II (Exponential equations): The following equations have been introduced by chem- ists:
Berthelot (1862): Van't Hoff (1884): Simplified form: (RGT-rule) Arrhenius (1889):
m = n-At (5) dlnk,/dT-dlnkl/dT = q/2-T2 (6) Qlo0 = kt+lo/kt = 2-3 or (7) Qlo = (k2/kl) exp[10/(t2-tl)] (8) Qtl = Qt exp[A(T1-To)/To T1] (9)
where n, A = constants m, k, e = reaction velocity
q = heat energy R = the gas constant (-2) t = temperature T = temperature in Kelvin degrees
(T= t + 273). Qlo0 = temperature coefficient
A (Eq. 9) = half of the heat energy which is needed to convert 1 mol of the in- active substance to active substance
(A = q/R).
(Eq. 8 permits of calculating Qlo for any temperature difference.) In his hypothesis about "active and inac- tive" cane sugar Arrhenius (1889) provided the the- oretical base for Van't Hoff's rule (see Cohen 1896). The simplified form (Eq. 7), stated first by Cohen (1896), is also called the RGT-rule (Ge. Reaktionsge- schwindigkeit-Temperatur-Regel, see Kanitz 1915). This form is the most well-known and is widely applied even to-day. It was, however, found very early that Qlo varied considerably at different temperatures and dif- ferent "explanations" were looked for, e.g., imperfec- tions of the experimental technique. Soon it became ob- vious that the inconsistency of Qlo with temperature was not accidental but systematic. The most accepted view to-day is that Qlo is not a true constant, i.e., the RGT- rule is not valid for biological reactions. Arrhenius' equation (9) therefore became more popular and was introduced into biology because it seemed to apply to chemical processes with more accuracy than the RGT- rule.
OIKOS 49:2 (1987) 178
This content downloaded from 128.95.220.71 on Wed, 24 May 2017 16:12:31 UTCAll use subject to http://about.jstor.org/terms
SJC_203

Another rule which is frequently used for tempera- ture corrections, e.g., in models (Ahlgren 1975, Kinnu- nen et al. 1982) is
Streeter and Phelps (1925): KI/K2 = 0(1 T-2) (10)
where T1 and T2 are two temperatures and K1 and K2 the corresponding values of a velocity constant. 0 is the thermal coefficient. This function was empirically found by Streeter and Phelps (1925), obviously independent of Berthelot's (5) or Arrhenius' (9) equations, from which Eq. (10) is easily derived.
However, in the Van't Hoff-Arrhenius' formula the temperature is entered as T, i.e., the absolute tem- perature. But 1/T plotted against t within the range which is of interest for biological processes, 0-40°C, is an almost straight line (Belehradek 1935). Therefore, Celcius degrees will do just as well. But this also means that there are no principal differences between the tem- perature coefficients Qo0 and q in Van't Hoff's, A in Ar- rhenius', A in Berthelot's and 0 in Streeter and Phelp's equations which, in turn, means that all criticism of Q0l also applies to the other coefficients mentioned.
Group III (built on physical processes): The lack of any rational temperature formula in biology led to Belehradek proposing a new empirical equation:
Belehradek (1926):
Later modified:
y= a/tb or v = a. tb
v = a(t-a)b
where a and b = constants, y = time, v = velocity (the reciprocal of time) and a = biological zero. The expo- nent b generally has a value betwen 0.6 and 4.0, but is mostly between 1.0 and 3.0. When it equals 1, the for- mula becomes identical with that of the thermal summa-
tion (1-4). Belehradek based his rule on the view that many biological processess are probably not controlled by chemical processes but by physical processes such as diffusion and viscosity.
The temperature formulas which are useful for testing are, thus, Burckhardt-Harvey's (4), Berthelot's (5) and Belehradek's (13) equations. Fits of Van't Hoff's and Arrhenius' formulas are abandoned, as they in principle are the same as Berthelot's exponential equation within the actual temperature range (0-40°C).
3. Methods
Scenedesmus quadricauda was grown in chemostats at five different temperatures; 5, 10, 15, 20 and 25°C, in continuous light with phosphorus as the limiting nu- trient. At the two lowest temperatures the chemostats (described in detail in Ahlgren 1977) were provided with a cooling jacket and cooled by a cooling bath (Heto cooling bath, type CB11).
To find out the optimum light intensity at each tem-
perature, preliminary batch experiments with different light intensities were performed in the chemostats with-
out flow. Growth curves were followed and (f estimated by fitting Verhulst's (1838) equation to the data (for the derivation of the equation, see Batschelet 1971):
B, = K/[1+exp(a-b. t)] (14)
where
Bt = biomass at the time t Bo = biomass at the time 0 K = maximum biomass (carrying capacity) a = ln((K-B0)/Bo) = ln(K/Bo-1) [b = maximum specific growth rate in batch cultures t = time.
Estimation of sb with Verhulst's equation should give more accurate results than the more generally used geo- metric J-curve, Bt = Bo exp(u. -t), for several reasons. Verhulst's equation is a logistic expression for restricted growth (S-curve), whereas the J-curve is an expression for unlimited growth. Besides, by using the J-curve, a certain subjective judgement is necessary when the data of the logarithmic growth phase had to be sorted out (cf. Ahlgren 1978a: Figs 3 and 4). This growth phase can also be very short or even lacking. The S-curve can also be used when the growth curve shows some irregular- ities, a situation which makes use of the J-curve very dif- ficult or even impossible. When the algal growth had passed the exponential phase, the experiments were stopped for analysis of C-, N-, P- and Chl-contents of the alga.
The culture medium was Z8' (see Ahlgren 1977). The chemical analyses of P04-P, total-P and dry weight (DW) were described in Ahlgren (1977). The sensitivity of the dissolved orthophosphate analysis (P04-P) was increased by extracting double the amount of the mo- lybdenum blue complex (80 ml) into 10 ml isobutanol. The detection limit for P04-P was, thus, 0.1-0.2 sg 1~1. The analyses were always made in duplicates, and the differences were mostly small (<10%). On a few occa- sions the difference between the duplicates could be about 50% at the lowest level (0.1-0.5 (tg 11) and about 25% at higher levels (1-5 jig I-1). The chlorophyll method was described in Ahlgren (1983). Cell-C and cell-N were analysed using an elemental analyzer (Carlo Erba, Mod. 1106).
The light intensity was measured with a spherical im- mersible sensor in the center of the reactor (QSL-100, Biospherical Instruments Inc.). Light sources in the chemostat assays were Philips light tubes (TL 32/20 W), and those in batch cultures were the same as well as a
new light tube named "True lite" (T.I.), giving a light quality close to daylight.
14C experiments were performed in an incubator built according to Steemann Nielsen (Steemann Nielsen and Hansen 1961, Steemann Nielsen and Willemoes 1971).
12* OIKOS 49:2 (1987) 179
This content downloaded from 128.95.220.71 on Wed, 24 May 2017 16:12:31 UTCAll use subject to http://about.jstor.org/terms
SJC_203
The algae were adapted to the experimental tempera- ture for one day, different temperatures being estab- lished in different thermostat rooms. A light gradient was produced by covering the bottles with varying layers of black netting.
Field experiments were performed with the ordinary 14C technique. The light penetration was measured with a LI-COR instrument (LI-185 Quantum photometer) with an underwater quantum sensor (QUW 220-7402) and expressed as percent of the values just beneath the surface. The mean insolation at optimum depth was then estimated by taking the percent values of the sur- face insolation integrated over the exposure time.
The different growth constants were estimated by fit- ting suitable equations to the data using the SAS pro- gram NLIN (SAS Users Guide 1979).
4. Results
4.1. Batch experiments
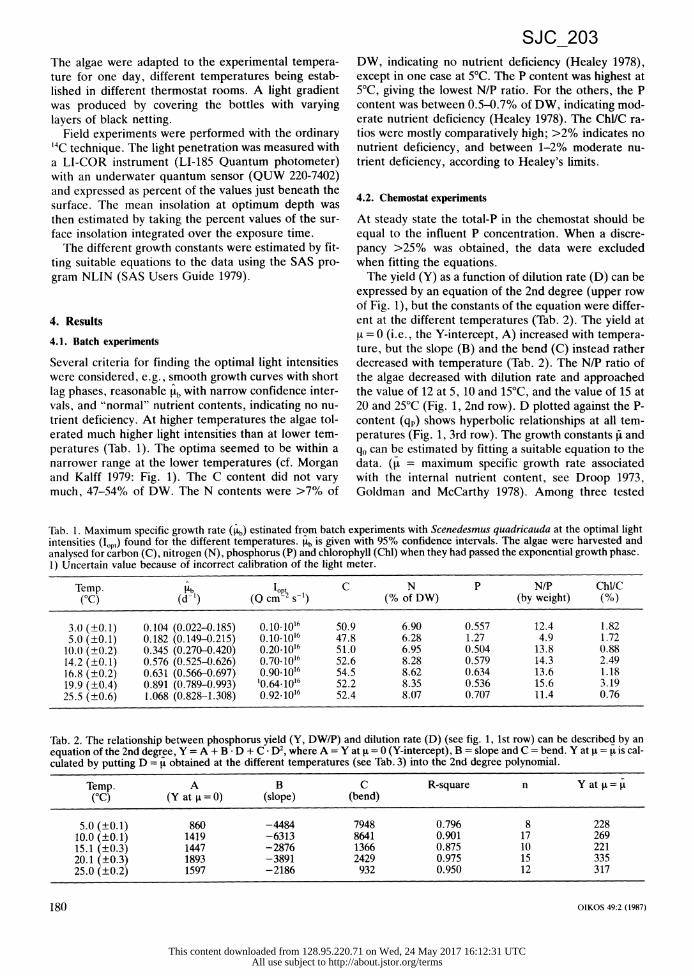
Several criteria for finding the optimal light intensities were considered, e.g., smooth growth curves with short lag phases, reasonable itb with narrow confidence inter- vals, and "normal" nutrient contents, indicating no nu- trient deficiency. At higher temperatures the algae tol- erated much higher light intensities than at lower tem- peratures (Tab. 1). The optima seemed to be within a narrower range at the lower temperatures (cf. Morgan and Kalff 1979: Fig. 1). The C content did not vary much, 47-54% of DW. The N contents were >7% of
DW, indicating no nutrient deficiency (Healey 1978),
except in one case at 5°C. The P content was highest at 5°C, giving the lowest N/P ratio. For the others, the P content was between 0.5-0.7% of DW, indicating mod- erate nutrient deficiency (Healey 1978). The Chl/C ra- tios were mostly comparatively high; >2% indicates no nutrient deficiency, and between 1-2% moderate nu- trient deficiency, according to Healey's limits.
4.2. Chemostat experiments
At steady state the total-P in the chemostat should be equal to the influent P concentration. When a discre- pancy >25% was obtained, the data were excluded when fitting the equations.
The yield (Y) as a function of dilution rate (D) can be expressed by an equation of the 2nd degree (upper row of Fig. 1), but the constants of the equation were differ- ent at the different temperatures (Tab. 2). The yield at lA = 0 (i.e., the Y-intercept, A) increased with tempera- ture, but the slope (B) and the bend (C) instead rather decreased with temperature (Tab. 2). The N/P ratio of the algae decreased with dilution rate and approached the value of 12 at 5, 10 and 15°C, and the value of 15 at 20 and 25°C (Fig. 1, 2nd row). D plotted against the P- content (qp) shows hyperbolic relationships at all tem- peratures (Fig. 1, 3rd row). The growth constants pi and q0 can be estimated by fitting a suitable equation to the data. ([t = maximum specific growth rate associated with the internal nutrient content, see Droop 1973, Goldman and McCarthy 1978). Among three tested
Tab. 1. Maximum specific growth rate (b) estinated from batch experiments with Scenedesmus quadricauda at the optimal light intensities (lop,) found for the different temperatures. pb is given with 95% confidence intervals. The algae were harvested and analysed for carbon (C), nitrogen (N), phosphorus (P) and chlorophyll (Chl) when they had passed the exponential growth phase. 1) Uncertain value because of incorrect calibration of the light meter.
Temp. b^ op C N P N/P Chl/C (°C) (d-1) (Q cm-2 s-') (% of DW) (by weight) (%)
3.0 (+0.1) 0.104 (0.022-0.185) 0.10-1016 50.9 6.90 0.557 12.4 1.82 5.0 (+0.1) 0.182 (0.149-0.215) 0.10 1016 47.8 6.28 1.27 4.9 1.72 10.0 (+0.2) 0.345 (0.270-0.420) 0.20-1016 51.0 6.95 0.504 13.8 0.88 14.2 (±0.1) 0.576 (0.525-0.626) 0.70.1016 52.6 8.28 0.579 14.3 2.49 16.8 (+0.2) 0.631 (0.566-0.697) 0.90-1016 54.5 8.62 0.634 13.6 1.18 19.9 (+0.4) 0.891 (0.789-0.993) 10.64-1016 52.2 8.35 0.536 15.6 3.19 25.5 (+0.6) 1.068 (0.828-1.308) 0.92-1016 52.4 8.07 0.707 11.4 0.76
Tab. 2. The relationship between phosphorus yield (Y, DW/P) and dilution rate (D) (see tig. 1, 1st row) can be described by an equation of the 2nd degree, Y = A + B -D + C D2, where A = Y at F = 0 (Y-intercept), B = slope and C = bend. Y at (A = u is cal- culated by putting D = t obtained at the different temperatures (see Tab. 3) into the 2nd degree polynomial.
Temp. A B C R-square n Y at = = (°C) (Y at I = 0) (slope) (bend)
5.0 (±0.1) 860 -4484 7948 0.796 8 228 10.0 (±0.1) 1419 -6313 8641 0.901 17 269 15.1 (±0.3) 1447 -2876 1366 0.875 10 221 20.1 (±0.3) 1893 -3891 2429 0.975 15 335 25.0 (±0.2) 1597 -2186 932 0.950 12 317
180 OIKOS 49:2 (1987)
This content downloaded from 128.95.220.71 on Wed, 24 May 2017 16:12:31 UTCAll use subject to http://about.jstor.org/terms
SJC_203

5°C
1500- 1=0.07-0.13
1000 -
o500o
0 .........
0.0 0.5 1.0 0.0
D (d-') 60 -
30 -M
: x* 0 .... I .... i
0.0 0.5 1.0
D (d-') 1.0
10 C 15°C
0.2 - 0.4 0.4 - 0.5
0.5 1.0 0.0 0.5
- x
XX XX
-X XX x 1.----
0.0 0.5 1.0
0.5
0.0 r
0.0 0.5 1.0 0.0 O.S
Oq (X of DW)
1., . . . .1 . . . . . . . 1.o 0. 0.0 0. 1. 0 0.5 1.0
1.0 -
0.5 -
0.0 , . . . ' 0 0.0 2.5 S.0 0.0
--
** *
2.5 . . . 0.0 2.5 . .
2. 5 5.0 0.0 2.5 s.0
. .5 5.0. .0. . .5 5.0.
2.s 5.0 0.0 2.5 s.0
P04-P (jg/1 )
Fig. 1. Results of P-limited chemostat experiments with Scenedesmus quadricauda. The five different columns of the diagram represent different experimental temperatures used and light intensities (I, 1016 Q cm-2s-1) measured in the centre of the culture vessel at steady state (given at the top of the figures). The row represent different relationships. Points within brackets are excluded in the regression analysis (cf. the text): 1st row: P Yield (Y ) versus dilution rate (D). Y = D), see Tab. 2. 2nd row: N-content/P-content (Qn/qp) versus dilution rate (D). 3rd row: Dilution rate (D) versus P content (qp). D = f(qp), see Tab. 3. 4th row: Dilution rate (D) versus external P-concentration (P04). D = f(PO4), see Tab. 4. (** = points excluded in the regression analyses, cf. the text.)
Tab. 3. Growth constants obtained by fitting Fuhs' equation to the data shown in fig. 1, 3rd row. RMS - residual mean square. 1) At 5°C Droop's equation gave a better fit. Fuhs (1969): l = 4[1 - exp((ln 0.5)(q - qo)/qo)]; Droop (1968): I = [(q - qo)/q.
Temp. I qo RMS n (°C) (d-1) (% of DW)
5.0 (±0.1) 0.275 (0.213-0.338) 0.110 (0.092-0.129) 0.000301 7 0.226 (0.163-0.289) 0.0955 (0.073-0.118) 0.00034 7
10.0 (±0.1) 0.383 (0.343-0.423) 0.0810 (0.070-0.092) 0.00135 16 15.1 (±0.2) 0.594 (0.499-0.690) 0.0643 (0.052-0.076) 0.00508 12 20.1 (±0.3) 0.815 (0.701-0.930) 0.0627 (0.052-0.073) 0.00737 12 25.0 (±0.2) 1.132 (0.971-1.293) 0.0696 (0.059-0.080) 0.01194 12
20°C 25°C
0.8- 1.1
.O rZ c?
1.0
0.0 0.5 1.0 1.0
V !v %O
CQ:
0.5 1.0
I .9
OIKOS 49:2 (1987) 181
This content downloaded from 128.95.220.71 on Wed, 24 May 2017 16:12:31 UTCAll use subject to http://about.jstor.org/terms
SJC_203
Tab. 4. Growth constants obtained by fitting Mitscherlich-Baule's equation to the data shown in fig. 1, 4th rov. 1) at 25°C Monod's equation gave an equally good fit. Baule (1917): it = j[1 - exp((ln 0.5) PO4/Ks)]; Monod (1942): I= - x P04/(P04 + Ks); (see Ahlgren 1977).
Temp. Ks RMS n (°C) (d-l) (g l-1)
5.0 (±0.1) 0.218 (0.075-0.362) 0.59 (-0.12 -1.29) 0.00039 6 10.0 (±0.1) 0.358 (0.276-0.440) 0.38 ( 0.058-0.70) 0.00639 11 15.1 (±0.2) 0.623 (0.501-0.746) 0.53 ( 0.22 -0.83) 0.00116 6 20.1 (±0.3) 1.03 (0.722-1.35) 0.45 ( 0.16 -0.73) 0.0136 11
0.980 (0.645-1.32) 0.069 (-0.073-0.21) 0.0471 6 25.0 (±0.2) 1.11 (0.464-1.75) 0.069 (-0.18 -0.32) 0.04711 6
equations (Droop 1968, Fuhs 1969, Caperon and Meyer 1972), Fuhs' equation gave the best fit (Tab. 3). It agreed well with the estimated b from the batch assays (Tab 1). From the relation D plotted against external P04-P for estimation of Ks, the data often show no sim- ple relation according to the theory (hyperbola de- scribed by Monod's or Mitscherlich-Baule's equations, cf. Ahlgren 1977). Instead, more or less distinct C- curves are seen at most of the temperatures (Fig. 1, low- est row). One hypothesis is that this type of curve, often reported in the literature, is obtained when more than one factor is limiting (Ahlgren, unpubl.). t and Ks have been estimated from the curves in Fig. 1 (lowest row) by excluding the data which give the lower leg of the "C" (marked with *). Most of these excluded data originate from assays where dense biomasses had considerably moderated the light intensities, sometimes outside the ranges given at the top of Fig. 1. Mitscherlich-Baule's (Baule 1917) equation mostly gave a slightly better fit than Monod's equation. The Ks values are between 0.4 and 0.6 [tg 1-1 except at 25°C, where a considerably
lower value of 0.07 [tg 1- were estimated (Tab. 4). They are all, however, very uncertain with wide confidence intervals. The best fit was estimated at 15°C (Tab. 4).
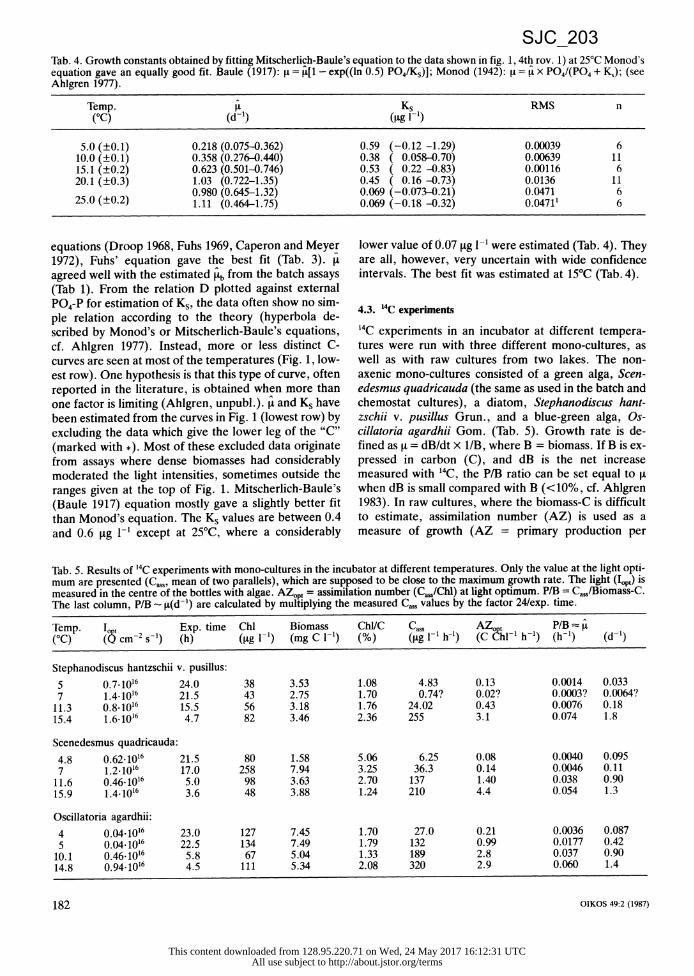
4.3. 14C experiments
14C experiments in an incubator at different tempera- tures were run with three different mono-cultures, as well as with raw cultures from two lakes. The non-
axenic mono-cultures consisted of a green alga, Scen- edesmus quadricauda (the same as used in the batch and chemostat cultures), a diatom, Stephanodiscus hant- zschii v. pusillus Grun., and a blue-green alga, Os- cillatoria agardhii Gom. (Tab. 5). Growth rate is de- fined as ut = dB/dt x 1/B, where B = biomass. If B is ex- pressed in carbon (C), and dB is the net increase measured with 14C, the P/B ratio can be set equal to pt when dB is small compared with B (<10%, cf. Ahlgren 1983). In raw cultures, where the biomass-C is difficult to estimate, assimilation number (AZ) is used as a measure of growth (AZ = primary production per
Tab. 5. Results of "C experiments with mono-cultures in the incubator at different temperatures. Only the value at the light opti- mum are presented (Cass, mean of two parallels), which are supposed to be close to the maximum growth rate. The light (Iopt) is measured in the centre of the bottles with algae. AZopt = assimilation number (Ca./Chl) at light optimum. P/B = Cass/Biomass-C. The last column, P/B - 4(d-1) are calculated by multiplying the measured Cas, values by the factor 24/exp. time.
Temp. I t Exp. time Chl Biomass Chl/C Cass AZont P/B (°C) (3 cm-2 S-1) (h) (fg l-1) (mg C l-1) (%) (g 1-1 h-1) (C 'hl-1 h-1) (h-1) (d-1)
Stephanodiscus hantzschii v. pusillus:
5 0.7.1016 24.0 38 3.53 1.08 4.83 0.13 0.0014 0.033 7 1.4.1016 21.5 43 2.75 1.70 0.74? 0.02? 0.0003? 0.0064? 11.3 0.8.1016 15.5 56 3.18 1.76 24.02 0.43 0.0076 0.18 15.4 1.6-1016 4.7 82 3.46 2.36 255 3.1 0.074 1.8
Scenedesmus quadricauda:
4.8 0.62.1016 21.5 80 1.58 5.06 6.25 0.08 0.0040 0.095 7 1.2-1016 17.0 258 7.94 3.25 36.3 0.14 0.0046 0.11 11.6 0.46-1016 5.0 98 3.63 2.70 137 1.40 0.038 0.90 15.9 1.4-1016 3.6 48 3.88 1.24 210 4.4 0.054 1.3
Oscillatoria agardhii:
4 0.04-1016 23.0 127 7.45 1.70 27.0 0.21 0.0036 0.087 5 0.04-1016 22.5 134 7.49 1.79 132 0.99 0.0177 0.42 10.1 0.46.1016 5.8 67 5.04 1.33 189 2.8 0.037 0.90 14.8 0.94-1016 4.5 111 5.34 2.08 320 2.9 0.060 1.4
182 OIKOS 49:2~~~~~~~~~~~~~~~~~0.6 (1987
182 OIKOS 49:2 (1987)
This content downloaded from 128.95.220.71 on Wed, 24 May 2017 16:12:31 UTCAll use subject to http://about.jstor.org/terms
SJC_203
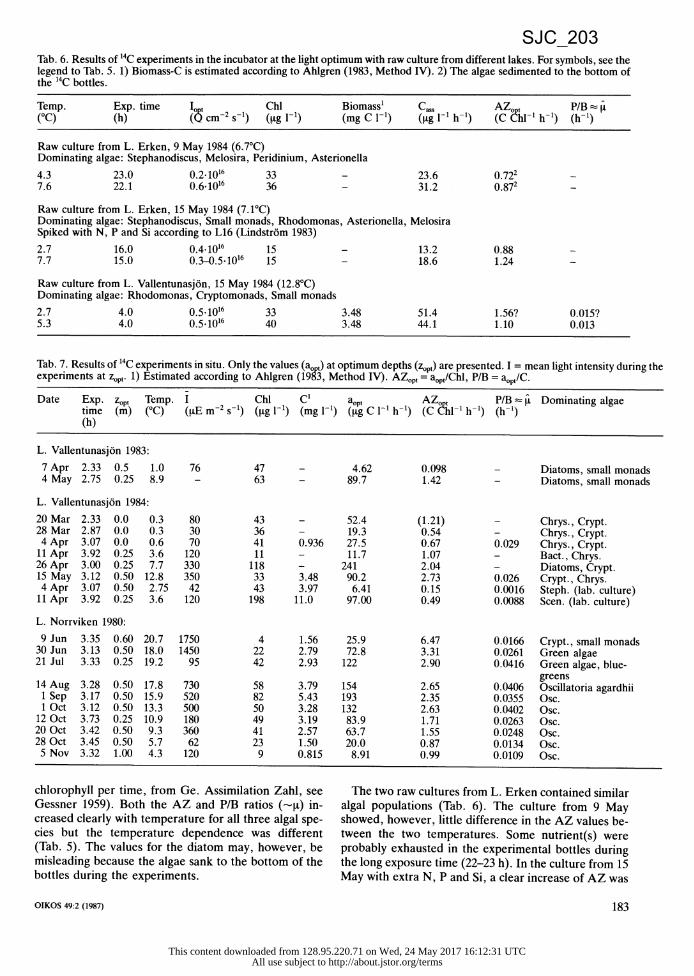
Tab. 6. Results of 14C experiments in the incubator at the light optimum with raw culture from different lakes. For symbols, see the legend to Tab. 5. 1) Biomass-C is estimated according to Ahlgren (1983, Method IV). 2) The algae sedimented to the bottom of the 14C bottles.
Temp. Exp. time 1o t Chl Biomass' Cass AZ t P/B (°C) (h) ((5 cm-2 s-1) (lg l-1) (mg C 1-1) (~tg I-1 h-1) (C hl-1 h-1) (h-1)
Raw culture from L. Erken, 9. May 1984 (6.7°C) Dominating algae: Stephanodiscus, Melosira, Peridinium, Asterionella
4.3 23.0 0.2-1016 33 - 23.6 0.722 7.6 22.1 0.6-1016 36 - 31.2 0.872
Raw culture from L. Erken, 15 May 1984 (7.1°C) Dominating algae: Stephanodiscus, Small monads, Rhodomonas, Asterionella, Melosira Spiked with N, P and Si according to L16 (Lindstrom 1983)
2.7 16.0 0.4.1016 15 - 13.2 0.88 7.7 15.0 0.3-0.5-1016 15 - 18.6 1.24
Raw culture from L. Vallentunasjon, 15 May 1984 (12.8°C) Dominating algae: Rhodomonas, Cryptomonads, Small monads
2.7 4.0 0.5-1016 33 3.48 51.4 1.56? 0.015? 5.3 4.0 0.5-1016 40 3.48 44.1 1.10 0.013
Tab. 7. Results of 14C experiments in situ. Only the values (ao ) at optimum depths (zopt) are presented. I = mean light intensity during the experiments at z0p,. 1) Estimated according to Ahlgren (1983, Method IV). AZo,, = aop0/Chl, P/B = aopt/C.
Date Exp. zopt Temp. I Chl C1 at 0 AZ P/B i t Dominating algae time (m) (°C) (tE m-2 s-1) (ig 1-1) (mg l-1) (g C 1-1 h-1) (C 1hl-1 h-1) (h-1) (h)
L. Vallentunasjon 1983:
7 Apr 2.33 0.5 1.0 76 47 - 4.62 0.098 - Diatoms, small monads 4 May 2.75 0.25 8.9 - 63 - 89.7 1.42 - Diatoms, small monads
L. Vallentunasjon 1984:
20 Mar 2.33 0.0 0.3 80 43 - 52.4 (1.21) - Chrys., Crypt. 28 Mar 2.87 0.0 0.3 30 36 - 19.3 0.54 - Chrys., Crypt. 4 Apr 3.07 0.0 0.6 70 41 0.936 27.5 0.67 0.029 Chrys., Crypt. 11 Apr 3.92 0.25 3.6 120 11 - 11.7 1.07 - Bact., Chrys. 26 Apr 3.00 0.25 7.7 330 118 - 241 2.04 - Diatoms, Crypt. 15 May 3.12 0.50 12.8 350 33 3.48 90.2 2.73 0.026 Crypt., Chrys. 4 Apr 3.07 0.50 2.75 42 43 3.97 6.41 0.15 0.0016 Steph. (lab. culture) 11 Apr 3.92 0.25 3.6 120 198 11.0 97.00 0.49 0.0088 Scen. (lab. culture)
L. Norrviken 1980:
9 Jun 3.35 0.60 20.7 1750 4 1.56 25.9 6.47 0.0166 Crypt., small monads 30 Jun 3.13 0.50 18.0 1450 22 2.79 72.8 3.31 0.0261 Green algae 21 Jul 3.33 0.25 19.2 95 42 2.93 122 2.90 0.0416 Green algae, blue-
greens 14 Aug 3.28 0.50 17.8 730 58 3.79 154 2.65 0.0406 Oscillatoria agardhii 1 Sep 3.17 0.50 15.9 520 82 5.43 193 2.35 0.0355 Osc. 1 Oct 3.12 0.50 13.3 500 50 3.28 132 2.63 0.0402 Osc. 12 Oct 3.73 0.25 10.9 180 49 3.19 83.9 1.71 0.0263 Osc. 20 Oct 3.42 0.50 9.3 360 41 2.57 63.7 1.55 0.0248 Osc. 28 Oct 3.45 0.50 5.7 62 23 1.50 20.0 0.87 0.0134 Osc. 5 Nov 3.32 1.00 4.3 120 9 0.815 8.91 0.99 0.0109 Osc.
chlorophyll per time, from Ge. Assimilation Zahl, see Gessner 1959). Both the AZ and P/B ratios (--[) in- creased clearly with temperature for all three algal spe- cies but the temperature dependence was different (Tab. 5). The values for the diatom may, however, be misleading because the algae sank to the bottom of the bottles during the experiments.
The two raw cultures from L. Erken contained similar algal populations (Tab. 6). The culture from 9 May showed, however, little difference in the AZ values be- tween the two temperatures. Some nutrient(s) were probably exhausted in the experimental bottles during the long exposure time (22-23 h). In the culture from 15 May with extra N, P and Si, a clear increase of AZ was
OIKOS 49:2 (1987) 183
This content downloaded from 128.95.220.71 on Wed, 24 May 2017 16:12:31 UTCAll use subject to http://about.jstor.org/terms
SJC_203

Tab. 8. Values of biological zero (a) found for some freshwater algae. 1) Eq. 16 (based on data from Ahlgren, 1978a).
Algal species Biological zero, a (°C)
Measured Estimated Extrapolated (Fig. 3, d-f) (Fig. 3, a-c)
Stephanodiscus hantzschii v. pus ....................... - 0 3 Scenedesmus quadricauda ............................ 2 0.2 3
5
Oscillatoria agardhii ................................. 10 4 4 121
Microcystis wesenbergii .............................. 11 - - Phormidium mucicola ............................... 9 - -
shown at 7.7°C compared with the results at 2.7°C. The water in L. Vallentunasjon is very eutrophic and be- cause of the high chlorophyll concentration the expo- sure time was limited to 4 h. The AZ value at 2.7°C is, however, unrealistically high. From the field experiments with the '4C method only
the maximum values at the optimum depths are pre- sented (Tab. 7). On two occasions in 1984, on 4 and 11 April, also monocultures of Stephanodiscus and Scen- edesmus were exposed in L. Vallentunasjon (Tab. 7). AZ and P/B values from the two lakes clearly increase with temperature, but the absolute values differed be- tween the lakes.
1.5
Pb 1.0
0.5
0.0
1.S
1.0
0.5
0.0
0.15
qo 0.10
0.05
0.00
' a)
I
0 10 20 30
1.5
1.0
0.5
0.0
Y
4.4. Estimation of biological zero
Scenedesmus quadricauda: In direct growth assays in batch cultures no significant biomass increase could be noted at 2.1 (±0.1)°C at any of the light intensities used (0.05, 0.10 and 0.15 * 1016 Q cm-2 s-1). When the tem- perature was increased to 3.0 (±0.1)°C, measurable biomass increases could be noted (cf. Tab. 1).
Oscillatoria agardhii: When the temperature was slowly lowered, no measurable growth could be noticed at 11 (±1)°C. The light intensities tested were 0.05, 0.1 and 0.2 * 1016 Q cm-2 s-1. The alga formed tufts which adhered to the walls. When the temperature was slowly increased, the alga began to grow normally in the free water, the tufts loosened and seemed gradually to disap- pear.
Microcystis wesenbergii Kom. stopped growing and began to adhere to the walls at 12.1 (±0.1)°C. Light in- tensities were 0.1, 0.2 and 0.4 * 1016 Q cm-2 s-1.
0 10 20 30 Fig. 2. Growth constants for Scenedesmus quadricauda as func- tions of temperature. The full lines represent equations which gave the best fit. The vertical lines represent 95% confidence
d r4) \interval-estimates of the constants. R = R-square). ' 2000 - a) Max. spec. growth rate, fb(d-l), estimated from batch
-t/. - ,,{XI) cultures (cf. Tab. 1). . _/ . . -Eq. 4: tb = 0.0440(t - 1.2) (R = 0.986, n=7)
1000 - Eq. 5: Lb = 0.177 x 1.076t (R = 0.936, n=7) z ~~~~- -;~ ;Eq. 13: Ib = 0.0248(t + 0.3)1 (R = 0.989, n=7)
+- y/|+ -b) Max. spec. growth rate, t(d-1), associated with the /-- *+ + + + +internal P content in the chemostats (cf. Tab. 3).
0 . * * O . a **< -. Eq. 4: u = 0.0448(t - 0.96) (R=0.983, n=5). 0 10 20 30 0 10 20 30 Eq. 5: L = 0.187 x 1.08' (R = 0.993, n=5).
Eq. 13: ,a = 0.000107(t + 17)248 (R = 0.999, n=5). c) Max. spec. growth rate, ,(d 1), associated with the
e- ) 1. s fexternal P04 concentration in the chemostats (cf. Tab. 4). .- K5 - . Eq. 4: (1 = 0.0490(t - 1.4) (R = 0.961, n=5). \ 0- Eq. 5: i = 0.210 x 1.0721 (R = 0.917, n=5).
1. - . d) Eq. 13: ( = 0.0323(t - 0.2)1 12 (R = 0.962, n=5). *. *.i -. - . 'r d) x x = P yields, Y (DW/P), at Ra = 0 (cf. Tab. 2).
-.- 0 * Eq. 4: Y=62.0(t + 10) (R =0.908, n=4) X *. *Eq. 5: Y = 792 x 1.04' (R = 0.888, n=4) I. - IEq. 13: Y = 648(t - 2.7)0361 (R 0.925, n=4)
.... , 0.0 . f · . , ++ =P-yields, Y(DW/P),at t = (cf. Tab. 2). 0 10 20 30 0 10 20 - 30 e) Minimum cell quota, qo, (% of DW) (cf. Tab. 3):
qo = 0.151 - 0.00941t + 0.000247t (R = 0.9985, n=5) TEMPERRTURE (°C) f) Half-saturation constant, KS(lg I-1).
p 11 r
A
184 OIKOS 49:2 (1987)
This content downloaded from 128.95.220.71 on Wed, 24 May 2017 16:12:31 UTCAll use subject to http://about.jstor.org/terms
SJC_203

Phormidium mucicola Naum. and Hub.-Pest., which grows in the mucilage of healthy growing Microcystis (cf. Ahlgren 1985), became predominant in one of the Microcystis cultures. Measurable growth was possible at 10°C. At 8.2 (±+0.2)°C the growth also stopped for Phormidium. At a slow increase of the temperature, neither Microcystis nor Phormidium began to grow again. Fragments of dead algae could be seen on the walls and on the bottom of the vessels.
The measured values of a are given in Tab. 8, and es- timated values from the fit of Belehraidek's equation are
Stephanod i scus 5.0 t -
r-
X 2.5 u
N o0.0
5.0
2.5
0.0
5.0
2.5
0.0
Fig. 3. Z biomass-
algae. V; ments wi + = cult
a, c and b) Eq. 4
Eq. 5 Eq. 1
d) Eq. 4 Eq. 5 Eq. 1
The dott
of the ba
f) Eq. 4 Eq. 5 Eq. 1
a) 2- b) -4
also included together with extrapolated values from the curves in Fig. 3.
4.5. Growth constants in relation to temperature
Belehradek's equation (Eq. 13) gave the best fit to the [tb values based on batch cultures (Tabs 1), but Burck- hardt-Harvey's equation (Eq. 4) gave an almost equally good fit (Fig. 2a). The same was found for the F- and Fi- values (Tabs 3 and 4) from the chemostat experiments (Fig. 2b and c). A common function which is based on all three sets of t data is:
t = 0.0307(t - 0.18)1-13 (R = 0.945, n = 18). (15)
* T . X The biological zero for Scenedesmus, according to this 1 } . j equation, is, thus, estimated to about 0.2°C. The limit
- ' / l 1 - | for Y at it = 0 as a function of temperature can also be ·l t / best described by Belehradek's equation (Fig. 2d), * / X jwhereas Y at ¢i = =t seems to be independent of tem-
· +.v,x p, + x - perature (2d). The minimum cell quota, q0, as a func- 0 10 20 0 10 20 tion of temperature showed a U-shaped curve, but the
q0 at 25°C was not significantly different from that at Scenedesmus 20°C (Tab. 3, Fig. 2e). A second degree polynomial can
c ) 7 2 . d )be well fitted to the data. The Ks values varied between - ' - / 0.4 and 0.6 [tg/l (Tab. 4), but the differences were not
, t Z significant. (The Ks value of 0.07 [tg 1-1 at 25°C is prob- 1 - x/ . ably too low because of suboptimal light.) The Ks, thus,
/ / seems to be independent of temperature (Fig. 2f). * , ./ Assimilation numbers, AZ, and P/B ratios (-~i)
based on incubator experiments with monocultures at 0 10 20 0 10 20 light optima also showed good relationships with tem-
perature (Fig. 3). The course of the AZ and P/B curves Osc i 11 ator i a are different probably depending on the varying chloro-
e) 2 f)phyll contents (Tab. 5), except for Stephanodiscus - where both curves show similar exponential forms. A
- _,: / X pilot test showed that keeping Scenedesmus one day in - / 1 - the experimental temperature was sufficient to adapt it
/ / /to a particular temperature. That is also confirmed by i * the regular decreasing Chl/C ratios with temperature for · ,,0 ...... , .·.. , Scenedesmus (Tab. 5). According to the irregular or
0 o10 20 0 10 20 rather increasing Chl/C ratios with temperature for Os-
TECMPERATURE ID oc) cillatoria and Stephanodiscus, an adaptation period of one day was probably too short for those algae. P/B ra-
Assimilation number (AZ) and primary production/ tios as a function of temperature can be best described C (P/B) as functions of temperature for three different by Belehradek's equation, except for Stephanodiscus alues from the light optimum from incubator experi- where Berthelot's equation gave an equally good fit
tures exposed in situ (cf. Tab. 7). (Fig. 3b). The constants are, however, different for the e) The lines are drawn by hand (cf. the text) different species. For comparison, the curve for Scen- e) The lines are drawn by hand (cf. the text) ' : P/B = 0.162(t - 6.6) (R = 0.749, n=4) edesmus based on the batch- and chemostat data (Eq.
: P/B = 0.000317 x 1.75t (R = 0.9996, n=4) 15) is also shown in Fig. 3d (dotted line). The growth 2: P/B = 3 - 10-9 x t7'43 (R = 0.9995, n=4) rates of Scenedesmus at 12 and 16°C based on 14C meas-
P/B = 0.119(t - 4.8) (R = 0.962, n=4) urements were about twice as high as those of the direct 3: P/B = 0.0853(t - 4.6)1.1 (R = 0.965, n=4). growth measurements. The daily values of P/B (-~u)
ed line represents Eq. 15, which is fitted to all the data multiplying the actually measured itch- and chemostat experiments (see 4.5). values by the factor 24/exp. time. If, instead, the factor
P/B = 0.113(t - 2.3) (R = 0.975, n=4) 10/exp. time was used for the two short-term experi- : P/B = 0.177 x 1.1521 (R = 0.917, n=4) ments (probably a more accurate factor in this context) 3: P/B = 0.333(t - 3.9)0588 (R = 0.988, n=4). both the curves for Scenedesmus would coincide fairly
well.
185 OIKOS 49:2 (1987)
This content downloaded from 128.95.220.71 on Wed, 24 May 2017 16:12:31 UTCAll use subject to http://about.jstor.org/terms
SJC_203

"3
-c J:
2
u
N CE 0
r-
LI
N CE
L. Erken
0 5 10
L. Norrvlken (x9/6 6 - C)
o .. . . . . . . .. ,, 0 10 20
A 6
-I
.C
o 3 u
N O 0
- 0.04 -c
- 0.02
X- 0.00
TEMPERRTURE
Fig. 4. Assimilation number (AZ) ar biomass-C (P/B - t) as functions of ter the optimum depth from field experin 7).
a) Data from Bell and Kuparinen (198 the factor 1/10 to get values per ho
Eq. 4: AZ = 0.425(t - 0.5) (R Eq. 5: AZ = 0.285 x 1.52t (R = Eq. 12: AZ = 0.25 x t128 (R = 0
Trh,c fxur% r%r%inIctx wsthin hrat-VAtts nrp i-yr
L. Ual lentunasjon flects the different algal compositions of the two years. - b ) In 1983 the diatoms (mostly Stephanodiscus hantzschii
v. pusillus and Diatoma) dominated, whereas in 1984 small monads (chrysophytes, e.g. Chrysochromulina
' / parva Lack. and others) and cryptomonads (e.g. Cryp- tomonas and Rhodomonas pusilla v. nannoplanctica (Skuja) Javorn.) were more common. The 1983 data agreed, in fact, better with the data from L. Norrviken, which is mostly dominated by blue-greens (Tab. 7, Fig.
L. Norrv I ken 4c). P/B ratios as a function of temperature for L. Norr- d ) viken are best described by Belehradek's equation (Fig.
x - 4d). It is interesting to note the opposite positions of / , JS0/ one outlier in the AZ and P/B data of L. Norrviken / x36 (within brackets in Fig. 4c and d). This point represents
X (x, results from 14C experiments on 9 June, when nutrients obviously were very limiting. The chlorophyll content of
. .....' ... netplankton was, in fact, only 0.26% of C, resulting in the very high AZ value. Besides, the depth curves of the
(0oc) l4C measurements from 9 June as well as from 30 June id primary production/ (the second outlier in Fig. 4d) showed some irregularity mperature. Values from in the shape of truncated optima, indicating nutrient nents with 14C (cf. Tab. deficiency (cf. Ahlgren 1978b). The two estimated P/B
ratios therefore represent values lower than optimum 4: Tab. 2) multiplied by and could not be expected to fit well in the relationship. ur. Concerning the second outlier (30 June) the nutrient = 0.741, n=9) limitation was less pronounced. The chlorophyll content 0. 795, n = 9) had increased to 0.79% of C. resulting in a closer posi- .751, n=9) tion to the line in Fig. 4c. i-hA-A in th,- ra,r--c.inn 11ne WU poUInls WILInl uira..L;s arI CAliUUCU 111 LII l-5glablUll
analyses (originate from the last two samplings when the peak of diatom bloom was reached, and the algae were probably nu- trient limited, cf. Bell and Kuparinen 1984).
b) Eq. 4: AZ = 0.178(t + 2.9) (R = 0.989, n=5) Eq. 5: AZ = 0.734 x 1.112t (R = 0.939, n=5) Eq. 13: AZ = 0.267(t + 2.0)0867 (R = 0.990, n=5) A values from 1983.
c) Eq. 4: AZ = 0.149(t + 1.4) (R = 0.9048, n=9) Eq. 5: AZ = 0.777 x 1.076t (R = 0.877, n=9) Eq. 13: AZ = 0.196(t + 0.5)0922 (R = 0.9051, n=9)
d) Eq. 4: P/B = 0.00214(t + 1.6) (R = 0.912, n=8) Eq. 5: P/B13 = 0.0120 x 1.072t (R = 0.842, n=8) Eq. 13: P/B = 0.00931(t - 3.2)°0550 (R = 0.938, n=8).
Concerning the points within brackets, see the text.
The AZ-values at the optimum depth from the field experiments showed different relationships with the temperature (Fig. 4a, b and c). Berthelot's equation (Eq. 5) gave the best fit to data from L. Erken, whereas the data of L. Vallentunasjon and L. Norrviken are bet- ter described by Belehradek's (Eq. 13) or Burckhardt- Harvey's equation (Eq. 4). The data from L. Erken (from Bell and Kuparinen, 1984) were, however, based on mixed samples from 1-5 m depths, exposed at 1 m for 24 h. Even though the optimum depth usually is be- tween 1-2 m in L. Erken (Rodhe 1958), it is not certain that all these values represent precisely the optimum depth. The two values from L. Vallentunasjon 1983 (Tab. 7) show different positions compared with the val- ues from 1984 (Fig. 4b). That condition probably re-
5. Discussion
5.1. Maximum specific growth rate, |i
The dependence of ~t on temperature in the green alga Scenedesmus and the blue-green alga Oscillatoria is bet- ter described by Belehraidek's equation than by the Ber- thelot or Arrhenius type of equations, which are de- rived from chemical processes. According to Belehra- dek (1935), "The biological processes are often of such a complex character that equations which have proved correct in chemistry do not fit in biological data". Be- lehradek based his empirical equation on a "physical view", i.e., he considered that the actual biological pro- cesses are better controlled by physical processes such as diffusion and viscosity than by chemical processes. When it is found that stirring increases the velocity of a process, the process is probably governed by diffusion. This was exactly what happened in my cultures; stirring increased the growth rate. The results from the "4C ex- periments in the incubator, as well as in situ with differ- ent algal populations, show the same temperature de- pendence but the constants of the equation are different and are probably species specific. In several cases Burckhardt-Harvey's equation (linear) gives a fit which is nearly as good as Bl1ehradek's equation. At low tem- peratures no drastic changes occurred but the growth rate decreased regularly until the biological zero was reached, a point that is probably also species specific.
OIKOS 49:2 (1987) 186
This content downloaded from 128.95.220.71 on Wed, 24 May 2017 16:12:31 UTCAll use subject to http://about.jstor.org/terms
SJC_203

0 10 20
TENPERATURE (°C)
Fig. 5. Data of growth rates from the literature of various algal species versus temperature. The R-square (R) given are from the fits of B61lehradek's equation (Eq. 13).
1. Eppley (1972). Different algal species grown in batch cultures.
2. Goldman and Carpenter (1974). Different species grown in chemostats.
3. Paasche (1980). Rhizosolenia fragilissima. (R = 0.999, n=4).
4. Goldman (1979). Monochrysis lutheri. (fitted by eye, n=3).
5. Senft et al. (1980). Volvox globulator. (R = 0.953, n=4). 6. Morgan & Kalff (1979). Cryptomonas erosa. (R = 0.997,
n=4). 7. Senft et al. (1980). Volvox aureus. (R = 0.996, n=4). 8. Wernicke and Nicklisch (1986). Oscillatoria redekei.
(R = 0.994, n=-4).
The original values given of 1, 3, 5, 6 and 7, which represented "k", are multiplied by In 2 to get i.The two values at 25 and 30°C are dropped in 5 and 7.
As already mentioned in the Introduction, Eppley (1972) and Goldman and Carpenter (1974) described this variation in growth rate with temperature by expo- nential equations of Berthelot's and Arrhenius' type (Fig. 5). My results, however, do not necessarily con- trast with their data. Eppley has obviously tested Beleh- radek's equation, even giving values of the equation constants a, b and a. Unfortunately, no information is given of the significance of the two equations, but the fit- ting gave a value of a (biological zero) as low as -40°C, which is, of course, impossible. The data of Goldman and Carpenter (1974: Tab. 2) include several species of both freshwater and marine origin. By testing the three equations of Burckhardt-Harvey (4), Berthelot (5) and Belehradek (13) against his data, Belehradek's equation also gives a fairly good fit (a = 6.6°C). R-squares are 0.829, 0.874, and 0.851, respectively (n = 26). Earlier I found that the dependence of [b on temperature could
be described by a 2nd degree polynomial (Ahlgren 1978a, R-square = 0.957, n = 10). The light intensity, which was held constant at all temperatures (37 [LE m-2 s-~, optimal at 15°C), was probably too low at the two highest temperatures, 25 and 28°C. If these points are excluded, Belehradek's equation can be better fitted to those data:
Plb = 0.273(t - 11.6) 309 (R = 0.996, n = 7). (16)
P/B-values (-it) for Oscillatoria in Tab. 5, multiplied by the factor 10 to get growth rates per day, agree fairly well with these earlier data from batch experiments (Ahlgren 1978a: Tab. 1). Zevenboom (1980: Ch. 7) found a linear relationship for the same alga, Oscillato- ria agardhii, within a limited temperature interval (10 to 20°C). Rhee and Gotham (1981) also found a linear re- lationship for the green alga Scenedesmus and the di- atom Asterionella between 5 and 20°C. Wernicke and
Nicklisch (1986) recently fitted a model variant (orig- inates from Arrhenius' equation, see Lehman et al. 1975), to data of Oscillatoria redekei. Belehradek's equation gives, however, a better fit to the same data as well as other tabled data collected from the literature
(Fig. 5). Relationships between AZ and temperature are occa-
sionally found in the literature (e.g., Williams and Mur- loch 1966, Glooschenko et al. 1973, Dokulil 1984). Glooschenko and coworkers presented a linear rela- tionship (data from L. Huron) very similar to that of L. Norrviken, in spite of the fact that L. Huron is very oli- gotrophic and had quite a different plankton flora. Judging from their plot, however, Belehradek's equa- tion should also fit here equally well or perhaps even better, since the relationship is slightly curved.
5.2. Yield coefficient, Y
The dependence of Y on temperature, as well as the other two growth constants qo and Ks, was only exam- ined for the green alga Scenedesmus in chemostat cul- tures. The limit value of the yield at t = 0 plotted against temperature can be best described by Belehra- dek's equation. In contrast, Y at (t = [t seems to be inde- pendent of temperature (Fig. 2d). Concerning Y, I have found only two other studies with results from the green alga, Chlorella pyrenoidosa and the bacteria, Aerobac- ter aerogenes (Shelef et al. 1971, Topiwala and Sinclair 1971). Both studies showed that Y at [t-max was fairly insensitive to temperature, a result confirmed by my data. These two investigations also comprised higher temperature ranges than usually considered (19 to 35°C and 25 to 40°C, respectively), making it probably that the results could be valid more generally. The results thus mean that when non-limited algae grow at maxi- mum rate (which is lower at lower temperature), they use the same amount of phosphorus per biomass irre- spective of temperature. In contrast, if the algae for
OIKOS 49:2 (1987) 187
This content downloaded from 128.95.220.71 on Wed, 24 May 2017 16:12:31 UTCAll use subject to http://about.jstor.org/terms
SJC_203

some reason (e.g. nutrient limitation) grow at a growth rate <ti, the yield decreases with temperature; the lower the growth rate, the larger the reduction (Fig. 2d).
5.3. Minimum cell quota, qo
The minimum cell phosphorus (qo) of Scenedesmus can be described by a 2nd degree polynomial (Fig. 2e), whose coefficients not yet can be given any physiolog- ical interpretations. Of the few data published on qo es- timated at different temperatures, some show indepen- dence of temperature (Fuhs 1969, Wernicke and Nick- lisch 1986), and some show that qo increases at lower temperatures (Goldman 1979, Rhee and Gotham 1981). Whether or not the qo values generally show a U-shaped response to temperature, i.e., that the qo-values have distinct minimum values at a certain temperature and then swing back up at higher temperatures, has not yet been convincingly proved. As cells normally become smaller at higher temperatures, U-shaped curves based on cell-basis (e.g., Goldman 1977, Goldman and Mann 1980) might, when based on a weight basis, be changed into gradually decreasing values which just level off at higher temperatures. It is also important that the light intensity is optimal at all experimental temperatures. Particularly in the case of the N content, it will respond directly to increasing values at suboptimal light condi- tions. Suboptimal light is also probably the reason why my qo value at 25°C tends towards higher values than at 20°C.
5.4. Half-saturation constants, Ks
Ks for Scenedesmus seems to be independent of tem- perature (Fig. 2f). Mechling and Kilham (1982: Tab. 1) collected data on Ks estimated at different tempera- tures. In the four papers cited dealing with growth ex- periments, varying relationships were found. Paasche's (1975) Ks values for Thalassiosira at the temperatures of 3 and 10°C are not significantly separated, and the same applies to one of the two algae tested by Thomas and Dodson (1974). Tilman et al. (1981), who investigated two diatoms at five different temperatures, found that Ks was independent of temperature, except for one di- atom at 24°C. The preliminary U-curve I presented on the basis of results from Oscillatoria agardhii was prob- ably rather premature (Ahlgren 1978a). The low Ks value of 0.3 atg P 1-1 found at 20°C was very uncertain and not significantly different from the more reliable value of 1 |tg P I1- found at 15 and 25°C (cf. Ahlgren 1978a: Tab. 3). The erratic results of those experiments at 20°C could be caused by inappropriate light condi- tions. At low dilution rates, the light (the same for all three temperatures) might be suboptimal in some of the sub-assays because of very dense biomasses, or supra- optimal because the algae can be extra sensitive in such very P-limited conditions. It looks as if different growth
V1
t3
p2/2
KS s Fig. 6. Principal diagram of it = f(S), cf. the text.
rates have different light optima, which implies that it would be necessary to run a light gradient in chemostat experiments at every single dilution rate. Mechling and Kilham (1982) also used the same illumination at their three experimental temperatures (100 RE m-2 s1-). This illumination might be supra-optimal at 10°C and could be an explanation of their significantly lower Ks at that temperature. Kilham's (1984) Ks values for Stephano- discus (P) are the same at 10 and 20°C as well as the Ks values (Si) for Synedra within the same temperature range. The data cited above, as well as my own data, show that the most probable hypothesis hitherto is that Ks is independent of temperature.
It is also reasonable that Ks should have the character of a real constant (Fig. 6). By definition Ks is the con- centration which will support half the maximum growth rate. As the maximum growth rate increases with tem- perature, half the maximum growth rate should also in- crease with temperature, thus giving curves which sep- arate immediately at the origin, i.e., curves of the "Bose" type (cf. Talling 1979: Fig. lf). A constant Ks leads to lower competition advantages with decreasing temperature. The initial gradient recommended by Tall- ing (1979), or the ratio i/Ks (Healey 1980), used to characterize the competition status of an alga, would then be a useful tool to compare different algal species. A difference in that ratio, if necessary scaled to the same biological zero, for two species estimated in the laboratory at one temperature would be valid for all temperature conditions in the field. Is that too simple to be true?
6. Summarizing conclusions
In spite of the fact that Belehradek's equation better de- scribes possible biological processes, it is almost com-
OIKOS 49:2 (1987)
p
188
This content downloaded from 128.95.220.71 on Wed, 24 May 2017 16:12:31 UTCAll use subject to http://about.jstor.org/terms
SJC_203

pletely ignored in preference to the RGT-rule or Van't Hoff-Arrhenius' equation. One reason given is rather obscure: "The formula contains two constants which
should complicate the application" (Winberg 1971:51). With easy access to modern computers nowadays and with "easy-to-use" computer systems for statistical analysis procedures, that reason no longer applies. The relatively good agreements between my growth experi- ments in the laboratory and in the field as well as the cited papers show that the dependence of algal growth rates on temperature is generally described better by Belehradek's equation than by the more frequently used Berthelot's or Arrhenius' equations. Concerning bacterial growth, it is found that the Van't Hoff-Arrhe- nius' formula also fits data poorly; graphs of the log- arithm of the growth rate versus reciprocal absolute temperature result in curves rather than straight lines. Ratkowsky et al. (1982) found instead an equation (pro- posed for nucleotide breakdown in cool-stored carp muscle by Ohta and Hirahara, 1977, not seen), which fitted very well (R-square > 0.97) to the growth of a wide range of bacteria as well as of some yeast species and a mold. This empirical equation is, in fact, identical with Belehradek's equation, if the exponent b is put equal to 2.
On the whole, biological processes seldom show ex- ponential increases with temperature. Bearing in mind also the many examples from zoology (e.g., reproduc- tion rate of ciliates, respiration rate in bacteria and fish, the rate of movement in ameboids and in insects, and the rate of development in zooplankton and in trout) given by Belehradek (1935, 1957) and McLaren (1963) of the statistically more accurate fit by Belehradek's equation compared with other temperature functions, it is perhaps time to accept more generally the type of Be- lehradek's equation for biological processes. Note- worthy is that two very late examples, i.e., swimming activity of the medicinal leech (Elliott and Tullett 1986) and growth of salmonid otoliths (Mosegaard 1986, Mo- segaard et al. 1986) were both best fitted to log-log transformations of temperature functions which are very similar to Belehradek's equation. Already Beleh- radek (1926) used several examples to show that when taking logarithm his equation (log v = a + b log t) gave a straight line within a wider range than Van't Hoff-Ar- rhenius' or Berthelot's equations (log v = a + b 1/T and log v = a + b t, respectively). That means that the arti- ficial "breaks", i.e. more than one value of the tem- perature coefficient in a temperature range (see e.g., Mohr and Krawic 1980), often found when using the ex- ponential formulas were mostly overcome by applying Belehradek's equation (Belehradek 1957). According to McLaren (1963): "In choosing between equally ac- curate formulas to describe biological material, ... one should choose formulas whose parameters reflect pos- sible biological characteristics, even if these are not fully understood. Belehradek's function certainly fulfills these requirements better than the alternatives". Beleh-
radek (1926) concluded that the variations between dif- ferent species of the constant b appeared to have con- siderable ecological significance. However, the constant a might also be species specific. If t==a+ 1, it follows that [t=a, i. e., the growth rate is equal to a when the tem- perature is one degree above the biological zero (a).
Acknowledgements - I thank my husband, I. Ahlgren, for valu- able support during the experiments and critically reading the manuscript and B. Pejler for thoughtful comments on the manuscript. I also thank my assistent, J. Johansson, whose careful work in the field and in the laboratory with the often very delicate analyses made the results very reliable. The draw- ings of the figures, including programs for computer plots, were made by my son, B. Ahlgren. This work was supported by the National Swedish Environmental Protection Board.
References
Ahlgren, G. 1977. Growth of Oscillatoria agardhii in chemos- tat culture. 1. Nitrogen and phosphorus requirements. - Oi- kos 29: 209-224.
- 1978a. Growth of Oscillatoria agardhii in chemostat cul- ture. 2. Dependence of growth constants on temperature. - Mitt. Int. Verein. Limnol. 21: 88-102.
- 1978b. Response of phytoplankton and primary production to reduced nutrient loading in Lake Norrviken. - Verh. Int. Verein. Limnol. 20: 840-845.
- 1983. Comparison of methods for estimation of phyto- plankton carbon. - Arch. Hydrobiol. 98: 489-508.
- 1985. Growth of Microcystis wesenbergii in batch and chem- ostat cultures. - Verh. Int. Verein. Limnol. 22: 2813-2820.
Ahlgren, I. 1975. Modell for fosforomsattning och fytoplank- tonproduktion i sjon Norrviken. - Eutrofiering. Nordforsk, Miljovardssekretariatet. 1: 387-423 (in Swedish).
Arrhenius, S. 1889. Uber die Reaktionsgeschwindigkeit bei der Inversion von Rohrzucker durch Sauren. - Z. physik. Chem. 4: 226-234.
Batschelet, E. 1971. Introduction to mathematics for life scien- tists. - Springer, Berlin.
Baule, B. 1917. Zu Mitscherlichs Gesetz der physiologischen Beziehungen. - Landw. Jbr. 51: 363-385.
Belehradek, J. 1926. Influence of temperature on biological processes. - Nature, Lond. 118: 117-118.
- 1935. Temperature and living matter. - Protoplasma-Mono- graphien. Vol. 8. Berlin.
- 1957. Physiological aspects of heat and cold. - Ann. Rev. Physiol. 19: 59-82.
Bell, R. T. and Kuparinen, J. 1984. Assessing phytoplankton and bacterioplankton production during early spring in Lake Erken, Sweden. - Appl. Environ. Microbiol. 48: 1221-1230.
Berthelot, M. 1862. Essai d'une theorie sur la formation des ethers. - Ann. de chimie et de phys., Ser. (3) T66: 110-128.
Caperon, J. and Meyer, J. 1972. Nitrogen-limited growth of marine phytoplankton. I. Changes in population character- istics with steady-state growth rate. - Deep Sea Res. 19: 601-618.
Cohen, E. 1896. Studien zur chemischen dynamik nach J. H. Van't Hoff's Etudes de dynamique chimique. - Muller, F. and Co., Amsterdam. Engelmann, W., Leipzig.
Dokulil, M. 1984. Assessment of components controlling phytoplankton photosynthesis and bacterioplankton pro- duction in a shallow, alkaline, turbid lake (Neusiedlersee, Austria). Int. Rev. ges. Hydrobiol. 69: 679-727.
Droop, M. R. 1968. Vitamin B12 and marine ecology. IV. The
OIKOS 49:2 (1987) 189
This content downloaded from 128.95.220.71 on Wed, 24 May 2017 16:12:31 UTCAll use subject to http://about.jstor.org/terms
SJC_203

kinetics of uptake, growth and inhibition of Monochrysis lutheri. - J. mar. biol. Ass. U.K. 48: 689-733.
- 1973. Some thoughts on nutrient limitation in algae. - J. Phycol. 9: 264-272.
Elliott, J. M. and Tullett, P. A. 1986. The effects of tempera- ture, atmospheric pressure and season on the swimming ac- tivity of the medical leech, Hirudo medicinalis (Hirudinea; Hirudinidae), in a Lake District tarn. - Freshwat. Biol. 16: 405-415.
Eppley, R. W. 1972. Temperature and phytoplankton growth in the sea. - Fish. Bull. 70: 1063-1085.
Fuhs, G. W. 1969. Phosphorus content and rate of growth in the diatoms Cyclotella nana and Thalassiosira fluviatilis. - J. Phycol. 5: 312-321.
Gessner, F. 1959. Hydrobotanik, Bd. II. - Berlin. Glooschenko, W. A., Moore, J. E. and Vollenweider, R. A.
1973. Chlorophyll a distribution in Lake Huron and its rela- tionship to primary productivity. - Proc. 16th Conf. Great Lakes Res., Int. Assoc. Great Lakes Res. p. 40-49.
Goldman, J. C. 1977. Biomass production in mass cultures of marine phytoplankton at varying temperature. - J. exp. mar. Biol. Ecol. 27: 161-169.
- 1979. Temperature effects on steady-state growth, phos- phorus uptake, and the chemical composition of a marine phytoplankter. - Micr. Ecol. 5: 153-166.
- and Carpenter, E. J. 1974. A kinetic approach to the effect of temperature on algal growth. - Limnol. Oceanogr. 19: 756-766.
- and Mann, R. 1980. Temperature-influenced variations in speciation and chemical composition of marine phytoplank- ton in outdoor mass cultures. - J. exp. mar. Biol. Ecol. 46: 29-39.
- and McCarthy, J. J. 1978. Steady-state growth and ammo- nium uptake of a fast-growing marine diatom. - Limnol. Oceanogr. 23: 695-703.
Healey, F. P. 1978. Physiological indicators of nutrient def- iciency in algae. - Mitt. Internat. Verein. Limnol. 21: 34-41.
- 1980. Slope of the Monod equation as an indicator of ad- vantage in nutrient competition. - Microb. Ecol. 5: 281- 286.
Kanitz, A. 1915. Temperatur und Lebensvorgange. Die Bio- chemie in Einzeldarstellungen. - Berlin.
Kilham, S. S. 1984. Silicon and phosphorus growth kinetics and competitive interactions between Stephanodiscus minutus and Synedra sp. - Verh. Internat. Limnol. 22: 435-439.
Kinnunen, K., Nyholm, B., Niemi, J., Frisk, T., Kyla-Ha- rakka, T. and Frisk, T. 1982. Water quality modeling of fin- nish water bodies. - Vesihallitus, National board of waters, Finland.
Lehman, J. T., Botkin, D. B. and Likens, G. E. 1975. The as- sumptions and rationales of a computer model of phyto- plankton population dynamics. - Limnol. Oceanogr. 20: 343-364.
Lindstrom, K. 1983. Selenium as a growth factor for plankton algae in laboratory experiments and in some Swedish lakes. - Hydrobiologia 101: 35-48.
McLaren, J. A. 1963. Effects of temperature on growth of zoo- plankton and the adaptive value of vertical migration. - J. Fish.Res. Bd Can. 20: 685-727.
Mechling, J. A. and Kilham, S. S. 1982. Temperature effects on silicon limited growth of the lake Michigan diatom Step- hanodiscus minutus (Bacillariophyceae)). - J. Phycol. 18: 199-205.
Mohr, P. W. and Krawiec, S. 1980. Temperature characteristics and Arrhenius plots for nominal psychrophiles, mesophiles and termophiles. - J. Gen. Microbiol. 121: 311-317.
Morgan, K. C. and Kalff, J. 1979. Effect of light and tem- perature interactions on growth of Cryptomonas erosa (Cryptophyceae). - J. Phycol. 15: 127-134.
Mosegaard, H. 1986. Growth in salmonid otoliths. - Acta Univ. Upsaliensis, 52: 1-18.
- , Svedang, H. and Taberman, K. 1986. The effect of tem- perature, body size, and growth history on daily growth rates of otoliths in arctic char fry at maximum rations. - Manuscript. (Inst. of Limnology, Uppsala, Sweden.) 32 pp.
Paasche, E. 1975. Growth of the plankton diatom Thalassiosira nordenskioeldii Cleve at low silicate concentrations. - J. Exp. Mar. Biol. 18: 173-183.
- 1980. Silicon content of five marine plankton diatom spe- cies measured with a rapid filter method. - Limnol. Ocea- nogr. 25: 474-480.
Ratkowsky, D. A., Olley, J., McMeekin, T. A. and Ball, A. 1982. Relationship between temperature and growth rate of bacterial growth. - J. Bacteriol. 149: 1-5.
Rhee, G.-Y. and Gotham, I. J. 1981. The effect of environ- mental factors on phytoplankton growth: Temperature and the interactions of temperature with nutrient limitation. - Limnol. Oceanogr. 26: 635-648.
Rodhe, W. 1958. The primary production in lakes: Some re- sults and restrictions of the C14-method. - Rapp. P.-V. Reun. Cons. perm. int. Explor. Mer 144: 122-128.
SAS User's Guide, 1979 edition. - Helwig, J. T. and Council, K. A. (eds). SAS Institute Inc., Raleigh, NC.
Senft II, W. H., Hunchberger, R. A. and Roberts, K. E. 1981. Temperature dependence of growth and phosphorus uptake in two species of Volvox (Volvocales, Chlorophyta). - J. Phycol. 17: 323-329.
Shelef, G., Oswald, W. J. and Golueke, C. 1971. Assaying al- gal growth with respect to nitrate concentration by a con- tinuous flow turbidostat. - In: Jenkins, S. H. (ed.), 5th Proc. int. Conf. Water Pollut. Res. Pergamon III-25/1-9.
Steemann Nielsen, E. and Hansen, V. K. 1961. Influence of surface illumination on plankton photosynthesis in Danish waters (56°N) throughout the year. - Phys. Plant. 14: 595- 613.
- and Willemoes, M. 1971. How to measure the illumination rate when investigating the rate of photosynthesis of unicel- lular algae under various light conditions. - Int. Rev. ges. Hydrobiol. 56: 541-556.
Streeter, H. W. and Phelps, E. B. 1925. A study of the pol- lution and natural purification of the Ohio river. III. - Publ. Health Bull. 147: 1-75.
Talling, J. F. 1979. Factor interactions and implications for the prediction of lake metabolism. - Arch. Hydrobiol. Beih. 13: 96-109.
Thomas, W. H. and Dodson, A. N. 1974. Effect of interactions between temperature and nitrate supply on the cell-division rates of two marine phytoflagellates. - Mar. Biol. 24: 213- 217.
Tilman, D., Mattson, M. and Langer, S. 1981. Competition and nutrient kinetics along a temperature gradient: an ex- perimental test of a mechanistic approach to niche theory. - Limnol. Oceanogr. 26: 1020-1033.
Topiwala, H. and Sinclair, C. G. 1971. Temperature relation- ship in continuous culture. - Biotechnol. Bioeng. 13: 795- 813.
Van't Hoff, J. H. 1884. Etudes de dynamique chimique. - Am- sterdam.
Verhulst, P. F. 1838. Notice sur la loi que la population suit dans son accroissement. - Corresp. Math. Phys. 10: 113- 121.
Wernicke, P. and Nicklisch, A. 1986. Light/dark cycle and tem- perature - their impact on phosphate-limited growth of Os- cillatoria redekei van Goor in semicontinuous culture. - Int. Rev. ges. Hydrobiol. 71: 297-313.
Williams, R. B. and Murdoch, M. B. 1966. Phytoplankton pro- duction and chlorophyll concentration in the Beaufort Channel, North Carolina. - Limnol. Oceanogr. 11: 73-82.
Winberg, G. G. 1971. Methods for the estimation of produc- tion of aquatic animals (transl. from Russian by A. Dun- can). - Academic Press, London.
Zevenboom, W. 1980. Growth and nutrient uptake kinetics of Oscillatoria agardhii. - Krips Repro Meppel.
OIKOS 49:2 (1987) 190
This content downloaded from 128.95.220.71 on Wed, 24 May 2017 16:12:31 UTCAll use subject to http://about.jstor.org/terms
SJC_203