temi di discussione - bancaditalia.it · the grounds of its relatively weak e ects on economic...
TRANSCRIPT

Temi di discussione(Working Papers)
On the unintended effects of public transfers: evidence from EU funding to Southern Italy
by Ilaria De Angelis, Guido de Blasio and Lucia Rizzica
Num
ber 1180Ju
ne
2018


Temi di discussione(Working Papers)
On the unintended effects of public transfers: evidence from EU funding to Southern Italy
by Ilaria De Angelis, Guido de Blasio and Lucia Rizzica
Number 1180 - June 2018

The papers published in the Temi di discussione series describe preliminary results and are made available to the public to encourage discussion and elicit comments.
The views expressed in the articles are those of the authors and do not involve the responsibility of the Bank.
Editorial Board: Antonio Bassanetti, Marco Casiraghi, Emanuele Ciani, Vincenzo Cuciniello, Nicola Curci, Davide Delle Monache, Giuseppe Ilardi, Andrea Linarello, Juho Taneli Makinen, Valentina Michelangeli, Valerio Nispi Landi, Marianna Riggi, Lucia Paola Maria Rizzica, Massimiliano Stacchini.Editorial Assistants: Roberto Marano, Nicoletta Olivanti.
ISSN 1594-7939 (print)ISSN 2281-3950 (online)
Printed by the Printing and Publishing Division of the Bank of Italy

ON THE UNINTENDED EFFECTS OF PUBLIC TRANSFERS: EVIDENCE FROM EU FUNDING TO SOUTHERN ITALY
by Ilaria De Angelis*, Guido de Blasio* and Lucia Rizzica*
Abstract
We study the relationship between the accrual of large financial transfers from a central level of government and the incidence of white collar crimes against public administration and public faith at the local level. We analyse the case of EU funding to Southern Italy and make use of within-municipality variation in the flow of funds between 2007 and 2014. We find a statistically significant effect of transfers on white collar crimes: our estimates suggest that in the absence of EU funding disbursements, the annual number of white collar crimes in Southern Italy would have been 4 per cent lower. We acknowledge that the evidence we provide cannot be taken as fully conclusive given the possible simultaneity of criminal activities and funding assignments and disbursements. Nevertheless, we provide evidence that the correlations we estimated between transfers and white collar crimes are unlikely to be spurious or due to confounding effects.
JEL Classification: D7, H3, H7. Keywords: regional transfers, white collar crimes, EU funds.
Contents 1. Introduction .......................................................................................................................... 5 2. Related literature .................................................................................................................. 7 3. Institutional setting .............................................................................................................. 9 4. Data and descriptive statistics ............................................................................................ 10 5. Empirical strategy .............................................................................................................. 13 6. Results................................................................................................................................ 15 7. Robustness checks ............................................................................................................. 19 8. Conclusions........................................................................................................................ 19
_______________________________________ * Bank of Italy, Directorate General for Economics, Statistics and Research, Structural Economic Analysis
Directorate.


1 Introduction∗
Large transfers of financial resources from higher levels of government to local adminis-
trations are used in most countries around the world and respond to a need for redistri-
bution that arises in particular when local jurisdictions are characterized by significant
socio-economic heterogeneity. Yet, their effectiveness in sustaining local development is
believed to be hampered by political economy mechanisms that would exacerbate the
political agency problem, lowering local politicians’ accountability and thus increasing
incentives for rent seeking and deteriorating the quality of candidates (Vicente, 2010;
Brollo et al., 2013).
The EU cohesion policy represents the largest program of redistribution of resources
across member states, it aims at reducing disparities across regions and at boosting
economic growth in the least-favored ones. Yet, the policy design has been questioned on
the grounds of its relatively weak effects on economic growth (Ciani and de Blasio, 2015)
and of its possible adverse effects on social capital (Accetturo et al., 2014). Moreover,
numerous cases of diversion of the EU resources have come to light in the most recent
years, casting a further shadow on the effectiveness of the EU cohesion policy. Growing
evidence, indeed, suggests that a non-negligible fraction of the EU budget is lost every
year in fraud and corruption. According to the European Anti-Fraud Office (OLAF), for
example, every year nearly 1 billion euro of EU funds is wasted in such illegal activities.
While most cases of malfeasance in funds allocation would regard Central and Eastern
European countries (OLAF, 2016), similar leakages were documented in Italy too, as
often reported in policy debates (Rossi, 2006) and in the media.
The present paper investigates the relationship between the disbursement of large
financial resources from a central unit of government, specifically the EU funds, and the
incidence of white collar crimes in recipient local governments. While one may think
that more money is simply a pre-requisite for corruption to spread, there are also more
subtle political economy mechanisms at stake. In particular, the accrual of large financial
resources may exacerbate the agency problem between the local politician and the pop-
ulation. Indeed, with a larger budget size which, moreover, is not collected locally, the
incumbent politician would have more room to grab political and financial rents with-
out disappointing rational but imperfectly informed voters. In other words, the expected
∗The views expressed in the paper are those of the authors only and do not involve the responsibilityof the Bank of Italy. We thank two anonymous referees, Paolo Sestito, Federico Cingano, GiulianaPalumbo, Alessandra Staderini, Stefania Zotteri, and seminar participants at the Bank of Italy (Rome,2016), the European Urban Economic Association (Copenhagen, 2017), the CesIfo Workshop on Place-based Policies (Venice, 2017), the European Regional Science Association (Groningen, 2017), the ItalianAssociation of Labor Economists (Cosenza, 2017), the OECD (Paris, 2017), the University of Salerno(Salerno, 2018), the University of Siena (Siena, 2018) and the University of Naples (Naples, 2018) forcomments and suggestions.
5

electoral punishment of corruption is lower when the budget size increases, and this would
induce the incumbent to misbehave more frequently. Moreover, the increased easiness
of grabbing rents from the public budget would attract to the office less capable and
more corruption prone individuals, thus further reinforcing the relationship between the
amount of transfers and the incidence of corruption at the local level. The question we
pose, therefore, is not simply one on the overall desirability of EU funds, but rather on
the optimal level of decentralization to adopt when such amounts of money are at stake
in order to reduce the agency problem and rent seeking.
Note that corruption is not the only type of loss that can be brought about by such
large transfers, but represent what in the literature (Bandiera et al., 2009) has been la-
beled as “active waste”, i.e. the resources subtracted by politicians and public officials
for private gain. On top of this there would be the “passive waste”, coming from ineffi-
ciencies in the administration of the resources, which is believed to account for the most
part of the total amount of public resources wasted. Our estimates, therefore, should be
considered a lower bound of the amount of waste potentially in place.
We analyze the case of EU funds to Southern Italy, because these funds offer a par-
ticularly suitable case to study the impact of extraordinary and large transfers from a
central authority to local administrations and we focus on Southern Italy because this
area has received particularly large amounts of EU financing. Our empirical analysis
draws on detailed information about EU funds’ disbursements over the Italian territory
between 2007 and 2014 and on a novel dataset collecting all criminal records at the local
level. Exploiting within municipality over time variation, we estimate the impact of such
large monetary transfers on the number of corruption (white collar) crimes.
Our estimates suggest that EU funds’ disbursements significantly increased the num-
ber of white collar crimes in the recipient municipality in a given year. In particular
we find that the disbursement of EU funds to municipalities in southern Italy was as-
sociated with an increase of about 4% in the average number of white collar crimes per
municipality and year. The result is mainly driven by funds targeting the realization of
public works, rather than those devoted to transfers to firms and households and pur-
chases of goods and services by public administrations. Interestingly, the estimated effect
is homogeneous across dimensions that are commonly associated to varying propensity
to malpractices (such as the efficiency of the local administration or social capital). On
the other hand, we find some evidence that the recent application of an anti-corruption
law partially offset the increase in white collar crimes.
A causal interpretation of the estimated relationship between EU funds disbursements
and white collar crimes is potentially mined by two issues. First, omitted variables may
simultaneously drive the assignment of funds and the incidence of corruption. For in-
6

stance, areas characterized by poorer socio-economic conditions generally display higher
rates of criminal activity and also receive more funds. We account for this possibility
by introducing a battery of time varying controls aimed at capturing differences in local
socio-economic and political conditions that change from year to year while time invariant
unobservable heterogeneity is absorbed by introducing municipality fixed effects. More-
over a falsification exercise shows that EU funds disbursements were not associated to
any significant change in the incidence of other types of crimes (violent and property
crimes), thus ruling out the possibility that some contemporaneous independent dete-
rioration of the social and economic environment at the local level is the driver of the
estimated relationship. Second, there may be a problem of reversed causality to the ex-
tent that more corrupt politicians manage to attract more resources to their municipality
(Barone and Narciso, 2013). In this regard, the inclusion of municipality fixed effects
should manage to capture any unobserved time invarying propensity to corrupt on the
part of local politicians and thus, under the assumption that the propensity to illegal
behavior remains constant over such a short period of time, rule out possible concerns
about reversed causality. In the light of such evidence, therefore, we conclude that our es-
timates most likely reflect a causal relationship between EU funds disbursements and the
emergence of white collar crimes in the recipient municipalities, and not just a spurious
correlation between the two.
The remainder of the paper is structured as follows: Section 2 discusses the most rel-
evant related literature; Section 3 describes the institutional setting; Section 4 introduces
the data and some descriptive statistics; Section 5 presents our results; Section 6 provides
some robustness checks and extensions; finally, Section 7 concludes.
2 Related literature
The existing empirical contributions on the determinants of corruption have highlighted
different potential channels that may lead to the emergence and rise of corruption.
First, some scholars highlighted the role of institutions and of social or cultural norms.
Fisman and Gatti (2006), for example, proved that in the presence of a more stringent
regulation firms are less likely to engage in the bribing of public officials because their
expected benefit from this is limited. Fisman and Miguel (2007), instead, highlighted
how, even when acting in the same institutional environment, agents from high-corruption
countries (on the basis of existing survey-based indexes) turn out to be systematically
more likely to engage in corruptive behaviors.
Several contributions, then, have dig into the mechanisms of political economy that
may underlie the raise of corruption. Ferraz and Finan (2011), for example, studied
7

the relationship between corruption and the electoral cycle, documenting a lower prob-
ability of corruption in the Brazilian municipalities in which incumbent mayors could
get reelected. This evidence would point at the importance of electoral accountability
in conditioning the behavior of politicians. Indeed, in another contribution (Ferraz and
Finan, 2008), the same authors have shown that public exposure of corrupt politicians
lowered the probability of them committing other corruption crimes in the future. In
the same spirit, Campante and Do (2014) found that, in the US, more isolated capital
cities are robustly associated with greater levels of corruption across US states on the
grounds that isolation reduces accountability, while Fisman and Gatti (2002) highlighted
that fiscal decentralization in government spending is significantly associated with lower
corruption.
While bottom-up monitoring on the part of voters indirectly reduces corruption, also
top-down monitoring has proved effective. Avis et al. (2016), for example, structurally
estimated a model of political agency and corruption in the context of the Brazilian anti-
corruption program and concluded that top-down monitoring, i.e. audits, significantly
lower the probability of corruption. Similarly, Olken (2007), in a randomized control
trial conducted in Indonesia, found that increasing government audits largely reduced
the amount of missing expenditures, as measured by the discrepancies between official
project costs and an independent engineers’ estimate of costs, a proxy of corruption
incidence.
By investigating the relationship between the accruing of large economic resources
and corruption, our paper is closest to the works by Brollo et al. (2013) and Isaksson
and Kotsadam (2018). The first estimated, again for the case of Brazil, the effect of
transfers of intergovernmental funds to federal administrations on the propensity of local
politicians and public officials to commit corruption crimes and find a positive sizable
effect. Isaksson and Kotsadam (2018), instead, considered the instance of large foreign
(Chinese) investments in Africa and found more widespread local corruption around active
Chinese project sites. In this case, though, the authors suggest that the main underlying
mechanisms would be a change in norms rather than the availability of financial resources
per se.
From a more specifically policy oriented point of view, we also speak to the recent
literature that has pointed at the existence of inefficiencies, in Italy, in the allocation
and use of public funds received from a central government. Carozzi and Repetto (2016),
for instance, showed that Italian municipalities that are birth towns of politicians in
the national Parliament tend to receive higher transfers from the national government.
Barone and Narciso (2013), instead, highlighted how the presence of organized crime in
an area would attract more transfers to the local administration. As for the use of the
8

public resources provided by the central authority, Rossi (2006) provided a descriptive
overview of the corruption cases spurred by the transfers that the administrations of the
South of Italy received in the recent past.
More broadly speaking, our study provides additional insights to the debate on the
effectiveness of the EU cohesion policy. The impact of structural funds in terms of
employment and GDP growth has been shown to be generally moderately positive (Becker
et al., 2010, 2013) across all EU countries. For what regards Italy, though, the results
on the effectiveness of the EU financing schemes are generally less supportive than those
found for the other EU regions (Ciani and de Blasio, 2015). Most importantly for our
work, is that some recent literature revealed that there may be undesirable side effects
of the policy: Accetturo et al. (2014), for example, showed that the disbursement of EU
funds negatively affected the degree of civicness and social cooperation in the receiving
area.
3 Institutional setting
The European regional policy2 is aimed at promoting growth and investments and reduc-
ing economic and social imbalances among European regions. The policy is implemented
through the so called structural funds, which are allocated by the European Commission
to the member states on a 7 year basis.
Once funds have been assigned to member states, a crucial decision becomes the level
of decentralization at which to manage the funds: a more decentralized management may
leave more room for discretion and hence misbehaviours on the part of local politicians
(Mauro, 1998; Tanzi and Davoodi, 2000), whereas a fully centralized system would reduce
the degree of accountability of the local politicians. As a matter of fact, more than 75%
of the 2007-13 EU budget referring to Italy has been managed by local administrations
(amounting to 46 billion euro, including the national co-financing for around 18 billion).
At least in principle, EU funds represent are an extraordinary disbursement of financial
resources to local administrations as they are meant to finance additional investments on
top of the structural expenditure which is instead financed through local and national
budgets.3
To improve the effectiveness of the funding mechanism and exert the maximum level
2Details on the functioning of the policy can be found on the EC dedicated webpage.3The EC Regional Policy refers to this as the principle of “additionality” of the EU funds, by which
contributions from the Funds must not replace public or equivalent structural expenditure by a MemberState in the regions concerned. Yet, concerns have been raised that the EU structural funds may haverelaxed the local budget constraint partly substituting the resources collected at the local level (Del Bo,2016).
9

of effort from local administrators, the European Commission has set a mechanism of au-
tomatic withdrawal of funds, that takes place whenever member states do not report and
certify the total spending of the assigned funds by the end of the programming period.
Moreover, member states are in charge of auditing the use of funds according to rules
decided at the European level and of signaling any irregularity to the European Com-
mission.4 The threat of withdrawal should push national authorities to impose heavier
regulations and requirements over the administration of the EU funds, and this should
make corruption more difficult and costly. Moreover, in order to make the national policy
makers feel more responsible about the use of the EU funds, it is established that member
states and regions have to guarantee an adequate share of co-financing of the projects
implemented with EU funds as a condition to receive the funds.
Despite these safeguard norms, the possibility of funds misuse should not be disre-
garded because the architecture of the EU funds allocation and spending is complex and
involves many levels of government. This leads to major bureaucratic redundancies and to
a high fractionalization of the expenditure which undermines the possibility of national
authorities to adequately monitor the funds use (see, for instance, Perotti and Teoldi,
2014); moreover, although most projects are managed at the local level, more than 90
percent of co-financing comes from national resources and not from the local ones: this
reduces the incentives for local authorities to monitor the spending of the funds and the
implementation of the projects.
4 Data and descriptive statistics
Our dependent variable, the number of white collar crimes recorded for each municipality
in each year between 2007 and 2014, is taken from SdI (Sistema d’Indagine), the archive of
the Ministry of Interior that contains records of all the crimes committed in the national
territory. This dataset, derived from the IT system used by the police for investigation
activities, has two major advantages: first, because it reports all the open cases which
are under investigation by the police, it provides an instantaneous picture of the criminal
activity in the municipality, whereas most datasets on crimes only report arrests or con-
victions which are likely to occur with delay with respect to when the crime is committed.
Secondly, our dataset is less subject to problems of underreporting of crimes because, on
top of the reports filed by those who might be penalized by the offense, it also contains
records of all the investigations opened by the police forces themselves. This is a par-
ticularly valuable aspect in the case of corruption crimes in that in such crimes neither
4Details on the functioning of the audit mechanism for the 2007-2013 programming period can befound in the EC Regulation No 1828/2006.
10

the corrupter nor the corruptee have any interest in reporting the crime because they
would both be guilty of a criminal offense. The classification of crimes available in the
SdI is made directly by the Ministry of Interior on the basis of the respective applicable
law. We thus identify as white collar crimes all crimes committed against articles 314-323
(crimes against public administration) and 479-481 (crimes against public faith) of the
Italian penal code: these include corruption, bribery, embezzlement, abuse of authority
and fraud.
To build our explanatory variable of interest, then, we use data on disbursements of
EU structural funds published on Opencoesione, an on-line portal created in 2012 that
contains geo-detailed information on the use of EU cohesion policy funds in Italy for
the programming period 2007-2013. The available information includes type of financed
project (public works, purchases of goods and services, subsides for firms and workers
etc.), localization (the receiving municipality), beneficiaries (public administrations or
other subjects residing in the municipality), budgets and payments (inclusive of national
co-financing) relative to all projects financed through structural funds. The data are
reported bimonthly but, to link them with our crime data, we aggregate them on a
yearly basis. In some cases a single project may involve more than one municipality so
that it is not possible to recover the share of payment received by each single municipality.
In these cases we imputed an equal share of payment to each municipality involved.5
We then merge this information with our crime data, that are currently only available
for white collar crimes until 2014. We thus used data on payments made between 2007
and 2014 (because of the EU N+2 rule, payments referring to the 2007-2013 programming
cycle could be made up to 2015).
Finally, we also use, as control variables, additional information at the municipality
level referring to local population size, labor market participation, unemployment, ed-
ucational attainment and political cycle, as well as regional GDP growth. Our control
variables are taken from the Italian National Bureau of Statistics (ISTAT) and from the
Italian registry of academic enrollments (MIUR).
The choice of considering only southern municipalities is mainly motivated by econo-
metric concerns due to the fact that in the Centre and North both the explanatory
variable and the dependent one displayed very little variability. As a matter of facts,
in the programming period 2007-2013, more than 70% of the total financing at the na-
tional level was allocated to the South. According to our data, EU funds disbursements
amounted to about 64 euro per person per year in the South and only 10 euro in the
Centre and the North. This implies that in the latter regions our explanatory variable
5We exclude projects that are managed at the national or regional level (which represent around 20per cent of the EU funds addressed to Italian regions) and only split across municipalities those that aremanaged at the province level (about 5% of the remaining funds).
11

does not show enough variation to identify a meaningful empirical relation (Figure 1).
The same problem arises with regard to the dependent variable: Figure 2 shows the
distribution of white collar crimes in the North and Center, in the left panel, and in
the South, in the right panel. The graphs reveal that the number of white collar crimes
recorded in the SdI dataset is generally very low, but also that these crimes are especially
rare in the regions of central and northern Italy. Indeed, about 85% of the sample of
municipalities in the Centre and North had no white collar crimes at all in any year. In
the South this share was considerably lower, about 60%.6
Furthermore, excluding Northern and Central Italy reduces the degree of heterogeneity
across municipalities in the sample in terms of their time varying characteristics, and in
particular, of the different economic cycles experienced in the most recent years. Indeed,
recent studies (Bank of Italy, 2014; SVIMEZ, 2015) have shown that the latest economic
crises affected the South of Italy in a very different way from the rest of the country.
Table 1 reports the main descriptive statistics for the sample of interest, i.e. mu-
nicipalities in southern Italy in the period 2007-2014. First, we report evidence on the
frequency and size of EU funds disbursements. Transfers were limited in the first years
of the programming period, in 2007 less than 30% of southern municipalities received
money and the average amount was about 65,000 euro per municipality only. Such low
level of funding in the first years mainly reflects the fact that the assignment of public
tenders and other preparatory activities required time to be implemented. At the end
of the programming period, indeed, over 90% of southern municipalities were receiving
funds from the EU, with an average amount more than ten times bigger than at the be-
ginning of the programming period, over 765,000 euro per municipality in 2014. We then
provide evidence on the type of expenditures: around two thirds of the funds financed
public works, the share being quite constant across years. Table 1 also shows the number
of white collar crimes and all crimes per municipality by year. White collar crimes rep-
resent a minor fraction of the total criminal activity: in 2007 only 0.04% of total crimes.
This share, nevertheless, increased over time up to more than doubling in 2011 when it
reached 0.1% due to a simultaneous increase in the number of white collar crimes and
a decrease in the number of total crimes. Figure 2 shows that the number of crimes is
a highly discrete variable: in over 62% of the municipalities analysed there was never a
white collar crime over the period of interest, and only in 6% of the municipalities there
were more than ten crimes. These figures become even lower when we consider yearly
6The fact that most muncipalities received no EU funds and that white collar crimes diplayed suchsmall variability implies that if we estimate our fixed effects model on the sub sample of municipalitiesin the Centre and North we lose about 90% of the observations, therefore remaining with a very selectedsample. The correlation between EU funds and crimes that we estimate on that sample is a non significant-0.01, while it is a positive and significant 0.076∗∗ in the specification without municipality fixed effects,on a sample that mantains about 33% of the total number of observations.
12

variations: 87% of southern municipalities had no white collar crimes in one of the years
considered, only 0.5% had more than ten in a single year.
We also present descriptive statistics on the set of covariates that we will employ as
control variables in our main regressions. The rate of participation in the labor market,
which averages 54% in the provinces of interest, the rate of unemployment, which spiked
in the South from 10% in 2007 to 19% in 2014, the number of new college graduates per
year in the municipality (only 5 new college graduates every 1,000 inhabitants) and the
rate of GDP growth at the regional level, which fluctuated around zero over the years
with the deepest negative peak in 2009. Moreover, we include in the table the statistics
that refer to two features of the local political cycle: the number of years from the last
local elections and the share of municipalities with a mayor who is at his second mandate
(and thus cannot run for re-election).
Finally, in figure 3, we show that there exists a raw positive correlation between
the incidence of white collar crimes and the amount of EU funds transferred to the
municipality in the same year. Yet, this correlation is likely to be spurious for the reasons
discussed in the introduction, and hence we propose below a more demanding empirical
strategy with the aim of netting out possible confounding effects.
5 Empirical strategy
We aim to estimate the effect of EU funds on the insurgence of white collar crimes. If not
efficiently assigned and sufficiently monitored, larger financial transfers from a centralized
authority to local administrations may raise incentives for local public officers to seek rents
out of them. As discussed in the introduction, the identification of a causal parameter
is hampered by the possibility that there may be omitted variables that confound the
relation between the amount of public funds received in a certain municipality and the
incidence of white collar crimes and by the possibility that there may be reverse causality
by which more corrupt politicians attract more funding from the EU.
To deal with omitted variables, our preferred specification will be one that exploits
yearly variations in the amount of funds received by each municipality. The inclusion of
municipality fixed effects will capture all the unobserved time invarying heterogeneity,
while a set of time varying control variables is meant to account for changes over time in
the socio-economic context. The EU funds represent a particularly suitable case study
to analyze the effects of transfers from central to local governments in a regression with
fixed effects because, as shown in table 1, the amount of funds that the EU disbursed to
Southern Italy municipalities varied significantly from year to year. Indeed, unlike the
transfers from the EU, the funding received from the national government for structural
13

expenditure, being based on previous disbursements and on the population size, exhibits
very little yearly variation and its effect thus tends to be fully absorbed by the inclusion
of municipality fixed effects in the regression.
As for reverse causation, we recognize that the possibility that money goes to the
most corrupted administrations is a very real chance. This is indeed what was shown by
Barone and Narciso (2013). Yet, in that paper, the authors establish a plausible long
term relationship, while we focus on short time variations within municipalities. In other
words, if we assume that the degree of corruptness of local politicians and officials is
sufficiently persistent over time, the inclusion of municipality fixed effects will also rule
out the possibility that the estimated coefficients actually capture a reverse causality
relationship.
One critical aspect of our empirical strategy derives, then, from the nature of the
distribution of our outcome variable: as shown in figure 2, the number of crimes is a
highly discrete variable, ranging between 0, in most cases, and 78 (Naples in 2012). This
implies that we cannot estimate the relation of interest by OLS, as the derived coefficients
would be biased (Cameron et al., 1988). We thus choose to employ a specific regression
model for count data so as to restrict the outcome variable Cm,t to be nonnegative integer
values. Specifically, we employ a Poisson regression model. With this empirical approach
the parameter of interest b1 will be interpretable as the elasticity of white collar crimes
to EU funds.
Our main empirical specification, hence, is expressed as follows:
Cm,t = exp {b0 + b1 logEUm,t + b2Xm,t + φt + φm + um,t} (1)
where Cm,t is the number of white collar crimes committed in municipality m in
year t and EUm,t is the corresponding (log of) EU disbursements received by the same
municipality in the same year. Such longitudinal specification allows us to absorb all the
time-invariant unobservable differences across municipalities, φm, as well as any common
time trend captured by the year fixed effects, φt. Therefore, the coefficient of interest,
b1, will be estimated by exploiting only the variation in the outcome within municipality
over time. It follows that only municipality and time varying unobservable characteristics
can confound the estimates.
In this respect, a first concern is due to the fact that our estimation window covers
the years of the economic crises whose consequences varied significantly across different
areas. This may imply that corruption increased more in areas that were more severely
hit by the crisis (as suggested by Bai et al. (2013) for the case of Vietnam), but also that
more funds were transferred to those same municipalities to counterbalance the negative
economic cycle. To address this concern, we control for the local economic conditions
14

by including in the vector of covariates Xm,t the size of the municipality population,
the rate of labour market participation and of unemployment, the level of educational
attainment (incidence of new college graduates in the population), and a regional rate of
GDP growth.
The second issue is then related to a possible direct effect of the local electoral cy-
cle. Ferraz and Finan (2011), for example, find that in Brazil corruption cases are less
likely to arise in municipalities where mayors can run for reelection. To control for the
local electoral cycle, we also include in the vector of covariates Xm,t the years from last
elections and an indicator for second (and last) mandate mayors. Note, however, that
white collar crimes as measured in the SDI archive include misconducts referring to both
elected politicians and non-elected public officials. Therefore, the extent to which elec-
toral aspects matter for our results is limited.
Controlling for potentially omitted variables is not our lonely line of defense. We also
present the results we obtain from a placebo experiment, which uses as outcomes crimes
different from corruption ones. The rational of the placebo is very simple. Should the
effect of EU funds on corruption be driven by a deterioration of the social and economic
local environment - which will happen to be independent but concomitant with the receipt
of EU funds, - then the results for corruption will likely be reflected in similar findings
for the other crimes. If we are unable to find comparable results, then we can more safely
trust that what we observe is truly the impact of EU financing.
6 Results
Table 2 reports the main results of the Poisson regression. First, note that the number
of observations in this specification is lower than the total number of observations in the
sample as reported in table 1 because some municipalities, about one quarter of the total,
received no funds in some years and thus are dropped from the estimation sample. The
sample further restricts significantly when we include municipality fixed effects because
many municipalities had no white collar crimes records at all over the entire period of
analysis.7
Column 1 shows the correlation between EU funds disbursements and the number
of corruption crimes including only the population size as control to scale the variables
of interest,8 together with year fixed effects to account for a common time trend. The
7The results in table 2, columns 1 and 2 are essentially unchanged when we employ the restricted setof observations, i.e. 6009.
8Our specification allows for a flexible relationship between population and the effect of funds. Yet,our results remain essentially unchanged if we impose linearity, i.e. if we consider funds per capita asexplanatory variable.
15

estimated elasticity is 0.084 and it is highly significant. Column 2 adds indicators of socio-
economic activity in the area, which vary over time. This leaves the coefficient essentially
unchanged, equal to 0.073. Column 3, then, introduces municipality fixed effects, thus
taking into account all the unobserved time invariant heterogeneity across municipalities
(omitted variable bias) and, at least partly, the issues of possible reversed causation
discussed in section 5. The inclusion of municipality fixed effects reduces the estimated
coefficient by half, thus confirming that unobserved time invariant heterogeneity accounts
for a large part of the relationship between the amount of EU funds received and the
number of white collar crimes recorded. Yet, the coefficient of interest still remains
positive and highly significant in statistical terms. The estimated elasticity is now 0.037.
When we further include the time varying controls, in column 4, the coefficient is little
affected and equal to 0.042.
According to our preferred and most conservative specification, therefore, the increase
in the number of white collar crimes attributable to a 1% increase in disbursements is
equal to 0.042%.9 This effect is about ten times smaller than the one found in Brollo
et al. (2013) for the case of Brazil. Such discrepancy may be, at least partly, due to the
fact that (i) the incidence of corruption is generally considerably larger in less advanced
economies (Transparency International, 2016); (ii) the type of funds analyzed by Brollo
et al. (2013) are presumably subject to less controls compared to the EU funds.
Some of the time varying characteristics included in the regression in column 4 enter
with interesting impacts. We find that better economic perspectives, as signaled by
a growing GDP and higher number of new college graduates, are associated to higher
corruption. Interestingly, therefore, this correlation has opposite sign relative to that
found by Bai et al. (2013) for Vietnam. We also find that municipalities with a major at
her second mandate experience less corruption. Again this results is in contrast with the
evidence on Brazil provided by Ferraz and Finan (2011), but is consistent with a setting
in which mayors who cannot rerun for the same office run for higher political offices and
moreover reflects the fact that our dependent variable includes not just corruption of
politicians but of any public official in the municipality.
We then explore several dimensions of heterogeneity in our results in table 3. First,
in columns 1 to 3, we distinguish between funds that were received by municipalities to
finance public works and funds received for other purposes (mainly purchase of goods
and services and subsidies to firms and households). We find that the effect of the
EU funds on corruption passes through the former category of expenditures. This is
9In alternatve specification, whose results we do not report fro brevity, we estimate the same modelof equation (1) using the standardized amount of the explanatory variable and find that a one standarddeviation increase in the amount of funds generates an increase in the number of white collar crimes ofabout 11%.
16

an expected upshot: according to the last annual report of the Italian anti-corruption
agency (Autorita’ Nazionale Anticorruzione, 2016), indeed, corruption seems to be nested
mainly in public works, whereas the procedure for the purchase of goods and services and
those to channel the funds to private agents follow more standardized rules, that are less
vulnerable to misconducts.
Second, we analyze the role of several mechanisms that might mitigate the increase
in illegal practices. First (column 4) we consider the quality of the local administration.
Recent empirical literature on the economic impact of structural funds has shown that
differences in the quality of local institutions contribute to produce heterogeneous effects
of the policy on GDP growth and on the local level of civicness (Becker et al., 2013; Ac-
cetturo et al., 2014). We are thus interested in checking whether the effect of EU transfers
on corruption changes depending on the degree of efficiency of the local administration in
the provision of the public good. Indeed, more efficient municipalities generally show a
higher level of administrative capacity and a lower degree of bureaucratic complexity that
make corruption more costly (Fisman and Gatti, 2006). For instance, an entrepreneur
wanting to build a EU-funded plant in a municipality that is relatively inefficient in the
provision of public goods would face higher incentives to bribe local public officials rather
than bearing the burden of red tape. As indicator for efficiency we use the number of
days between the date of approval of a local tax10 that changes at the municipal level,
and the deadline for the approval of the municipal budgetary plan, that is decided at
the national level. Because in recent years the Italian law on real estate tax changed
very frequently, we assume that the earlier a local administration was able to update the
rules on local taxation the more it is efficient (Messina and Savegnago, 2015).11 In our
regressions a municipality is highly efficient if the number of days between the approval
and the deadline is above the median value, this indicator is not time varying as data are
only available for 2012. The coefficient associated to the interaction between the amount
of funds received and the indicator of local administration efficiency, reported in column
4, is not significantly different from zero indicating that all municipalities, no matter
their local level of efficiency, show the same elasticity between EU funds and corruption
crimes.
A second aspect that may reduce the positive effect of funds on white collar crimes
through the mechanisms of bottom-up monitoring discussed in section 2, is the vibrancy of
the local civic life, as measured by the municipal rate of turnout at the 2011 referendum
10Specifically, we refer to the TASI, a locally collected real estate tax.11This indicator of local efficiency is available for all municipalities in 2012. For the overlapping sample
of municipalities, the indicator correlates well with the measure of local efficiency calculated by Baroneand Mocetti (2011) and with the index proposed by Giacomelli and Tonello (2015). When aggregatedat the province level the indicator correlates well with the established proxies for public sector quality,such as Giordano and Tommasino (2011) and Nifo and Vecchione (2014).
17

(column 4). Referenda turnout is a long recognized measure of interest in the public
good, which is exempt from particularistic interests and patronage motivations (Helliwell
and Putnam, 1995). In the 2011 national referendum, citizens were asked to express
their preferences on four relevant topics for the national political debate. Because the
referendum contained four questions and people could respond to some of them only, we
take the municipality average rate of response among the four questions and split the
sample of municipalities into high and low civicness ones depending on whether they fall
above or below the median. The interaction between the indicator of civicness and EU
funds is not significant, thus suggesting that grassroots monitoring has no mitigating
effect on corruption.
A complementary analysis that we perform focuses on the impact of the anti corrup-
tion law approved in 2012.12 The law provided a number of restrictions in the possibility
of assigning directive positions in public administrations to those who had held political
responsibilities in the previous years. At the local level the law only applies to munici-
palities with more than 15 thousand inhabitants. This design allows us to implement a
difference in differences estimation of the impact of the anti-corruption law at the local
level and to identify whether this affected the estimated elasticity between EU funds
and white collar crimes. Results are reported in table 4. In column 1 we show that the
implementation of the law, in 2013 and 2014, generally decreased the number of white
collar crimes in the municipalities where the law was applicable. The estimated impact
is large enough to completely offset the one of the funds but not statistically significant.
In columns 2 and 3, then, we estimated the differential effect of the EU funds depending
on the application of the anti-corruption law. The coefficient of interest is thus the one
associated to the triple interaction term. Interestingly, the coefficient is negative, sug-
gesting that the implementation of the anti-corruption law did offset, to some extent, the
effect of EU funds on corruption. Yet, the lack of statistical significance, does not allow
us to make strong statements in this regard.
7 Robustness checks
As a robustness check we propose a falsification exercise that considers the impact of
EU funds on other types of crimes that should not be associated with the accruing of
financial resources to a given area. Specifically, we test the relationship between EU
funds disbursements and all other crimes (column 1), property related crimes such as
thefts and robberies (column 2) and violent crimes (column 3). The underlying intuition
is that if we were to find an impact of EU funds on crimes like robberies or violent
12Law 190 of 2012, see ANAC for its application to municipal governments.
18

crimes that would cast doubts on the credibility of our argument. For instance, to the
extent that a declining economy makes the residents find it more acceptable to live on
a criminal activity, an observed positive correlation between EU funds and corruption
would be driven by a deterioration of the regulative and market environment rather than
the receipt of transfers per se. The results show no effect at all on both variables.13
A second concern regards the possibility that the arrival of large transfers induces
an increase in the supervision and thus in the rate of detection of criminal activity at
the local level. To, at least partially, rule out this concern, we collected the data on
the funds allocated to some municipalities (around 250 in Southern Italy between 2007
and 2014) through the EU-funded National Security Program (PON Sicurezza) and find
little correlation (0.1) between these and the EU structural funds disbursements and no
significant relationship between the funds for security and the number of white collar
crimes.
8 Conclusions
Plans of large financial transfers from a central unit of government to lower levels of
government are generally used to mitigate differences across regions within a country,
federation of states or union of countries, as the EU. Yet, such transfers come with the
risk of exacerbating the agency problem due to the fact that the funds are collected at
a higher level and then managed locally with typically little transparency on the actual
amount of resources received by each local area. This moral hazard problem may increase
incentives for local administrators to extract rents from the funds received. While systems
of safeguards and monitoring are generally put in place to contrast such risks, growing
evidence suggests that illegal practices and rent seeking are still often associated with the
receipt of transfers from a central government.
In this paper we investigate the relationship between financial transfers from a central
level of government to local administrations and the coincident occurrence of white collar
crimes at the same local level drawing from the case of EU funding to Southern Italy. The
1986 Single European Act defined the aim of the EU cohesion policy as that of reducing
disparities between the various regions and the backwardness of the least-favored regions.
It thus established that resources should be transferred to areas that were most lagging
behind in terms of economic development. The South of Italy has been one of the largest
recipients of EU funds: in the most recent programming period it received 25 billion euro
out of the 35 billion total allocated to Italy and managed at the local level. The empirical
analysis exploits a unique administrative dataset of criminal episodes in Italy and matches
13Note that the sample significantly shrinks because data on other crimes are only available until 2011.
19

them to the records of all the transfers from the EU to each single municipality over the
period 2007-2014.
We find evidence of a significant positive relationship between EU funds and the oc-
currence of corruption and fraudulent behaviors in the recipient municipality in the same
year. We acknowledge that the evidence we provide cannot be taken as fully conclusive,
given the possible simultaneity of criminal activities and funds assignment and disburse-
ments. Yet, the robustness analysis we performed provided evidence that the correlation
between transfers and corruption that we estimate is likely not just spurious or due to
confounding effects.
In terms of external validity of our exercise, an important aspect to take into account
is that EU projects are heavily controlled and processed (see, for instance, the European
Commission portal on cohesion policy). This consideration suggests that the effect we
estimate might represent a lower bound of the impact of extraordinary transfers on cor-
ruption relative to what would happen in the absence of such controls. Indeed, similar
evidence from other countries and transfers schemes has produced significantly larger
estimates.
In regard to the EU cohesion policy, our results, in turn, add to a growing body
of previous literature suggesting that, while their final effectiveness in fostering growth
appears to be limited, transfers might also have unintended negative consequences on local
institutional quality and social capital endowments. In particular, our study documents
- for the first time in a systematic way - that EU funding has entailed some waste
of resources, “lost in corruption”. Yet, such effects may be offset with more careful
procedures of assignment, disbursement and management of the funds that increase the
accountability of local administrators and thus mitigate the underlying agency problem.
20

Figures and tables
Figure 1: EU funds disbursements per municipality, total over the period 2007-2014(hundreds of thousands).
010
2030
40P
erce
nt
0 1-2 2-4 4-6 6-8 8-10 10-12 12-14 14-16 16-18 18-20 >20
North-Centre
010
2030
40P
erce
nt
0 1-2 2-4 4-6 6-8 8-10 10-12 12-14 14-16 16-18 18-20 >20
South
Figure 2: Number of white collar crimes per municipality, total over the period 2007-2014.
020
4060
80P
erce
nt
0 1 2 3 4 5 6 7 8 9 10 >10
North-Centre
020
4060
80P
erce
nt
0 1 2 3 4 5 6 7 8 9 10 >10
South
21

Figure 3: White collar crimes and EU funds
-2-1
01
23
log
crim
es
5 10 15 20log funds
Residuals Fitted values
Notes: Variable on the y axis is the residuals from OLS regressionlog Crimesm,07−14 = b0 + b1 log ¯popm,07−14 + em,07−14; variable on xaxis is log Fundsm,07−14.
22
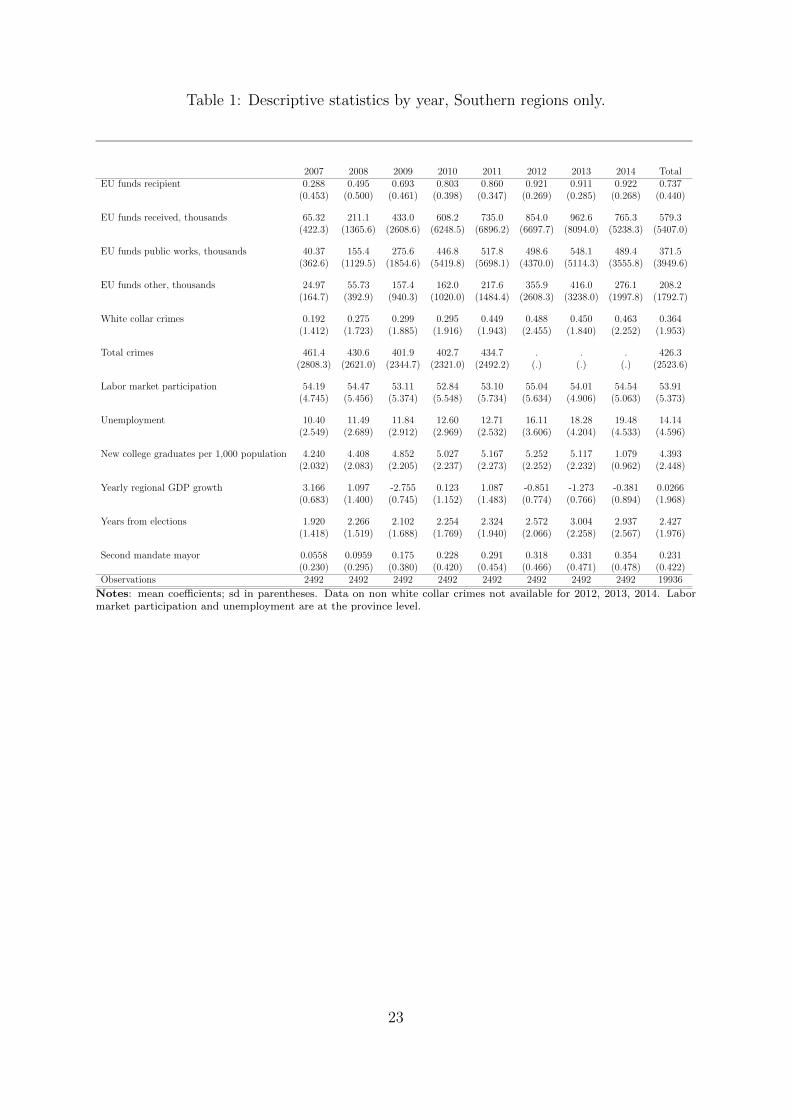
Table 1: Descriptive statistics by year, Southern regions only.
2007 2008 2009 2010 2011 2012 2013 2014 TotalEU funds recipient 0.288 0.495 0.693 0.803 0.860 0.921 0.911 0.922 0.737
(0.453) (0.500) (0.461) (0.398) (0.347) (0.269) (0.285) (0.268) (0.440)
EU funds received, thousands 65.32 211.1 433.0 608.2 735.0 854.0 962.6 765.3 579.3(422.3) (1365.6) (2608.6) (6248.5) (6896.2) (6697.7) (8094.0) (5238.3) (5407.0)
EU funds public works, thousands 40.37 155.4 275.6 446.8 517.8 498.6 548.1 489.4 371.5(362.6) (1129.5) (1854.6) (5419.8) (5698.1) (4370.0) (5114.3) (3555.8) (3949.6)
EU funds other, thousands 24.97 55.73 157.4 162.0 217.6 355.9 416.0 276.1 208.2(164.7) (392.9) (940.3) (1020.0) (1484.4) (2608.3) (3238.0) (1997.8) (1792.7)
White collar crimes 0.192 0.275 0.299 0.295 0.449 0.488 0.450 0.463 0.364(1.412) (1.723) (1.885) (1.916) (1.943) (2.455) (1.840) (2.252) (1.953)
Total crimes 461.4 430.6 401.9 402.7 434.7 . . . 426.3(2808.3) (2621.0) (2344.7) (2321.0) (2492.2) (.) (.) (.) (2523.6)
Labor market participation 54.19 54.47 53.11 52.84 53.10 55.04 54.01 54.54 53.91(4.745) (5.456) (5.374) (5.548) (5.734) (5.634) (4.906) (5.063) (5.373)
Unemployment 10.40 11.49 11.84 12.60 12.71 16.11 18.28 19.48 14.14(2.549) (2.689) (2.912) (2.969) (2.532) (3.606) (4.204) (4.533) (4.596)
New college graduates per 1,000 population 4.240 4.408 4.852 5.027 5.167 5.252 5.117 1.079 4.393(2.032) (2.083) (2.205) (2.237) (2.273) (2.252) (2.232) (0.962) (2.448)
Yearly regional GDP growth 3.166 1.097 -2.755 0.123 1.087 -0.851 -1.273 -0.381 0.0266(0.683) (1.400) (0.745) (1.152) (1.483) (0.774) (0.766) (0.894) (1.968)
Years from elections 1.920 2.266 2.102 2.254 2.324 2.572 3.004 2.937 2.427(1.418) (1.519) (1.688) (1.769) (1.940) (2.066) (2.258) (2.567) (1.976)
Second mandate mayor 0.0558 0.0959 0.175 0.228 0.291 0.318 0.331 0.354 0.231(0.230) (0.295) (0.380) (0.420) (0.454) (0.466) (0.471) (0.478) (0.422)
Observations 2492 2492 2492 2492 2492 2492 2492 2492 19936
Notes: mean coefficients; sd in parentheses. Data on non white collar crimes not available for 2012, 2013, 2014. Labormarket participation and unemployment are at the province level.
23

Table 2: Baseline results. Panel 2007-2014.
(1) (2) (3) (4)
White collar crimes
log disbursements 0.084*** 0.073*** 0.037** 0.042**(0.020) (0.018) (0.016) (0.017)
log population 0.948*** 0.964*** 1.510 1.170(0.034) (0.033) (1.804) (1.853)
Labor market participation -0.011 0.008(0.007) (0.016)
Unemployment -0.033*** -0.027*(0.011) (0.015)
Years from elections 0.003 -0.009(0.014) (0.016)
Second mandate mayor -0.104 -0.174*(0.073) (0.101)
New college graduates per 1,000 population 0.100*** 0.047*(0.026) (0.026)
Yearly regional GDP growth 0.004 0.046**(0.028) (0.022)
Observations 14687 14462 6123 6009Year FE y y y yControls n y n yMuncipality FE n n y yNumber of municipalities 895 891
Notes: Poisson regression, dependent variable is the number of white collar crimes in mu-nicipality i in year t. Labor market participation and unemployment rate at the provincelevel. Standard errors clustered at municipality level in parentheses. *** p<0.01, ** p<0.05,* p<0.1 .
24

Table 3: Heterogeneous results.
(1) (2) (3) (4) (5)
Type of funds Efficiency Civicness
log disbursements 0.054** 0.032*(0.022) (0.019)
log funds for public works 0.027* 0.017(0.015) (0.015)
log other funds -0.007 -0.016(0.019) (0.021)
log disbursement*interaction -0.017 0.033(0.035) (0.029)
log population 2.588 -0.034 1.268 2.917 1.202(1.895) (2.151) (2.323) (2.152) (1.859)
Observations 4691 5111 3807 4570 6009Number of municipalities 761 829 695 677 891Year FE y y y y yControls y y y y yMunicipality FE y y y
Notes: Poisson regression, dependent variable is the number of white collar crimes in municipality i inyear t. Controls are rate of labor market participation and unemployment rate at province level, numberof new college graduates per 1,000 inhabitants, yearly regional GDP growth. Interaction indicates beinghighly efficient (column 4) and having high social capital (column 5). Standard errors clustered atmunicipality level in parentheses. *** p<0.01, ** p<0.05, * p<0.1
25

Table 4: Impact of anti-corruption law.
(1) (2) (3)
White collar crimes
log disbursements 0.042** 0.070*** 0.067***(0.017) (0.021) (0.021)
population >15,000 × post 2013 -0.066 0.283 0.514(0.111) (0.614) (0.650)
population >15,000 × log disbursements × post 2013 -0.024 -0.040(0.045) (0.048)
population >15,000 × log disbursements -0.071*** -0.060**(0.023) (0.024)
post 2013 × log disbursements 0.009 0.026(0.037) (0.039)
log population 1.288 1.584 1.134(1.883) (1.867) (1.919)
Observations 6009 6123 6009Number of municipalities 891 895 891Year FE y y yControls n n nMuncipality FE y y y
Notes: Poisson regression, dependent variable is the number of white collar crimes in municipalityi in year t. Controls are rate of labor market participation and unemployment rate at province level,number of new college graduates per 1,000 inhabitants, yearly regional GDP growth. Standarderrors clustered at municipality level in parentheses. *** p<0.01, ** p<0.05, * p<0.1
26

Table 5: Robustness checks: placebo.
(1) (2) (3)
Other crimes Property crimes Violent crimes
log disbursements 0.001 0.003 -0.007(0.003) (0.003) (0.005)
log population 1.149*** 1.011** 1.461*(0.431) (0.457) (0.749)
Observations 3342 3342 3335Number of id comune 831 831 828Year FE y y yControls y y yProvince FE n n nMuncipality FE y y y
Notes: Poisson regression, dependent variable is the number of white collar crimes in municipalityi in year t. Sample is restricted to years 2007-2011 as data on non white collar crimes are notavailable for other years. Controls are rate of labor market participation and unemployment rate atprovince level, number of new college graduates per 1,000 inhabitants, yearly regional GDP growth.Interaction indicates being highly efficient (column 4) and having high social capital (column 5).Standard errors clustered at municipality level in parentheses. *** p<0.01, ** p<0.05, * p<0.1.
27

References
Accetturo, A., G. de Blasio, and L. Ricci (2014). A tale of an unwanted outcome: Trans-
fers and local endowments of trust and cooperation. Journal of Economic Behavior &
Organization 102 (C), 74–89.
Autorita’ Nazionale Anticorruzione (2016). Relazione Annuale 2015. Report to the
Parliament, ANAC, Autorita’ Nazionale Anticorruzione.
Avis, E., C. Ferraz, and F. Finan (2016). Do Government Audits Reduce Corruption?
Estimating the Impacts of Exposing Corrupt Politicians. NBER Working Papers 22443,
National Bureau of Economic Research, Inc.
Bai, J., S. Jayachandran, E. J. Malesky, and B. A. Olken (2013). Does Economic Growth
Reduce Corruption? Theory and Evidence from Vietnam. NBER Working Papers
19483, National Bureau of Economic Research, Inc.
Bandiera, O., A. Prat, and T. Valletti (2009, September). Active and passive waste
in government spending: Evidence from a policy experiment. American Economic
Review 99 (4), 1278–1308.
Bank of Italy (2014). The economy of the Italian regions. Economie regionali 43, Bank
of Italy.
Barone, G. and S. Mocetti (2011). Tax morale and public spending inefficiency. Interna-
tional Tax and Public Finance 18 (6), 724–749.
Barone, G. and G. Narciso (2013). The effect of organized crime on public funds. Temi
di discussione (Economic working papers) 916, Bank of Italy, Economic Research and
International Relations Area.
Becker, S. O., P. H. Egger, and M. von Ehrlich (2010). Going NUTS: The effect of
EU Structural Funds on regional performance. Journal of Public Economics 94 (9-10),
578–590.
Becker, S. O., P. H. Egger, and M. von Ehrlich (2013). Absorptive Capacity and the
Growth and Investment Effects of Regional Transfers: A Regression Discontinuity De-
sign with Heterogeneous Treatment Effects. American Economic Journal: Economic
Policy 5 (4), 29–77.
Brollo, F., T. Nannicini, R. Perotti, and G. Tabellini (2013). The Political Resource
Curse. American Economic Review 103 (5), 1759–96.
28

Cameron, A. C., P. Trivedi, F. Milne, and J. Piggott (1988). A microeconometric model
of the demand for health care and health insurance in australia. Review of Economic
Studies 55 (1), 85–106.
Campante, F. R. and Q.-A. Do (2014). Isolated Capital Cities, Accountability, and
Corruption: Evidence from US States. American Economic Review 104 (8), 2456–81.
Carozzi, F. and L. Repetto (2016). Sending the pork home: Birth town bias in transfers
to Italian municipalities. Journal of Public Economics 134 (C), 42–52.
Ciani, E. and G. de Blasio (2015). European structural funds during the crisis: evidence
from Southern Italy. IZA Journal of Labor Policy 4 (1), 1–31.
Del Bo, C. F. (2016, 08). Fiscal autonomy and eu structural funds: The case of the
italian regional income tax system. 46.
Ferraz, C. and F. Finan (2008). Exposing Corrupt Politicians: The Effects of Brazil’s
Publicly Released Audits on Electoral Outcomes. The Quarterly Journal of Eco-
nomics 123 (2), 703–745.
Ferraz, C. and F. Finan (2011). Electoral Accountability and Corruption: Evidence from
the Audits of Local Governments. American Economic Review 101 (4), 1274–1311.
Fisman, R. and R. Gatti (2002). Decentralization and corruption: evidence across coun-
tries. Journal of Public Economics 83 (3), 325–345.
Fisman, R. and R. Gatti (2006, October). Bargaining for Bribes: The Role of Institu-
tions. In International Handbook on the Economics of Corruption, Chapters, Chapter 4.
Edward Elgar Publishing.
Fisman, R. and E. Miguel (2007). Corruption, Norms, and Legal Enforcement: Evidence
from Diplomatic Parking Tickets. Journal of Political Economy 115 (6), 1020–1048.
Giacomelli, S. and M. Tonello (2015). Measuring the performance of local governments:
evidence from mystery calls. Questioni di Economia e Finanza (Occasional Papers)
292, Bank of Italy, Economic Research and International Relations Area.
Giordano, R. and P. Tommasino (2011). Public sector efficiency and political culture.
Temi di discussione (Economic working papers) 786, Bank of Italy, Economic Research
and International Relations Area.
Helliwell, J. F. and R. D. Putnam (1995). Economic Growth and Social Capital in Italy.
Eastern Economic Journal 21 (3), 295–307.
29

Isaksson, A.-S. and A. Kotsadam (2018). Chinese aid and local corruption. Journal of
Public Economics Forthcoming, https://doi.org/10.1016/j.jpubeco.2018.01.002.
Mauro, P. (1998). Corruption and the composition of government expenditure. Journal
of Public Economics 69 (2), 263–279.
Messina, G. and M. Savegnago (2015). Le imposte sulla prima casa in Italia, un equilibrio
difficile fra decentramento e redistribuzione. Economia Pubblica (3), 5–29.
Nifo, A. and G. Vecchione (2014). Do Institutions Play a Role in Skilled Migration? The
Case of Italy. Regional Studies 48 (10), 1628–1649.
OLAF (2016). The OLAF Report 2015. Yearly report XVI, European Anti Fraud Office.
Olken, B. A. (2007). Monitoring Corruption: Evidence from a Field Experiment in
Indonesia. Journal of Political Economy 115, 200–249.
Rossi, N. (2006). Mediterraneo del nord. Laterza.
SVIMEZ (2015). Rapporto sull’economia del Mezzogiorno. il Mulino.
Tanzi, V. and H. R. Davoodi (2000). Corruption, Growth, and Public Finances. IMF
Working Papers 00/182, International Monetary Fund.
Vicente, P. C. (2010). Does oil corrupt? Evidence from a natural experiment in West
Africa. Journal of Development Economics 92 (1), 28–38.
30

(*) Requests for copies should be sent to: Banca d’Italia – Servizio Studi di struttura economica e finanziaria – Divisione Biblioteca e Archivio storico – Via Nazionale, 91 – 00184 Rome – (fax 0039 06 47922059). They are available on the Internet www.bancaditalia.it.
RECENTLY PUBLISHED “TEMI” (*)
N. 1170 – The global component of inflation volatility, by Andrea Carriero, Francesco Corsello and Massimiliano Marcellino (April 2018).
N. 1171 – The potential of big housing data: an application to the Italian real-estate market, by Michele Loberto, Andrea Luciani and Marco Pangallo (April 2018).
N. 1172 – ECB monetary policy and the euro exchange rate, by Martina Cecioni (April 2018).
N. 1173 – Firms’ investments during two crises, by Antonio De Socio and Enrico Sette (April 2018).
N. 1174 – How can the government spending multiplier be small at the zero lower bound?, by Valerio Ercolani and João Valle e Azevedo (April 2018).
N. 1153 – Systemic risk and systemic importance measures during the crisis, by Sergio Masciantonio and Andrea Zaghini (December 2017).
N. 1154 – Capital controls, macroprudential measures and monetary policy interactions in an emerging economy, by Valerio Nispi Landi (December 2017).
N. 1155 – Optimal monetary policy and fiscal policy interaction in a non-Ricardian economy, by Massimiliano Rigon and Francesco Zanetti (December 2017).
N. 1156 – Secular stagnation, R&D, public investment and monetary policy: a global-model perspective, by Pietro Cova, Patrizio Pagano, Alessandro Notarpietro and Massimiliano Pisani (December 2017).
N. 1157 – The CSPP at work: yield heterogeneity and the portfolio rebalancing channel, by Andrea Zaghini (December 2017).
N. 1158 – Targeting policy-compliers with machine learning: an application to a tax rebate programme in Italy, by Monica Andini, Emanuele Ciani, Guido de Blasio, Alessio D’Ignazio and Viola Salvestrini (December 2017).
N. 1159 – Banks’ maturity transformation: risk, reward, and policy, by Pierluigi Bologna (December 2017).
N. 1160 – Pairwise trading in the money market during the European sovereign debt crisis, by Edoardo Rainone (December 2017).
N. 1161 – Please in my back yard: the private and public benefitsof a new tram line in Florence, by Valeriia Budiakivska and Luca Casolaro (January 2018).
N. 1162 – Real exchange rate misalignments in the euro area, by by Michael Fidora, Claire Giordano and Martin Schmitz (January 2018).
N. 1163 – What will Brexit mean for the British and euro-area economies? A model-based assessment of trade regimes, by Massimiliano Pisani and Filippo Vergara Caffarelli (January 2018).
N. 1164 – Are lenders using risk-based pricing in the consumer loan market? The effects of the 2008 crisis, by Silvia Magri (January 2018).
N. 1165 – Listening to the buzz: social media sentiment and retail depositors’ trust by Matteo Accornero and Mirko Moscatelli (February 2018)
N. 1166 – Banks’ holdings of and trading in government bonds, by Michele Manna and Stefano Nobili (March 2018).
N. 1167 – Firms’ and households’ investment in Italy: the role of credit constraints and other macro factors, by Claire Giordano, Marco Marinucci and Andrea Silvestrini (March 2018).
N. 1168 – Credit supply and productivity growth, by Francesco Manaresi and Nicola Pierri (March 2018).
N. 1169 – Consumption volatility risk and the inversion of the yield curve, by Adriana Grasso and Filippo Natoli (March 2018).
N. 1152 – International financial flows and the risk-taking channel, by Pietro Cova and Filippo Natoli (December 2017).

"TEMI" LATER PUBLISHED ELSEWHERE
2016
ALBANESE G., G. DE BLASIO and P. SESTITO, My parents taught me. evidence on the family transmission of values, Journal of Population Economics, v. 29, 2, pp. 571-592, TD No. 955 (March 2014).
ANDINI M. and G. DE BLASIO, Local development that money cannot buy: Italy’s Contratti di Programma, Journal of Economic Geography, v. 16, 2, pp. 365-393, TD No. 915 (June 2013).
BARONE G. and S. MOCETTI, Inequality and trust: new evidence from panel data, Economic Inquiry, v. 54, pp. 794-809, TD No. 973 (October 2014).
BELTRATTI A., B. BORTOLOTTI and M. CACCAVAIO, Stock market efficiency in China: evidence from the split-share reform, Quarterly Review of Economics and Finance, v. 60, pp. 125-137, TD No. 969 (October 2014).
BOLATTO S. and M. SBRACIA, Deconstructing the gains from trade: selection of industries vs reallocation of workers, Review of International Economics, v. 24, 2, pp. 344-363, TD No. 1037 (November 2015).
BOLTON P., X. FREIXAS, L. GAMBACORTA and P. E. MISTRULLI, Relationship and transaction lending in a crisis, Review of Financial Studies, v. 29, 10, pp. 2643-2676, TD No. 917 (July 2013).
BONACCORSI DI PATTI E. and E. SETTE, Did the securitization market freeze affect bank lending during the financial crisis? Evidence from a credit register, Journal of Financial Intermediation , v. 25, 1, pp. 54-76, TD No. 848 (February 2012).
BORIN A. and M. MANCINI, Foreign direct investment and firm performance: an empirical analysis of Italian firms, Review of World Economics, v. 152, 4, pp. 705-732, TD No. 1011 (June 2015).
BRAGOLI D., M. RIGON and F. ZANETTI, Optimal inflation weights in the euro area, International Journal of Central Banking, v. 12, 2, pp. 357-383, TD No. 1045 (January 2016).
BRANDOLINI A. and E. VIVIANO, Behind and beyond the (headcount) employment rate, Journal of the Royal Statistical Society: Series A, v. 179, 3, pp. 657-681, TD No. 965 (July 2015).
BRIPI F., The role of regulation on entry: evidence from the Italian provinces, World Bank Economic Review, v. 30, 2, pp. 383-411, TD No. 932 (September 2013).
BRONZINI R. and P. PISELLI, The impact of R&D subsidies on firm innovation, Research Policy, v. 45, 2, pp. 442-457, TD No. 960 (April 2014).
BURLON L. and M. VILALTA-BUFI, A new look at technical progress and early retirement, IZA Journal of Labor Policy, v. 5, TD No. 963 (June 2014).
BUSETTI F. and M. CAIVANO, The trend–cycle decomposition of output and the Phillips Curve: bayesian estimates for Italy and the Euro Area, Empirical Economics, V. 50, 4, pp. 1565-1587, TD No. 941 (November 2013).
CAIVANO M. and A. HARVEY, Time-series models with an EGB2 conditional distribution, Journal of Time Series Analysis, v. 35, 6, pp. 558-571, TD No. 947 (January 2014).
CALZA A. and A. ZAGHINI, Shoe-leather costs in the euro area and the foreign demand for euro banknotes, International Journal of Central Banking, v. 12, 1, pp. 231-246, TD No. 1039 (December 2015).
CESARONI T. and R. DE SANTIS, Current account “core-periphery dualism” in the EMU, The World Economy, v. 39, 10, pp. 1514-1538, TD No. 996 (December 2014).
CIANI E., Retirement, Pension eligibility and home production, Labour Economics, v. 38, pp. 106-120, TD No. 1056 (March 2016).
CIARLONE A. and V. MICELI, Escaping financial crises? Macro evidence from sovereign wealth funds’ investment behaviour, Emerging Markets Review, v. 27, 2, pp. 169-196, TD No. 972 (October 2014).
CORNELI F. and E. TARANTINO, Sovereign debt and reserves with liquidity and productivity crises, Journal of International Money and Finance, v. 65, pp. 166-194, TD No. 1012 (June 2015).
D’AURIZIO L. and D. DEPALO, An evaluation of the policies on repayment of government’s trade debt in Italy, Italian Economic Journal, v. 2, 2, pp. 167-196, TD No. 1061 (April 2016).
DE BLASIO G., G. MAGIO and C. MENON, Down and out in Italian towns: measuring the impact of economic downturns on crime, Economics Letters, 146, pp. 99-102, TD No. 925 (July 2013).
DOTTORI D. and M. MANNA, Strategy and tactics in public debt management, Journal of Policy Modeling, v. 38, 1, pp. 1-25, TD No. 1005 (March 2015).

LIBERATI D., M. MARINUCCI and G. M. TANZI, Science and technology parks in Italy: main features and analysis of their effects on hosted firms, Journal of Technology Transfer, v. 41, 4, pp. 694-729, TD No. 983 (November 2014).
MARCELLINO M., M. PORQUEDDU and F. VENDITTI, Short-Term GDP forecasting with a mixed frequency dynamic factor model with stochastic volatility, Journal of Business & Economic Statistics , v. 34, 1, pp. 118-127, TD No. 896 (January 2013).
RODANO G., N. SERRANO-VELARDE and E. TARANTINO, Bankruptcy law and bank financing, Journal of Financial Economics, v. 120, 2, pp. 363-382, TD No. 1013 (June 2015).
ZINNA G., Price pressures on UK real rates: an empirical investigation, Review of Finance,v. 20, 4, pp. 1587-1630, TD No. 968 (July 2014).
2017
ADAMOPOULOU A. and G.M. TANZI, Academic dropout and the great recession, Journal of Human Capital, V. 11, 1, pp. 35–71, TD No. 970 (October 2014).
ALBERTAZZI U., M. BOTTERO and G. SENE, Information externalities in the credit market and the spell of credit rationing, Journal of Financial Intermediation, v. 30, pp. 61–70, TD No. 980 (November 2014).
ALESSANDRI P. and H. MUMTAZ, Financial indicators and density forecasts for US output and inflation, Review of Economic Dynamics, v. 24, pp. 66-78, TD No. 977 (November 2014).
BARBIERI G., C. ROSSETTI and P. SESTITO, Teacher motivation and student learning, Politica economica/Journal of Economic Policy, v. 33, 1, pp.59-72, TD No. 761 (June 2010).
BENTIVOGLI C. and M. LITTERIO, Foreign ownership and performance: evidence from a panel of Italian firms, International Journal of the Economics of Business, v. 24, 3, pp. 251-273, TD No. 1085 (October 2016).
BRONZINI R. and A. D’IGNAZIO, Bank internationalisation and firm exports: evidence from matched firm-bank data, Review of International Economics, v. 25, 3, pp. 476-499 TD No. 1055 (March 2016).
BRUCHE M. and A. SEGURA, Debt maturity and the liquidity of secondary debt markets, Journal of Financial Economics, v. 124, 3, pp. 599-613, TD No. 1049 (January 2016).
BURLON L., Public expenditure distribution, voting, and growth, Journal of Public Economic Theory,, v. 19, 4, pp. 789–810, TD No. 961 (April 2014).
BURLON L., A. GERALI, A. NOTARPIETRO and M. PISANI, Macroeconomic effectiveness of non-standard monetary policy and early exit. a model-based evaluation, International Finance, v. 20, 2, pp.155-173, TD No. 1074 (July 2016).
BUSETTI F., Quantile aggregation of density forecasts, Oxford Bulletin of Economics and Statistics, v. 79, 4, pp. 495-512, TD No. 979 (November 2014).
CESARONI T. and S. IEZZI, The predictive content of business survey indicators: evidence from SIGE, Journal of Business Cycle Research, v.13, 1, pp 75–104, TD No. 1031 (October 2015).
CONTI P., D. MARELLA and A. NERI, Statistical matching and uncertainty analysis in combining household income and expenditure data, Statistical Methods & Applications, v. 26, 3, pp 485–505, TD No. 1018 (July 2015).
D’AMURI F., Monitoring and disincentives in containing paid sick leave, Labour Economics, v. 49, pp. 74-83, TD No. 787 (January 2011).
D’AMURI F. and J. MARCUCCI, The predictive power of google searches in forecasting unemployment, International Journal of Forecasting, v. 33, 4, pp. 801-816, TD No. 891 (November 2012).
DE BLASIO G. and S. POY, The impact of local minimum wages on employment: evidence from Italy in the 1950s, Journal of Regional Science, v. 57, 1, pp. 48-74, TD No. 953 (March 2014).
DEL GIOVANE P., A. NOBILI and F. M. SIGNORETTI, Assessing the sources of credit supply tightening: was the sovereign debt crisis different from Lehman?, International Journal of Central Banking, v. 13, 2, pp. 197-234, TD No. 942 (November 2013).
DEL PRETE S., M. PAGNINI, P. ROSSI and V. VACCA, Lending organization and credit supply during the 2008–2009 crisis, Economic Notes, v. 46, 2, pp. 207–236, TD No. 1108 (April 2017).
DELLE MONACHE D. and I. PETRELLA, Adaptive models and heavy tails with an application to inflation forecasting, International Journal of Forecasting, v. 33, 2, pp. 482-501, TD No. 1052 (March 2016).

FEDERICO S. and E. TOSTI, Exporters and importers of services: firm-level evidence on Italy, The World Economy, v. 40, 10, pp. 2078-2096, TD No. 877 (September 2012).
GIACOMELLI S. and C. MENON, Does weak contract enforcement affect firm size? Evidence from the neighbour's court, Journal of Economic Geography, v. 17, 6, pp. 1251-1282, TD No. 898 (January 2013).
LOBERTO M. and C. PERRICONE, Does trend inflation make a difference?, Economic Modelling, v. 61, pp. 351–375, TD No. 1033 (October 2015).
MANCINI A.L., C. MONFARDINI and S. PASQUA, Is a good example the best sermon? Children’s imitation of parental reading, Review of Economics of the Household, v. 15, 3, pp 965–993, D No. 958 (April 2014).
MEEKS R., B. NELSON and P. ALESSANDRI, Shadow banks and macroeconomic instability, Journal of Money, Credit and Banking, v. 49, 7, pp. 1483–1516, TD No. 939 (November 2013).
MICUCCI G. and P. ROSSI, Debt restructuring and the role of banks’ organizational structure and lending technologies, Journal of Financial Services Research, v. 51, 3, pp 339–361, TD No. 763 (June 2010).
MOCETTI S., M. PAGNINI and E. SETTE, Information technology and banking organization, Journal of Journal of Financial Services Research, v. 51, pp. 313-338, TD No. 752 (March 2010).
MOCETTI S. and E. VIVIANO, Looking behind mortgage delinquencies, Journal of Banking & Finance, v. 75, pp. 53-63, TD No. 999 (January 2015).
NOBILI A. and F. ZOLLINO, A structural model for the housing and credit market in Italy, Journal of Housing Economics, v. 36, pp. 73-87, TD No. 887 (October 2012).
PALAZZO F., Search costs and the severity of adverse selection, Research in Economics, v. 71, 1, pp. 171-197, TD No. 1073 (July 2016).
PATACCHINI E. and E. RAINONE, Social ties and the demand for financial services, Journal of Financial Services Research, v. 52, 1–2, pp 35–88, TD No. 1115 (June 2017).
PATACCHINI E., E. RAINONE and Y. ZENOU, Heterogeneous peer effects in education, Journal of Economic Behavior & Organization, v. 134, pp. 190–227, TD No. 1048 (January 2016).
SBRANA G., A. SILVESTRINI and F. VENDITTI, Short-term inflation forecasting: the M.E.T.A. approach, International Journal of Forecasting, v. 33, 4, pp. 1065-1081, TD No. 1016 (June 2015).
SEGURA A. and J. SUAREZ, How excessive is banks' maturity transformation?, Review of Financial Studies, v. 30, 10, pp. 3538–3580, TD No. 1065 (April 2016).
VACCA V., An unexpected crisis? Looking at pricing effectiveness of heterogeneous banks, Economic Notes, v. 46, 2, pp. 171–206, TD No. 814 (July 2011).
VERGARA CAFFARELI F., One-way flow networks with decreasing returns to linking, Dynamic Games and Applications, v. 7, 2, pp. 323-345, TD No. 734 (November 2009).
ZAGHINI A., A Tale of fragmentation: corporate funding in the euro-area bond market, International Review of Financial Analysis, v. 49, pp. 59-68, TD No. 1104 (February 2017).
2018
BELOTTI F. and G. ILARDI Consistent inference in fixed-effects stochastic frontier models, Journal of Econometrics, v. 202, 2, pp. 161-177, TD No. 1147 (October 2017).
CARTA F. and M. DE PHLIPPIS, You've Come a long way, baby. husbands' commuting time and family labour supply, Regional Science and Urban Economics, v. 69, pp. 25-37, TD No. 1003 (March 2015).
CARTA F. and L. RIZZICA, Early kindergarten, maternal labor supply and children's outcomes: evidence from Italy, Journal of Public Economics, v. 158, pp. 79-102, TD No. 1030 (October 2015).
CECCHETTI S., F. NATOLI and L. SIGALOTTI, Tail co-movement in inflation expectations as an indicator of anchoring, International Journal of Central Banking, v. 14, 1, pp. 35-71, TD No. 1025 (July 2015).
NUCCI F. and M. RIGGI, Labor force participation, wage rigidities, and inflation, Journal of Macroeconomics, v. 55, 3 pp. 274-292, TD No. 1054 (March 2016).
SEGURA A., Why did sponsor banks rescue their SIVs?, Review of Finance, v. 22, 2, pp. 661-697, TD No. 1100 (February 2017).

FORTHCOMING
ADAMOPOULOU A. and E. KAYA, Young Adults living with their parents and the influence of peers, Oxford Bulletin of Economics and Statistics, TD No. 1038 (November 2015).
ALBANESE G., G. DE BLASIO and P. SESTITO, Trust, risk and time preferences: evidence from survey data, International Review of Economics, TD No. 911 (April 2013).
BARONE G., G. DE BLASIO and S. MOCETTI, The real effects of credit crunch in the great recession: evidence from Italian provinces, Regional Science and Urban Economics, TD No. 1057 (March 2016).
BELOTTI F. and G. ILARDI, Consistent inference in fixed-effects stochastic frontier models, Journal of Econometrics, TD No. 1147 (October 2017).
BERTON F., S. MOCETTI, A. PRESBITERO and M. RICHIARDI, Banks, firms, and jobs, Review of Financial Studies, TD No. 1097 (February 2017).
BOFONDI M., L. CARPINELLI and E. SETTE, Credit supply during a sovereign debt crisis, Journal of the European Economic Association, TD No. 909 (April 2013).
BRILLI Y. and M. TONELLO, Does increasing compulsory education reduce or displace adolescent crime? New evidence from administrative and victimization data, CESifo Economic Studies, TD No. 1008 (April 2015).
CASIRAGHI M., E. GAIOTTI, L. RODANO and A. SECCHI, A “Reverse Robin Hood”? The distributional implications of non-standard monetary policy for Italian households, Journal of International Money and Finance, TD No. 1077 (July 2016).
CIPRIANI M., A. GUARINO, G. GUAZZAROTTI, F. TAGLIATI and S. FISHER, Informational contagion in the laboratory, Review of Finance, TD No. 1063 (April 2016).
D’AMURI F., Monitoring and disincentives in containing paid sick leave, Labour Economics, TD No. 787 (January 2011).
FEDERICO S. and E. TOSTI, Exporters and importers of services: firm-level evidence on Italy, The World Economy, TD No. 877 (September 2012).
GIACOMELLI S. and C. MENON, Does weak contract enforcement affect firm size? Evidence from the neighbour's court, Journal of Economic Geography, TD No. 898 (January 2013).
NATOLI F. and L. SIGALOTTI, Tail co-movement in inflation expectations as an indicator of anchoring, International Journal of Central Banking, TD No. 1025 (July 2015).
RIGGI M., Capital destruction, jobless recoveries, and the discipline device role of unemployment, Macroeconomic Dynamics, TD No. 871 (July 2012).
SEGURA A., Why did sponsor banks rescue their SIVs?, Review of Finance, TD No. 1100 (February 2017).