telstra\'s climate change opportunities report
DESCRIPTION
Describes 7 opportunities for ICT to reduce Australia\'s carbon emissionsTRANSCRIPT
�Towards a High-Bandwidth, Low-Carbon FutureClimate Risk
Climate Risk Pty Ltd provide specialist professional services to business and government on risk, opportunity and adaptation to climate change.
Towards a High-Bandwidth, Low-Carbon Future Telecommunications-based Opportunities to Reduce Greenhouse Gas Emissions
www.climaterisk.net
A C
limat
e R
isk
Rep
ort
Climate Risk
�Towards a High-Bandwidth, Low-Carbon FutureClimate Risk
Climate Risk Pty Limited (Australia)
Level �,
36 Lauderdale AvenueFairlight, NSW �094
Tel: + 6� � 8003 45�4
Brisbane: + 6� 7 3�0� 45�3
www.climaterisk.net
Climate Risk Europe Limited
Manchester: + 44 �6 ��73 �474
This report was prepared by:
Dr Karl Mallon BSc PhD
Gareth Johnston GC. Sust CSAP [email protected]
Donovan Burton B.Env.Plan (Hons) [email protected]
Jeremy Cavanagh B.Eng
Design and layout by Bethan Burton BSc
Towards a High-Bandwidth, Low-Carbon Future: Telecommunications-based Opportunities to Reduce Greenhouse Gas Emissions. Version 1.0
ISBN: 978-0-9804343-0-9
DisclaimerClimate Risk provides professional services in relation to climate change risks and opportunities. Our technical and professional staff endeavour to work to international best practice standards using experienced scientists, sector specialists and associated experts.
This document is intended to stimulate ideas and generate discussion amongst business government and society about the role telecommunications can play in reducing carbon emissions. While the information contained is drawn from reputable sources in the public domain, Climate Risk cannot take responsibility for errors or inaccuracies within original source material.
This report does not consider individual investment requirements or the particular needs of individuals, corporations or others and as such the report should not be relied upon as the basis for specific commercial decisions.
Telstra and Climate Risk support a constructive dialogue about the ideas and concepts contained herein.
iTowards a High-Bandwidth, Low-Carbon FutureClimate Risk
Dr Karl Mallon
Dr Karl Mallon is director of Science and Systems at Climate Risk Pty Ltd. He is
a first class honours graduate in physics from the United Kingdom and holds a
doctorate in Mechanical Engineering from the University of Melbourne. He has
been the recipient of research scholarships from the British Council and European
Centre for Nuclear Research (CERN). Karl has worked in the field of climate change
and energy since �99� and is the editor and co-author of ‘Renewable Energy Policy
and Politics: A Handbook for Decision Making’ published by Earthscan (London). He has worked as
a technology and energy policy analyst for various international government and non-government
organisations. Karl was a member of the CSIRO’s Energy Futures Forum which reported in �006, as well
as a director of the Australian Wind Energy Association between �003 and �005.
Gareth JohnstonGareth Johnston is director of Corporate and Government Risk at Climate Risk
Pty Ltd. Post graduate qualified in sustainability, with a background in land
management and infrastructure development, Gareth focuses on emergent
opportunities for Climate Risk clients. As founding CEO of a CSIRO energy
technology company and executive director of an Australian management
consulting company, Gareth has consulted to the largest Australian, European and
Japanese utilities. His development work has given him exposure to local, state
and federal governments across Europe and Australasia.
Donovan Burton
Donovan Burton is a Senior Associate with Climate Risk. Donovan heads Climate
Risk’s Planning and Local Government section where he works closely with
local government and industry to help develop climate change adaptation and
mitigation strategies. He has a degree in Environmental Planning and achieved a
first class honours for his thesis on local climate change mitigation. Donovan is
also a PhD candidate at Griffith University and has recently been announced as a
Wentworth Scholar. Donovan’s recent research is on local scale adaptation where
he is developing tools to quantify the impacts of climate change on human settlements.
Jeremy Cavanagh
Jeremy Cavanagh has a degree in electrical engineering from University
Technology Sydney and postgraduate qualifications in sustainability. With
over �0 years international telecommunications experience he has provided
technical operations management for terrestrial and satellite service operators
including AUSSAT and France Telecom. Jeremy is a recognised analyst of
media technology innovation and has been published in DTV(US), TVB Europe
and BEN (AUST). Jeremy provides technical planning and execution expertise
which is used by international broadcasters including CNN, CBS, ITN, ITV and Channel 7. His work in
telecommunications and broadcasting has been recognised internationally and he has shared in three
US Emmy awards for technical excellence.
Climate Risk Team
iiTowards a High-Bandwidth, Low-Carbon FutureClimate Risk
Greg Bourne
Greg Bourne is chief executive of WWF Australia and a member of the National
Advisory Committee for Environment Business Australia. Greg was formerly
Regional President of BP Australasia, part of a career in the oil and gas industry
spanning over �5 years. Greg’s work in oil research and exploration included work
in the United Kingdom, the USA, Latin America, Canada, Ireland, Brazil, China,
Australia, Papua New Guinea and Middle East. During the middle of his career,
Greg was also seconded to the Prime Minister’s Policy Unit at �0 Downing Street
in �988 as Special Adviser on Energy and Transport. Greg took up his current position as CEO WWF-
Australia in October �004. Greg is also Chair of the Sustainable Energy Authority of Victoria and a
Member of the CSIRO Sector Advisory Council to the Natural Resource Management and Environment
Sector. He was awarded the Centenary Medal for services to the environment.
Dr Hugh Saddler
Dr Saddler has a degree in science from Adelaide University and a PhD from
Cambridge University. He is the author of a book on Australian energy policy,
‘Energy in Australia’ and over 50 scientific papers, monographs and articles
on energy technology and environmental policy, and is recognised as one of
Australia’s leading experts in this field. He is currently a member of the Experts
Group on Emissions Trading, appointed by the Australian Greenhouse Office, of
the ABS Environmental Statistics Advisory Group, and of the ACT Environment
Advisory Committee. In �998 he was appointed an Adjunct Professor at Murdoch University. He is a
Fellow of the Australian Institute of Energy and a member of the International Association for Energy
Economics. Between �99� and �995 he was a member of the Board of the ACT Electricity and Water
Authority. In �995 he was a member of the Expert Selection Panel for the �995 Special Round of the
Cooperative Research Centres Program (renewable energy technologies).
Peer Reviewers
Acknowledgements
Climate Risk acknowledges the support of the following: Telstra staff especially Cassandra
Scott and Virginia Harrison; Heritage Pacific staff Natalie Philp, Bianca Duncan and Stephen
Harrison; Catholic Education Parramatta: Loddon Mallee Health Alliance. We would also like
to acknowledge the expert advice from Peter Best and Corin Millais and the support from
Ruth Tedder and Nicole Hercus.
iiiTowards a High-Bandwidth, Low-Carbon FutureClimate Risk
The �007 Lowy Institute Poll found that tackling climate change is as important to Australians as
improving standards in education - and more so than improving the delivery of health care, ensuring
economic growth and fighting international terrorism.
This Report is a first attempt at a nationwide quantification of the carbon savings and financial
benefits resulting from using telecommunications networks to conserve energy and increase clean
energy use at home, in the workplace and in ways we connect people, enterprises and communities.
The analysis presented in this report finds that the telecommunications sector is uniquely placed
to provide important services that can yield nationally significant reductions in greenhouse gas
emissions. Indeed a key finding is that many of the telecommunication solutions for living and working
in a future carbon-constrained world can actually lead to cost savings for business and the consumer.
There is scant information in the public domain that quantifies the opportunities presented by
telecommunications to reduce greenhouse gas emissions. This report does.
This report is not the last word on telecommunications and carbon emissions, but one of the first.
We welcome a robust public dialogue around the ideas presented in the report – including critiques
by national and international specialists who may provide more detailed insights and more refined
ideas. Climate Risk, the authors of the report, and Telstra are committed to raising the level of public
discourse and to capture and share learning that can result. This dialogue will, we hope, lead to a
more comprehensive understanding of how we can work together to achieve the benefits of a high
bandwidth, low carbon society.
Time is of the essence as we find innovative solutions to reducing carbon emissions. We are delighted
to offer this study into the marketplace of ideas and we invite you to share your reactions, insights
and ideas with us and with each other through forums, the media and private discussions.
Philip M. Burgess, Ph.D
Group Managing Director
Public Policy & Communications
Foreword
ivTowards a High-Bandwidth, Low-Carbon FutureClimate Risk
Executive Summary vi -xiii
Part 1 1Climate Change - The Challenge 1The Global Consensus 1What is the ‘greenhouse effect’? 1The Complexity of Climate Change 2What Does ‘Avoiding Dangerous Climate Change’ Actually Mean? 5Understanding Emission Cuts 6National Emissions and Per Capita Emissions 7Adaptation and Mitigation 7A Carbon Price 8Emissions Trading 9
Part 2 10The Emissions Signature of Broadband 10Understanding Telecommunications Networks 10The Balance of Network Impacts 16
Part 3 18Identifying Carbon-Opportunities for Telecommunication networks 18Step 1. Identifying Relevant Sectors 18Step 2. Reviewing Current and Emergent Network Technology 19Step 3. Major Carbon-Opportunities for telecommunication providers: Overlaying emission sources with network technologies 20Viability and Implementation 23
Part 4 24Major Carbon-Opportunities for Telecommunication Networks 24Carbon-Opportunity 1: Remote Appliance Power Management 24Carbon-Opportunity 2: Presence-Based Power 27Carbon-Opportunity 3: De-centralised Business District 29Carbon-Opportunity 4: Personalised Public Transport 33Carbon-Opportunity 5: Real-time Freight Management 36Carbon-Opportunity 6: Increased Renewable Energy 38Carbon-Opportunity 7: ‘On-Live’ High Definition Video Conferencing 45
Part 5 48Quantifying the Opportunities 48Remote Appliance Power Management 48Presence-Based Power 49De-centralised Business District 50Personalised Public Transport 51Real-time Freight Management 52
Contents
vTowards a High-Bandwidth, Low-Carbon FutureClimate Risk
Increased Renewable Energy 53‘On-Live’ High Definition Video Conferencing 54Total Impacts of Abatement Opportunities 55Value of Avoided Carbon 56Total Value of the Identified Opportunities 57Attribution 57Regulation 58Timing 58
Part 6 60Conclusions 60Beyond Carbon Neutral 60The Climate Challenge 60Telecommunication’s Significance in Climate Change Mitigation 61
Part 7 64References 64Glossary 68
Appendix 1 73Industry Example: Broadband and Urban Development - Genesis, Coomera
Appendix 2 78Industry Example: Next generation networks, Carbon and Education - Catholic Education Parramatta
Appendix 3 81Industry Example: Telstra - Change Through Leadership
Appendix 4 84Industry Example: The Health Sector, Climate Change and Telecommunication Networks
Appendix 5: 89 Summary of Sectors and Applications Considered with Action
viTowards a High-Bandwidth, Low-Carbon FutureClimate Risk
Executive Summary
This report provides an analysis of the opportunities for Australian society to achieve nationally significant greenhouse gas abatement using telecommunication networks.
The report identifies that the scale and scope of telecommunication network services and users provide a unique opportunity to harness economies of scale to achieve meaningful emission reductions.
Many of the carbon-opportunities identified lead to energy and other cost savings for commercial and residential customers, and in some cases will enable the on-selling of newly created carbon creditsi and electricity management commodities.
The estimated abatement opportunity calculated herein is almost 5% (4.9) of Australia’s total national emissions, making the use of telecommunication networks one of the most significant opportunities to reduce the national carbon footprint.
�.
�.
3.
4.
The estimated energy and travel cost savings are approximately $6.6 billion per year, and value of the carbon credits created may be between $�70 million and $�.� billion subject to the future price of carbon.
Some of these carbon-opportunities can be realised immediately; others are contingent on the roll-out of a national fibre optic network to residential and commercial consumers.
In combination with other measures being implemented by Government, a deployment of the carbon-opportunities in the period �008 to �0�4 would have the additional effect of stabilising national emissions in the period up to �0�4 in keeping with the findings of the IPCC and the Stern Review, as shown in Figure i.
5.
6.
7.
The opportunities outlined in this report result in total greenhouse gas reductions equivalent to approximately 4.9% of Australia’s total national emissions.
i When pollution levels are capped, in some schemes, it may be possible to trade greenhouse gas pollution rights referred to as ‘carbon credits’. Currently NSW has a greenhouse gas emissions trading scheme, the Federal Government has announced plans to introduce a national scheme in �0�� and there are also voluntary abatement markets.
Key Findings
CARBOn-
OPPORTuniTiES
Throughout this document
carbon-opportunities is
used as a short hand for
‘carbon dioxide emission
abatement opportunities’
which include an activity
that provides real and
measurable reductions
in, or avoidance of,
greenhouse gas
emissions. They do not
include the use of offset
mechanism to reduce
emissions.
The scale and scope of the telecommunication sector’s operations unlock the ability to aggregate multiple distributed initiatives to achieve nationally significant emissions savings.
viiTowards a High-Bandwidth, Low-Carbon FutureClimate Risk
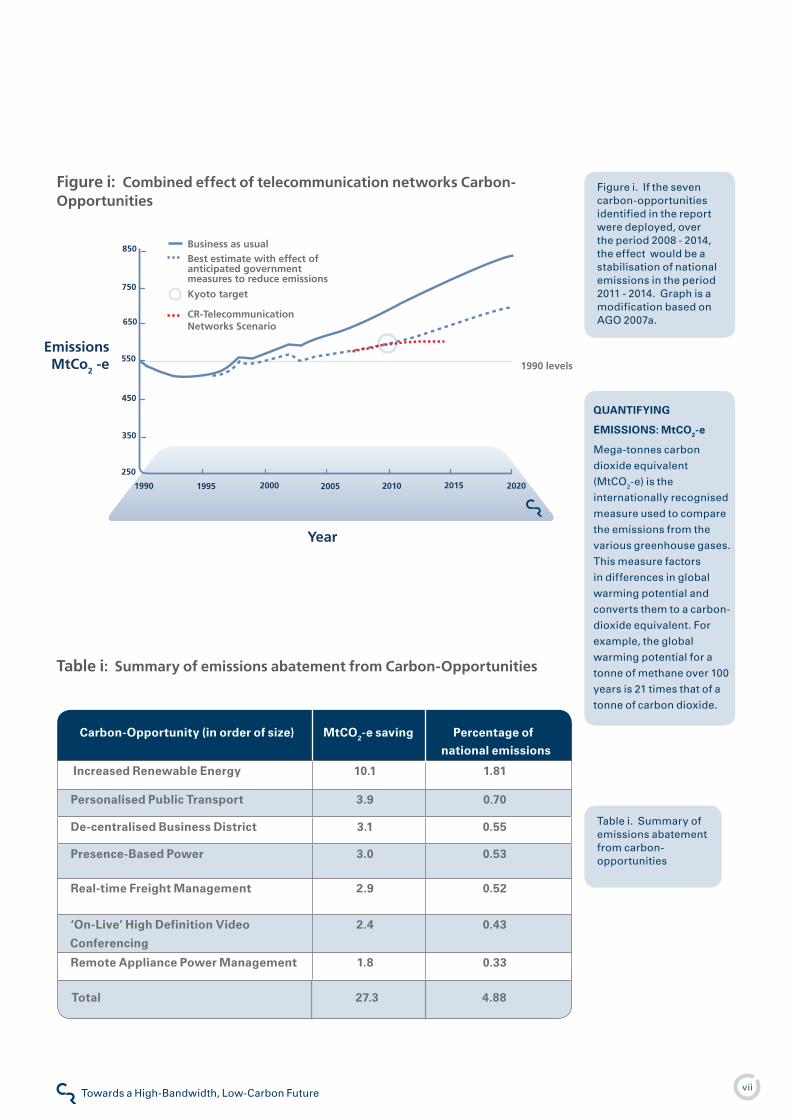
Figure i. If the seven carbon-opportunities identified in the report were deployed, over the period �008 - �0�4, the effect would be a stabilisation of national emissions in the period �0�� - �0�4. Graph is a modification based on AGO �007a.
Figure i: Combined effect of telecommunication networks Carbon- Opportunities
Table i. Summary of emissions abatement from carbon-opportunities
Table i: Summary of emissions abatement from Carbon-Opportunities
Total 27.3 4.88
Carbon-Opportunity (in order of size) MtCO2-e saving Percentage of
national emissions
increased Renewable Energy 10.1 1.81
Personalised Public Transport 3.9 0.70
De-centralised Business District 3.1 0.55
Presence-Based Power 3.0 0.53
Real-time Freight Management 2.9 0.52
‘On-Live’ High Definition Video
Conferencing
2.4 0.43
Remote Appliance Power Management 1.8 0.33
Year
1990 202020152010200520001995
850
250
350
450
550
650
750
EmissionsMtCo2 -e
Business as usualBest estimate with effect of anticipated government measures to reduce emissions
1990 levels
Kyoto target
CR-Telecommunication Networks Scenario
QuAnTiFyinG
EMiSSiOnS: MtCO2-e
Mega-tonnes carbon
dioxide equivalent
(MtCO�-e) is the
internationally recognised
measure used to compare
the emissions from the
various greenhouse gases.
This measure factors
in differences in global
warming potential and
converts them to a carbon-
dioxide equivalent. For
example, the global
warming potential for a
tonne of methane over �00
years is �� times that of a
tonne of carbon dioxide.
viiiTowards a High-Bandwidth, Low-Carbon FutureClimate Risk
Beyond Carbon Neutral
This report goes significantly beyond ‘holding the line’ goals of corporate carbon neutrality and carbon. Instead it sets out a suite of opportunities that would allow telecommunications providers to play a leadership role in decarbonising the Australian economy and equipping the nation to prosper in a carbon constrained future. All of the strategies and opportunities are based on avoiding the release of fossil carbon into the atmosphere; they are not based on off-setting emissions.
Seven options are proposed to build on existing and next-generation networks. The realisation of opportunities outlined in this report would result in telecommunications providers assisting Australian businesses and households achieving total greenhouse gas reductions equivalent to approximately 4.9% of Australia’s total national emissions. Some of the opportunities identified in the consumer space can be achieved using existing network services and others are contingent on the roll-out of fibre to the node (FTTN) broadband infrastructure. Overall the initiatives identified in this report present the opportunity for one of the single largest reductions in Australia’s carbon footprint by an Australian corporation.
Companies seeking to maximise their carbon emission reduction could leverage the existing and next-generation networks already built by Telstra.
The Climate Challenge
The latest statement from the Intergovernmental Panel on Climate Change (IPCC �007) indicates the next ten years are critical in meeting the challenges posed by climate change. For the first time, scientists and governments are now agreed that global emissions must be stabilised by �0�5 if climate change is to be effectively addressed. Similarly the global economic Stern Review concluded that “to stabilise at 450ppmii CO�-e, without overshooting, global emissions would need to peak in the next �0 years“ (Stern �006, p. �93). Reducing greenhouse emissions requires major commitments from both the public and private sectors as well as the government.
In �005 Australia’s net annual emissions totalled 559 mega-tonnes of CO� equivalent (MtCO�-e) from all activities, which equates to �.4% of the global total. In the short term, it appears that Australia will stay close to its Kyoto Protocol target of no more than an 8% increase above �990 emission levels (AGO �007b). However, the underlying trend is that Australian emissions will increase at about �.3% per year.
The use of fossil-fuels in stationary-energyiii and transport applications is the nation’s major source of emissions. The trend is not declining or stabilising, but continuing to grow significantly. If deep cuts in emissions are to be achieved, emissions from the energy sector are Australia’s greatest greenhouse challenge.
THE KyOTO PROTOCOL
AnD AuSTRALiA’S
TARGET
The Kyoto Protocol is
an agreement made
under the United Nations
Framework Convention
on Climate Change
(UNFCCC). The main
objective of the protocol
is the “stabilization
of greenhouse gas
concentrations in the
atmosphere at a level
that would prevent
dangerous anthropogenic
interference with the
climate system.” The first
commitment period of the
Kyoto Protocol requires
industrial nations to reduce
greenhouse gas emissions
by at least 5 per cent
below �990 levels by �0��.
Australia received a �08%
target above �990 levels.
GREEnHOuSE GASES
(GHG)
Greenhouse gases
are those gaseous
constituents of the
atmosphere, both natural
and anthropogenic (man
made), that contribute
to increasing the global
mean temperature of the
earth. Greenhouse gases
including water vapour
(H�O), carbon dioxide
(CO�), nitrous oxide (N�O),
methane (CH4), and ozone
(O3) are the primary
greenhouse gases in the
Earth’s atmosphere. There
are a number of entirely
human-made greenhouse
gases in the atmosphere,
such as the halocarbons
and other chlorine- and
bromine-containing
substances. ii Associated with a 50% chance of exceeding �oC warming above pre-industrial levels.
iii Stationary energy includes emissions from electricity generation, the use of fuels in manufacturing, construction and commercial sectors, and residential heating. It excludes transport fuels.
ixTowards a High-Bandwidth, Low-Carbon FutureClimate Risk
Telecommunication’s Significance in Climate Change Mitigation
Telecommunication operators are a major conduit for new technology and infrastructure. Australia has the only national wireless broadband network in the world.
The scale and scope of the telecommunication sector’s operations unlock the ability to aggregate multiple distributed initiatives to achieve nationally significant emissions savings. The anticipated greenhouse emission constraints coincide with the government’s plans for next-generation networks, which provides synergies for new emission reduction opportunities.
This report identifies seven carbon-opportunities appropriate for Australian businesses and households, which have the potential for viable carbon abatement using existing and next-generation networks. These carbon-opportunities have relevance for energy consumption in buildings, road transport, renewable energy production and aviation.
Buildings
Today electricity consumption in homes and the workplace accounts for one fifth of total national emissions (ABS �007, AGO �007b); in both locations there are two significant sources of energy wastage. Firstly, standby power, in which numerous appliances that appear to be ‘off’ are still consuming energy, typically this accounts for over ��% of electricity use in an average home.
Secondly, devices and appliances which are on, but not being unused, may also waste large amounts of electricity (estimated herein as �5%), we refer to this as ‘orphaned’ energy. We have identified two relevant commercial opportunities:
Carbon-Opportunity: Remote Appliance Power Management
Broadband can provide both the monitoring and control of electrical networks down to the electric switch box or even plug socket and in addition facilitate analysis and management elsewhere on the network. Standby switching can be centralised to allow electricity to be halted to devices on standby, such as a phone that has finished charging, a TV that has not been used for an hour, or a hot water system which is on, even though no one is in the house. While this is not appropriate for all devices, it is applicable to many.
Annual Saving: The estimated emissions saving of Remote Appliance Power Managementiv is �.8 MtCO�-e, or 0.33% of total national emissions. The financial value of the avoided electricity spending is $�70 million and the value of the carbon credits would be in the range of $�8 million to $9� million.
Carbon-Opportunity: Presence-Based Power
It is very common for any energy consuming devices to be left on even though the user may not be present.
nATiOnAL EMiSSiOnS
AnD PER CAPiTA
EMiSSiOnS
Greenhouse gas
emissions vary
considerably, especially
between developed
countries and developing
countries, both at a
national level and per
person. Australia has the
highest emissions per
capita of any developed
country (OECD) with the
equivalent emissions
of �6 tonnes per person
carbon dioxide per year.
China is one of the worlds
biggest greenhouse
gas polluters, but this
is largely due the high
population. On a per
capita basis a Chinese
person is responsible for
about �.5 tonnes per year.
iv Assumes broadband-based Remote Appliance Power Management solutions are used to reduce standby emissions by 50% in �/3 of Australian homes and commercial buildings.
With Presence-Based Power the supply of energy follows the person, not the appliance.
The underlying trend is that Australian emissions are forecast to increase at about 1.3% per year.
xTowards a High-Bandwidth, Low-Carbon FutureClimate Risk
However, the supply of energy can be made dependent on the presence of a person. For example, most office meeting rooms remain air-conditioned while no one is using them and computers stay on when the person is at lunch. Significant reductions in energy consumption can be achieved if devices are deactivated when people walk away, and turned back on when the person returns. This ‘Presence-Based Power’ can use a person’s mobile phone or company identification tag to register their presence meaning the supply of energy is linked to the presence of the person, not just the appliance.
Annual Saving: The estimated emissions saving of Presence-Based Powerv is 3.0 MtCO�-e, or 0.53% of total national emissions. The financial value of the avoided electricity spending is $�70 million and the value of the carbon credits would be in the range $�9 million to $�50 million.
Transport
Today road transport produces nearly 70 MtCO�–e of emissions per year, around �4% of total national emissionsvi. Three quarters of Australians drive to work; of these only 4% share a car (ABS �005). Though significant attention has focused on making traffic flows more efficient, this often only increases traffic volumes. Meaningful emissions abatement requires the provision of more compelling alternatives to car use.
Major emissions also result from the movement of freight totalling about 5%
of national emissions. Overall, freight vehicles are empty for �8% of the kilometres travelled (ABS �005).
For all of these emissions we have identified three commercially-viable opportunities:
Carbon-Opportunity: De-centralised Business District
Broadband-enabled homes, suburbs and regional centres can either remove or significantly reduce the emissions generated by people travelling to and from work. At one end of the spectrum, people would be working from home one day a week or more; at the other end, people would be working in suburban or regional centres where minor commuting is involved. In the latter case, people would continue to enjoy employment in a national or international company with no career disadvantage. A hybrid is the telework business centre, open to staff from many different businesses and placed in locations close to where people live but able to offer all of the amenities of a large office.
Annual Saving: The estimated emissions saving of De-centralised Business Districtsvii, from reduced travel emissions only, is 3.� MtCO�-e or 0.55% of total national emissions. The financial value of the avoided fuel spending is $�.� billion and the value of the carbon credits would be in the range $30 million to $�50 million.
THE VALuE OF CARBOn
Greenhouse gas
emissions trading will be
operational in Australia
by �0��. This will create
a cost for the right to emit
greenhouse gas pollution.
Reciprocally it will create
a value for greenhouse
gas abatement. The
value of greenhouse
gas abatement will
depend on the cuts in
emissions specified by
the government and will
be set by the market. In
this report we use a range
of possible carbon prices
from $�0 to $50 per tonne
of carbon dioxide based on
analysis by the CSIRO and
ABARE.
vii Assumes that De-Centralised Workplaces are used by �0% of employees who have telework suitable jobs, and their commuting emissions are reduced by at least 50%.
v Assumes network enabled Presence-Based Power solutions are used to reduce ‘orphaned’ energy emissions by 50% in �/3 of Australian homes and commercial buildings.
vi Much of this is caused by the sheer size of the nation. Other continentalised nations, such as the US and Canada, also have comparatively high transport-linked emissions. This may also affect vehicle type and choice.
xiTowards a High-Bandwidth, Low-Carbon FutureClimate Risk
Carbon-Opportunity: Personalised Public Transport
Wireless-broadband can facilitate public transport on demand. Personalised Public Transport allows the user to order public transport provided by an integrated network of multi-occupant taxis, minibuses, buses and trains, which starts at the front door. The personal efficiency of Personalised Public Transport can exceed that of using the private car, with faster speeds door-to-door, greater flexibility and lower costs. Further, Personalised Public Transport can greatly increase the catchment of other public transport options, such as bus and rail, resulting in significant opportunities for greenhouse gas abatement.
Annual Saving: The estimated emissions saving through Personalised Public Transportviii is 3.9 MtCO�-e per annum, or 0.7% of total national emissions. The financial value of the avoided fuel spending is $�.6 billion and the value of the carbon credits would be in the range $39 million to $�00 million.
Carbon-Opportunity: Real-time Freight Management
Wireless-broadband allows freight and freight vehicles to be monitored in real time. Consolidating this information allows more freight to be assigned to unladen, or underladen, vehicles. Real-time Freight Management creates an integrated clearing house for multiple suppliers of freight services.
Annual Saving: The estimated emissions saving of Real-time Freight Managementix is �.9 MtCO�-e per annum,
or 0.5�% of total national emissions. The financial value of the avoided fuel spending is $�.� billion and the value of the carbon credits would be in the range $�9 million to $�50 million.
Renewable Energy
Today Australia’s energy supply is dominated by fossil fuels. However deep cuts in Australian emissions will require a transition to low and zero emission sources of power supply. Despite being plentiful, low-cost renewable energy sources like wind power are hampered by the variability of the supply; this has in part prompted restriction of new wind farm development in South Australia and has been used in the advocacy of higher-cost nuclear generation. The report identifies a means by which next- generation networks can dismantle such barriers to renewable energy uptake.
Carbon-Opportunity: increased Renewable Energy
Australia’s extensive broadband networks allow a link to be made between renewable energy supplies and active load management of heating, cooling and other appliances in buildings and homes across Australia. This can be used to create ‘virtual’ energy storage to effectively neutralise aspects of short-term variability, turning such renewables into ‘stable and predictable generation’. This in turn would enable renewables to contribute an increased component of the electricity supply.
REnEWABLE EnERGy
COnSTRAinTS
Europe, US states and
developing countries
like India and China have
established very high
targets for renewable
energy. The Australian
government has recently
announced a target for
about 30,000 gigawatt
hours of electricity
per year to come from
renewables. Some of the
most successful renewable
energy sources, like wind
power, produce constantly
varying amounts of
energy. Properly
managing this variation
can limit the amount of
renewable energy which
can be installed in certain
locations or increase the
value of such energy.
ix Assumes that Real-time Freight Management effectively avoids �5% of unladen truck kilometres.
viii Assumes that wireless broadband-facilitated Personalised Public Transport is able to capture �0% of car-based commuters and assumes that the relative emission intensity of public transport is 90% lower than personal car travel in the urban environment.
The report identifies a means by which next generation networks can dismantle barriers to renewable energy uptake.
xiiTowards a High-Bandwidth, Low-Carbon FutureClimate Risk
Annual Saving: The emissions abatement from using Increased Renewable Energyx is at least �0.� MtCO�-e or �.8% of total national emissions, though this could be considerably higher. The financial value of the avoided fuel spending is $86 million and the value of the carbon credits would be in the range $�00 million to $300 million.
Aviation
Aviation emissions are amongst the fastest growing in the energy sector. Domestic aviation alone produces 5.� million tonnes of CO� per year and international aviation using fuels procured in Australia give rise to approximately twice these emissions. Yet because aviation emissions occur at altitude the warming effect is as much as �.7 times higher. Based on international studies about 50% of short haul air travel may be for business (Mason �000).
Carbon-Opportunity: ‘On-Live’ High Definition Video Conferencing
Long-distance, short-duration travel can be effectively replaced with ‘in-person’ high-definition, high fidelity, online conferencing that is significantly more efficient in cost, time, energy and emissions.
Annual Saving: The emissions saving of ‘On-Live’ High Definition Video Conferencingxi services in avoided domestic and international air travel is �.4 MtCO�-e per annum through direct fuel use reduction (equivalent
to 6.5MtCO�-e per annum when the increased warming effect of aviation emissions at altitude or ‘up-lift’ is included). Excluding up-lift, the avoided emissions are equivalent to 0.43% of total national emissions.
The financial value of the avoided spending on air travel is $�.� billion and the value of the carbon credits are in the range $�4 million to $��0 million.
Real World and Industry Examples
For each of the carbon-opportunities identified above, the report provides international examples of current applications of the required technology or systems.
To illustrate the opportunities and barriers in achieving the carbon cuts from the use of Telstra’s existing and next-generation networks, four industry perspectives have been presented:
Housing: The Genesis residential housing development in South East Queensland
Education: Catholic Education Parramatta which administers ��7 schools
Business: Telstra which has approximately 36,000 full-time equivalent employees in Australia
Health: Information Communications Technology (ICT) networks in regional and rural health services
�.
�.
3.
4.
Because aviation emissions occur at altitude the warming effect is approximately 2.7 times higher.
x Assumes that one-third of homes and commercial buildings are broadband enabled and that they have agreed to have their discretionary (non-time-sensitive) loads managed by Telstra. Assumes that on average, �5% of the total loads across residential and commercial buildings are discretionary at any one time.
xi Assumes �/3 of business air travel can be replaced by ‘On-Live’ meetings using high speed, high definition video links.
Each of the industry
examples demonstrate
that there have already
been carbon emission
savings through the use
of ICT networks. In many
cases this has been a side
effect of reducing costs or
improving productivity.
These examples show
considerable scope
to apply the carbon-
opportunities identified
in this report to create
much deeper emission
abatement in these sectors
and also to unlock costs
savings in energy, fuel and
infrastructure.
xiiiTowards a High-Bandwidth, Low-Carbon FutureClimate Risk
0.0
2.5
2.0
1.5
1.0
0.5
Pres
ence
-Bas
ed
Pow
er
Remote
Applia
nce
Pow
er M
anag
emen
t
De-ce
ntralis
ed
Busines
s Dist
rict
‘On-Li
ve’ H
igh D
efiniti
on
Video
Confe
rencin
g
Incre
ased
Ren
ewab
le
Ener
gy
Real-t
ime F
reig
ht
Man
agem
ent
Perso
nalise
d Public
Tran
sport
Saving/Value
Carbon@ $20 tCO2-e
Billions dollars$A per year
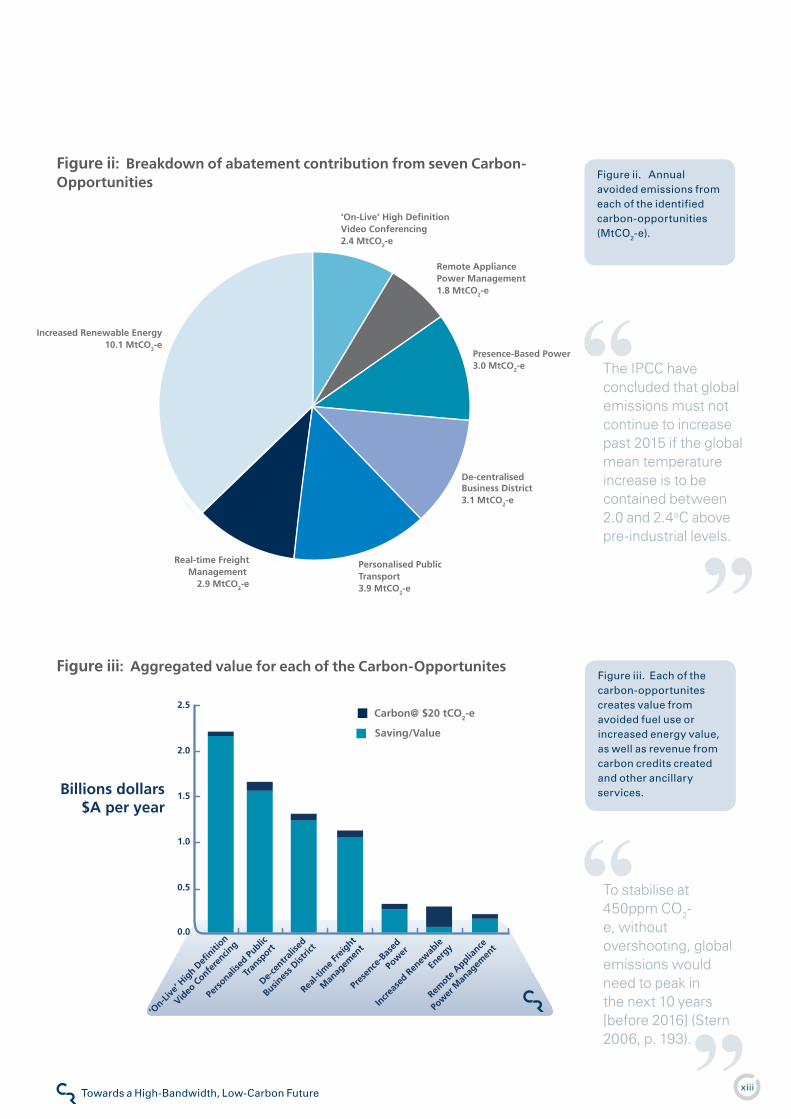
Figure iii. Each of the carbon-opportunites creates value from avoided fuel use or increased energy value, as well as revenue from carbon credits created and other ancillary services.
Figure iii: Aggregated value for each of the Carbon-Opportunites
Figure ii. Annual avoided emissions from each of the identified carbon-opportunities (MtCO�-e).
Remote Appliance Power Management 1.8 MtCO2-e
Presence-Based Power 3.0 MtCO2-e
De-centralisedBusiness District3.1 MtCO2-e
Personalised Public Transport 3.9 MtCO2-e
Real-time Freight Management
2.9 MtCO2-e
Increased Renewable Energy10.1 MtCO2-e
‘On-Live’ High DefinitionVideo Conferencing2.4 MtCO2-e
Figure ii: Breakdown of abatement contribution from seven Carbon-Opportunities
To stabilise at 450ppm CO2-e, without overshooting, global emissions would need to peak in the next 10 years [before 2016] (Stern 2006, p. 193).
The IPCC have concluded that global emissions must not continue to increase past 2015 if the global mean temperature increase is to be contained between 2.0 and 2.4oC above pre-industrial levels.
�Towards a High-Bandwidth, Low-Carbon FutureClimate Risk
Part 1
Global warming could shrink the global economy by 20%, but taking action now would cost just 1% of global gross domestic product - Stern 2006
Climate Change - The Challenge
In this chapter we explore the basic rationale for a low carbon society. We present an overview of climate change science and mitigation strategies.
The Global Consensus
In this report we assume that Australia, along with most other countries, is starting down a path toward a carbon constrained future.
This starting assumption is founded on the science behind climate change, the rapid evolution of public opinion around the world and the actions and commitments occurring in the political domain. There is now a global consensus that climate change is a challenge that will have to be addressed forthwith.
This consensus extends to the business community which is increasingly recognising the risks posed by climate change and seeking the opportunities created by a carbon constrained society.
Any solution to climate change will require international agreement, which has not yet been achieved. In any international agreement Australia will likely be a target taker, rather than a target setter. Unlike the USA, the EU, China, India or Brazil, as one of the world’s smaller emitters Australia is unlikely to play a central role in the architecture and targets established in future international agreements. However, as one of the world’s highest per capita emitters, Australia is highly vulnerable to international
binding targets that may lead toward a convergence in per capita emissions. For example, Australia’s per person emissions are approximately �0 times that of the average Chinese citizen and the highest in the developed world.
Nevertheless, the societal pressure for unilateral actions in many countries means that measures to reduce emissions are gathering pace on almost every continent, and Australia is no different. There is now bi-partisan political support for greenhouse gas emissions trading, energy efficiency standards and the expansion of renewable energy. All of these present opportunities for the telecommunications sector as we shall explore in this report.
What is the ‘greenhouse effect’?
The atmosphere is semi-transparent to solar energy, allowing some sunlight to reach and warm the Earth’s surface, absorbing the rest as infrared radiation, and emitting it back to Earth or out into space. This radiation budget is adjusted as the concentration of greenhouse gases change in the atmosphere.
This natural ‘greenhouse effect’ keeps the average surface temperature on Earth at a comfortable �4°C. To get a sense of its importance, our nearest neighbour, the Moon has an average temperature 3�°C lower than Earth. Although the Moon is about the same distance from the Sun as Earth, it does not have an atmosphere, and no natural ‘greenhouse effect’ to keep it warm.
The scientific convention
is for global warming
levels to be expressed
relative to pre-industrial
levels, nominally set
as �850. Temperature
increases are different
across the globe, lowest
at the equator and
highest at the poles,
consequently the
scientific convention is
to refer to global average
temperature increases.
Unless otherwise stated
these conventions are
adhered to in this report.
�Towards a High-Bandwidth, Low-Carbon FutureClimate Risk
The composition of our atmosphere is crucial for trapping heat to the levels which Earth’s ecosystems and human civilisations are now adapted. The atmospheric composition is 78% nitrogen, ��% oxygen, 0.93% argon as well as some other trace gases. One of these trace gases is carbon dioxide, comprising 0.04%.
Almost all (99%) of air is made up of simple double molecules – oxygen (O�) and nitrogen (N�) – which neither emit nor absorb infrared radiation. Molecules with more than two atoms of different elements - like water vapour (H�O), carbon dioxide (CO�), or methane (CH4) – can trap heat by emitting more infrared radiation back to Earth (Figure �). These are known as the greenhouse gases.
While carbon is a trace element in the air, vast amounts are cycled between the Earth and the atmosphere by geological and biological processes, and transferred by plant growth into the oceans, soils, and forests. Millions of years in favourable geological conditions have turned decaying plant matter into the carbon-rich fossil fuels we know as oil, coal and gas.
Burning fossil fuels releases carbon dioxide back into the atmosphere. Here the carbon dioxide acts as a particularly effective heat radiator because of its molecular structure. The amounts in the atmosphere are so small they are measured in parts per million (ppm), but a slight change in CO� concentration makes a large difference to the heat balance. The increased CO� adds to the natural greenhouse effect of the Earth – and causes the human induced global
warming or ‘enhanced greenhouse effect’ we now have to address. In essence the CO� that was taken out of the atmosphere by plants over hundreds of millions of years is now being released back into the atmosphere in a matter of decades.
The Complexity of Climate Change
The United Nations sums up climate change science as follows:
“The average temperature of the Earth has been increasing more than natural climatic cycles would explain. This episode of “global warming” is due to human activity. It began with the industrial revolution, two centuries ago, and accelerated over the last 50 years. Fossil fuel burning is mostly responsible, because it releases gases (particularly carbon dioxide) that trap infrared radiation. This “greenhouse effect” creates a whole system disturbance, that we call climate change”. (UNEP �005)
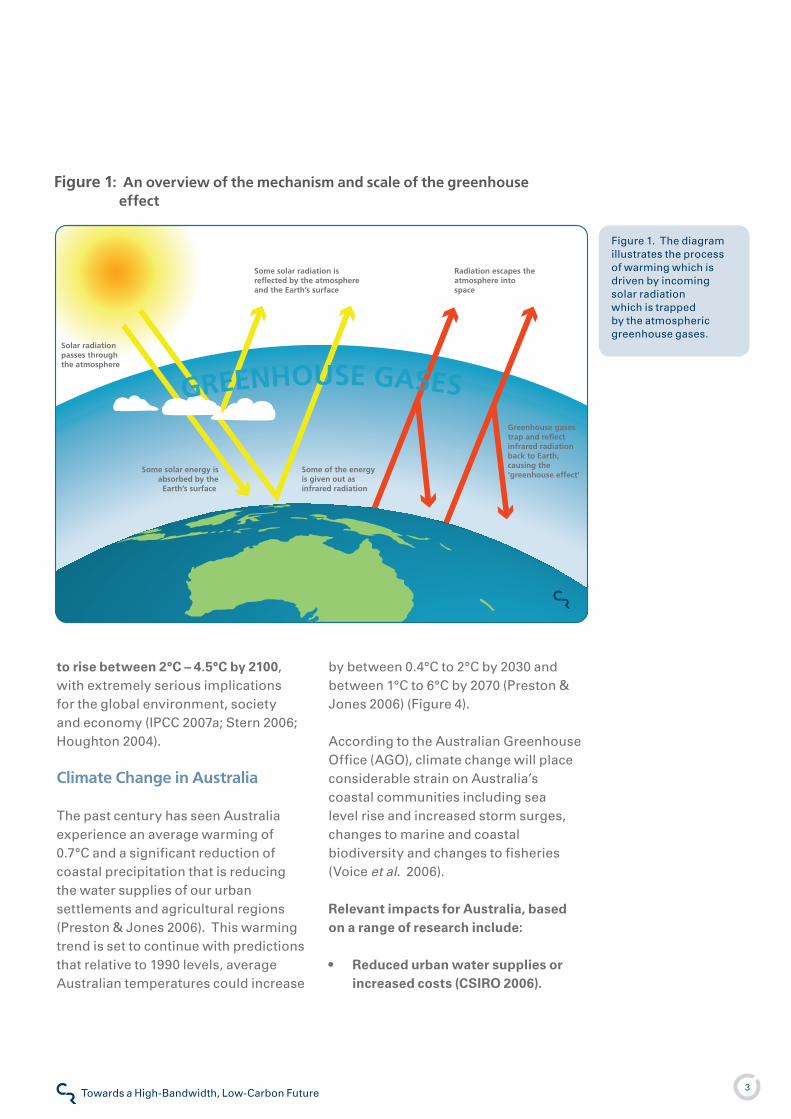
The climate change process and risks are part of a complex interaction with human activities and the physical dynamics that define the global climate itself. The complexity of these interactions is explained in Figure �.
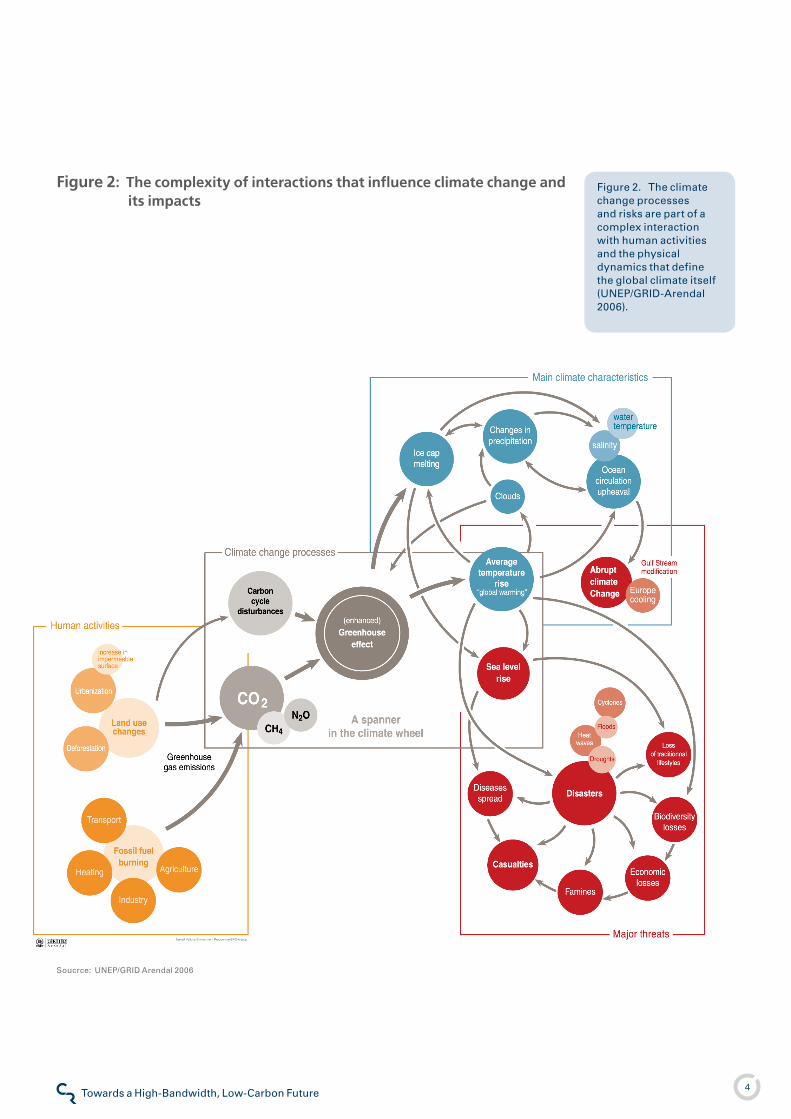
Over the past century, average global temperatures have increased by approximately 0.74°C (Figure 3) and scientific evidence suggests this will continue (IPCC WGI �007).
If, as predicted by current IPCC projection models, there is a doubling of atmospheric carbon dioxide, the average global temperature is expected
In essence, the CO2 that was taken out of the atmosphere by plants over hundreds of millions of years is now being released back into the atmosphere in a matter of decades.
3Towards a High-Bandwidth, Low-Carbon FutureClimate Risk
to rise between 2°C – 4.5°C by 2100, with extremely serious implications for the global environment, society and economy (IPCC �007a; Stern �006; Houghton �004).
Climate Change in Australia
The past century has seen Australia experience an average warming of 0.7°C and a significant reduction of coastal precipitation that is reducing the water supplies of our urban settlements and agricultural regions (Preston & Jones �006). This warming trend is set to continue with predictions that relative to �990 levels, average Australian temperatures could increase
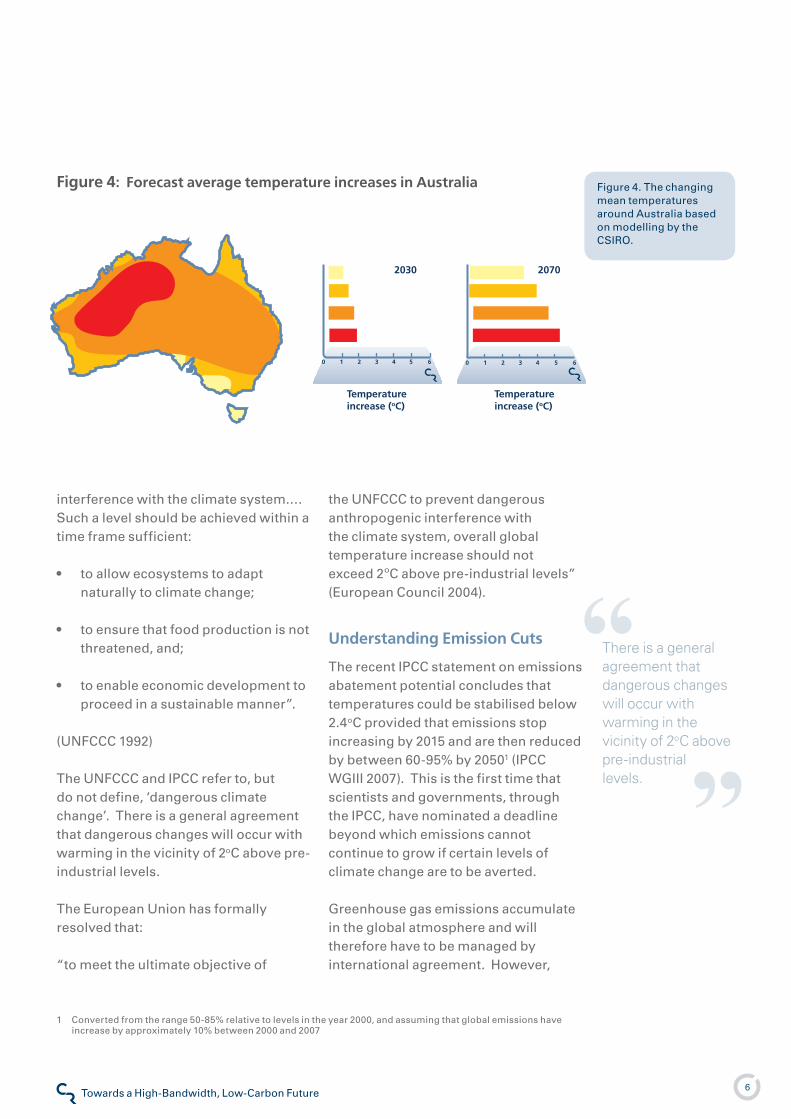
by between 0.4°C to �°C by �030 and between �°C to 6°C by �070 (Preston & Jones �006) (Figure 4).
According to the Australian Greenhouse Office (AGO), climate change will place considerable strain on Australia’s coastal communities including sea level rise and increased storm surges, changes to marine and coastal biodiversity and changes to fisheries (Voice et al. �006).
Relevant impacts for Australia, based on a range of research include:
Reduced urban water supplies or increased costs (CSiRO 2006).
•
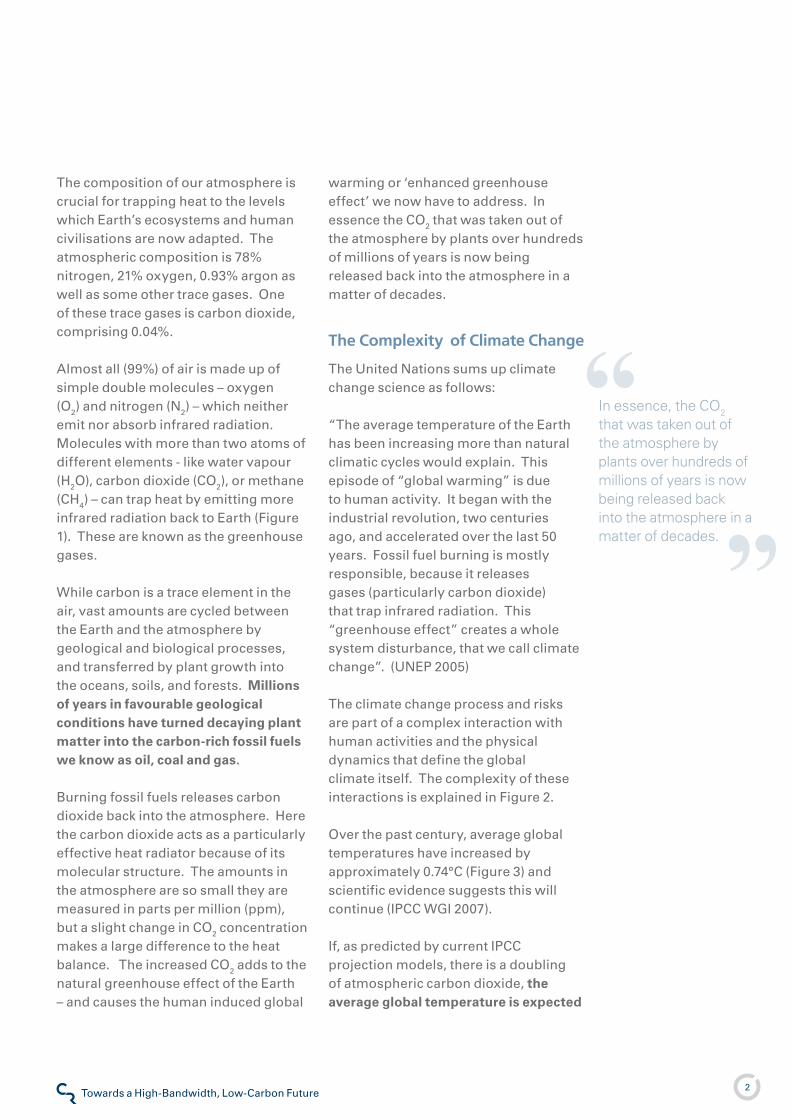
Figure �. The diagram illustrates the process of warming which is driven by incoming solar radiation which is trapped by the atmospheric greenhouse gases.
Figure 1: An overview of the mechanism and scale of the greenhouse effect
Solar radiation passes through the atmosphere
Some solar radiation is reflected by the atmosphere and the Earth’s surface
Some solar energy is absorbed by the
Earth’s surface
Some of the energy is given out as infrared radiation
Greenhouse gases trap and reflect infrared radiation back to Earth, causing the ‘greenhouse effect’
Radiation escapes the atmosphere into space
GREENHOUSE GASES
4Towards a High-Bandwidth, Low-Carbon FutureClimate Risk
Figure �. The climate change processes and risks are part of a complex interaction with human activities and the physical dynamics that define the global climate itself (UNEP/GRID-Arendal �006).
Soucrce: UNEP/GRID Arendal �006
Figure 2: The complexity of interactions that influence climate change and its impacts
5Towards a High-Bandwidth, Low-Carbon FutureClimate Risk
1860 1880 1900 1920 1940 1960 1980 2000
0.6
- 0.6
- 0.4
- 0.2
0.0
0.2
0.4
Year
Temperature anomaly (oC)
Figure 3. There is a discernable increase in global temperatures since �900 as the black line with multi-year smoothing shows (Brohan et al. �006).
Figure 3: The changing global average temperatures since 1850
Rural and agricultural community economic dislocation (nelson 2006).
increase in extreme weather events (CSiRO 2006).
Sea level rise and storm surge impacts on coastal settlements (Church 2006).
A southerly movement of mosquito-borne diseases including Ross River Fever (Lyth 2006).
Disruption of food security (Preston 2006).
Loss of biodiversity including extinction of endemic species (Williams 2005).
Reduced ecosystem services including water quality and availability; and decreased natural pollination of crops (Houghton 2004; Pittock 2005; Flannery 2005).
•
•
•
•
•
•
•
Destabilisation and regional conflict in the Pacific including mobilisation of environmental refugees (Edwards 1999).
What Does ‘Avoiding Dangerous Climate Change’ Actually Mean?
The latest IPCC report suggests that atmospheric CO� concentration alone (i.e. not including other gases) has increased from pre-industrial levels of �80 parts per million (ppm) to 380 ppm in �005, which “exceeds by far the natural range over the last 650,000 years (�80 to 300 ppm) as determined from ice cores.” (IPCC WGI SPM �007).
The term ‘dangerous’ climate change was introduced in the �99� United Nations Convention on Climate Change (UNFCCC), from which the Kyoto Protocol was born. It calls for stabilisation of greenhouse gases to:
“prevent dangerous anthropogenic
•
6Towards a High-Bandwidth, Low-Carbon FutureClimate Risk
interference with the climate system.…Such a level should be achieved within a time frame sufficient:
to allow ecosystems to adapt naturally to climate change;
to ensure that food production is not threatened, and;
to enable economic development to proceed in a sustainable manner”.
(UNFCCC �99�)
The UNFCCC and IPCC refer to, but do not define, ‘dangerous climate change’. There is a general agreement that dangerous changes will occur with warming in the vicinity of �oC above pre-industrial levels.
The European Union has formally resolved that:
“to meet the ultimate objective of
•
•
•
the UNFCCC to prevent dangerous anthropogenic interference with the climate system, overall global temperature increase should not exceed �ºC above pre-industrial levels” (European Council �004).
Understanding Emission Cuts
The recent IPCC statement on emissions abatement potential concludes that temperatures could be stabilised below �.4oC provided that emissions stop increasing by �0�5 and are then reduced by between 60-95% by �050� (IPCC WGIII �007). This is the first time that scientists and governments, through the IPCC, have nominated a deadline beyond which emissions cannot continue to grow if certain levels of climate change are to be averted.
Greenhouse gas emissions accumulate in the global atmosphere and will therefore have to be managed by international agreement. However,
Figure 4. The changing mean temperatures around Australia based on modelling by the CSIRO.
31 4 60 2 5
Temperature increase (oC)
31 4 60 2 5
Temperature increase (oC)
2030 2070
Figure 4: Forecast average temperature increases in Australia
� Converted from the range 50-85% relative to levels in the year �000, and assuming that global emissions have increase by approximately �0% between �000 and �007
There is a general agreement that dangerous changes will occur with warming in the vicinity of 2oC above pre-industrial levels.
7Towards a High-Bandwidth, Low-Carbon FutureClimate Risk
emissions cuts will have to be implemented at a national level.
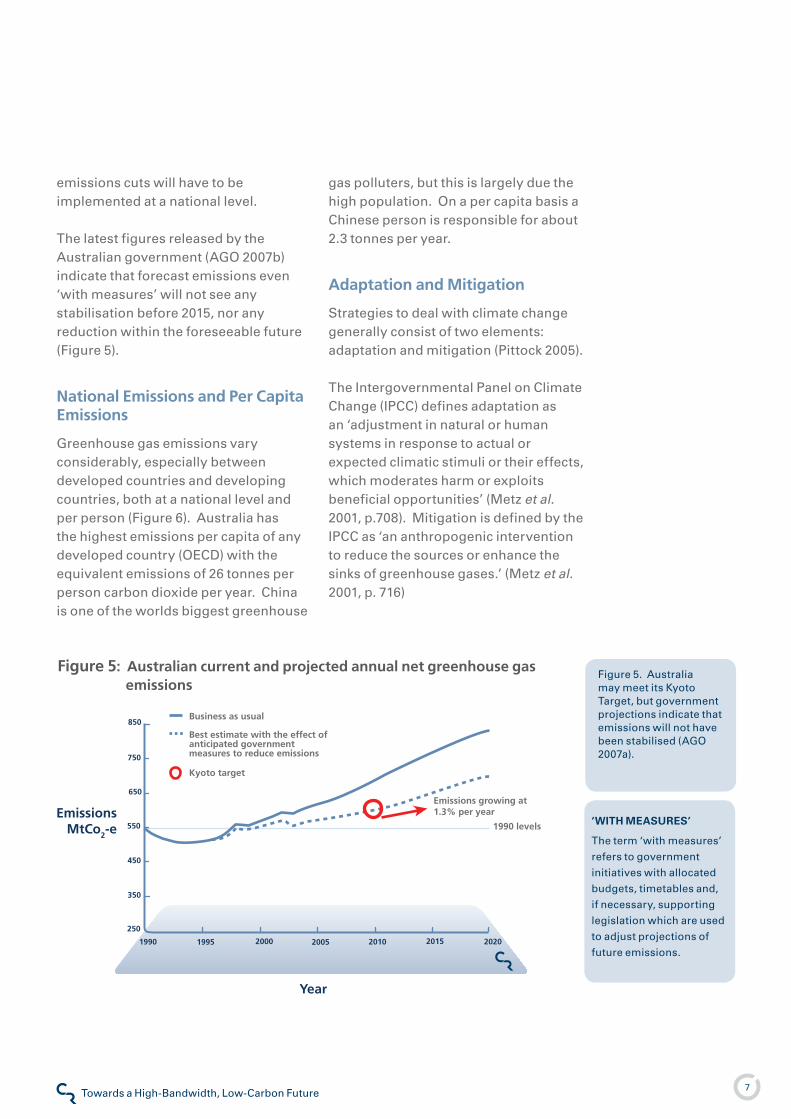
The latest figures released by the Australian government (AGO �007b) indicate that forecast emissions even ‘with measures’ will not see any stabilisation before �0�5, nor any reduction within the foreseeable future (Figure 5).
National Emissions and Per Capita Emissions
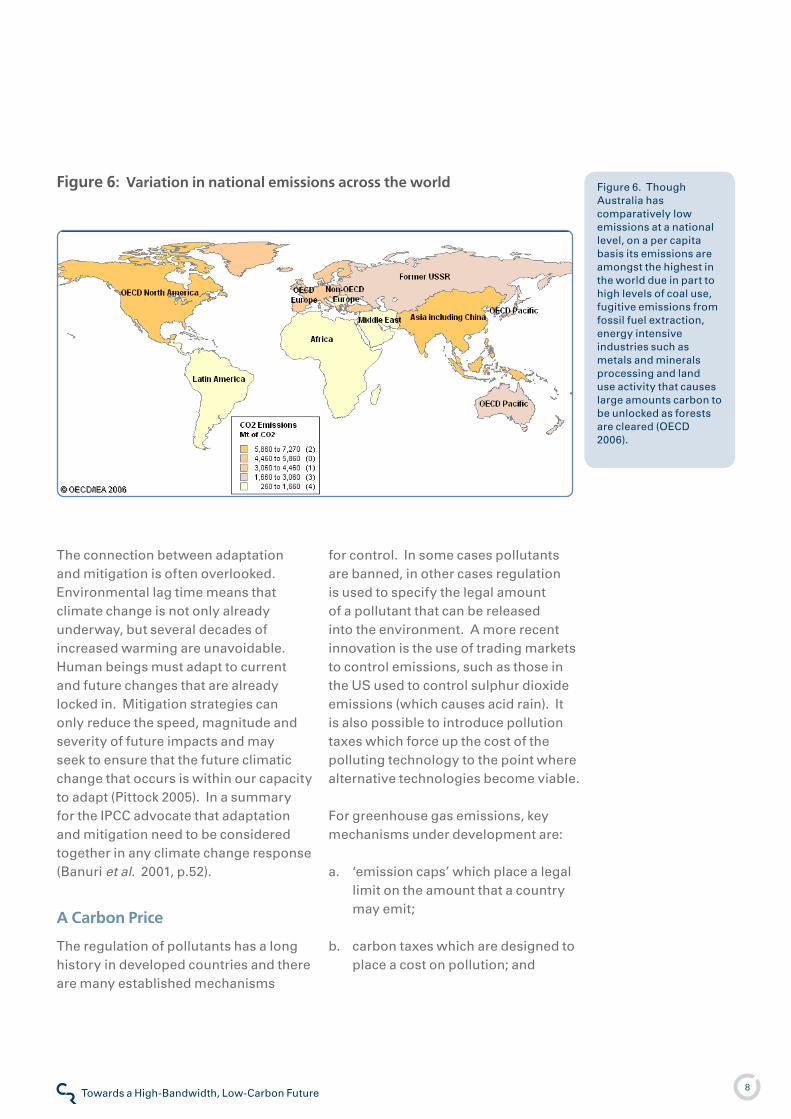
Greenhouse gas emissions vary considerably, especially between developed countries and developing countries, both at a national level and per person (Figure 6). Australia has the highest emissions per capita of any developed country (OECD) with the equivalent emissions of �6 tonnes per person carbon dioxide per year. China is one of the worlds biggest greenhouse
gas polluters, but this is largely due the high population. On a per capita basis a Chinese person is responsible for about �.3 tonnes per year.
Adaptation and Mitigation
Strategies to deal with climate change generally consist of two elements: adaptation and mitigation (Pittock �005).
The Intergovernmental Panel on Climate Change (IPCC) defines adaptation as an ‘adjustment in natural or human systems in response to actual or expected climatic stimuli or their effects, which moderates harm or exploits beneficial opportunities’ (Metz et al. �00�, p.708). Mitigation is defined by the IPCC as ‘an anthropogenic intervention to reduce the sources or enhance the sinks of greenhouse gases.’ (Metz et al. �00�, p. 7�6)
Figure 5. Australia may meet its Kyoto Target, but government projections indicate that emissions will not have been stabilised (AGO �007a).
Year
1990 202020152010200520001995
850
250
350
450
550
650
750
EmissionsMtCo2-e
Business as usual
Kyoto target
1990 levels
Best estimate with the effect of anticipated government measures to reduce emissions
Emissions growing at 1.3% per year
Figure 5: Australian current and projected annual net greenhouse gas emissions
‘WiTH MEASuRES’
The term ‘with measures’
refers to government
initiatives with allocated
budgets, timetables and,
if necessary, supporting
legislation which are used
to adjust projections of
future emissions.
8Towards a High-Bandwidth, Low-Carbon FutureClimate Risk
The connection between adaptation and mitigation is often overlooked. Environmental lag time means that climate change is not only already underway, but several decades of increased warming are unavoidable. Human beings must adapt to current and future changes that are already locked in. Mitigation strategies can only reduce the speed, magnitude and severity of future impacts and may seek to ensure that the future climatic change that occurs is within our capacity to adapt (Pittock �005). In a summary for the IPCC advocate that adaptation and mitigation need to be considered together in any climate change response (Banuri et al. �00�, p.5�).
A Carbon Price
The regulation of pollutants has a long history in developed countries and there are many established mechanisms
for control. In some cases pollutants are banned, in other cases regulation is used to specify the legal amount of a pollutant that can be released into the environment. A more recent innovation is the use of trading markets to control emissions, such as those in the US used to control sulphur dioxide emissions (which causes acid rain). It is also possible to introduce pollution taxes which force up the cost of the polluting technology to the point where alternative technologies become viable.
For greenhouse gas emissions, key mechanisms under development are:
‘emission caps’ which place a legal limit on the amount that a country may emit;
carbon taxes which are designed to place a cost on pollution; and
a.
b.
Figure 6. Though Australia has comparatively low emissions at a national level, on a per capita basis its emissions are amongst the highest in the world due in part to high levels of coal use, fugitive emissions from fossil fuel extraction, energy intensive industries such as metals and minerals processing and land use activity that causes large amounts carbon to be unlocked as forests are cleared (OECD �006).
Figure 6: Variation in national emissions across the world
9Towards a High-Bandwidth, Low-Carbon FutureClimate Risk
emissions trading in which the total rights to emit greenhouse gases under a national cap can be bought, sold and traded.
Emissions Trading
There is now bi-partisan support for the introduction of emissions trading in Australia. Under this system a cap will be placed on the amount of emissions that can be released across the country, and the rights to emit will be given out and/or auctioned. As the cap gradually reduces over time the market value for the right to emit will gradually increase. In this way the emissions trading scheme creates a ‘price of carbon’ which reciprocally creates a value for greenhouse gas abatement.
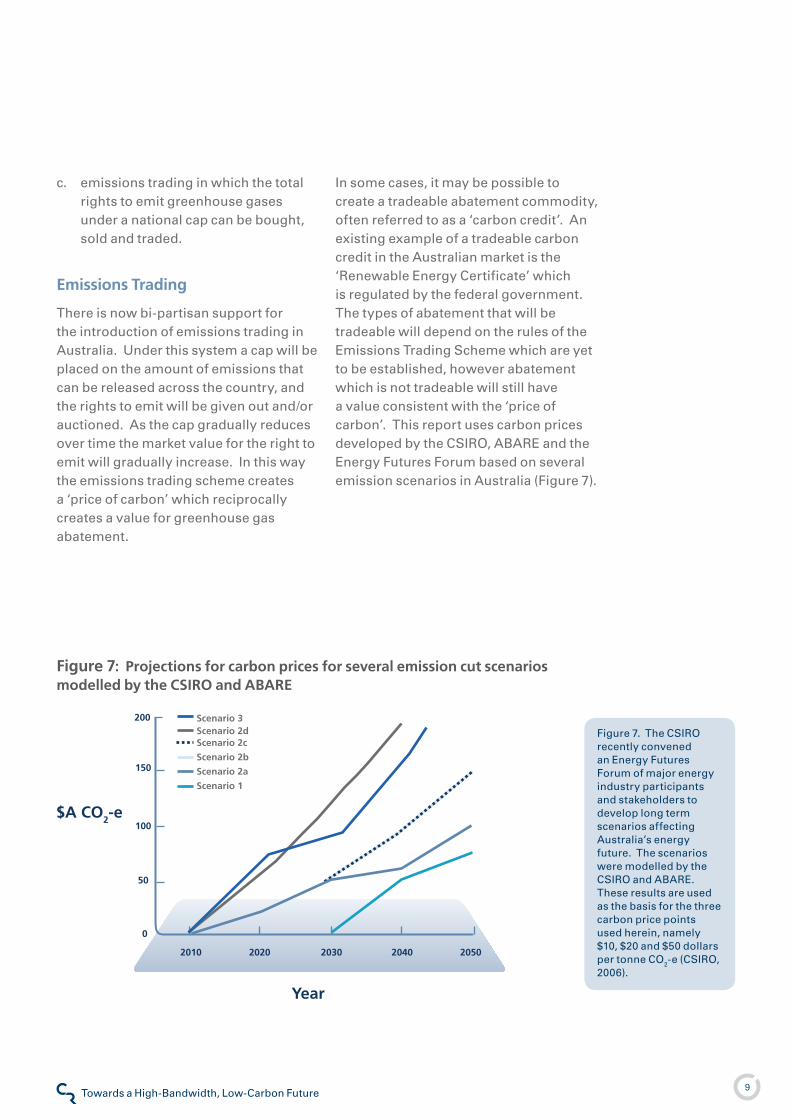
c. In some cases, it may be possible to create a tradeable abatement commodity, often referred to as a ‘carbon credit’. An existing example of a tradeable carbon credit in the Australian market is the ‘Renewable Energy Certificate’ which is regulated by the federal government. The types of abatement that will be tradeable will depend on the rules of the Emissions Trading Scheme which are yet to be established, however abatement which is not tradeable will still have a value consistent with the ‘price of carbon’. This report uses carbon prices developed by the CSIRO, ABARE and the Energy Futures Forum based on several emission scenarios in Australia (Figure 7).
$A CO2-e
2020 2030 2040 20502010
0
200
150
100
50
Year
Scenario 2c
Scenario 2b
Scenario 2a
Scenario 1
Scenario 2dScenario 3
Figure 7. The CSIRO recently convened an Energy Futures Forum of major energy industry participants and stakeholders to develop long term scenarios affecting Australia’s energy future. The scenarios were modelled by the CSIRO and ABARE. These results are used as the basis for the three carbon price points used herein, namely $�0, $�0 and $50 dollars per tonne CO�-e (CSIRO, �006).
Figure 7: Projections for carbon prices for several emission cut scenarios modelled by the CSIRO and ABARE
�0Towards a High-Bandwidth, Low-Carbon FutureClimate Risk
Part 2The Emissions Signature of Broadband
Telecommunications is a large user of energy. The most recent survey of Australian businesses indicates that their Information and Communications Technology (ICT) use is responsible for about 7.9 MtCO�-e, or about �.4% of national emissions (ACS �007). Emissions arising from Telstra’s operations account for about 0.��% of Australia’s total emissions (Telstra �006). While this may seem negligible in comparison to other sectors, a major expansion of networks and usage could lead to significant changes in emissions. In this section we seek to establish how significant. We do not consider life-cycle emissions or embodied energy (e.g. the energy or materials used to make a modem), which although significant are dwarfed by the energy flows in the ICT sector.
Understanding Telecommunications Networks
Telecommunication networks and broadband are best understood by considering three key elements:
Content – such as emails, music or videos as well as the applications and services that are needed to access this content;
Networks – the systems that transfer content from one place to another; and
Devices – such as computers, Personal Digital Assistants (PDA) and mobile phones.
�.
�.
3.
Content
All electronic content is comprised of data. Data is measured in bits– kilobytes (KB), megabytes (MB), gigabytes (GB) and terabytes (TB). Data requirements vary widely among different kinds of media content. For example:
Text-based email contains about �0-�5 KB of information
An SMS contains only �.5 KB for a �60 character SMS
A medium-sized novel contains about 5 MB of information
A song contains about 5 MB of information
A 3-minute, high-quality music video clip contains around 60 MB of information
A movie at DVD quality contains around 7-�0 GB of information for dual-layer discs
A library contains �-30 or more TB of information
Content data can be stored on devices, for example the hard drive of a computer, the memory of an iPod® or the address book in a mobile phone. Data can also be stored in a network or on server, for example much of the information available on the Internet like videos on YouTube™ and the photos on FaceBook™.
•
•
•
•
•
•
•
��Towards a High-Bandwidth, Low-Carbon FutureClimate Risk
Information Communications Technology appears to have been causing significant decreases in the energy intensity of economic activity across the wider economy.
networks
Telecommunication networks carry content from one place to another. Networks connect landline telephones, mobile phones and computers. They also connect consumers to businesses and businesses to businesses, both in Australia and overseas.
The performance of networks can be thought of like the performance of water pipes. Big pipes carry more water than small. Transferring data is like transferring water which need a network of pipes, and the quality of the architecture and size of the pipes will determine the volume and speed at which data is carried. In a telecommunications network the size of pipes or network capacity is known as ‘bandwidth’.
Unlike a water system, data needs to flow in two directions. The amount of bandwidth coming “in” (called “download”) has traditionally been greater than the amount of bandwidth going “out” (called “upload”), as there are more users who want to get content than create content. However this is changing with businesses and consumers starting to “upload” larger packets of information or data – for example, large video files (like videos placed on YouTube™) and e-mail attachments (like digital photographs) are now routinely sent out (or “uploaded”). In this way networks are evolving as the Internet becomes more like a two-way highway.
Devices
Devices include computers, modems, wireless turbo cards, mobile phones, PDAs – effectively anything that plugs into a network to receive and send data.
The speed at which content can be accessed is determined by the amount of content, network and the devices using the network.
The capacity of the device is part of the overall performance of the system, for example, there may be a lot of network capacity to handle a digital file, but unless the device has the capacity to process the data quickly, the overall performance will be limited. For example, if a video conference is occurring between a mobile phone and computer, the capacity of the mobile device and the computer will contribute to the clarity of the video.
Broadband
Broadband is sufficient data transmission speed to utilise applications, services or content effectively relative to the user’s access device or capabilities (KPMG �004).
Broadand covers systems running over fixed connections such as copper, coaxial cable or fibre optic cables as well as wireless links such as those that mobile devices use (e.g. 3G or the Next G™ wireless network).
��Towards a High-Bandwidth, Low-Carbon FutureClimate Risk
Three Ways to Consider the Issue
Emissions effects from ICT networks are considered in three ways.
A review of a macro-economic assessment of the effects of ICT on national emissions in the USA.
A review of energy demand impacts from ICT network operation in the United Kingdom and the secondary impacts on broadband-based customer activities.
A review of the status and trends for energy consumption (and therefore emissions profile) of relevant devices.
Macro-economics of iCT from the uSA
In the USA ICT brought about a partial decoupling of economic growth from energy consumption. In order to explain this interaction we need to consider the period prior to the major expansion of ICT in the US.
From �99� to �996, US economic growth averaged 3.4 % a year while energy use grew by �.4% a year (Romm �00�) - consistent with the opinion that a growing economy needs ever more energy. However from �996 to �000, Romm reports an apparent anomaly in US energy statistics. The US GDP growth increased to over 4% a year, but during the same period, energy demand only increased by �.�% a year. The energy intensity of economic growth
�.
�.
3.
- energy consumed per dollar of GDP - decreased by more than half (�997 and �998 saw decreases of 3.7% and 3.9% respectively)�. Except for the oil shocks of the �970s, this discontinuity in the connection between growth and energy was unprecedented in post-war US economic history.
The critical change that occurred during this period was the introduction of the internet, which was being deployed alongside the PC systems introduced in the previous part of the decade. Major economic growth was occurring online. Expansion of ICT deployment did require increased energy, in �00�, office ICT equipment across the US used 3% of total electricity (Roth �00�, p. �43).
The conclusion from these macro-economic studies of broadband energy issue is: if energy in ICT use was increasing, yet the energy intensity of the economy was decreasing, then ICT appears to have been causing significant decreases in the energy intensity of economic activity across the wider economy.
Power use for ICT has continued to increase through the broadband revolution. Analysis in �006 notes an increase in energy demand from home/consumer ICT (Roth �006, p. 53-54), ascribed to PCs and related equipment being 60% to �00% more than in previous studies, with most of the additional demand arising from devices being left on overnight. This is an issue we will consider in more detail later in the report.
� It should be noted that weather related factors may have accounted for some of the changes not exceeding 0.5% (Romm �00�).
�3Towards a High-Bandwidth, Low-Carbon FutureClimate Risk
Looking forward, while ICT networks and applications need energy it appears that they can realise much greater reductions in energy use across the wider economy.
The uK Broadband Environmental Audit
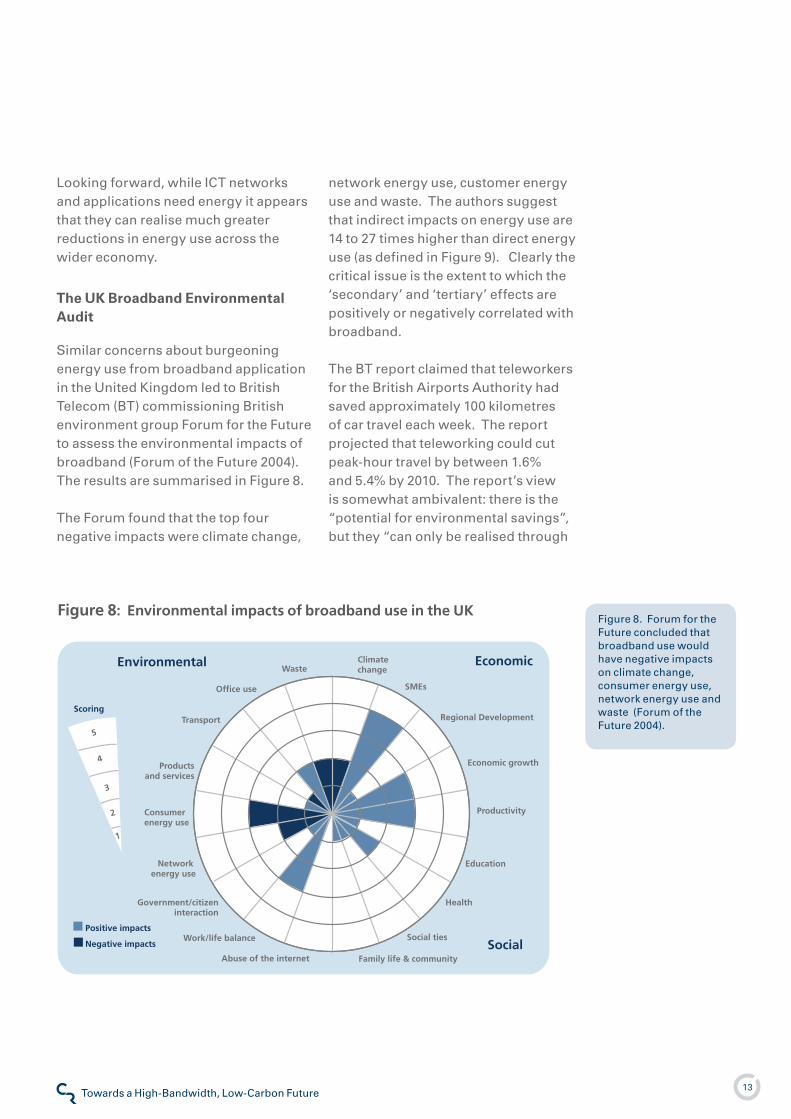
Similar concerns about burgeoning energy use from broadband application in the United Kingdom led to British Telecom (BT) commissioning British environment group Forum for the Future to assess the environmental impacts of broadband (Forum of the Future �004). The results are summarised in Figure 8.
The Forum found that the top four negative impacts were climate change,
network energy use, customer energy use and waste. The authors suggest that indirect impacts on energy use are �4 to �7 times higher than direct energy use (as defined in Figure 9). Clearly the critical issue is the extent to which the ‘secondary’ and ‘tertiary’ effects are positively or negatively correlated with broadband.
The BT report claimed that teleworkers for the British Airports Authority had saved approximately �00 kilometres of car travel each week. The report projected that teleworking could cut peak-hour travel by between �.6% and 5.4% by �0�0. The report’s view is somewhat ambivalent: there is the “potential for environmental savings”, but they “can only be realised through
Positive impacts
Negative impacts
Environmental
Social
Economic
Regional Development
WasteClimatechange
SMEs
Family life & community
Social ties
Health
Education
Productivity
Economic growth
Abuse of the internet
Transport
Productsand services
Networkenergy use
Government/citizen interaction
Work/life balance
Consumerenergy use
Office use
5
4
3
2
1
Scoring
Figure 8. Forum for the Future concluded that broadband use would have negative impacts on climate change, consumer energy use, network energy use and waste (Forum of the Future �004).
Figure 8: Environmental impacts of broadband use in the UK
�4Towards a High-Bandwidth, Low-Carbon FutureClimate Risk
changes in behaviour and corporate policy.” It contends that even with telework and reduced commuting, car use would continue to grow, presumably due to other unrelated factors.
The report also notes that telework could reduce office space demands by �5%, which clearly has commensurate impacts on energy demands in commercial workplaces. The critical observation in the context of this report is that even the projected direct and indirect emissions associated with broadband expansion represent only a “tiny percentage of UK emissions… secondary and tertiary impacts are likely to be much greater, e.g. an increase in transport intensity is ten times more significant for CO� emissions than all primary broadband impacts.”
The overall conclusion was that the delivery of environmental outcomes “could swing either way” but that the key element affecting this swing would be the associated [customer] behaviour and corporate policy.
To some extent this conclusion is in contrast with the US results, which indicated that a fundamental dematerialisation of energy use happened even without an environmental objective. Since this report was released, the process of ‘unintended’ dematerialisation has continued. For example, energy demand is significantly reduced in the transition from motor driven physical storage (e.g. the CD) to chip storage. Nonetheless, it is clear that coordination could have a critical role in enabling an intended outcome regarding
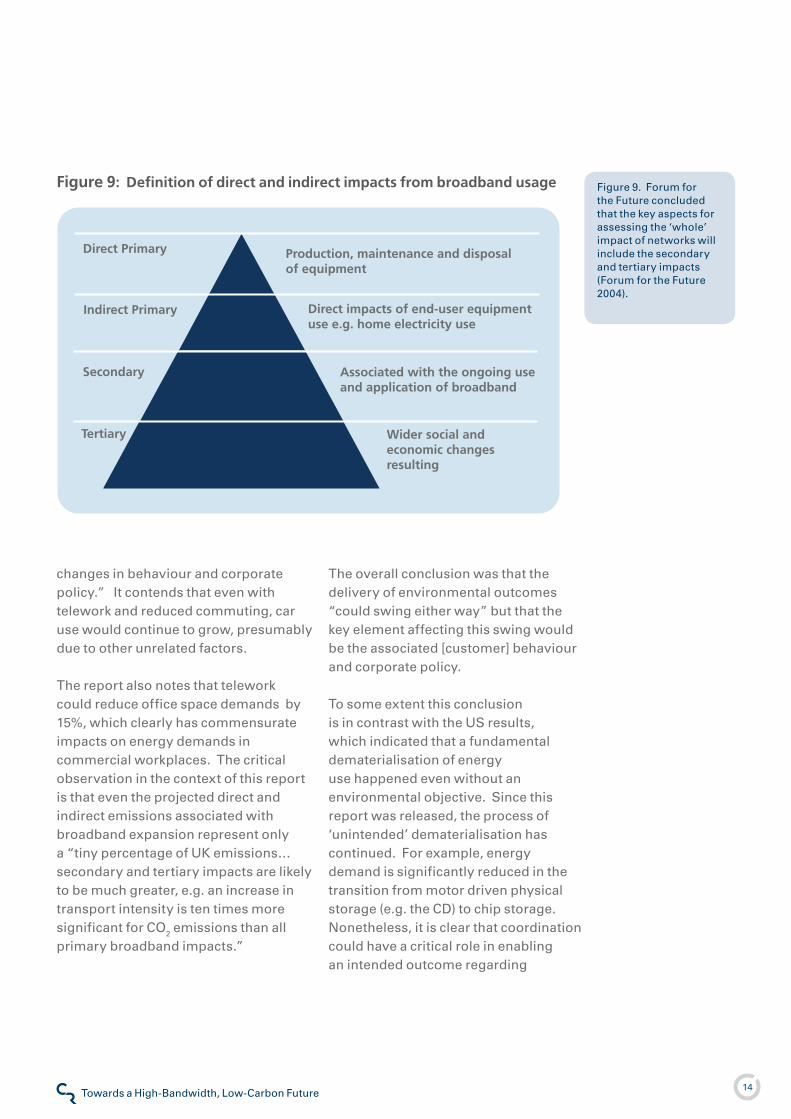
Wider social and economic changes resulting
Associated with the ongoing use and application of broadband
Direct impacts of end-user equipment use e.g. home electricity use
Production, maintenance and disposal of equipment
Indirect Primary
Secondary
Tertiary
Direct Primary
Figure 9. Forum for the Future concluded that the key aspects for assessing the ‘whole’ impact of networks will include the secondary and tertiary impacts (Forum for the Future �004).
Figure 9: Definition of direct and indirect impacts from broadband usage
�5Towards a High-Bandwidth, Low-Carbon FutureClimate Risk
carbon emissions, and a lack of such an objective could lead to a swing to negative outcomes.
Status and Trends in underlying Devices
The energy trajectory of the devices that underpin broadband is influenced by incremental and step changes.
Incremental changes are those in which the same device becomes steadily more efficient. Often this is achieved by more expensive technologies being pulled into the market as economies of scale are achieved, and this can be aided by technology standards or targets. Table � shows the evolution in energy demand between two successive product specification years and the incremental changes delivered.
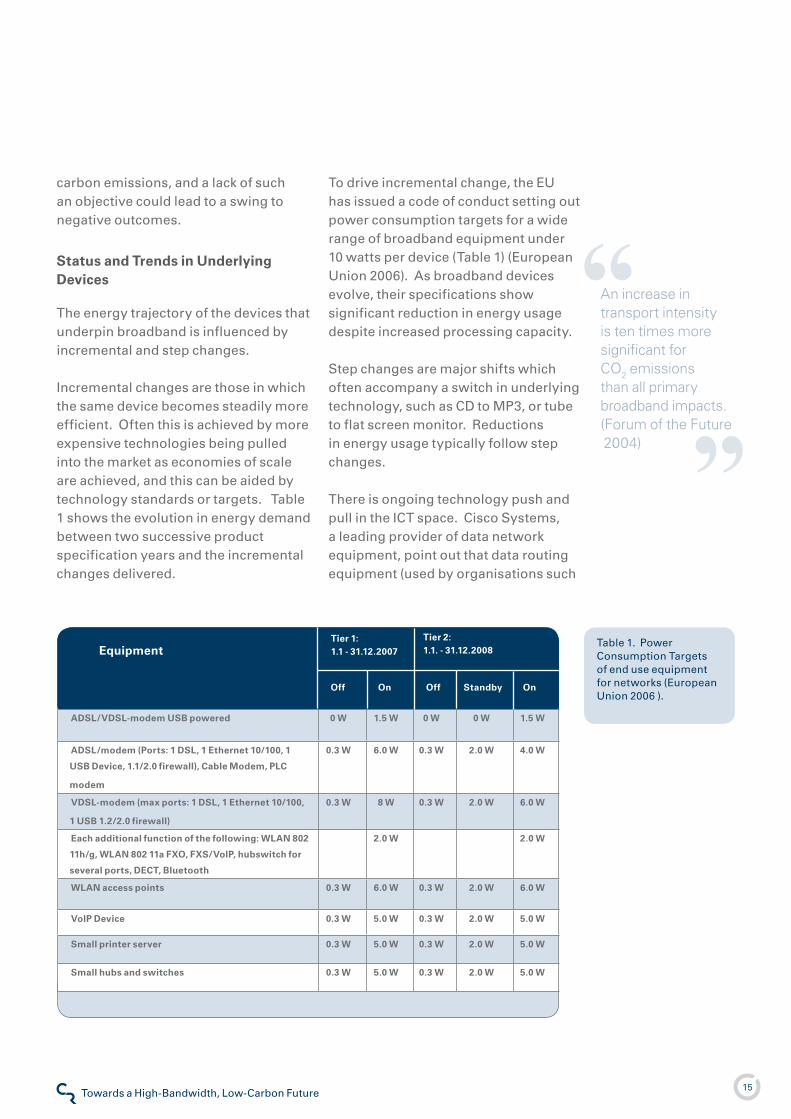
To drive incremental change, the EU has issued a code of conduct setting out power consumption targets for a wide range of broadband equipment under �0 watts per device (Table �) (European Union �006). As broadband devices evolve, their specifications show significant reduction in energy usage despite increased processing capacity.
Step changes are major shifts which often accompany a switch in underlying technology, such as CD to MP3, or tube to flat screen monitor. Reductions in energy usage typically follow step changes.
There is ongoing technology push and pull in the ICT space. Cisco Systems, a leading provider of data network equipment, point out that data routing equipment (used by organisations such
Equipment
Off On Off Standby On
ADSL/VDSL-modem uSB powered 0 W 1.5 W 0 W 0 W 1.5 W
ADSL/modem (Ports: 1 DSL, 1 Ethernet 10/100, 1
uSB Device, 1.1/2.0 firewall), Cable Modem, PLC
modem
0.3 W 6.0 W 0.3 W 2.0 W 4.0 W
VDSL-modem (max ports: 1 DSL, 1 Ethernet 10/100,
1 uSB 1.2/2.0 firewall)
0.3 W 8 W 0.3 W 2.0 W 6.0 W
Each additional function of the following: WLAn 802
11h/g, WLAn 802 11a FXO, FXS/VolP, hubswitch for
several ports, DECT, Bluetooth
2.0 W 2.0 W
WLAn access points 0.3 W 6.0 W 0.3 W 2.0 W 6.0 W
VolP Device 0.3 W 5.0 W 0.3 W 2.0 W 5.0 W
Small printer server 0.3 W 5.0 W 0.3 W 2.0 W 5.0 W
Small hubs and switches 0.3 W 5.0 W 0.3 W 2.0 W 5.0 W
Tier 1: 1.1 - 31.12.2007
Tier 2:1.1. - 31.12.2008
Table �. Power Consumption Targets of end use equipment for networks (European Union �006 ).
An increase in transport intensity is ten times more significant for CO2 emissions than all primary broadband impacts. (Forum of the Future 2004)
�6Towards a High-Bandwidth, Low-Carbon FutureClimate Risk
The most significant opportunities to reduce emissions from networks is through the leveraging of emission reductions in the wider society via the use of network enabled applications.
as Internet Service Providers) has seen an increase of data throughput of �33% in �0 years for the same amount of power (Cisco �005).
Not only can step changes reduce the energy intensity of ICT devices, but they also result in ‘smarter’ devices. In early �007, Sky (the UK’s largest satellite broadcaster) released a satellite set-top-box with automatic functionality to turn itself off completely, rather than go into standby mode when not being used.
The Balance of Network Impacts
The key conclusions from a consideration of the greenhouse gas impacts of network use are as follows:
The previous research presented indicates that there is evidence of a strong link between telecommunication networks and a reduction in the intensity of society-wide/economy-wide energy use and therefore greenhouse gas emissions.
The assumption that the use and extensive growth of ICT networks gives rise to major increases in energy consumption is not valid. The large rise in ICT use in the US was a major part of economic growth during a period when the energy intensity of economic activity actually decreased.
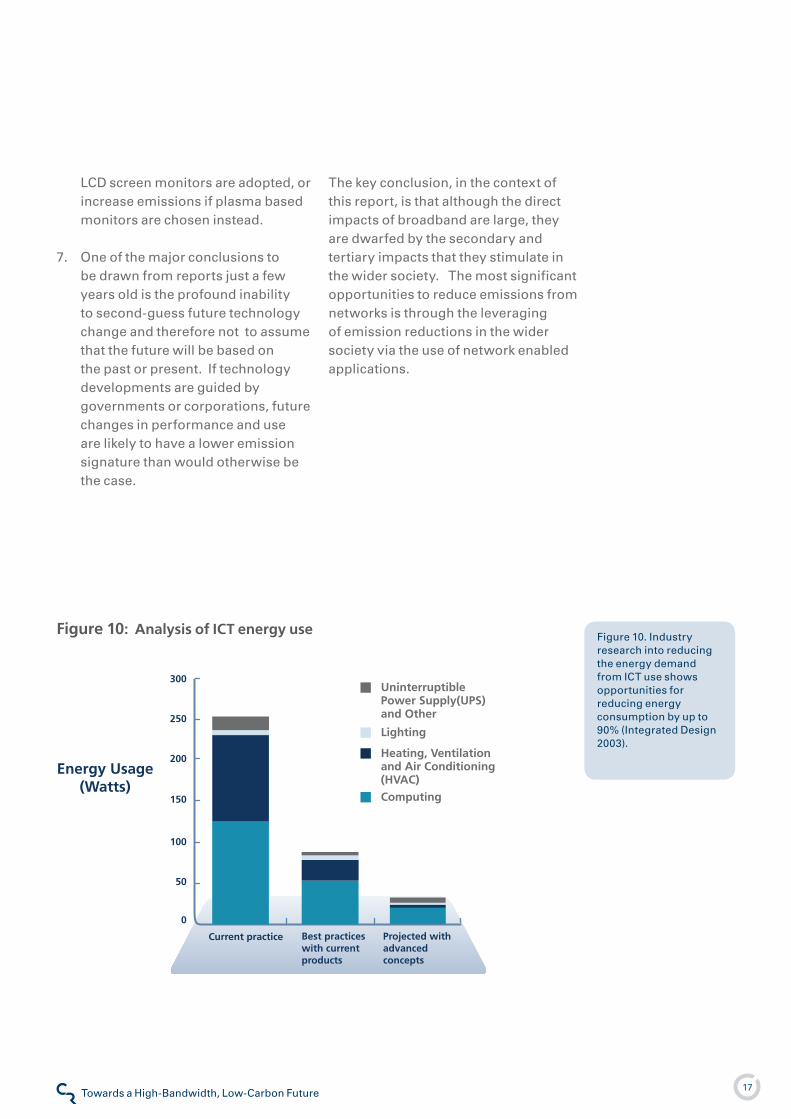
The trends in new technologies around energy consumption in data networks indicate that energy consumption reductions of 90%
�.
�.
3.
are possible (see Figure �0) and are now coming through to the market. However these ongoing reductions are occurring at a time when the volume of use is increasing significantly.
The most significant impacts from networks will be in how the networks are used by business and residential consumers and the consequent impacts on their emissions footprint. These impacts will be at least an order of magnitude larger than any direct impacts from energy related to using ICT networks.
There is very little evidence that the ability of networks to leverage emissions cuts has been deliberately attempted thus far. Society wide emissions and abatement have not been made a central part of the decision-making for network outcomes in the global telecommunications sector. There have been however significant attempts to reduce energy consumption in order to reduce operation and infrastructure costs and so emissions reductions have occurred as an ‘unintended’ but beneficial side-effect.
There are warnings from some analysts that without intent and coordination the positive outcomes seen thus far could swing the other way into increased relative emissions. For example the current trend towards flat screen monitors may decrease monitor emissions if
4.
5.
6.
�7Towards a High-Bandwidth, Low-Carbon FutureClimate Risk
LCD screen monitors are adopted, or increase emissions if plasma based monitors are chosen instead.
One of the major conclusions to be drawn from reports just a few years old is the profound inability to second-guess future technology change and therefore not to assume that the future will be based on the past or present. If technology developments are guided by governments or corporations, future changes in performance and use are likely to have a lower emission signature than would otherwise be the case.
7.
The key conclusion, in the context of this report, is that although the direct impacts of broadband are large, they are dwarfed by the secondary and tertiary impacts that they stimulate in the wider society. The most significant opportunities to reduce emissions from networks is through the leveraging of emission reductions in the wider society via the use of network enabled applications.
Figure �0. Industry research into reducing the energy demand from ICT use shows opportunities for reducing energy consumption by up to 90% (Integrated Design �003).
Figure 10: Analysis of ICT energy use
UninterruptiblePower Supply(UPS) and Other
Lighting
Computing
Heating, Ventilation and Air Conditioning (HVAC)
0
50
250
100
200
150
300
Current practice Best practices with current products
Projected with advancedconcepts
Energy Usage (Watts)
�8Towards a High-Bandwidth, Low-Carbon FutureClimate Risk
Step 1: Review Australian National Greenhouse Gas Inventory, identify relevant sectors, discount less relevant sectors and identify ‘target’ emission sources.
Step 2. Review current and emergent network technology and applications for the sectors identified.
Step 3: Overlay the results of steps � and �, to identify telecommunication network opportunities which reduce carbon emissions and create financial value for end users.
Part 3Identifying Carbon-Opportunities for Telecommunication networks
The genesis of this project was the recognition that a movement towards teleworking should contribute to reduced greenhouse gas emissions due to reduced transport use. A review of the emerging broadband technology revealed that network-related innovations may facilitate further emission reductions. Telstra commissioned Climate Risk to quantify the potential of existing and next-generation networks and applications for carbon abatement, and the opportunities for telecommunication networks to play a role in climate change mitigation in Australia.
The idea that ICT networks can reduce greenhouse gas emissions is not new, but still nascent. Excellent high level work published internationally has highlighted several ways in which ICT may assist emissions abatement (ETNO �006). In this report we have built upon this research to pragmatically re-consider the types of opportunities available, the plausible market uptake of new technologies and services, the scale and significance of these opportunities at a national level and the costs and benefits to telecommunications providers and their customers. We also present several new opportunities to reduce emissions which are potentially larger in scale than any opportunities previously identified, as well as being internationally applicable
In order to provide a consistent
methodology to identify opportunities and maximise carbon abatement potential, Climate Risk adopted the following process:
Step 1. Identifying Relevant Sectors
In �005 Australia’s net greenhouse gas emissions were 559 MtCO�-e, about �.�% above emission levels in �990.
Table � shows the major emissions by category. By inspection, broadband can provide only a limited role in agriculture, land use, land use change and forestry (LULUCF), industrial processes and waste. There may be some relevant applications, but these are not in the main target markets typical for network services. For example an area where ICT networks could contribute significantly to these emissions sectors is through ‘dematerialisation’, i.e.
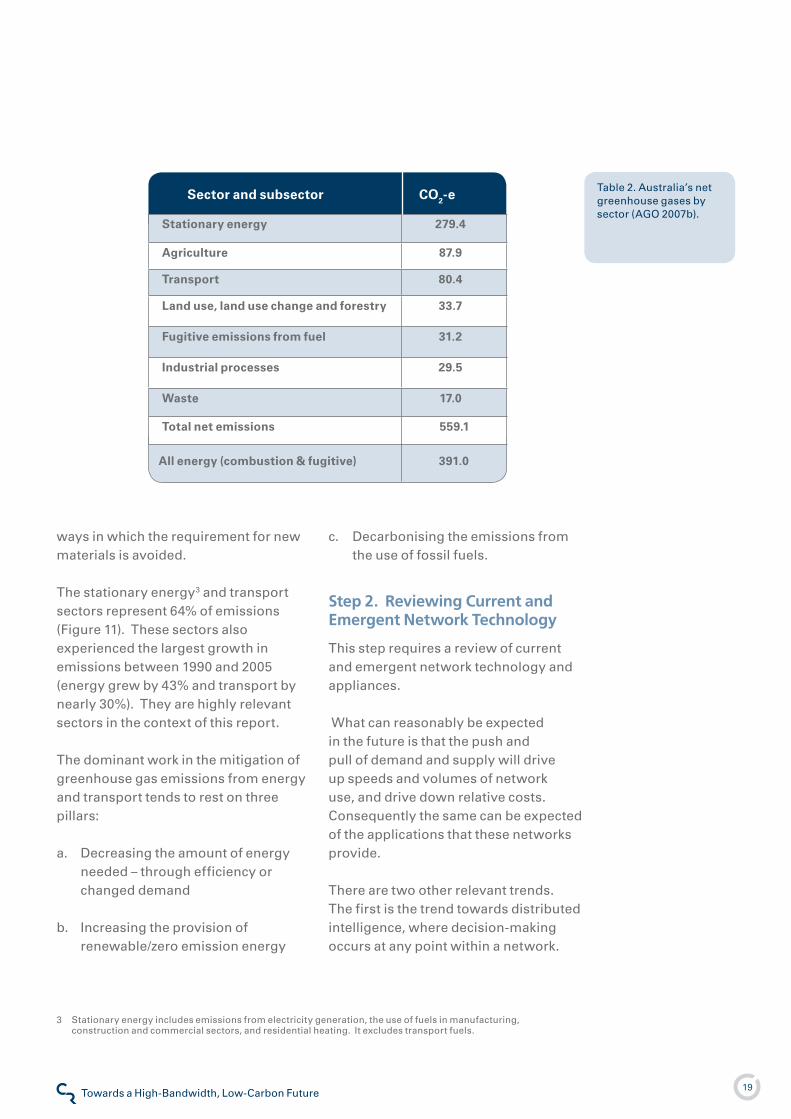
�9Towards a High-Bandwidth, Low-Carbon FutureClimate Risk
Table �. Australia’s net greenhouse gases by sector (AGO �007b).
All energy (combustion & fugitive) 391.0
Sector and subsector CO2-e
Stationary energy 279.4
Agriculture 87.9
Transport 80.4
Land use, land use change and forestry 33.7
Fugitive emissions from fuel 31.2
industrial processes 29.5
Waste 17.0
Total net emissions 559.1
ways in which the requirement for new materials is avoided.
The stationary energy3 and transport sectors represent 64% of emissions (Figure ��). These sectors also experienced the largest growth in emissions between �990 and �005 (energy grew by 43% and transport by nearly 30%). They are highly relevant sectors in the context of this report.
The dominant work in the mitigation of greenhouse gas emissions from energy and transport tends to rest on three pillars:
Decreasing the amount of energy needed – through efficiency or changed demand
Increasing the provision of renewable/zero emission energy
a.
b.
Decarbonising the emissions from the use of fossil fuels.
Step 2. Reviewing Current and Emergent Network Technology
This step requires a review of current and emergent network technology and appliances.
What can reasonably be expected in the future is that the push and pull of demand and supply will drive up speeds and volumes of network use, and drive down relative costs. Consequently the same can be expected of the applications that these networks provide.
There are two other relevant trends. The first is the trend towards distributed intelligence, where decision-making occurs at any point within a network.
c.
3 Stationary energy includes emissions from electricity generation, the use of fuels in manufacturing, construction and commercial sectors, and residential heating. It excludes transport fuels.
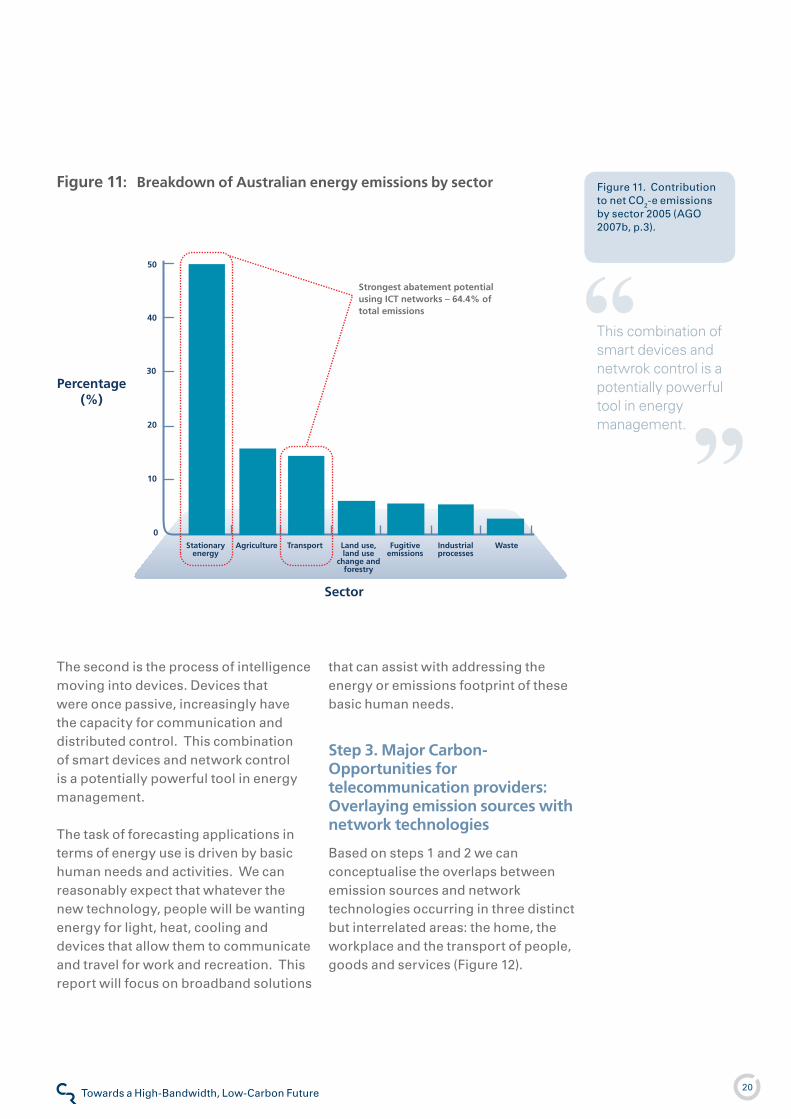
�0Towards a High-Bandwidth, Low-Carbon FutureClimate Risk
This combination of smart devices and netwrok control is a potentially powerful tool in energy management.
Figure ��. Contribution to net CO�-e emissions by sector �005 (AGO �007b, p.3).
Figure 11: Breakdown of Australian energy emissions by sector
Stationaryenergy
Transport Fugitiveemissions
Industrialprocesses
Agriculture Land use, land use
change and forestry
Waste
0
10
20
30
40
50
Percentage(%)
Sector
Strongest abatement potential using ICT networks – 64.4% of total emissions
The second is the process of intelligence moving into devices. Devices that were once passive, increasingly have the capacity for communication and distributed control. This combination of smart devices and network control is a potentially powerful tool in energy management.
The task of forecasting applications in terms of energy use is driven by basic human needs and activities. We can reasonably expect that whatever the new technology, people will be wanting energy for light, heat, cooling and devices that allow them to communicate and travel for work and recreation. This report will focus on broadband solutions
that can assist with addressing the energy or emissions footprint of these basic human needs.
Step 3. Major Carbon-Opportunities for telecommunication providers: Overlaying emission sources with network technologies
Based on steps � and � we can conceptualise the overlaps between emission sources and network technologies occurring in three distinct but interrelated areas: the home, the workplace and the transport of people, goods and services (Figure ��).
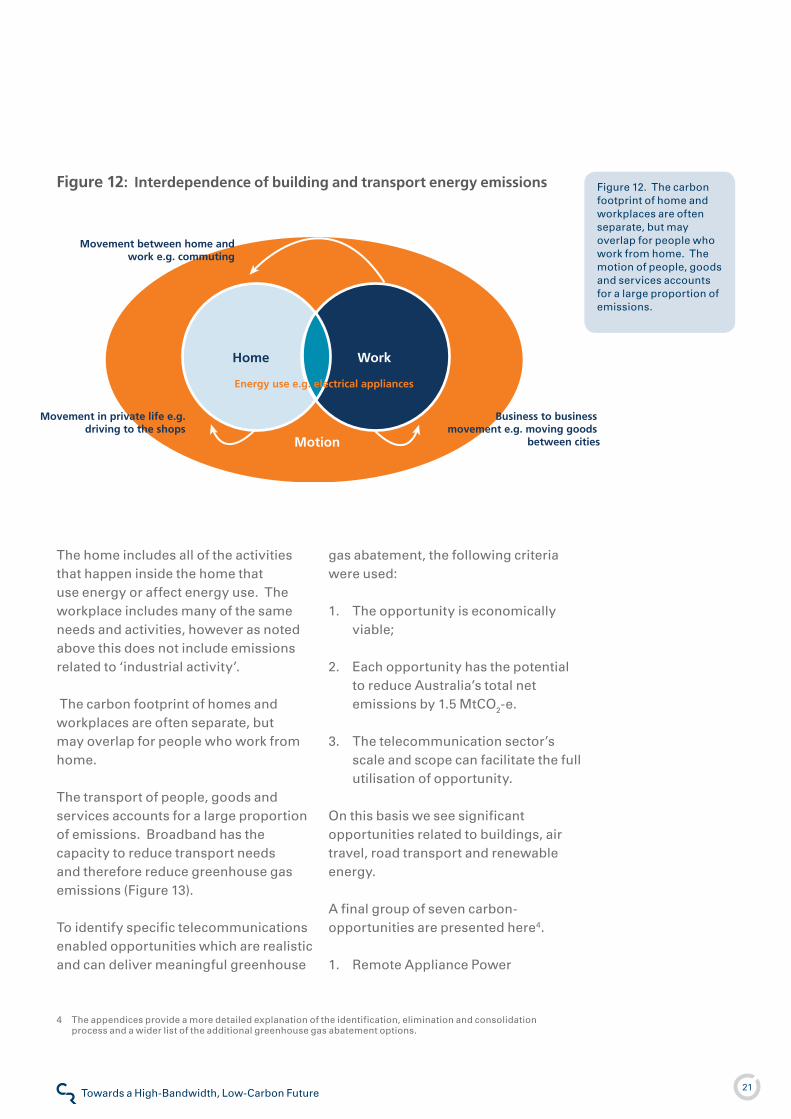
��Towards a High-Bandwidth, Low-Carbon FutureClimate Risk
Figure ��. The carbon footprint of home and workplaces are often separate, but may overlap for people who work from home. The motion of people, goods and services accounts for a large proportion of emissions.
WorkHome
Movement in private life e.g. driving to the shops
Business to business movement e.g. moving goods
between cities
Movement between home andwork e.g. commuting
Motion
Energy use e.g. electrical appliances
Figure 12: Interdependence of building and transport energy emissions
The home includes all of the activities that happen inside the home that use energy or affect energy use. The workplace includes many of the same needs and activities, however as noted above this does not include emissions related to ‘industrial activity’.
The carbon footprint of homes and workplaces are often separate, but may overlap for people who work from home.
The transport of people, goods and services accounts for a large proportion of emissions. Broadband has the capacity to reduce transport needs and therefore reduce greenhouse gas emissions (Figure �3).
To identify specific telecommunications enabled opportunities which are realistic and can deliver meaningful greenhouse
gas abatement, the following criteria were used:
The opportunity is economically viable;
Each opportunity has the potential to reduce Australia’s total net emissions by �.5 MtCO�-e.
The telecommunication sector’s scale and scope can facilitate the full utilisation of opportunity.
On this basis we see significant opportunities related to buildings, air travel, road transport and renewable energy.
A final group of seven carbon- opportunities are presented here4.
Remote Appliance Power
�.
�.
3.
�.
4 The appendices provide a more detailed explanation of the identification, elimination and consolidation process and a wider list of the additional greenhouse gas abatement options.
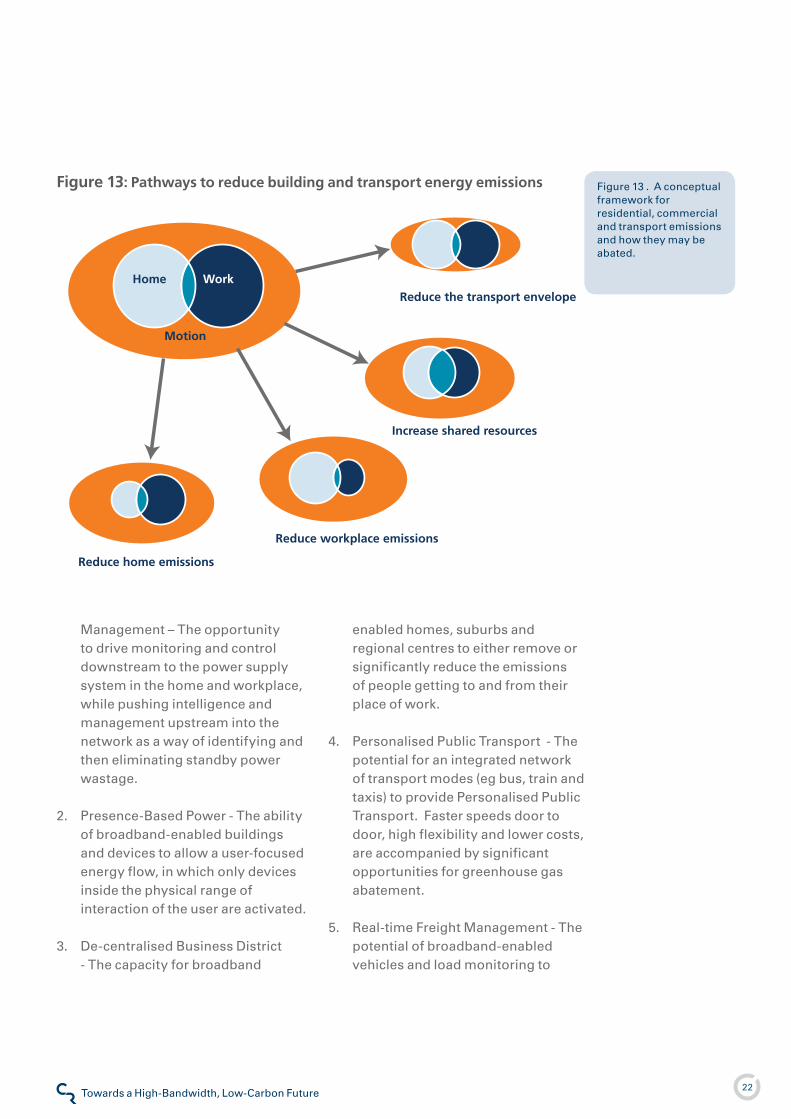
��Towards a High-Bandwidth, Low-Carbon FutureClimate Risk
Figure �3 . A conceptual framework for residential, commercial and transport emissions and how they may be abated.
Home Work
Motion
Reduce the transport envelope
Increase shared resources
Reduce workplace emissions
Reduce home emissions
Figure 13: Pathways to reduce building and transport energy emissions
Management – The opportunity to drive monitoring and control downstream to the power supply system in the home and workplace, while pushing intelligence and management upstream into the network as a way of identifying and then eliminating standby power wastage.
Presence-Based Power - The ability of broadband-enabled buildings and devices to allow a user-focused energy flow, in which only devices inside the physical range of interaction of the user are activated.
De-centralised Business District - The capacity for broadband
�.
3.
enabled homes, suburbs and regional centres to either remove or significantly reduce the emissions of people getting to and from their place of work.
Personalised Public Transport - The potential for an integrated network of transport modes (eg bus, train and taxis) to provide Personalised Public Transport. Faster speeds door to door, high flexibility and lower costs, are accompanied by significant opportunities for greenhouse gas abatement.
Real-time Freight Management - The potential of broadband-enabled vehicles and load monitoring to
4.
5.
�3Towards a High-Bandwidth, Low-Carbon FutureClimate Risk
reduce unladen (empty) and under-laden trips.
Increased Renewable Energy - The potential for extensive broadband networks to monitor and facilitate the management of heating, cooling and other loads. This load management can be undertaken by an integrated mobile and fixed broadband platform and be used to effectively neutralise the short-term variability of renewable energy supplies, turning them into ‘stable and predictable’ power generation.
‘On-Live’ High Definition Video Conferencing - The opportunity for long distance, short duration travel to be effectively replaced with ‘in person’ quality online conferencing that is considerably more cost, time and energy efficient, with significantly reduced emissions.
6.
7.
Viability and Implementation
The carbon opportunities identified in the report have been selected in part because of the practicality of their implementation, i.e. that there are technologies, products, services or systems that can readily assimilate the identified innovations and deliver them to market. In some, but not all cases, there is assumed to be market pressure for reduced emissions through carbon pricing and a premium value for renewable energy. These assumptions are plausible given current statements by political leaders in Australia.
Beyond an initial screening for viability, this report does not set out a business strategy or road-map for commercially realising the carbon-opportunities identified, and so a detailed analysis of implementation options and barriers is not provided or implied.
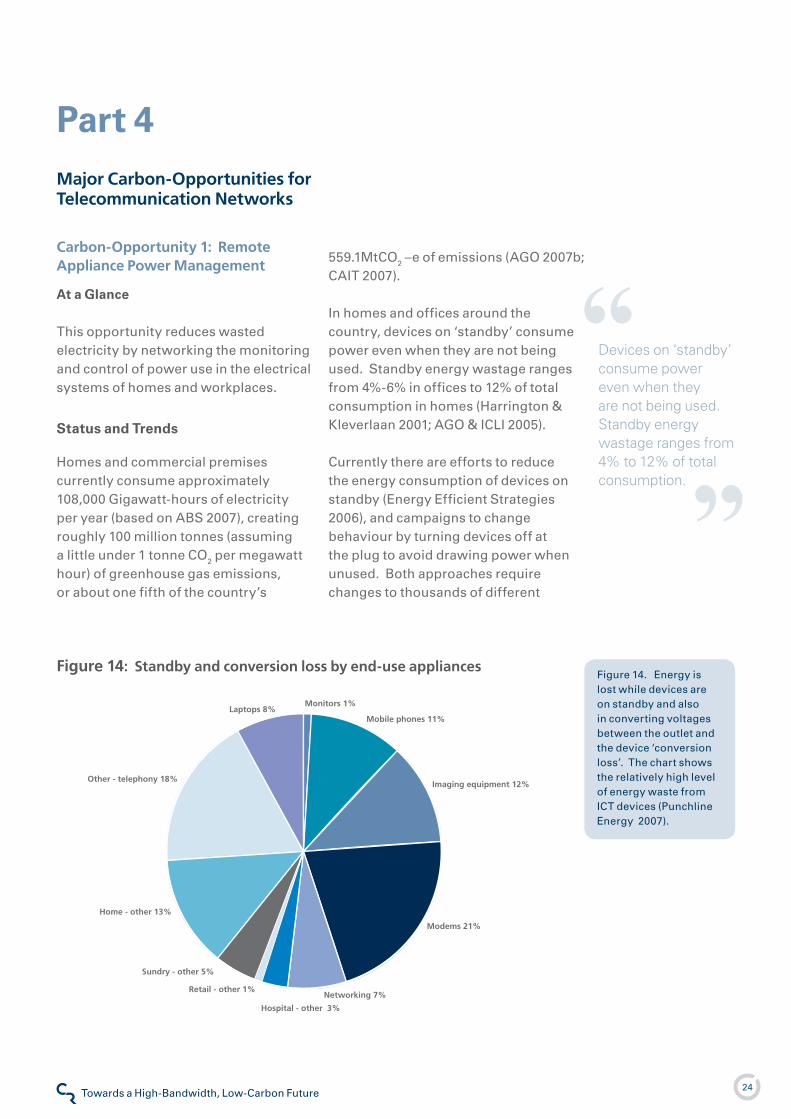
�4Towards a High-Bandwidth, Low-Carbon FutureClimate Risk
Monitors 1%
Mobile phones 11%
Imaging equipment 12%
Modems 21%
Networking 7%
Hospital - other 3%
Retail - other 1%
Sundry - other 5%
Home - other 13%
Other - telephony 18%
Laptops 8%
Figure �4. Energy is lost while devices are on standby and also in converting voltages between the outlet and the device ‘conversion loss’. The chart shows the relatively high level of energy waste from ICT devices (Punchline Energy �007).
Figure 14: Standby and conversion loss by end-use appliances
Devices on ‘standby’ consume power even when they are not being used. Standby energy wastage ranges from 4% to 12% of total consumption.
Carbon-Opportunity 1: Remote Appliance Power Management
At a Glance
This opportunity reduces wasted electricity by networking the monitoring and control of power use in the electrical systems of homes and workplaces.
Status and Trends
Homes and commercial premises currently consume approximately �08,000 Gigawatt-hours of electricity per year (based on ABS �007), creating roughly �00 million tonnes (assuming a little under � tonne CO� per megawatt hour) of greenhouse gas emissions, or about one fifth of the country’s
559.�MtCO� –e of emissions (AGO �007b; CAIT �007).
In homes and offices around the country, devices on ‘standby’ consume power even when they are not being used. Standby energy wastage ranges from 4%-6% in offices to ��% of total consumption in homes (Harrington & Kleverlaan �00�; AGO & ICLI �005).
Currently there are efforts to reduce the energy consumption of devices on standby (Energy Efficient Strategies �006), and campaigns to change behaviour by turning devices off at the plug to avoid drawing power when unused. Both approaches require changes to thousands of different
Part 4Major Carbon-Opportunities for Telecommunication Networks
�5Towards a High-Bandwidth, Low-Carbon FutureClimate Risk
REAL WORLD EXAMPLENetworks and remote intelligence can allow a more sophisticated level of
intervention. A small company in Oxfordshire UK has created a single-point
handheld device that allows the user to send a radio frequency signal to switch off
all products (plugged into specially designed socket adapters) that are in standby
mode when they leave the house or go to sleep. The company, ‘Bye Bye Standby’,
states that the device can save large amounts of greenhouse gases through lower
energy consumption, reduce electricity bills and decrease the risk of home fires
(BBSB �007).
5 Calculation is based on ��.5GWh of standby energy at a delivered price of $�00 per MWh (at the lower end of non-industrial delivered electricity prices in Australia), which gives a total value of $�.�5 billion
The value of wasted standby energy may be over 1 billion dollars per year.
product types and modifying the behaviour of millions of people, making reductions difficult. Standards are being developed to reduce the energy consumption of various devices while they are on standby, however current trends indicate that by �0�0 Australian electricity demand may increase by as much as 40% (ABARE �005). Consequently, wasted energy from devices that are on standby may still increase.
The Carbon-Business Confluence
Reducing energy use means reducing greenhouse emissions, which in turn represents cost savings. The value of wasted standby energy is of the order of $A� billion per year5.
The Telemetry Application
Telecommunication providers have existing telemetry products that can be extended to monitoring and controlling energy distribution networks in buildings. These products could move energy management away from individuals or devices to intelligence in the communications network.
The distributed management of energy could occur either inside the building or anywhere online. In practice, this could mean combining outlets for power and broadband into a unified socket or inserting an intermediate networked plug/socket such as the one shown in the breakout box. Both of these would allow intelligent control from anywhere on the global broadband network. For example, charging tools in a garage; the outlet or switching box is able to monitor the energy being drawn and management elsewhere on the network can tell when the charging is finished. Rather than leaving the charging transformers running, the remote management sends a signal for the outlet to turn off, halting the flow of standby power.
The application draws on a broadband-enabled home or workplace, but also requires the telecommunications provider to engage in the home electrical market and building industry to deploy appropriate products in new and refurbished homes or provide simple retrofit products.
Rather than leaving the charging transformers running, the remote management sends a signal for the outlet to turn off, halting the flow of standby power.
�6Towards a High-Bandwidth, Low-Carbon FutureClimate Risk
Challenges and Barriers
This is an example of shifting from an incidental to deliberate specification of network enabled energy management. The ability to have the necessary information and control to intercept standby energy wastage requires devices that are both networked and controllable or power supply switches that are networked and controllable.
Such devices and switches already exist, however the large scale uptake requires the ability to retro-fit such switching at low cost. It also requires applicable future devices to be suitably networked and controllable.
�7Towards a High-Bandwidth, Low-Carbon FutureClimate Risk
A typical plasma television uses the equivalent energy of an electric heater even when no-one is in the room.
Carbon-Opportunity 2 : Presence-Based Power
At a Glance
Electricity flows in the home and workplace are currently device-focussed. Once the appliance is on, it draws the energy that it demands. If no-one is in the room to enjoy the lighting or the air-conditioning, this can be thought of as ‘orphaned’ energy. Broadband-enabled buildings and devices allow a user-focused energy flow (a ‘Presence-Based Power’), in which only devices inside the physical range of engagement of the user are activated. This innovation could reduce an estimated �5% of energy use currently wasted as ‘orphaned’.
Status and Trends
Homes and commercial premises currently consume approximately �08,000 Gigawatt-hours of electricity per year (ABS �007), causing roughly �00 million tonnes (assuming a little under � tonne CO� per megawatt hour) of greenhouse gas emissions or about one fifth of the country’s 559.� MtCO� –e of emissions (AGO �007b; CAIT �007).
Devices which are on but unused (orphaned) are wasting energy in homes and offices. For example, a typical plasma television uses the equivalent energy of an electric heater even when no-one is in the room. Computers are on in offices when people have left for a meeting; lights and air conditioning are on in rooms or entire floors where no one is present. Current trends indicate
that by �0�0 Australian electricity demand may increase by as much as 50%. Consequently, ‘orphaned’ energy from devices that are on but unused can be expected to increase by a similar amount.
The Carbon-Business Confluence
There is very little work on how much energy is wasted in ‘orphaned’ appliances. To some extent, this will vary with the definition of what period of non-use is applicable. Climate Risk estimate that, separate from standby power, about �5% of energy use may be categorised as ‘orphaned’, extrapolated from analysis by the larger product manufacturers in the field.
The Telecommunication Mobile network Opportunity
Presence-Based Power may be understood as the aura that lights up the room when a charismatic person arrives. The ‘intelligent building’ is aware as the person moves between spaces. Devices, lights, heating, TVs or computers are on when required by the person, but ‘go to sleep’ after the user leaves.
The user, identified via their mobile phone or a key tag, can personally define an ‘aura’ size - perhaps a � metre radius in the office. Any device inside that sphere will be active, but a device outside the person’s designated ‘energy radius’ will be off until such time as the person comes back into proximity to the device. The system can be extended to
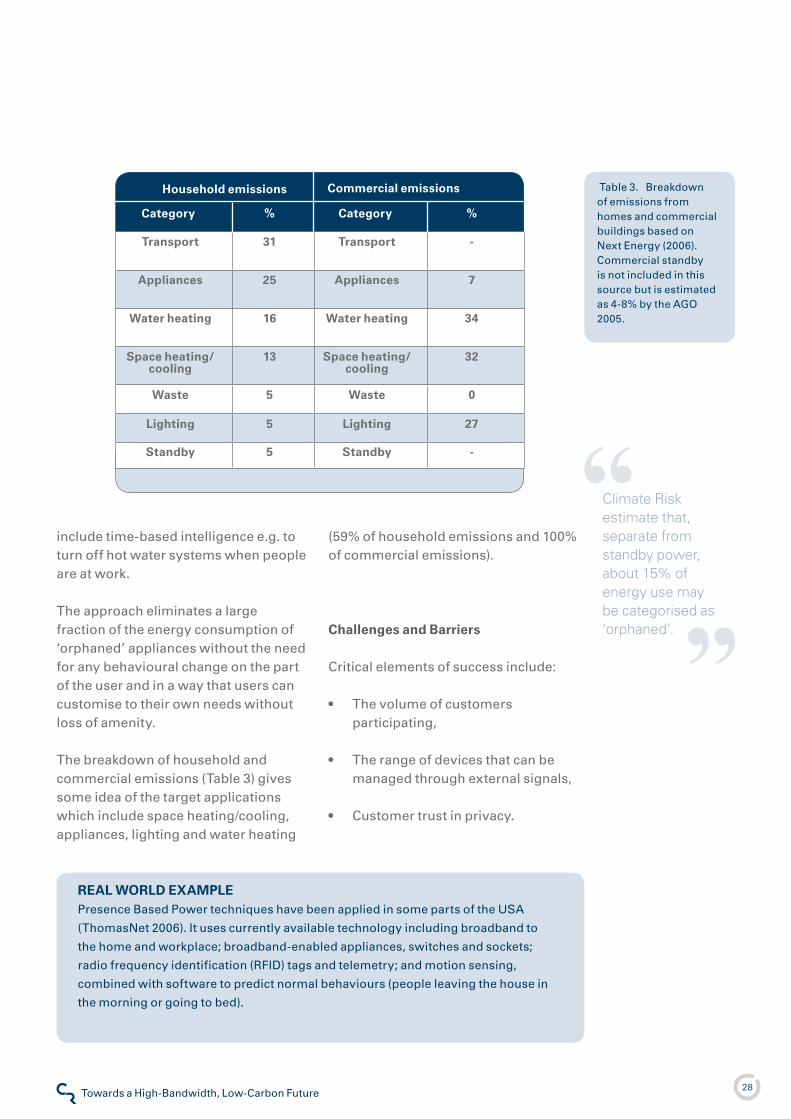
�8Towards a High-Bandwidth, Low-Carbon FutureClimate Risk
Table 3. Breakdown of emissions from homes and commercial buildings based on Next Energy (�006). Commercial standby is not included in this source but is estimated as 4-8% by the AGO �005.
Category % Category %
Transport 31 Transport -
Appliances 25 Appliances 7
Water heating 16 Water heating 34
Space heating/cooling
13 Space heating/cooling
32
Waste 5 Waste 0
Lighting 5 Lighting 27
Standby 5 Standby -
Household emissions Commercial emissions
REAL WORLD EXAMPLEPresence Based Power techniques have been applied in some parts of the USA
(ThomasNet �006). It uses currently available technology including broadband to
the home and workplace; broadband-enabled appliances, switches and sockets;
radio frequency identification (RFID) tags and telemetry; and motion sensing,
combined with software to predict normal behaviours (people leaving the house in
the morning or going to bed).
Climate Risk estimate that, separate from standby power, about 15% of energy use may be categorised as ‘orphaned’.
include time-based intelligence e.g. to turn off hot water systems when people are at work.
The approach eliminates a large fraction of the energy consumption of ‘orphaned’ appliances without the need for any behavioural change on the part of the user and in a way that users can customise to their own needs without loss of amenity.
The breakdown of household and commercial emissions (Table 3) gives some idea of the target applications which include space heating/cooling, appliances, lighting and water heating
(59% of household emissions and �00% of commercial emissions).
Challenges and Barriers
Critical elements of success include:
The volume of customers participating,
The range of devices that can be managed through external signals,
Customer trust in privacy.
•
•
•
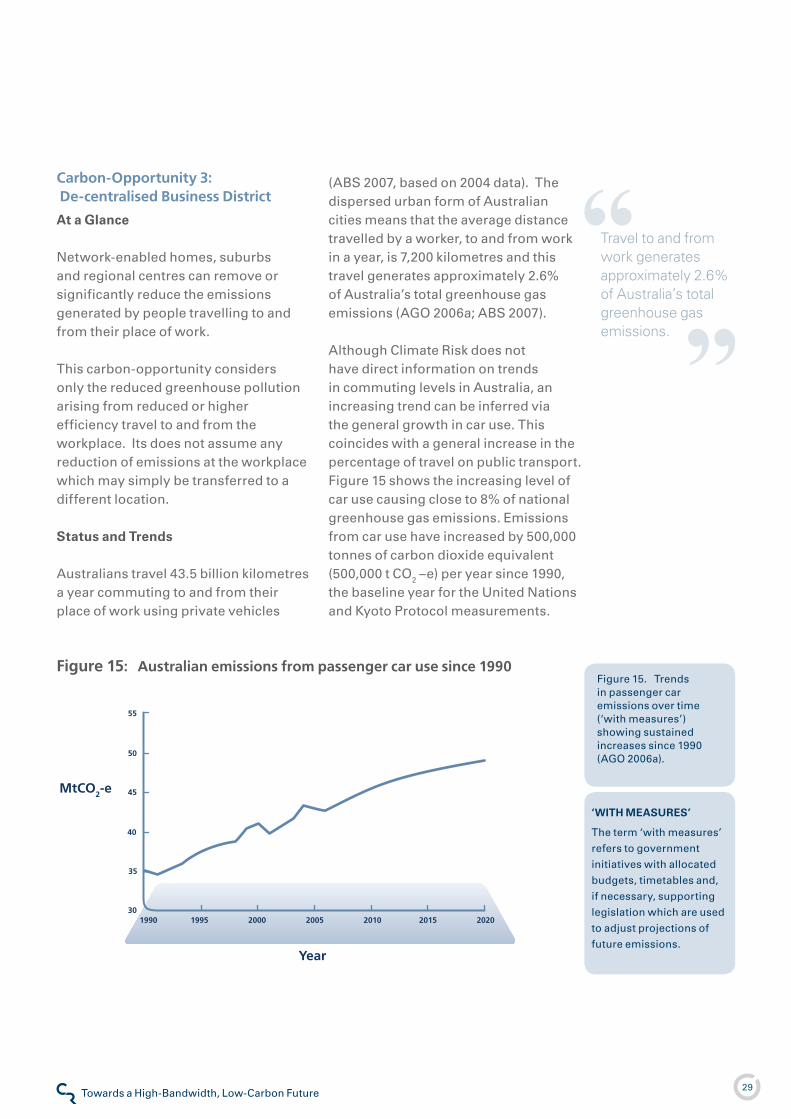
�9Towards a High-Bandwidth, Low-Carbon FutureClimate Risk
1990 1995 2000 2005 2010 2015 2020
55
30
35
40
45
50
MtCO2-e
Year
Figure �5. Trends in passenger car emissions over time (‘with measures’) showing sustained increases since �990 (AGO �006a).
Travel to and from work generates approximately 2.6% of Australia’s total greenhouse gas emissions.
Figure 15: Australian emissions from passenger car use since 1990
Carbon-Opportunity 3: De-centralised Business District
At a Glance
Network-enabled homes, suburbs and regional centres can remove or significantly reduce the emissions generated by people travelling to and from their place of work.
This carbon-opportunity considers only the reduced greenhouse pollution arising from reduced or higher efficiency travel to and from the workplace. Its does not assume any reduction of emissions at the workplace which may simply be transferred to a different location.
Status and Trends
Australians travel 43.5 billion kilometres a year commuting to and from their place of work using private vehicles
(ABS �007, based on �004 data). The dispersed urban form of Australian cities means that the average distance travelled by a worker, to and from work in a year, is 7,�00 kilometres and this travel generates approximately �.6% of Australia’s total greenhouse gas emissions (AGO �006a; ABS �007).
Although Climate Risk does not have direct information on trends in commuting levels in Australia, an increasing trend can be inferred via the general growth in car use. This coincides with a general increase in the percentage of travel on public transport. Figure �5 shows the increasing level of car use causing close to 8% of national greenhouse gas emissions. Emissions from car use have increased by 500,000 tonnes of carbon dioxide equivalent (500,000 t CO� –e) per year since �990, the baseline year for the United Nations and Kyoto Protocol measurements.
‘WiTH MEASuRES’
The term ‘with measures’
refers to government
initiatives with allocated
budgets, timetables and,
if necessary, supporting
legislation which are used
to adjust projections of
future emissions.
30Towards a High-Bandwidth, Low-Carbon FutureClimate Risk
JEVOnS’ PARADOXWilliam Stanley Jevons (�835-�88�) was an English
economist and logician who analysed the impacts of
the last Industrial Revolution. In The Coal Question
(�865) he maintained that technological efficiency
gains—specifically the more “economical” use of coal in
engines doing mechanical work—actually increased the
overall consumption of coal, iron, and other resources,
rather than “saving” them, as many claimed (Alcott
�005, p.9). As this outcome ran counter to Jevons’
intuition, it is known historically as ‘Jevons’ Paradox’.
The Carbon-Business Confluence
There is a direct carbon impact from the reduced use of vehicles for commuting. A direct value from reduced time spent by workers commuting also accrues either to the company or to the individual, and can be monetised in terms of the hourly rate that the person would otherwise earn for their time.
Australia is experiencing a skills and labour shortage across many sectors as a result of continued economic growth and an aging population. More flexible hours and locations of work can partly redress this shortage by enabling new workers previously excluded by the time barrier of commuting. The economy will benefit from the deployment of such additional resources in any labour-constrained market.
Reduced time spent commuting may encourage workers to relocate to regional centres. This has a secondary financial benefit to employers and employees in that it allows people to settle in places with lower housing prices than Australia’s major cities. This improves affordability, reduces wage pressures and results in more disposable income.
The Telecommunication network Opportunity
Telecommunication providers have many existing products and services that can reduce the time spent commuting, or can provide viable alternatives to physical commuting. The two solutions considered here are
teleworking and de-centralised working. We do not include traffic efficiency due to Jevons’ Paradox.
Telework:
Telework allows people to work from home or local business centres without the need to physically commute. According to the Australian Telework Advisory Committee (ATAC), telework is defined as:
“encompassing work arrangements which take place between a remote worker and a central business location, including where these arrangements:
involve a worker located at home, either as an employer connecting to a work location, or as a self-employed worker, connecting to clients; and are enabled by ICT, such as a PC and network connectivity; and occur within the context of the Australian economy (e.g. not
•
•
•
3�Towards a High-Bandwidth, Low-Carbon FutureClimate Risk
Empirical research suggests that teleworkers produce more work per hour than their work-based colleagues.
‘off-shoring’ or ‘time-shifting’ arrangements); and involve full-time, part-time or casual work; and occur within the context of an employment relationship; and are either formal or informal; and are voluntary or compulsory.” (ATAC �006, p.�4)
According to ATAC (2006), the benefits of telework typically include:
increased productivity,Decreased workplace costsFlexible work hours (e.g. for the over-65 age group),Removal of distance as a barrier to employment,increased opportunities for people with disabilities,Decreased travel times, costs and emissions.
A quarter of the 9.5 million people in the workforce work at least some of their hours from home (ABS �007). Of the 7�5,000 people who identify themselves as ‘working from home’, only about �95,000 are employees, the remainder being small business owner-managers. Teleworking creates an important overlap between the home environment and the workplace, with consequent reductions in emissions as outlined above. Furthermore, empirical research suggests that teleworkers produce more work per hour than their work-based colleagues (ATAC �006).
The De-centralised Workplace:
A variation on teleworking is the ability of people to work not at home, but
•
•
••
•••
•
•
•
close to home at a ‘telework centre’ or regional centre. This workplace decentralisation yields considerably reduced commuting distances, travel time and transport emissions. For example, the average commute time in Sydney is 4.7 hours per week, compared to �.9 hours per week for the rest of NSW (MIAESR �00�). Furthermore, the lower levels of traffic should increase vehicle speeds and efficiencies.
Broadband can serve to counteract these ‘lost hours’ commuting by enabling people to live and work in smaller towns, cities or suburbs (with much lower commuting requirements), while continuing to work for city-based national and international employers. This may involve the use of multi-occupant business centres, or regional offices for larger businesses. In other cases, whole departments can be moved to regional centres.
All of these changes hinge on the ability to move large volumes of data, voice and video between regional centres, suburbs and cities. The richness of the experiences will increasingly be enhanced by higher-end services such as ‘in person’ quality conferencing facilities. The economic opportunities to reinvigorate widely dispersed regional centres through teleworking and de-centralised workplaces are obviously linked to the quality and extent of the broadband network.
Challenges and Barriers
Some barriers to teleworking and regional relocation are non-technical. According to ATAC (�006) the main
3�Towards a High-Bandwidth, Low-Carbon FutureClimate Risk
East Midlands Electricity (EME), united Kingdom
EME is an electricity distribution firm in the East Midlands, UK. Approximately
�50 of its 469 staff at the Pegasus building telework � to 5 days per week, resulting
in considerable savings for both the employer and employees. Due to the high
telework uptake, EME reduced its amount of office space, currently at a premium,
saving the company approximately $A�70,0006 per year. The workers save
approximately $A 40 per week and an average of �0 hours each per week in
commuting time. In total, an average of 38,000 km per week was saved by the �50
teleworkers (Hopkins & James �00�).
Malta information Technology and Training Services Ltd , Malta
In Malta, an information technology service has utilised a hybrid approach to
telework to maximise the opportunities and overcome challenges associated
with telework. Malta Information Technology and Training Services Ltd (MITTS)
decided on a three-day-telework, two-day-office program with its staff. This way
they have managed to retain skilled working mothers who could not commit to a
full-time office-based working week (ETC �007).
REAL WORLD EXAMPLES
6 Based on � GBP = �.7 AUD
The average commute time in Sydney is 4.7 hours per week, compared to 2.9 hours per week for the rest of NSW (MIAESR 2002).
barriers to telework implementation are:
The trust-based relationship between employee and employer,The monitoring and supervision of employees, Insurance, ICT costs, Isolation, and Cultural resistance.
•
•
••••
33Towards a High-Bandwidth, Low-Carbon FutureClimate Risk
The transport sector accounts for approximately 13.5 percent of annual net greenhouse emissions.
Carbon-Opportunity 4: Personalised Public Transport
At a Glance
Wireless-broadband can facilitate public transport on demand. Personalised Public Transport allows the user to order public transport provided by an integrated network of multi-occupant taxis, minibuses, buses and trains, which starts at the front door (multi-modal transport). The personal efficiency of Personalised Public Transport can exceed that of using the private car, with faster speeds door-to-door, greater flexibility and lower costs.
Status and Trends
Australia’s tyranny of distance and dispersed settlement patterns have led to a reliance on motor vehicles (Alexander �000). The transport sector accounts for approximately �4% of annual net greenhouse emissions (AGO �007b). Further, it is anticipated that under a business-as-usual scenario, private vehicle use and emissions will continue to increase significantly, with �3% growth between �005 and �0�0 (AGO �006a).
Private Transport: Since the �950s, Australia has experienced considerable growth in private car ownership and kilometres travelled (ABS �007). According to the Australian Bureau of Statistics, the majority of private transport is used for commuting to and from work, as well as personal travel such as school runs and shopping (ABS �007). Three-quarters of Australian
commuters use their car to get to work, and of these only 4% share the car with anyone else (ABS �007).
While recent increases in the cost of fuel have made a minor impact on private vehicle kilometres travelled, there continues to be a strong positive trend in private vehicle use (Figure �5). The current greenhouse gas emissions from this sector are expected to grow from 43 MtCO�–e in �005 to 49 MtCO�–e in �0�0, a 39 % increase on �990 levels (AGO �006a). Researchers identify that a combination of demand-side management, supply-side management and behavioural change is required to significantly reduce transport emissions (Cervero �00�).
Public Transport: Public transport use has varied in recent history, and stabilised to a constant ��% between �000 and �003 (ABS �007). Although there has been a recent spike in public transport use from increased fuel price (ABS �007), Australia’s dispersed settlement pattern has limited the viable public transport services to hub-and-spoke options, i.e. in and out of the city with poor intra- and inter-suburb services. In order to improve public transport use, there needs to be an improvement in the ‘personal efficiency’ of public transport options, such as increased frequency of services and across-town options (suburb-to-suburb, rather than suburb-to-city: Mees �000).
Transit Orientated Design: Throughout Australia there is an increasing trend towards regional transport planning that incorporates Transit Oriented
34Towards a High-Bandwidth, Low-Carbon FutureClimate Risk
Design (TOD), in which dense mixed-use activity centres are connected by frequent transport services (OUM & SEQROC �005; V.DSE �005). Low-density sprawling Australian neighbourhoods do not encourage the provision of such services to areas outside the TOD catchment without incurring significant running costs.
The Carbon-Business Confluence
A range of potential ICT-based solutions exists to reduce private transport use and improve vehicle energy efficiencies. These include facilitating telework options discussed earlier.
The carbon-business case presented below is based on the opportunity to facilitate new or changed services that improve the personal efficiency of public transport to the consumer, exceeding the relative value of personal car use.
There are other opportunities that include web-based intelligence to increase car pooling and therefore the net efficiency of car use and smart traffic-flow monitoring (GoLoco �007). There is a strong business case for an existing internet company or council to create a web-based clearing house for car pooling. This report has not pursued traffic flow alternatives which could be improved by network applications, because improved traffic flow and efficiency lead to increased levels of traffic with little or no net greenhouse emission benefit (Jevon’s Paradox).
The Telecommunications/iT industry Opportunity
The opportunity identified here is the application of ICT-facilitated Personalised Public Transport in high and medium density urban areas to allow a reduction in car use in favour of lower emission travel options.
Personalised Public Transport is the provision of on-call public transport vehicles which act as feeders to Transit Oriented Developments (TODs), using integrated modes of local mini-buses, suburb-to-suburb links, high-speed express buses, trains and multi-occupant taxi services. The integration reduces travel and wait-times and increases the economies of scale for specialised services such as express commuter trains and buses, as well as suburb-to-suburb inter-connection.
The net effect of PPT is:
Increased flexibility for the customer,
Reduced waiting times for the customer,
Increasing the use of public transport within the catchment,
More frequent services,
Higher speed arterial services,
Increased commercial viability of all transport suppliers.
•
•
•
•
•
•
35Towards a High-Bandwidth, Low-Carbon FutureClimate Risk
REAL WORLD EXAMPLES
Brisbane City Council
Brisbane City Council is currently trialling a limited PPT system which operates
outside the Translink network. Through an agreement with Black and White Cabs
Pty Ltd, maxi cabs travel along a fixed route every �5-30 minutes in five subburbs
to provide commuters easy acces to and from their local train stations, bus
interchanges and shopping centre. The service only runs during peak hour and the
costs the commuter $� for each trip (Brisbane City Council �007).
MobiSoft
Technology already exists for the facilitation of personalised public transport.
MobiSoft, a Finnish software company, has developed software for transport
providers which:
“enables total management of incoming requests, offers real-time map-based
route design as well as scheduling and capacity management, such as making sure
the proper vehicle is sent to the customer. Mobile phone networks are used for fast
and reliable data transfer, meaning that the system can be immediately deployed,
eliminating the need for expensive equipment investments and lengthy delivery
and deployment times.” (MobiSoft �007)
Research is also currently underway to provide personalised public transport using
automated, driverless vehicles. Capoco (�007) have developed the Mobilicity
project. Mobilicity is a demand-responsive driverless personalised public transport
system which uses hybrid electric vehicles to act as transport feeders to main trunk
public transport lines and is beginning trials at the Shanghai Expo in �0�0 and
London Olympic Games in �0��.
Challenges and Barriers
The barriers to the uptake of public transport in general would also be a barrier to network enabled PPT and include imbalances in tax and corporate incentives, traffic access and prioritisation as well as funding for major public transport infrastructure.
The premise is that the barriers to non-car travel are based on personal efficiency. Currently, even though a bus trip may be significantly less costly than car-based commuting and personal travel, the net time spent waiting and travelling and the value of that time to the person reverses the overall cost-benefit balance in favour of the car.
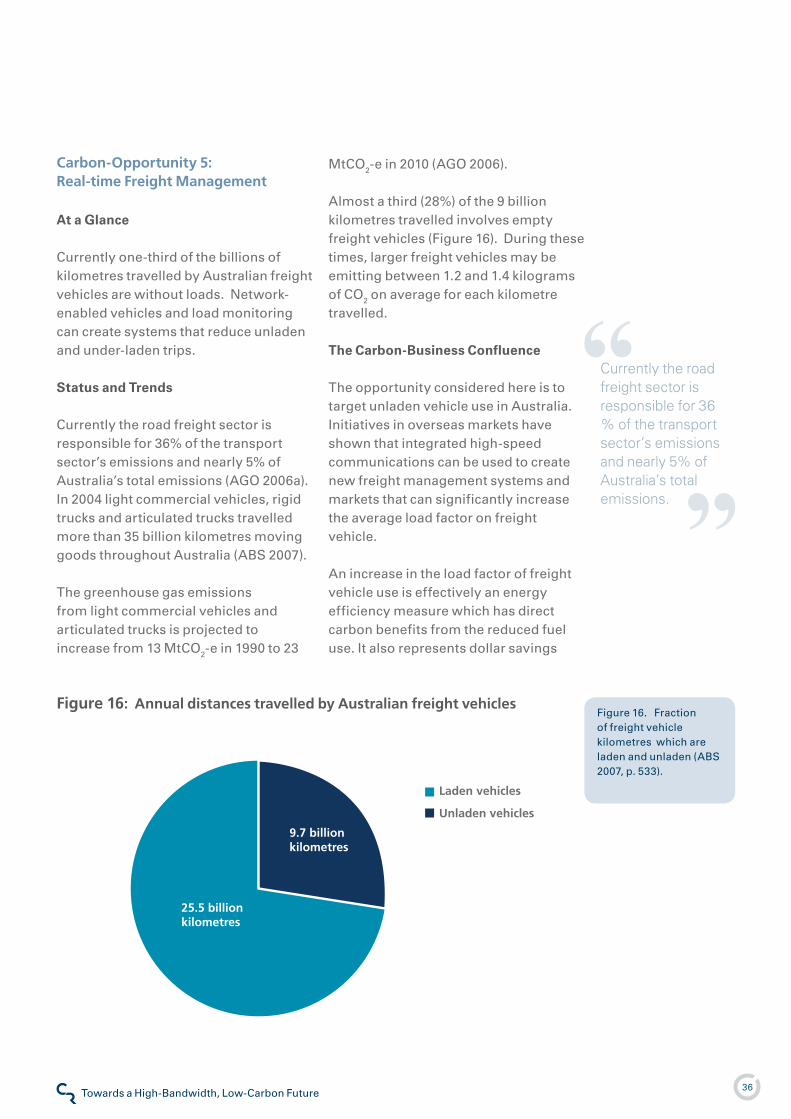
36Towards a High-Bandwidth, Low-Carbon FutureClimate Risk
9.7 billion kilometres
25.5 billion kilometres
Laden vehicles
Unladen vehicles
Figure �6. Fraction of freight vehicle kilometres which are laden and unladen (ABS �007, p. 533).
Figure 16: Annual distances travelled by Australian freight vehicles
Currently the road freight sector is responsible for 36 % of the transport sector’s emissions and nearly 5% of Australia’s total emissions.
Carbon-Opportunity 5: Real-time Freight Management
At a Glance
Currently one-third of the billions of kilometres travelled by Australian freight vehicles are without loads. Network-enabled vehicles and load monitoring can create systems that reduce unladen and under-laden trips.
Status and Trends
Currently the road freight sector is responsible for 36% of the transport sector’s emissions and nearly 5% of Australia’s total emissions (AGO �006a). In �004 light commercial vehicles, rigid trucks and articulated trucks travelled more than 35 billion kilometres moving goods throughout Australia (ABS �007).
The greenhouse gas emissions from light commercial vehicles and articulated trucks is projected to increase from �3 MtCO�-e in �990 to �3
MtCO�-e in �0�0 (AGO �006).
Almost a third (�8%) of the 9 billion kilometres travelled involves empty freight vehicles (Figure �6). During these times, larger freight vehicles may be emitting between �.� and �.4 kilograms of CO� on average for each kilometre travelled.
The Carbon-Business Confluence
The opportunity considered here is to target unladen vehicle use in Australia. Initiatives in overseas markets have shown that integrated high-speed communications can be used to create new freight management systems and markets that can significantly increase the average load factor on freight vehicle.
An increase in the load factor of freight vehicle use is effectively an energy efficiency measure which has direct carbon benefits from the reduced fuel use. It also represents dollar savings
37Towards a High-Bandwidth, Low-Carbon FutureClimate Risk
REAL WORLD EXAMPLE
Mercedes-Benz FleetBoard, working with Software AG, has recently developed an
internet-based fleet management system whereby information between forwarders
and carriers can be shared in real-time �4 hours a day, seven days a week.
The system allows the freight forwarder to enter information on to a web-based
platform which assigns orders to individual vehicles. The information is sent via SMS
to the vehicle’s in-cab screen, allowing the driver to accept or reject the assignment
based on timing or congestion issues. The end result is that there are less unladen
vehicle trips, saving considerable time and money for both the forwarder and carrier.
Furthermore, all of the information can be stored for future analysis of route planning
(Software AG �007).
Almost a third of the kilometres travelled by Australian freight fleets is wasted on empty trips.
which could accrue between freight handlers, third-party freight managers and the freight customer. Such a large percentage (�8%) of current and projected unladen kilometres travelled presents an opportunity for telecommunications providers and the freight industry to facilitate considerable greenhouse gas emission reductions.
There are also non-carbon financial benefits due to the reduced capital stock required, reduced vehicle wear, and reduced on-road costs (such as taxation).
The Telecommunications/iCT industry Opportunity
The opportunity we identify here is the application of ICT-facilitated Real-time Freight Management, which goes beyond typical in-house options undertaken by conventional freight businesses.
Use of mobile data networks to facilitate real-time solutions would allow freight brokers to identify loads, vehicle locations, destinations and load status in order to offer freight to empty or partially laden vehicles. Furthermore, it is also possible to provide best
route options using GPS technology, providing the carrier with the shortest routes for the load pick-up and delivery.
The anticipated cost savings for the freight carrier would allow freight brokers (or third-party network providers) to capture a price for the service. The service would be particularly useful for owner-operator carriers who do not have the capacity or resources for an integrated management system.
Many businesses throughout the world have recognised that unladen freight vehicles kilometres reduce profitability and have attempted to manage this cost in a variety of ways using ICT platforms. Moreover, as Radio Frequency Identification (RFID) tagging of goods increases, it is possible that more precise savings can be utilised.
Challenges and Barriers
The major barriers to the deployment of such a solution would be the necessary tagging, monitoring and clearing-house infrastructure. The system lends itself to collaboration with a third-party logistics partner.
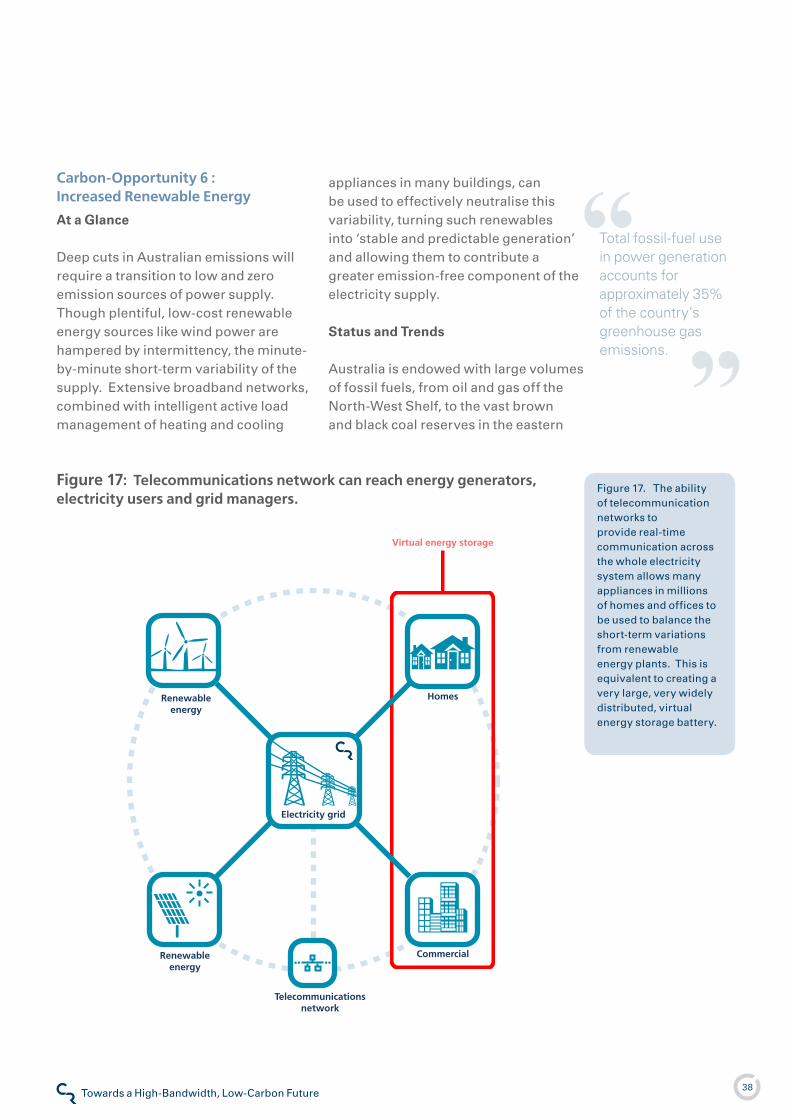
38Towards a High-Bandwidth, Low-Carbon FutureClimate Risk
Carbon-Opportunity 6 : Increased Renewable Energy
At a Glance
Deep cuts in Australian emissions will require a transition to low and zero emission sources of power supply. Though plentiful, low-cost renewable energy sources like wind power are hampered by intermittency, the minute-by-minute short-term variability of the supply. Extensive broadband networks, combined with intelligent active load management of heating and cooling
appliances in many buildings, can be used to effectively neutralise this variability, turning such renewables into ‘stable and predictable generation’ and allowing them to contribute a greater emission-free component of the electricity supply.
Status and Trends
Australia is endowed with large volumes of fossil fuels, from oil and gas off the North-West Shelf, to the vast brown and black coal reserves in the eastern
Total fossil-fuel use in power generation accounts for approximately 35% of the country’s greenhouse gas emissions.
Figure �7. The ability of telecommunication networks to provide real-time communication across the whole electricity system allows many appliances in millions of homes and offices to be used to balance the short-term variations from renewable energy plants. This is equivalent to creating a very large, very widely distributed, virtual energy storage battery.
Figure 17: Telecommunications network can reach energy generators, electricity users and grid managers.
Commercial
Homes
Renewableenergy
Renewableenergy
Virtual energy storage
Telecommunications network
Electricity networkElectricity grid
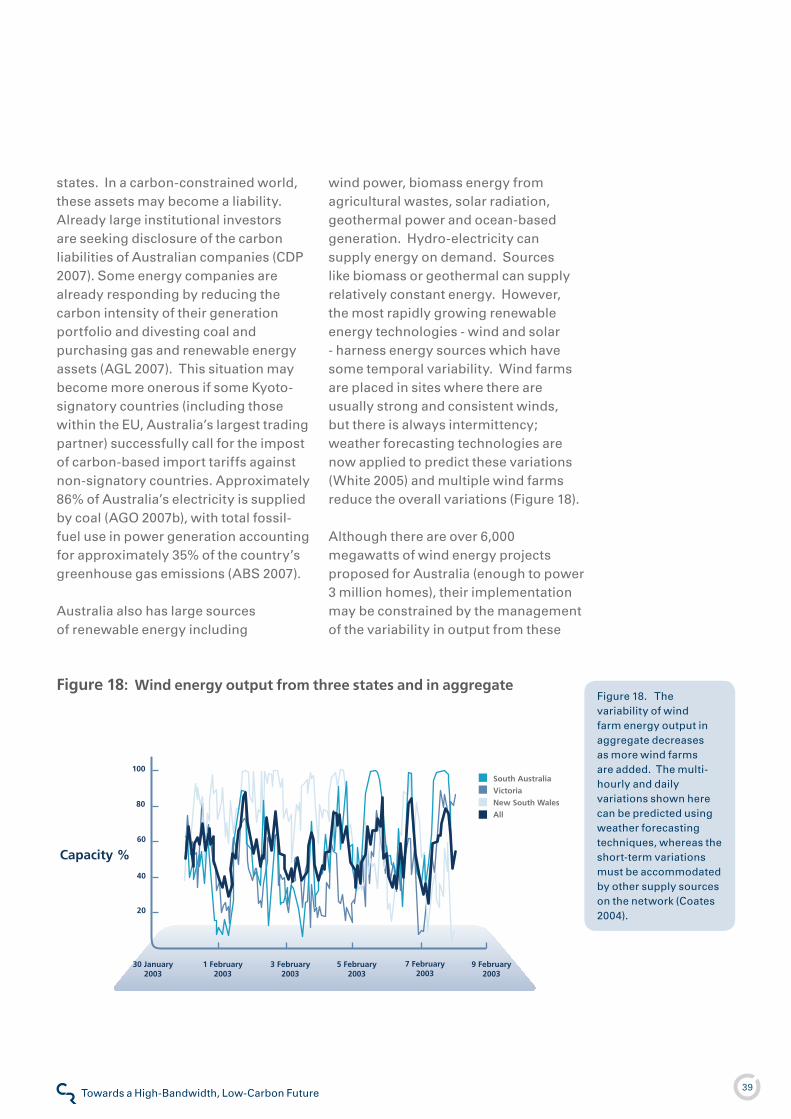
39Towards a High-Bandwidth, Low-Carbon FutureClimate Risk
Figure �8. The variability of wind farm energy output in aggregate decreases as more wind farms are added. The multi-hourly and daily variations shown here can be predicted using weather forecasting techniques, whereas the short-term variations must be accommodated by other supply sources on the network (Coates �004).
Capacity %
30 January 2003
3 February2003
5 February2003
7 February2003
9 February2003
1 February2003
100
80
60
40
20
South Australia
Victoria
New South Wales
All
Figure 18: Wind energy output from three states and in aggregate
states. In a carbon-constrained world, these assets may become a liability. Already large institutional investors are seeking disclosure of the carbon liabilities of Australian companies (CDP �007). Some energy companies are already responding by reducing the carbon intensity of their generation portfolio and divesting coal and purchasing gas and renewable energy assets (AGL �007). This situation may become more onerous if some Kyoto-signatory countries (including those within the EU, Australia’s largest trading partner) successfully call for the impost of carbon-based import tariffs against non-signatory countries. Approximately 86% of Australia’s electricity is supplied by coal (AGO �007b), with total fossil-fuel use in power generation accounting for approximately 35% of the country’s greenhouse gas emissions (ABS �007).
Australia also has large sources of renewable energy including
wind power, biomass energy from agricultural wastes, solar radiation, geothermal power and ocean-based generation. Hydro-electricity can supply energy on demand. Sources like biomass or geothermal can supply relatively constant energy. However, the most rapidly growing renewable energy technologies - wind and solar - harness energy sources which have some temporal variability. Wind farms are placed in sites where there are usually strong and consistent winds, but there is always intermittency; weather forecasting technologies are now applied to predict these variations (White �005) and multiple wind farms reduce the overall variations (Figure �8).
Although there are over 6,000 megawatts of wind energy projects proposed for Australia (enough to power 3 million homes), their implementation may be constrained by the management of the variability in output from these
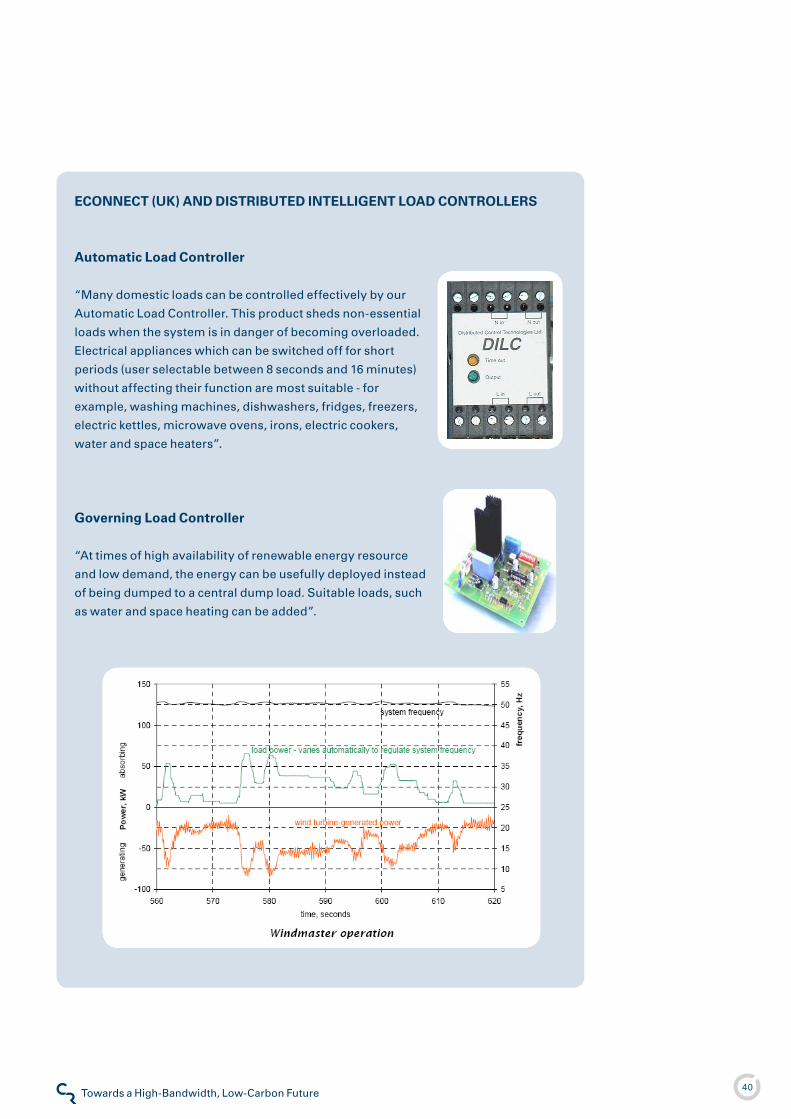
40Towards a High-Bandwidth, Low-Carbon FutureClimate Risk
ECOnnECT (uK) AnD DiSTRiBuTED inTELLiGEnT LOAD COnTROLLERS
Automatic Load Controller
“Many domestic loads can be controlled effectively by our
Automatic Load Controller. This product sheds non-essential
loads when the system is in danger of becoming overloaded.
Electrical appliances which can be switched off for short
periods (user selectable between 8 seconds and �6 minutes)
without affecting their function are most suitable - for
example, washing machines, dishwashers, fridges, freezers,
electric kettles, microwave ovens, irons, electric cookers,
water and space heaters”.
Governing Load Controller
“At times of high availability of renewable energy resource
and low demand, the energy can be usefully deployed instead
of being dumped to a central dump load. Suitable loads, such
as water and space heating can be added”.
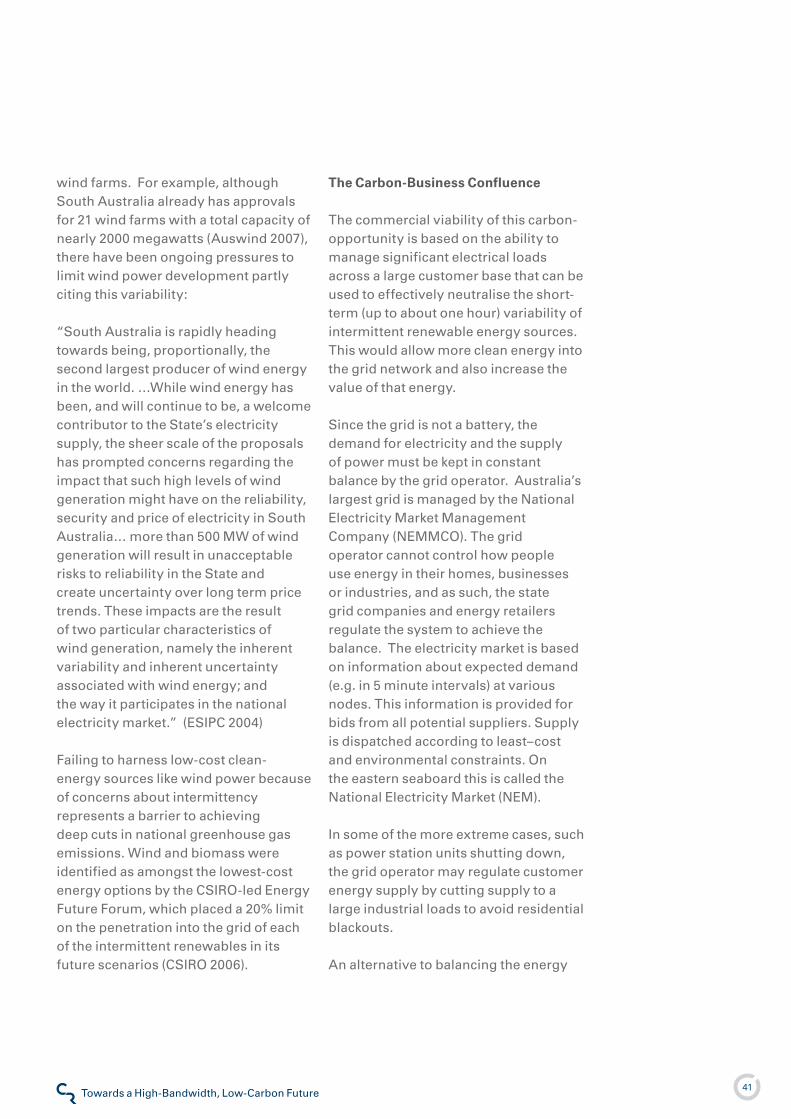
4�Towards a High-Bandwidth, Low-Carbon FutureClimate Risk
wind farms. For example, although South Australia already has approvals for �� wind farms with a total capacity of nearly �000 megawatts (Auswind �007), there have been ongoing pressures to limit wind power development partly citing this variability:
“South Australia is rapidly heading towards being, proportionally, the second largest producer of wind energy in the world. …While wind energy has been, and will continue to be, a welcome contributor to the State’s electricity supply, the sheer scale of the proposals has prompted concerns regarding the impact that such high levels of wind generation might have on the reliability, security and price of electricity in South Australia… more than 500 MW of wind generation will result in unacceptable risks to reliability in the State and create uncertainty over long term price trends. These impacts are the result of two particular characteristics of wind generation, namely the inherent variability and inherent uncertainty associated with wind energy; and the way it participates in the national electricity market.” (ESIPC �004)
Failing to harness low-cost clean-energy sources like wind power because of concerns about intermittency represents a barrier to achieving deep cuts in national greenhouse gas emissions. Wind and biomass were identified as amongst the lowest-cost energy options by the CSIRO-led Energy Future Forum, which placed a �0% limit on the penetration into the grid of each of the intermittent renewables in its future scenarios (CSIRO �006).
The Carbon-Business Confluence
The commercial viability of this carbon-opportunity is based on the ability to manage significant electrical loads across a large customer base that can be used to effectively neutralise the short-term (up to about one hour) variability of intermittent renewable energy sources. This would allow more clean energy into the grid network and also increase the value of that energy.
Since the grid is not a battery, the demand for electricity and the supply of power must be kept in constant balance by the grid operator. Australia’s largest grid is managed by the National Electricity Market Management Company (NEMMCO). The grid operator cannot control how people use energy in their homes, businesses or industries, and as such, the state grid companies and energy retailers regulate the system to achieve the balance. The electricity market is based on information about expected demand (e.g. in 5 minute intervals) at various nodes. This information is provided for bids from all potential suppliers. Supply is dispatched according to least–cost and environmental constraints. On the eastern seaboard this is called the National Electricity Market (NEM).
In some of the more extreme cases, such as power station units shutting down, the grid operator may regulate customer energy supply by cutting supply to a large industrial loads to avoid residential blackouts.
An alternative to balancing the energy
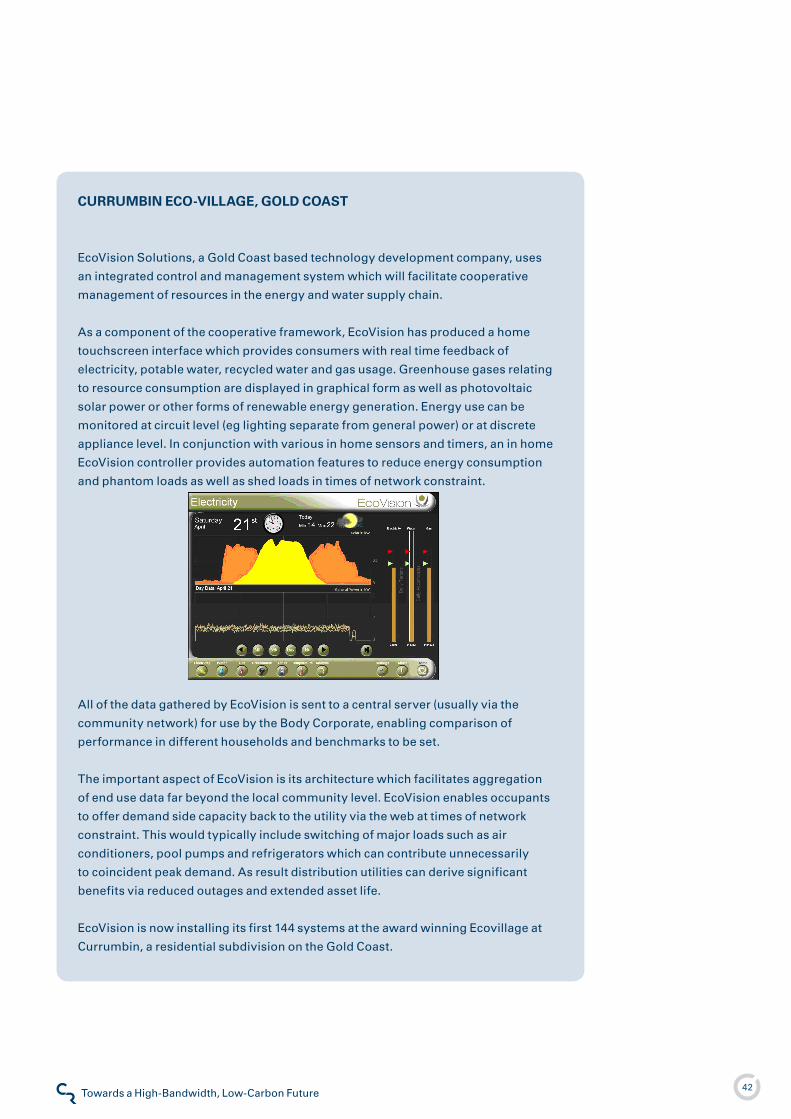
4�Towards a High-Bandwidth, Low-Carbon FutureClimate Risk
CuRRuMBin ECO-ViLLAGE, GOLD COAST
EcoVision Solutions, a Gold Coast based technology development company, uses
an integrated control and management system which will facilitate cooperative
management of resources in the energy and water supply chain.
As a component of the cooperative framework, EcoVision has produced a home
touchscreen interface which provides consumers with real time feedback of
electricity, potable water, recycled water and gas usage. Greenhouse gases relating
to resource consumption are displayed in graphical form as well as photovoltaic
solar power or other forms of renewable energy generation. Energy use can be
monitored at circuit level (eg lighting separate from general power) or at discrete
appliance level. In conjunction with various in home sensors and timers, an in home
EcoVision controller provides automation features to reduce energy consumption
and phantom loads as well as shed loads in times of network constraint.
All of the data gathered by EcoVision is sent to a central server (usually via the
community network) for use by the Body Corporate, enabling comparison of
performance in different households and benchmarks to be set.
The important aspect of EcoVision is its architecture which facilitates aggregation
of end use data far beyond the local community level. EcoVision enables occupants
to offer demand side capacity back to the utility via the web at times of network
constraint. This would typically include switching of major loads such as air
conditioners, pool pumps and refrigerators which can contribute unnecessarily
to coincident peak demand. As result distribution utilities can derive significant
benefits via reduced outages and extended asset life.
EcoVision is now installing its first �44 systems at the award winning Ecovillage at
Currumbin, a residential subdivision on the Gold Coast.
43Towards a High-Bandwidth, Low-Carbon FutureClimate Risk
supply on an ongoing basis is to manage the loads (demand-side management). In this way, a spike in demand of one megawatt can be matched by either a corresponding increase in supply of one megawatt, or a corresponding dip in demand of one megawatt somewhere else in the grid - sometimes referred to as ‘negawatt’ (Lovins �989). There are many electrical appliances in homes, offices and other buildings – especially heating and cooling applications - which are only mildly time-critical and can be managed to control loads with no loss of amenity to the customer. The conventional means to make these loads assist with grid management has focused on providing a price signal to customers using a ‘smart meter’ that can show the price of electricity varying though the day, but this is a slow and blunt instrument. A faster response could assist in the management of the short-term dynamics of renewable energy. Broadband unlocks the speeds of response required for such tasks.
The target loads that can be readily accessed by broadband are the ‘discretionary loads’. These are energy-consuming devices where the timing of energy use is less important. For example, it may be important that the temperature of a fridge stays between � and 4oC, but whether the fridge is on for one block of �0 minutes or two blocks of 5 minutes will make no difference to the fridge owner, but can play an important part in power management in the electricity network. The ability to control when discretionary loads operate creates a large, distributed load management tool. It is important to
note that the net energy use will be the same, but it is the ‘dynamic’ or ‘time shifting’ which is being harnessed.
The ability to manage discretionary consumer loads on a large scale with rapid speed unlocks the ability to actively manage variability in the grid in general, but particularly in the management of the intermittency in renewable energy supplies.
The Telecommunication networks Application
The opportunity we identify here is the application of broadband to the home and workplace, with broadband-enabled appliances, switches and sockets which can be easily installed in buildings.
Typical ‘discretionary loads’ in the home and workplace include:
Air conditioning,
Electric Heating,
Electric hot water systems or electric boosted solar hot water,
Refrigerators and freezers,
Devices on charge such as tools, laptop computers, wireless phones etc.
Most of these appliances work within user-defined ranges, such as the room temperature setting for an air conditioner. Third-party management of how the outcome is achieved is essentially invisible to the resident or
•
•
•
•
•
DynAMiC LOAD
MAnAGEMEnT
Some utilities use signals
over the electrical network
to turn domestic hot water
systems on and off. This
assists with their grid
management.
44Towards a High-Bandwidth, Low-Carbon FutureClimate Risk
worker and causes no loss of amenity.
The permission to exercise control could be assigned as part of the broadband supply contract and perhaps coupled with the promotion of third-party supply of externally controllable appliances (though this would lend itself to national standards legislation).
The NEM also has an ‘ancillary services’ market designed to maintain the supply availability and quality, and the load management system presented here may be suitable to bidding into these markets.
Challenges and Barriers
Critical elements of success include:
The volume of customers with devices and appliances under external management,
•
Customer trust in the management company to cause no loss of amenity,
External control of appliances – some, like hot water systems, can be controlled at the power outlet; others, like a fridge, need to be able to have the cooling turned on and off separately from internal lighting or timers,
The uptake of renewable energy is subject to carbon pricing and industry development mechanisms.
•
•
•
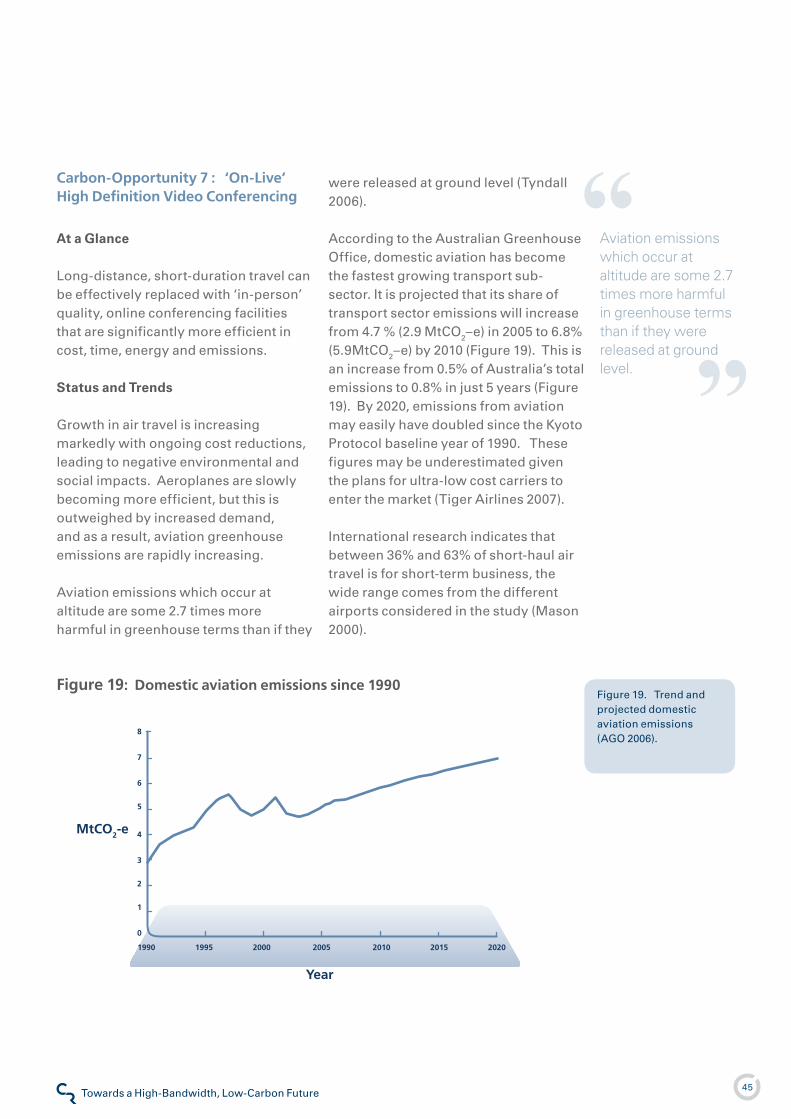
45Towards a High-Bandwidth, Low-Carbon FutureClimate Risk
1990 1995 2000 2005 2010 2015 2020
MtCO2-e
Year
Figure �9. Trend and projected domestic aviation emissions (AGO �006).
Figure 19: Domestic aviation emissions since 1990
Aviation emissions which occur at altitude are some 2.7 times more harmful in greenhouse terms than if they were released at ground level.
Carbon-Opportunity 7 : ‘On-Live’ High Definition Video Conferencing
At a Glance
Long-distance, short-duration travel can be effectively replaced with ‘in-person’ quality, online conferencing facilities that are significantly more efficient in cost, time, energy and emissions.
Status and Trends
Growth in air travel is increasing markedly with ongoing cost reductions, leading to negative environmental and social impacts. Aeroplanes are slowly becoming more efficient, but this is outweighed by increased demand, and as a result, aviation greenhouse emissions are rapidly increasing.
Aviation emissions which occur at altitude are some �.7 times more harmful in greenhouse terms than if they
were released at ground level (Tyndall �006).
According to the Australian Greenhouse Office, domestic aviation has become the fastest growing transport sub-sector. It is projected that its share of transport sector emissions will increase from 4.7 % (�.9 MtCO�–e) in �005 to 6.8% (5.9MtCO�–e) by �0�0 (Figure �9). This is an increase from 0.5% of Australia’s total emissions to 0.8% in just 5 years (Figure �9). By �0�0, emissions from aviation may easily have doubled since the Kyoto Protocol baseline year of �990. These figures may be underestimated given the plans for ultra-low cost carriers to enter the market (Tiger Airlines �007).
International research indicates that between 36% and 63% of short-haul air travel is for short-term business, the wide range comes from the different airports considered in the study (Mason �000).
46Towards a High-Bandwidth, Low-Carbon FutureClimate Risk
REAL WORLD EXAMPLECisco Systems, one developer of telepresence conferencing facilities, has offices
all over the world and a highly mobile workforce. Since adopting the technology
internally, the company has set a worldwide target of reducing its own air travel by
�0%. The Australian division of Cisco has already reduced air travel by �6% in less
than one year (Ross �007).
The Carbon-Business Confluence
In the medium to longer term, the high growth rates of 4% forecast by the aviation sector (Airservices Australia �006) are likely to be unsustainable, given fuel supply costs and expected carbon constraints.
Currently bunker fuels are excluded from restriction under the Kyoto Protocol. This is expected to change in the next commitment period, foreshadowed by emergent regulation in the EU (Bows & Anderson �005).
As regulatory risks increase overseas, this may impact on inbound and outbound long-haul travel as well as pricing structures in Australia.
There is a clear disharmony between the rapid growth of the aviation sector in Australia and overseas, and the pressure for carbon constraints.
There is significant potential for carbon abatement and commercial gain if telecommunication companies provide services offering equivalent contact for some aspects of business and personal aviation.
Telecommunications network Opportunity: ‘On-Live’ High Definition Video-Conferencing
Business air travel can be exceedingly time inefficient. High-value executives spend valuable hours and sometimes days in transit, a significant waste of human resources with a direct dollar value to their companies.
To effectively replace business travel it is important to recognise that 60% of communication between people is non-verbal, being contained in body language, gesture and expression. These elements are often lost by conventional teleconferencing where the body is not shown, definition is too low to capture detailed expression, and latency loses critical gestures.
Technology now available to Australian businesses has been designed to address these issues. Such high-end commercial systems (from Cisco and HP) have considerable bandwidth requirements. The potential savings of time, money and greenhouse gas emissions will increase the efficiency of many Australian companies.
AEROPLAnE EFFiCiEnCy
The aviation industry is
seeing new, more efficient,
aircraft enter the market.
The analysis herein
uses a �005 snapshot of
emissions which excludes
new initiatives announced
and launched since this
time, as well as the sectors
growth.
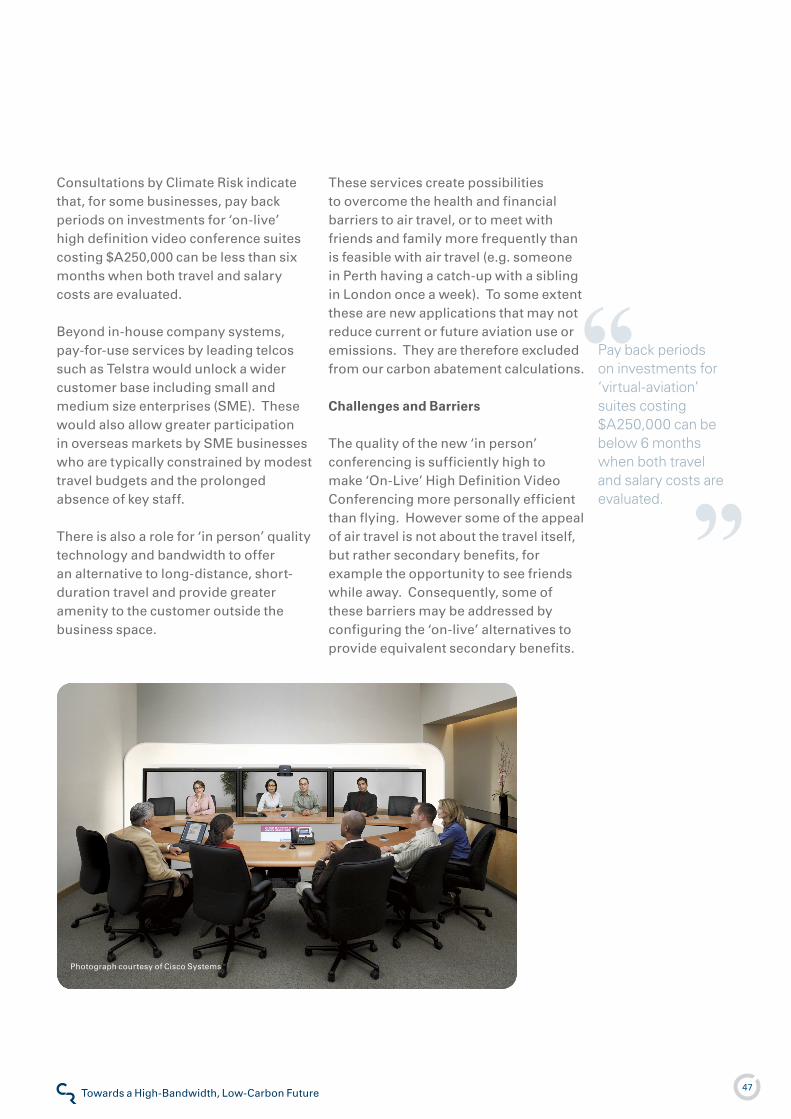
47Towards a High-Bandwidth, Low-Carbon FutureClimate Risk
Pay back periods on investments for ‘virtual-aviation’ suites costing $A250,000 can be below 6 months when both travel and salary costs are evaluated.
Consultations by Climate Risk indicate that, for some businesses, pay back periods on investments for ‘on-live’ high definition video conference suites costing $A�50,000 can be less than six months when both travel and salary costs are evaluated.
Beyond in-house company systems, pay-for-use services by leading telcos such as Telstra would unlock a wider customer base including small and medium size enterprises (SME). These would also allow greater participation in overseas markets by SME businesses who are typically constrained by modest travel budgets and the prolonged absence of key staff.
There is also a role for ‘in person’ quality technology and bandwidth to offer an alternative to long-distance, short-duration travel and provide greater amenity to the customer outside the business space.
These services create possibilities to overcome the health and financial barriers to air travel, or to meet with friends and family more frequently than is feasible with air travel (e.g. someone in Perth having a catch-up with a sibling in London once a week). To some extent these are new applications that may not reduce current or future aviation use or emissions. They are therefore excluded from our carbon abatement calculations.
Challenges and Barriers
The quality of the new ‘in person’ conferencing is sufficiently high to make ‘On-Live’ High Definition Video Conferencing more personally efficient than flying. However some of the appeal of air travel is not about the travel itself, but rather secondary benefits, for example the opportunity to see friends while away. Consequently, some of these barriers may be addressed by configuring the ‘on-live’ alternatives to provide equivalent secondary benefits.
Photograph courtesy of Cisco Systems
48Towards a High-Bandwidth, Low-Carbon FutureClimate Risk
Quantifying the Opportunities
Part 5
Remote Appliance Power Management
Data and Assumptions
The total annual net greenhouse gas emissions for Australia is 559.� MtCO�-e. (AGO �007b).
Total residential and commercial electricity consumption was �08,000 GWh per year (ABS �004 , ANZSIC divisions E-H and J-Q).
Estimated losses from standby power in residential and commercial sectors are 9.3 % (AGO �007b).
Emission intensity of electricity production is 0.94 tCO�-e per MWh (AGO �006b, p. �3).
The national average price of electricity to residential and non-residential customers is estimated herein as �0 cents per kilowatt hour (ESAA �004)7 .
Assumes broadband-based Remote Appliance Power Management solutions are used to reduce standby emissions by 50% in �/3 of Australian homes and commercial buildings.
7 ESAA �004, Electricity Prices in Australia �003/04. Electricity Supply Association of Australia
Results
(All figures are based on �005 data without growth)
The total reduction in standby emissions will be �.8 MtCO�-e per annum.
This emission reduction represents 0.33% of total net Australian emissions.
The value of the carbon abatement will be $�8 million, $36 million and $9� million at carbon prices of $�0, $�0 and $50 per tonne CO�-e respectively.
The avoided electricity purchase through application of Remote Appliance Power Management is �,700 GWh per year.
The value of the avoided electricity purchases at �0 cents per KWh is $�70 million per year.
�.
�.
3.
4.
5.
The carbon-opportunities are based on using either existing ICT networks or networks that will be rolled-out in due course regardless of any greenhouse gas benefits. Therefore the energy and emissions related to increased ICT use are not included within the emissions cost-benefit equations for each carbon-opportunity, but are instead included within the overall projections of increased national emissions (Figure �4).
BASELinE yEAR AnD
GROWTH
The Australian
government regularly
publishes a National
Greenhouse Gas
Inventory, the most
recent of which covered
emissions in �005. The
results presented herein
are generally calculated
based on this �005
‘snapshot’. Since national
emissions are growing it
has been assumed that
the relative contribution
of different sectors
remains unchanging and
therefore the abatement
as a percentage of
national emissions
remains constant post
�005. However, several
of the energy based
emissions sectors to
which these carbon
opportunities apply are
increasing their relative
proportion of national
emissions. Therefore,
the results presented can
be considered relatively
conservative, and the
actual abatement may be
considerably higher.
49Towards a High-Bandwidth, Low-Carbon FutureClimate Risk
8 ESAA �004, Electricity Prices in Australia �003/04. Electricity Supply Association of Australia
Presence-Based Power
Data and Assumptions
The total annual net greenhouse gas emissions for Australia is 559.� MtCO�-e (based on �005 figures in AGO �007b).
Total residential and commercial electricity consumption was �08,000 GWh per year (ABS �004 , ANZSIC divisions E-H and J-Q).
Emission intensity of electricity production is 0.94tCO�-e per MWh (AGO �006b).
The national average price of electricity to residential and non-residential customers is estimated as �0 cents per kilowatt hour (ESAA �004)8 .
Assumes that ‘orphaned’ energy consumed by appliances is �5% overall for residential and commercial energy consumption .
Assumes network enabled Presence-Based Power solutions are used to reduce ‘orphaned’ energy emissions by 50% in �/3 of Australian homes and commercial buildings.
Results
(All figures are based on �005 data without growth)
The total reduction in standby emissions will be �.97 MtCO�-e per annum.
This emission reduction represents 0.53% of total net Australian emissions.
The value of the carbon abatement will be $�9 million, $59 million and $�48 million at carbon prices of $�0, $�0 and $50 per tonne CO�-e respectively.
The avoided electricity purchase is �,700 GWh per year.
The value of the avoided electricity purchases at �0 cents per KWh is $�69 million per year.
�.
�.
3.
4.
5.
50Towards a High-Bandwidth, Low-Carbon FutureClimate Risk
De-centralised Business District
Data and Assumptions
The total annual net greenhouse gas emissions for Australia is 559.� MtCO�-e. (based on �005 figures in AGO �007b).
Total emissions from private transport (passenger car) were 43.7 MtCO�-e per year (AGO �007b).
The fraction of kilometres travelled used on commuting to and from work is 3�% (ABS �007).
The fraction of jobs that are amenable to telework is about 65% (ATAC �005c).
The emission intensity of � litre of liquid fuel is approximately �.5kGCO�-e per litre (AGO �006b).
The assumed cost of � litre of fuel is $A�.009.
Assumes that emissions for commuting in non-urban areas or within a suburb, is half of those of city based commuting (based on MIAESR �00� and assuming that for shorter distances non-car options also become more attractive).
Assumes that broadband-based telework is taken up by 50% of the employees who have telework suitable jobs and on average work one day per week from home.
Assumes that De-Centralised Workplaces are used by �0% of employees who have telework suitable jobs, and their commuting emissions are reduced by at least 50%.
9 This figure is high by historical values but low by current prices
Results
(All figures are based on �005 data without growth and consider reduced travel emissions only)
Annual reduction in emissions from telework will be 0.9� MtCO�-e.
This emission reduction from telework represents 0.�6% of total net Australian emissions.
The total reduction in emissions from the De-centralised Workplace will be �.� MtCO�-e p.a.
This emission reduction from De-centralised workplaces represents 0.39% of total net Australian emissions.
The total reduction in emissions from telework and the De-Centralised Workplace will be 3.09 MtCO�-e per annum.
This total emission reduction from telework and the de-centralised workplace represents 0.55% of total net Australian emissions.
The value of the carbon abatement will be $3� million, $6� million and $�54 million per year at carbon prices of $�0, $�0 and $50 per tonne CO�-e respectively.
The avoided fuel purchase is �.� billion litres per year.
The value of the avoided fuel purchases at $A� per litre is $�.� billion per year.
�.
�.
3.
4.
5.
6.
7.
8.
9.
5�Towards a High-Bandwidth, Low-Carbon FutureClimate Risk
Personalised Public Transport
Data and Assumptions
The total annual net greenhouse gas emissions for Australia is 559.�MtCO�-e (based on �005 figures in AGO �007b).
Total emissions from private transport (cars) are 43.7 MtCO�-e per year (AGO �007).
The emission intensity of � litre of liquid fuel is approximately �.5kGCO�-e per litre (AGO �006b).
The assumed cost of � litre of fuel is $A�.00.
The relative emission intensity of public transport is 90% lower than personal car travel in the urban environment.
Assumes that wireless broadband-facilitated Personalised Public Transport is able to capture �0% of car-based commuters�0.
�0 Assumes that a variety of vehicle options exist in order to optimise passenger vehicle size e.g. taxi for �-3 passengers through to a train for hundreds of passengers. Feeder bus services increase train ridership by enlarging the catchments significantly (Najafi & Nassar �990).
Results
(All figures are based on �005 data without growth)
The total reduction in transport emissions will be 3.93 MtCO�-e per annum.
This emission reduction represents 0.70% of total net Australian emissions.
The value of the carbon abatement will be $39 million, $79 million and $�00 million at carbon prices of $�0, $�0 and $50 per tonne CO�-e respectively.
The avoided fuel purchases through application of PPT is �.6 billion litres per year.
The value of the avoided fuel purchases at $A� per litre is $�.6 billion per year.
�.
�.
3.
4.
5.
5�Towards a High-Bandwidth, Low-Carbon FutureClimate Risk
Real-time Freight Management
Data and Assumptions
The total annual net greenhouse gas emissions for Australia is 559.� MtCO�-e. (based on �005 figures in AGO �007b).
Total emissions from freight transport are �6 MtCO�-e per year (AGO �007)�� .
The fraction of kilometres travelled by unladen freight vehicles is �8% (ABS �007).
The decrease in fuel use from unladen to laden is 40% (AGO �006c).
The emission intensity of � litre of liquid fuel is approximately �.7kGCO�-e per litre (AGO �006b).
The assumed cost of � litre of fuel is $A�.00.
Assumes that Real-time Freight Management effectively avoids �5% of unladen truck kilometres.
Results
(All figures are based on �005 data without growth)
The total reduction in emissions from Real-time Freight Management will be �.9 MtCO�-e per annum.
This emission reduction from Real-time Freight Management represents 0.5�% of total net Australian emissions.
The value of the carbon abatement will be $�9 million, $58 million and $�45 million per year at carbon prices of $�0, $�0 and $50 per tonne CO�-e respectively.
The avoided fuel purchase is �.� billion litres per year.
The value of the avoided fuel purchases at $A� per litre is $�.� billion per year.
�.
�.
3.
4.
5.
�� Freight figures include light commercial vehicles (LCVs), rigid trucks (including non-freight trucks such as fire engines) and articulated trucks.
53Towards a High-Bandwidth, Low-Carbon FutureClimate Risk
Increased Renewable Energy
Data and Assumptions
The total annual net greenhouse gas emissions for Australia is 559.� MtCO�-e. (based on �005 figures in AGO �007b).
Total residential and commercial electricity consumption was �08,000 GWh (ABS �004 , ANZSIC divisions E-H and J-Q).
Emission intensity of electricity production 0.94tCO�-e per MWh (AGO �006b, p. �3).
The Nominal capacity factor of intermittent renewable energy generation plants is 0.3 (Transition Institute �004).
The cost of large-scale, grid connected renewable energy is $80 per MWh (Transition Institute �004).
Assumes that one-third of homes and commercial buildings are broadband enabled and that they have agreed to have their discretionary (non-time-sensitive) loads managed by Telstra.
Assumes that on average, �5% of the total loads across residential and commercial buildings are discretionary at any one time.
Assumes that at a minimum, discretionary power is able to leverage the same average renewable energy capacity.
Assumes that the additional value of Increased Renewable Energy is �0% of the electricity production cost.
Results
Increased Renewable Energy would facilitate an additional ��,000 GWh of renewable energy production per year.
This is equivalent to 4.�GW of additional renewable energy capacity.
The emission abatement from avoided fossil fuel use would be �0.� MtCO�-e per year.
This emission reduction represents �.8% of total net Australian emissions.
The value of the carbon abatement will be $�0� million, $�0� million and $304 million at carbon prices of $�0, $�0 and $50 per tonne CO�-e respectively – however it is assumed that this is already included in the renewable energy pricing structure.
The value of renewable energy sales enabled by Increased Renewable Energy is $86 million per year.
�.
�.
3.
4.
5.
6.
54Towards a High-Bandwidth, Low-Carbon FutureClimate Risk
‘On-Live’ High Definition Video Conferencing
Data and Assumptions
The total annual net greenhouse gas emissions for Australia is 559.� MtCO�-e. (based on �005 figures in AGO �007b).
Total emissions from domestic aviation was 5.� MtCO�-e per year in �005 (AGO �007b).
Emissions from international aviation are approximately double that of domestic emissions (May �004).
The CO� emission per litre of aviation fuel is 3.�kg /litre (Aviation Environment Federation �007).
The nominal fuel efficiency of air travel is 0.035 litres per person per kilometre (IATA �007).
The estimated fraction of short haul travel due to business use is 45% (Mason �000).
The assumed cost per kilometre of business air travel in Australia is �0c per kilometre��.
Assumes one third of business travellers could replace a trip with an ‘On-Live’ meeting with high speed, high definition links.
�� By way of illustration this would be equivalent to a Melbourne-Sydney trip of about �000km costing $�00 including taxes.
Results
(All figures are based on �005 data without growth)
The total reduction in domestic aviation emissions will be 0.8 MtCO�-e per annum.
The total reduction in domestic and international aviation emissions will be �.4 MtCO� per annum.
This direct emission reduction is equivalent to 0.43% of total net Australian emissions.
The equivalent emissions reduction including ‘up-lift’ is 6.5 MtCO�-e per annum.
The value of the carbon abatement will be $�4 million, $48 million and $��0 million at carbon prices of $�0, $�0 and $50 per tonne CO�-e respectively.
The avoided fuel consumption is 960 million litres of aviation fuel per year.
The avoided spending on air travel through use of ‘On-Live’ High Definition Video Conferencing is $�.� billion.
�.
�.
3.
4.
5.
6.
7.
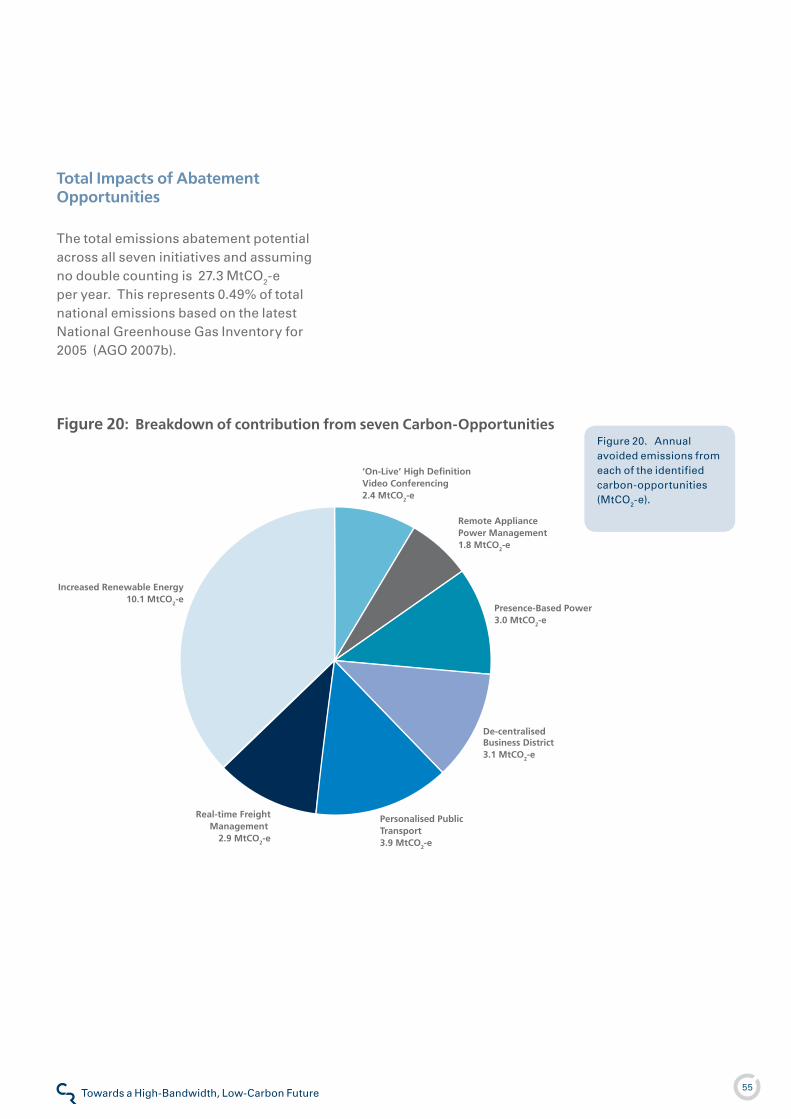
55Towards a High-Bandwidth, Low-Carbon FutureClimate Risk
Figure �0. Annual avoided emissions from each of the identified carbon-opportunities (MtCO�-e).
Total Impacts of Abatement Opportunities
The total emissions abatement potential across all seven initiatives and assuming no double counting is �7.3 MtCO�-e per year. This represents 0.49% of total national emissions based on the latest National Greenhouse Gas Inventory for �005 (AGO �007b).
Remote Appliance Power Management 1.8 MtCO2-e
Presence-Based Power 3.0 MtCO2-e
De-centralisedBusiness District3.1 MtCO2-e
Personalised Public Transport 3.9 MtCO2-e
Real-time Freight Management
2.9 MtCO2-e
Increased Renewable Energy10.1 MtCO2-e
‘On-Live’ High DefinitionVideo Conferencing2.4 MtCO2-e
Figure 20: Breakdown of contribution from seven Carbon-Opportunities
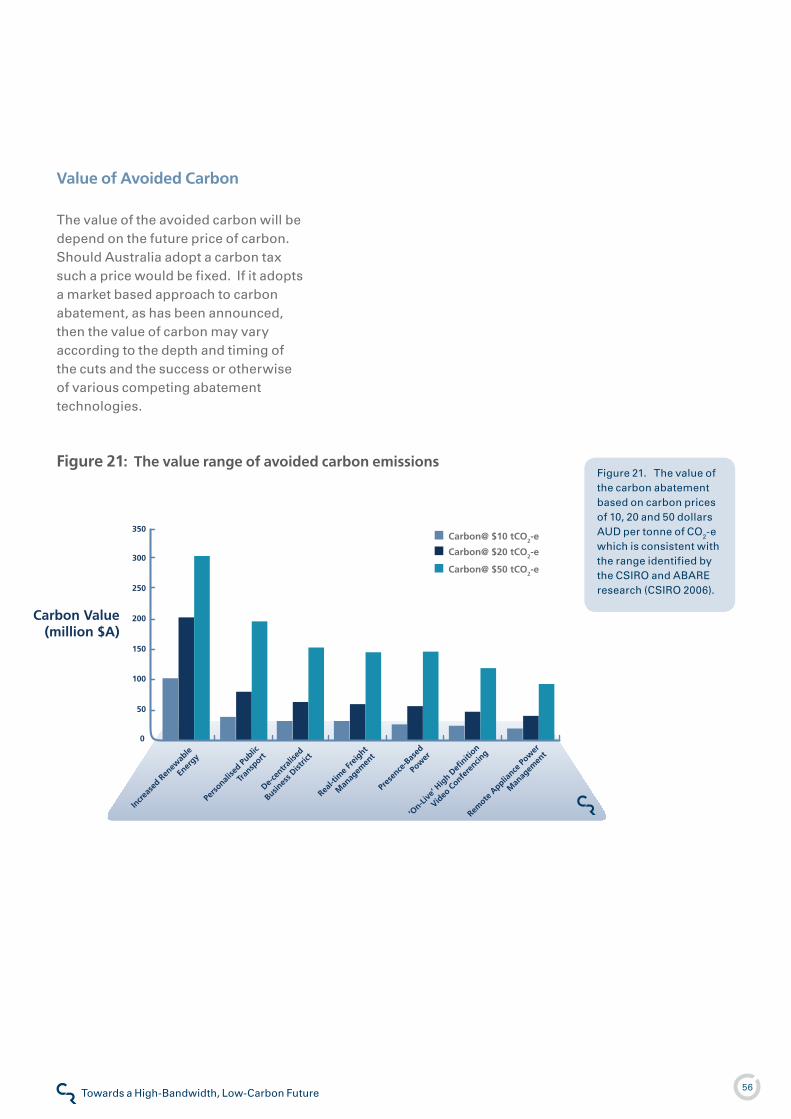
56Towards a High-Bandwidth, Low-Carbon FutureClimate Risk
Value of Avoided Carbon
The value of the avoided carbon will be depend on the future price of carbon. Should Australia adopt a carbon tax such a price would be fixed. If it adopts a market based approach to carbon abatement, as has been announced, then the value of carbon may vary according to the depth and timing of the cuts and the success or otherwise of various competing abatement technologies.
Pres
ence
-Bas
ed
Pow
er
Remote
Applia
nce Po
wer
Man
agem
ent
De-ce
ntralis
ed
Busines
s Dist
rict
‘On-Li
ve’ H
igh D
efiniti
on
Video
Confe
rencin
g
Incre
ased
Ren
ewab
le
Ener
gy
Real-t
ime F
reig
ht
Man
agem
ent
Perso
nalise
d Public
Tran
sport
200
150
100
50
0
350
250
300Carbon@ $20 tCO2-e
Carbon@ $50 tCO2-e
Carbon@ $10 tCO2-e
Carbon Value(million $A)
Figure ��. The value of the carbon abatement based on carbon prices of �0, �0 and 50 dollars AUD per tonne of CO�-e which is consistent with the range identified by the CSIRO and ABARE research (CSIRO �006).
Figure 21: The value range of avoided carbon emissions
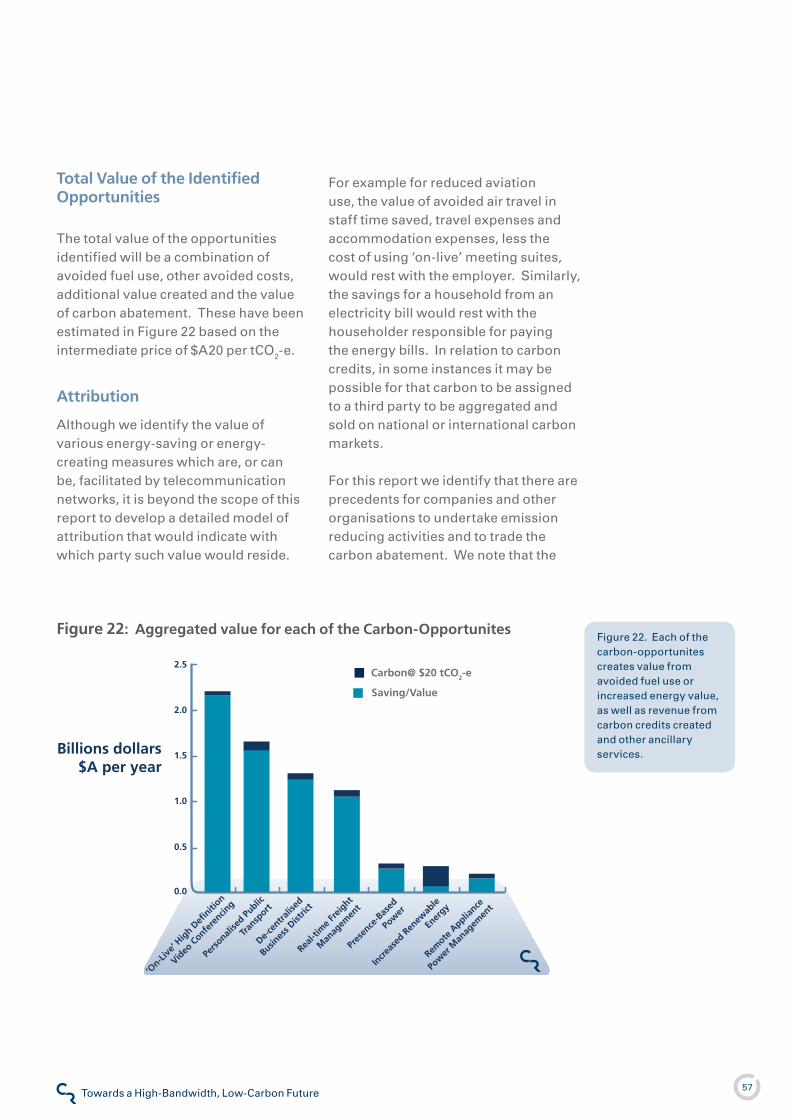
57Towards a High-Bandwidth, Low-Carbon FutureClimate Risk
Total Value of the Identified Opportunities
The total value of the opportunities identified will be a combination of avoided fuel use, other avoided costs, additional value created and the value of carbon abatement. These have been estimated in Figure �� based on the intermediate price of $A�0 per tCO�-e.
Attribution
Although we identify the value of various energy-saving or energy-creating measures which are, or can be, facilitated by telecommunication networks, it is beyond the scope of this report to develop a detailed model of attribution that would indicate with which party such value would reside.
For example for reduced aviation use, the value of avoided air travel in staff time saved, travel expenses and accommodation expenses, less the cost of using ‘on-live’ meeting suites, would rest with the employer. Similarly, the savings for a household from an electricity bill would rest with the householder responsible for paying the energy bills. In relation to carbon credits, in some instances it may be possible for that carbon to be assigned to a third party to be aggregated and sold on national or international carbon markets.
For this report we identify that there are precedents for companies and other organisations to undertake emission reducing activities and to trade the carbon abatement. We note that the
0.0
2.5
2.0
1.5
1.0
0.5
Pres
ence
-Bas
ed
Pow
er
Remote
Applia
nce
Pow
er M
anag
emen
t
De-ce
ntralis
ed
Busines
s Dist
rict
‘On-Li
ve’ H
igh D
efiniti
on
Video
Confe
rencin
g
Incre
ased
Ren
ewab
le
Ener
gy
Real-t
ime F
reig
ht
Man
agem
ent
Perso
nalise
d Public
Tran
sport
Saving/Value
Carbon@ $20 tCO2-e
Billions dollars$A per year
Figure ��. Each of the carbon-opportunites creates value from avoided fuel use or increased energy value, as well as revenue from carbon credits created and other ancillary services.
Figure 22: Aggregated value for each of the Carbon-Opportunites
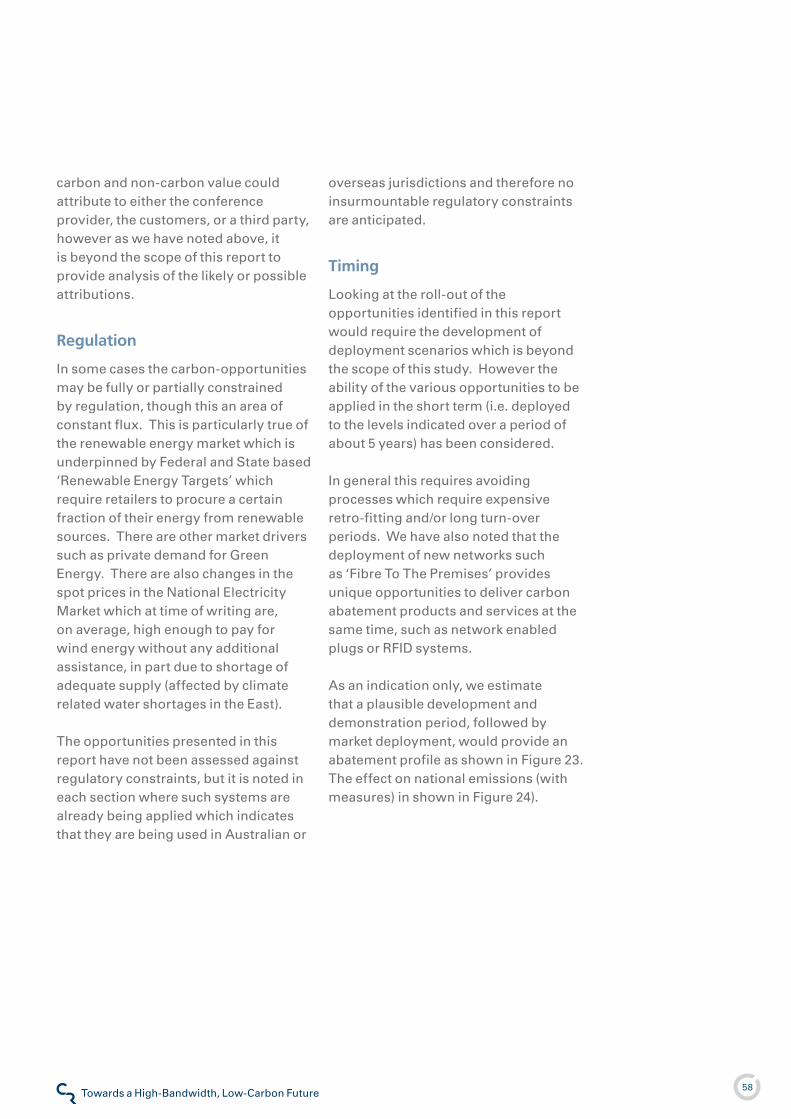
58Towards a High-Bandwidth, Low-Carbon FutureClimate Risk
carbon and non-carbon value could attribute to either the conference provider, the customers, or a third party, however as we have noted above, it is beyond the scope of this report to provide analysis of the likely or possible attributions.
Regulation
In some cases the carbon-opportunities may be fully or partially constrained by regulation, though this an area of constant flux. This is particularly true of the renewable energy market which is underpinned by Federal and State based ‘Renewable Energy Targets’ which require retailers to procure a certain fraction of their energy from renewable sources. There are other market drivers such as private demand for Green Energy. There are also changes in the spot prices in the National Electricity Market which at time of writing are, on average, high enough to pay for wind energy without any additional assistance, in part due to shortage of adequate supply (affected by climate related water shortages in the East).
The opportunities presented in this report have not been assessed against regulatory constraints, but it is noted in each section where such systems are already being applied which indicates that they are being used in Australian or
overseas jurisdictions and therefore no insurmountable regulatory constraints are anticipated.
Timing
Looking at the roll-out of the opportunities identified in this report would require the development of deployment scenarios which is beyond the scope of this study. However the ability of the various opportunities to be applied in the short term (i.e. deployed to the levels indicated over a period of about 5 years) has been considered.
In general this requires avoiding processes which require expensive retro-fitting and/or long turn-over periods. We have also noted that the deployment of new networks such as ‘Fibre To The Premises’ provides unique opportunities to deliver carbon abatement products and services at the same time, such as network enabled plugs or RFID systems.
As an indication only, we estimate that a plausible development and demonstration period, followed by market deployment, would provide an abatement profile as shown in Figure �3. The effect on national emissions (with measures) in shown in Figure �4).
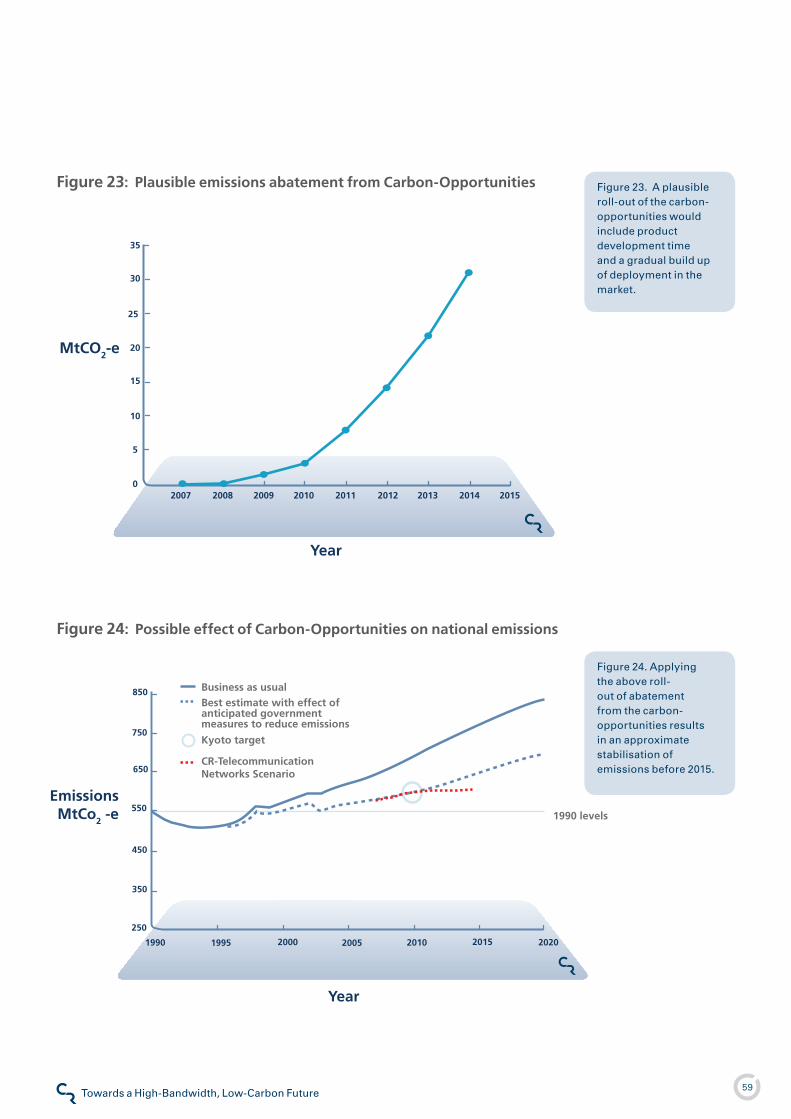
59Towards a High-Bandwidth, Low-Carbon FutureClimate Risk
2010200920082007 2011 2013 201520142012
30
0
5
10
15
20
25
35
Year
MtCO2-e
Figure �4. Applying the above roll-out of abatement from the carbon-opportunities results in an approximate stabilisation of emissions before �0�5.
Figure �3. A plausible roll-out of the carbon-opportunities would include product development time and a gradual build up of deployment in the market.
Figure 23: Plausible emissions abatement from Carbon-Opportunities
Figure 24: Possible effect of Carbon-Opportunities on national emissions
Year
1990 202020152010200520001995
850
250
350
450
550
650
750
EmissionsMtCo2 -e
Business as usualBest estimate with effect of anticipated government measures to reduce emissions
1990 levels
Kyoto target
CR-Telecommunication Networks Scenario
60Towards a High-Bandwidth, Low-Carbon FutureClimate Risk
Part 6
Beyond Carbon Neutral
This report goes significantly beyond ‘holding the line’ goals of corporate carbon neutrality and carbon. Instead it sets out a suite of opportunities that would allow telecommunications providers to play a leadership role in decarbonising the Australian economy and equipping the nation to prosper in a carbon constrained future. All of the strategies and opportunities are based on avoiding the release of fossil carbon into the atmosphere; they are not based on off-setting emissions.
Seven options are proposed to build on existing and next-generation networks. The realisation of opportunities outlined in this report would result in telecommunications providers assisting Australian businesses and households achieving total greenhouse gas reductions equivalent to approximately 4.9% of Australia’s total national emissions. Some of the opportunities identified in the consumer space can be achieved using existing network services and others are contingent on the roll-out of fibre to the node (FTTN) broadband infrastructure. Overall the initiatives identified in this report present the opportunity for one of the single largest reductions in Australia’s carbon footprint by an Australian corporation.
Companies seeking to maximise their carbon emission reduction could leverage the existing and next-generation networks already built by Telstra.
The Climate Challenge
The latest statement from the Intergovernmental Panel on Climate Change (IPCC �007) indicates the next ten years are critical in meeting the challenges posed by climate change. For the first time, scientists and governments are now agreed that global emissions must be stabilised by �0�5 if climate change is to be effectively addressed. Similarly the global economic Stern Review concluded that
“to stabilise at 450ppmii CO�-e, without overshooting, global emissions would need to peak in the next �0 years“ (Stern �006, p. �93). Reducing greenhouse emissions requires major commitments from both the public and private sectors as well as the government.
In �005 Australia’s net annual emissions totalled 559 mega-tonnes of CO� equivalent (MtCO�-e) from all activities, which equates to �.4% of the global total. In the short term, it appears that Australia will stay close to its Kyoto Protocol target of no more than an 8% increase above �990 emission levels (AGO �007b). However, the underlying trend is that Australian emissions will increase at about �.3% per year.
The use of fossil-fuels in stationary-energyiii and transport applications is the nation’s major source of emissions. The trend is not declining or stabilising, but continuing to grow significantly. If deep cuts in emissions are to be achieved, emissions from the energy sector are Australia’s greatest greenhouse challenge.
Conclusions
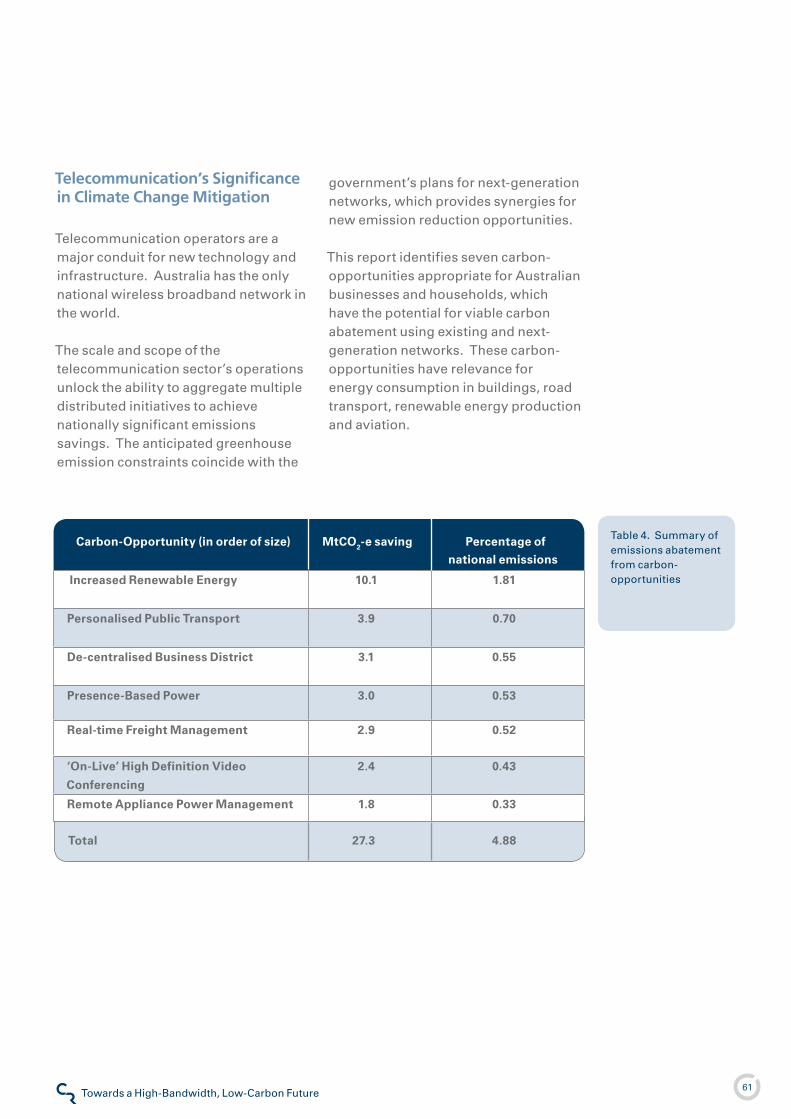
6�Towards a High-Bandwidth, Low-Carbon FutureClimate Risk
Telecommunication’s Significance in Climate Change Mitigation
Telecommunication operators are a major conduit for new technology and infrastructure. Australia has the only national wireless broadband network in the world.
The scale and scope of the telecommunication sector’s operations unlock the ability to aggregate multiple distributed initiatives to achieve nationally significant emissions savings. The anticipated greenhouse emission constraints coincide with the
government’s plans for next-generation networks, which provides synergies for new emission reduction opportunities.
This report identifies seven carbon-opportunities appropriate for Australian businesses and households, which have the potential for viable carbon abatement using existing and next-generation networks. These carbon-opportunities have relevance for energy consumption in buildings, road transport, renewable energy production and aviation.
Table 4. Summary of emissions abatement from carbon-opportunities
Total 27.3 4.88
Carbon-Opportunity (in order of size) MtCO2-e saving Percentage of
national emissions
increased Renewable Energy 10.1 1.81
Personalised Public Transport 3.9 0.70
De-centralised Business District 3.1 0.55
Presence-Based Power 3.0 0.53
Real-time Freight Management 2.9 0.52
‘On-Live’ High Definition Video
Conferencing
2.4 0.43
Remote Appliance Power Management 1.8 0.33
6�Towards a High-Bandwidth, Low-Carbon FutureClimate Risk
Key Findings
This report provides an analysis of the opportunities for Australian society to achieve nationally significant greenhouse gas abatement using telecommunication networks.
The report identifies that the scale and scope of telecommunication network services and users provide a unique opportunity to harness economies of scale to achieve meaningful emission reductions.
Many of the carbon-opportunities identified lead to energy and other cost savings for commercial and residential customers, and in some cases will enable the on-selling of newly created carbon creditsi and electricity management commodities.
The estimated abatement opportunity calculated herein is almost 5% (4.9) of Australia’s total national emissions, making the use of telecommunication networks one of the most significant opportunities to reduce the national carbon footprint.
�.
�.
3.
4.
The estimated energy and travel cost savings are approximately $6.6 billion per year, and value of the carbon credits created may be between $�70 million and $�.� billion subject to the future price of carbon.
Some of these carbon-opportunities can be realised immediately; others are contingent on the roll-out of a national fibre optic network to residential and commercial consumers.
In combination with other measures being implemented by Government, a deployment of the carbon-opportunities in the period �008 to �0�4 would have the additional effect of stabilising national emissions in the period up to �0�4 in keeping with the findings of the IPCC and the Stern Review, as shown in Figure �5.
5.
6.
7.
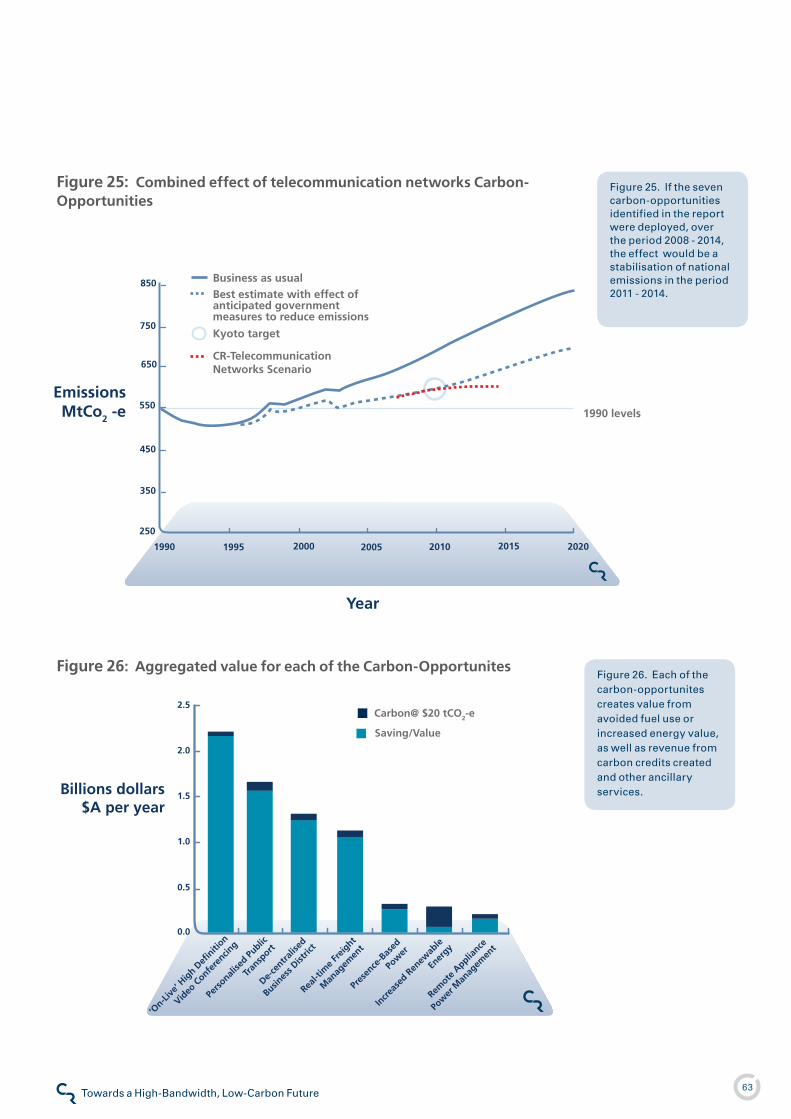
63Towards a High-Bandwidth, Low-Carbon FutureClimate Risk
0.0
2.5
2.0
1.5
1.0
0.5
Pres
ence
-Bas
ed
Pow
er
Remote
Applia
nce
Pow
er M
anag
emen
t
De-ce
ntralis
ed
Busines
s Dist
rict
‘On-Li
ve’ H
igh D
efiniti
on
Video
Confe
rencin
g
Incre
ased
Ren
ewab
le
Ener
gy
Real-t
ime F
reig
ht
Man
agem
ent
Perso
nalise
d Public
Tran
sport
Saving/Value
Carbon@ $20 tCO2-e
Billions dollars$A per year
Figure �6. Each of the carbon-opportunites creates value from avoided fuel use or increased energy value, as well as revenue from carbon credits created and other ancillary services.
Figure 26: Aggregated value for each of the Carbon-Opportunites
Figure �5. If the seven carbon-opportunities identified in the report were deployed, over the period �008 - �0�4, the effect would be a stabilisation of national emissions in the period �0�� - �0�4.
Figure 25: Combined effect of telecommunication networks Carbon-Opportunities
Year
1990 202020152010200520001995
850
250
350
450
550
650
750
EmissionsMtCo2 -e
Business as usualBest estimate with effect of anticipated government measures to reduce emissions
1990 levels
Kyoto target
CR-Telecommunication Networks Scenario
64Towards a High-Bandwidth, Low-Carbon FutureClimate Risk
ABARE (�005) Australian Energy: National and State Projections
to �0�9 - 30. e-Report 05.9, October �005.
Adger, N., Brown, K., & Tompkins, E. (�005). The Political economy
of Cross-Scale Networks. Resource Co-Management. Ecology
and Society, �0(�).
AGL. (�007). Chicago Climate Exchange® Welcomes Australia’s
AGL Energy [Electronic Version]. AGL Media Release from http://
www.agl.com.au/AGL/Press+Releases/Chicago+Climate+Exchan
ge%C�%AE+Welcomes+Australia’s+AGL+Energy.htm.
Airservices Australia. (�006). Corporate Plan July �006 - June
�0��: Airservices Australia.
Alcatel-Lucent. (�007). Alcatel-Lucent Achieves a World Record
�5.6 Terabit/s Optical Transmission [Electronic Version].
Retrieved May �007 from http://www.alcatel-lucent.com/.
Alcott, B. (�005). Jevons’ Paradox. Ecological Economics, 54(�),
9-��.
Alexander, I. (�000). The Post War City. In S. Hamnett & R.
Freestone (Eds.), The Australian Metropolis. St Leonards: Allen
& Unwin,
Australian Bureau of Statistics (ABS). (�998). Use of Internet by
Household, Catalogue No. 8�47.
Australian Bureau of Statistics (ABS). (�00�). Australian Social
Trends, Catalogue No. 4�0�.0. Canberra.
Australian Bureau of Statistics (ABS). (�004). Detailed Energy
Statistics, Australia, Cat No. 4648.0.55.00�.
Australian Bureau of Statistics (ABS). (�007). �007 Year Book
Australia Canberra: Commonwealth of Australia.
Australian Business Council for Sustainable Energy. (�006). The
Victorian Renewable Energy Target: An Analysis of is Impacts and
Rational. Carlton, Victoria.
Australian Computer Society (ACS). (�007). Policy Statement
on Green ICT. Published by the Australian Computer Society,
retrieved October �007 from https://www.acs.org.au/acs_
policies/docs/�007/greenictpolicy.pdf
Australian Greenhouse Office (AGO). (�006a). Transport
Sector Greenhouse Gas Emissions Projections �006. Canberra:
Commonwealth of Australia.
Australian Greenhouse Office (AGO). (�006b). AGO Factors and
Methods Workbook, December �006: Australian Greenhouse
Office.
Australian Greenhouse Office (AGO). (�006c). Comparison of
Transport Fuels [Electronic Version]. Final Report (EV45A/�/F3C)
to the Australian Greenhouse Office on the Stage � study of
Life-cycle Emissions Analysis of Alternative Fuels for Heavy
Vehicles. Retrieved April �007 from http://www.greenhouse.gov.
au/transport/comparison/.
Australian Greenhouse Office (AGO). (�007a). National
Greenhouse Gas Inventory �005: Accounting for the �08% Target.
Canberra: Australian Greenhouse Office.
Australian Greenhouse Office (AGO). (�007b). National Inventory
by Economic Sector. Canberra: Australian Greenhouse Office,
Commonwealth of Australia.
Australian Greenhouse Office (AGO), & International Council for
Local Environmental Initiatives (ICLEI). (�005). Standby Energy
Consumption: Australian Local Government Buildings [Electronic
Version] from http://www.energyrating.gov.au/library/
pubs/�005��-standby-local-gov.pdf.
Australian Telework Advisory Committee (ATAC). (�005).
Telework: International Developments, Paper Three.
Australian Telework Advisory Committee (ATAC). (�005).
Telework: Literature Search �005.
Australian Telework Advisory Committee (ATAC). (�006).
Telework for Australian Employees and Businesses: Maximising
the Economic and Social Benefits of Flexible Working Practices,
Report of the Australian Telework Advisory Committee to the
Australian Government. Canberra.
Australian Telework Advisory Committee (ATAC)c. (�005).
Telework for Employees and Businesses: Maximising the
Economic and Social Benefits of Flexible Working Practices,
Consultation Paper. Canberra: Australian Telework Advisory
Committee (ATAC).
Auswind. (�007). Wind Energy Projects in Australia. Retrieved
April �007, from http://www.auswind.org/auswea/index.html
Aviation Environment Federation. (�007). Carbon Dioxide
Emissions, and Climate Changing Effect. How Does Air
Compare to Other Means of Travel? [Electronic Version].
Retrieved April �007 from www.aef.org.uk/downloads//
Howdoesairtravelcompare.doc.
Brisbane City Council (�007). Personalised Public Transport.
Retrieved August �007, from http://www.brisbane.qld.gov.au/
BCC:BASE:�90686738�:pc=PC_�344
British Telecom. (�004). Forum For The Future. Sustainable
Development in Broadband Britain. A report prepared for British
Telecom [Electronic Version]. Retrieved April �007 from http://
www.btplc.com/Societyandenvironment/Reports/Reports.htm.
Brohan, P., Kennedy, J., Haris, I., Tett, S., & Jones, P. (�006).
Uncertainty Estimates in Regional and Global Observed
Temperature Changes: A New Dataset from �850. Journal of
Geophysical Research ���.
Burgess, P. (�006). Sit, Fight, Join or Run. Strategies for making
the shift from POTS to PANs in the Digital Space. Paper presented
at the Conference of the Securities & Derivatives Industry
Association.
Burton, D. (�007). Evaluating Climate Change Mitigation
Strategies in South East Queensland [Electronic Version].
Urban Research Program Research Paper �� March �007.
Retrieved May �007 from http://www.griffith.edu.au/centre/
urp/urp_publications/research_papers/URP_RP��_Burton_
ClimateLocGovt_final.pdf.
Bye Bye Standby (BBSB). (�007). Bye Bye Standby Home Page.
Retrieved May �007, from http://www.byebyestandby.co.uk/
howitworks.html.
Capoco Design. (�007). Mobilicity Project. Retrieved May �007,
from http://www.capoco.co.uk/capoco-design-links.html
Carbon Disclosure Project (CDP). (�007). The Carbon Disclosure
Project Media Release. April �007, from http://www.cdproject.
net/pressreleases.asp
Cervero, R. (�00�). Built Environments and Mode Choice: Toward
Part 7References
65Towards a High-Bandwidth, Low-Carbon FutureClimate Risk
a Normative Framework. Transportation Research Part D, 7(4),
�65-�84.
Church, J., Hunter, J., McInnes, K., & White, N. (�007). Sea-level
Rise and the Frequency of Extreme Event Around the Australian
Coastline [Electronic Version]. The Antarctic Climate and
Ecosystems Cooperative Research Centre Retrieved May �007.
Cisco Systems Inc. (�005). Cisco Corporate Citizens Report
[Electronic Version]. Retrieved �7 April �007 from http://
www.cisco.com/web/about/ac��7/ac���/pdf/ccmigration_
09�86a0080536�44.pdf.
Climate Analysis Indicators Tool (CAIT). (�007). World Resources
Institute - Climate Indicators Website. Retrieved May �007, from
http://www.cait.wri.org/
Coates, S. (�003). Maximising the Benefit of Wind. Paper
presented at the Sustainable Energy Development Authority
Wind Power Symposium.
Coote, A. (�006). What Health Services Could Do About Climate
Change. BMJ �006, 33�(�343-�344).
Council of the European Union. (�006). Follow-up to the eleventh
Conference of the Parties (COP ��) to the United Nations
Framework Convention on Climate Change (UNFCCC) Brussels.
CSIRO. (�006). The Heat Is On: The Future of Energy in Australia.
CSIRO,Canberra.
CSIRO. (�007). ViCCU™ Makes Long-Distance Critical Care a
Reality [Electronic Version]. Retrieved May �007 from http://www.
csiro.au/solutions/pps6e.html.
Dodson, J., & Sipe, N. (�006). Shocking the Suburbs: Urban
Location, Housing Debt and Oil Vulnerability in the Australian City
[Electronic Version]. Urban Research Program Research Paper
8 July �006, . Retrieved May �007 from http://www.griffith.edu.
au/centre/urp/urp_publications/research_papers/URP_RP8_
MortgageVulnerability_Final.pdf.
Econnect. (�007). Econnect Ventures Mini-Grid Capability
Statement. Northumberland, UK.
Edwards, M. J. (�999). Security Implications of a Worst-case
Scenario of Climate Change in the South-west Pacific (Vol. 30, pp.
3�� - 330): Routledge.
Electricity Supply Association of Australia (ESAA). (�004).
Electricity Prices in Australia.
Employment and Training Corporation (ETC). (�007). Telework - is
it for me? [Electronic Version]. Retrieved May �007 from http://etc.
gov.mt/docs/telwork.pdf.
Energy Efficient Strategies. (�007). Inclusion of Standby Power in
the Energy Ratings of Clothes Washers & Dishwashers [Electronic
Version]. Presentation on the RIS by Energy Efficient Strategies
May �006 from http://www.energyrating.gov.au/pubs/ris-
standby-cw-dw-�006-05-presentation.pdf.
Epstein, P. (�999). Climate and Health. Science, �85(54�6), 347-
348.
ESPCI. (�004). Wind Energy in South Australia, Planning Council
Report to ESCOSA.
European Telecommunications Networks Operators Association
(ETNO)(�006), Saving the Climate at the Speed of Light,.
Retrieved October �007 from http://www.panda.org/news_facts/
publications/ict/index.cfm.
European Union. (�006). Meeting on Energy Consumption of
Broadband Communication Equipment and Networks, 9 March
�006.
Eysenbach, G. J. (�00�). What is e-health? . Journal Medical
Internet Research, �8(3).
Flannery, T. (�005). The Weather Makers : How Man Is Changing
the Climate and What It Means for Life on Earth New York: Atlantic
Monthly Press.
Forum for The Future. (�004). Sustainable Development in
Broadband Britain [Electronic Version]. British Telecom. Retrieved
April �007 from http://www.btplc.com/Societyandenvironment/
Reports/Reports.htm.
Gold Coast City Council. (�007). Local Growth Management
Strategy: A Blueprint for Managing Growth. Gold Coast.
Goldstein, F., Kleinman, J., & Roth K. (�00�). Energy Consumption
by Office and Telecommunications Equipment in Commercial
Buildings [Electronic Version], �, �43-�44. Retrieved May �007
from www.tiax.com.
Goldstein, F., Ponoum, R., & Roth, K. (�006). U.S. Residential
Information Technology Consumption �005 and �0�0. Report
prepared by Tiax LLC for The U.S Department of Energy
[Electronic Version], 53-54. Retrieved May �007 from www.doe.
gov.
GoLoco. (�007). GoLoco Home Page. Retrieved May �007, from
http://www.goloco.org/greetings;guest
Government, A. (�006). Broadband Blueprint. Retrieved. from.
Graham, S. (�000). Planning Cyberspaces. In R. Simmonds & G.
Hack (Eds.), Global City Regions: Their Emerging Forms. London:
Spon Press.
Harrington, L., & Kleverlaan, P. (�00�). Quantification of
Residential Standby Power Consumption in Australia: Results of
Recent Survey Work [Electronic Version] from www.greenhouse.
gov.au/energyefficiency.
Harrison, S. (�007). Resident’s Request for Home Offices.
Harrison, V. (�007). Telstra and Renewable Energy.
Hickie, I. (�007). ABC 730 Report on Professor Ian Hickie,
Beyondblue: The National Depression Initiative, Melbourne,
VIC [Electronic Version] from http://www.abc.net.au/7.30/
content/�007/s�9�5070.htm.
Hopkins, P., & James, P. (�00�). Sustainable Telework
– Assessing and Optimising the Ecological and Social Benefits of
Teleworking. SUSTEL Case Study UK-05 East Midlands Electricity
[Electronic Version]. Retrieved May �007 from http://www.
sustel.org/documents/deliverables%�0-%�0WP�/Cases%�0-
%�0Submitted/�537�4_UK05_EME.pdf.
Houghton, J. (�004). Global Warming: The Complete Briefing
(Third ed.). Cambridge: Cambridge University Press.
Huber, P., & Mills, M. (�999). Dig More Coal, the PCs are Coming
[Electronic Version]. Forbes Magazine. Retrieved May �007 from
www.forbes.com.
IATA. (�007). Debunking Some Persistent Myths
About Air Transport and the Environment.
66Towards a High-Bandwidth, Low-Carbon FutureClimate Risk
Retrieved May �007, from http://www.iata.org/NR/
rdonlyres/��804�48-06A7-44A�-A�60-6�F�953D9E44/0/
ingsomePersistentMythsaboutAirTransportandtheEnvironment.
Intergovernmental Panel on Climate Change Working Group I
(IPCC WGI). (�007). Working Group I Assessment Report 4: The
Physical Science Basis [Electronic Version]. Retrieved May �007
from http://ipcc-wg�.ucar.edu/wg�/wg�-report.html.
Intergovernmental Panel on Climate Change Working Group II
(IPCC WGII). (�007). Climate Change �007: Impacts, Adaptation
and Vulnerability Working Group II Contribution to the
Intergovernmental Panel on Climate Change Fourth Assessment
Report, Summary for Policymakers [Electronic Version].
Retrieved May �007 from http://www.ipcc.ch/SPM�3apr07.pdf.
Intergovernmental Panel on Climate Change Working Group
III (IPCC WGIII). (�007). Working Group III contribution to the
Intergovernmental Panel on Climate Change Fourth Assessment
Report Climate Change �007: Mitigation of Climate Change,
Summary for Policymakers [Electronic Version]. Retrieved May
�007 from http://www.ipcc.ch/SPM040507.pdf.
International Telecommunication Union (ITU). (�007 ). ITU-T’s
Definition of NGN [Electronic Version]. Retrieved April �007 from
http://www.itu.int/ITU-T/ngn/definition.html.
International Telecommunication Union (ITU). (�003). Promoting
Broadband [Electronic Version]. ITU Internet Reports. Retrieved
April �007 from http://www.itu.int/osg/spu/publications/sales/
birthofbroadband/exec_summary.html
Internet Industry Association (IAA). (�006). �0�0 National
Broadband Targets: Maintaining Australia’s Global
Competitiveness: Internet Industry Association.
James, P. (�004). Teleworking and Sustainable Development - The
Verdict, Teleworking and Sustainable Development [Electronic
Version]. Retrieved April �007 from http://www.btplc.com/
Societyandenvironment/Reports/Reports.htm.
KPMG. (�004). Leaders or Laggards? Australia’s Broadband
Future.
Loddon Mallee Health Alliance (LMHA). (�007). Loddon Mallee
Health Alliance Home Page. from http://www.lmha.com.au/
Lovins, A. (�989). The Negawatt Revolution: Solving the CO�
Problem. Paper presented at the Green Energy Conference,
Montreal.
Lyth, A., Holbrook, N. J., & Beggs, P. J. (�005). Climate,
Urbanisation and Vulnerability to Vector-borne Disease
in Subtropical Coastal Australia: Sustainable Policy for a
Changing Environment. Global Environmental Change Part B:
Environmental Hazards 6(4), �89-�00.
Marvin, S. (�000). Telecommunications and Sustainable Cities.
In R. Simmonds & G. Hack (Eds.), Global City Regions: Their
emerging Forms. London: Spon Press.
Mason, K. (�000). The Propensity of Business Travellers to use
Low Cost Airlines. Journal of Transport Geography 8, �07-��9.
May, M. (�004). Unpacking Aviation futures: An Ecological
Perspective on Consumption, Sustainability and Air Transport.
University of Western Sydney.
McMichael, A., Haines, A., & Sloo, V., et al. eds. (�996). Climate
Change and Human Health. Geneva: World Health Organization.
Mees, P. (�000). A Very Public Solution: Transport in the Dispersed
City. Melbourne: Melbourne University Press.
Meinhausen, M. (�004). EU’s �oC Target and Implications for
Global Emission Reductions. . Paper presented at the Swiss
Federal Institute of Technology
Melbourne Institute of Applied Economic and Social Research
(MIAESR). (�00�). The Household, Income and Labour Dynamics
in Australia (HILDA) Survey [Electronic Version]. Retrieved May
�007 from http://melbourneinstitute.com/hilda/.
Metz, B., Davidson, O., Swart, R., & Pan, J. (Eds.). (�00�). Climate
Change �00�: Mitigation: Contribution of Working Group III to
the Third Assessment Report of the Intergovernmental Panel on
Climate Change. Cambridge: Cambridge University Press.
MobiSoft. (�007). Mobisoft’s MobiRouter. Retrieved April
from www.mobisoft.fi/www_english/case_studies_article.
php?case=0000�3
Monbiot, G. (�007, May � �007). Giving Up On Two Degrees: Have
We Already Abandoned Our Attempts to Prevent Dangerous
Climate Change? Guardian.
Najafi, F., & Nassar, E. (�990). Feeder Bus for Downtown People
Mover: Report No. UTC. UF. �68.6, Prepared for the United States
Department of Transportation.
National Electricity Market Management Company. (�006).
Annual Report [Electronic Version]. Retrieved May �007 from
http://www.nemmco.com.au/nemgeneral/000-0��8.pdf.
Nelson, R., Kokic, P., Elliston, L., & King, J. (�005). Structural
Adjustment: A Vulnerability Index for Australian Broadacre
Agriculture. Australian Commodities, �� (�).
OECD. (�007). Broadband Subscribers per �00 Inhabitants in
OECD Countries. [Electronic Version] from http://www.oecd.org/
document/�3/0,�340,en_�8�5_495656_33987543_�_�_�_�,00.
html
Office of Communications (Ofcom). (�007). Key Points. The
Communications Market: Broadband Digital Progress Report
[Electronic Version]. Retrieved April �007 from http://www.
ofcom.org.uk/research/cm/broadband_rpt/.
Office of Urban Management (OUM), & South East Queensland
Regional Organisation of Councils (SEQROC). (�005). South East
Queensland Regional Plan. Brisbane: Queensland Government.
Pacala, S., & Socolow, R. (�004). Stabilization Wedges: Solving
the Climate Problem for the Next 50 Years with Current
Technologies. Science, 305, 968-97�.
Pamlin, D. E. (�00�). Sustainability at the Speed of Light:
Opportunities and Challenges for Tomorrows Society: WWF
Sweden.
Paratz, L. (�006). Developing Australia’s Regions Conference.
Paper presented at the AFR
Parry, M., Arnell, N., McMichael, T., Nicholls, R., Martens, P.,
Kovats, S., et al. (�00�). Millions at Risk: Defining Critical Climate
Change Threats and Targets. Global Environmental Change, �(3),
�8�-�83.
Patz, J., Campbell-Lendrum, D., Holloway, T., & Foley, J. (�005).
Impact of Regional Climate Change on Human Health Nature 438,
67Towards a High-Bandwidth, Low-Carbon FutureClimate Risk
3�0-3�7
Pittock, A. B. (�007). Climate change Impacts �007: Impacts,
Adaptation and Vulnerability: The Second Volume of the IPCC
Fourth Assessment Report [Electronic Version]. Australian
Science Media Centre. Retrieved April �007 from http://www.
aussmc.org/IPCCWG�.php.
Pittock, B. (�005). Climate Change: Turning Up the Heat. Canberra:
CSIRO Publishing.
Preston, B. L., & Jones, R. N. (�006). Climate Change Impacts
on Australia and the Benefits of Early Action to Reduce Global
Greenhouse Gas Emissions. A consultancy Report for the
Australian Business Roundtable on Climate Change. [Electronic
Version] from http://www.csiro.au/csiro/content/file/pfbg.
Preston, B. L., Suppiah, R., Macadam, I., & Bathols, J. (�006).
Climate Change in the Asia/Pacific Region: A Consultancy
Report Prepared for the Climate Change and Development
Roundtable: Climate Change Impacts and Risk, CSIRO Marine and
Atmospheric Research.
Punchline Energy. (�007). Minimum Energy Performance
Standards and Alternative Strategies for External Power
Supplies: Report Prepared for Australian Greenhouse Office
February �007.
Renewable Energies Unit. (�006). Power Consumption Targets
of End Use Equipment for Networks: Institute for Environment
and Sustainability, European Union Directorate General Joint
Research Centre.
Roese, J. (�007). Mega Trend No �, web blog on Nortel. for
February and March �007 [Electronic Version], February & March.
Retrieved April �007 from http://blogs.nortel.com/johnroese/
?NT_promo_T_ID=hp_news_link_roese_blog,.
Romm, J. (�00�). The Internet and the New Energy Economy,
Sustainability at the Speed of Light: WWF Sweden.
Ross, I. (�007). Cisco Aviation Avoidance, Cisco Australia.
Roth, K. (�00�). The Potential to Reduce Information and
Communication Technology (ICT) Energy Consumption. Paper
presented at the Special CEPE-Colloquium, Thursday, October �3,
�005 at �7.�5 GEP-Pavillon, Polyterrasse, ETH Zurich.
Roth, K. (�006). Residential Information Technology (IT)
Consumption in the US. Paper presented at the International
Energy Efficiency in Domestic Appliances and Lighting
Conference 06, TIAX, LLC, USA.
Schellnhuber, H., Cramer, N., Nakicenovic, N., Wigley, T., Yohe,
G., & Pachauri, R. (Eds.). (�006). Avoiding Dangerous Climate
Change. Cambridge: Cambridge University Press.
Shafizadeh, K., Niemeier, D., Mokhtarian, P., & Salomon, I. (�007).
Costs and Benefits of Home-Based Telecommuting: A Monte
Carlo Simulation Model Incorporating Telecommuter, Employer
and Public Sector Perspectives. Journal of Infrastructure
Systems, March �007.
Software Ag. (�007). Logistics on the Move With XML [Electronic
Version]. XML Shockwave. Retrieved May �007 from http://www.
softwareag.com/xml/applications/mercedes.htm.
Steffan, W. (�006). Stronger Evidence but New Challenges:
Climate Change Science �00�-�005: Australian Greenhouse
Office, Canberra.
Stern, N. (�006). Stern Review on the Economics of Climate
Change [Electronic Version]. Retrieved April �006 from http://
www.hm-treasury.gov.uk/independent_reviews/stern_review_
economics_climate_change/stern_review_report.cfm.
Sydney Morning Herald (SMH). (�007). Earth Hour. May �007, from
http://earthhour.smh.com.au/
Telstra. (�006). Corporate Social Responsibility Report �005/06
[Electronic Version]. Retrieved May �007 from http://www.telstra.
com.au/abouttelstra/csr/docs/cr_report_06.pdf.
The Wall Street Transcript. (�004). Company Interview Excerpt:
Dan Kerth - Telstra Inc. Retrieved April �007 from http://www.
twst.com/notes/articles/yaw608.html
ThomasNet. (�006). Tag Your It [Electronic Version]. ThomasNet
Industrial Market Trends from http://news.thomasnet.com/IMT/
archives/�006/0�/rfid_tag_youre.html?t=archive.
Tiger Airways. (�007). Press Release �5th March �007 Tiger
Airways Australian Operations One Step Closer Retrieved April
�007 from http://www.tigerairways.com/about/press/Press_
�00703�5.html
Transition Institute. (�004). Cost Convergence of Wind Power
and Conventional Generation in Australia: The Australian Wind
Energy Association (AusWEA).
Underwood, J., Ault, A., Banyard, P., Bird, K., Dillon, G., Hayes, M.,
et al. (�005). The Impact of Broadband in Schools. Nottingham:
Nottingham University.
United Nations. (�99�). Article 3 of the United Nations Framework
Convention on Climate Change [Electronic Version]. Retrieved
May �007 from http://unfccc.int/essential_background/
convention/background/items/�355.php.
United Nations Environment Programme (UNEP/GRID-Arendal).
(�006). Maps and Graphics Library [Electronic Version]. Retrieved
April �007 from http://maps.grida.no/.
Victoira Department of Sustainability and the Environment
(V.DSE). (�005). Melbourne �030: Protecting Our Livability Now
and for the Future. Melbourne: Victorian Government.
Walsh, K., Betts, H., Church, J., Pittock, A. B., McInnes, K. L.,
Jackett, D. R., et al. (�004). Using Sea Level Rise Projections for
Urban Planning in Australia (Vol. �0, pp. 586-598).
White, G. (�004). Wind Forecasting Presentation Produced by
Garrad Harrison Pty Ltd.
Williams, S., Bolitho, E., & Fox, S. (�003). Climate Change in
Australian Tropical Rainforests: An Impending Environmental
Catastrophe. Proceedings of the Royal Society: Biological
Sciences, �70�5�7, �887-�89�.
Wormworth, J., & Mallon, K. (�006). Bird Species and Climate
Change: The Global Status Report Version �.�: A Report to World
Wide Fund for Nature [Electronic Version]. Retrieved May �007
from www.climaterisk.com.au.
68Towards a High-Bandwidth, Low-Carbon FutureClimate Risk
Abatement – A reduction in greenhouse gas
emissions (also see mitigation)
Adaptation -The Intergovernmental
Panel on Climate Change (IPCC) defines
adaptation as an ‘adjustment in natural or
human systems in response to actual or
expected climatic stimuli or their effects,
which moderates harm or exploits beneficial
opportunities’ (Metz et al. �00�, p.708).
Anthropogenic – The result of human
activities.
ATM – Assynchronus Transfer Mode.
ANSI and CCITT communications protocol
allowing different types of information e.g.
voice, data, video to share the one network
and interface. Based around a system of
separating bytes and reassembling at
delivery for optimal use of network.
Base-load – Normally refers to a power
station that runs constantly (�4 hours per
day, 7 days per week) regardless of energy
demand. Due to their slow start up and shut
sown times it is more cost effective for them
to remain on.
Baud – Data rate in bits per second. Falling
out of use as a term.
Broadband – The term originally applied
to internet networks when they were faster
than 64 kbit/s and always connected.
Different commentators apply different
data speed thresholds for the beginning
of Broadband e.g. 64, ��8, �56 Kbit/s or
beyond �, � Mbit/s. The term Broadband has
morphed into a description of wide, fast,
transparent connectivity and interfacing for
a variety of devices and applications.
Business as Usual – Refers to the
emissions trajectory associated with
undertaking activities without any measures
to reduce greenhouse gas emissions. Often
greenhouse gas mitigation policies are
compared to “business as usual” to show
the potential impact of the policy.
Capacity – Maximum rated power of
a power station, usually measured in
megawatts.
Capacity Factor – The percentage of
yearly energy generated as a fraction of its
maximum possible rated output.
Carbon Credits - When pollution levels are
capped, in some schemes, it may be possible
to trade greenhouse gas pollution rights
referred to as ‘carbon credits’. Currently
NSW has a greenhouse gas emissions
trading scheme, the Federal Government
has announced plans to introduce a national
scheme in �0�� and there are also voluntary
abatement markets.
CERN - Organisation Européenne
pour la Recherche Nucléaire (European
Organization for Nuclear Research) particle
physics laboratory based just outside of
Geneva
CO� – Carbon dioxide, which is one of the
primary anthropogenic greenhouse gases
CO�-e - Carbon dioxide equivalent. The net
effect greenhouse gas emissions is often
presented as carbon dioxide equivalent
which is a conversion to the global warming
Glossary
69Towards a High-Bandwidth, Low-Carbon FutureClimate Risk
potential of carbon dioxide over a �00 year
period. For example, the global warming
potential for a tonne of methane is �� times
that of a tonne of carbon dioxide.
Dial Up – An Internet connection where the
modem dials into an analog phone line using
standard telephone dialing protocols.
Emissions Intensity – The emissions
generated per unit of input or output.
Fibre – Refers to Optical Fibre, invented and
refined in the 60’s and 70’s, and able to carry
analog and digital data as modulated light
offering extremely high bandwidths at long
distances. Fibre can have a variety of optical
communications interfaces applied and it
comes as either Multi-mode or Single- mode
with the physical advantages of being light
and flexible for installation.
Fossil Fuel – A non-renewable source
of energy formed from decayed organic
matter millions of years ago. The most
predominant fossil fuels are coal, oil and
gas.
FTTx – Fibre-to-the-‘x’ where ‘x’ is a node,
premises, segment e.g. FTTP, FTTN etc.
Fugitive Emissions – The emissions which
come from the mining, transportation and
storage of fossil fuels (but does not include
the emissions from fossil fuel combustion).
GDP – Gross Domestic Product – the
economic value of a country’s annual
production of goods and services.
Geosequestration – Refers to the capture
and geological (underground) storage of CO�
emissions.
Greenhouse Gas (GHG) – Gases in the
atmosphere that adsorb and emit infrared
radiation, which subsequently lead to global
warming. Most common anthropogenic
greenhouse gases are (CO�), Methane (CH4),
Ozone (O3), Nitrous Oxide (N�O) and Sulfur
Hexafluoride (SF6).
HSDPA - High-Speed Downlink Packet
Access is a mobile telephone protocol
allowing high speed data transmission and
is used in Telstra’s Next GTM network
IP – Intelligent processing within a network.
Network layer protocol in TCP/IP offering a
connectionless or packetised service
ICT – Information Communications
Technology
ITU – International Telecommunications
Union i.e. coordinates standards for
telecommunication networks and operations
around the world with signatories from
participating countries.
Latency – The delay through a network or
process that can be caused by distance such
as over satellite or through dealing with
information such as reassembling bytes in
an ATM network or decompressing video.
Mitigation- The Intergovernmental Panel
on Climate Change (IPCC) defines as ‘an
anthropogenic intervention to reduce the
sources or enhance the sinks of greenhouse
gases’ (Metz et al. �00�, p. 7�6).
70Towards a High-Bandwidth, Low-Carbon FutureClimate Risk
Modem – Device for modulating data and
signals over a network according to the
interfacing protocols required by the devices
on the network. Theer are different types
of modems for different networks, whether
phone or cable TV networks etc.
MPEG – (Moving Picture Experts Group)
Protocol for moving compressed video
and audio down data networks either as
broadcast/satellite or along wires/fibre. So
far there are MPEG�. �.5, �, and 4 referring
to different rates and processing outcomes
(e.g. there was an MPEG 3 specified for
HDTV but it was never used).
MPLS – Multi Protocol Label Switching is a
method for carrying IP over ATM. Favoured
because it allows customer traffic to be less
expensively introduced into backbones
without needing an intermediate service.
MRET – Mandatory Renewable Energy
Target
Mt- Mega-tonnes. One mega tonne is one
million tonnes. Greenhouse gas emissions
are often displayed in mega-tonnes carbon
dioxide equivalent per annum (MtCO�-e/yr)
(see MtCO�-e).
MtCO�-e - Mega-tonnes carbon dioxide
equivalent (MtCO�-e) is the internationally
recognised measure used to compare the
emissions from the various greenhouse
gases. This measure factors in differences
in global warming potential and converts
them to a carbon-dioxide equivalent. For
example, the global warming potential for a
tonne of methane over �00 years is �� times
that of a tonne of carbon dioxide.
NEM – The National Electricity Market. The
NEM is a wholesale market for electricity
supply which delivers electricity to market
customers in all states and territories, except
for Western Australia and the Northern
Territory, through the interconnected
transmissions and distribution network.
NEMCO - The National Electricity Market
Management Company Limited administers
the National Energy Market (see NEM).
Network –The term for communications
systems and originally meant the physical
cable of a phone network or a data network.
With the growth of ATM and wireless has
widened to include how signals are dealt
with on a physical network but not referred
to the electrical characteristics of that
network plus the devices on the network.
Also no longer limited to wires but includes
mobile and wireless systems.
NGNs – Next Generation Networks where
the physical and electrical characteristics
of the network are not paramount so much
as the active way in which information
is processed and dealt with across the
network. With NGNs this means intelligence
is built into the network making it
transparent to a wide range of devices and
applications with application’s architecture
plugged into the network.
Orphaned Energy / Appliance - an
appliance which is using energy even though
no user is present is refered to as orphaned.
Peaking Plant – Normally refers to power
stations which run at peak times to meet
short term peaks in electricity demand.
Photovoltaic Cell – A renewable energy
technology which converts sunlight into
7�Towards a High-Bandwidth, Low-Carbon FutureClimate Risk
electrical energy.
Point-To-Point – When two sites or nodes in
a telecommunications system are connected
together by a physical cable or wireless
system.
Power - Energy transferred per unit of
time. Electrical power is usually measured
in watts (W), kilowatts (kW) and megawatt
(MW). An appliance drawing �000 Watts (�
kW) for � hour is said to have used � kilowatt
hour (� kWh) of electricity.
QoS – Quality of service. Has set definitions
including network availability as well as
quality of usage.
Renewable Energy - Energy which comes
from natural processes and which are
replenished in human time frames or cannot
be exhausted (sources of renewable energy
include wind, biomass, solar radiation,
geothermal energy, wave and tidal power).
Solar Power - (see photovoltaic cell)
SONET- Synchronous Optical Network
implemented over fibre as a ring so if a
fibre stops working traffic can be rerouted
without interruption. Data rates from 5�.84
Mbit/s through to 9.953 Gbit/s.
Switch – The large-scale device for
switching phone and data from their sources
to their destinations via the network.
TCP – Transmission Control Protocol
ensuring data is delivered to the application
layer in proper sequence without errors,
missing data or duplication.
Telco – shortened version of
telecommunications company or carrier.
Telepresence – Enhanced Video, audio
and information conferencing with the aim
of minimising the perception limitations of
present electronic communication such as
video conferencing compared with face-
to-face meetings. As well as using better
sytems such as HDTV it involves designing
in ‘soft’ issues such as lighting, sound
placement etc.
Teleworking – Using Broadband facilities
to enable working away from the office
whether at home or on the road.
Twisted Pair – Two wires ‘twisted’ together
in a certain pattern to minimise electrical
interference and connected as an electrical
circuit for carrying phone or data as a point-
to-point connection from the house to the
telephone exchange.
VoIP – Voice over Internet Protocol. Makes
use of Broadband to repackage voice as data
routed using IP. Used for placing computer
to computer calls or for entire business
networks.
Wind Farms – A collection of wind turbines
which connect to common substation to
feed into the main electrical grid.
Wind Turbine – A renewable energy
technology that converts air currents into
mechanical energy which is then used to
generate electrical energy.
Wireless – Refers to mobile phone
networks or any public network that uses
radio. Also can refer to local area networks
or LANs that are distributed using inhouse
wireless systems.
7�Towards a High-Bandwidth, Low-Carbon FutureClimate Risk
With Measures – Describes an emissions
trajectory with greenhouse gas mitigation
measures and generally shows the deviation
from the business-as-usual projection.
xDSL – x Digital Subscriber Line, a family
of high bandwidth telecommunications
services consisting of ADSL, HDSL,
SDSL, IDSL. ADSL (Asymetric) and SDSL
(Symetric) have been focussed on because
of the opportunity to provide broadband to
the premises over existing twisted pair in
addition to phone service.
73Towards a High-Bandwidth, Low-Carbon FutureClimate Risk
Appendix 1
Industry Example: Broadband and Urban Development - Genesis, Coomera
introduction
Genesis Coomera, by award winning developer, Heritage Pacific, was Telstra’s first Smart Community connected with Fibre To The Premises (FTTP), providing a high-speed optical fibre cable to each of the proposed 700 residential buildings. It is located 3km from the Coomera Town Centre which is identified as a Major Activity Centre in the South East Queensland Regional Plan (Gold Coast City Council �007). The development is occurring in one of Australia’s fastest growing regions and as such measures to reduce the environmental impact are important to curbing national emissions.
The Genesis development is exploring new boundaries in urban development in several ways. This innovation has been recognised through a number of awards for its design and construction. Some of the key elements include:
Water recycling and environmental flows which can be remotely monitored and controlled
Genesis residents have access to shared central services for recreation, business and education, including an office suite with full high-speed broadband connectivity
•
•
Some homes feature full automation of lighting, security and entertainment with a Voice over Internet Protocol (VoIP) phone for video conferencing
Smart wiring and automation provide a range of monitoring and control functions in the homes. Environmental controls such as temperature and air quality, light and shade can all be regulated;
Energy saving has been an important design consideration with much of the automation optimised to maximise energy savings with minimal user interaction.
In order to consider how broadband can facilitate reduced carbon emissions in a community like Genesis Coomera, it is relevant to consider the geographical and social context with which the community is being established.
Coomera, Gold Coast and South East Queensland
Rated as one of the world’s most biodiverse areas, rapid growth is placing resource pressure on the region (Gold Coast City Council �005). The rapid urbanisation of the Gold Coast has contributed to some suburban areas suffering social isolation and a lack of public facilities and transport (Gold Coast City Council �005). Environmental pressure is growing with climate change and urbanisation increasing vulnerability within the region.
The region is predominantly rural with a
•
•
•
Appendicies
74Towards a High-Bandwidth, Low-Carbon FutureClimate Risk
low population. The Pacific Motorway is the major public transport route. There are two train stations in the area with less frequent services than the regional average. Currently high dependence on the private car for transport needs has heightened the economic vulnerability of residents (Dodson and Sipe �006).
Upper Coomera is an area with high levels of disadvantage and no public transport service. The State government is planning to centre most development around Coomera in proximity to rail transport running north-south parallel to the Pacific Highway.
How Can Broadband Assist with the Carbon Footprint of Genesis?
Smart Development reduces environmental impacts
Genesis residents will have access to an epicentre for recreation, business and education. Synergy, a $3 million investment for exclusive use by Genesis residents, provides an epicentre with recreation, business and education facilities. There is an office suite and social centre including a cinema on site with full connectivity. Water recycling and environmental flows can be remotely monitored and controlled if required.
Transport
In a climate sensitive, carbon constrained world, increased fuel prices are likely to place considerable strain on the cost of living. The increase in transport costs will have repercussions
for communities heavily dependent upon private cars for commuting and personal activities. Any carbon tax, cap or trade mechanism is also likely to increase costs for urbanised and rural communities whose travel is based predominately around the car.
Given that Genesis is evolving within an area with relatively high unemployment, there is strong indication that its residents will work outside the area, possibly for businesses in Brisbane. Without the provision of effective alternatives, the presence of a major motorway nearby will draw residents to car based commuting.
Home Appliance Efficiency
Genesis is a community with a high level of appliance energy consumption. This high degree of automation could lead to significant increases in energy demand above those of the less ‘smart’ home. Conversely, this automation may be used to leverage energy management and therefore reverse and reduce energy demand.
Smart Homes reduce heating and cooling demands
A proportion of homes have been automated and connected to high-speed broadband. These feature full automation of lighting, security and entertainment with a Voice over Internet Protocol (VoIP) phone for video conferencing. Smart wiring allows for a range of automation in these homes. Environmental controls such as temperature and air quality, light and
75Towards a High-Bandwidth, Low-Carbon FutureClimate Risk
shade can be regulated to allow blinds to come down during sunny periods and louvres to open to let in afternoon breezes.
Automated window opening and closing maximises energy savings with minimal user interaction.
Telstra Smart Community brought together via the web
All homes also share a domain (@myhome.genesis.coomera.com.au). There is significant potential to develop collaborative relationships i.e. car-pooling or online purchasing, in addition to practical issues pertaining to the site. Local universities offer online courses and delivery of education via the web.
Smart Technology
Telstra have connected a product called Telstra VelocityTM which is FTTP which at present offers 8 - �0 mbps, multiple phone lines and television services on one fibre cable. This delivers ultra high quality connections and the use of many applications rarely found in CBD offices. This high-speed broadband connection facilitates the uptake of full-time or partial telework. At Genesis, of the 85 % of residents connected to Telstra VelocityTM , all request that dedicated office facilities be built at their home (Harrison �007a). Profiling provided by Genesis suggests that many residents employed in Brisbane are working from home at least one day per week. One resident has been able to move a high technology sound production business to his home. The uptake of teleworking
at the development has the potential to save a considerable amount of greenhouse gas emissions.
The projected savings for residents who are employed in the Brisbane area can be estimated as follows:
Teleworking one day per week saves 96kms per week per person. This is equal to 9,�00kms per year (46 weeks x 96kms per year).
Assuming a typical Australian car emits �60g CO�-e per kilometre then 780 kg of CO�-e per year would be saved.
If 300 of the adult residents in the planned development worked from home one day per week then ��5 tonnes of CO�-e would be saved per year (based on travel to Brisbane).
Ancillary benefits include time, cost savings, reduced traffic congestion and air pollution.
Potential for increased Emission Reductions
Personalised Public Transport
By utilising Telstra Fibre to the Premises (FTTP) at the Genesis development there is potential for deeper greenhouse gas abatement than provided by teleworking alone. The Genesis development is located 3km from a soon to be ‘Major Activity Centre’ which includes a large public transport node on the main rail line to Brisbane.
As discussed earlier in this report, one
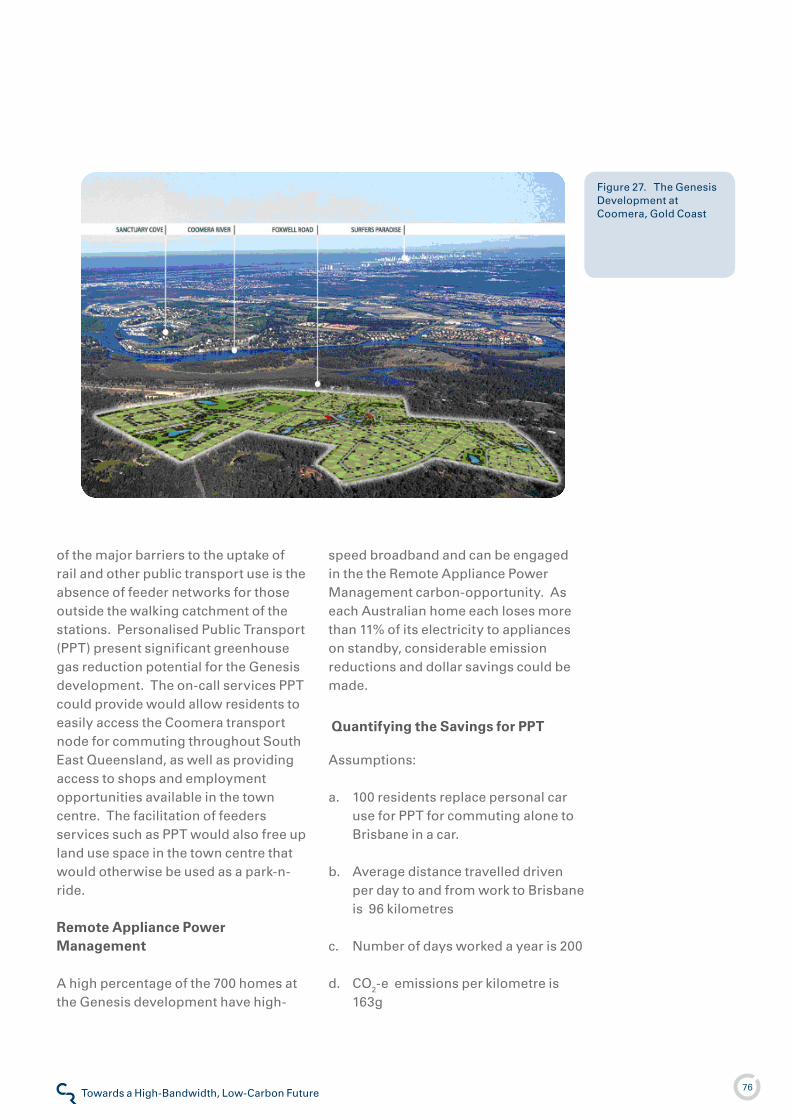
76Towards a High-Bandwidth, Low-Carbon FutureClimate Risk
of the major barriers to the uptake of rail and other public transport use is the absence of feeder networks for those outside the walking catchment of the stations. Personalised Public Transport (PPT) present significant greenhouse gas reduction potential for the Genesis development. The on-call services PPT could provide would allow residents to easily access the Coomera transport node for commuting throughout South East Queensland, as well as providing access to shops and employment opportunities available in the town centre. The facilitation of feeders services such as PPT would also free up land use space in the town centre that would otherwise be used as a park-n-ride.
Remote Appliance Power Management
A high percentage of the 700 homes at the Genesis development have high-
speed broadband and can be engaged in the the Remote Appliance Power Management carbon-opportunity. As each Australian home each loses more than ��% of its electricity to appliances on standby, considerable emission reductions and dollar savings could be made.
Quantifying the Savings for PPT
Assumptions:
�00 residents replace personal car use for PPT for commuting alone to Brisbane in a car.
Average distance travelled driven per day to and from work to Brisbane is 96 kilometres
Number of days worked a year is �00
CO�-e emissions per kilometre is �63g
a.
b.
c.
d.
Figure �7. The Genesis Development at Coomera, Gold Coast
77Towards a High-Bandwidth, Low-Carbon FutureClimate Risk
Emissions savings:
= (a x b x c x d)
= 3��,000 kgs CO�-e per year saved
Assume petrol is $� per litre results in $�.7 million in combined savings (after $65 per person, per week spent on public transport is removed).
Quantifying the Savings for Remote Appliance Power Management
Assumptions:
700 homes when complete
Average household energy use 6.�6 MWh per annum (ABS �004)
Standby percentage ��.6% (AGO & ICLEI �005)
900 kg of CO�-e per MWh (CAIT �005)
Emissions savings:
= (a x b x c x d)
= 504,000kg GHG emissions saved.
Total emissions savings potential is 3��,000 kg (using PPT) plus 504,�5� kg (using Remote Appliance Power Management) = 8�6,�5� kg per annum.
a.
b.
c.
d.
Barriers to implementation
In order to realise emissions reductions using PPT at Genesis, government support to increase the functionality of public transport in the region will be necessary. This would include high frequency rail services from Coomera to Brisbane to ensure public transport is a viable option.
Conclusion
The Genesis development is well equipped to provide best practice systems to reduce greenhouse gas emissions through the use of FTTP and consequent high quality teleworking options. Herein it is envisaged that by utilising two of the proposed options in this report (PPT and Remote Appliance Power Management) deeper greenhouse gas emission cuts are possible.
78Towards a High-Bandwidth, Low-Carbon FutureClimate Risk
Appendix 2
Industry Example: Next generation networks, Carbon and Education - Catholic Education Parramatta
“broadband is changing the way pupils learn and construct their work, changing the ways teachers organise lessons and co-operate with colleagues, and changing the way schools administer their courses.” (Underwood et al. �005, p.6)
Catholic Education Parramatta (CEP)
The Diocese of Parramatta is located in one of the fastest growing areas of New South Wales. The diocese is west of Sydney and reaches from Dundas Valley, west to Katoomba, south to Luddenham and north to Richmond.
There are 76 Catholic schools in the Parramatta diocese of which 54 are primary and �� are secondary. Approximately 4000 staff attend to the total student population of 4�,600 students. There are also six congregational (independent Catholic) schools in the diocese with the most recent, St Mark’s Catholic College, opening at Stanhope Gardens in February �007.
Carbon Emission Abatement in Schools
Using technology to save emissions in schools offers a great opportunity to expose students to new ways of managing their emission profile. They can then carry this into the workplace and home.
Significant energy and carbon emission savings could be realised via two of the opportunities identified earlier in this report; Remote Appliance Power Management and Increased Renewable Energy.
A ‘Typical’ School
Each of Catholic Education Parramatta’s schools are different. In order to consider this industry example it is useful to create an hypothetical ‘typical’ school.
Our case-study school has �,000 pupils and just fewer than �00 members of staff.
The class occupancy is about �5 children per class and this includes smaller classes for specialist subjects.
The school has 40 classrooms equipped with air conditioning for cooling in the summer and heating for the winter, using an average of 3.7MWh of energy per classroom per year over the year�3. By comparison a typical home uses about 6.�MWh per year.
•
•
•
The annual energy saving of this server consolidation is 1.4 megawatt hours and a carbon reduction of approximately 140 tonnes of greenhouse gas emissions per year.
�3 Assuming 50 square meters per class room, 0.��5KW of power used per square metre (SEDO �004) when in use, 3 months heating in summer, 3 months cooling in summer for 5 hours per day.
79Towards a High-Bandwidth, Low-Carbon FutureClimate Risk
The school has standby loads including computers, laptops on charge and musical equipment. It also has electrical hot water heating on �4 hours a day, seven days a week. Standby power consumption is typical of that in the residential sector.
The average energy consumption in this typical school is 335KWh per person (pupils and teachers) per year (QDOE �006) which equates to a total of 370MWh per year.
Remote Appliance Power Management in Schools
In line with commercial and residential sectors, a significant proportion of energy in Australian schools is wasted on standby power. Remote Appliance Power Management would allow all appliances to be switched off by the school caretaker at the end of the school
• day or during holiday periods. The intelligent networked control switch would enable the caretaker to selectively turn on areas for after hours use.
If we assume that the schools have energy wastage similar to residential standby, the opportunity exists to provide for simple standby reduction through centralised online control of either outlets or network enabled intermediate sockets (an adaptor between the socket and the device plug which can be used without the need to retro fit the outlet).
Assuming 50 square meters per class room, 0.��5KW of power used per square metre (SEDO �004) when in use, 3 months heating in summer, 3 months cooling in summer for 5 hours per day.
All standby power across the school
Broadband technology has the potential to revolutionise the Australian
education sector. The always-on nature of broadband connections allows
school students to use the internet as an everyday research tool in the
classroom more easily. High bandwidth enhances the effectiveness of existing
distance learning programs by enabling video conferencing on the desktop.
Access to sufficient bandwidth allows researchers in Australia’s higher education
institutions to participate in international collaborative research projects and
broadband allows tertiary students to access high quality course materials from
campuses across the country and around the world.
(Broadband in Schools, NOIE Canberra August �00�)
80Towards a High-Bandwidth, Low-Carbon FutureClimate Risk
could be terminated from 5pm to 8am each school day and over the weekends, reducing the number of hours in which standby devices could draw power by 73%. Assuming an average ��% of energy is standby, the savings would equate to 3.�MWh of energy per school (enough to power 5 homes a year) and saving over $3,�00 per year on the school electricity bill.
increased Renewable Energy
Heating and cooling facilities in the school present an opportunity to use these loads for Increased Renewable Energy during the working hours of the school (assuming these loads are they are all off outside these hours).
The amount of power used in heating and cooling classrooms during the relevant summer and winter months
would be approximately �50kW, which is enough ‘discretionary’ load to marry with a 750 kilowatt wind turbine with a �5% capacity factor. Across the total CEP school population of 4�,000 students, this would be enough discretionary load to partner with a substantial 30 megawatt wind farm - approximately double the amount of wind energy currently operating in NSW.
Conclusion
This example illustrates a significant opportunity to reduce the emission footprint of any school through the application of several of the opportunities identified in this report to heating, cooling and energy loads.
8�Towards a High-Bandwidth, Low-Carbon FutureClimate Risk
Appendix 3
Industry Example: Telstra - Change Through Leadership
introduction
This report identifies the opportunity for Telstra to act as a catalyst for reductions in national emissions which go beyond the direct scope of Telstra operations.
This chapter explores Telstra’s environmental stewardship to date and identifies opportunities to use Next IP™ for further emission reductions.
introduction to Telstra
Telstra’s history dates back to the foundation of the Commonwealth in �90� when the Commonwealth Government established the Postmaster-General’s Department to manage all domestic telephone, telegraph and postal services.
Telstra, as Australia’s largest telecommunications provider, serves Australian customers via fixed line (including data, broadband, IP and cable), wireless (�GSM, ��00MHz, CDMA and Next GTM) and satellite networks. In addition, it operates a number of international services. In total Telstra provides nearly �0 million fixed line services and over 9.� million mobile services.
Current Emissions14
Telstra has approximately 36,000 full-time equivalent (FTE) employees in its Australian workforce and operates Australia’s largest vehicle fleet of over �7,000 vehicles (including salary sacrifice vehicles). The organisation’s physical footprint covers �4,500 commercial properties with nearly 33,000 cabinet facilities.
As a builder, operator and maintainer of telecommunications infrastructure, Telstra’s main emissions - 89% of the total - come from energy use in network operations including data centres and offices (Telstra �006). Telstra is one of the largest occupiers of commercial property in Australia with over �0,000 sites nationally. The scale and scope of Telstra’s operations and assets present significant energy management challenges. For example, the CDMA network when retired will reduce energy requirements while the roll-out of next generation networks is likely to increase consumption.
Other emission sources include Land Use, Land Use Change and Forestry (LULCF) which could be both negative through clearing of easements or positive through replanting. Staff travel is extensive with over 4�� million road kilometres travelled in the financial year �005/06.
Current iCT based abatement strategies
Telstra recognises and tracks its greenhouse gas emissions on a yearly basis. Telstra to date has saved ��5,�4�
�4 The data and information contained within this study is sourced from publicly available documents and from information provided by senior management. The principal source document, the Telstra Corporate Responsibility Report �006, is written in accordance with GRI G3 standards however the information reported has not been verified by Climate Risk and no assurance is given as to its completeness or materiality.
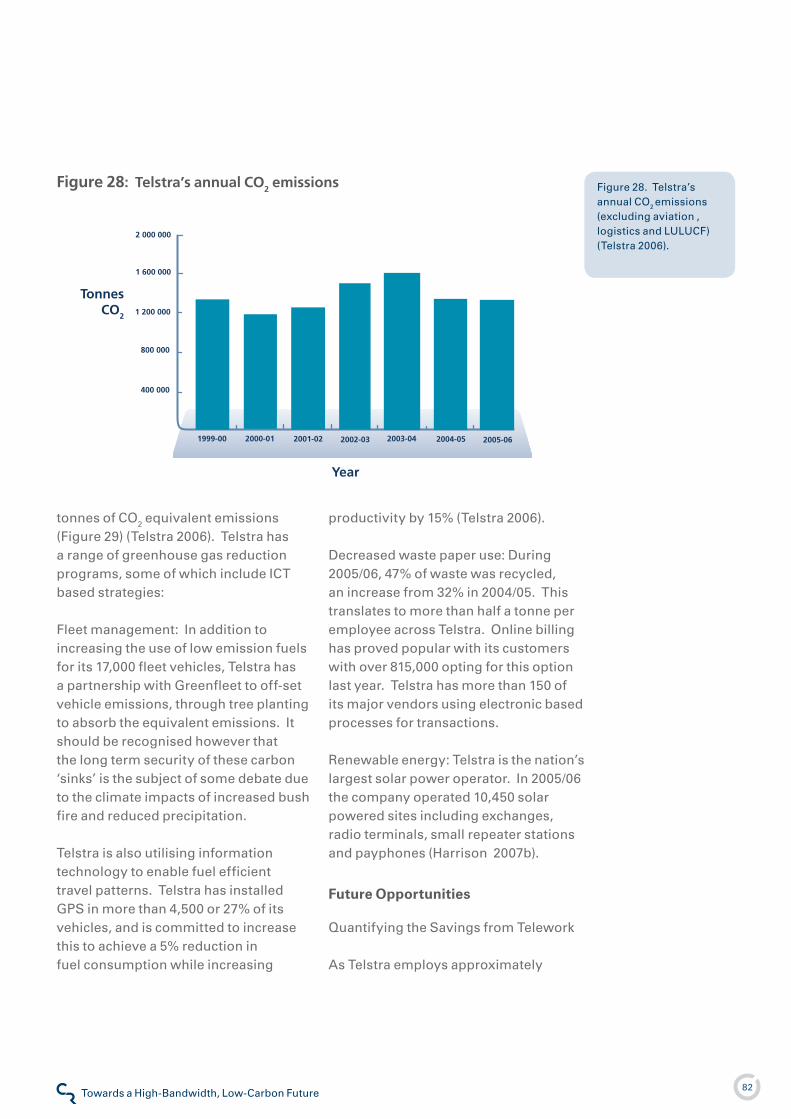
8�Towards a High-Bandwidth, Low-Carbon FutureClimate Risk
tonnes of CO� equivalent emissions (Figure �9) (Telstra �006). Telstra has a range of greenhouse gas reduction programs, some of which include ICT based strategies:
Fleet management: In addition to increasing the use of low emission fuels for its �7,000 fleet vehicles, Telstra has a partnership with Greenfleet to off-set vehicle emissions, through tree planting to absorb the equivalent emissions. It should be recognised however that the long term security of these carbon ‘sinks’ is the subject of some debate due to the climate impacts of increased bush fire and reduced precipitation.
Telstra is also utilising information technology to enable fuel efficient travel patterns. Telstra has installed GPS in more than 4,500 or �7% of its vehicles, and is committed to increase this to achieve a 5% reduction in fuel consumption while increasing
productivity by �5% (Telstra �006).
Decreased waste paper use: During �005/06, 47% of waste was recycled, an increase from 3�% in �004/05. This translates to more than half a tonne per employee across Telstra. Online billing has proved popular with its customers with over 8�5,000 opting for this option last year. Telstra has more than �50 of its major vendors using electronic based processes for transactions.
Renewable energy: Telstra is the nation’s largest solar power operator. In �005/06 the company operated �0,450 solar powered sites including exchanges, radio terminals, small repeater stations and payphones (Harrison �007b).
Future Opportunities
Quantifying the Savings from Telework
As Telstra employs approximately
1 600 000
Year
800 000
1 200 000
400 000
2 000 000
2004-052003-041999-00 2000-01 2001-02 2002-03 2005-06
Tonnes CO2
Figure �8. Telstra’s annual CO� emissions (excluding aviation , logistics and LULUCF) (Telstra �006).
Figure 28: Telstra’s annual CO2 emissions
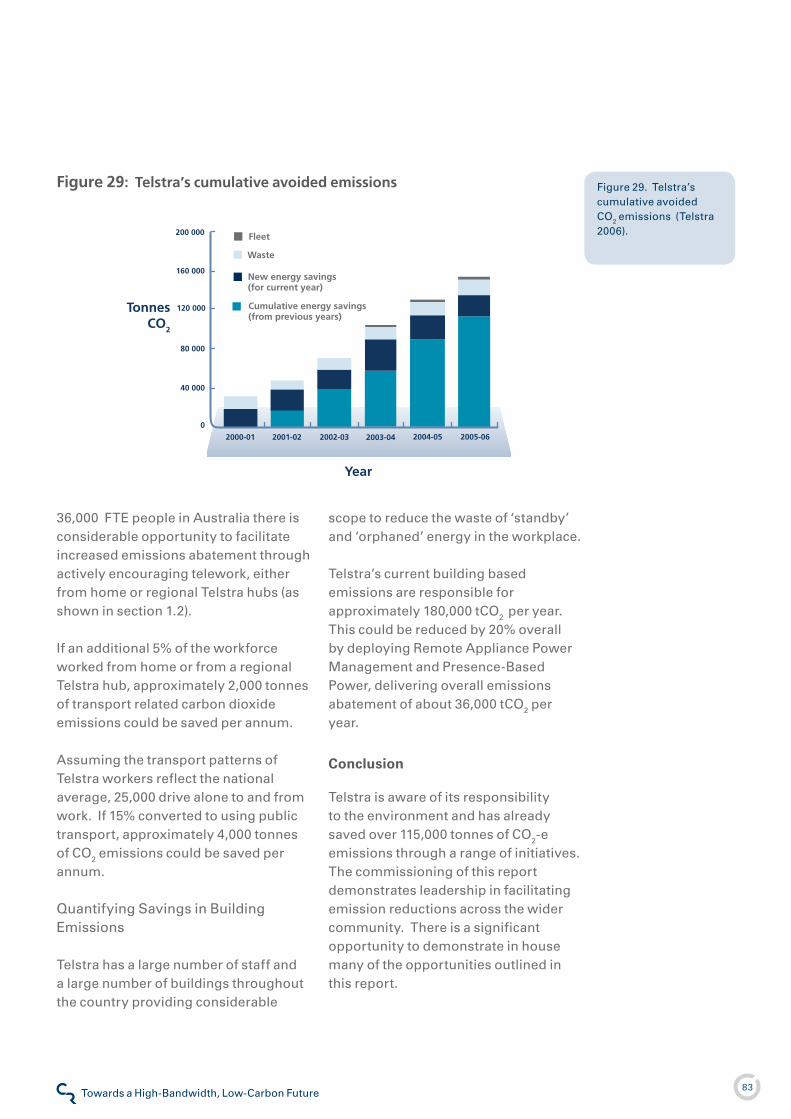
83Towards a High-Bandwidth, Low-Carbon FutureClimate Risk
36,000 FTE people in Australia there is considerable opportunity to facilitate increased emissions abatement through actively encouraging telework, either from home or regional Telstra hubs (as shown in section �.�).
If an additional 5% of the workforce worked from home or from a regional Telstra hub, approximately �,000 tonnes of transport related carbon dioxide emissions could be saved per annum.
Assuming the transport patterns of Telstra workers reflect the national average, �5,000 drive alone to and from work. If �5% converted to using public transport, approximately 4,000 tonnes of CO� emissions could be saved per annum.
Quantifying Savings in Building Emissions
Telstra has a large number of staff and a large number of buildings throughout the country providing considerable
scope to reduce the waste of ‘standby’ and ‘orphaned’ energy in the workplace.
Telstra’s current building based emissions are responsible for approximately �80,000 tCO� per year. This could be reduced by �0% overall by deploying Remote Appliance Power Management and Presence-Based Power, delivering overall emissions abatement of about 36,000 tCO� per year.
Conclusion
Telstra is aware of its responsibility to the environment and has already saved over ��5,000 tonnes of CO�-e emissions through a range of initiatives. The commissioning of this report demonstrates leadership in facilitating emission reductions across the wider community. There is a significant opportunity to demonstrate in house many of the opportunities outlined in this report.
2004-052003-042000-01 2001-02 2002-03 2005-06
Year
40 000
0
200 000
120 000
160 000
80 000
Tonnes CO2
Cumulative energy savings (from previous years)
New energy savings (for current year)
Waste
Fleet
Figure �9. Telstra’s cumulative avoided CO� emissions (Telstra �006).
Figure 29: Telstra’s cumulative avoided emissions
84Towards a High-Bandwidth, Low-Carbon FutureClimate Risk
Appendix 4
Industry Example: The Health Sector, Climate Change and Telecommunication Networks
“The institutions of healthcare have enormous power to do good or harm to the natural environment and to increase or diminish carbon emissions”(Coote �006, p. �344).
The Double Exposure of the Health Sector to Climate Change.
The health sector is recognised as being at the front line of climate change impacts, responding to issues including extreme weather impacts and disease migration. The World Health Organisation “estimates that the warming and precipitation trends due to anthropogenic climate change of the past 30 years already claim over �50,000 lives annually. Many prevalent human diseases are linked to climate fluctuations, from cardiovascular mortality and respiratory illnesses due to heatwaves, to altered transmission of infectious diseases and malnutrition from crop failures.” (Patz et al. �005)
Direct health impacts are only one component of the health sector. Indirect impacts of climate change may include the effects on the integrity of energy and water infrastructure supporting health and productivity of the wider economy. Further, it has been suggested that these secondary and tertiary impacts
will be of the most significance to the health sector, “In the longer term, and with considerable variation between populations because of geography and vulnerability, the indirect impacts may well have greater magnitude than the more direct impacts” (Epstein �999; McMichael et al. �996).
There is a proven relationship between climate and health as more impacts mean more health sector activity which in turn leads to more emissions. For example, the southerly spread of tropical disease carriers in Australia increases the number of patients, some of whom will need air transfers, with consequent increases in greenhouse gas emissions. This interdependency illustrates that health care provision is both a source of greenhouse gas emissions and bears the brunt of impacts from climate change. Nevertheless, there are opportunities for the sector to decarbonise its footprint and to increase its resilience to climate change impacts.
using networks to Address 21st Century Health Challenges
Despite the direct and indirect consequences of climate change for human health becoming better researched and understood, there is relatively little planning within the health sector to consider the infrastructure requirements needed for adaptation to climate change.
Healthcare comprises a complex mix of institutions, structures and individuals. These structures generate
85Towards a High-Bandwidth, Low-Carbon FutureClimate Risk
varying temporal and spatial challenges that ICT networks can help address. From medical professionals and administrators to patients and insurance companies, this sector has wide-ranging information and communication needs.
Existing or emergent applications enabled by ICT networks which are relevant to the health sector include:
The exchange of patient records and data;
Monitoring of patients in aftercare and vital care situations;
Transfer of images radiographs, ultrasound, CAT/MRI scans;
Teleconsultation;
Online health information and clinical support;
High quality interactive video for remote care;
E-Learning, training and testing;
Medical Research and collaborative team working; and
Retention and recruitment of staff in rural practices.
All of these examples reduce travel requirements and therefore emissions.
The following examples highlight several emerging eHealth solutions enabled by ICT network technologies in regional and remote areas.
•
•
•
•
•
•
•
•
•
e-Health
“e-health is an emerging field in the intersection of medical informatics, public health and business, referring to health services and information delivered or enhanced through the Internet and related technologies…commitment for networked, global thinking, to improve health care locally, regionally, and worldwide by using information and communication technology.” (Eysenbach �003)
Strong technological leadership and good infrastructure has led to the emergence of a global e-Health industry. In Europe the industry is estimated to be worth �0 billion Euro. Telstra has pioneered a number of e-Health applications in Australia and is further developing the use of internationally significant applications in critical care using ICT networks.
The Virtual Critical Care Unit (ViCCUTM) developed by the CSIRO, is a specialist teleconferencing and remote diagnostic facility. Combined with the Telstra’s Next IP™ services, it enables specialists in metropolitan hospitals diagnose and treat patients in remote hospitals, improving the standard of patient care in regional areas. This obviates the risk and transport costs, and allows patients to be cared for in their own community.
86Towards a High-Bandwidth, Low-Carbon FutureClimate Risk
According to the CSIRO the key benefits of ViCCUTM include:
Regional delivery of expert advice often faster than via helicopter transport;
Improved patient recovery, in their own community environment, supported by specialists;
Recruitment and retention benefits for rural health professionals;
Addressing health equity challenges in rural or regional areas;
Multi-disciplinary intervention; and
Reduced costs and risk to the medical system through avoided movement of patients.
Within the context of climate change mitigation, such applications are reducing the need for long distance road and air travel by practitioners, patients and carers, and the associated greenhouse gas emissions.
Within the context of adapting to the physical impacts of climate change, this type of initiative increases the resilience of rural communities to events that may require critical care and provides a model for other services which can be moved online.
Regional Health Care
“Only 4.9% of University of Queensland medical graduates
•
•
•
•
•
•
from 1990 to 2004 are currently working in rural and remote Queensland.” (White �006)
In many of Australia’s rural areas, there is a dire lack of specialist care. Recruitment of rural practitioners is difficult due to isolation of staff, reduced revenues due to patient numbers and a lack of general resources. Rural patients may require round trips of many hundreds of kilometres for specialist diagnosis. There are considerable travel costs and subsequent emissions created by patients and family for treatment and aftercare support.
Transfer of patient care accountability back to GPs can reduce travel, but this requires providing specialist support to doctors, support which may only be available at a state or national level.
A successful example of how broadband networks are being applied to bring need and expertise together and avoid long distance, high emission travel by patients and/or medical staff is in the field of dermatology.
Tele-Derm is an online diagnosis tool available to doctors throughout Australia. Using Tele-Derm, GPs are able to access online dermatological case studies, education opportunities, recommended links and discussion forums.
Tele-Derm also allows rural doctors anywhere in Australia to electronically submit specific cases for assessment. These cases are available as case
87Towards a High-Bandwidth, Low-Carbon FutureClimate Risk
studies for all GPs enrolled in Tele-Derm.
Since it began, Tele-Derm has been used extensively by the medical community:
It currently has over 450 people enrolled;
In a typical month, Tele-Derm has over �000 hits from over �70 individual doctors;
Approximately �00 interactive, self-paced cases are now available for doctors to work through; and
Tele-Derm has assisted with over �00 individual cases.
Rural and remote communities benefit from rapid access to expert advice through initiatives such as Tele-Derm. Currently based on ISDN, next generation networks will provide better visual definition and faster communication services. As such they can form the basis for expansion to other types of diagnostics and treatment. The reduced travel by patients and doctors will directly equate to reduced emissions.
Remote Health
“We desperately want IT training on-site for nurses, in plain English, which covers problem solving, confidence, problems of isolation”, says one bush nurse. Grampians Health Region eLearning Feasibility Study �006
•
•
•
•
Loddon Mallee Health Alliance
Loddon Mallee Health Alliance (LMHA) is a governance entity that represents the ICT interests of �6 hospitals and 65 health agencies located at �60 sites throughout the Loddon Mallee Region (LMHA �007).
The Loddon Mallee region covers �5% of Victoria’s land mass over which LMHA has implemented high-speed broadband services. The LMHA network is a secure, high-speed Wide Area Network (WAN), utilising Telstra IP infrastructure. The network has been designed to provide fast, reliable and secure connectivity to the internet, other health agencies and government. It has also been designed to perform at a service availability of 99.8%. Unlike other networks, access to the LMHA network is �:� contention which means that access availability and speed is not determined by the number of users trying to connect at any particular time. It allows connectivity to centralised resources and applications, as well as advanced voice, video and data services.
The geography and dispersion of patients across a wide area mean that some nurses are driving 800km for a single patient visit. As a result of the first 3 month trial of video conferencing, the network is on target to save some �75,000kms per year equivalent to 45.5 tonnes CO�-e.
88Towards a High-Bandwidth, Low-Carbon FutureClimate Risk
Future Opportunities
Quantifying Savings: Reduced Air Travel Emissions
The use of ‘On-Live’ High Definition Video Conferencing, as identified in this report, has an application to remote diagnostics for rural and regional Australia. This is a natural extension of the static image based diagnostics used by Tele-Derm, to detailed video based diagnostics which can be undertaken in real-time.
In order to quantify the potential value of such applications, a nominal patient is considered:
The patient requires specialist diagnosis which is only available in a major city.
The patient is 400km from the city and chooses to use air travel (for distances of 300km or less people may prefer to drive).
The overall efficiency of short distance air travel in smaller aircraft is significantly less than that of intercity travel and is assumed to be 0.05 litres per passenger per kilometre.
The patient has to travel three times; once for diagnosis, once for a stay with treatment and once for a follow up consultation.
Road transport and other emissions related to the trip are neglected.
•
•
•
•
•
The person is accompanied by a family member for each of the trips.
Based on these assumptions:
The total air travel involved for the patient and family member is 4,800kms.
The total amount of fuel used is �40 litres.
The total amount of greenhouse pollution caused is 0.77 tonnes CO�-e per patient.
Conclusion
Healthcare is at the front line of climate change risk and adaptation in Australia and these pressures can be expected to intensify. There is a role for ICT networks to overcome the tyranny of distance and the relative shortage of skills at a regional level by sharing limited human resources through online services. The double benefit is that overcoming the need to move people between healthcare centres will also reduce emissions associated with rural health care provision in Australia.
•
�.
�.
3.
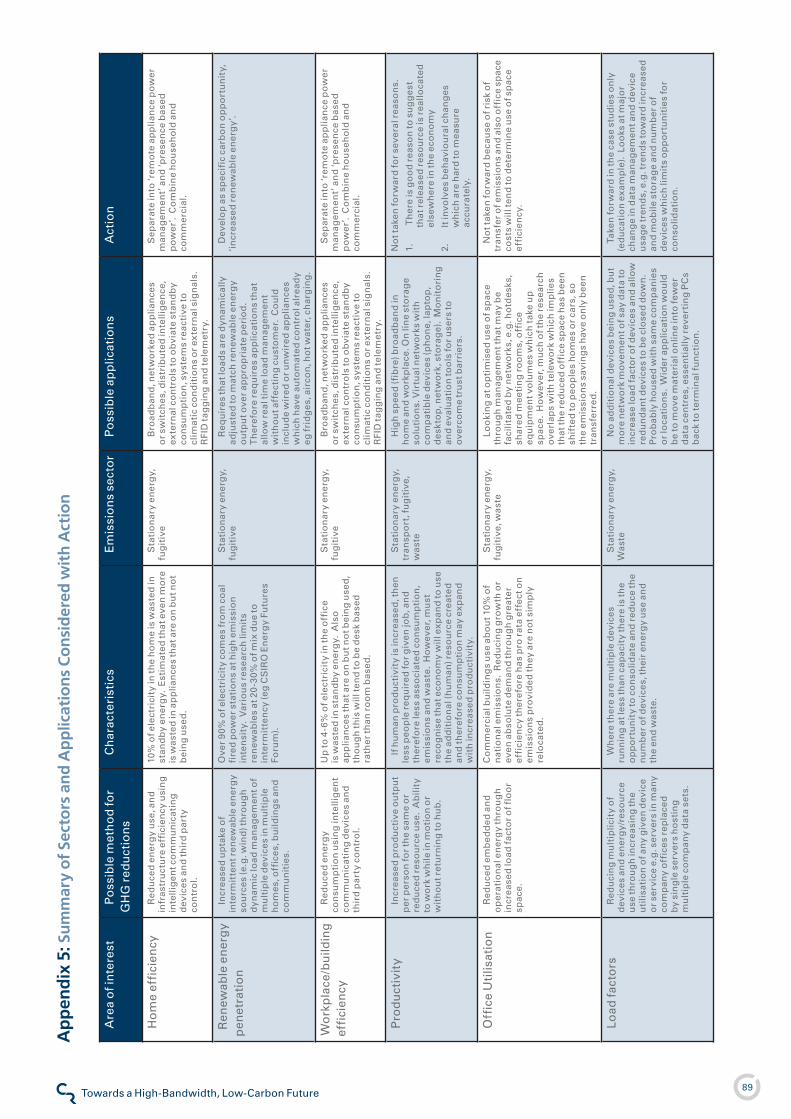
89Towards a High-Bandwidth, Low-Carbon FutureClimate Risk
Are
a o
f in
tere
stP
oss
ible
met
ho
d fo
r G
HG
red
uct
ion
sC
har
acte
rist
ics
Em
issi
on
s se
cto
rP
oss
ible
ap
plic
atio
ns
Act
ion
Ho
me
effi
cien
cy
Red
uce
d e
ner
gy
use
, an
d
infr
astr
uct
ure
eff
icie
ncy
usi
ng
in
telli
gen
t co
mm
un
icat
ing
d
evic
es a
nd
thir
d p
arty
co
ntr
ol.
�0%
of e
lect
rici
ty in
the
ho
me
is w
aste
d in
st
and
by
ener
gy.
Est
imat
ed th
at e
ven
mo
re
is w
aste
d in
ap
plia
nce
s th
at a
re o
n b
ut n
ot
bei
ng
use
d.
Sta
tio
nar
y en
erg
y,
fug
itiv
eB
road
ban
d, n
etw
ork
ed a
pp
lian
ces
or
swit
ches
, dis
trib
ute
d in
telli
gen
ce,
exte
rnal
co
ntr
ols
to o
bvi
ate
stan
db
y co
nsu
mp
tio
n, s
yste
ms
reac
tive
to
clim
atic
co
nd
itio
ns
or
exte
rnal
sig
nal
s.
RFI
D ta
gg
ing
an
d te
lem
etry
.
Sep
arat
e in
to ‘r
emo
te a
pp
lian
ce p
ow
er
man
agem
ent’
an
d ‘p
rese
nce
bas
ed
po
wer
’. C
om
bin
e h
ou
seh
old
an
d
com
mer
cial
.
Ren
ewab
le e
ner
gy
pen
etra
tio
nIn
crea
sed
up
take
of
inte
rmit
ten
t ren
ewab
le e
ner
gy
sou
rces
(e.g
. win
d) t
hro
ug
h
dyn
amic
load
man
agem
ent o
f m
ult
iple
dev
ices
in m
ult
iple
h
om
es, o
ffic
es, b
uild
ing
s an
d
com
mu
nit
ies.
Ove
r 9
0% o
f ele
ctri
city
co
mes
fro
m c
oal
fi
red
po
wer
sta
tio
ns
at h
igh
em
issi
on
in
ten
sity
. V
ario
us
rese
arch
lim
its
ren
ewab
les
at �
0-3
0% o
f mix
du
e to
in
term
itte
ncy
(eg
CS
IRO
En
erg
y Fu
ture
s Fo
rum
).
Sta
tio
nar
y en
erg
y,
fug
itiv
eR
equ
ires
that
load
s ar
e d
ynam
ical
ly
adju
sted
to m
atch
ren
ewab
le e
ner
gy
ou
tpu
t ove
r ap
pro
pri
ate
per
iod
. T
her
efo
re r
equ
ires
ap
plic
atio
ns
that
al
low
rea
l tim
e lo
ad m
anag
emen
t w
ith
ou
t aff
ecti
ng
cu
sto
mer
. C
ou
ld
incl
ud
e w
ired
or
un
wir
ed a
pp
lian
ces
wh
ich
hav
e au
tom
ated
co
ntr
ol a
lrea
dy
eg fr
idg
es, a
irco
n, h
ot w
ater
, ch
arg
ing
.
Dev
elo
p a
s sp
ecif
ic c
arb
on
op
po
rtu
nit
y,
‘incr
ease
d r
enew
able
en
erg
y’.
Wo
rkp
lace
/bu
ildin
g
effi
cien
cyR
edu
ced
en
erg
y co
nsu
mp
tio
n u
sin
g in
telli
gen
t co
mm
un
icat
ing
dev
ices
an
d
thir
d p
arty
co
ntr
ol.
Up
to 4
-6%
of e
lect
rici
ty in
the
off
ice
is w
aste
d in
sta
nd
by
ener
gy.
Als
o
app
lian
ces
that
are
on
bu
t no
t bei
ng
use
d,
tho
ug
h th
is w
ill te
nd
to b
e d
esk
bas
ed
rath
er th
an r
oo
m b
ased
.
Sta
tio
nar
y en
erg
y,
fug
itiv
eB
road
ban
d, n
etw
ork
ed a
pp
lian
ces
or
swit
ches
, dis
trib
ute
d in
telli
gen
ce,
exte
rnal
co
ntr
ols
to o
bvi
ate
stan
db
y co
nsu
mp
tio
n, s
yste
ms
reac
tive
to
clim
atic
co
nd
itio
ns
or
exte
rnal
sig
nal
s.
RFI
D ta
gg
ing
an
d te
lem
etry
.
Sep
arat
e in
to ‘r
emo
te a
pp
lian
ce p
ow
er
man
agem
ent’
an
d ‘p
rese
nce
bas
ed
po
wer
’. C
om
bin
e h
ou
seh
old
an
d
com
mer
cial
.
Pro
du
ctiv
ity
Incr
ease
d p
rod
uct
ive
ou
tpu
t p
er p
erso
n fo
r th
e sa
me
or
red
uce
d r
eso
urc
e u
se.
Ab
ility
to
wo
rk w
hile
in m
oti
on
or
wit
ho
ut r
etu
rnin
g to
hu
b.
If h
um
an p
rod
uct
ivit
y is
incr
ease
d, t
hen
le
ss p
eop
le r
equ
ired
for
giv
en jo
b, a
nd
th
eref
ore
less
ass
oci
ated
co
nsu
mp
tio
n,
emis
sio
ns
and
was
te.
Ho
wev
er, m
ust
re
cog
nis
e th
at e
con
om
y w
ill e
xpan
d to
use
th
e ad
dit
ion
al (h
um
an) r
eso
urc
e cr
eate
d
and
ther
efo
re c
on
sum
pti
on
may
exp
and
w
ith
incr
ease
d p
rod
uct
ivit
y.
Sta
tio
nar
y en
erg
y,
tran
spo
rt, f
ug
itiv
e,
was
te
Hig
h s
pee
d (f
ibre
) bro
adb
and
in
ho
me
and
wo
rkp
lace
. On
lin
e st
ora
ge
solu
tio
ns.
Vir
tual
net
wo
rks
wit
h
com
pat
ible
dev
ices
(ph
on
e, la
pto
p,
des
kto
p, n
etw
ork
, sto
rag
e).
Mo
nit
ori
ng
an
d e
valu
atio
n to
ols
for
use
rs to
o
verc
om
e tr
ust
bar
rier
s.
No
t tak
en fo
rwar
d fo
r se
vera
l rea
son
s.
Th
ere
is g
oo
d r
easo
n to
su
gg
est
that
rel
ease
d r
eso
urc
e is
rea
lloca
ted
el
sew
her
e in
the
eco
no
my
It in
volv
es b
ehav
iou
ral c
han
ges
w
hic
h a
re h
ard
to m
easu
re
accu
rate
ly.
�. �.
Off
ice
Uti
lisat
ion
Red
uce
d e
mb
edd
ed a
nd
o
per
atio
nal
en
erg
y th
rou
gh
in
crea
sed
load
fact
or
of f
loo
r sp
ace.
Co
mm
erci
al b
uild
ing
s u
se a
bo
ut �
0% o
f n
atio
nal
em
issi
on
s. R
edu
cin
g g
row
th o
r ev
en a
bso
lute
dem
and
thro
ug
h g
reat
er
effi
cien
cy th
eref
ore
has
pro
rat
a ef
fect
on
em
issi
on
s p
rovi
ded
they
are
no
t sim
ply
re
loca
ted
.
Sta
tio
nar
y en
erg
y,
fug
itiv
e, w
aste
Loo
kin
g a
t op
tim
ised
use
of s
pac
e th
rou
gh
man
agem
ent t
hat
may
be
faci
litat
ed b
y n
etw
ork
s, e
.g. h
otd
esks
, sh
ared
mee
tin
g r
oo
ms,
off
ice
equ
ipm
ent v
olu
mes
wh
ich
take
up
sp
ace.
Ho
wev
er, m
uch
of t
he
rese
arch
o
verl
aps
wit
h te
lew
ork
wh
ich
imp
lies
that
the
red
uce
d o
ffic
e sp
ace
has
bee
n
shif
ted
to p
eop
les
ho
mes
or
cars
, so
th
e em
issi
on
s sa
vin
gs
hav
e o
nly
bee
n
tran
sfer
red
.
No
t tak
en fo
rwar
d b
ecau
se o
f ris
k o
f tr
ansf
er o
f em
issi
on
s an
d a
lso
off
ice
spac
e co
sts
will
ten
d to
det
erm
ine
use
of s
pac
e ef
fici
ency
.
Load
fact
ors
Red
uci
ng
mu
ltip
licit
y o
f d
evic
es a
nd
en
erg
y/re
sou
rce
use
thro
ug
h in
crea
sin
g th
e u
tilis
atio
n o
f an
y g
iven
dev
ice
or
serv
ice
e.g
. ser
vers
in m
any
com
pan
y o
ffic
es r
epla
ced
b
y si
ng
le s
erve
rs h
ost
ing
m
ult
iple
co
mp
any
dat
a se
ts.
Wh
ere
ther
e ar
e m
ult
iple
dev
ices
ru
nn
ing
at l
ess
than
cap
acit
y th
ere
is th
e o
pp
ort
un
ity
to c
on
solid
ate
and
red
uce
the
nu
mb
er o
f dev
ices
, th
eir
ener
gy
use
an
d
the
end
was
te.
Sta
tio
nar
y en
erg
y,
Was
teN
o a
dd
itio
nal
dev
ices
bei
ng
use
d, b
ut
mo
re n
etw
ork
mo
vem
ent o
f say
dat
a to
in
crea
se lo
ad fa
cto
r o
f dev
ices
an
d a
llow
re
du
nd
ant d
evic
es to
be
clo
sed
do
wn
. P
rob
ably
ho
use
d w
ith
sam
e co
mp
anie
s o
r lo
cati
on
s. W
ider
ap
plic
atio
n w
ou
ld
be
to m
ove
mat
eria
l on
line
into
few
er
dat
a ce
ntr
es, e
ssen
tial
ly r
ever
tin
g P
Cs
bac
k to
term
inal
fun
ctio
n.
Take
n fo
rwar
d in
the
case
stu
die
s o
nly
(e
du
cati
on
exa
mp
le).
Lo
oks
at m
ajo
r ch
ang
e in
dat
a m
anag
emen
t an
d d
evic
e u
sag
e tr
end
s, e
.g. t
ren
ds
tow
ard
incr
ease
d
and
mo
bile
sto
rag
e an
d n
um
ber
of
dev
ices
wh
ich
lim
its
op
po
rtu
nit
ies
for
con
solid
atio
n.
Ap
pen
dix
5: S
um
mar
y o
f Se
cto
rs a
nd
Ap
plic
atio
ns
Co
nsi
der
ed w
ith
Act
ion
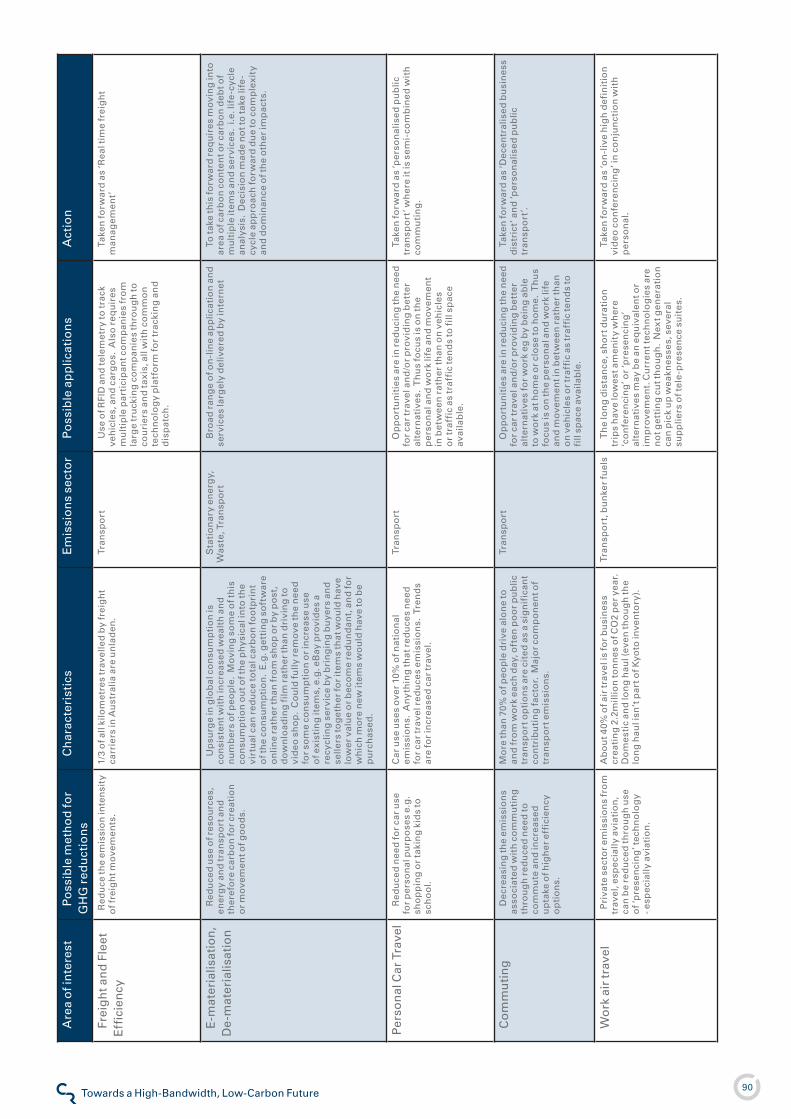
90Towards a High-Bandwidth, Low-Carbon FutureClimate Risk
Are
a o
f in
tere
stP
oss
ible
met
ho
d fo
r G
HG
red
uct
ion
sC
har
acte
rist
ics
Em
issi
on
s se
cto
rP
oss
ible
ap
plic
atio
ns
Act
ion
Frei
gh
t an
d F
leet
E
ffic
ien
cyR
edu
ce th
e em
issi
on
inte
nsi
ty
of f
reig
ht m
ove
men
ts.
�/3
of a
ll ki
lom
etre
s tr
avel
led
by
frei
gh
t ca
rrie
rs in
Au
stra
lia a
re u
nla
den
.Tr
ansp
ort
Use
of R
FID
an
d te
lem
etry
to tr
ack
veh
icle
s, a
nd
car
go
s. A
lso
req
uir
es
mu
ltip
le p
arti
cip
ant c
om
pan
ies
fro
m
larg
e tr
uck
ing
co
mp
anie
s th
rou
gh
to
cou
rier
s an
d ta
xis,
all
wit
h c
om
mo
n
tech
no
log
y p
latf
orm
for
trac
kin
g a
nd
d
isp
atch
.
Take
n fo
rwar
d a
s ‘R
eal t
ime
frei
gh
t m
anag
emen
t’
E-m
ater
ialis
atio
n,
De-
mat
eria
lisat
ion
Red
uce
d u
se o
f res
ou
rces
, en
erg
y an
d tr
ansp
ort
an
d
ther
efo
re c
arb
on
for
crea
tio
n
or
mo
vem
ent o
f go
od
s.
Up
surg
e in
glo
bal
co
nsu
mp
tio
n is
co
nsi
sten
t wit
h in
crea
sed
wea
lth
an
d
nu
mb
ers
of p
eop
le.
Mo
vin
g s
om
e o
f th
is
con
sum
pti
on
ou
t of t
he
ph
ysic
al in
to th
e vi
rtu
al c
an r
edu
ce to
tal c
arb
on
foo
tpri
nt
of t
he
con
sum
pti
on
. E
.g. g
etti
ng
so
ftw
are
on
line
rath
er th
an fr
om
sh
op
or
by
po
st,
do
wn
load
ing
film
rat
her
than
dri
vin
g to
vi
deo
sh
op
. C
ou
ld fu
lly r
emo
ve th
e n
eed
fo
r so
me
con
sum
pti
on
or
incr
ease
use
o
f exi
stin
g it
ems,
e.g
. eB
ay p
rovi
des
a
recy
clin
g s
ervi
ce b
y b
rin
gin
g b
uye
rs a
nd
se
llers
tog
eth
er fo
r it
ems
that
wo
uld
hav
e lo
wer
val
ue
or
bec
om
e re
du
nd
ant,
an
d fo
r w
hic
h m
ore
new
item
s w
ou
ld h
ave
to b
e p
urc
has
ed.
Sta
tio
nar
y en
erg
y,
Was
te, T
ran
spo
rtB
road
ran
ge
of o
n-l
ine
app
licat
ion
an
d
serv
ices
larg
ely
del
iver
ed b
y in
tern
etTo
take
this
forw
ard
req
uir
es m
ovi
ng
into
ar
ea o
f car
bo
n c
on
ten
t or
carb
on
deb
t of
mu
ltip
le it
ems
and
ser
vice
s. i
.e. l
ife
-cyc
le
anal
ysis
. D
ecis
ion
mad
e n
ot t
o ta
ke li
fe-
cycl
e ap
pro
ach
forw
ard
du
e to
co
mp
lexi
ty
and
do
min
ance
of t
he
oth
er im
pac
ts.
Per
son
al C
ar T
rave
lR
edu
ced
nee
d fo
r ca
r u
se
for
per
son
al p
urp
ose
s e.
g.
sho
pp
ing
or
taki
ng
kid
s to
sc
ho
ol.
Car
use
use
s o
ver
�0%
of n
atio
nal
em
issi
on
s. A
ny
thin
g th
at r
edu
ces
nee
d
for
car
trav
el r
edu
ces
emis
sio
ns.
Tre
nd
s ar
e fo
r in
crea
sed
car
trav
el.
Tran
spo
rtO
pp
ort
un
itie
s ar
e in
red
uci
ng
the
nee
d
for
car
trav
el a
nd
/or
pro
vid
ing
bet
ter
alte
rnat
ives
. T
hu
s fo
cus
is o
n th
e p
erso
nal
an
d w
ork
life
an
d m
ove
men
t in
bet
wee
n r
ath
er th
an o
n v
ehic
les
or
traf
fic
as tr
affi
c te
nd
s to
fill
spac
e av
aila
ble
.
Take
n fo
rwar
d a
s ‘p
erso
nal
ised
pu
blic
tr
ansp
ort
’ wh
ere
it is
sem
i-co
mb
ined
wit
h
com
mu
tin
g.
Co
mm
uti
ng
D
ecre
asin
g th
e em
issi
on
s as
soci
ated
wit
h c
om
mu
tin
g
thro
ug
h r
edu
ced
nee
d to
co
mm
ute
an
d in
crea
sed
u
pta
ke o
f hig
her
eff
icie
ncy
o
pti
on
s.
Mo
re th
an 7
0% o
f peo
ple
dri
ve a
lon
e to
an
d fr
om
wo
rk e
ach
day
, oft
en p
oo
r p
ub
lic
tran
spo
rt o
pti
on
s ar
e ci
ted
as
a si
gn
ific
ant
con
trib
uti
ng
fact
or.
Maj
or
com
po
nen
t of
tran
spo
rt e
mis
sio
ns.
Tran
spo
rtO
pp
ort
un
itie
s ar
e in
red
uci
ng
the
nee
d
for
car
trav
el a
nd
/or
pro
vid
ing
bet
ter
alte
rnat
ives
for
wo
rk e
g b
y b
ein
g a
ble
to
wo
rk a
t ho
me
or
clo
se to
ho
me.
Th
us
focu
s is
on
the
per
son
al a
nd
wo
rk li
fe
and
mo
vem
ent i
n b
etw
een
rat
her
than
o
n v
ehic
les
or
traf
fic
as tr
affi
c te
nd
s to
fi
ll sp
ace
avai
lab
le.
Take
n fo
rwar
d a
s ‘D
ecen
tral
ised
bu
sin
ess
dis
tric
t’ a
nd
‘per
son
alis
ed p
ub
lic
tran
spo
rt’.
Wo
rk a
ir tr
avel
P
riva
te s
ecto
r em
issi
on
s fr
om
tr
avel
, esp
ecia
lly a
viat
ion
, ca
n b
e re
du
ced
thro
ug
h u
se
of ‘
pre
sen
cin
g’ t
ech
no
log
y - e
spec
ially
avi
atio
n.
Ab
ou
t 40%
of a
ir tr
avel
is fo
r b
usi
nes
s cr
eati
ng
�.�
mill
ion
ton
nes
of C
O�
per
yea
r.
Do
mes
tic
and
lon
g h
aul (
even
tho
ug
h th
e lo
ng
hau
l isn
’t p
art o
f Kyo
to in
ven
tory
).
Tran
spo
rt, b
un
ker
fuel
sT
he
lon
g d
ista
nce
, sh
ort
du
rati
on
tr
ips
hav
e lo
wes
t am
enit
y w
her
e ‘c
on
fere
nci
ng
’ or
‘pre
sen
cin
g’
alte
rnat
ives
may
be
an e
qu
ival
ent o
r im
pro
vem
ent.
Cu
rren
t tec
hn
olo
gie
s ar
e n
ot g
etti
ng
cu
t th
ou
gh
. N
ext g
ener
atio
n
can
pic
k u
p w
eakn
esse
s, s
ever
al
sup
plie
rs o
f tel
e-p
rese
nce
su
ites
.
Take
n fo
rwar
d a
s ‘o
n-l
ive
hig
h d
efin
itio
n
vid
eo c
on
fere
nci
ng
’ in
co
nju
nct
ion
wit
h
per
son
al.
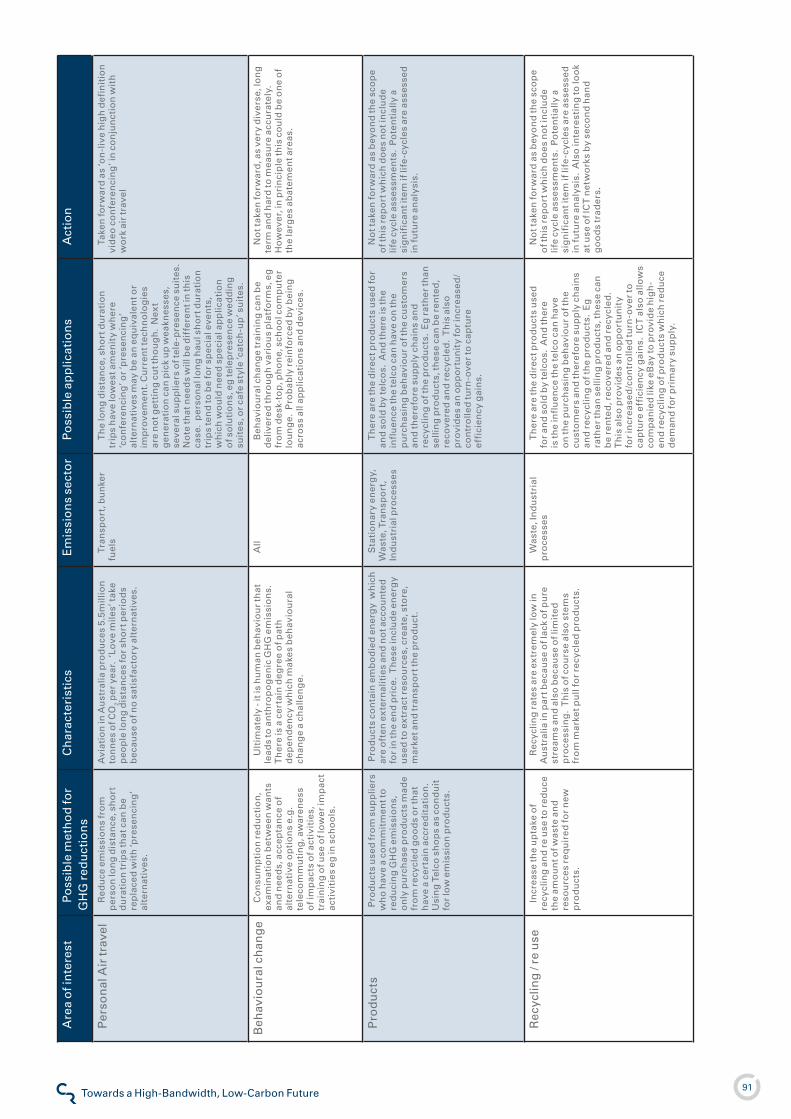
9�Towards a High-Bandwidth, Low-Carbon FutureClimate Risk
Are
a o
f in
tere
stP
oss
ible
met
ho
d fo
r G
HG
red
uct
ion
sC
har
acte
rist
ics
Em
issi
on
s se
cto
rP
oss
ible
ap
plic
atio
ns
Act
ion
Per
son
al A
ir tr
avel
Red
uce
em
issi
on
s fr
om
p
erso
n lo
ng
dis
tan
ce, s
ho
rt
du
rati
on
trip
s th
at c
an b
e re
pla
ced
wit
h ‘p
rese
nci
ng
’ al
tern
ativ
es.
Avi
atio
n in
Au
stra
lia p
rod
uce
s 5.
5mill
ion
to
nn
es o
f CO
� per
yea
r. ‘
Love
mile
s’ ta
ke
peo
ple
lon
g d
ista
nce
s fo
r sh
ort
per
iod
s b
ecau
se o
f no
sat
isfa
cto
ry a
lter
nat
ives
.
Tran
spo
rt, b
un
ker
fuel
sT
he
lon
g d
ista
nce
, sh
ort
du
rati
on
tr
ips
hav
e lo
wes
t am
enit
y w
her
e ‘c
on
fere
nci
ng
’ or
‘pre
sen
cin
g’
alte
rnat
ives
may
be
an e
qu
ival
ent o
r im
pro
vem
ent.
Cu
rren
t tec
hn
olo
gie
s ar
e n
ot g
etti
ng
cu
t th
ou
gh
. N
ext
gen
erat
ion
can
pic
k u
p w
eakn
esse
s,
seve
ral s
up
plie
rs o
f tel
e-p
rese
nce
su
ites
. N
ote
that
nee
ds
will
be
dif
fere
nt i
n th
is
case
. p
erso
nal
lon
g h
aul s
ho
rt d
ura
tio
n
trip
s te
nd
to b
e fo
r sp
ecia
l eve
nts
, w
hic
h w
ou
ld n
eed
sp
ecia
l ap
plic
atio
n
of s
olu
tio
ns,
eg
tele
pre
sen
ce w
edd
ing
su
ites
, or
cafe
sty
le ‘c
atch
-up
’ su
ites
.
Take
n fo
rwar
d a
s ‘o
n-l
ive
hig
h d
efin
itio
n
vid
eo c
on
fere
nci
ng
’ in
co
nju
nct
ion
wit
h
wo
rk a
ir tr
avel
Beh
avio
ura
l ch
ang
eC
on
sum
pti
on
red
uct
ion
, ex
amin
atio
n b
etw
een
wan
ts
and
nee
ds,
acc
epta
nce
of
alte
rnat
ive
op
tio
ns
e.g
. te
leco
mm
uti
ng
, aw
aren
ess
of i
mp
acts
of a
ctiv
itie
s,
trai
nin
g o
f use
of l
ow
er im
pac
t ac
tivi
ties
eg
in s
cho
ols
.
Ult
imat
ely
- it i
s h
um
an b
ehav
iou
r th
at
lead
s to
an
thro
po
gen
ic G
HG
em
issi
on
s.
Th
ere
is a
cer
tain
deg
ree
of p
ath
d
epen
den
cy w
hic
h m
akes
beh
avio
ura
l ch
ang
e a
chal
len
ge.
All
Beh
avio
ura
l ch
ang
e tr
ain
ing
can
be
del
iver
ed th
rou
gh
var
iou
s p
latf
orm
s, e
g
fro
m d
esk-
top
, ph
on
e, s
cho
ol c
om
pu
ter
lou
ng
e. P
rob
ably
rei
nfo
rced
by
bei
ng
ac
ross
all
app
licat
ion
s an
d d
evic
es.
No
t tak
en fo
rwar
d, a
s ve
ry d
iver
se, l
on
g
term
an
d h
ard
to m
easu
re a
ccu
rate
ly.
Ho
wev
er, i
n p
rin
cip
le th
is c
ou
ld b
e o
ne
of
the
larg
es a
bat
emen
t are
as.
Pro
du
cts
Pro
du
cts
use
d fr
om
su
pp
liers
w
ho
hav
e a
com
mit
men
t to
re
du
cin
g G
HG
em
issi
on
s,
on
ly p
urc
has
e p
rod
uct
s m
ade
fro
m r
ecyc
led
go
od
s o
r th
at
hav
e a
cert
ain
acc
red
itat
ion
. U
sin
g T
elco
sh
op
s as
co
nd
uit
fo
r lo
w e
mis
sio
n p
rod
uct
s.
Pro
du
cts
con
tain
em
bo
die
d e
ner
gy
wh
ich
ar
e o
ften
ex
tern
alit
ies
and
no
t acc
ou
nte
d
for
in th
e en
d p
rice
. T
hes
e in
clu
de
ener
gy
use
d to
ex
trac
t res
ou
rces
, cre
ate,
sto
re,
mar
ket a
nd
tran
spo
rt th
e p
rod
uct
.
Sta
tio
nar
y en
erg
y,
Was
te, T
ran
spo
rt,
Ind
ust
rial
pro
cess
es
Th
ere
are
the
dir
ect p
rod
uct
s u
sed
for
and
so
ld b
y te
lco
s. A
nd
ther
e is
the
infl
uen
ce th
e te
lco
can
hav
e o
n th
e p
urc
has
ing
beh
avio
ur
of t
he
cust
om
ers
and
ther
efo
re s
up
ply
ch
ain
s an
d
recy
clin
g o
f th
e p
rod
uct
s. E
g r
ath
er th
an
selli
ng
pro
du
cts,
thes
e ca
n b
e re
nte
d,
reco
vere
d a
nd
rec
ycle
d.
Th
is a
lso
p
rovi
des
an
op
po
rtu
nit
y fo
r in
crea
sed
/co
ntr
olle
d tu
rn-o
ver
to c
aptu
re
effi
cien
cy g
ain
s.
No
t tak
en fo
rwar
d a
s b
eyo
nd
the
sco
pe
of t
his
rep
ort
wh
ich
do
es n
ot i
ncl
ud
e lif
e cy
cle
asse
ssm
ents
. P
ote
nti
ally
a
sig
nif
ican
t ite
m if
life
-cyc
les
are
asse
ssed
in
futu
re a
nal
ysis
.
Rec
yclin
g /
re u
seIn
crea
se th
e u
pta
ke o
f re
cycl
ing
an
d r
e u
se to
red
uce
th
e am
ou
nt o
f was
te a
nd
re
sou
rces
req
uir
ed fo
r n
ew
pro
du
cts.
Rec
yclin
g r
ates
are
ex
trem
ely
low
in
Au
stra
lia in
par
t bec
ause
of l
ack
of p
ure
st
ream
s an
d a
lso
bec
ause
of l
imit
ed
pro
cess
ing
. T
his
of c
ou
rse
also
ste
ms
fro
m m
arke
t pu
ll fo
r re
cycl
ed p
rod
uct
s.
Was
te, I
nd
ust
rial
p
roce
sses
Th
ere
are
the
dir
ect p
rod
uct
s u
sed
fo
r an
d s
old
by
telc
os.
An
d th
ere
is th
e in
flu
ence
the
telc
o c
an h
ave
on
the
pu
rch
asin
g b
ehav
iou
r o
f th
e cu
sto
mer
s an
d th
eref
ore
su
pp
ly c
hai
ns
and
rec
yclin
g o
f th
e p
rod
uct
s. E
g
rath
er th
an s
ellin
g p
rod
uct
s, th
ese
can
b
e re
nte
d, r
eco
vere
d a
nd
rec
ycle
d.
Th
is a
lso
pro
vid
es a
n o
pp
ort
un
ity
for
incr
ease
d/c
on
tro
lled
turn
-ove
r to
ca
ptu
re e
ffic
ien
cy g
ain
s. I
CT
als
o a
llow
s co
mp
anie
d li
ke e
Bay
to p
rovi
de
hig
h-
end
rec
yclin
g o
f pro
du
cts
wh
ich
red
uce
d
eman
d fo
r p
rim
ary
sup
ply
.
No
t tak
en fo
rwar
d a
s b
eyo
nd
the
sco
pe
of t
his
rep
ort
wh
ich
do
es n
ot i
ncl
ud
e lif
e cy
cle
asse
ssm
ents
. P
ote
nti
ally
a
sig
nif
ican
t ite
m if
life
-cyc
les
are
asse
ssed
in
futu
re a
nal
ysis
. A
lso
inte
rest
ing
to lo
ok
at u
se o
f IC
T n
etw
ork
s b
y se
con
d h
and
g
oo
ds
trad
ers.
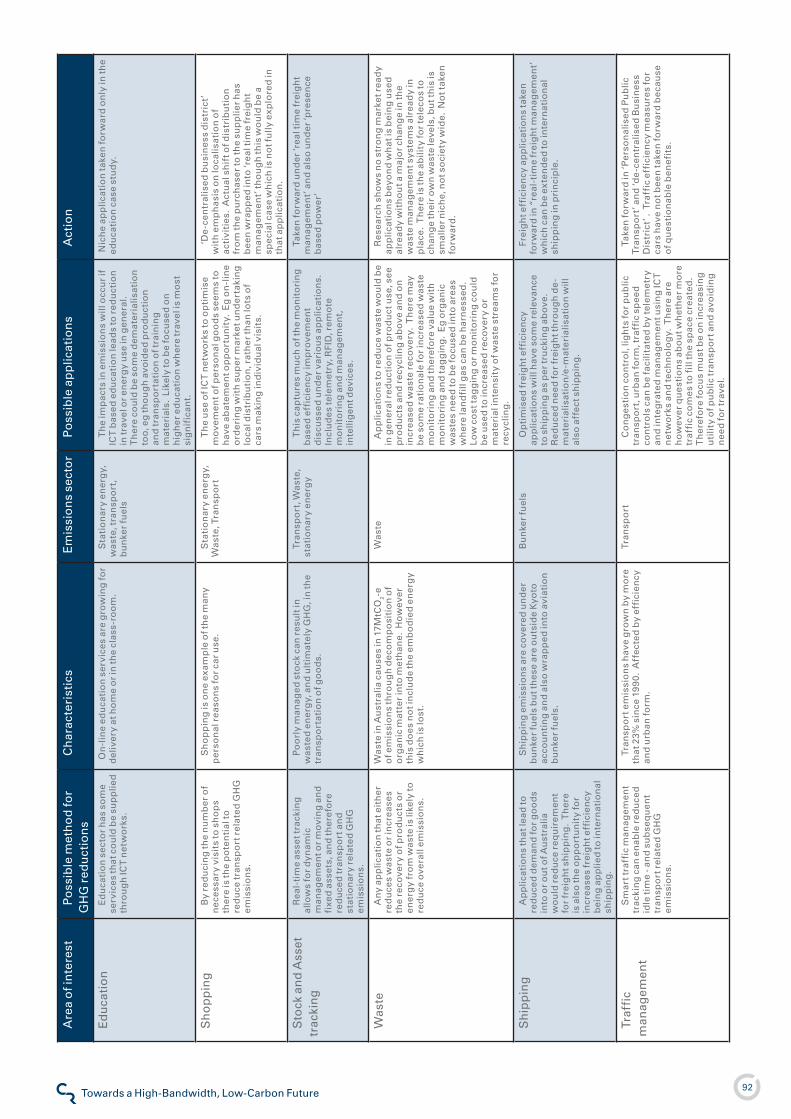
9�Towards a High-Bandwidth, Low-Carbon FutureClimate Risk
Are
a o
f in
tere
stP
oss
ible
met
ho
d fo
r G
HG
red
uct
ion
sC
har
acte
rist
ics
Em
issi
on
s se
cto
rP
oss
ible
ap
plic
atio
ns
Act
ion
Ed
uca
tio
nE
du
cati
on
sec
tor
has
so
me
serv
ices
that
co
uld
be
sup
plie
d
thro
ug
h IC
T n
etw
ork
s.
On
-lin
e ed
uca
tio
n s
ervi
ces
are
gro
win
g fo
r d
eliv
ery
at h
om
e o
r in
the
clas
s-ro
om
.S
tati
on
ary
ener
gy,
w
aste
, tra
nsp
ort
, b
un
ker
fuel
s
Th
e im
pac
ts in
em
issi
on
s w
ill o
ccu
r if
IC
T b
ased
ed
uca
tio
n le
ads
to r
edu
ctio
n
in tr
avel
or
ener
gy
use
in g
ener
al.
Th
ere
cou
ld b
e so
me
dem
ater
ialis
atio
n
too
, eg
tho
ug
h a
void
ed p
rod
uct
ion
an
d tr
ansp
ort
atio
n o
f tra
inin
g
mat
eria
ls.
Like
ly to
be
focu
sed
on
h
igh
er e
du
cati
on
wh
ere
trav
el is
mo
st
sig
nif
ican
t.
Nic
he
app
licat
ion
take
n fo
rwar
d o
nly
in th
e ed
uca
tio
n c
ase
stu
dy.
Sh
op
pin
gB
y re
du
cin
g th
e n
um
ber
of
nec
essa
ry v
isit
s to
sh
op
s th
ere
is th
e p
ote
nti
al to
re
du
ce tr
ansp
ort
rel
ated
GH
G
emis
sio
ns.
Sh
op
pin
g is
on
e ex
amp
le o
f th
e m
any
per
son
al r
easo
ns
for
car
use
. S
tati
on
ary
ener
gy,
W
aste
, Tra
nsp
ort
Th
e u
se o
f IC
T n
etw
ork
s to
op
tim
ise
mo
vem
ent o
f per
son
al g
oo
ds
seem
s to
h
ave
abat
emen
t op
po
rtu
nit
y. E
g o
n-l
ine
ord
erin
g w
ith
su
per
mar
ket u
nd
erta
kin
g
loca
l dis
trib
uti
on
, rat
her
than
lots
of
cars
mak
ing
ind
ivid
ual
vis
its.
‘De
-cen
tral
ised
bu
sin
ess
dis
tric
t’
wit
h e
mp
has
is o
n lo
calis
atio
n o
f ac
tivi
ties
. A
ctu
al s
hif
t of d
istr
ibu
tio
n
fro
m th
e p
urc
has
er to
the
sup
plie
r h
as
bee
n w
rap
ped
into
‘rea
l tim
e fr
eig
ht
man
agem
ent’
tho
ug
h th
is w
ou
ld b
e a
spec
ial c
ase
wh
ich
is n
ot f
ully
exp
lore
d in
th
at a
pp
licat
ion
.
Sto
ck a
nd
Ass
et
trac
kin
gR
eal-
tim
e as
set t
rack
ing
al
low
s fo
r d
ynam
ic
man
agem
ent o
r m
ovi
ng
an
d
fixe
d a
sset
s, a
nd
ther
efo
re
red
uce
d tr
ansp
ort
an
d
stat
ion
ary
rela
ted
GH
G
emis
sio
ns.
Po
orl
y m
anag
ed s
tock
can
res
ult
in
was
ted
en
erg
y, a
nd
ult
imat
ely
GH
G, i
n th
e tr
ansp
ort
atio
n o
f go
od
s.
Tran
spo
rt, W
aste
, st
atio
nar
y en
erg
yT
his
cap
ture
s m
uch
of t
he
mo
nit
ori
ng
b
ased
eff
icie
ncy
imp
rove
men
t d
iscu
ssed
un
der
var
iou
s ap
plic
atio
ns.
In
clu
des
tele
met
ry, R
FID
, rem
ote
m
on
ito
rin
g a
nd
man
agem
ent,
in
telli
gen
t dev
ices
.
Take
n fo
rwar
d u
nd
er ‘r
eal t
ime
frei
gh
t m
anag
emen
t’ a
nd
als
o u
nd
er ‘p
rese
nce
b
ased
po
wer
’
Was
te
An
y ap
plic
atio
n th
at e
ith
er
red
uce
s w
aste
or
incr
ease
s th
e re
cove
ry o
f pro
du
cts
or
ener
gy
fro
m w
aste
is li
kely
to
red
uce
ove
rall
emis
sio
ns.
Was
te in
Au
stra
lia c
ause
s in
�7M
tCO
�-e
of e
mis
sio
ns
thro
ug
h d
eco
mp
osi
tio
n o
f o
rgan
ic m
atte
r in
to m
eth
ane.
Ho
wev
er
this
do
es n
ot i
ncl
ud
e th
e em
bo
die
d e
ner
gy
wh
ich
is lo
st.
Was
teA
pp
licat
ion
s to
red
uce
was
te w
ou
ld b
e in
gen
eral
red
uct
ion
of p
rod
uct
use
, see
p
rod
uct
s an
d r
ecyc
ling
ab
ove
an
d o
n
incr
ease
d w
aste
rec
ove
ry.
Th
ere
may
b
e so
me
rati
on
ale
for
incr
ease
d w
aste
m
on
ito
rin
g a
nd
ther
efo
re v
alu
e w
ith
m
on
ito
rin
g a
nd
tag
gin
g.
Eg
org
anic
w
aste
s n
eed
to b
e fo
cuse
d in
to a
reas
w
her
e la
nd
fill
gas
can
be
har
nes
sed
. Lo
w c
ost
tag
gin
g o
r m
on
ito
rin
g c
ou
ld
be
use
d to
incr
ease
d r
eco
very
or
mat
eria
l in
ten
sity
of w
aste
str
eam
s fo
r re
cycl
ing
.
Res
earc
h s
ho
ws
no
str
on
g m
arke
t rea
dy
app
licat
ion
s b
eyo
nd
wh
at is
bei
ng
use
d
alre
ady
wit
ho
ut a
maj
or
chan
ge
in th
e w
aste
man
agem
ent s
yste
ms
alre
ady
in
pla
ce.
Th
ere
is th
e ab
ility
for
tele
cos
to
chan
ge
thei
r o
wn
was
te le
vels
, bu
t th
is is
sm
alle
r n
ich
e, n
ot s
oci
ety
wid
e. N
ot t
aken
fo
rwar
d.
Sh
ipp
ing
Ap
plic
atio
ns
that
lead
to
red
uce
d d
eman
d fo
r g
oo
ds
into
or
ou
t of A
ust
ralia
w
ou
ld r
edu
ce r
equ
irem
ent
for
frei
gh
t sh
ipp
ing
. T
her
e is
als
o th
e o
pp
ort
un
ity
for
incr
ease
s fr
eig
ht e
ffic
ien
cy
bei
ng
ap
plie
d to
inte
rnat
ion
al
ship
pin
g.
Sh
ipp
ing
em
issi
on
s ar
e co
vere
d u
nd
er
bu
nke
r fu
els
bu
t th
ese
are
ou
tsid
e K
yoto
ac
cou
nti
ng
an
d a
lso
wra
pp
ed in
to a
viat
ion
b
un
ker
fuel
s.
Bu
nke
r fu
els
Op
tim
ised
frei
gh
t eff
icie
ncy
ap
plic
atio
ns
will
hav
e so
me
rele
van
ce
to s
hip
pin
g a
s p
er tr
uck
ing
ab
ove
. R
edu
ced
nee
d fo
r fr
eig
ht t
hro
ug
h d
e-
mat
eria
lisat
ion
/e-m
ater
ialis
atio
n w
ill
also
aff
ect s
hip
pin
g.
Frei
gh
t eff
icie
ncy
ap
plic
atio
ns
take
n
forw
ard
in “
real
-tim
e fr
eig
ht m
anag
emen
t’
wh
ich
can
be
exte
nd
ed to
inte
rnat
ion
al
ship
pin
g in
pri
nci
ple
.
Traf
fic
man
agem
ent
Sm
art t
raff
ic m
anag
emen
t tr
acki
ng
can
en
able
red
uce
d
idle
tim
e - a
nd
su
bse
qu
ent
tran
spo
rt r
elat
ed G
HG
em
issi
on
s.
Tran
spo
rt e
mis
sio
ns
hav
e g
row
n b
y m
ore
th
at �
3% s
ince
�99
0. A
ffec
ted
by
effi
cien
cy
and
urb
an fo
rm.
Tran
spo
rtC
on
ges
tio
n c
on
tro
l, lig
hts
for
pu
blic
tr
ansp
ort
, urb
an fo
rm, t
raff
ic s
pee
d
con
tro
ls c
an b
e fa
cilit
ated
by
tele
met
ry
and
inte
gra
ted
man
agem
ent u
sin
g IC
T
net
wo
rks
and
tech
no
log
y. T
her
e ar
e h
ow
ever
qu
esti
on
s ab
ou
t wh
eth
er m
ore
tr
affi
c co
mes
to fi
ll th
e sp
ace
crea
ted
. T
her
efo
re fo
cus
mu
st b
e o
n in
crea
sin
g
uti
lity
of p
ub
lic tr
ansp
ort
an
d a
void
ing
n
eed
for
trav
el.
Take
n fo
rwar
d in
‘Per
son
alis
ed P
ub
lic
Tran
spo
rt’ a
nd
‘de
-cen
tral
ised
Bu
sin
ess
Dis
tric
t’ .
Tra
ffic
eff
icie
ncy
mea
sure
s fo
r ca
rs h
ave
no
t bee
n ta
ken
forw
ard
bec
ause
o
f qu
esti
on
able
ben
efit
s.
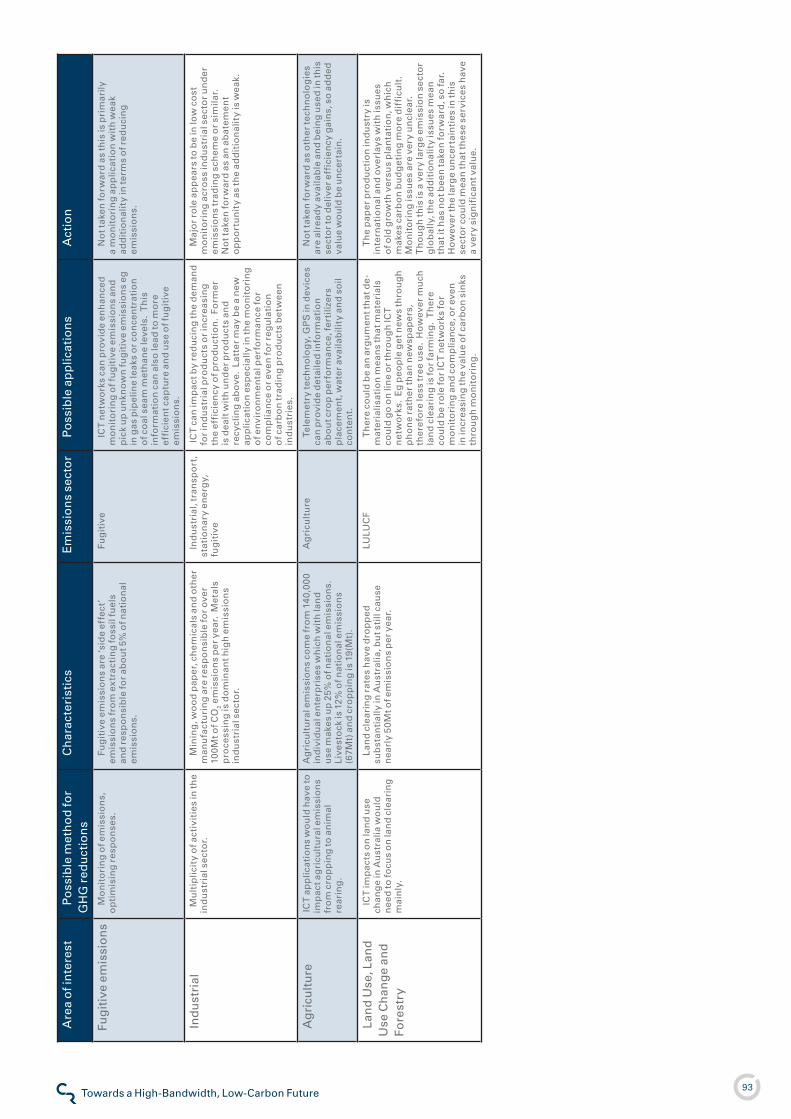
93Towards a High-Bandwidth, Low-Carbon FutureClimate Risk
Are
a o
f in
tere
stP
oss
ible
met
ho
d fo
r G
HG
red
uct
ion
sC
har
acte
rist
ics
Em
issi
on
s se
cto
rP
oss
ible
ap
plic
atio
ns
Act
ion
Fug
itiv
e em
issi
on
sM
on
ito
rin
g o
f em
issi
on
s,
op
tim
isin
g r
esp
on
ses.
Fug
itiv
e em
issi
on
s ar
e ‘s
ide
effe
ct’
emis
sio
ns
fro
m e
xtr
acti
ng
foss
il fu
els
and
res
po
nsi
ble
for
abo
ut 5
% o
f nat
ion
al
emis
sio
ns.
Fug
itiv
eIC
T n
etw
ork
s ca
n p
rovi
de
enh
ance
d
mo
nit
ori
ng
of f
ug
itiv
e em
issi
on
s an
d
pic
k u
p u
nkn
ow
n fu
git
ive
emis
sio
ns
eg
in g
as p
ipel
ine
leak
s o
r co
nce
ntr
atio
n
of c
oal
sea
m m
eth
ane
leve
ls.
Th
is
info
rmat
ion
can
als
o le
ad to
mo
re
effi
cien
t cap
ture
an
d u
se o
f fu
git
ive
emis
sio
ns.
No
t tak
en fo
rwar
d a
s th
is is
pri
mar
ily
a m
on
ito
rin
g a
pp
licat
ion
wit
h w
eak
add
itio
nal
ity
in te
rms
of r
edu
cin
g
emis
sio
ns.
Ind
ust
rial
M
ult
iplic
ity
of a
ctiv
itie
s in
the
ind
ust
rial
sec
tor.
Min
ing
, wo
od
pap
er, c
hem
ical
s an
d o
ther
m
anu
fact
uri
ng
are
res
po
nsi
ble
for
ove
r �0
0Mt o
f CO
� em
issi
on
s p
er y
ear.
Met
als
pro
cess
ing
is d
om
inan
t hig
h e
mis
sio
ns
ind
ust
rial
sec
tor.
Ind
ust
rial
, tra
nsp
ort
, st
atio
nar
y en
erg
y,
fug
itiv
e
ICT
can
imp
act b
y re
du
cin
g th
e d
eman
d
for
ind
ust
rial
pro
du
cts
or
incr
easi
ng
th
e ef
fici
ency
of p
rod
uct
ion
. Fo
rmer
is
dea
lt w
ith
un
der
pro
du
cts
and
re
cycl
ing
ab
ove
. La
tter
may
be
a n
ew
app
licat
ion
esp
ecia
lly in
the
mo
nit
ori
ng
o
f en
viro
nm
enta
l per
form
ance
for
com
plia
nce
or
even
for
reg
ula
tio
n
of c
arb
on
trad
ing
pro
du
cts
bet
wee
n
ind
ust
ries
.
Maj
or
role
ap
pea
rs to
be
in lo
w c
ost
m
on
ito
rin
g a
cro
ss in
du
stri
al s
ecto
r u
nd
er
emis
sio
ns
trad
ing
sch
eme
or
sim
ilar.
N
ot t
aken
forw
ard
as
an a
bat
emen
t o
pp
ort
un
ity
as th
e ad
dit
ion
alit
y is
wea
k.
Ag
ricu
ltu
reIC
T a
pp
licat
ion
s w
ou
ld h
ave
to
imp
act a
gri
cult
ura
l em
issi
on
s fr
om
cro
pp
ing
to a
nim
al
rear
ing
.
Ag
ricu
ltu
ral e
mis
sio
ns
com
e fr
om
�4
0,00
0 in
div
idu
al e
nte
rpri
ses
wh
ich
wit
h la
nd
u
se m
akes
up
�5%
of n
atio
nal
em
issi
on
s.
Live
sto
ck is
��%
of n
atio
nal
em
issi
on
s (6
7Mt)
an
d c
rop
pin
g is
�9(
Mt)
.
Ag
ricu
ltu
reTe
lem
etry
tech
no
log
y, G
PS
in d
evic
es
can
pro
vid
e d
etai
led
info
rmat
ion
ab
ou
t cro
p p
erfo
rman
ce, f
erti
lizer
s p
lace
men
t, w
ater
ava
ilab
ility
an
d s
oil
con
ten
t.
No
t tak
en fo
rwar
d a
s o
ther
tech
no
log
ies
are
alre
ady
avai
lab
le a
nd
bei
ng
use
d in
this
se
cto
r to
del
iver
eff
icie
ncy
gai
ns,
so
ad
ded
va
lue
wo
uld
be
un
cert
ain
.
Lan
d U
se, L
and
U
se C
han
ge
and
Fo
rest
ry
ICT
imp
acts
on
lan
d u
se
chan
ge
in A
ust
ralia
wo
uld
n
eed
to fo
cus
on
lan
d c
lear
ing
m
ain
ly.
Lan
d c
lear
ing
rat
es h
ave
dro
pp
ed
sub
stan
tial
ly in
Au
stra
lia, b
ut s
till
cau
se
nea
rly
50M
t of e
mis
sio
ns
per
yea
r.
LULU
CF
Th
ere
cou
ld b
e an
arg
um
ent t
hat
de
-m
ater
ialis
atio
n m
ean
s th
at m
ater
ials
co
uld
go
on
lin
e o
r th
rou
gh
ICT
n
etw
ork
s. E
g p
eop
le g
et n
ews
thro
ug
h
ph
on
e ra
ther
than
new
spap
ers,
th
eref
ore
less
tree
use
. H
ow
ever
mu
ch
lan
d c
lear
ing
is fo
r fa
rmin
g.
Th
ere
cou
ld b
e ro
le fo
r IC
T n
etw
ork
s fo
r m
on
ito
rin
g a
nd
co
mp
lian
ce, o
r ev
en
in in
crea
sin
g th
e va
lue
of c
arb
on
sin
ks
thro
ug
h m
on
ito
rin
g.
Th
e p
aper
pro
du
ctio
n in
du
stry
is
inte
rnat
ion
al a
nd
ove
rlay
s w
ith
issu
es
of o
ld g
row
th v
ersu
s p
lan
tati
on
, wh
ich
m
akes
car
bo
n b
ud
get
ing
mo
re d
iffi
cult
. M
on
ito
rin
g is
sues
are
ver
y u
ncl
ear.
T
ho
ug
h th
is is
a v
ery
larg
e em
issi
on
sec
tor
glo
bal
ly, t
he
add
itio
nal
ity
issu
es m
ean
th
at it
has
no
t bee
n ta
ken
forw
ard
, so
far.
H
ow
ever
the
larg
e u
nce
rtai
nti
es in
this
se
cto
r co
uld
mea
n th
at th
ese
serv
ices
hav
e a
very
sig
nif
ican
t val
ue.
94Towards a High-Bandwidth, Low-Carbon FutureClimate Risk
Climate Risk Pty Limited (Australia)
Level �, 36 Lauderdale Avenue
Fairlight, NSW �094
Tel: +6� � 8003 45�4 Brisbane: +6� 7 3�0� 45�3
www.climaterisk.net
Climate Risk Europe Limited London: + 44 �0 8�44 45�0
Manchester: + 44 �6 ��73 �474 Climate Risk