telstra annual report 2013...strategy and performance and full year results and operations review...
TRANSCRIPT
TELSTRAANNUALREPORT2013

Online Shareholder Services
Telstra’s Investor Centre www.telstra.
com/investor has all the latest news and
information available for shareholders.
Shareholders can also easily
manage their shareholding online at
www.linkmarketservices.com.au/telstra.
To access your information you will need your
SRN/HIN and post code. Follow the prompts to
log in and select from the following menu options:
Holdings – transaction history, holding balance
and value and latest closing share price.
Payment & Tax – dividend payment history,
payment instructions and TFN details.
You can update your bank details here.
Communication – become an e-Shareholder
and update postal/email addresses and
communication elections here.
Annual Report
Telstra’s 2013 Annual Report is available
to all shareholders on our Investor Website
at www.telstra.com.au/annualreports.
To receive a hardcopy of the Annual Report
(free of charge) you can call our Share Registry on
1300 88 66 77 and request the report be sent to you.
You may also update your communication
preferences online to change the way you
receive future copies of the Annual Report.
Please refer to the Online Shareholder Services
section for instructions on how to do this.
Sustainability Reporting
Selected graphs and data presented in this report
are included in the Bigger Picture Telstra 2013
Sustainability Reporting Series, which is available
online at www.telstra.com.au/sustainability/report.
This series provides more detailed information
and analysis for our stakeholders on Telstra’s
sustainability performance.
Global Reporting Initiative
We develop our sustainability reporting with
reference to industry and sustainability standards
including the United Nations Global Compact
Communication on Progress, and the Global
Reporting Initiative (GRI) G3 Sustainability
Reporting Guidelines and Telecommunications
Sector Supplement (pilot). This financial year we
have applied the GRI framework to application
level B+. The full GRI Index can be found online
at www.telstra.com.au/sustainability/report.
®Registered trademark of Telstra Corporation Limited.
™Trademark of Telstra Corporation limited.
^ Apple and iPad are trademarks of Apple Inc., registered in the US and other countries.
^ Android is a trademark of Google Inc.
Foxtel marks are used under licence by Foxtel Management Pty Ltd.
All amounts are expressing Australian Dollars ($A) unless otherwise stated.
Telstra Corporation Limited ABN 33 051 775 556
CONTENTS
Key Highlights 2
Our Business 3
Chairman and CEO Message 4
Strategy and Performance 6
Improving customer satisfaction 6
Retaining and growing customer numbers 7
Simplifying the business 8
Developing new growth businesses 9
Future outlook 10
Managing our risks 11
Full Year Results and Operations Review 12
Sustainability 20
Our approach 20
Responsible business 22
Customer experience 23
Our people 24
Community impact 26
Environmental impact 28
Board of Directors 30
Senior Management Team 32
Corporate Governance Statement 33
Directors’ Report 42
Remuneration Report 46
Financial Report 69
Financial Statements 70
Directors’ Declaration 197
Shareholder Information 199
Reference Tables 201
We have changed the format of our Annual Report this year to
provide shareholders with key information (including who we are,
our business strategies and goals, our governance structures
and our results for the current financial year) in a way we hope
shareholders will find more helpful and easy to use. The sections
of our Annual Report Our Business, Chairman and CEO Message,
Strategy and Performance and Full Year Results and Operations
Review comprise our operating and financial review (OFR) and
form part of the Directors’ Report.
1Telstra Annual Report 2013
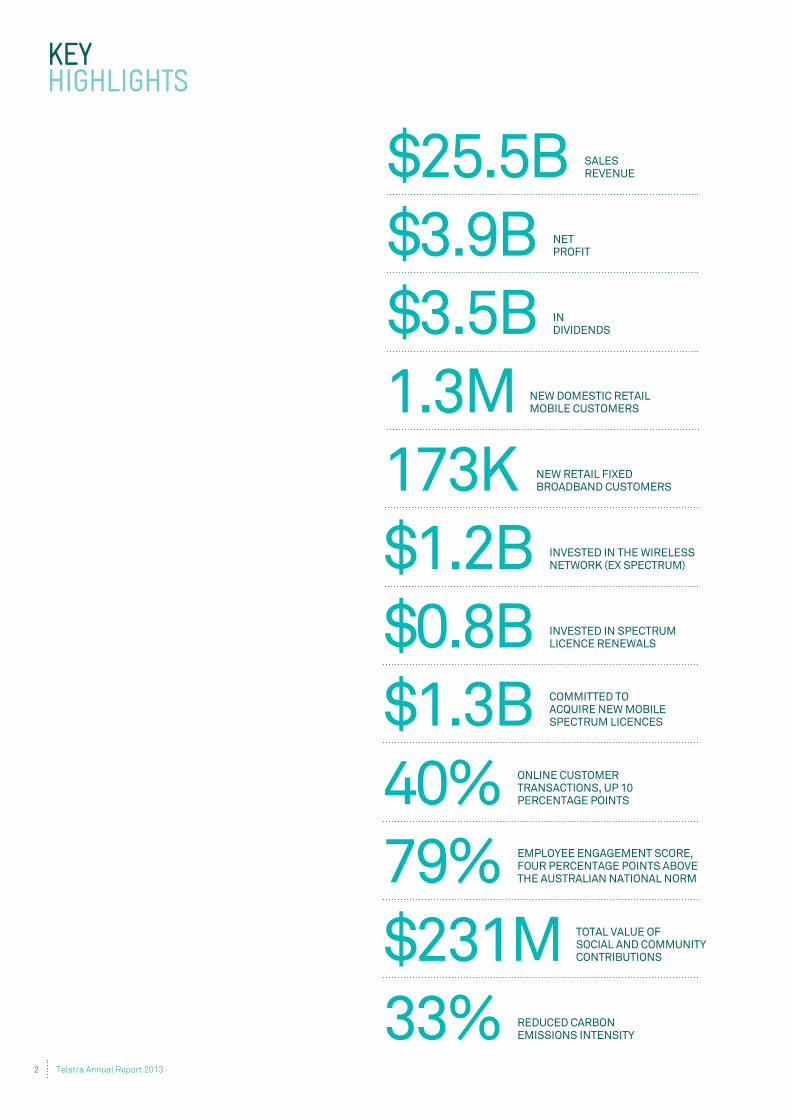
KEY HIGHLIGHTS
IN DIVIDENDS
NET PROFIT
SALES REVENUE
NEW DOMESTIC RETAIL MOBILE CUSTOMERS
INVESTED IN SPECTRUM LICENCE RENEWALS
COMMITTED TO ACQUIRE NEW MOBILE SPECTRUM LICENCES
NEW RETAIL FIXED BROADBAND CUSTOMERS
INVESTED IN THE WIRELESS NETWORK (EX SPECTRUM)
ONLINE CUSTOMER TRANSACTIONS, UP 10 PERCENTAGE POINTS
EMPLOYEE ENGAGEMENT SCORE, FOUR PERCENTAGE POINTS ABOVE THE AUSTRALIAN NATIONAL NORM
TOTAL VALUE OF SOCIAL AND COMMUNITY CONTRIBUTIONS
REDUCED CARBON EMISSIONS INTENSITY
$3.5B $3.9B$25.5B
1.3M
$0.8B$1.3B
173K$1.2B
40%79%$231M33%
2 Telstra Annual Report 2013

OUR BUSINESS
WHO WE ARE EVERY DAY WE HELP
MILLIONS OF CUSTOMERS
CONNECT TO THE PEOPLE
AND THINGS THAT MATTER
MOST TO THEM
Telstra is Australia’s leading
telecommunications and information
services company, offering a full range of
communications services and competing
in all telecommunications markets. In
Australia we provide 15.1 million mobile
services, 7.8 million fixed voice services
and 2.8 million retail fixed broadband
services. Telstra’s international
businesses include Hong Kong mobile
operator CSL New World, Telstra Global’s
networks and managed services business
and Telstra’s China-based search and
advertising businesses.
We understand our customers want
technology and content solutions that
are simple and easy to use – that’s why
we’ve built networks like Australia’s
largest fully integrated IP network and
Australia’s largest and most reliable
national mobile network.
INDUSTRY CONTEXT OUR INDUSTRY
IS EXPERIENCING
RAPID CHANGE
The way people communicate, share
their lives and consume entertainment
is changing.
The digitisation of information,
entertainment, videos and photos means
we are increasingly accessing content
and services previously delivered over
one network to one device, on multiple
devices over a range of networks.
Technology has evolved. Devices and
networks can adapt to their users’
needs, rather than the other way around.
Improvements in mobility and the growth
of cloud computing mean users’ content
and services can seamlessly follow
people wherever they go and customer
expectations have changed accordingly.
OUR VISION TO IMPROVE THE WAY
PEOPLE LIVE AND WORK
We aim to help our customers change the
way they live and work through improved
and more convenient connection. The way
people are connecting with each other,
and with the content and services they
use, is becoming more individualised and
more sophisticated every day.
Our vision is to take advantage of this
connectivity evolution by providing our
customers the products and services they
want, where and when they want them in
a simple and convenient way.
MISSION WE STRIVE TO SERVE
OUR CUSTOMERS BETTER
THAN ANYONE ELSE
Our mission is to build technology
and content solutions that are simple
and easy to use. We understand the
connectivity evolution and we are working
to stay ahead of the curve. We have to put
the customer at the centre of everything
that we do.
We are building a culture based on
customer service, collaboration and
innovation, and leading in the market.
We are building this new company culture
around the most powerful person in the
new digital economy – the customer.
3Telstra Annual Report 2013
CHAIRMAN AND CEO MESSAGE
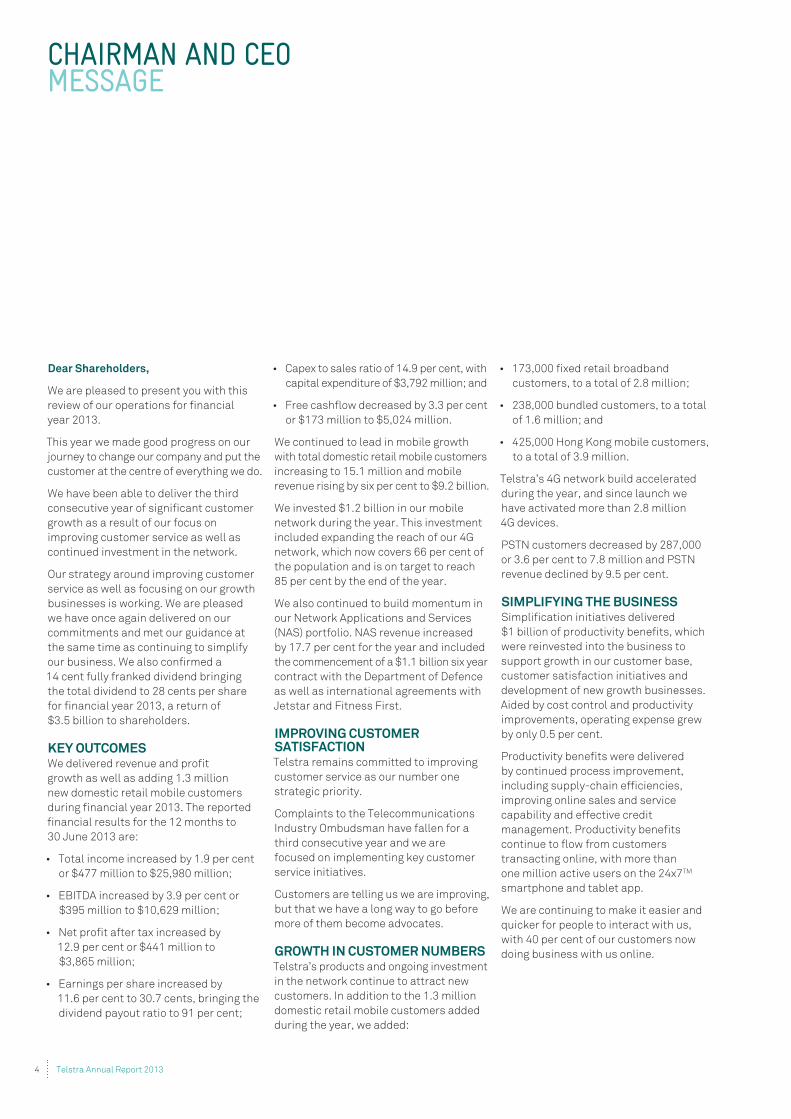
Dear Shareholders,
We are pleased to present you with this
review of our operations for financial
year 2013.
This year we made good progress on our
journey to change our company and put the
customer at the centre of everything we do.
We have been able to deliver the third
consecutive year of significant customer
growth as a result of our focus on
improving customer service as well as
continued investment in the network.
Our strategy around improving customer
service as well as focusing on our growth
businesses is working. We are pleased
we have once again delivered on our
commitments and met our guidance at
the same time as continuing to simplify
our business. We also confirmed a
14 cent fully franked dividend bringing
the total dividend to 28 cents per share
for financial year 2013, a return of
$3.5 billion to shareholders.
KEY OUTCOMESWe delivered revenue and profit
growth as well as adding 1.3 million
new domestic retail mobile customers
during financial year 2013. The reported
financial results for the 12 months to
30 June 2013 are:
or $173 million to $5,024 million.
We continued to lead in mobile growth
with total domestic retail mobile customers
increasing to 15.1 million and mobile
We invested $1.2 billion in our mobile
network during the year. This investment
the population and is on target to reach
85 per cent by the end of the year.
We also continued to build momentum in
by 17.7 per cent for the year and included
as well as international agreements with
IMPROVING CUSTOMER SATISFACTIONTelstra remains committed to improving
customer service as our number one
strategic priority.
third consecutive year and we are
focused on implementing key customer
service initiatives.
but that we have a long way to go before
more of them become advocates.
GROWTH IN CUSTOMER NUMBERSTelstra’s products and ongoing investment
in the network continue to attract new
domestic retail mobile customers added
during the year, we added:
during the year, and since launch we
have activated more than 2.8 million
SIMPLIFYING THE BUSINESS
$1 billion of productivity benefits, which
were reinvested into the business to
support growth in our customer base,
customer satisfaction initiatives and
development of new growth businesses.
by only 0.5 per cent.
Productivity benefits were delivered
by continued process improvement,
including supply-chain efficiencies,
improving online sales and service
capability and effective credit
management. Productivity benefits
transacting online, with more than TM
smartphone and tablet app.
We are continuing to make it easier and
quicker for people to interact with us,
with 40 per cent of our customers now
doing business with us online.
4 Telstra Annual Report 2013
BUILDING NEW GROWTH BUSINESSES
to grow, with revenue increasing by
product categories.
provide digital media services in automotive,
business as it transitions from print to
digital media revenue growth of
11.3 per cent offset by a print revenue
overall revenue fall of 11.4 per cent.
We have also established two new
business units to focus on growth
applications.
NBN Telstra continues to progress
work constructively in the best interests
value of those agreements as the project
progresses.
SUSTAINABILITYWe are pleased with the progress we
have made on our sustainability agenda.
Our aim in financial year 2013 was to
build performance momentum in three
key areas – employee involvement, digital
inclusion and environmental leadership.
Our people contributed more than 4,200
employee volunteer days, a 200 per cent
members by the end of financial year 2013.
We developed a new operating model and
align key community investments with
core customer digital inclusion programs.
of being connected to new communication
technologies. The value of the partnerships
We completed significant research to
inform a more proactive and strategic
year, we will focus our efforts on three key
areas – improving the energy efficiency of
our operations, reducing environmental
impact in our supply chain and developing
greener products and services.
We place the highest priority on the
safety of our employees and the wider
community. We were very disappointed
there were issues with our asbestos
stopped pit remediation work and
conducted a review of our contractor
management which identified a number
of areas where improvements could be
made. We recently announced
remediation works will recommence with
additional safeguards in place. This
includes requiring relevant employees
and contractors involved in this work to
undergo additional training in the safe
handling and removal of asbestos and
the requirement for contractors to hold
appropriate licences.
FINANCIAL OUTLOOK
financial year 2014 and forecasts low
15 per cent of sales as it continues to
This guidance assumes wholesale
product price stability, no impairments to
on the sale of businesses, the cost of
acquisitions and spectrum purchases.
a fully franked dividend of 14 cents per
share bringing total dividends per share
for financial year 2013 to 28 cents per
announced, the company will return to its
previous practice of considering dividends
on a half yearly basis, as part of the regular
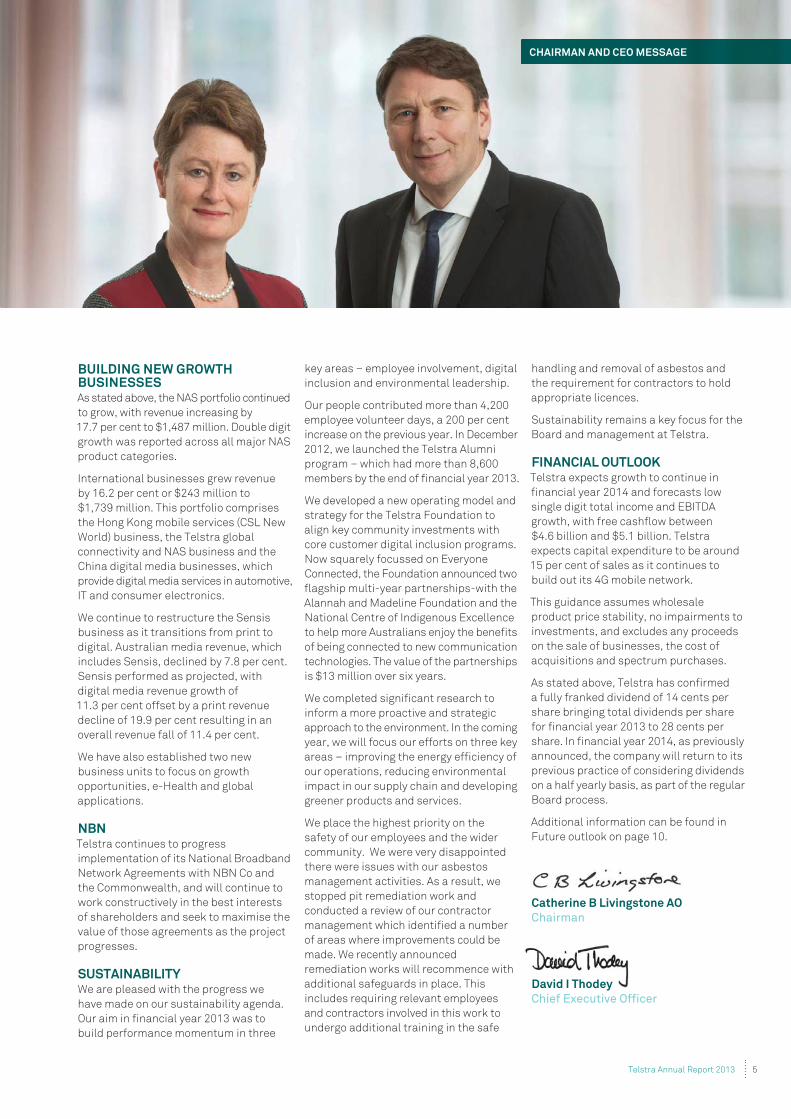
Catherine B Livingstone AO
Chairman
David I Thodey
Chief Executive Officer
5Telstra Annual Report 2013
CHAIRMAN AND CEO MESSAGE

WE ARE LISTENING TO OUR
CUSTOMERS AND PUTTING
THEM AT THE CENTRE OF
EVERYTHING WE DO
Improving customer satisfaction is core
to our strategy. Our aim is to change the
way our customers talk about Telstra by
building a culture of customer advocacy
across Telstra. This is both a cultural
and commercial imperative as we know
that advocates buy more of our services,
cost less to serve, and are more likely to
recommend Telstra to family and friends.
We have been working hard over the last
12 months and we are seeing results.
CUSTOMER ADVOCACYTurning customers into advocates is
underpinned by a significant cultural
change within our company. More than
7,500 of our people leaders have been
given the tools, training and skills needed
to create a culture of customer advocacy
in all areas of our business.
We now ask our customers for their
feedback after every interaction with
Telstra, which provides us with rich
information on the quality of their Telstra
experience. We are then able to use
these insights to improve our level of
service and to challenge our business
processes. To date, more than 10 million
customer surveys have been completed,
and we are starting to see improvement
in customer advocacy.
CUSTOMER SERVICE INITIATIVESWe’ve made further progress in keeping
our customers informed about their
mobile usage by increasing the number
of usage alerts we send them. These
alerts help our customers better manage
their mobile spend and avoid ‘bill
shock’ – a major cause of mobile related
complaints.
Many of our customers have expressed
concern when they return from an
overseas trip to find a larger than
expected mobile telephone bill. As a
result, we now inform our customers by
SMS of every 20 megabytes of data used
when travelling overseas so they can
manage their data usage and avoid bill
shock when they return home.
Telstra customers are also able to access
4G mobile services while travelling
in Hong Kong with the launch of 4G
international roaming between Telstra
and CSL New World, and we are working
on similar agreements with operators
in other countries with compatible 4G
wireless broadband networks.
NETWORK INVESTMENTSOur customers value Telstra’s superior
mobile network and we invested
$1.2 billion this financial year to maintain
our mobile network advantage. Telstra’s
networks are supported by ongoing
innovation and investment and, as a
result of our investments, high speed 4G
services on the Telstra network are now
available to 66 per cent of the population.
We recently announced a further network
expansion to make 4G coverage available
to 85 per cent of the population by the
end of calendar year 2013.
We have also broadened the scope of our
4G network by adding a second wireless
frequency, 900MHz, to better cater for
increasing mobile use in regional areas.
The lower frequency improves signal
range and depth, making it ideal for use
in areas where improved range or signal
reliability is required.
An important decision for the company
this year was to commit $1.3 billion to
acquire mobile spectrum licences in
the 700MHz and 2.5GHz bands. The
2.5GHz spectrum will become available
from 1 October 2014 and the 700MHz
spectrum on 1 January 2015, and be paid
for in September 2014. This represents
a major investment in the future of
telecommunications in Australia and
means we can continue to deliver a
superior mobile experience for our
customers. The spectrum will be used
to support the extraordinary growth in
demand for mobile content and data.
Our ADSL fixed broadband network is now
available to over 9 million households
and businesses and approximately 92
per cent of the population. We recently
completed an upgrade of over 1,800 sites
providing ADSL 2+ broadband coverage
to another 400,000 premises.
‘THANKS’ TM
Telstra launched the ‘Thanks’ loyalty
program during the year to thank our
customers for choosing Telstra, and
reward our people for being a part of
Telstra. Our aim is to deliver an exciting
loyalty program which focuses on offering
things that are valued highly by our
customers and employees. The nation-
wide program shows our customers we
appreciate them and our employees that
their work is valued and respected.
Research told us customers love going
to the movies, and enjoy attending live
music and sporting events. Our loyalty
program is designed to offer those
experiences in a new and exciting way.
‘Thanks’ offers customers and employees
a range of money can’t buy experiences,
such as red carpet premieres and behind
the scenes access to great events.
Exclusive access to music concerts and
sporting events are also included in the
program. These opportunities will be
another way Telstra can say ‘Thanks’.
STRATEGY AND PERFORMANCEIMPROVING CUSTOMER SATISFACTION
OUR STRATEGIC PRIORITIES
Improving Customer Satisfaction
6 Telstra Annual Report 2013

Retaining and Growing Customer Numbers
STRATEGY AND PERFORMANCERETAINING AND GROWING CUSTOMER NUMBERS
WE WANT TO BE THE
TELECOMMUNICATIONS
PROVIDER OF CHOICE
OUR STRATEGIC PRIORITIES
We have continued to see good
momentum in the business as our
customers respond positively to the
initiatives we have put in place over the
past year, including new competitive
mobile and fixed bundle plans.
MOBILESOur mobiles business continues to
provide growth for the company with 1.3
million domestic retail mobile customers
added in the past year. Since refreshing
our mobile plans in 2010, we have added
over 4.5 million mobile customers in
Australia. Our leadership in mobiles is
based on the breadth and quality of our
network coverage. We have Australia’s
largest and most reliable mobile network,
covering more than 99.3 per cent of the
population, 2.3 million square kilometres
of landmass and more than 1 million
square kilometres out to sea.
Growth on our 4G network continues and
since launch in September 2011, we have
sold 2.8 million 4G devices. This includes
1.9 million handsets, 200,000 tablets,
400,000 dongles and 300,000 Wi-Fi
hotspots. We continue to expand our device
range and we now offer 27 4G devices.
This includes a 4G dongle and Wi-Fi device,
Australia’s first 4G device combining a
USB dongle and Wi-Fi hotspot technology,
providing an ultra-fast internet connection
that up to five Wi-Fi enabled devices can
share simultaneously.
We continue to refresh our mobile offerings
and during the year we announced our
new No Lock In plans that come with great
value inclusions and do not require a
long-term contract or commitment.
Customer benefits include better budget
control, the option of using existing mobile
phones and not having to purchase a new
one, and the freedom that comes from not
being tied to a long term contract.
In the wholesale space we launched a
3G prepaid mobile offering allowing our
customers to market and custom brand
their own prepaid mobile and wireless
broadband offerings using Telstra’s 3G
service across parts of our mobile network.
FIXEDWe regularly ask our customers what new
features and options they would most
value on their fixed plans. Our customers
told us that included entertainment and
mobility were important, so this year we
introduced a new range of Entertainer
bundles. In addition to high speed
broadband, unlimited local and STD calls,
and mobile phone benefits, a selection of
the new bundles now include 11 popular
Foxtel on T-Box® channels and 500
megabytes of mobile broadband data. We
grew the number of our fixed broadband
customers taking a bundle by 238,000
this year to 1.6 million, or 59 per cent of
our fixed broadband base.
Across our Telstra Business and
Enterprise and Government segments,
we have increased cloud customer
numbers by 68 per cent. These customers
are benefitting from Telstra’s world-class
Next IPTM network which provides
superior reach, speed and coverage.
Network performance is monitored and
maintained from dedicated centres by
an Australia-wide team of technicians,
allowing our customers to place greater
reliance on network applications and do
business in more places.
9%
7%
12%
68%
RETAIL PRODUCT CUSTOMER GROWTH IN FY13
CLOUD
HK MOBILES(CSL)
MOBILESDOMESTIC
FIXEDBROADBAND
7Telstra Annual Report 2013
STRATEGY AND PERFORMANCE
THE SIMPLIFICATION
OF OUR BUSINESS
CONTINUES TO DELIVER
BENEFITS FOR OUR
CUSTOMERS, EMPLOYEES
AND SHAREHOLDERS
Simplifying the business remains a
critical part of our strategy. This year
simplification initiatives delivered
$1 billion of productivity benefits. These
productivity benefits are reinvested
into the business to support growth in
our customer base, customer service
initiatives and the development of new
growth businesses.
We have introduced a range of initiatives
and improved feedback channels
between our frontline staff and senior
management during the year that helped
us improve processes, reduce complexity
and improve customer service.
We broadened the skill sets of our
contact centre consultants enabling
them to handle calls in more situations
without having to transfer to a technical
expert. Over 3,000 agents have been
upskilled, resulting in more effective and
efficient customer interactions.
We simplified billing by applying new
rates for the full billing period when
customers change plans. Previously,
we split the bill between old and
new plans, which was hard for our
customers to understand. We believe
this change will result in fewer calls
to contact centres, fewer complaints
to the Telecommunications Industry
Ombudsman and importantly a better
customer experience.
We introduced a 14 Day Customer Card
which allows our customers to contact
the same technician who visited their
premises, should they need to. More
than 100,000 cards were provided to
our customers during the year. Our
technicians’ performance is no longer
only judged on how well they fixed a fault
but also on how satisfied the customer
was with their visit.
We are also seeing productivity benefits
as more customers transact with us
on-line. We now have more than one
million active users on our 24x7TM app
which is available on the Apple iPhoneˆ,
Androidˆ, Apple iPadˆ and on Facebook.
The 24x7TM app enables our customers
to monitor their call and data usage, top
up their prepaid account and view their
bills. In upcoming releases of the 24x7TM
app we are planning to release additional
functionality allowing customers to
purchase new services from us. We will
start with simple add-ons such as data
packs, and progress to more complex
transactions. Since launch in April
2012, over 2.5 million customers have
downloaded the app. We are putting the
information our customers want, and the
opportunity to contact us more readily,
at their fingertips.
$1 BILLION OF
PRODUCTIVITY BENEFITS
RE-INVESTED INTO THE
BUSINESS
STRATEGY AND PERFORMANCESIMPLIFYING THE BUSINESS
OUR STRATEGIC PRIORITIES
Simplifying the Business
8 Telstra Annual Report 2013
DEVELOPING NEW
BUSINESSES IS
IMPORTANT TO OUR
LONG-TERM GROWTH
In addition to driving growth in our core
business, we must also develop new
businesses to ensure long term growth.
Our current strategy includes three
key growth opportunities - Network
Applications and Services (NAS),
International and Media. We also have
a corporate venture capital group,
Telstra Ventures that invests in high
growth technology companies that are
strategically important to Telstra.
Telstra has also established two new
business units to focus on growth
opportunities in e-Health and global
applications.
NETWORK APPLICATIONS AND SERVICES
NAS is a strategic growth opportunity for
Telstra domestically and internationally
with our products and services
underpinned by our core Next IP®
network. We continue to see strong
growth as we invest in this important
part of our business. In April 2013 we
signed a six year, $1.1 billion contract
with the Department of Defence for the
provision of services including unified
communications, video conferencing as
well as tablet and smartphone usage.
The agreement is the largest customer
contract in Telstra’s history and will
support military operations at home and
abroad. 350 new positions will be created
to help serve the contract, including
recruiting some of the nation’s leading IT,
network and security experts.
INTERNATIONALGrowth into Asia is another of our key
strategic ambitions. Our international
business encompasses three lines of
business – CSL New World, Telstra
China and Telstra Global. CSL New World
is one of Hong Kong’s leading mobile
operators, which continues to increase
market share in an intensely competitive
market. Our Chinese businesses provide
digital media services in the IT, consumer
electronics and automotive segments
in which our Autohome business has
delivered significant growth during the
year. Telstra Global provides managed
network services, international data and
voice, and satellite and also manages our
submarine cable networks and assets.
During the year we signed a business
communications contract with Jetstar
and the deal is Telstra’s largest global
contract to date. We continue to expand
our capabilities in Asia including the
opening of our Singapore data centre.
We have also continued to grow outside
the Asia region.
MEDIAWe had a successful re-launch of our
AFL and NRL mobile apps ahead of the
2013 seasons for both sports. These apps
enable our customers to view the games
live on a smartphone or tablet. These
have been very successful in the market
and to date we have had over 1.5 million
AFL app downloads and 800,000 NRL
app downloads. The apps are available to
customers across all mobile providers.
Telstra’s media assets also include our
50 per cent stake in the Foxtel business.
The key focus for Foxtel continues to be
the growth of its customer base which
grew by 3.4 per cent to 2.5 million.
The Sensis directories business continues
to be challenged by the increased
competition from online and mobile
search directories and migration from
traditional print products. We completed
the acquisition of online directory
business TrueLocal during the year.
A core part of Sensis’ digital strategy
is to seek investment opportunities
that accelerate digital growth, and add
value for our customers. TrueLocal is
a business that meets those criteria
with thousands of information rich
business listings and more than 200,000
user reviews that generate millions of
searches each month. This acquisition
presents additional growth opportunities
for our customers because their content
can now be found by an even greater
number of consumers.
TELSTRA VENTURESTelstra Ventures’ investment strategy
focuses on high growth opportunities
that offer technology and solutions which
leverage Telstra’s assets and enable
Telstra to offer new products and services
to its customers. Based in Australia and
Silicon Valley, Telstra Ventures works
closely with quality entrepreneurs to
build significant companies. Since it was
established in 2011, Telstra Ventures has
invested in eight companies, and during
financial year 2013 acquired stakes in
Kony Solutions Inc, HealthEngine, Whispir
and IP Health.
STRATEGY AND PERFORMANCEDEVELOPING NEW GROWTH BUSINESSES
OUR STRATEGIC PRIORITIES
Developing New Growth Businesses
9Telstra Annual Report 2013
STRATEGY AND PERFORMANCE
Our strategy will continue to evolve as we
work hard to improve customer service
and simplify and grow the business.
While we are starting to see promising
results from our focus on improving
customer satisfaction, there is a great
deal more to be done. In the year ahead,
we will continue to focus on our journey
towards building a culture of customer
advocacy, implement further customer
service initiatives and continue to invest
in our networks to deliver a differentiated
and quality customer service experience
for all of our customers.
We will continue to use our network
leadership, product innovation and
capabilities to retain and grow our
customer base. Our device range will
expand and in the coming months we will
be launching shared data plans which will
enable our customers to pool wireless
data allowances across multiple devices
on a single bill.
As the NBN rolls out to more communities
around Australia, we will be focused on
bringing customers the benefits of Telstra
services on the NBN. Having local teams
working in communities across Australia
is a competitive advantage and where
we do not have a local presence, we have
introduced mobile stores on wheels to
help inform and connect our customers.
We will continue to simplify the business
to reduce our cost base. This will
involve further process and systems
improvements, empowering our people
to make positive change across the
business. We will continue to invest in
our online service capabilities to provide
customers with a simple and intuitive way
to do business with us online.
Like other strong Australian companies
we have aspirations to grow into the Asia
region. For Telstra this means leveraging
our core network capabilities in Asia and
building our NAS business in the region.
We also need to do this as we support the
growth of our enterprise customers in the
region and will base additional resources
and employees in the region.
While we have a number of important
assets in our media portfolio, we are
facing challenges at Sensis. Sensis is
a changing business and is challenged
by the transition from its previous print
based business model to the new digital
model. It is a completely new business
model that requires greater agility and
efficiency to compete. As the business
continues to change, we will continue to
review all aspects of its operations, to
make sure we have the right resources
in the right areas, so we can meet our
customers’ needs.
Additional information on our future
outlook can be found in the Chairman
and CEO Message on page 4.
STRATEGY AND PERFORMANCEFUTURE OUTLOOK
10 Telstra Annual Report 2013
STRATEGY AND PERFORMANCEMANAGING OUR RISKS
Identifying and managing risks which may
affect the success of our strategy and financial
prospects for future years is an essential part
of our governance framework. In addition to
the risks discussed earlier in our OFR, a
summary of our key strategic risks and our
approach to managing them is outlined below.
SUMMARY OF STRATEGIC RISKS
Changes to industry structure and competition Changes to our industry structure and
competitive landscape, including the
introduction of the NBN, see us operating in
an increasingly competitive environment.
This competition comes from existing
competitors as well as new competitors
with lower cost bases, and agile, innovative
business models. If we don’t adapt to
changes in the industry and competitive
landscape we may lose market share and
revenue. Our strategy to deal with our
changing industry and competitive landscape
is to retain and grow our customer base
through driving customer advocacy, and
identifying and executing new growth
strategies. We also need to be innovative to
keep ahead of our competitors and be able
to respond to customer expectations by
delivering new and superior services,
applications and products to our customers.
To address this we are working to develop
and deliver new and innovative technologies
and products to meet changing consumer
needs; and improving our service offerings
to align with customer expectations about
pricing, scalability, privacy, security,
performance and support.
Adapting our operating modelWe recognise that we need to adapt our
operating model to align with structural
changes in the market place and reduce our
cost base in order to remain competitive. To
meet this challenge we are implementing a
number of process improvement initiatives
to simplify our internal structure, processes
and systems. Information in relation to the
challenges we are facing with respect to
Sensis’ changing business model can be
found in the Future outlook on page 10.
We also need to ensure we have effective
processes to attract talent and further
develop the capabilities that we believe
will be important to our future
performance, so that we are able to
maintain momentum and execute on our
plans, and adapt to the changing nature
of our industry and our business.
Business disruption Our ability to compete, sustain business
operations and deliver customer service
may be impeded by a significant business
disruption. This can occur due to adverse
weather events, a critical process failure,
or disruption in our supplier base or supply
chain, and may result in a loss of revenue,
customer dissatisfaction, compensation
claims and failure to meet regulatory
obligations. To manage these risks we
monitor network performance, execute
our business continuity programs, and
coordinate incident response when
incidents occur. We also have programs in
place to manage surety of supply including
risk assessments of critical suppliers, and
proactively manage vendors to protect our
supply chain.
Regulation We operate in highly regulated industries
and changes in government policy and
regulation can result in increases to the
scope of our obligations and compliance
costs. Decisions on the prices of regulated
services can also affect the prices we
charge our customers and result in a loss
of revenue. To manage this risk, we
continue to proactively engage and
maintain constructive relationships with
the government, regulators, interest
groups and industry to seek appropriately
balanced policy outcomes. Additional
information in relation to NBN and a
potential change in government policy can
be found in the Chairman and CEO
Message on page 4.
OUR RISK MANAGEMENT APPROACHOur risk management approach facilitates
the ongoing assessment, monitoring and
reporting of risks which can impede our
progress in delivering our strategic priorities.
This year, we refined and clarified our approach
to managing risks through our ‘Three Lines
of Defence’ model, which facilitates clear
separation of accountabilities between:
First line:
‘Front-line’ management and staff in
business operations – who are responsible
for the day to day management of risks.
Second line:
The Chief Risk Office (managed by the Chief
Risk Officer) – who provide the ‘front-line’
with frameworks, policies, methodologies,
tools and assistance to embed risk
management in the business.
Third line:
Group Internal Audit – who provide
independent and objective assurance on the
effectiveness of our governance, risk
management and internal control processes.
A critical component of our ‘second line’ of
defence is our risk management framework
which aligns with ISO 31000 Risk
Management – Principles and Guidelines,
the global standard for risk management.
The framework is also supported by our
Telstra Group Code of Conduct and Business
Principles, and our risk management policy.
The policy sets out our objectives, principles
and accountabilities for risk management at
all levels of our business. It also provides a
definition of material business risks which
we define as any type of risk that could have
a material impact on the Telstra Group.
Material business risks are regularly
reported to the Board along with their
controls and treatments.
We remain committed to continuous
improvement in our approach to managing
risks and ensuring that we maintain a strong,
integrated risk and compliance culture.
11Telstra Annual Report 2013
STRATEGY AND PERFORMANCE
FULL YEAR RESULTS AND OPERATIONS REVIEW
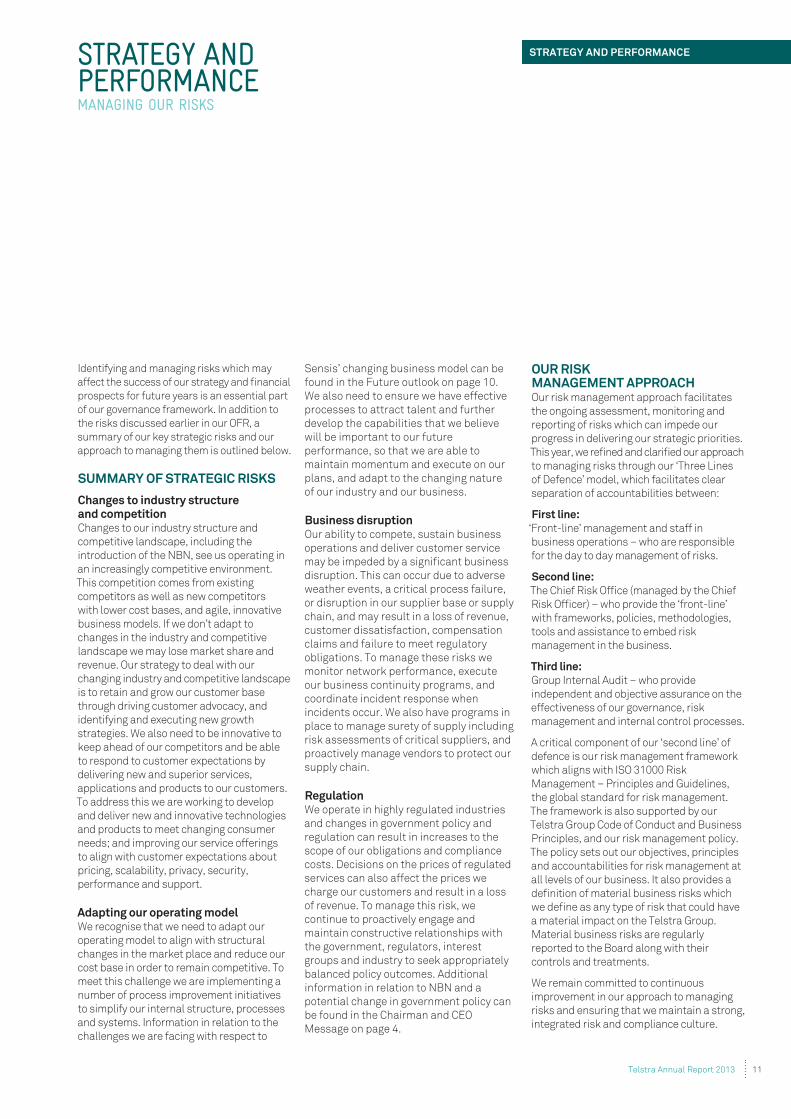
REPORTED RESULTSIn financial year 2013 sales revenue
increased by 1.1 per cent or $270 million
to $25,502 million and total income
increased by 1.9 per cent or $477 million
to $25,980 million.
Operating expenses (before depreciation
and amortisation) increased by
0.5 per cent or $81 million to
$15,350 million.
Labour expenses decreased by 3.3 per
cent to $4,803 million driven by lower
labour substitution and other labour
expenses. Excluding TelstraClear from
both periods, labour expenses declined
by 2.0 per cent.
With our growing customer base and
increased handset sales, directly variable
costs (DVCs) or goods and services
purchased increased by 3.4 per cent
to $6,389 million. Network payments
expense continued to decline.
Other expenses increased by 0.8 per cent
to $4,158 million driven by an increase
in service contract expense to support
operational initiatives, and the loss
recognised on the sale of TelstraClear.
This was offset by an overall decrease
in impairment expenses.
Earnings before interest, tax,
depreciation and amortisation
(EBITDA) increased by 3.9 per cent
to $10,629 million. EBITDA margins
increased by 1.1 percentage points to
41.7 per cent. Earnings before interest
and tax (EBIT) increased by 9.8 per cent
to $6,391 million.
Net finance costs increased by
2.4 per cent to $909 million as a result
of revaluation impacts offset to a large
extent by net borrowing costs decreasing
from lower market interest rates.
Reported profit after tax increased by
12.9 per cent to $3,865 million. Basic
earnings per share (EPS) increased
by 11.6 per cent from 27.5 cents to
30.7 cents.
generated in the year. Accrued capital
expenditure was $3,792 million or
14.9 per cent of sales.
On 8 August 2013, the Directors of Telstra
resolved to pay a fully franked final
dividend of 14 cents per share bringing
the total dividend to 28 cents per share
for the 2013 financial year. Shares
will trade excluding entitlement to the
dividend on 19 August 2013 with payment
on 20 September 2013.
SUMMARY FINANCIAL RESULTS
FY13
$m
FY12
$m
Change
%
Sales revenue 25,502 25,232 1.1
Total income 25,980 25,503 1.9
Operating expenses 15,350 15,269 0.5
EBITDA 10,629 10,234 3.9
Depreciation
and amortisation4,238 4,412 (3.9)
EBIT 6,391 5,822 9.8
Net finance costs 909 888 2.4
Tax 1,617 1,510 7.1
Net profit after tax 3,865 3,424 12.9
Attributable net profit 3,813 3,405 12.0
Accrued capex(1) 3,792 3,591 5.6
5,024 5,197 (3.3)
Earnings per share
(cents)30.7 27.5 11.6
Dividend payout ratio (%) 91 102 n/m
(1) Accrued capital expenditure is defined as additions to property,
equipment and intangible assets, including capital lease additions,
measured on an accrued basis.
RESULTS ON A GUIDANCE BASIS*
FY13 FY13 guidance
Total income 3.3% Low single digit growth
EBITDA 4.8% Low single digit growth
Capex/sales 14.9% Around 15%
$5.2 billion $4.75-$5.25 billion
Dividend 28c fully franked 28c fully franked
GUIDANCE VERSUS REPORTED RESULTS*
FY13 FY13 FY13 FY12
Reported
results
$m
Adjustments
$m
Guidance
basis
$m
Guidance
basis
$m
Total
income25,980 (164) 25,816 25,001
EBITDA 10,629 127 10,756 10,264
Free 5,024 152 5,176 n/m
*Adjusted for TelstraClear trading results and sale and spectrum payments.
Please refer to the guidance versus reported results reconciliation on
page 203. This reconciliation forms part of the Full Year Results and
Operations Review, and has been reviewed by our auditors.
12 Telstra Annual Report 2013
PRODUCT PERFORMANCE
Fixed
Telstra’s fixed portfolio comprises
fixed voice (PSTN and NBN voice), fixed
broadband and other fixed revenue which
primarily includes intercarrier services,
payphones, customer premises equipment
and infrastructure access revenue from
the NBN agreements. Our key priorities
in the fixed portfolio are to grow our fixed
broadband business, manage the decline
in our PSTN business and successfully
transition customers to the NBN.
There was a continuation of trends in
our PSTN and fixed broadband business
this financial year. PSTN revenue fell by
9.5 per cent to $4,358 million, however
we saw strong growth in retail fixed
broadband with revenue increasing
by 9.3 per cent to $1,757 million, the
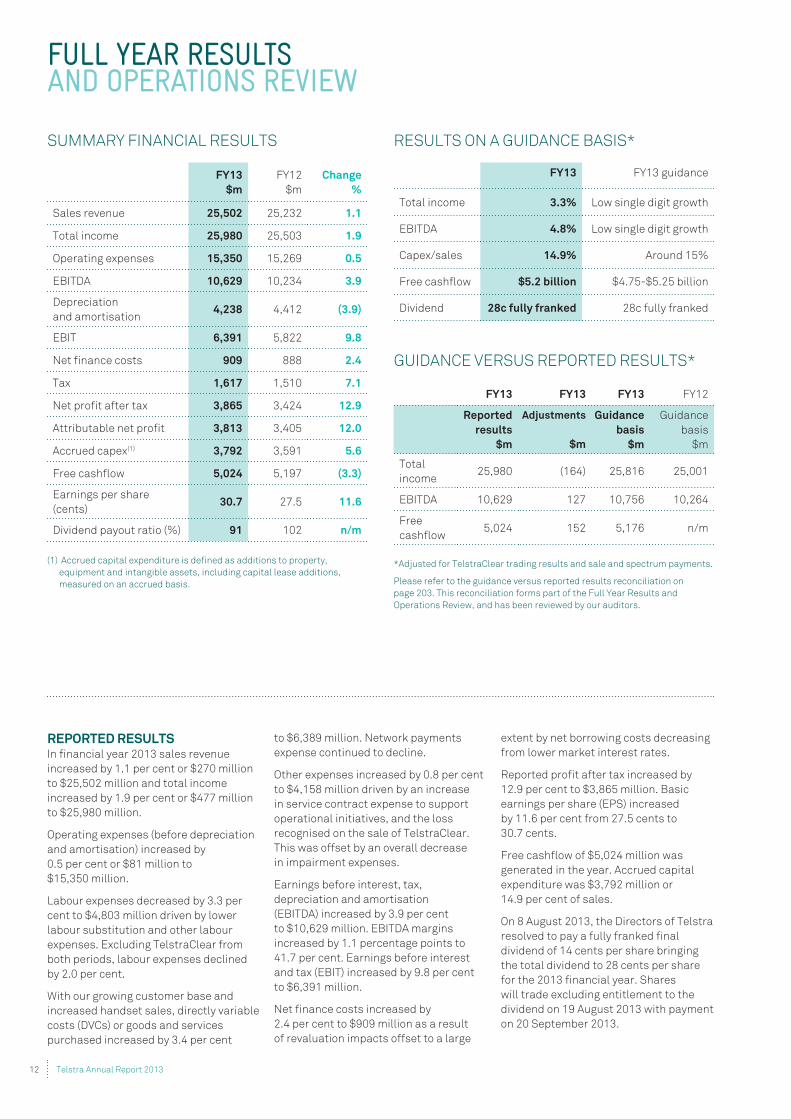
strongest growth in four years. Total
fixed broadband revenue increased by
5.0 per cent to $2,087 million. The growth
in fixed broadband and $71 million of
infrastructure access revenue from the
NBN agreements slowed the rate of
decline in the fixed revenue portfolio,
which declined by 2.7 per cent to
$7,303 million.
Our PSTN business continued to decline
with the loss of 287,000 customers. Retail
customer numbers declined by 346,000 and
wholesale services increased by 59,000.
There are now 7.8 million PSTN customers.
Retail fixed broadband growth in
customer numbers remained strong
with 173,000 customers added during
the year. Customer base growth has
been driven by our range of competitive
bundled offers. There are now 1.6 million
bundled customers compared to
1.4 million customers at the end of FY12.
In addition to this growth, retail fixed
broadband average revenue per user
(ARPU) increased by 1.6 per cent to $54.52.
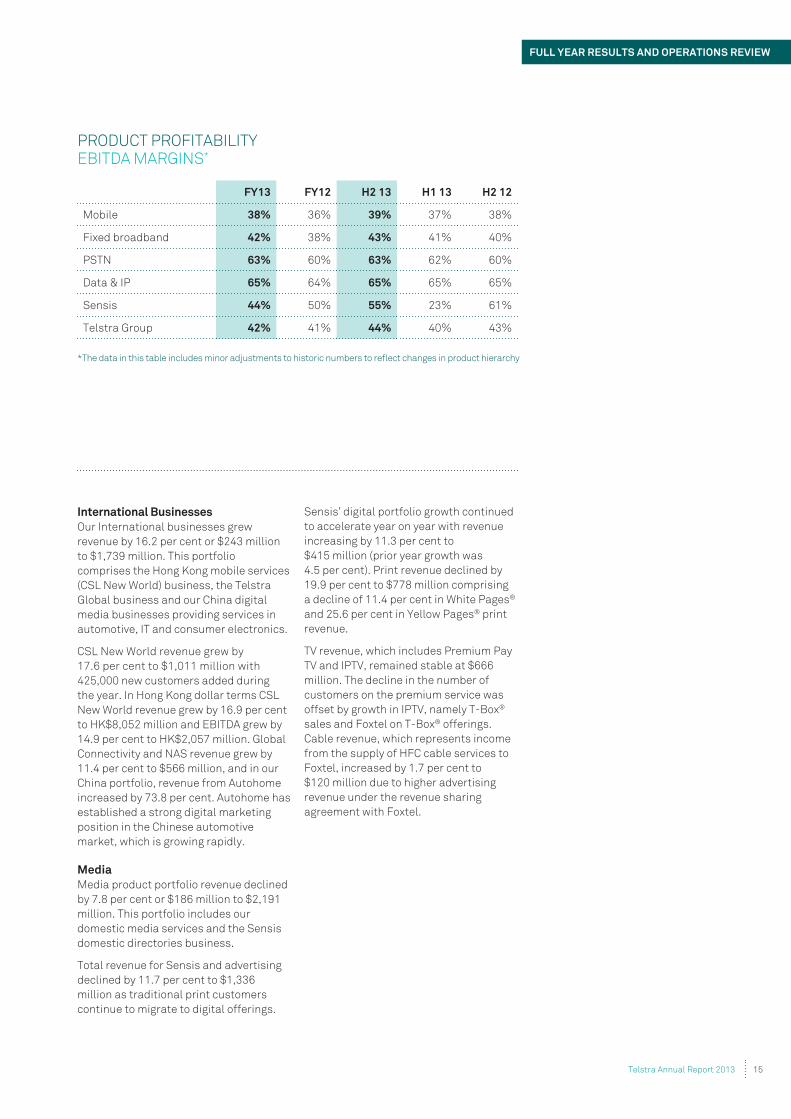
PSTN EBITDA margins increased to
63 per cent while fixed broadband
increased by four percentage points to 42
per cent compared to financial year 2012.
PRODUCT SALES REVENUE BREAKDOWN
GR
OW
TH FIX
ED
MOBILE
Fixed voice 17%
International businesses 7%
Other 2%
Fixed broadband 8%
Media 9%
Other fixed 3%
NAS 6%
Mobile 36%
Data & IP 12%
KEY PRODUCT REVENUE
FY13
$m
FY12
$m
Change
%
Fixed 7,303 7,508 (2.7)
Mobile 9,200 8,680 6.0
Data & IP 3,041 3,108 (2.2)
NAS 1,487 1,263 17.7
International
businesses1,739 1,496 16.2
Media 2,191 2,377 (7.8)
TOTAL FIXED BROADBAND REVENUE GROWTH
(2.4%)
3.1%
5.0%
FY12 FY13
FY11
13Telstra Annual Report 2013
FULL YEAR RESULTS AND OPERATIONS REVIEW
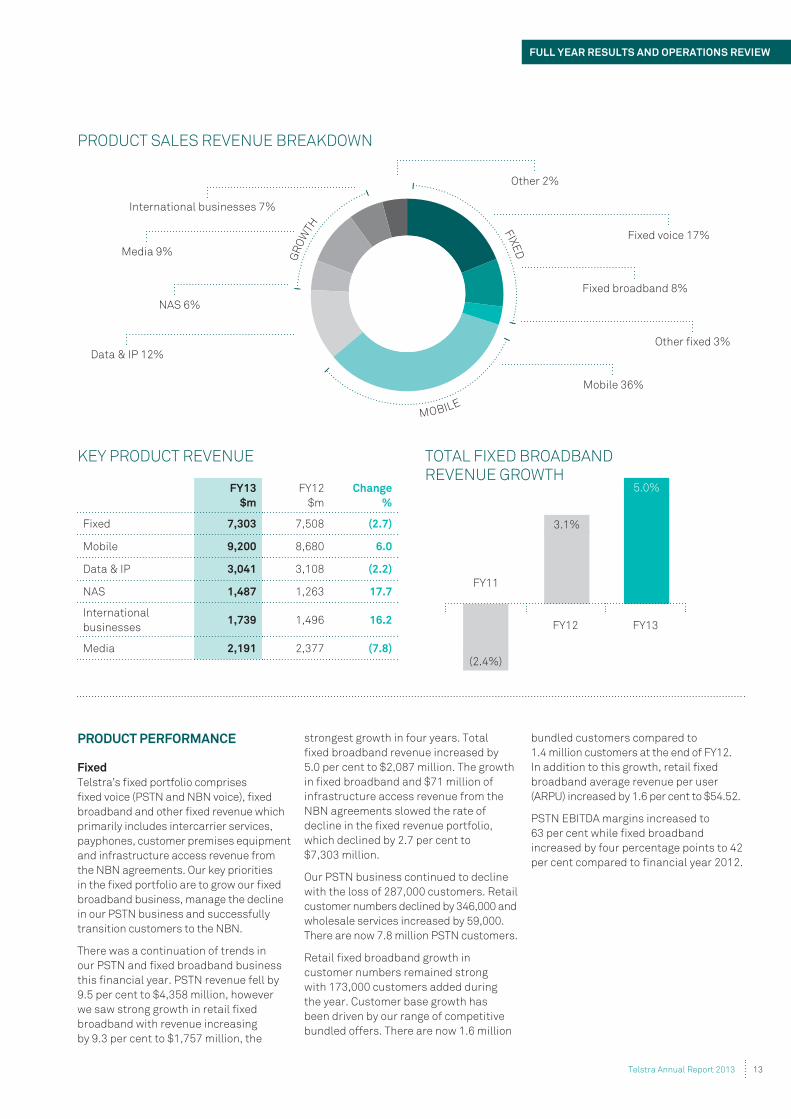
Mobile
Mobile revenue grew by 6.0 per cent or
$520 million to $9,200 million with 1.3
million domestic retail mobile customers
added during the year, taking our total
mobile customer base to 15.1 million.
Customers are using more data on our
wireless network; their experience being
enhanced by our continued investments
in the network, product development and
customer service.
To continue to provide our customers
with a superior network experience
we invested $1.2 billion in our mobile
network during the year. This investment
included broadening the reach of our
4G network which now covers 66 per
cent of the population. As a result of our
extended coverage and device range, to
date we have sold 2.8 million 4G devices
with 27 per cent of our postpaid handheld
customers now on 4G.
Postpaid handheld revenue growth
accelerated in the second half, growing
by 5.4 per cent compared to 0.3 per cent
growth in the first half. For the full year,
postpaid handheld revenue grew by
2.8 per cent to $4,804 million with the
addition of 423,000 customers. Excluding
the impact of Mobile Repayment Options
(MRO), ARPU increased by 2.7 per cent
in the second half to $65.39. For the full
year, ARPU excluding MRO was down
0.1 per cent to $65.33.
Growth was also strong in the mobile
broadband category with the addition
of 452,000 customers. Revenue grew
by 17.5 per cent or $178 million to
$1,196 million. Much of this growth was
driven by the popularity of tablets. As the
ARPU on tablet devices is lower, mobile
broadband ARPU declined by 4.7 per cent
to $29.80. We have now sold 900,000
tablet devices including over 200,000
4G enabled tablet devices.
Prepaid handheld revenue grew by
11.2 per cent to $727 million driven by
the ongoing popularity of our Prepaid
Cap Encore plans, which contributed
approximately 66 per cent of prepaid
activations during the year. This led to
an increase in prepaid handheld ARPU
of 6.3 per cent to $17.94. Prepaid unique
handheld users also increased by 8.3 per
cent to 2.2 million.
The popularity of smartphones and
tablets contributed to mobile hardware
revenue growth of 11.9 per cent
to $1,497 million while mobiles
interconnection revenue decreased
marginally by $1 million to $768 million.
Churn continues to be well managed.
The annualised postpaid handheld
deactivation rate improved by
1.4 percentage points to 10.8 per cent.
Effective cost management and
increased operating scale has improved
the profitability of the mobile portfolio.
EBITDA margins increased by
2 percentage points to 38 per cent.
Data and IP
Data and IP revenue declined
by 2.2 per cent or $67 million to
$3,041 million. IP Access revenue grew
by 5.9 per cent to $1,118 million, however
this was not enough to offset the decline
in legacy data products. Customer
growth was strong with IP MAN services
increasing by 3,588 to 30,597. Data and
IP EBITDA margins were 65 per cent, up
1 percentage point from the prior year.
Network Applications
and Services (NAS)
There was continued double digit growth
across all major NAS product categories
as we start to see the revenue benefits of
long-term contracts won in the previous
year. The NAS portfolio grew revenue by
17.7 per cent to $1,487 million. Revenue
growth in our unified communications
portfolio was also 17.7 per cent. Unified
communications is an integrated
hardware and software offering that
combines enterprise communications
onto a single platform. Revenue from
cloud services, which includes providing
storage and computing capacity and
software as a service to our customers,
grew by 33.0 per cent during the year.
FULL YEAR RESULTS AND OPERATIONS REVIEW
RETAIL MOBILE CUSTOMER ADDS (‘000s)
1,6681,592
1,257
NAS REVENUE GROWTH
10.6% 10.5%
17.7%
FY12 FY13FY11 FY13FY11 FY12
14 Telstra Annual Report 2013
International Businesses
Our International businesses grew
revenue by 16.2 per cent or $243 million
to $1,739 million. This portfolio
comprises the Hong Kong mobile services
(CSL New World) business, the Telstra
Global business and our China digital
media businesses providing services in
automotive, IT and consumer electronics.
CSL New World revenue grew by
17.6 per cent to $1,011 million with
425,000 new customers added during
the year. In Hong Kong dollar terms CSL
New World revenue grew by 16.9 per cent
to HK$8,052 million and EBITDA grew by
14.9 per cent to HK$2,057 million. Global
Connectivity and NAS revenue grew by
11.4 per cent to $566 million, and in our
China portfolio, revenue from Autohome
increased by 73.8 per cent. Autohome has
established a strong digital marketing
position in the Chinese automotive
market, which is growing rapidly.
Media
Media product portfolio revenue declined
by 7.8 per cent or $186 million to $2,191
million. This portfolio includes our
domestic media services and the Sensis
domestic directories business.
Total revenue for Sensis and advertising
declined by 11.7 per cent to $1,336
million as traditional print customers
continue to migrate to digital offerings.
Sensis’ digital portfolio growth continued
to accelerate year on year with revenue
increasing by 11.3 per cent to
$415 million (prior year growth was
4.5 per cent). Print revenue declined by
19.9 per cent to $778 million comprising
a decline of 11.4 per cent in White Pages®
and 25.6 per cent in Yellow Pages® print
revenue.
TV revenue, which includes Premium Pay
TV and IPTV, remained stable at $666
million. The decline in the number of
customers on the premium service was
offset by growth in IPTV, namely T-Box®
sales and Foxtel on T-Box® offerings.
Cable revenue, which represents income
from the supply of HFC cable services to
Foxtel, increased by 1.7 per cent to
$120 million due to higher advertising
revenue under the revenue sharing
agreement with Foxtel.
PRODUCT PROFITABILITYEBITDA MARGINS*
FY13 FY12 H2 13 H1 13 H2 12
Mobile 38% 36% 39% 37% 38%
Fixed broadband 42% 38% 43% 41% 40%
PSTN 63% 60% 63% 62% 60%
Data & IP 65% 64% 65% 65% 65%
Sensis 44% 50% 55% 23% 61%
Telstra Group 42% 41% 44% 40% 43%
15Telstra Annual Report 2013
FULL YEAR RESULTS AND OPERATIONS REVIEW
SEGMENT PERFORMANCE We report our segment information on the
same basis as our internal management
reporting structure at reporting date.
Commentary on the performance of our
business segments follows.
Telstra Consumer
Telstra Consumer income grew by
3.3 per cent to $10,656 million and
EBITDA increased by 2.4 per cent to
$5,577 million. Fixed broadband revenue
continued to grow at double digit rates,
increasing by 10.4 per cent to $1,441
million. The popularity of our bundled
plans contributed to this growth. In
mobiles, refreshed postpaid offers and an
expanded 4G handset and tablet range
contributed to an increase in mobile
revenue of 9.4 per cent to $5,763 million.
353,000 postpaid mobile handheld
customers were added during the year.
Telstra Business
Telstra Business returned to growth
for the full year with income increasing
by 1.1 per cent to $4,714 million. This
included income growth of 2.5 per cent
in the second half. Trends in the fixed
line business continued with revenue
declining by 5.5 per cent to $1,444 million
however there was strong double-digit
growth in NAS and IP access and data.
NAS revenue grew by 26.4 per cent to
$278 million and IP access and data
revenue grew by 13.2 per cent to $219
million. Mobile services revenue (including
interconnection) grew by 2.4 per cent
to $2,213 million with 59,000 postpaid
mobile handheld customers added in the
year. Fixed broadband revenue increased
by 7.9 per cent to $326 million with very
solid customer growth of 40,000. EBITDA
increased by 1.8 per cent to $3,631 million.
Telstra Enterprise and Government
Telstra Enterprise and Government income
grew by 1.3 per cent to $4,346 million.
IP access and data revenue grew by
1.5 per cent to $1,136 million. NAS revenue
grew by 14.7 per cent to $1,169 million
as we start to see the revenue benefits of
long-term contracts won in the previous
year. Mobile services revenue (including
interconnection) declined by 1.5 per cent
to $973 million driven by ARPU declines
outweighing customer growth. EBITDA
decreased by 1.0 per cent to $3,400 million
due primarily to product mix changes
including growth from lower margin NAS
business.
Telstra Wholesale
Income generated from our Wholesale
business increased by 1.1 per cent to
$2,115 million, the first year on year
increase in seven years. This was largely
driven by NBN Infrastructure revenue
which was offset in part by the impact of
lower fixed usage and mobile roaming.
Continued carrier migration from Line
Spectrum Sharing (LSS) to ULL services
resulted in LSS services declining by
65,000 while ULL services grew by 162,000.
External expenses increased by 8.9 per
cent resulting in an EBITDA increase of
0.5 per cent to $1,942 million. The increase
in expenses was largely due to doubtful
debt provision, customer compensation
costs relating to the Warrnambool exchange
fire and higher service contract costs.
Telstra Operations
Telstra Operations is primarily a service
delivery centre supporting the revenue
generating activities of our other
segments. The EBITDA contribution
improved 0.9 per cent on the prior year with
significant reductions in labour expense
partially offset by higher accommodation
costs (particularly light and power). This
result was achieved after increased
investment in our strategic growth area
of NAS.
Telstra Media Group
The Telstra Media Group (TMG) includes
the Sensis domestic directories business of
Yellow Pages® and White Pages® print and
digital, Whereis® location and navigation
services and TrueLocal; the Foxtel reseller
products including premium Pay TV, Foxtel
on T-Box® and Foxtel on Mobile; the supply
of HFC cable services to Foxtel; and Digital
Content Services including AFL, NRL, and
the MOG music service.
The decline in EBITDA of 15.3 per cent was
largely due to the decline in Sensis EBITDA.
Further commentary on the performance
of products in the TMG is provided in the
Media products section on page 15.
FULL YEAR RESULTS AND OPERATIONS REVIEW
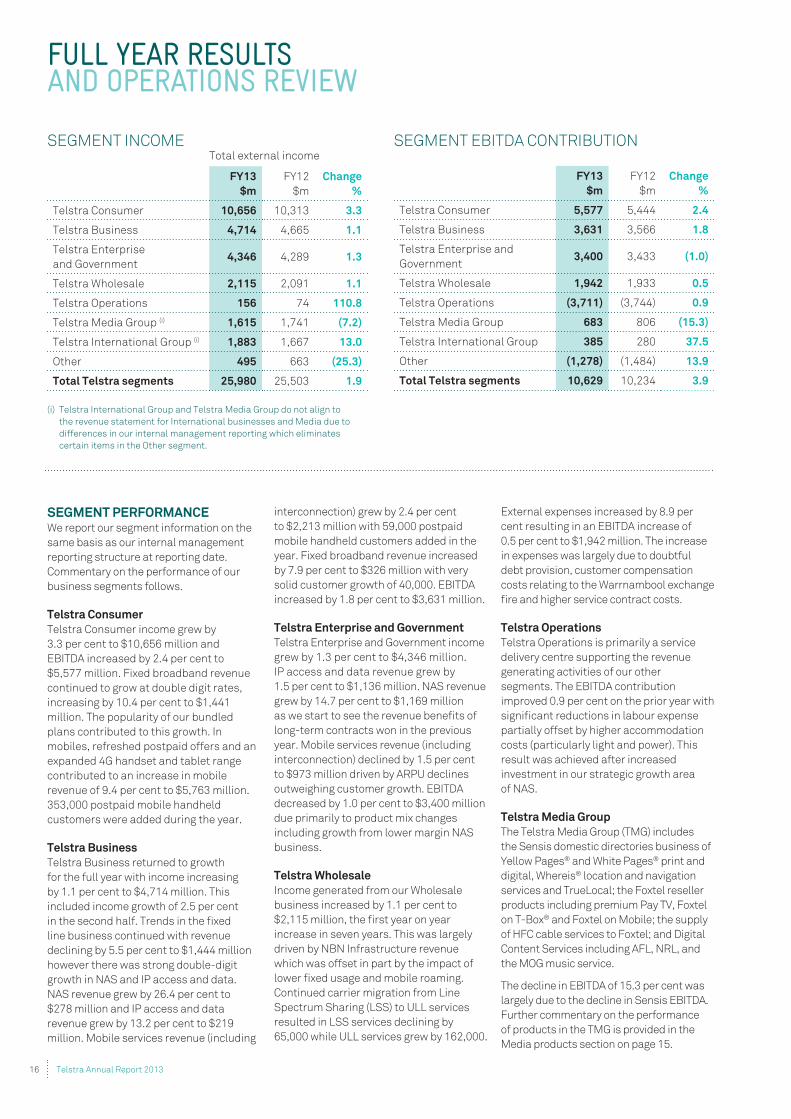
SEGMENT EBITDA CONTRIBUTION
FY13
$m
FY12
$m
Change
%
Telstra Consumer 5,577 5,444 2.4
Telstra Business 3,631 3,566 1.8
Telstra Enterprise and
Government3,400 3,433 (1.0)
Telstra Wholesale 1,942 1,933 0.5
Telstra Operations (3,711) (3,744) 0.9
Telstra Media Group 683 806 (15.3)
Telstra International Group 385 280 37.5
Other (1,278) (1,484) 13.9
Total Telstra segments 10,629 10,234 3.9
SEGMENT INCOME
Total external income
FY13
$m
FY12
$m
Change
%
Telstra Consumer 10,656 10,313 3.3
Telstra Business 4,714 4,665 1.1
Telstra Enterprise
and Government4,346 4,289 1.3
Telstra Wholesale 2,115 2,091 1.1
Telstra Operations 156 74 110.8
Telstra Media Group (i) 1,615 1,741 (7.2)
Telstra International Group (i) 1,883 1,667 13.0
Other 495 663 (25.3)
Total Telstra segments 25,980 25,503 1.9
(i) Telstra International Group and Telstra Media Group do not align to
the revenue statement for International businesses and Media due to
differences in our internal management reporting which eliminates
certain items in the Other segment.
16 Telstra Annual Report 2013
Telstra International Group
Telstra International Group (TIG)
segment income grew by 13.0 per cent to
$1,883 million and EBITDA contribution
grew by 37.5 per cent to $385 million.
Further commentary on the performance
of the components in the TIG segment is
provided in the International businesses
section on page 15.
Other
Our Other category consists primarily of
our corporate centre functions where we
recognise payments received under NBN
agreements, impairments, adjustments
to our employee provisions for bond rate
movements and short term incentives, and
redundancy expenses for the parent entity.
The results of our New Zealand subsidiary
TelstraClear, which was sold in October
2012, is also included in the Other category.
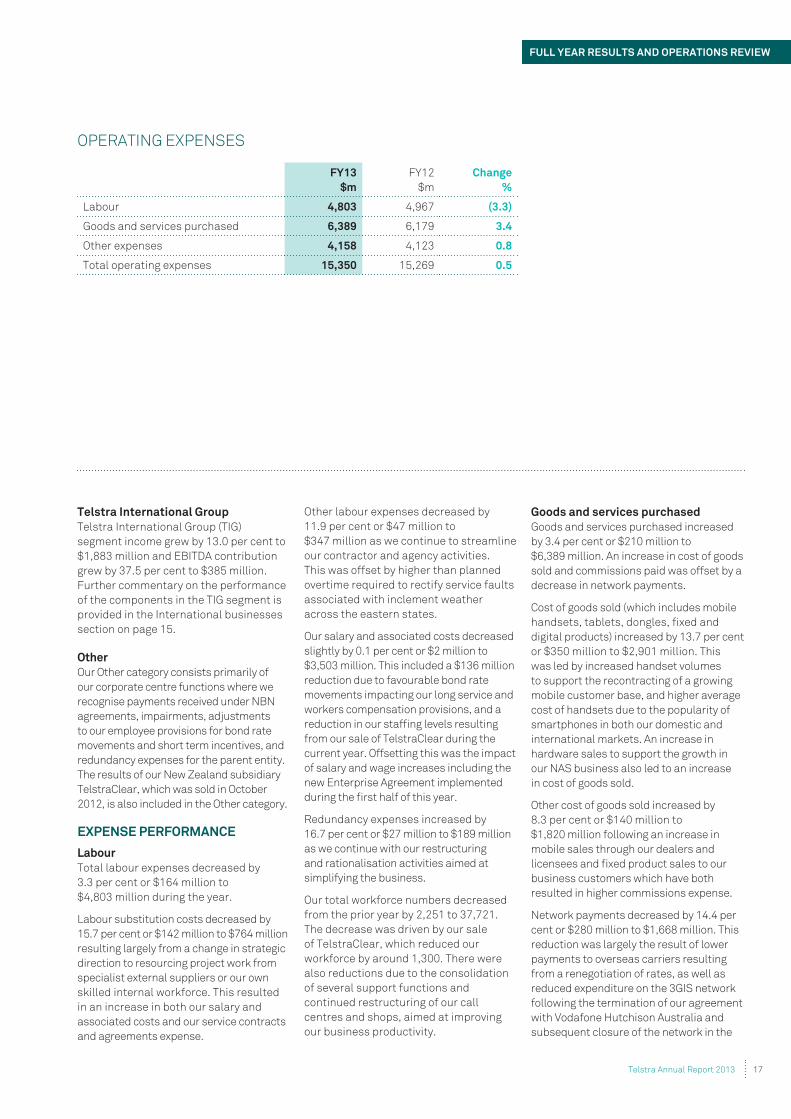
EXPENSE PERFORMANCE
Labour
Total labour expenses decreased by
3.3 per cent or $164 million to
$4,803 million during the year.
Labour substitution costs decreased by
15.7 per cent or $142 million to $764 million
resulting largely from a change in strategic
direction to resourcing project work from
specialist external suppliers or our own
skilled internal workforce. This resulted
in an increase in both our salary and
associated costs and our service contracts
and agreements expense.
Other labour expenses decreased by
11.9 per cent or $47 million to
$347 million as we continue to streamline
our contractor and agency activities.
This was offset by higher than planned
overtime required to rectify service faults
associated with inclement weather
across the eastern states.
Our salary and associated costs decreased
slightly by 0.1 per cent or $2 million to
$3,503 million. This included a $136 million
reduction due to favourable bond rate
movements impacting our long service and
workers compensation provisions, and a
reduction in our staffing levels resulting
from our sale of TelstraClear during the
current year. Offsetting this was the impact
of salary and wage increases including the
new Enterprise Agreement implemented
during the first half of this year.
Redundancy expenses increased by
16.7 per cent or $27 million to $189 million
as we continue with our restructuring
and rationalisation activities aimed at
simplifying the business.
Our total workforce numbers decreased
from the prior year by 2,251 to 37,721.
The decrease was driven by our sale
of TelstraClear, which reduced our
workforce by around 1,300. There were
also reductions due to the consolidation
of several support functions and
continued restructuring of our call
centres and shops, aimed at improving
our business productivity.
Goods and services purchased
Goods and services purchased increased
by 3.4 per cent or $210 million to
$6,389 million. An increase in cost of goods
sold and commissions paid was offset by a
decrease in network payments.
Cost of goods sold (which includes mobile
handsets, tablets, dongles, fixed and
digital products) increased by 13.7 per cent
or $350 million to $2,901 million. This
was led by increased handset volumes
to support the recontracting of a growing
mobile customer base, and higher average
cost of handsets due to the popularity of
smartphones in both our domestic and
international markets. An increase in
hardware sales to support the growth in
our NAS business also led to an increase
in cost of goods sold.
Other cost of goods sold increased by
8.3 per cent or $140 million to
$1,820 million following an increase in
mobile sales through our dealers and
licensees and fixed product sales to our
business customers which have both
resulted in higher commissions expense.
Network payments decreased by 14.4 per
cent or $280 million to $1,668 million. This
reduction was largely the result of lower
payments to overseas carriers resulting
from a renegotiation of rates, as well as
reduced expenditure on the 3GIS network
following the termination of our agreement
with Vodafone Hutchison Australia and
subsequent closure of the network in the
OPERATING EXPENSES
FY13
$m
FY12
$m
Change
%
Labour 4,803 4,967 (3.3)
Goods and services purchased 6,389 6,179 3.4
Other expenses 4,158 4,123 0.8
Total operating expenses 15,350 15,269 0.5
17Telstra Annual Report 2013
FULL YEAR RESULTS AND OPERATIONS REVIEW
first half of this financial year. Savings from
the reduction in the mobile terminating
access (MTA) rate (9.0 cents to 6.0 cents
per minute in January 2012, and then from
6.0 cents to 4.8 cents per minute in January
2013) were partially offset by an increase in
the volume of SMS/MMS traffic. There was
also a reduction in network payments as a
result of the sale of TelstraClear.
Other expenses
Total other expenses increased
marginally by 0.8 per cent or
$35 million to $4,158 million. This
increase was driven by service contracts
and agreements and our recognition of a
loss on the sale of TelstraClear during the
first half of this year. This was offset by a
decrease in impairment expenses.
Service contracts and agreements
increased by 12.4 per cent or $153 million
to $1,382 million with the utilisation of
additional external expertise to support
current programs including our initiatives
to drive greater customer advocacy,
operational efficiency and ongoing site
recovery and maintenance. Expenses
were also incurred in relation to our
commitments under the NBN and AFL
rights agreements.
Other operating expenses increased by
5.0 per cent or $118 million to $2,468 million
mainly due to the completion of our sale
of TelstraClear on 31 October 2012 which
resulted in a loss on sale of $127 million.
Impairment and diminution expenses
decreased by 43.4 per cent or $236 million
to $308 million. Bad and doubtful debts
expense declined by 28.7 per cent or
$85 million to $211 million due to lower
levels of consumer debt defaults, improved
remediation of long outstanding debt and
tighter assessment of customers at time
of connection. The prior period included
impairments in both TelstraClear and the
LMobile Group.
Excluding TelstraClear related expenditure
and sale adjustments from both periods,
other expenses increased by 1.7 per cent.
Finance costs
Net finance costs increased by 2.4 per cent
or $21 million to $909 million.
Net borrowing costs decreased by
$139 million due to a reduction in the net
average interest cost (from 7.0 per cent
to 6.4 per cent) and a reduction in the
average volume of our net interest bearing
liabilities. The rate reduction arises
principally from a reduction in market base
rates during the year, resulting in lower
of our debt portfolio.
Other net finance costs increased by
$160 million largely due to revaluation
impacts relating to our fair value
hedges and on transactions not in, or
de-designated from, hedge relationships.
This was predominantly due to movements
in base market interest rates and
borrowing margins, as well as net present
value calculations as borrowings move
closer to maturity.
FINANCIAL POSITION
Capital expenditure and cash flow
Our operating capital expenditure
increased by 5.6 per cent to $3,792 million
in line with our 15 per cent capex to sales
guidance. This investment has enabled
us to meet ongoing customer demand,
support the accelerated rollout of mobile
4G LTE and meet ongoing delivery of NBN
commitments.
and investing activities was $5,024 million,
representing a decline of 3.3 per cent.
This included increased working capital to
support business growth, cash proceeds
from the sale of TelstraClear of $669
million and spectrum licence payments of
$821 million. Excluding the cash proceeds
from sale of TelstraClear and spectrum
licence payments, on a full year basis,
Debt position
Our gross debt position at 30 June 2013
was $15,628 million, a decrease of
$1,594 million from 30 June 2012.
This included the early repayment in June
2013 of a US$600 million (A$630 million)
bank loan due to mature in August 2013.
repayments of $2,065 million partly
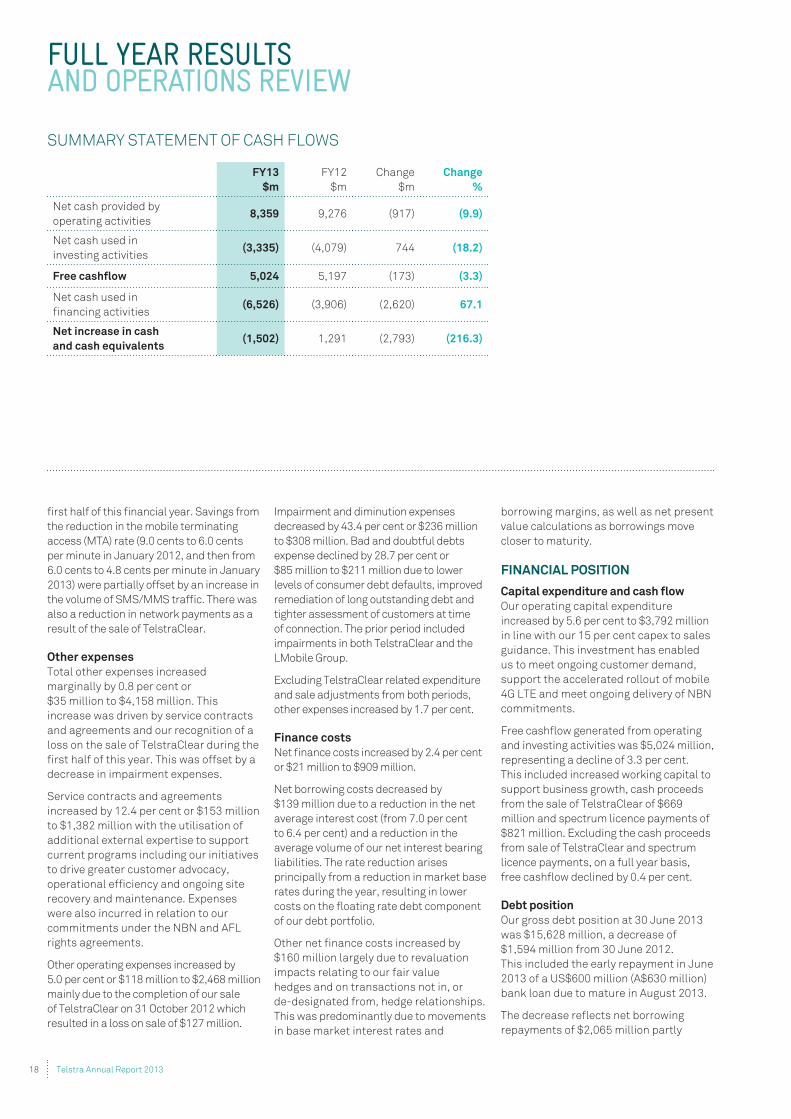
FULL YEAR RESULTS AND OPERATIONS REVIEW
SUMMARY STATEMENT OF CASH FLOWS
FY13
$m
FY12
$m
Change
$m
Change
%
Net cash provided by
operating activities 8,359 9,276 (917) (9.9)
Net cash used in
investing activities(3,335) (4,079) 744 (18.2)
Free cashflow 5,024 5,197 (173) (3.3)
Net cash used in
financing activities(6,526) (3,906) (2,620) 67.1
Net increase in cash
and cash equivalents(1,502) 1,291 (2,793) (216.3)
18 Telstra Annual Report 2013
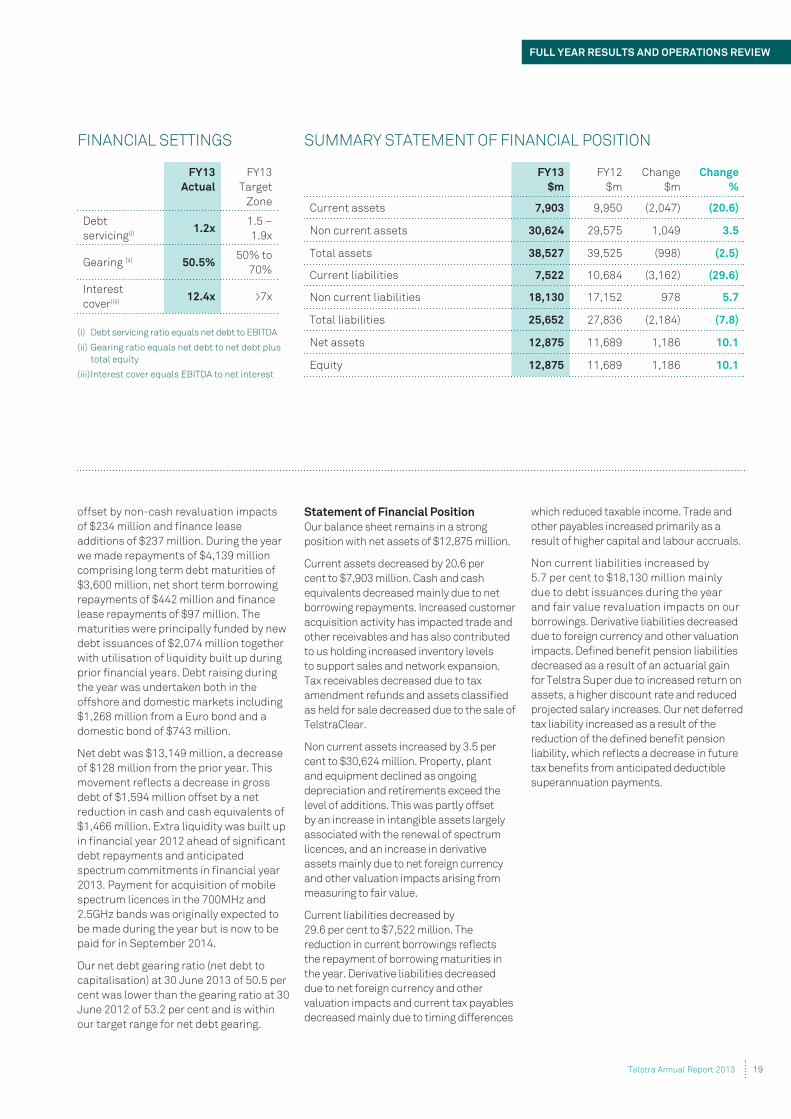
FINANCIAL SETTINGS
FY13
Actual
FY13
Target
Zone
Debt
servicing(i)1.2x
1.5 –
1.9x
Gearing (ii) 50.5%50% to
70%
Interest
cover(iii)12.4x >7x
(i) Debt servicing ratio equals net debt to EBITDA
(ii) Gearing ratio equals net debt to net debt plus
total equity
(iii) Interest cover equals EBITDA to net interest
SUMMARY STATEMENT OF FINANCIAL POSITION
FY13
$m
FY12
$m
Change
$m
Change
%
Current assets 7,903 9,950 (2,047) (20.6)
Non current assets 30,624 29,575 1,049 3.5
Total assets 38,527 39,525 (998) (2.5)
Current liabilities 7,522 10,684 (3,162) (29.6)
Non current liabilities 18,130 17,152 978 5.7
Total liabilities 25,652 27,836 (2,184) (7.8)
Net assets 12,875 11,689 1,186 10.1
Equity 12,875 11,689 1,186 10.1
offset by non-cash revaluation impacts
of $234 million and finance lease
additions of $237 million. During the year
we made repayments of $4,139 million
comprising long term debt maturities of
$3,600 million, net short term borrowing
repayments of $442 million and finance
lease repayments of $97 million. The
maturities were principally funded by new
debt issuances of $2,074 million together
with utilisation of liquidity built up during
prior financial years. Debt raising during
the year was undertaken both in the
offshore and domestic markets including
$1,268 million from a Euro bond and a
domestic bond of $743 million.
Net debt was $13,149 million, a decrease
of $128 million from the prior year. This
debt of $1,594 million offset by a net
reduction in cash and cash equivalents of
$1,466 million. Extra liquidity was built up
in financial year 2012 ahead of significant
debt repayments and anticipated
spectrum commitments in financial year
2013. Payment for acquisition of mobile
spectrum licences in the 700MHz and
2.5GHz bands was originally expected to
be made during the year but is now to be
paid for in September 2014.
Our net debt gearing ratio (net debt to
capitalisation) at 30 June 2013 of 50.5 per
cent was lower than the gearing ratio at 30
June 2012 of 53.2 per cent and is within
our target range for net debt gearing.
Statement of Financial Position
Our balance sheet remains in a strong
position with net assets of $12,875 million.
Current assets decreased by 20.6 per
cent to $7,903 million. Cash and cash
equivalents decreased mainly due to net
borrowing repayments. Increased customer
acquisition activity has impacted trade and
other receivables and has also contributed
to us holding increased inventory levels
to support sales and network expansion.
Tax receivables decreased due to tax
amendment refunds and assets classified
as held for sale decreased due to the sale of
TelstraClear.
Non current assets increased by 3.5 per
cent to $30,624 million. Property, plant
and equipment declined as ongoing
depreciation and retirements exceed the
level of additions. This was partly offset
by an increase in intangible assets largely
associated with the renewal of spectrum
licences, and an increase in derivative
assets mainly due to net foreign currency
and other valuation impacts arising from
measuring to fair value.
Current liabilities decreased by
29.6 per cent to $7,522 million. The
the repayment of borrowing maturities in
the year. Derivative liabilities decreased
due to net foreign currency and other
valuation impacts and current tax payables
decreased mainly due to timing differences
which reduced taxable income. Trade and
other payables increased primarily as a
result of higher capital and labour accruals.
Non current liabilities increased by
5.7 per cent to $18,130 million mainly
due to debt issuances during the year
and fair value revaluation impacts on our
borrowings. Derivative liabilities decreased
due to foreign currency and other valuation
impacts. Defined benefit pension liabilities
decreased as a result of an actuarial gain
for Telstra Super due to increased return on
assets, a higher discount rate and reduced
projected salary increases. Our net deferred
tax liability increased as a result of the
reduction of the defined benefit pension
tax benefits from anticipated deductible
superannuation payments.
19Telstra Annual Report 2013
FULL YEAR RESULTS AND OPERATIONS REVIEW
SUSTAINABILITYOUR APPROACH
OUR COMMITMENTTelstra’s commitment is to manage our
business well and to deliver an overall
positive impact for our customers,
employees, shareholders, the wider
community and the natural environment.
Our primary corporate responsibilities
are to:
shareholder interests
environment
technology, products and services, and
funds to support the communities in
which we operate
strengthening the capability of
the nation’s telecommunications
infrastructure, and thereby providing a
strong foundation for economic growth,
productivity improvement, sustainable
prosperity and global competitive
advantage.
KEY ISSUESWe undertake a formal and consultative
approach to ensure that we identify and
respond to key sustainability issues
and opportunities that are important to
both our business and our stakeholders.
Increasingly, we seek to identify the
ways in which we can use our core
telecommunications capabilities, assets,
expertise, workforce and national
presence to make a genuine contribution
to the communities in which we operate.
To do this, we work with our customers
and suppliers, engage our employees and
develop partnerships with government
and non-profit organisations.
GOVERNANCEGovernance of Telstra’s sustainability
strategy and performance is provided by
the Telstra Sustainability Council, which
is chaired by the CEO and comprises
Telstra’s Executive Leadership Team.
Reports on sustainability progress
are also regularly provided to the CEO
and the Telstra Board. Telstra’s Chief
Sustainability Officer provides strategic
leadership for sustainability and is
responsible for the implementation
of our approach and programs.
OUR GOAL IS TO
EMBED SOCIAL AND
ENVIRONMENTAL
CONSIDERATIONS INTO
THE HEART OF OUR
BUSINESS IN WAYS
THAT CREATE VALUE
20 Telstra Annual Report 2013
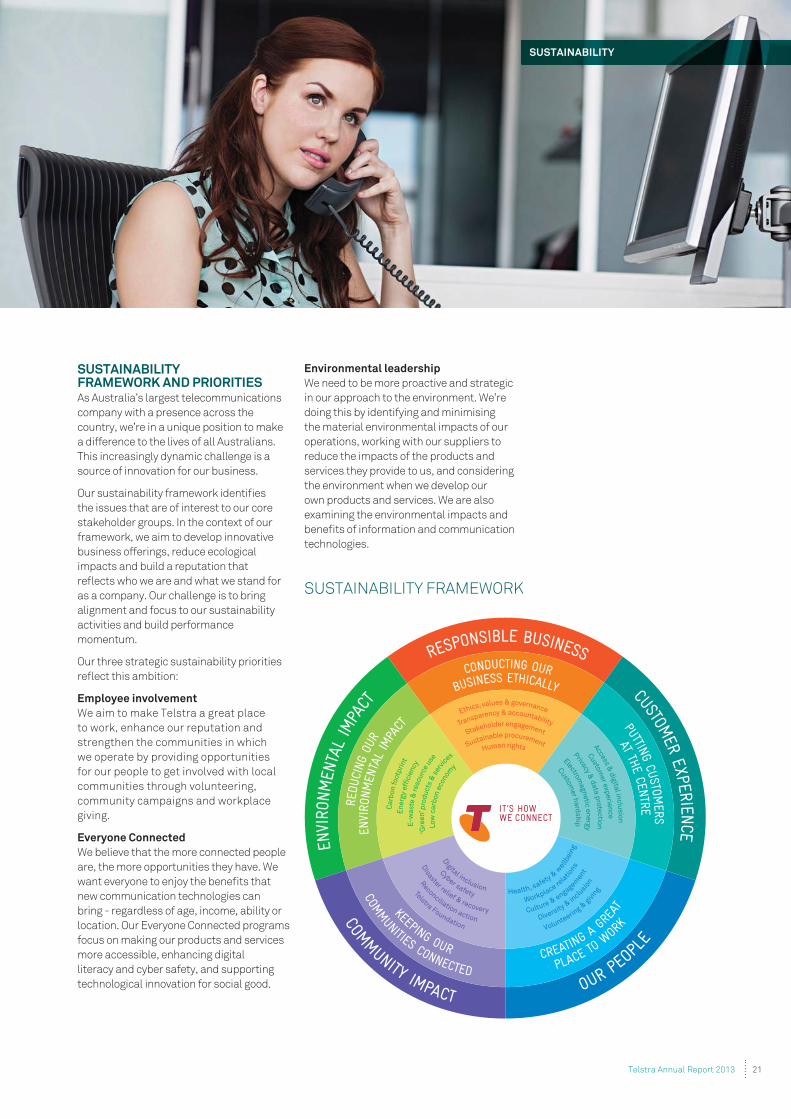
SUSTAINABILITY FRAMEWORK AND PRIORITIESAs Australia’s largest telecommunications
company with a presence across the
country, we’re in a unique position to make
a difference to the lives of all Australians.
This increasingly dynamic challenge is a
source of innovation for our business.
Our sustainability framework identifies
the issues that are of interest to our core
stakeholder groups. In the context of our
framework, we aim to develop innovative
business offerings, reduce ecological
impacts and build a reputation that
as a company. Our challenge is to bring
alignment and focus to our sustainability
activities and build performance
momentum.
Our three strategic sustainability priorities
Employee involvement
We aim to make Telstra a great place
to work, enhance our reputation and
strengthen the communities in which
we operate by providing opportunities
for our people to get involved with local
communities through volunteering,
community campaigns and workplace
giving.
Everyone Connected
We believe that the more connected people
are, the more opportunities they have. We
want everyone to enjoy the benefits that
new communication technologies can
bring - regardless of age, income, ability or
location. Our Everyone Connected programs
focus on making our products and services
more accessible, enhancing digital
literacy and cyber safety, and supporting
technological innovation for social good.
Environmental leadership
We need to be more proactive and strategic
in our approach to the environment. We’re
doing this by identifying and minimising
the material environmental impacts of our
operations, working with our suppliers to
reduce the impacts of the products and
services they provide to us, and considering
the environment when we develop our
own products and services. We are also
examining the environmental impacts and
benefits of information and communication
technologies.
SUSTAINABILITY FRAMEWORK
21Telstra Annual Report 2013
SUSTAINABILITY
UNITED NATIONS GLOBAL COMPACTIn December 2011, Telstra became a
signatory to the United Nations Global
Compact, signalling our commitment
to responsible business practice in
all our markets. We are committed to
aligning our operations and strategies
with ten universally accepted principles
in the areas of human rights, labour,
environment and anti-corruption. Our
commitment to these principles is
As a member of the Global Compact
Network Australia, we participated in
leadership groups for environment,
business and human rights, and anti-
corruption this year.
SUPPLY CHAINThis year we purchased around $6 billion
in goods and services from close to 8,000
suppliers, placing us in a strong position
standards of our suppliers.
In January 2013, we introduced a Supplier
Code of Conduct which describes the
standards required to conduct business
with Telstra and ensures that social
and environmental considerations are
included when choosing suppliers.
Refinement of the code will be a focus
in the coming year.
In 2010, we made a commitment to
increase the diversity of our supply
chain by becoming a member of Supply
Nation, which links organisations with
Indigenous business suppliers. This year,
we updated our tendering process with
a requirement to consider organisations
certified by Supply Nation. This has led
to an increase in expenditure with Supply
Nation suppliers.
SUPPORTED WORKFORCETelstra partners with local non-
profit groups to create employment
opportunities for people with disability
or who are disadvantaged. We work with
14 community groups across Australia,
as part of the Supported Workforce
Program, to clean and maintain Telstra
exchanges. We now have more than 300
people working in the program around the
country, which represents a 67 per cent
increase over the past year. In December
2012, the program received a Disability
Services Australia award for improving
employment opportunities.
SUSTAINABILITYRESPONSIBLE BUSINESS
WE’RE COMMITTED
TO EXCELLENCE IN
CORPORATE GOVERNANCE,
TRANSPARENCY AND
ACCOUNTABILITY
22 Telstra Annual Report 2013
SUSTAINABILITYCUSTOMER EXPERIENCE
CUSTOMERS EXPERIENCING DISADVANTAGEWe celebrated the 10th anniversary of
our Access for Everyone program, which
assists people on a low income or facing
financial hardship to stay connected.
Since 2002, we’ve provided benefits to
the value of $2.2 billion. This year, we
introduced a new targeted phone and
broadband bundle plan specifically for
people on a low income, and launched a
new program providing $1 million worth
of pre-paid mobile phone recharge cards
for customers in crisis to stay in touch.
We also revised our Financial Hardship
Policy to cover events including sudden
illness or loss of employment that may
impact customers’ ability to pay their
bills.
CUSTOMERS WITH DISABILITYThis year, we completed the
implementation of our fifth Disability
Action Plan (2010-2012). An independent
review found that 94 per cent of the
actions were completed or ongoing.
The Plan recognised the benefits that
modern information and communications
technologies bring to people with
disability, and incorporated actions
to provide a better experience for our
customers with disability and their
carers.
REMOTE INDIGENOUS COMMUNITIESWe announced a $5.76 million joint
investment with the Northern Territory
(NT) Government to deliver mobile
coverage to eight remote communities
and fixed broadband services to six
remote communities in the NT by the end
of 2013. This will reach more than 8,000
people.
PRIVACY PROTECTIONProtecting our customers’ privacy is a
core priority, and a key factor in driving
customer advocacy and trust. Although
there have been fewer incidents overall
this year, we know we need to do better.
Of particular concern was an incident in
May 2013, where some of our customers’
details were accidentally made available
online. Having customer information
revealed in such a way is completely
unacceptable, under any circumstances.
As soon as possible after we were made
aware of this, we ensured that access
to the information was removed and we
quickly notified affected customers. We
also informed the Office of the Australian
Information Commissioner and have
reviewed the incident and are introducing
measures to protect against similar
incidents occurring again.
ONLINE SAFETY AND SECURITYWe launched a new opt-in tool to
protect families online, Smart Controls®,
designed to complement regular parental
involvement in kids’ use of mobile phones
by encouraging safe and responsible
behaviour. This is in addition to our
existing product Telstra Safe Social®, a
new social networking protection tool
available to BigPond Security customers.
We also launched a range of cyber
safety brochures and delivered 32 cyber
safety seminars to more than 11,000
parents and high school students around
Australia.
WE WANT TO ENSURE THAT
ALL AUSTRALIANS ENJOY
THE EVERYDAY BENEFITS
OF BEING CONNECTED TO
MODERN COMMUNICATION
TECHNOLOGIES
23Telstra Annual Report 2013
SUSTAINABILITY
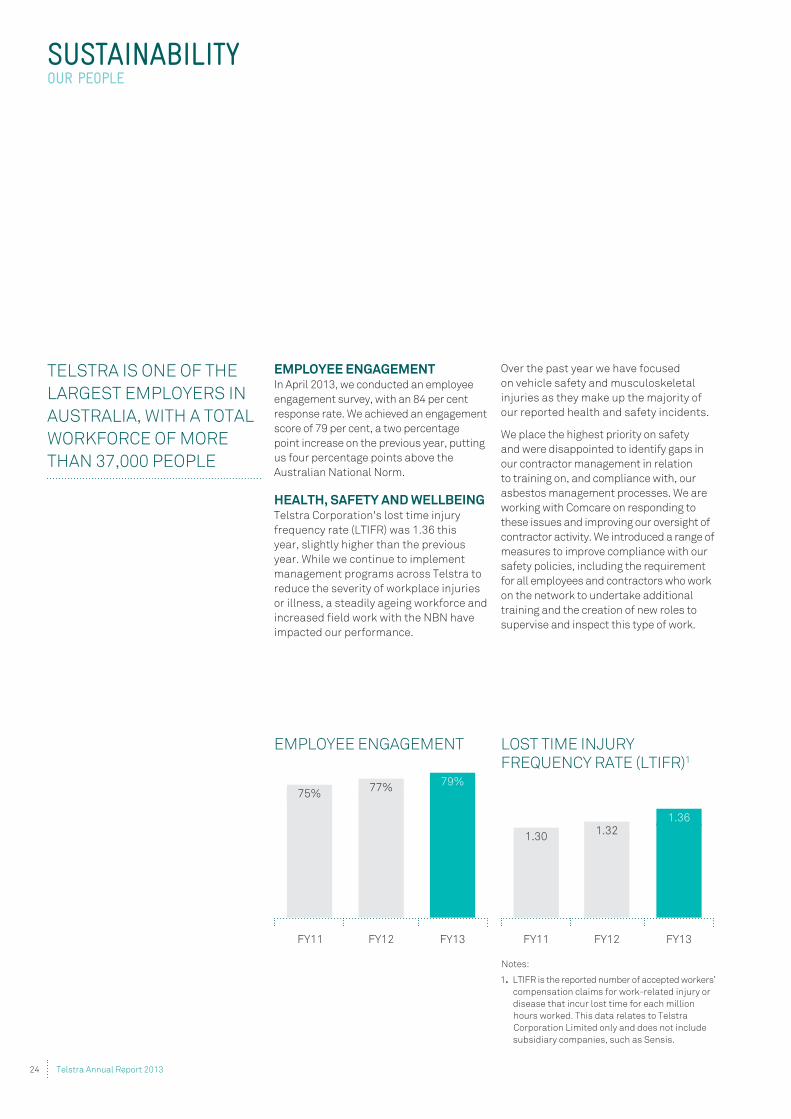
EMPLOYEE ENGAGEMENTIn April 2013, we conducted an employee
engagement survey, with an 84 per cent
response rate. We achieved an engagement
score of 79 per cent, a two percentage
point increase on the previous year, putting
us four percentage points above the
Australian National Norm.
HEALTH, SAFETY AND WELLBEINGTelstra Corporation's lost time injury
frequency rate (LTIFR) was 1.36 this
year, slightly higher than the previous
year. While we continue to implement
management programs across Telstra to
reduce the severity of workplace injuries
or illness, a steadily ageing workforce and
increased field work with the NBN have
impacted our performance.
Over the past year we have focused
on vehicle safety and musculoskeletal
injuries as they make up the majority of
our reported health and safety incidents.
We place the highest priority on safety
and were disappointed to identify gaps in
our contractor management in relation
to training on, and compliance with, our
asbestos management processes. We are
working with Comcare on responding to
these issues and improving our oversight of
contractor activity. We introduced a range of
measures to improve compliance with our
safety policies, including the requirement
for all employees and contractors who work
on the network to undertake additional
training and the creation of new roles to
supervise and inspect this type of work.
TELSTRA IS ONE OF THE
LARGEST EMPLOYERS IN
AUSTRALIA, WITH A TOTAL
WORKFORCE OF MORE
THAN 37,000 PEOPLE
SUSTAINABILITYOUR PEOPLE
1.321.36
1.30
LOST TIME INJURY FREQUENCY RATE (LTIFR)1
Notes:
1. LTIFR is the reported number of accepted workers’
compensation claims for work-related injury or
disease that incur lost time for each million
hours worked. This data relates to Telstra
Corporation Limited only and does not include
subsidiary companies, such as Sensis.
EMPLOYEE ENGAGEMENT
75%77%
79%
FY12 FY13FY11FY11 FY13FY12
24 Telstra Annual Report 2013
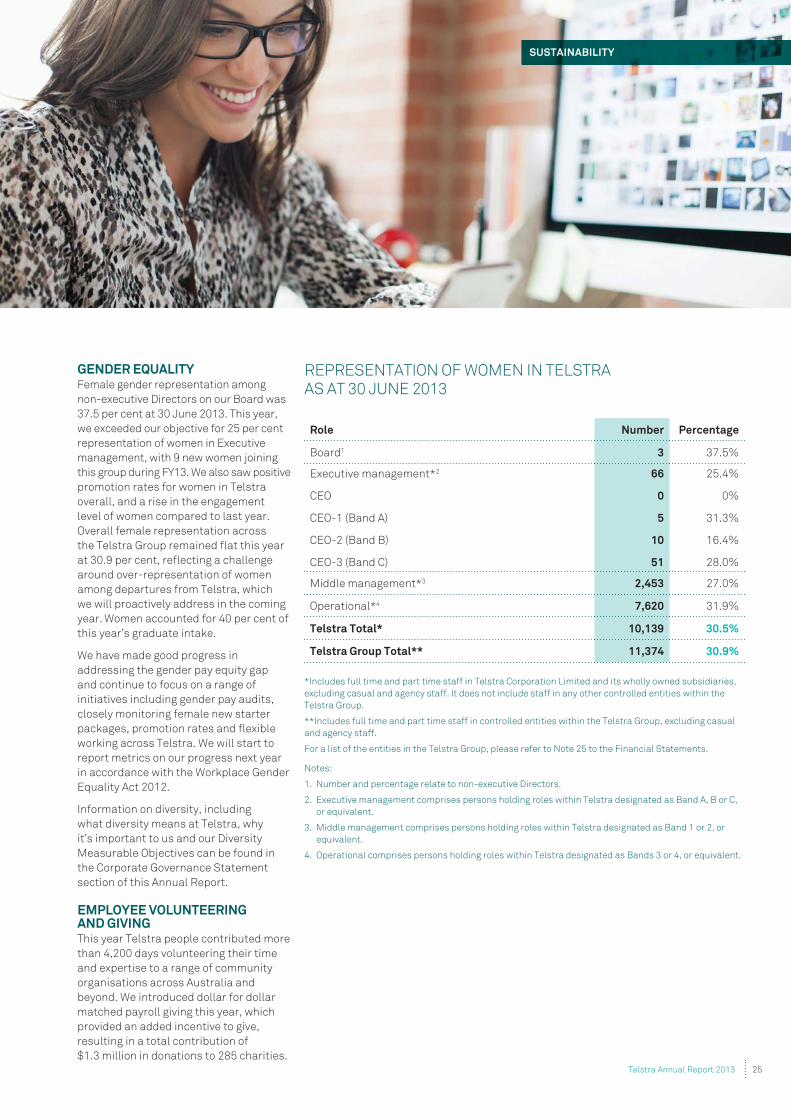
GENDER EQUALITY
37.5 per cent at 30 June 2013. This year,
promotion rates for women in Telstra
overall, and a rise in the engagement
level of women compared to last year.
Overall female representation across
around over-representation of women
among departures from Telstra, which
we will proactively address in the coming
year. Women accounted for 40 per cent of
this year’s graduate intake.
We have made good progress in
addressing the gender pay equity gap
and continue to focus on a range of
initiatives including gender pay audits,
closely monitoring female new starter
working across Telstra. We will start to
what diversity means at Telstra, why
Measurable Objectives can be found in
EMPLOYEE VOLUNTEERING AND GIVINGThis year Telstra people contributed more
than 4,200 days volunteering their time
beyond. We introduced dollar for dollar
matched payroll giving this year, which
provided an added incentive to give,
resulting in a total contribution of
$1.3 million in donations to 285 charities.
Role Number Percentage
1 3 37.5%
2 66
0
5
10
51
25.4%
0%
31.3%
28.0%
3 2,453 27.0%
4 7,620
Telstra Total* 10,139 30.5%
Telstra Group Total** 11,374 30.9%
and agency staff.
or equivalent.
equivalent.
25Telstra Annual Report 2013
SUSTAINABILITY
SUSTAINABILITYCOMMUNITY IMPACT
TELSTRA FOUNDATIONThrough its social innovation
program, the Telstra Foundation
works in partnership with community
organisations to bring ideas and
technology together - unlocking digital
potential. This year we committed
$1 million in three new social innovation
grants, including support for the MJD
Foundation to deliver a digital inclusion
program for Indigenous people living with
Machado-Joseph Disease (MJD) in the
Northern Territory. MJD is a hereditary
neurodegenerative condition, life limiting
and with no known cure. The project
will use innovative tablet technology to
deliver health services and support to 30
Indigenous MJD clients and their carers
across six Arnhem Land communities.
INDIGENOUS COMMUNITIESWe consulted widely this year to explore
the digital inclusion potential for
Aboriginal and Torres Strait Islander
people. We will use the findings and work
in partnership with the National Centre
of Indigenous Excellence to develop a
national strategy for Indigenous Digital
Excellence.
We renewed our partnership with One
Laptop Per Child Australia (OLPCA) for
another two years, committing an additional
$200,000 to help deploy 50,000 laptops to
disadvantaged schools, including many
with a large Indigenous student population.
Since 2010, Telstra has provided $900,000
in seed funding to OLPCA.
This year we became one of the first
corporations in Australia to formally
recognise the traditional owners of
land and country, by installing signs of
acknowledgement in every branded Telstra
store and business centre across Australia.
DIGITAL LITERACY We established a partnership with the
New South Wales Government to deliver
the Tech Savvy Seniors program. The
18 month program will deliver digital
literacy training to around 15,000
senior Australians through more than
40 community colleges and 100 local
libraries, particularly in regional and
remote areas of NSW.
We also launched a partnership with
Able Australia Services to help deafblind
Australians better access technology.
Communication difficulties associated
with deafblindness can lead to social
isolation, unemployment and the
frustration of relying on support workers.
The partnership will deliver digital literacy
training and provide access to equipment
such as tablets and Braille devices.
E-SMART LIBRARIESIn August 2012, we launched eSmart
Libraries, a multi-year, $8 million
partnership between the Telstra
Foundation and The Alannah and
Madeline Foundation. The initiative will
better equip 1,500 public libraries across
the country and support library users
with the skills they need for smart, safe
and responsible use of technology. To
date, more than 140 library employees
from 100 libraries across Australia have
attended training sessions as part of the
eSmart Libraries pilot.
WE USE OUR TECHNOLOGY,
EXPERTISE, SCALE AND
PRESENCE ACROSS
THE NATION TO MAKE A
POSITIVE CONTRIBUTION
TO THE COMMUNITY
26 Telstra Annual Report 2013
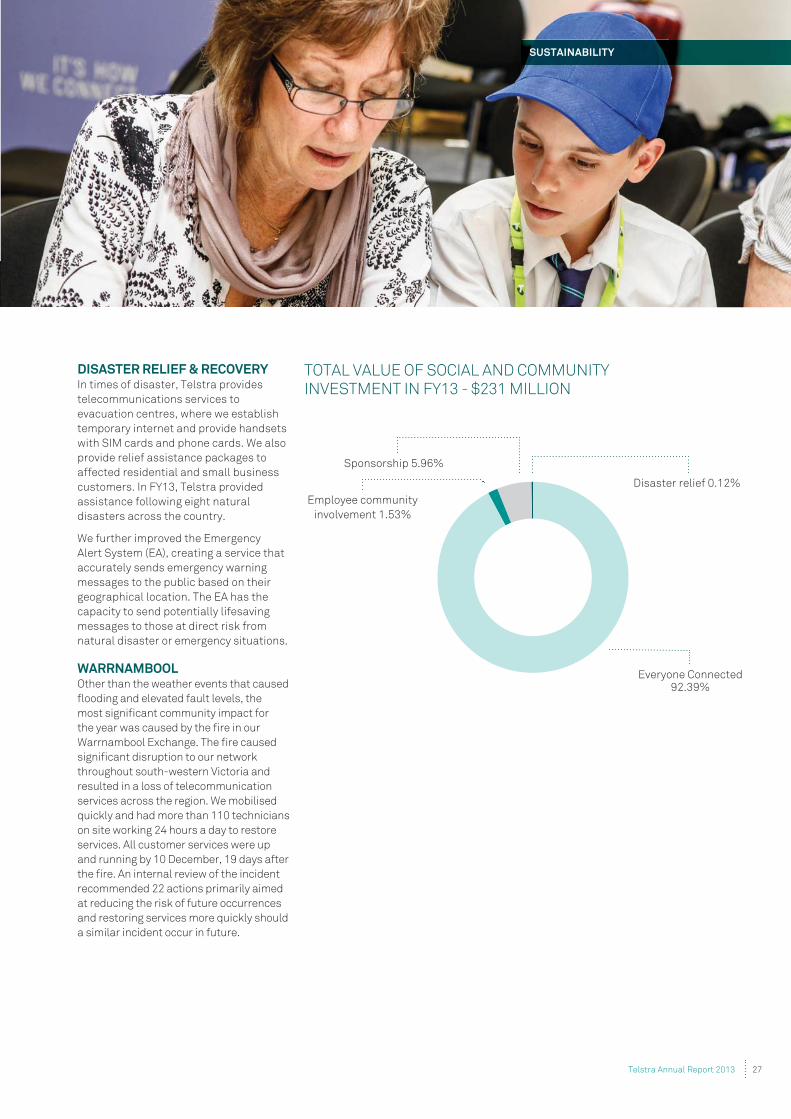
DISASTER RELIEF & RECOVERYIn times of disaster, Telstra provides
telecommunications services to
evacuation centres, where we establish
temporary internet and provide handsets
with SIM cards and phone cards. We also
provide relief assistance packages to
affected residential and small business
customers. In FY13, Telstra provided
assistance following eight natural
disasters across the country.
We further improved the Emergency
Alert System (EA), creating a service that
accurately sends emergency warning
messages to the public based on their
geographical location. The EA has the
capacity to send potentially lifesaving
messages to those at direct risk from
natural disaster or emergency situations.
WARRNAMBOOLOther than the weather events that caused
flooding and elevated fault levels, the
most significant community impact for
the year was caused by the fire in our
Warrnambool Exchange. The fire caused
significant disruption to our network
throughout south-western Victoria and
resulted in a loss of telecommunication
services across the region. We mobilised
quickly and had more than 110 technicians
on site working 24 hours a day to restore
services. All customer services were up
and running by 10 December, 19 days after
the fire. An internal review of the incident
recommended 22 actions primarily aimed
at reducing the risk of future occurrences
and restoring services more quickly should
a similar incident occur in future.
TOTAL VALUE OF SOCIAL AND COMMUNITY INVESTMENT IN FY13 - $231 MILLION
Disaster relief 0.12%
Everyone Connected92.39%
Employee community
involvement 1.53%
Sponsorship 5.96%
27Telstra Annual Report 2013
SUSTAINABILITY
ENVIRONMENT STRATEGY This year, we reviewed our environmental
capabilities, risks and opportunities.
We also commissioned an independent
review to assess the environmental
issues that matter most to our
stakeholders and have the potential for
the biggest impact on the company.
framework for an enterprise-wide
environmental strategy, which will focus
on three key areas - improving the energy
efficiency of our operations, reducing
environmental impact in our supply chain
and developing greener products and
services. We will finalise the strategy and
ENERGY EFFICIENCY AND CARBON EMISSIONSOur largest environmental impact is
associated with our networks, which
need large amounts of energy to power
equipment and keep it at optimum
total energy consumption.
2e per terabyte of data, a
33 per cent decrease on carbon emissions
15 per cent reduction target.
our carbon emissions efficiency due to
better utilisation of network equipment
and a continued dedicated investment
in energy and carbon efficiency projects.
We have set a target for a further 15 per
cent reduction in emissions intensity
Total energy consumption (stationary and
This reduction was driven by decreases
in electricity consumption across several
key areas of our business.
PAPER USE - SENSIS PRINT DIRECTORIES
® and White Pages®
we supported four carbon reduction
2
commitment, we will be purchasing
carbon offsets in late 2013 to certify
We are committed to using paper from
environmentally and socially responsible
sources and Telstra is a member of the
taken steps and transitioned to ensure we
and a number of our directories have
national recycling and reuse rate for our
We promote household recycling by
providing information on recycling options
and the associated environmental benefits.
OFFICE, BILLING AND PRINTING PAPERPaper usage fell by 24 per cent this year.
as more customers opt for online billing.
Use of printing paper also decreases with
the move to online advertising reducing
resulted in a 14 per cent decrease in
trends to continue.
SUSTAINABILITYENVIRONMENTAL IMPACT
28 Telstra Annual Report 2013
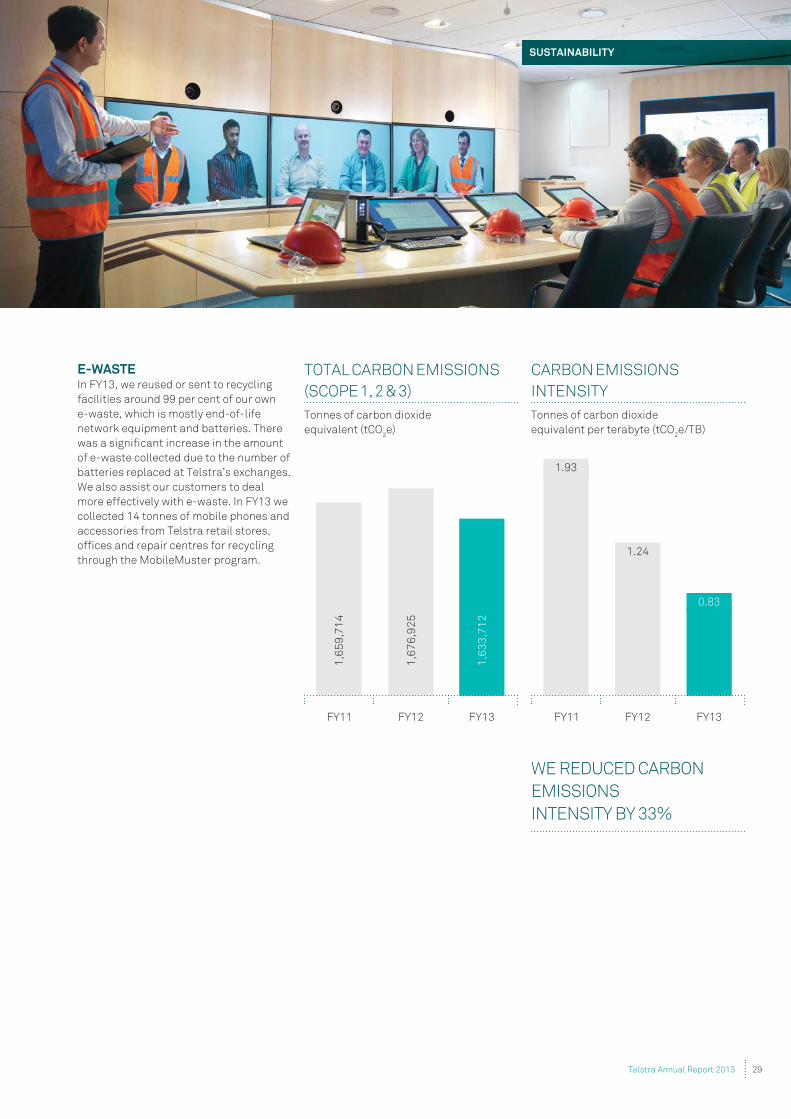
WE REDUCED CARBON
EMISSIONS
INTENSITY BY 33%
E-WASTEIn FY13, we reused or sent to recycling
facilities around 99 per cent of our own
e-waste, which is mostly end-of-life
network equipment and batteries. There
was a significant increase in the amount
of e-waste collected due to the number of
batteries replaced at Telstra’s exchanges.
We also assist our customers to deal
more effectively with e-waste. In FY13 we
collected 14 tonnes of mobile phones and
accessories from Telstra retail stores,
offices and repair centres for recycling
through the MobileMuster program.
CARBON EMISSIONS
INTENSITY
Tonnes of carbon dioxide
equivalent per terabyte (tCO2e/TB)
TOTAL CARBON EMISSIONS
(SCOPE 1, 2 & 3)
Tonnes of carbon dioxide
equivalent (tCO2e)
1,6
33
,71
2
1,6
59
,71
4
1,6
76
,92
5
1.93
1.24
0.83
FY13FY11 FY12 FY11 FY13FY12
29Telstra Annual Report 2013
SUSTAINABILITY

Ms Livingstone has been a non-executive Director since
November 2000, was appointed as Chairman in May 2009
and last re-elected in 2011. She is the Chairman of the
Nomination Committee, a member of the Audit and
Remuneration Committees and served on the Technology
Committee#.
Ms Livingstone is a Chartered Accountant and has held
several finance and general management roles primarily
in the medical devices sector. Ms Livingstone was the
Chief Executive of Cochlear Limited from 1994 to 2000.
She was Chairman of CSIRO from 2001 to 2006 and has
also served on the boards of Goodman Fielder Limited and
Rural Press Limited. In 2008, Ms Livingstone was appointed
an Officer of the Order of Australia for service to the
development of Australian science, technology and
innovation policies to the business sector.
Other listed companies - past three years
Director, WorleyParsons Limited (from 2007), Macquarie
Bank Limited (2003 - 2013) and Macquarie Group Limited
(2007 - 2013).
Other directorships/appointments
Member, Advisory Board for the John Grill Centre for
Project Leadership at University of Sydney (from 2013)
and New South Wales Innovation and Productivity Council
(from 2007); President, Australian Museum Trust (from
2012), Director, The George Institute (from 2012) and
Saluda Medical Pty Ltd (from 2013).
CATHERINE B LIVINGSTONE AO
BA (Hons), Hon DBus (Macquarie),
Hon DSc (Murdoch), FCA, FTSE,
FAICD
JOHN P MULLEN
Mr Mullen has been a non-executive Director since
July 2008. He is the Chairman of the Remuneration
Committee, a member of the Nomination Committee
and was last re-elected in 2011.
Mr Mullen is the Managing Director and Chief Executive
Officer of Asciano Ltd and has served in that role
since 2011. He has worked for over two decades
in a multitude of senior positions with different
multinationals including 10 years with the TNT Group,
with two years as its Chief Operating Officer. From 1991
to 1994, he held the position of Chief Executive Officer
of TNT Express Worldwide. Mr Mullen joined Deutsche
Post World Net (DPWN) as an Advisor in 1994, becoming
Chief Executive Officer of DHL Express Asia Pacific in
2002 and Joint Chief Executive Officer, DHL Express
in 2005. Mr Mullen was Global Chief Executive Officer,
DHL Express from 2006 to 2009.
Other listed companies - past three years
Director, Asciano Ltd (from 2011), Brambles Limited
(2009 - 2011), Embarq Corporation USA (2006 - 2009)
and MAp Airports Limited (2010 - 2011).
Other directorships/appointments
Member, Australian Graduate School of Management
(from 2005).
Mr Thodey became Chief Executive Officer and an
executive Director in May 2009.
Mr Thodey joined Telstra in April 2001 as Group
Managing Director of Telstra Mobiles and in December
2002 was appointed as Group Managing Director
Telstra Enterprise and Government where he was
responsible for the company’s corporate, government
and large business customers in Australia, TelstraClear
in New Zealand and Telstra’s International sales
division. Before joining Telstra, Mr Thodey was Chief
Executive Officer of IBM Australia/New Zealand and
previously held several senior executive positions in
marketing and sales with IBM across Asia Pacific.
Mr Thodey holds a Bachelor of Arts in Anthropology and
English from Victoria University in New Zealand and
attended the Kellogg Post-Graduate School General
Management Program at Northwestern University in
Chicago.
In January 2013, Mr Thodey joined the Board of the GSM
Association, the global body made up of carriers and
related companies that supports the standardisation
and deployment of mobile technology around the world.
Mr Thodey was previously Chairman of TelstraClear
New Zealand and Basketball Australia.
DAVID I THODEY
BA, FAICD
GEOFFREY A COUSINS
Mr Cousins has been a non-executive Director since
November 2006. He is a member of the Nomination and
Remuneration Committees and was last re-elected in 2012.
Mr Cousins has more than 26 years experience as
a company director. Mr Cousins was previously the
Chairman of George Patterson Australia and is a
former Director of Publishing and Broadcasting
Limited, the Seven Network, Hoyts Cinemas group
and NM Rothschild & Sons Limited. He was the first
Chief Executive of Optus Vision and before that held
a number of executive positions at George Patterson,
including Chief Executive of George Patterson Australia.
Mr Cousins was previously a consultant to the Prime
Minister. He was also Chairman of Cure Cancer Australia
and has served on the boards of the Insurance Australia
Group Ltd, Globe International Limited and a number of
cultural institutions and not for profit foundations.
Other directorships/appointments
Chairman of the St James Ethics Foundation (from 2010).
RUSSELL A HIGGINS AO
BEc, FAICD
Mr Higgins has been a non-executive Director
since September 2009. He is a member of the Audit
Committee and was last re-elected in 2012.
Mr Higgins is an experienced company director who
has worked at very senior levels of both government
and private sectors. He has served on the boards of a
wide range of listed companies, private companies,
government business enterprises and international
organisations, including as Chairman of the Snowy
Mountains Hydro Electric Scheme and the Global
Carbon Capture and Storage Institute. From 2003 to
2004, he was Chairman of the then Prime Minister’s
Energy Task Force and prior to that he was Secretary of
the Department of Industry, Science and Resources.
Other listed companies - past three years
Director, APA Group (from 2004), Argo Investments
Limited (from 2011), Leighton Holdings Limited (from
2013) and Ricegrowers Limited (SunRice) (2005 - 2012).
Other directorships/appointments
Director, St. James Ethics Foundation (from 2010).
BOARD OFDIRECTORS
30 Telstra Annual Report 2013

NORA L SCHEINKESTEL
LLB(Hons), PhD, FAICD
Dr Scheinkestel was appointed as a non-executive
Director in August 2010 and elected in October 2010.
She is Chairman of the Audit Committee.
Dr Scheinkestel is an experienced company director with a
background as a senior banking executive in international
and project financing. She currently consults to
government, corporate and institutional clients in areas
such as corporate governance, strategy and finance. She
is also an Associate Professor at the Melbourne Business
School at Melbourne University and is a member of the
Takeovers Panel. Dr Scheinkestel held a number of roles in
the utility sector including Chairman of South East Water
Limited from 2002 to 2005 and the Energy 21 and Stratus
Gas Group from 1997 to 1999. She has also served on a
range of public and private sector boards including, more
recently, AMP Limited and its funds management and
banking subsidiaries, Mayne Group Limited and Mayne
Pharma Limited, Medical Benefits Fund of Australia Ltd,
Newcrest Mining Limited and North Limited. In 2003, Dr
Scheinkestel was awarded a centenary medal for services
to Australian society in business leadership.
Other listed companies - past three years
Director, Insurance Australia Group Limited (from 2013),
Orica Limited (from 2006), Pacific Brands Limited (2009 -
2013) and AMP Limited (2003 - 2013).
MARGARET L SEALE
BA, FAICD
Ms Seale was appointed as a non-executive Director in
May 2012 and subsequently elected in October 2012.
She is a member of the Audit Committee.
Ms Seale has over 20 years experience in senior
executive roles in Australia and overseas, including
in global publishing and the transition of traditional
business models to adapt and thrive in a digital
environment as well as sales and marketing. Most
recently she was the Managing Director of Random
House, Australia (with managerial responsibility for
Random House New Zealand) and President, Asia
Development for Random House Inc, the global company.
Previously, she was Chief Executive Officer for The
Macquarie Dictionary and Lansdowne Publishing from
1997 to 1999. Ms Seale was the Chief Executive Officer
for the Juvenile Diabetes Research Foundation from
1994 to 1997. She also served on the boards of the
Australian Publishers Association and the Powerhouse
Museum, and on the Council of Chief Executive Women,
chairing its Scholarship Committee from 2011 to 2012.
Other directorships/appointments
Director, Random House Australia, New Zealand
(from 2001) and Sydney Writers Festival (from 2011).
STEVEN M VAMOS
BEng (Hons)
Mr Vamos joined the Telstra Board as a non-
executive Director in September 2009 and was last
re-elected in 2012. He is a member of the Nomination
and Remuneration Committees and served on the
Technology Committee#.
Mr Vamos has over 30 years experience in the
information technology, internet and online industry.
He led Microsoft Australia and New Zealand from
2003 to January 2007 before moving to the United
States to become the company’s online business head
of worldwide Sales and International Operations.
Previously, he was Chief Executive Officer of ninemsn.
Mr Vamos also worked for Apple Computer in the 1990s
after spending 14 years in senior management roles
at IBM Australia. He is the founding President of the
Society for Knowledge Economics (SKE), a not-for-
profit think tank that encourages new and better
practices in leadership and management.
Other listed companies - past three years
Director, David Jones (from 2012).
Other directorships/appointments
President, Society for Knowledge Economics (from
2005); Director, Medibank Private Limited (from
2011), BDB Soti Pty Ltd (from 2012) and eGeneration
Investments Pty Limited (from 1999).
JOHN D ZEGLIS
BSc Finance, JD Law
Mr Zeglis has been a non-executive Director since May
2006. He served as Chairman of the Technology Committee
from 2009 to 2013# and was last re-elected in 2012.
Mr Zeglis has had a long and distinguished career in
the US telecommunications sector. He joined AT&T in
1984, and was elected as President of AT&T in 1998
and Chairman and Chief Executive Officer of the AT&T
Wireless Group in 1999. He continued as CEO of AT&T
Wireless until retiring in November 2004 following the
company’s sale to Cingular Wireless. He has also served
on the boards of Georgia Pacific Corporation, Illinois
Power Company and Sara Lee Corporation.
Mr Zeglis has a legal background, and became
partner with the law firm Sidley & Austin in 1978.
He was General Counsel of AT&T from 1986 to 1998.
His qualifications include a BSc in Finance from the
University of Illinois, and a JD in Law from Harvard.
Other listed companies - past three years
Director, Helmerich & Payne Corporation (from 1989).
Other directorships/appointments
Director, The Duchossois Group (including AMX) (from
2011) and State Farm Automobile Insurance (from 2004).
# The Technology Committee ceased operation effective 14 June 2013.
31Telstra Annual Report 2013
BOARD OF DIRECTORS

SENIOR MANAGEMENT TEAM
DAVID I THODEY
CHIEF EXECUTIVE OFFICER
AND EXECUTIVE DIRECTOR
GORDON BALLANTYNE
CHIEF CUSTOMER OFFICER,
TELSTRA CUSTOMER SALES & SERVICE
Telstra Customer Sales & Service is
responsible for providing sales and
service to all of Telstra’s customer
segments (Consumer, Business, and
Enterprise and Government) through a
range of channels, including call centres,
Telstra Shops and Dealers, Business
Centres, account managers and online
through telstra.com.
TIMOTHY CHEN
PRESIDENT AND GROUP MANAGING
DIRECTOR, TELSTRA INTERNATIONAL GROUP
Telstra International Group is responsible
for Telstra’s international assets and
connectivity, including Hong Kong’s
leading mobile operator CSL, Telstra
Global’s networks and managed services
business and Telstra’s China-based
search and advertising businesses.
RICK ELLIS
GROUP MANAGING DIRECTOR,
TELSTRA MEDIA GROUP
The Telstra Media Group is responsible for
Telstra’s end-to-end media capabilities,
including Sensis, BigPond, Trading Post,
IPTV, Foxtel and content agreements.
TRACEY GAVEGAN
GROUP MANAGING DIRECTOR,
HUMAN RESOURCES
Human Resources is responsible for
organisational design and change;
implementation of people and culture
initiatives; leadership development,
talent and succession management;
health, safety and wellbeing; workplace
relations and all employment and
remuneration policies.
STUART LEE
GROUP MANAGING DIRECTOR,
TELSTRA WHOLESALE
Telstra Wholesale is responsible
for the provision of a wide range of
telecommunication products and
services delivered over Telstra networks
and associated support systems to non-
Telstra branded carriers, carriage service
providers and internet service providers
as well as NBN Co Limited.
KATE MCKENZIE
GROUP MANAGING DIRECTOR,
TELSTRA INNOVATION, PRODUCTS
AND MARKETING
Telstra Innovation, Products and
Marketing is responsible for innovation,
product and pricing across Telstra, as
well as the Telstra brand, sponsorship,
promotion and advertising direction.
CARMEL MULHERN
GROUP GENERAL COUNSEL,
TELSTRA LEGAL SERVICES
Telstra Legal Services provides
operational and strategic legal support
and advice across the company.
ROBERT NASON
GROUP MANAGING DIRECTOR,
BUSINESS SUPPORT AND IMPROVEMENT
Business Support and Improvement
is responsible for credit management,
billing and procurement, as well as
driving change that improves the
customer experience and delivering
Telstra-wide productivity improvements.
ANDREW PENN
CHIEF FINANCIAL OFFICER,
FINANCE AND STRATEGY
Finance and Strategy is responsible
for corporate planning and strategy,
accounting and administration, treasury,
risk management and assurance,
corporate security, investor relations and
mergers and acquisitions.
BRENDON RILEY
CHIEF OPERATIONS OFFICER,
TELSTRA OPERATIONS
Telstra Operations is responsible for the
overall planning, design, engineering,
construction, maintenance and
restoration of Telstra’s fixed and mobile
networks, technology and information
technology.
TONY WARREN
GROUP MANAGING DIRECTOR,
CORPORATE AFFAIRS
Corporate Affairs is responsible
for Telstra’s internal and external
communications, government relations,
regulatory affairs and sustainability
(including the Telstra Foundation).
32 Telstra Annual Report 2013
CORPORATE GOVERNANCE STATEMENT
CORPORATE GOVERNANCE STATEMENT
Telstra Corporation Limited and controlled entities Telstra Annual Report 2013 33
We are committed to excellence in corporate governance,
transparency and accountability. This is essential for the long
term performance and sustainability of our Company, and to
protect and enhance the interests of our shareholders and other
stakeholders. We regularly review our governance arrangements
as well as developments in market practice, expectations and
regulation.
Throughout FY13, we have complied with the ASX Corporate
Governance Council’s Corporate Governance Principles and
Recommendations (‘ASX Recommendations’). A checklist cross-
referencing the ASX Recommendations to the relevant disclosures
in this section or other parts of our Annual Report is provided in the
corporate governance section of our website at
www.telstra.com.au/abouttelstra/company-overview/
governance/. Supplementary detail on our governance
arrangements, including copies of the Board and Board
Committee Charters and key policies, can also be found in the
corporate governance section of our website.
THE BOARD OF DIRECTORS
The Board
The Board is responsible, and is accountable to shareholders, for
managing Telstra’s business. In addition to the matters required
by law to be approved by the Board, the key responsibilities of the
Board include:
• approving our strategy and corporate plan and monitoring the
implementation of our strategy and performance against the
corporate plan
• appointing, assessing the performance of and determining the
remuneration of the CEO, as well as approving the appointment
and remuneration of and overseeing the performance of the
CEO’s Leadership Team
• overseeing our financial position and approving decisions
concerning our capital management policy, including share buy
backs, dividend policy and the payment of dividends
• overseeing our external and internal audit activities, internal
control framework and reporting systems and strategic and
operational risk management systems
• monitoring and influencing our culture, reputation, ethical
standards and legal and regulatory compliance, and
overseeing our corporate governance framework
• monitoring our work health and safety performance
• approving our overall remuneration framework, and
• approving certain matters relating to diversity.
The Board has adopted a Board Charter that details its role and
responsibilities (a copy of which can be found in the corporate
governance section of our website).
The CEO, together with the senior management team, is
responsible to the Board for the development and implementation
of our strategy and overall management and performance of our
Company. The Board has delegated responsibility for day-to-day
management of Telstra to the CEO and there is a formal
delegations structure in place which sets out the powers
delegated to the CEO and those specifically retained by the Board.
This is complemented by a formal delegations structure from the
CEO to our employees.
Our Chairman
The role of our Chairman and CEO cannot be fulfilled by the same
person and our Chairman must be an independent Director
appointed by the Board. Our Chairman, Catherine Livingstone, is
an independent non-executive Director. She has been a Director of
Telstra since 2000 and was elected Chairman in 2009. The
Chairman’s overarching responsibilities are to provide
appropriate leadership to the Board and Telstra and to ensure the
Board fulfils its obligations under its Charter. The Chairman’s
responsibilities are set out in more detail in the Board Charter.
Board Composition and Director Appointment
There are currently nine Directors on the Board, comprising eight
non-executive Directors and the CEO. Details of the Directors,
including their qualifications and experience, together with
details of the year of initial appointment and re-election (where
applicable), can be found in the Board of Directors section of this
Annual Report. John Stocker retired as a non-executive Director
at the conclusion of our 2012 Annual General Meeting (held on 16
October 2012). Tim Chen retired as a non-executive Director with
effect from 5 October 2012. There were no new Directors
appointed to the Board during FY13.
The Board actively seeks to ensure that it has an appropriate mix
of diversity (including gender diversity), skills, experience and
expertise to enable it to effectively discharge its responsibilities
and to be well equipped to help our Company navigate the range of
challenges we face.
CORPORATE GOVERNANCE STATEMENT
34 Telstra Annual Report 2013 Telstra Corporation Limited and controlled entities
Matters relating to Board (and Board Committee) composition are
considered by the Board and Nomination Committee in
accordance with the framework set out in the Nomination
Committee Charter and through processes implemented by the
Board. To assist in identifying areas of focus and maintaining an
appropriate experience mix, the Board developed a skills matrix
which is reviewed by the Board on a regular basis. It is an
important, but not the only, basis of criteria applying to director
appointments.
The skills, experience and expertise areas which the Board
currently considers to be particularly relevant include those in
telecommunications, information technology, multimedia,
marketing, retail and sales, infrastructure, government relations,
Australian and international business, finance and legal.
Information regarding Board diversity can be found in the
“Diversity and Inclusion at Telstra” section below.
Our process for the selection, nomination and appointment of
Directors involves a formal selection process undertaken by the
Board, and an executive search firm is generally engaged to assist
in the process. As part of this process, the Board establishes
criteria regarding the general qualifications and experience, as
well as the specific qualifications, a candidate should possess.
Formal letters are provided to all new Directors setting out the key
terms and conditions of their appointment. Any new Director
appointed by the Board during the year is required to stand for
election at the next Annual General Meeting (AGM).
Director Induction Training and Continuing Education
All new Directors participate in a formal induction process co-
ordinated by the Company Secretary. This induction process
includes briefings on our financial, strategic, operational and risk
management policies and processes, our governance framework
(including key policies), culture and values and key developments
in our Company and the sectors and environments in which we
operate.
We also have in place a continuing education program for
Directors which is part of the annual Board cycle, with specific
sessions scheduled around Board meeting dates.
Board Tenure
In accordance with the ASX Listing Rules, we hold an election of
Directors at our AGM each year. The Directors stand for re-election
in accordance with the process set out in our Constitution, which
provides that no non-executive Director may hold office for more
than three years, or beyond the third AGM following their
appointment, whichever is the later, without re-election. If no
Director would otherwise be required by our Constitution to
submit for election or re-election then, in accordance with the
procedure in our Constitution, any non-executive Director who
wishes to retire and offer himself or herself for re-election may
stand, otherwise the non-executive Director who has been longest
in office since their last election or appointment is required to
retire and stand for re-election. The tenure of the CEO as a Director
is linked to his or her executive office and therefore the CEO is not
required to stand for re-election through this process.
A recommendation to re-elect a Director at the end of his/her term
is not automatic. Prior to each AGM, the Board determines if it will
recommend to shareholders that they vote in favour of the re-
election of the Directors standing for re-election. This decision is
made by the Board, having regard to the outcome of the annual
Board performance review and any other matters it considers
relevant.
In recognition of the importance of Board renewal and succession
planning, the Board has adopted the following principles in
relation to Board and Board Committee tenure:
• Director Positions - where a non-executive Director is
approaching the end of his/her third 3-year term, a more formal
review of his or her continuing directorship should take place,
taking into account broader Board renewal and Board
composition considerations and the requirements of the
Telstra Corporation Act
• Board Committee Chair Positions - the maximum term for a
non-executive Director to hold the position of Chairman of a
Board Committee is generally 5 years, and
• Board Committee Membership - Committee membership
should rotate every 3-5 years, subject to considerations of
Committee succession planning and the overall composition/
skills/experience of the Committee.
Director Independence
The Board recognises the important contribution independent
Directors make to good corporate governance. All Directors,
whether independent or not, are required to act in the best
interests of Telstra and to exercise unfettered and independent
judgment. The Board intends that the CEO be the only executive
Director and that all non-executive Directors should also be
independent Directors.
The Board assesses, at least annually, the independence of each
Director. We consider that an independent Director is a non-
executive Director who is free of any business or other relationship
that could materially interfere with or could reasonably be
perceived to materially interfere with the exercise of his or her
unfettered and independent judgement and ability to act in
Telstra’s best interests. Materiality is assessed on a case-by-case
basis from the perspective of both Telstra and the relevant
Director, and consideration is given to both qualitative and
quantitative factors.
When assessing the independence of a Director, the Board
considers the relationships potentially affecting the independent
status of a director as described in Box 2.1 of the ASX
Recommendations. The Board may determine that a Director is
independent notwithstanding the existence of a relationship of
the kind referred to above. However, in such a case, the Board will
disclose the reasons for making its determination.
If at any time during the year a Director ceases or may have ceased
to be independent, he/she is required to advise the Chairman
immediately. Where the Board determines a Director is no longer
independent, we will make an announcement to the market.
CORPORATE GOVERNANCE STATEMENT
Telstra Corporation Limited and controlled entities Telstra Annual Report 2013 35
With the exception of the CEO, all Directors are non-executive
Directors and have been determined by the Board to be
independent. During FY13, no non-executive Director had any
relationship that could materially interfere with, or be perceived to
materially interfere with, his or her unfettered and independent
judgement and ability to act in Telstra’s best interests.
Conflicts of Interests
In accordance with the requirements of the Corporations Act and
our Constitution, Directors must declare any conflict of interest
they may have, and follow the procedures set out in our Directors’
Interests Policy including, in certain circumstances, to abstain
from participating in any discussion or voting on matters in which
they have a material personal interest.
Review of Board and Director Performance
The Board reviews its performance annually (including its
performance against the requirements of its Charter), the
performance of individual Committees and the performance of
individual Directors, including the performance of the Chairman
as Chairman of the Board.
These performance reviews are conducted both internally and, on
a periodic basis, externally with the assistance of a facilitator. In
line with this approach and on the basis that the FY12 review was
undertaken with the assistance of an external facilitator, the FY13
review of Board, Committee and Director performance was
conducted internally, led by the Chairman. The process
comprised:
(a) a whole of Board discussion in relation to what currently
works well and areas for improvement
(b) one-on-one review meetings between our Chairman and each
Director, and
(c) a review of the Chairman’s performance which was facilitated
by the Chairman of the Audit Committee.
The review included consideration of matters relating to strategic
settings, the Board’s agenda, papers and presentations, Board
meeting processes and protocols and the relationship with
management.
A review was also undertaken by each Board Committee in respect
of its performance during FY13.
The findings and recommendations of the reviews were provided
to the Board.
The Board annually reviews the performance of the CEO against
agreed performance measures and other relevant factors. The
CEO undertakes a similar exercise in relation to the senior
executives. The results of the CEO’s annual performance and
review of the senior executives are then approved by the Board.
Details regarding performance evaluations for the CEO and senior
executives are set out in our Remuneration Report (which forms
part of our Directors’ Report).
Board Access to Management and Independent
Professional Advice
Directors have complete access to our senior management
through the Chairman, CEO or Company Secretary at any time. In
addition to regular presentations by senior management at Board
meetings, Directors may seek briefings from senior management
on specific matters.
The Board has the authority to conduct or direct any investigation
required to fulfil its responsibilities and has the ability to retain, at
Telstra’s expense, such legal, accounting or other advisers,
consultants or experts as it considers necessary from time to time
in the performance of its duties. All Committees of the Board have
access to independent professional advice on this basis. In certain
circumstances, each Director has the right to seek independent
professional advice at Telstra’s expense within specified limits.
Company Secretary
The Company Secretary reports directly to the Board through the
Chairman, and all Directors have access to the Company
Secretary. The Board is supported in governance and
administration by the Company Secretary whose responsibilities
include coordinating all Board business (including meetings,
agendas, board papers and minutes, and monitoring the
completion of actions arising from Board meetings), retaining
independent professional advisors at the request of the Board,
Board Committee or as permitted under the Board Charter, and
attending to certain statutory requirements relating to Telstra.
BOARD COMMITTEES
As at August 2013, the following three standing Committees assist
the Board in carrying out its responsibilities:
• Audit Committee
• Nomination Committee, and
• Remuneration Committee.
Each Committee operates in accordance with a written Charter
approved by the Board, copies of which can be found in the
corporate governance section of our website. The role, Charter,
performance and membership of each Committee are reviewed
each year.
Only independent, non-executive Directors can serve on Board
Committees. The Board appoints the members and the Chairman
of each Committee. In addition to the membership requirements
applying to each Committee as set out in its Charter, each
Committee member must have the capacity to devote the required
time and attention to prepare for, and attend, Committee
meetings. Following each Committee meeting, the Board receives
a report from that Committee on its deliberations, conclusions
and recommendations.
An overview of the roles and responsibilities, composition, and
membership as at 30 June 2013, of our three standing
Committees is provided overleaf.
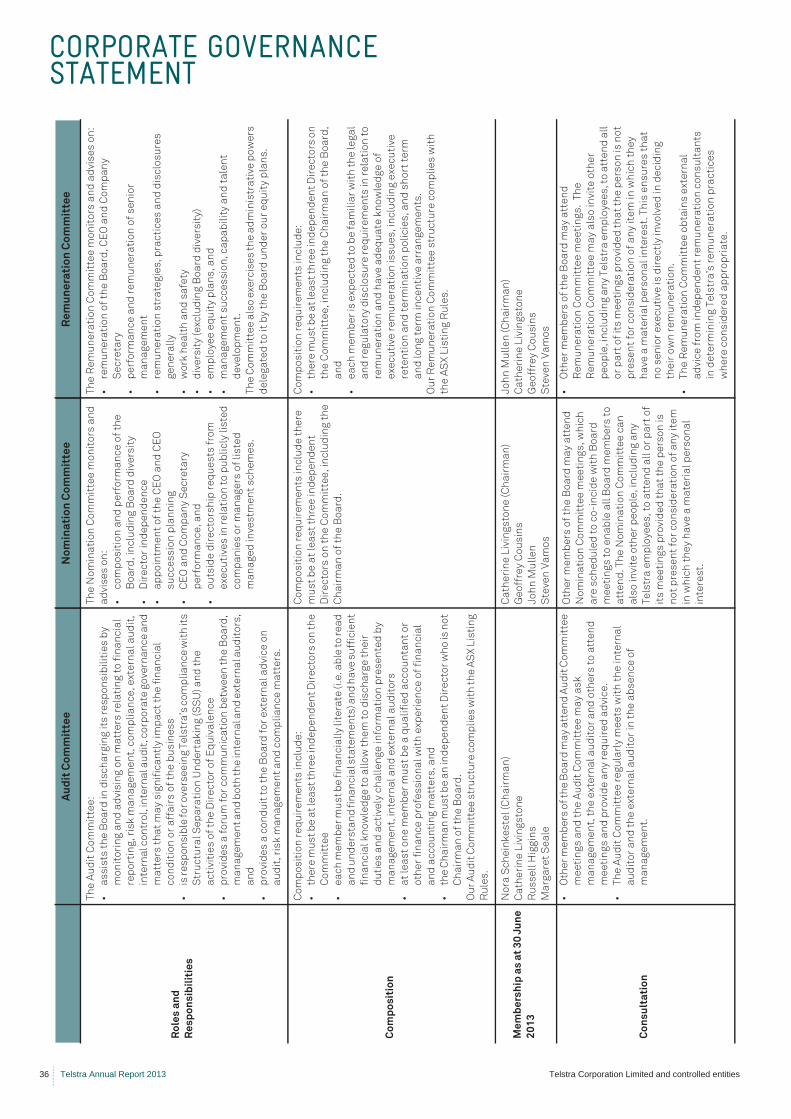
CORPORATE GOVERNANCE STATEMENT
36 Telstra Annual Report 2013 Telstra Corporation Limited and controlled entities
Au
dit
Co
mm
itte
eN
om
ina
tio
n C
om
mit
tee
Re
mu
ne
rati
on
Co
mm
itte
e
Ro
les
an
d
Re
sp
on
sib
ilit
ies
Th
e A
ud
it C
om
mit
tee
:
•a
ss
ists
th
e B
oa
rd i
n d
isc
ha
rgin
g i
ts r
es
po
ns
ibil
itie
s b
y
mo
nit
ori
ng
an
d a
dvi
sin
g o
n m
att
ers
re
lati
ng
to
fin
an
cia
l
rep
ort
ing
, ri
sk
ma
na
ge
me
nt,
co
mp
lia
nc
e,
ext
ern
al
au
dit
,
inte
rna
l co
ntr
ol,
inte
rna
l au
dit
, co
rpo
rate
go
vern
an
ce
an
d
ma
tte
rs t
ha
t m
ay
sig
nif
ica
ntl
y i
mp
ac
t th
e f
ina
nc
ial
co
nd
itio
n o
r a
ffa
irs
of
the
bu
sin
es
s
•is
re
sp
on
sib
le f
or
ove
rse
ein
g T
els
tra
’s c
om
pli
an
ce
wit
h it
s
Str
uc
tura
l S
ep
ara
tio
n U
nd
ert
ak
ing
(S
SU
) a
nd
th
e
ac
tivi
tie
s o
f th
e D
ire
cto
r o
f E
qu
iva
len
ce
•p
rovi
de
s a
fo
rum
fo
r c
om
mu
nic
ati
on
be
twe
en
th
e B
oa
rd,
ma
na
ge
me
nt
an
d b
oth
th
e in
tern
al a
nd
ext
ern
al a
ud
ito
rs,
an
d
•p
rovi
de
s a
co
nd
uit
to
th
e B
oa
rd f
or
ext
ern
al
ad
vic
e o
n
au
dit
, ri
sk
ma
na
ge
me
nt
an
d c
om
pli
an
ce
ma
tte
rs.
Th
e N
om
ina
tio
n C
om
mit
tee
mo
nit
ors
an
d
ad
vis
es
on
:
•c
om
po
sit
ion
an
d p
erf
orm
an
ce
of
the
Bo
ard
, in
clu
din
g B
oa
rd d
ive
rsit
y
•D
ire
cto
r in
de
pe
nd
en
ce
•a
pp
oin
tme
nt
of
the
CE
O a
nd
CE
O
su
cc
es
sio
n p
lan
nin
g
•C
EO
an
d C
om
pa
ny
Se
cre
tary
pe
rfo
rma
nc
e,
an
d
•o
uts
ide
dir
ec
tors
hip
re
qu
es
ts f
rom
exe
cu
tive
s i
n r
ela
tio
n t
o p
ub
lic
ly l
iste
d
co
mp
an
ies
or
ma
na
ge
rs o
f li
ste
d
ma
na
ge
d i
nve
stm
en
t s
ch
em
es
.
Th
e R
em
un
era
tio
n C
om
mit
tee
mo
nit
ors
an
d a
dvi
se
s o
n:
•re
mu
ne
rati
on
of
the
Bo
ard
, C
EO
an
d C
om
pa
ny
Se
cre
tary
•p
erf
orm
an
ce
an
d r
em
un
era
tio
n o
f s
en
ior
ma
na
ge
me
nt
•re
mu
ne
rati
on
str
ate
gie
s,
pra
cti
ce
s a
nd
dis
clo
su
res
ge
ne
rall
y
•w
ork
he
alt
h a
nd
sa
fety
•d
ive
rsit
y (
exc
lud
ing
Bo
ard
div
ers
ity
)
•e
mp
loy
ee
eq
uit
y p
lan
s,
an
d
•m
an
ag
em
en
t s
uc
ce
ss
ion
, c
ap
ab
ilit
y a
nd
ta
len
t
de
velo
pm
en
t.
Th
e C
om
mit
tee
als
o e
xerc
ise
s t
he
ad
min
istr
ati
ve p
ow
ers
de
leg
ate
d t
o i
t b
y t
he
Bo
ard
un
de
r o
ur
eq
uit
y p
lan
s.
Co
mp
os
itio
n
Co
mp
os
itio
n r
eq
uir
em
en
ts i
nc
lud
e:
•th
ere
mu
st
be
at
lea
st
thre
e in
de
pe
nd
en
t D
ire
cto
rs o
n t
he
Co
mm
itte
e
•e
ac
h m
em
be
r m
us
t b
e f
ina
nc
iall
y li
tera
te (i
.e. a
ble
to
re
ad
an
d u
nd
ers
tan
d f
ina
nc
ial s
tate
me
nts
) an
d h
ave
su
ffic
ien
t
fin
an
cia
l k
no
wle
dg
e t
o a
llo
w t
he
m t
o d
isc
ha
rge
th
eir
du
tie
s a
nd
ac
tive
ly c
ha
lle
ng
e i
nfo
rma
tio
n p
res
en
ted
by
ma
na
ge
me
nt,
in
tern
al
an
d e
xte
rna
l a
ud
ito
rs
•a
t le
as
t o
ne
me
mb
er
mu
st
be
a q
ua
lifi
ed
ac
co
un
tan
t o
r
oth
er
fin
an
ce
pro
fes
sio
na
l w
ith
exp
eri
en
ce
of
fin
an
cia
l
an
d a
cc
ou
nti
ng
ma
tte
rs,
an
d
•th
e C
ha
irm
an
mu
st
be
an
ind
ep
en
de
nt
Dir
ec
tor
wh
o is
no
t
Ch
air
ma
n o
f th
e B
oa
rd.
Ou
r A
ud
it C
om
mit
tee
str
uc
ture
co
mp
lie
s w
ith
th
e A
SX
Lis
tin
g
Ru
les
.
Co
mp
os
itio
n r
eq
uir
em
en
ts i
nc
lud
e t
he
re
mu
st
be
at
lea
st
thre
e i
nd
ep
en
de
nt
Dir
ec
tors
on
th
e C
om
mit
tee
, in
clu
din
g t
he
Ch
air
ma
n o
f th
e B
oa
rd.
Co
mp
os
itio
n r
eq
uir
em
en
ts i
nc
lud
e:
•th
ere
mu
st
be
at
lea
st
thre
e in
de
pe
nd
en
t D
ire
cto
rs o
n
the
Co
mm
itte
e,
inc
lud
ing
th
e C
ha
irm
an
of
the
Bo
ard
,
an
d
•e
ac
h m
em
be
r is
exp
ec
ted
to
be
fa
mil
iar
wit
h t
he
leg
al
an
d r
eg
ula
tory
dis
clo
su
re r
eq
uir
em
en
ts in
re
lati
on
to
rem
un
era
tio
n a
nd
ha
ve a
de
qu
ate
kn
ow
led
ge
of
exe
cu
tive
re
mu
ne
rati
on
is
su
es
, in
clu
din
g e
xec
uti
ve
rete
nti
on
an
d t
erm
ina
tio
n p
oli
cie
s,
an
d s
ho
rt t
erm
an
d l
on
g t
erm
in
ce
nti
ve a
rra
ng
em
en
ts.
Ou
r R
em
un
era
tio
n C
om
mit
tee
str
uc
ture
co
mp
lie
s w
ith
the
AS
X L
isti
ng
Ru
les
.
Me
mb
ers
hip
as
at
30
Ju
ne
20
13
No
ra S
ch
ein
ke
ste
l (C
ha
irm
an
)
Ca
the
rin
e L
ivin
gs
ton
e
Ru
ss
ell
Hig
gin
s
Ma
rga
ret
Se
ale
Ca
the
rin
e L
ivin
gs
ton
e (
Ch
air
ma
n)
Ge
off
rey
Co
us
ins
Jo
hn
Mu
lle
n
Ste
ven
Va
mo
s
Jo
hn
Mu
lle
n (
Ch
air
ma
n)
Ca
the
rin
e L
ivin
gs
ton
e
Ge
off
rey
Co
us
ins
Ste
ven
Va
mo
s
Co
ns
ult
ati
on
•O
the
r m
em
be
rs o
f th
e B
oa
rd m
ay
att
en
d A
ud
it C
om
mit
tee
me
eti
ng
s a
nd
th
e A
ud
it C
om
mit
tee
ma
y a
sk
ma
na
ge
me
nt,
th
e e
xte
rna
l a
ud
ito
r a
nd
oth
ers
to
att
en
d
me
eti
ng
s a
nd
pro
vid
e a
ny
re
qu
ire
d a
dvi
ce
.
•T
he
Au
dit
Co
mm
itte
e r
eg
ula
rly
me
ets
wit
h t
he
in
tern
al
au
dit
or
an
d t
he
ext
ern
al
au
dit
or
in t
he
ab
se
nc
e o
f
ma
na
ge
me
nt.
Oth
er
me
mb
ers
of
the
Bo
ard
ma
y a
tte
nd
No
min
ati
on
Co
mm
itte
e m
ee
tin
gs
, w
hic
h
are
sc
he
du
led
to
co
-in
cid
e w
ith
Bo
ard
me
eti
ng
s t
o e
na
ble
all
Bo
ard
me
mb
ers
to
att
en
d.
Th
e N
om
ina
tio
n C
om
mit
tee
ca
n
als
o i
nvi
te o
the
r p
eo
ple
, in
clu
din
g a
ny
Te
lstr
a e
mp
loy
ee
s,
to a
tte
nd
all
or
pa
rt o
f
its
me
eti
ng
s p
rovi
de
d t
ha
t th
e p
ers
on
is
no
t p
res
en
t fo
r c
on
sid
era
tio
n o
f a
ny
ite
m
in w
hic
h t
he
y h
ave
a m
ate
ria
l p
ers
on
al
inte
res
t.
•O
the
r m
em
be
rs o
f th
e B
oa
rd m
ay
att
en
d
Re
mu
ne
rati
on
Co
mm
itte
e m
ee
tin
gs
. T
he
Re
mu
ne
rati
on
Co
mm
itte
e m
ay
als
o i
nvi
te o
the
r
pe
op
le, i
nc
lud
ing
an
y T
els
tra
em
plo
ye
es
, to
att
en
d a
ll
or
pa
rt o
f it
s m
ee
tin
gs
pro
vid
ed
th
at
the
pe
rso
n is
no
t
pre
se
nt
for
co
ns
ide
rati
on
of
an
y i
tem
in
wh
ich
th
ey
ha
ve a
ma
teri
al
pe
rso
na
l in
tere
st.
Th
is e
ns
ure
s t
ha
t
no
se
nio
r e
xec
uti
ve i
s d
ire
ctl
y i
nvo
lve
d i
n d
ec
idin
g
the
ir o
wn
re
mu
ne
rati
on
.
•T
he
Re
mu
ne
rati
on
Co
mm
itte
e o
bta
ins
ext
ern
al
ad
vic
e f
rom
in
de
pe
nd
en
t re
mu
ne
rati
on
co
ns
ult
an
ts
in d
ete
rmin
ing
Te
lstr
a’s
re
mu
ne
rati
on
pra
cti
ce
s
wh
ere
co
ns
ide
red
ap
pro
pri
ate
.
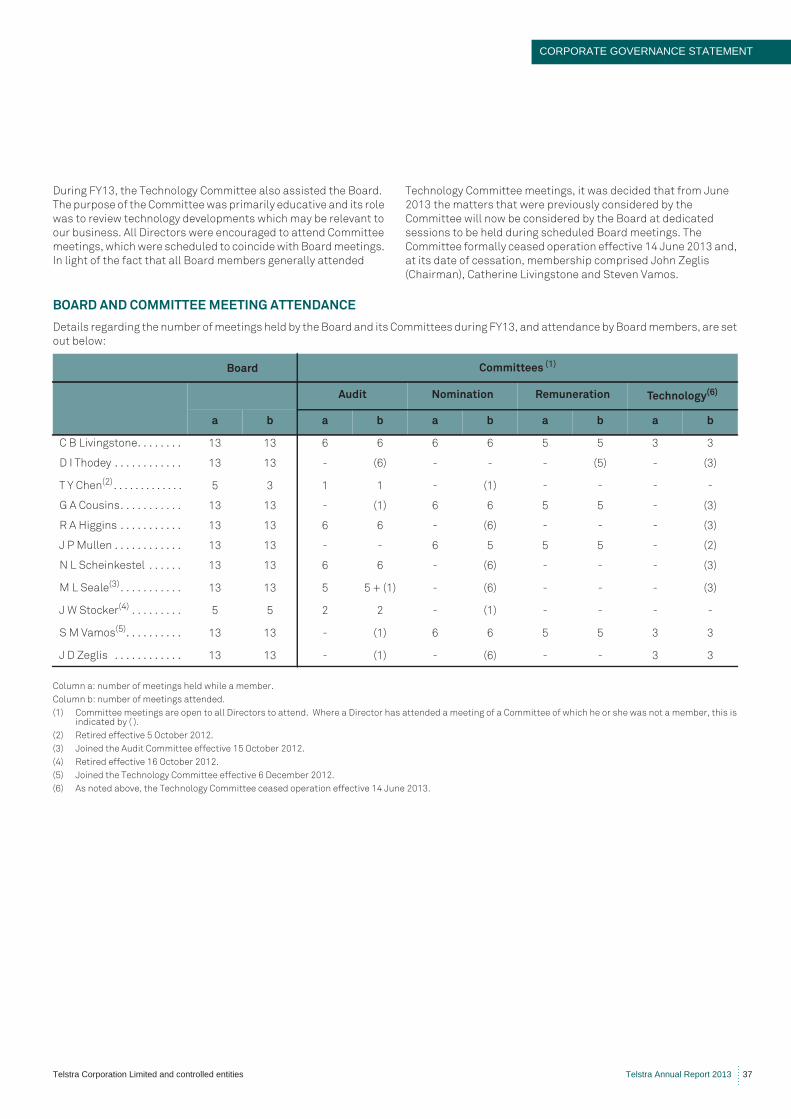
CORPORATE GOVERNANCE STATEMENT
Telstra Corporation Limited and controlled entities Telstra Annual Report 2013 37
During FY13, the Technology Committee also assisted the Board.
The purpose of the Committee was primarily educative and its role
was to review technology developments which may be relevant to
our business. All Directors were encouraged to attend Committee
meetings, which were scheduled to coincide with Board meetings.
In light of the fact that all Board members generally attended
Technology Committee meetings, it was decided that from June
2013 the matters that were previously considered by the
Committee will now be considered by the Board at dedicated
sessions to be held during scheduled Board meetings. The
Committee formally ceased operation effective 14 June 2013 and,
at its date of cessation, membership comprised John Zeglis
(Chairman), Catherine Livingstone and Steven Vamos.
BOARD AND COMMITTEE MEETING ATTENDANCE
Details regarding the number of meetings held by the Board and its Committees during FY13, and attendance by Board members, are set
out below:
Column a: number of meetings held while a member.
Column b: number of meetings attended.
(1) Committee meetings are open to all Directors to attend. Where a Director has attended a meeting of a Committee of which he or she was not a member, this is indicated by ( ).
(2) Retired effective 5 October 2012.
(3) Joined the Audit Committee effective 15 October 2012.
(4) Retired effective 16 October 2012.
(5) Joined the Technology Committee effective 6 December 2012.
(6) As noted above, the Technology Committee ceased operation effective 14 June 2013.
Board Committees (1)
Audit Nomination Remuneration Technology(6)
a b a b a b a b a b
C B Livingstone. . . . . . . . 13 13 6 6 6 6 5 5 3 3
D I Thodey . . . . . . . . . . . . 13 13 - (6) - - - (5) - (3)
T Y Chen(2) . . . . . . . . . . . . . 5 3 1 1 - (1) - - - -
G A Cousins. . . . . . . . . . . 13 13 - (1) 6 6 5 5 - (3)
R A Higgins . . . . . . . . . . . 13 13 6 6 - (6) - - - (3)
J P Mullen . . . . . . . . . . . . 13 13 - - 6 5 5 5 - (2)
N L Scheinkestel . . . . . . 13 13 6 6 - (6) - - - (3)
M L Seale(3). . . . . . . . . . . 13 13 5 5 + (1) - (6) - - - (3)
J W Stocker(4) . . . . . . . . . 5 5 2 2 - (1) - - - -
S M Vamos(5). . . . . . . . . . 13 13 - (1) 6 6 5 5 3 3
J D Zeglis . . . . . . . . . . . . 13 13 - (1) - (6) - - 3 3
CORPORATE GOVERNANCE STATEMENT
38 Telstra Annual Report 2013 Telstra Corporation Limited and controlled entities
EXTERNAL AUDITOR
Our external auditor, Ernst & Young (E&Y), was appointed by
shareholders at the 2007 AGM. During FY13, the Board, on the
recommendation of the Audit Committee, extended E&Y’s
appointment as auditor for a further two year period until the end
of FY15.
In accordance with the Corporations Act 2001, the lead E&Y
partner on the audit is required to rotate at the completion of a five
year term. A rotation occurred after our FY11 half year accounts
were signed as the lead partner retired from E&Y. The Board
undertook a process with E&Y and agreed upon the new lead
partner.
The Audit Committee oversees our relationship with E&Y,
including:
• reviewing and assessing the performance, independence and
objectivity of E&Y
• monitoring management’s adherence to our policy on audit and
non-audit services provided by E&Y
• reviewing and agreeing on the terms of engagement and fees
for E&Y, and
• reviewing E&Y’s proposed annual audit scope and audit
approach, including materiality levels.
During FY13, the Audit Committee was provided with regular
formal, written reports detailing the nature and amount of any
non-audit services rendered by E&Y and an explanation of how the
provision of those non-audit services are compatible with auditor
independence. Details of amounts paid or payable to E&Y for non-
audit services provided during the year are disclosed in Note 8 to
our Financial Statements.
The E&Y engagement partner for the Telstra audit attends our
AGM and is available to answer shareholder questions about the
conduct of our audit and the preparation and content of the
auditor’s report.
INTERNAL AUDIT
Our internal audit activities are undertaken by Group Internal
Audit, Telstra’s dedicated internal audit function. The role of
Group Internal Audit is to provide the Board and management with
independent and objective assurance on the effectiveness of our
governance, risk management and internal control
processes. Group Internal Audit has no direct operational
responsibility or authority over any of our business or risk
management activities, to maintain the necessary independence
it needs to carry out its role.
Functional responsibility for Group Internal Audit resides with the
Director Group Internal Audit, whose appointment is approved by
the Board. The Director Group Internal Audit reports to the Audit
Committee and the CFO. Group Internal Audit has full and
unrestricted access to all of our information systems, records,
physical properties and employees in order to carry out its
activities. The work of Group Internal Audit is guided by The
International Professional Practices Framework provided by the
Institute of Internal Auditors. The Audit Committee monitors
Group Internal Audit’s activities and performance, including its
independence.
MANAGEMENT REPORTING ON RISK
A summary of our key strategic risks and how we manage them is
provided in the Strategy and Performance (Managing our risks)
section of this Annual Report.
In connection with our financial statements for the financial year
ended 30 June 2013, our CEO and CFO have provided the Board
with the certifications required by the Corporations Act and the
ASX Recommendations. Specifically, the Board has received:
• reports from management as to the effectiveness of our
management of our material business risks
• the declaration from our CEO and CFO required in accordance
with section 295A of the Corporations Act, and
• assurance from our CEO and CFO that the section 295A
declaration was founded on a sound system of risk
management and internal control and that the system is
operating effectively in all material respects in relation to
financial reporting risks.
PROMOTING RESPONSIBLE AND ETHICAL BEHAVIOUR
Our Telstra Values, Telstra Group Code of Conduct & Business
Principles (Code of Conduct) and company policies provide
guidance on responsible and ethical decision making and
behaviour, and take into account our legal obligations and the
reasonable expectations of our stakeholders.
Our Code of Conduct underpins our Telstra Values. It sets out the
behaviours we expect of our Directors, employees and
contractors, and articulates our commitment to good corporate
governance, responsible business practice, our customers, our
workforce, the communities in which we operate and the
environment. Our company policies give effect to the principles
embodied in our Code of Conduct and there is mandatory training
for all employees on these policies. All persons governed by our
Code of Conduct are responsible for complying with the principles
embodied in our Code of Conduct.
Our governance framework includes polices in the following key
areas:
Health and Safety – which recognises our commitment to the
health, safety and wellbeing of our staff, contractors and
community. The policy highlights the importance of workplace
health and safety and sets out the priority, accountability,
measurement and our commitment to compliance for health and
safety at Telstra.
Diversity – which sets out our strategy and principles in relation to
diversity and provides the framework for the establishment of our
diversity measurable objectives, and monitoring and reporting on
diversity matters across Telstra. We discuss diversity at Telstra,
including our measurable objectives and our progress in achieving
them, in further detail below and in the Sustainability (Our people)
section of this Annual Report.
Discrimination and Bullying – which aims to ensure we have a
workplace free of all forms of unlawful discrimination,
harassment, bullying and victimisation.
CORPORATE GOVERNANCE STATEMENT
Telstra Corporation Limited and controlled entities Telstra Annual Report 2013 39
Privacy - which sets out our commitment to the protection of our
customers’ personal information. Our policy and privacy principles
outline the ways we protect customer personal information, how
and why we collect it, how we may use and disclose it, how we keep
it secure and accurate, as well as how customers may access it.
Further information on Privacy at Telstra is provided in the
Sustainability (Customer experience) section of this Annual
Report and on our website at www.telstra.com.au/privacy/
privacy-at-telstra/index.htm (including copies of Telstra’s Privacy
Policy, Privacy Principles and Privacy Statement).
Telstra's 3Rs of Social Media Engagement (Representation,
Responsibility and Respect) – which provides guidance to
employees and contractors who use social media, either as part of
their job or in a personal capacity, regarding our expectations
when they talk online about us, our products and services, our
people, our competitors and/or other business related individuals
or organisations.
Sustainability – which seeks to ensure we manage our business
ethically to produce an overall positive impact on our customers,
employees, shareholders and other stakeholders, as well as the
wider community and the natural environment. Information
regarding our approach to sustainability can be found in the
Sustainability section of this Annual Report. We make donations
and contribute funds to community and non-profit organisations
as part of our approach to community investment and
sustainability. We do not make political donations. However, in
line with other major publicly listed companies, we do pay fees to
attend events organised by political parties where those events
allow for discussion on major policy issues with key opinion
leaders and policy makers.
Anti Bribery & Anti Corruption – which aims to ensure we comply
with applicable anti-bribery and anti-corruption laws and
regulations. Our Gifts, Prizes and Hospitality Policy also seeks to
ensure that gifts, prizes and hospitality are not accepted in
inappropriate circumstances, including where acceptance may (or
may be perceived to) compromise independence or be construed
as a bribe.
Conflicts of Interest and Outside Activities - which provides a
process to manage conflicts of interest, and assist our employees,
contractors and managers to understand what we consider to be
a conflict of interest and how to deal with any actual or potential
conflicts.
Securities Trading – which sets out the rules and restrictions
relating to buying, selling and otherwise dealing in Telstra
securities by our Directors, CEO, senior management and certain
other designated employees (Designated Persons), through a
trading windows approach. Designated Persons are also
prohibited from using Telstra shares as collateral in financial
transactions (including margin loan arrangements), and engaging
in stock lending arrangements, short term trading and certain
hedging arrangements in respect of our securities.
Market Disclosure - which outlines responsibilities and sets out
the process for the approval of our ASX announcements, including
where Board approval is required in respect of announcements
that relate to certain significant matters. The policy also outlines
the role of our CEO, CFO and our Continuous Disclosure Committee
in relation to disclosure matters. Our continuous disclosure policy
is reviewed and updated on a regular basis. Our Investor Relations
Communication Policy aims to ensure that we provide investors
and the financial community with appropriate and timely
information whilst ensuring that we fulfil our statutory reporting
obligations under the Corporations Act and the ASX Listing Rules.
We provide advance notification of significant group briefings,
such as our results announcements, and make them widely
accessible through the use of webcasting and placing all
announcements made to the market on our website.
Structural Separation Undertaking – which reflects our
commitment to compliance with the Structural Separation
Undertaking (SSU). The SSU includes our undertaking to
structurally separate over time through migrating voice and
broadband customers from Telstra’s copper and HFC networks to
the National Broadband Network, and to delivering increased
transparency as well as equivalence in the supply of regulated
fixed network services to our wholesale customers. Our
commitments under the SSU include the requirement to self-
report potential breaches of the SSU to the ACCC each month, and
to report annually to the ACCC on our compliance, including
details of any new or additional measures that have been
undertaken by us to ensure compliance. The ACCC reports
annually to the Minister of Broadband, Communications and the
Digital Economy on our compliance with the SSU.
Whistleblowing - provides an avenue for anyone to report
suspected unethical, illegal or improper behaviour. Our
whistleblowing process is supported by an independent service
provider and all disclosures are treated as confidential and can be
made anonymously. Our Ethics Committee monitors all
disclosures, investigations, recommendations and the
implementation of actions, and our Audit Committee oversees the
whistleblowing process.
Additional information regarding our governance framework
(including copies of our Code of Conduct, Securities Trading Policy
and Diversity Policies) can be found in the corporate governance
section of our website.
OUR REMUNERATION FRAMEWORK
Information relating to our remuneration framework and policies
can be found in our Remuneration Report (which forms part of our
Directors' Report).
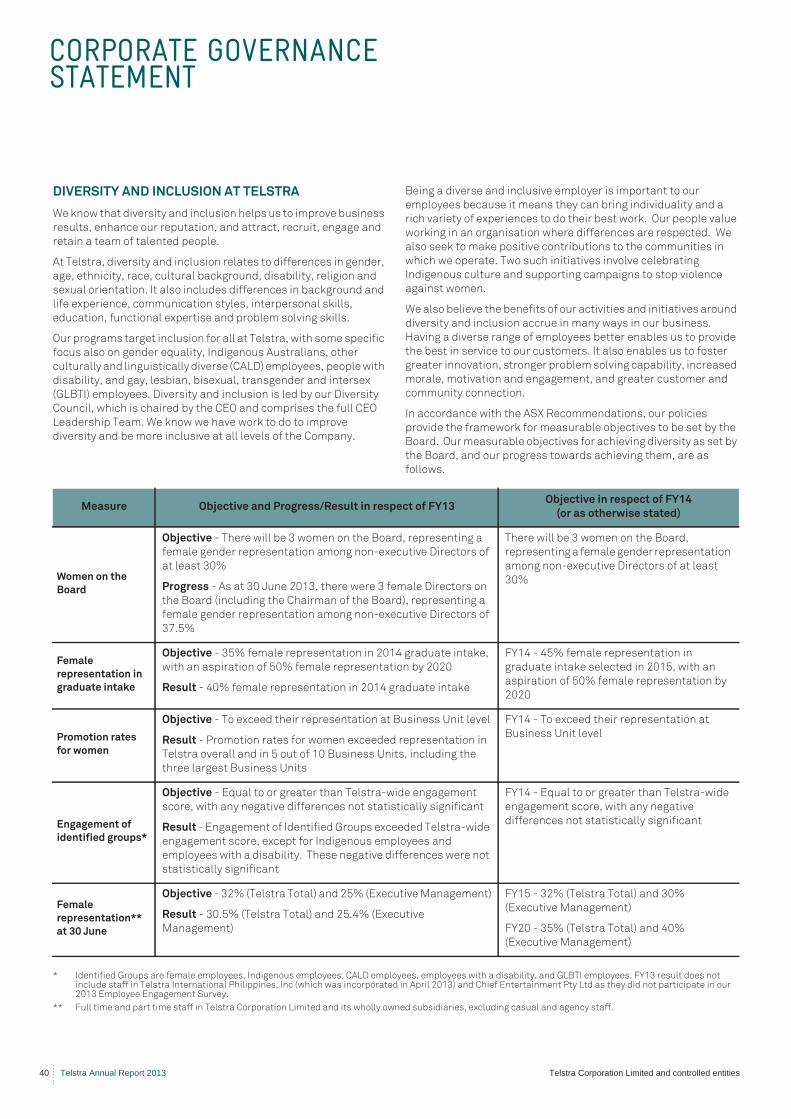
CORPORATE GOVERNANCE STATEMENT
40 Telstra Annual Report 2013 Telstra Corporation Limited and controlled entities
DIVERSITY AND INCLUSION AT TELSTRA
We know that diversity and inclusion helps us to improve business
results, enhance our reputation, and attract, recruit, engage and
retain a team of talented people.
At Telstra, diversity and inclusion relates to differences in gender,
age, ethnicity, race, cultural background, disability, religion and
sexual orientation. It also includes differences in background and
life experience, communication styles, interpersonal skills,
education, functional expertise and problem solving skills.
Our programs target inclusion for all at Telstra, with some specific
focus also on gender equality, Indigenous Australians, other
culturally and linguistically diverse (CALD) employees, people with
disability, and gay, lesbian, bisexual, transgender and intersex
(GLBTI) employees. Diversity and inclusion is led by our Diversity
Council, which is chaired by the CEO and comprises the full CEO
Leadership Team. We know we have work to do to improve
diversity and be more inclusive at all levels of the Company.
Being a diverse and inclusive employer is important to our
employees because it means they can bring individuality and a
rich variety of experiences to do their best work. Our people value
working in an organisation where differences are respected. We
also seek to make positive contributions to the communities in
which we operate. Two such initiatives involve celebrating
Indigenous culture and supporting campaigns to stop violence
against women.
We also believe the benefits of our activities and initiatives around
diversity and inclusion accrue in many ways in our business.
Having a diverse range of employees better enables us to provide
the best in service to our customers. It also enables us to foster
greater innovation, stronger problem solving capability, increased
morale, motivation and engagement, and greater customer and
community connection.
In accordance with the ASX Recommendations, our policies
provide the framework for measurable objectives to be set by the
Board. Our measurable objectives for achieving diversity as set by
the Board, and our progress towards achieving them, are as
follows.
* Identified Groups are female employees, Indigenous employees, CALD employees, employees with a disability, and GLBTI employees. FY13 result does not include staff in Telstra International Philippines, Inc (which was incorporated in April 2013) and Chief Entertainment Pty Ltd as they did not participate in our 2013 Employee Engagement Survey.
** Full time and part time staff in Telstra Corporation Limited and its wholly owned subsidiaries, excluding casual and agency staff.
Measure Objective and Progress/Result in respect of FY13Objective in respect of FY14
(or as otherwise stated)
Women on the
Board
Objective - There will be 3 women on the Board, representing a
female gender representation among non-executive Directors of
at least 30%
Progress - As at 30 June 2013, there were 3 female Directors on
the Board (including the Chairman of the Board), representing a
female gender representation among non-executive Directors of
37.5%
There will be 3 women on the Board,
representing a female gender representation
among non-executive Directors of at least
30%
Female
representation in
graduate intake
Objective - 35% female representation in 2014 graduate intake,
with an aspiration of 50% female representation by 2020
Result - 40% female representation in 2014 graduate intake
FY14 - 45% female representation in
graduate intake selected in 2015, with an
aspiration of 50% female representation by
2020
Promotion rates
for women
Objective - To exceed their representation at Business Unit level
Result - Promotion rates for women exceeded representation in
Telstra overall and in 5 out of 10 Business Units, including the
three largest Business Units
FY14 - To exceed their representation at
Business Unit level
Engagement of
identified groups*
Objective - Equal to or greater than Telstra-wide engagement
score, with any negative differences not statistically significant
Result - Engagement of Identified Groups exceeded Telstra-wide
engagement score, except for Indigenous employees and
employees with a disability. These negative differences were not
statistically significant
FY14 - Equal to or greater than Telstra-wide
engagement score, with any negative
differences not statistically significant
Female
representation**
at 30 June
Objective - 32% (Telstra Total) and 25% (Executive Management)
Result - 30.5% (Telstra Total) and 25.4% (Executive
Management)
FY15 - 32% (Telstra Total) and 30%
(Executive Management)
FY20 - 35% (Telstra Total) and 40%
(Executive Management)
CORPORATE GOVERNANCE STATEMENT
Telstra Corporation Limited and controlled entities Telstra Annual Report 2013 41
As noted earlier, overall female representation across the Telstra
Group remained flat this year, reflecting a challenge around over-
representation of women among departures from Telstra, an
aspect which we will proactively address next year.
We have changed our approach to our measurable objective in
relation to female representation, moving from having a one year
horizon to establishing the objective with horizons to the end of
FY15 and FY20. We have made this change to introduce a longer-
term focus in this area and it will be supported internally with
regular monthly monitoring of progress towards achievement of
our representation objectives.
Information on the representation of women at various levels
within Telstra at 30 June 2013 can be found in the Sustainability
(Our people) section of this Annual Report. A table setting out
Telstra’s workforce gender profile as at 31 March 2013, as
required by the Workplace Gender Equality Act 2012 and lodged
with the Workplace Gender Equality Agency on 27 May 2013, is
provided in the corporate governance section of our website at
www.telstra.com.au/abouttelstra/company-overview/
governance/diversity-and-inclusion/index.htm.
Board Diversity
The Board has a number of initiatives in place to meet its strategic
imperative of ensuring the Company has a diverse Board and to
achieve its Board diversity measurable objective. These include
ensuring a diverse range of qualified candidates is considered for
Board appointments, developing a pipeline of potential Board
candidates, and participating in programs to assist in the
development of a broader pool of skilled and experienced Board
candidates, including support for the AICD ASX 200 Chairmen’s
Mentoring Program.
Employee Diversity and Inclusion
Our 2013 employee engagement survey showed that the
engagement of all of our identified groups has improved since last
year. The most significant improvement was seen in the
engagement of our Indigenous employees.
During FY13, our initiatives to enhance diversity and inclusion at
Telstra included the following:
• Gender Equality: our CEO continued his involvement in the
“Male Champions of Change” group, convened by Australia’s
Sex Discrimination Commissioner, Elizabeth Broderick. This
group models effective leadership by male executives in
relation to gender equality in some of Australia’s largest
corporate and government organisations.
• Indigenous: we established a team of Indigenous Employment
Ambassadors and an Indigenous employee network, along with an online employee Indigenous cultural appreciation program
(Connecting our Cultures) and signed a three-year
memorandum of understanding with Jawun Indigenous
Corporate Partnerships to place Telstra secondees in
Indigenous communities.
• Flexibility: we began a series of pilot projects on job sharing,
employee connection during and after long term leave such as
maternity leave, job design, proactive advertising of flexible
work options, and a more systematic approach to change work
practices to enable better balance between work and life
outside work.
• Overall Inclusion: we reinforced expectations of all of our
leaders, through performance planning and development
processes, that they lead in an inclusive way and value
differences within their teams.
SHAREHOLDER COMMUNICATIONS
We are committed to open, clear, accurate and timely
communications with our shareholders about matters affecting
the value of their investment in Telstra, and ensuring all
communications are consistent with our continuous disclosure
and other applicable legal obligations. We also value a direct, two-
way dialogue with shareholders and believe it is important not only
to provide relevant information as quickly and efficiently as
possible, but also to listen and understand our shareholders’
perspectives and respond to their feedback.
Some of the specific initiatives we have put in place to encourage
effective communication with our shareholders include:
• making appropriate use of technology to inform and engage our
shareholders, including webcasting important events such as
our financial results briefings and our AGM
• hosting a series of retail shareholder information briefings in a
number of cities around Australia with the CEO and/or CFO in
relation to our full year results, prior to our AGM
• writing directly to our shareholders on significant issues that
affect their investment and using electronic communications
to advise those shareholders who have provided us with their
email address, and
• maintaining our investor relations website and placing all
announcements made to the market, including transcripts of
investor briefings and related information, on our website after
this information has been released to the ASX.
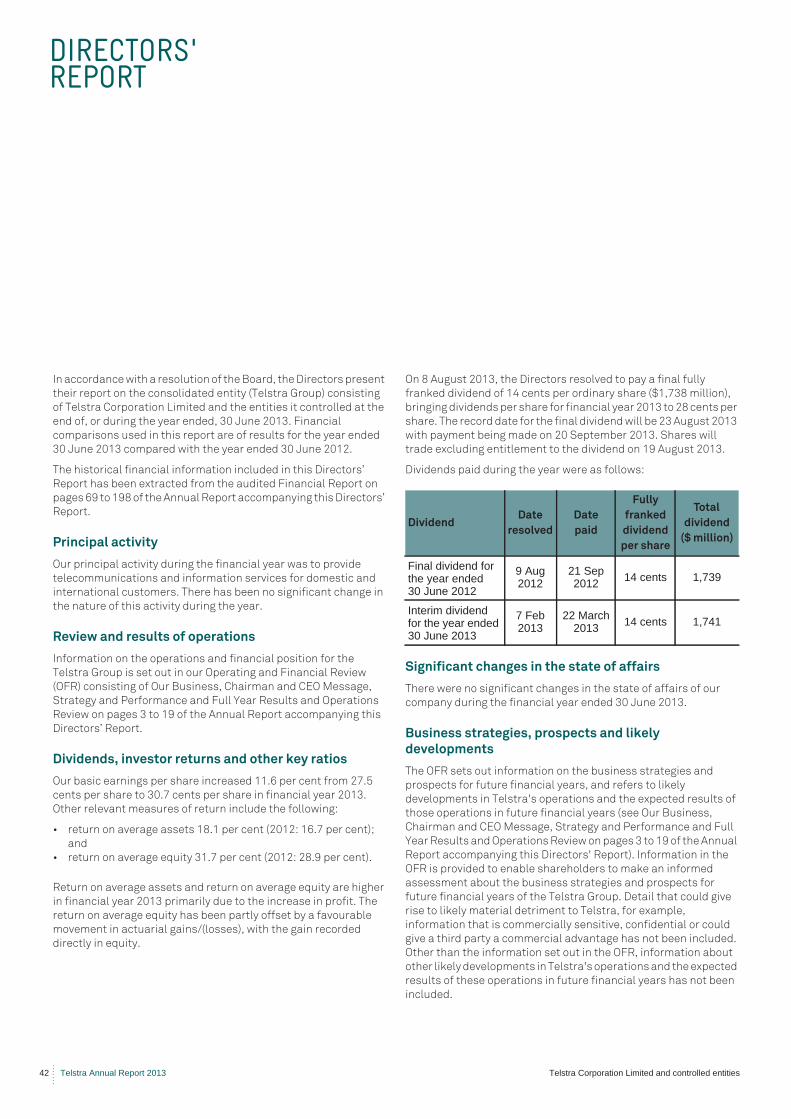
DIRECTORS'REPORT
42 Telstra Annual Report 2013 Telstra Corporation Limited and controlled entities
In accordance with a resolution of the Board, the Directors present
their report on the consolidated entity (Telstra Group) consisting
of Telstra Corporation Limited and the entities it controlled at the
end of, or during the year ended, 30 June 2013. Financial
comparisons used in this report are of results for the year ended
30 June 2013 compared with the year ended 30 June 2012.
The historical financial information included in this Directors’
Report has been extracted from the audited Financial Report on
pages 69 to 198 of the Annual Report accompanying this Directors’
Report.
Principal activity
Our principal activity during the financial year was to provide
telecommunications and information services for domestic and
international customers. There has been no significant change in
the nature of this activity during the year.
Review and results of operations
Information on the operations and financial position for the
Telstra Group is set out in our Operating and Financial Review
(OFR) consisting of Our Business, Chairman and CEO Message,
Strategy and Performance and Full Year Results and Operations
Review on pages 3 to 19 of the Annual Report accompanying this
Directors’ Report.
Dividends, investor returns and other key ratios
Our basic earnings per share increased 11.6 per cent from 27.5
cents per share to 30.7 cents per share in financial year 2013.
Other relevant measures of return include the following:
• return on average assets 18.1 per cent (2012: 16.7 per cent);
and
• return on average equity 31.7 per cent (2012: 28.9 per cent).
Return on average assets and return on average equity are higher
in financial year 2013 primarily due to the increase in profit. The
return on average equity has been partly offset by a favourable
movement in actuarial gains/(losses), with the gain recorded
directly in equity.
On 8 August 2013, the Directors resolved to pay a final fully
franked dividend of 14 cents per ordinary share ($1,738 million),
bringing dividends per share for financial year 2013 to 28 cents per
share. The record date for the final dividend will be 23 August 2013
with payment being made on 20 September 2013. Shares will
trade excluding entitlement to the dividend on 19 August 2013.
Dividends paid during the year were as follows:
Significant changes in the state of affairs
There were no significant changes in the state of affairs of our
company during the financial year ended 30 June 2013.
Business strategies, prospects and likely
developments
The OFR sets out information on the business strategies and
prospects for future financial years, and refers to likely
developments in Telstra's operations and the expected results of
those operations in future financial years (see Our Business,
Chairman and CEO Message, Strategy and Performance and Full
Year Results and Operations Review on pages 3 to 19 of the Annual
Report accompanying this Directors' Report). Information in the
OFR is provided to enable shareholders to make an informed
assessment about the business strategies and prospects for
future financial years of the Telstra Group. Detail that could give
rise to likely material detriment to Telstra, for example,
information that is commercially sensitive, confidential or could
give a third party a commercial advantage has not been included.
Other than the information set out in the OFR, information about
other likely developments in Telstra's operations and the expected
results of these operations in future financial years has not been
included.
DividendDate
resolved
Date
paid
Fully
franked
dividend
per share
Total
dividend
($ million)
Final dividend for the year ended 30 June 2012
9 Aug 2012
21 Sep 2012 14 cents 1,739
Interim dividend for the year ended 30 June 2013
7 Feb 2013
22 March 2013 14 cents 1,741
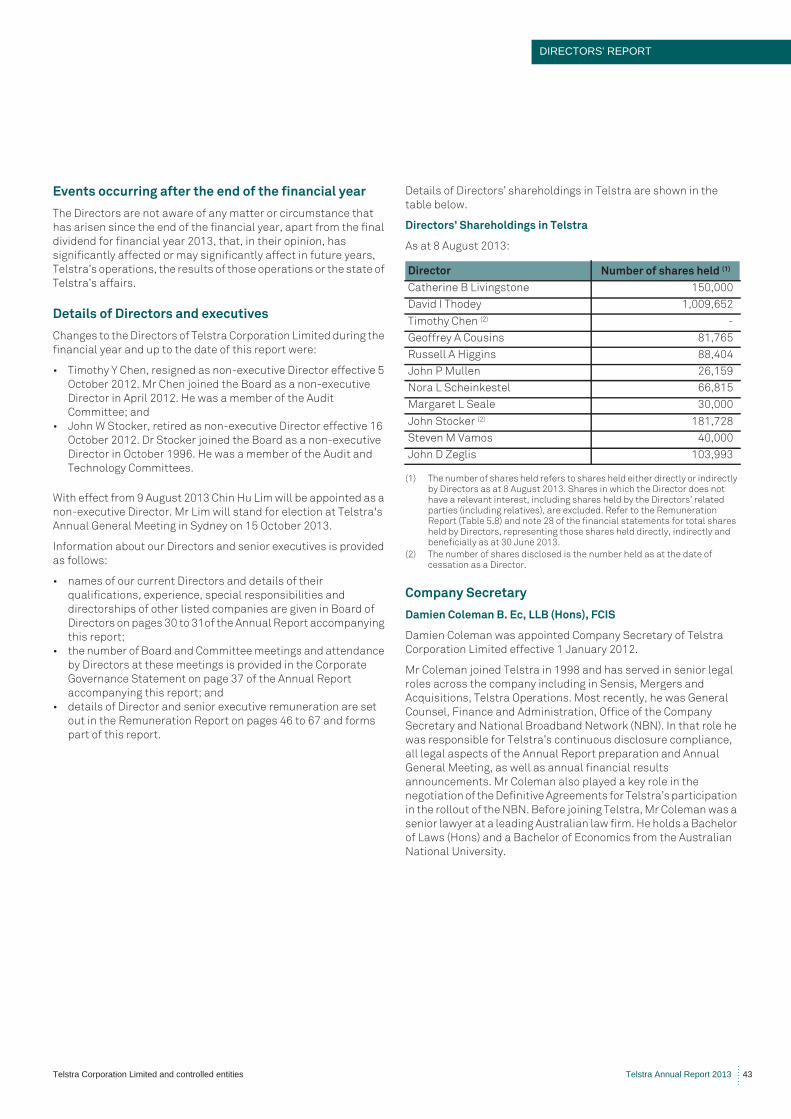
DIRECTORS' REPORT
Telstra Corporation Limited and controlled entities Telstra Annual Report 2013 43
Events occurring after the end of the financial year
The Directors are not aware of any matter or circumstance that
has arisen since the end of the financial year, apart from the final
dividend for financial year 2013, that, in their opinion, has
significantly affected or may significantly affect in future years,
Telstra’s operations, the results of those operations or the state of
Telstra’s affairs.
Details of Directors and executives
Changes to the Directors of Telstra Corporation Limited during the
financial year and up to the date of this report were:
• Timothy Y Chen, resigned as non-executive Director effective 5
October 2012. Mr Chen joined the Board as a non-executive
Director in April 2012. He was a member of the Audit
Committee; and
• John W Stocker, retired as non-executive Director effective 16
October 2012. Dr Stocker joined the Board as a non-executive
Director in October 1996. He was a member of the Audit and
Technology Committees.
With effect from 9 August 2013 Chin Hu Lim will be appointed as a
non-executive Director. Mr Lim will stand for election at Telstra's
Annual General Meeting in Sydney on 15 October 2013.
Information about our Directors and senior executives is provided
as follows:
• names of our current Directors and details of their
qualifications, experience, special responsibilities and
directorships of other listed companies are given in Board of
Directors on pages 30 to 31of the Annual Report accompanying
this report;
• the number of Board and Committee meetings and attendance
by Directors at these meetings is provided in the Corporate
Governance Statement on page 37 of the Annual Report
accompanying this report; and
• details of Director and senior executive remuneration are set
out in the Remuneration Report on pages 46 to 67 and forms
part of this report.
Details of Directors’ shareholdings in Telstra are shown in the
table below.
Directors’ Shareholdings in Telstra
As at 8 August 2013:
(1) The number of shares held refers to shares held either directly or indirectly by Directors as at 8 August 2013. Shares in which the Director does not have a relevant interest, including shares held by the Directors’ related parties (including relatives), are excluded. Refer to the Remuneration Report (Table 5.8) and note 28 of the financial statements for total shares held by Directors, representing those shares held directly, indirectly and beneficially as at 30 June 2013.
(2) The number of shares disclosed is the number held as at the date of cessation as a Director.
Company Secretary
Damien Coleman B. Ec, LLB (Hons), FCIS
Damien Coleman was appointed Company Secretary of Telstra
Corporation Limited effective 1 January 2012.
Mr Coleman joined Telstra in 1998 and has served in senior legal
roles across the company including in Sensis, Mergers and
Acquisitions, Telstra Operations. Most recently, he was General
Counsel, Finance and Administration, Office of the Company
Secretary and National Broadband Network (NBN). In that role he
was responsible for Telstra’s continuous disclosure compliance,
all legal aspects of the Annual Report preparation and Annual
General Meeting, as well as annual financial results
announcements. Mr Coleman also played a key role in the
negotiation of the Definitive Agreements for Telstra’s participation
in the rollout of the NBN. Before joining Telstra, Mr Coleman was a
senior lawyer at a leading Australian law firm. He holds a Bachelor
of Laws (Hons) and a Bachelor of Economics from the Australian
National University.
Director Number of shares held (1)
Catherine B Livingstone 150,000
David I Thodey 1,009,652
Timothy Chen (2) -
Geoffrey A Cousins 81,765
Russell A Higgins 88,404
John P Mullen 26,159
Nora L Scheinkestel 66,815
Margaret L Seale 30,000
John Stocker (2) 181,728
Steven M Vamos 40,000
John D Zeglis 103,993
DIRECTORS'REPORT
44 Telstra Annual Report 2013 Telstra Corporation Limited and controlled entities
Directors’ and officers’ indemnity
Constitution
Telstra’s constitution provides for it to indemnify each officer, to
the maximum extent permitted by law, for any liability and legal
costs incurred as an officer of Telstra or a related body corporate.
If one of Telstra’s officers or employees is asked by Telstra to be a
director or other officer of a company which is not related to it,
Telstra’s constitution provides for it to indemnify the officer or
employee for any liability he or she incurs. This indemnity only
applies if the liability was incurred in the officer’s or employee’s
capacity as an officer of that other company. This indemnity is to
the maximum extent permitted by law, as if that liability had been
incurred in the capacity as an officer of Telstra. Telstra’s
constitution also allows it to indemnify employees and outside
officers in some circumstances. The terms "officer", "employee"
and "outside officer" are defined in Telstra’s constitution.
Deeds of indemnity in favour of directors, officers and
employees
Telstra has also executed deeds of indemnity in favour of
(amongst others):
• Directors of Telstra (including past Directors);
• secretaries and executive officers of Telstra (other than Telstra
Directors) and directors, secretaries and executive officers of
Telstra’s wholly owned controlled entities;
• directors, secretaries and executive officers of a related body
corporate of Telstra (other than a wholly owned controlled
entity) while the director, secretary or executive officer was
also an employee of Telstra or a director or employee of a wholly
owned controlled entity of Telstra (other than Telstra
Directors); and
• the officers listed above (other than Telstra Directors) and
certain employees of Telstra or a related body corporate of
Telstra who are appointed as directors of a company which is
not a related body corporate of Telstra, at the request of
Telstra.
Each of these deeds provides an indemnity as permitted under
Telstra’s constitution and the Corporations Act 2001. The term
“executive officer” is defined in the relevant deed of indemnity. The
deeds in favour of Directors of Telstra also give Directors certain
rights of access to Telstra’s books and require it to maintain
insurance cover for the Directors.
Additionally, Telstra has executed an indemnity in favour of
employees (including officers other than Directors) in respect of
certain liabilities incurred in the formulation, entering into or
carrying out, of a Telstra Sale Scheme (as defined in the Telstra
Corporation Act 1991 (Cth)). This indemnity is provided as
permitted under Telstra’s constitution and the Corporations Act
2001. Although all Telstra Sale Schemes conducted by the
Commonwealth Government have been completed, the indemnity
will remain in place while it is possible for claims to arise under a
Telstra Sale Scheme.
Telstra has also executed a deed of indemnity in favour of certain
employees (including certain officers), in respect of liabilities and
legal costs which may be incurred as part of the NBN transaction.
The indemnity is to the maximum extent permitted by law and is
subject to the employee performing his or her duties such as
acting in good faith and complying with all applicable laws.
Directors’ and officers’ insurance
Telstra maintains directors' and officers' insurance policies that,
subject to some exceptions, provide worldwide insurance cover to
past, present and future directors, secretaries and officers and
certain employees of Telstra and its controlled entities. Telstra
has paid the premiums for the policies. The directors' and officers'
insurance policies prohibit disclosure of the premiums payable
under the policies and the nature of the liabilities insured.
Environmental regulation and performance
Telstra’s operations are subject to significant environmental
regulation under Commonwealth, State and Territory law,
particularly with regard to:
• the impact of the installation and maintenance of
telecommunications infrastructure;
• energy and water efficiency;
• mandatory reporting of a range of environmental matters
including energy use and greenhouse gas emissions;
• packaging of products;
• procurement of services;
• site contamination and pollution; and
• waste management.
Telstra is subject to the Energy Efficiency Opportunities Act 2006
(Cth), requiring robust systems for the identification and
evaluation of cost-effective energy saving opportunities. Telstra
registered on 31 March 2007 and has submitted annual public and
bi-annual government reports to the Department of Resources
Energy and Tourism, meeting all legislative requirements. Telstra
completed its first five year cycle in 2011 and has transitioned into
the second five year cycle with the Assessment and Reporting
Schedule approved in June 2013.
Telstra is subject to the National Greenhouse and Energy
Reporting Act 2007 (Cth), requiring annual reporting of
greenhouse gas emissions, energy consumption and energy
production for activities under Telstra’s control. Telstra registered
prior to 31 August 2009, and has reported to the Department of
Climate Change and Energy Efficiency/Clean Energy Regulator on
an annual basis. The next report is due on 31 October 2013, and
will be supported with an independent assurance audit to a
reasonable assurance standard.
Telstra has well established systems and procedures to monitor
and manage compliance with existing environmental regulations
and new regulations as they come into force. Telstra keeps its
systems and procedures under review and works with regulators
and other relevant stakeholders to respond appropriately to
environmental issues that arise across its operations, as it has
done during the year in relation to the management of remediation
of telecommunications pits, some of which contain asbestos fibre
cement. Telstra has not been prosecuted for, or convicted of, any
significant breaches of environmental regulation during the
financial year.
DIRECTORS' REPORT
Telstra Corporation Limited and controlled entities Telstra Annual Report 2013 45
Non-audit services
During financial year 2013, Telstra’s auditor Ernst & Young (EY)
has been employed on assignments additional to its statutory
audit duties. Details of the amounts paid or payable to EY for audit
and non-audit services provided during the year are detailed in
note 8 to the financial statements.
The Directors are satisfied that the provision of non-audit services
during financial year 2013 is consistent with the general standard
of independence for auditors imposed by the Corporations Act
2001 (the Act), and that the nature and scope of each type of non-
audit service provided did not compromise the auditor
independence requirements of the Act for the following reasons:
• all recurring audit engagements are approved by the Audit
Committee each year through the Audit Committee’s approval
of the annual audit plan;
• additional audit and non-audit services up to $100,000 require
approval from the Chief Financial Officer;
• additional audit and non-audit services between $100,000 and
$250,000 require approval from the Chairman of the Audit
Committee and services greater than $250,000 require
approval from the Audit Committee;
• where the nature or scope of an external engagement changes
such that the prior approval obtained is insufficient,
subsequent approval from the Chief Financial Officer must be
obtained for the revised engagement as shown in the table
below. Where the change is not covered in the following table,
approval of the revised engagement must be obtained in
accordance with the approval levels described above;
• all additional engagements approved as per the above points
are reported to the Audit Committee at the next meeting;
• fees earned from non-audit work undertaken by EY are capped
at 1.0 times the total audit and audit related fees; and
• the provision of non-audit services by EY is monitored by the
Audit Committee via periodic reporting to the Audit Committee.
EY is specifically prohibited from performing any of the following
services:
• bookkeeping services and other services related to preparing
our accounting records or financial statements;
• financial information system design and implementation
services;
• operation or supervision of IT systems;
• appraisal or valuation services, fairness opinions, or
contribution in kind reports;
• actuarial services;
• internal audit services;
• management or human resources functions including the
provision of advice and benchmarking services in relation to
executive remuneration;
• temporary staff assignments;
• broker or dealer, investment advisor, or investment banking
services;
• legal services or expert services unrelated to the audit;
• tax planning and strategy services; and
• receiver/liquidation services.
A copy of the auditors’ independence declaration is set out in the
“Auditor’s Independence Declaration to the Directors of Telstra
Corporation Limited” on page 68 and forms part of this report.
Type of Service Type of Change
Additional audit work related
to the half year review and full
year audit
Scope and / or fee variations
Other audit services Scope increases of up to 10 per
cent in total of the pre approved
fee
Other assurance services Scope increases of up to 10 per
cent in total of the pre approved
fee
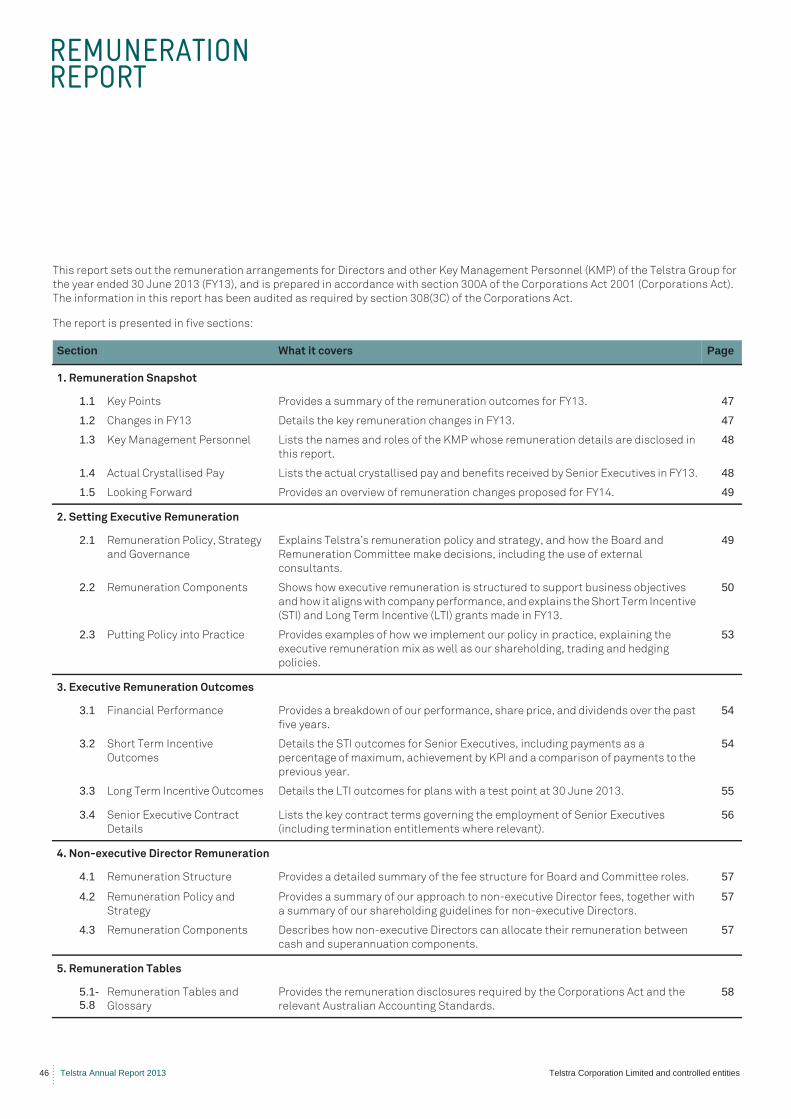
REMUNERATIONREPORT
46 Telstra Annual Report 2013 Telstra Corporation Limited and controlled entities
This report sets out the remuneration arrangements for Directors and other Key Management Personnel (KMP) of the Telstra Group for
the year ended 30 June 2013 (FY13), and is prepared in accordance with section 300A of the Corporations Act 2001 (Corporations Act).
The information in this report has been audited as required by section 308(3C) of the Corporations Act.
The report is presented in five sections:
Section What it covers Page
1. Remuneration Snapshot
1.1 Key Points Provides a summary of the remuneration outcomes for FY13. 47
1.2 Changes in FY13 Details the key remuneration changes in FY13. 47
1.3 Key Management Personnel Lists the names and roles of the KMP whose remuneration details are disclosed in
this report.
48
1.4 Actual Crystallised Pay Lists the actual crystallised pay and benefits received by Senior Executives in FY13. 48
1.5 Looking Forward Provides an overview of remuneration changes proposed for FY14. 49
2. Setting Executive Remuneration
2.1 Remuneration Policy, Strategy
and Governance
Explains Telstra’s remuneration policy and strategy, and how the Board and
Remuneration Committee make decisions, including the use of external
consultants.
49
2.2 Remuneration Components Shows how executive remuneration is structured to support business objectives
and how it aligns with company performance, and explains the Short Term Incentive
(STI) and Long Term Incentive (LTI) grants made in FY13.
50
2.3 Putting Policy into Practice Provides examples of how we implement our policy in practice, explaining the
executive remuneration mix as well as our shareholding, trading and hedging
policies.
53
3. Executive Remuneration Outcomes
3.1 Financial Performance Provides a breakdown of our performance, share price, and dividends over the past
five years.
54
3.2 Short Term Incentive
Outcomes
Details the STI outcomes for Senior Executives, including payments as a
percentage of maximum, achievement by KPI and a comparison of payments to the
previous year.
54
3.3 Long Term Incentive Outcomes Details the LTI outcomes for plans with a test point at 30 June 2013. 55
3.4 Senior Executive Contract
Details
Lists the key contract terms governing the employment of Senior Executives
(including termination entitlements where relevant).
56
4. Non-executive Director Remuneration
4.1 Remuneration Structure Provides a detailed summary of the fee structure for Board and Committee roles. 57
4.2 Remuneration Policy and
Strategy
Provides a summary of our approach to non-executive Director fees, together with
a summary of our shareholding guidelines for non-executive Directors.
57
4.3 Remuneration Components Describes how non-executive Directors can allocate their remuneration between
cash and superannuation components.
57
5. Remuneration Tables
5.1-5.8
Remuneration Tables and
Glossary
Provides the remuneration disclosures required by the Corporations Act and the
relevant Australian Accounting Standards.
58
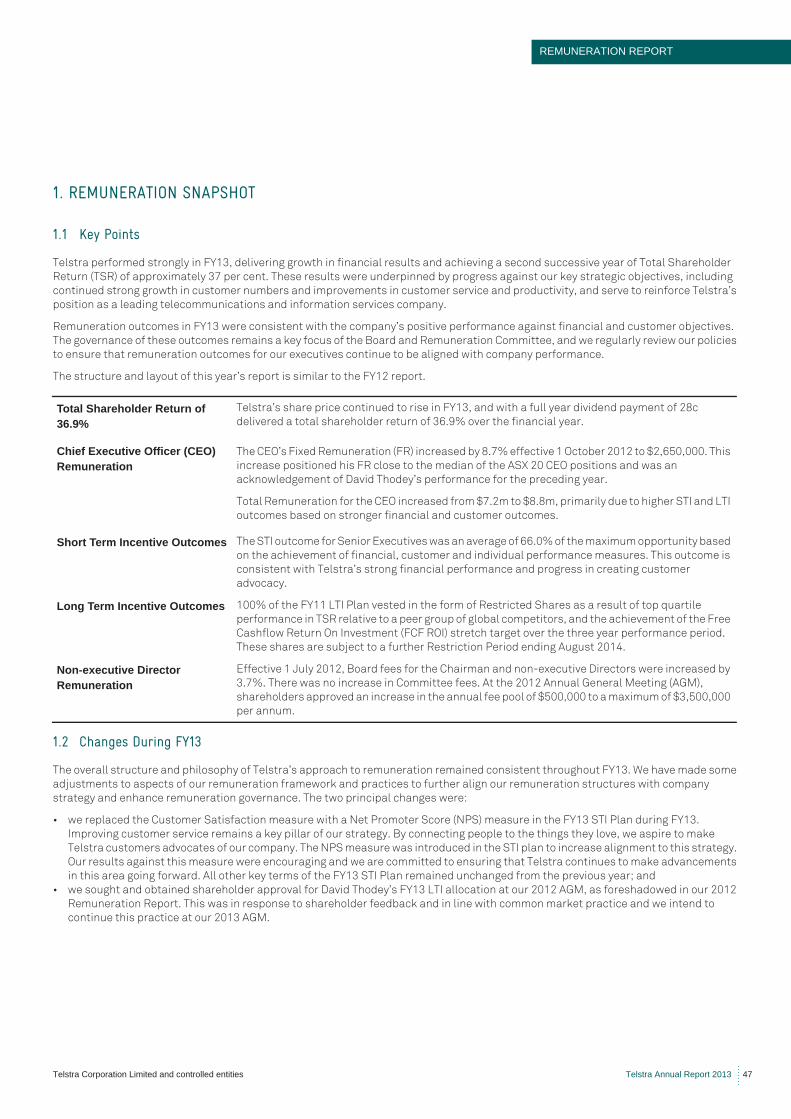
REMUNERATION REPORT
Telstra Corporation Limited and controlled entities Telstra Annual Report 2013 47
1. REMUNERATION SNAPSHOT
1.1 Key Points
Telstra performed strongly in FY13, delivering growth in financial results and achieving a second successive year of Total Shareholder
Return (TSR) of approximately 37 per cent. These results were underpinned by progress against our key strategic objectives, including
continued strong growth in customer numbers and improvements in customer service and productivity, and serve to reinforce Telstra’s
position as a leading telecommunications and information services company.
Remuneration outcomes in FY13 were consistent with the company’s positive performance against financial and customer objectives.
The governance of these outcomes remains a key focus of the Board and Remuneration Committee, and we regularly review our policies
to ensure that remuneration outcomes for our executives continue to be aligned with company performance.
The structure and layout of this year’s report is similar to the FY12 report.
1.2 Changes During FY13
The overall structure and philosophy of Telstra’s approach to remuneration remained consistent throughout FY13. We have made some
adjustments to aspects of our remuneration framework and practices to further align our remuneration structures with company
strategy and enhance remuneration governance. The two principal changes were:
• we replaced the Customer Satisfaction measure with a Net Promoter Score (NPS) measure in the FY13 STI Plan during FY13.
Improving customer service remains a key pillar of our strategy. By connecting people to the things they love, we aspire to make
Telstra customers advocates of our company. The NPS measure was introduced in the STI plan to increase alignment to this strategy.
Our results against this measure were encouraging and we are committed to ensuring that Telstra continues to make advancements
in this area going forward. All other key terms of the FY13 STI Plan remained unchanged from the previous year; and
• we sought and obtained shareholder approval for David Thodey’s FY13 LTI allocation at our 2012 AGM, as foreshadowed in our 2012
Remuneration Report. This was in response to shareholder feedback and in line with common market practice and we intend to
continue this practice at our 2013 AGM.
Total Shareholder Return of 36.9%
Telstra’s share price continued to rise in FY13, and with a full year dividend payment of 28c
delivered a total shareholder return of 36.9% over the financial year.
Chief Executive Officer (CEO) Remuneration
The CEO’s Fixed Remuneration (FR) increased by 8.7% effective 1 October 2012 to $2,650,000. This
increase positioned his FR close to the median of the ASX 20 CEO positions and was an
acknowledgement of David Thodey’s performance for the preceding year.
Total Remuneration for the CEO increased from $7.2m to $8.8m, primarily due to higher STI and LTI
outcomes based on stronger financial and customer outcomes.
Short Term Incentive Outcomes The STI outcome for Senior Executives was an average of 66.0% of the maximum opportunity based
on the achievement of financial, customer and individual performance measures. This outcome is
consistent with Telstra’s strong financial performance and progress in creating customer
advocacy.
Long Term Incentive Outcomes 100% of the FY11 LTI Plan vested in the form of Restricted Shares as a result of top quartile
performance in TSR relative to a peer group of global competitors, and the achievement of the Free
Cashflow Return On Investment (FCF ROI) stretch target over the three year performance period.
These shares are subject to a further Restriction Period ending August 2014.
Non-executive Director Remuneration
Effective 1 July 2012, Board fees for the Chairman and non-executive Directors were increased by
3.7%. There was no increase in Committee fees. At the 2012 Annual General Meeting (AGM),
shareholders approved an increase in the annual fee pool of $500,000 to a maximum of $3,500,000
per annum.
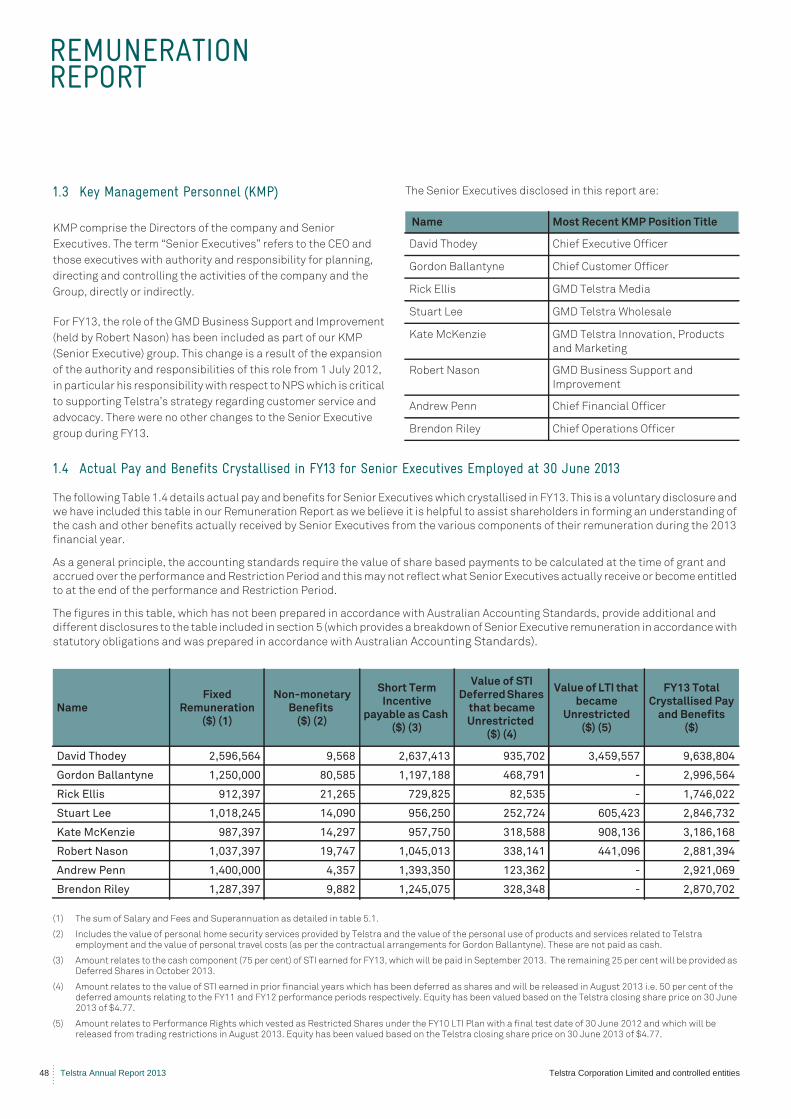
REMUNERATION REPORT
48 Telstra Annual Report 2013 Telstra Corporation Limited and controlled entities
1.3 Key Management Personnel (KMP)
KMP comprise the Directors of the company and Senior
Executives. The term “Senior Executives” refers to the CEO and
those executives with authority and responsibility for planning,
directing and controlling the activities of the company and the
Group, directly or indirectly.
For FY13, the role of the GMD Business Support and Improvement
(held by Robert Nason) has been included as part of our KMP
(Senior Executive) group. This change is a result of the expansion
of the authority and responsibilities of this role from 1 July 2012,
in particular his responsibility with respect to NPS which is critical
to supporting Telstra’s strategy regarding customer service and
advocacy. There were no other changes to the Senior Executive
group during FY13.
The Senior Executives disclosed in this report are:
1.4 Actual Pay and Benefits Crystallised in FY13 for Senior Executives Employed at 30 June 2013
The following Table 1.4 details actual pay and benefits for Senior Executives which crystallised in FY13. This is a voluntary disclosure and
we have included this table in our Remuneration Report as we believe it is helpful to assist shareholders in forming an understanding of
the cash and other benefits actually received by Senior Executives from the various components of their remuneration during the 2013
financial year.
As a general principle, the accounting standards require the value of share based payments to be calculated at the time of grant and
accrued over the performance and Restriction Period and this may not reflect what Senior Executives actually receive or become entitled
to at the end of the performance and Restriction Period.
The figures in this table, which has not been prepared in accordance with Australian Accounting Standards, provide additional and
different disclosures to the table included in section 5 (which provides a breakdown of Senior Executive remuneration in accordance with
statutory obligations and was prepared in accordance with Australian Accounting Standards).
(1) The sum of Salary and Fees and Superannuation as detailed in table 5.1.
(2) Includes the value of personal home security services provided by Telstra and the value of the personal use of products and services related to Telstra employment and the value of personal travel costs (as per the contractual arrangements for Gordon Ballantyne). These are not paid as cash.
(3) Amount relates to the cash component (75 per cent) of STI earned for FY13, which will be paid in September 2013. The remaining 25 per cent will be provided as Deferred Shares in October 2013.
(4) Amount relates to the value of STI earned in prior financial years which has been deferred as shares and will be released in August 2013 i.e. 50 per cent of the deferred amounts relating to the FY11 and FY12 performance periods respectively. Equity has been valued based on the Telstra closing share price on 30 June 2013 of $4.77.
(5) Amount relates to Performance Rights which vested as Restricted Shares under the FY10 LTI Plan with a final test date of 30 June 2012 and which will be released from trading restrictions in August 2013. Equity has been valued based on the Telstra closing share price on 30 June 2013 of $4.77.
Name Most Recent KMP Position Title
David Thodey Chief Executive Officer
Gordon Ballantyne Chief Customer Officer
Rick Ellis GMD Telstra Media
Stuart Lee GMD Telstra Wholesale
Kate McKenzie GMD Telstra Innovation, Products
and Marketing
Robert Nason GMD Business Support and
Improvement
Andrew Penn Chief Financial Officer
Brendon Riley Chief Operations Officer
NameFixed
Remuneration($) (1)
Non-monetary Benefits
($) (2)
Short Term Incentive
payable as Cash ($) (3)
Value of STI Deferred Shares
that became Unrestricted
($) (4)
Value of LTI that became
Unrestricted($) (5)
FY13 TotalCrystallised Pay
and Benefits($)
David Thodey 2,596,564 9,568 2,637,413 935,702 3,459,557 9,638,804
Gordon Ballantyne 1,250,000 80,585 1,197,188 468,791 - 2,996,564
Rick Ellis 912,397 21,265 729,825 82,535 - 1,746,022
Stuart Lee 1,018,245 14,090 956,250 252,724 605,423 2,846,732
Kate McKenzie 987,397 14,297 957,750 318,588 908,136 3,186,168
Robert Nason 1,037,397 19,747 1,045,013 338,141 441,096 2,881,394
Andrew Penn 1,400,000 4,357 1,393,350 123,362 - 2,921,069
Brendon Riley 1,287,397 9,882 1,245,075 328,348 - 2,870,702
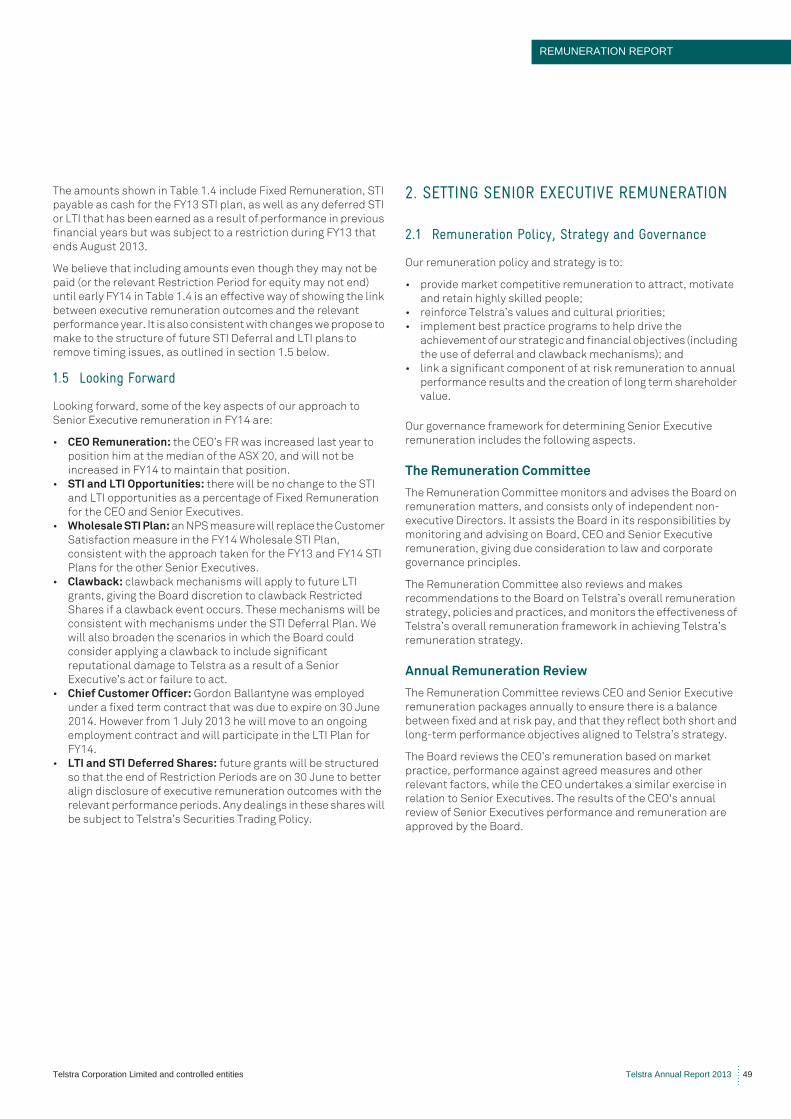
REMUNERATION REPORT
Telstra Corporation Limited and controlled entities Telstra Annual Report 2013 49
The amounts shown in Table 1.4 include Fixed Remuneration, STI
payable as cash for the FY13 STI plan, as well as any deferred STI
or LTI that has been earned as a result of performance in previous
financial years but was subject to a restriction during FY13 that
ends August 2013.
We believe that including amounts even though they may not be
paid (or the relevant Restriction Period for equity may not end)
until early FY14 in Table 1.4 is an effective way of showing the link
between executive remuneration outcomes and the relevant
performance year. It is also consistent with changes we propose to
make to the structure of future STI Deferral and LTI plans to
remove timing issues, as outlined in section 1.5 below.
1.5 Looking Forward
Looking forward, some of the key aspects of our approach to
Senior Executive remuneration in FY14 are:
• CEO Remuneration: the CEO’s FR was increased last year to
position him at the median of the ASX 20, and will not be
increased in FY14 to maintain that position.
• STI and LTI Opportunities: there will be no change to the STI
and LTI opportunities as a percentage of Fixed Remuneration
for the CEO and Senior Executives.
• Wholesale STI Plan: an NPS measure will replace the Customer
Satisfaction measure in the FY14 Wholesale STI Plan,
consistent with the approach taken for the FY13 and FY14 STI
Plans for the other Senior Executives.
• Clawback: clawback mechanisms will apply to future LTI
grants, giving the Board discretion to clawback Restricted
Shares if a clawback event occurs. These mechanisms will be
consistent with mechanisms under the STI Deferral Plan. We
will also broaden the scenarios in which the Board could
consider applying a clawback to include significant
reputational damage to Telstra as a result of a Senior
Executive’s act or failure to act.
• Chief Customer Officer: Gordon Ballantyne was employed
under a fixed term contract that was due to expire on 30 June
2014. However from 1 July 2013 he will move to an ongoing
employment contract and will participate in the LTI Plan for
FY14.
• LTI and STI Deferred Shares: future grants will be structured
so that the end of Restriction Periods are on 30 June to better
align disclosure of executive remuneration outcomes with the
relevant performance periods. Any dealings in these shares will
be subject to Telstra’s Securities Trading Policy.
2. SETTING SENIOR EXECUTIVE REMUNERATION
2.1 Remuneration Policy, Strategy and Governance
Our remuneration policy and strategy is to:
• provide market competitive remuneration to attract, motivate
and retain highly skilled people;
• reinforce Telstra’s values and cultural priorities;
• implement best practice programs to help drive the
achievement of our strategic and financial objectives (including
the use of deferral and clawback mechanisms); and
• link a significant component of at risk remuneration to annual
performance results and the creation of long term shareholder
value.
Our governance framework for determining Senior Executive
remuneration includes the following aspects.
The Remuneration Committee
The Remuneration Committee monitors and advises the Board on
remuneration matters, and consists only of independent non-
executive Directors. It assists the Board in its responsibilities by
monitoring and advising on Board, CEO and Senior Executive
remuneration, giving due consideration to law and corporate
governance principles.
The Remuneration Committee also reviews and makes
recommendations to the Board on Telstra’s overall remuneration
strategy, policies and practices, and monitors the effectiveness of
Telstra’s overall remuneration framework in achieving Telstra’s
remuneration strategy.
Annual Remuneration Review
The Remuneration Committee reviews CEO and Senior Executive
remuneration packages annually to ensure there is a balance
between fixed and at risk pay, and that they reflect both short and
long-term performance objectives aligned to Telstra’s strategy.
The Board reviews the CEO’s remuneration based on market
practice, performance against agreed measures and other
relevant factors, while the CEO undertakes a similar exercise in
relation to Senior Executives. The results of the CEO's annual
review of Senior Executives performance and remuneration are
approved by the Board.
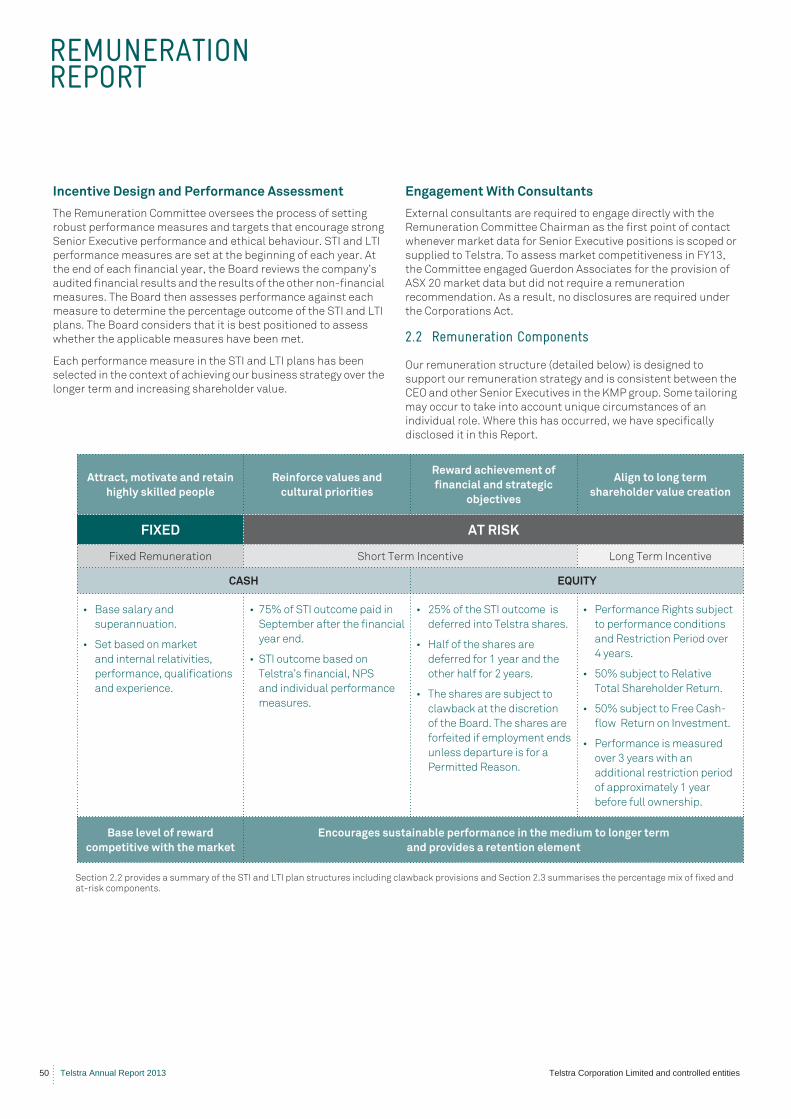
REMUNERATION REPORT
50 Telstra Annual Report 2013 Telstra Corporation Limited and controlled entities
Incentive Design and Performance Assessment
The Remuneration Committee oversees the process of setting
robust performance measures and targets that encourage strong
Senior Executive performance and ethical behaviour. STI and LTI
performance measures are set at the beginning of each year. At
the end of each financial year, the Board reviews the company’s
audited financial results and the results of the other non-financial
measures. The Board then assesses performance against each
measure to determine the percentage outcome of the STI and LTI
plans. The Board considers that it is best positioned to assess
whether the applicable measures have been met.
Each performance measure in the STI and LTI plans has been
selected in the context of achieving our business strategy over the
longer term and increasing shareholder value.
Engagement With Consultants
External consultants are required to engage directly with the
Remuneration Committee Chairman as the first point of contact
whenever market data for Senior Executive positions is scoped or
supplied to Telstra. To assess market competitiveness in FY13,
the Committee engaged Guerdon Associates for the provision of
ASX 20 market data but did not require a remuneration
recommendation. As a result, no disclosures are required under
the Corporations Act.
2.2 Remuneration Components
Our remuneration structure (detailed below) is designed to
support our remuneration strategy and is consistent between the
CEO and other Senior Executives in the KMP group. Some tailoring
may occur to take into account unique circumstances of an
individual role. Where this has occurred, we have specifically
disclosed it in this Report.
Section 2.2 provides a summary of the STI and LTI plan structures including clawback provisions and Section 2.3 summarises the percentage mix of fixed and at-risk components.
Attract, motivate and retain
highly skilled people
Reinforce values and
cultural priorities
Reward achievement of
fi nancial and strategic
objectives
Align to long term
shareholder value creation
FIXED AT RISK
Fixed Remuneration Short Term Incentive Long Term Incentive
CASH EQUITY
• Base salary and
superannuation.
• Set based on market
and internal relativities,
performance, qualifi cations
and experience.
• 75% of STI outcome paid in
September after the fi nancial
year end.
• STI outcome based on
Telstra’s fi nancial, NPS
and individual performance
measures.
• 25% of the STI outcome is
deferred into Telstra shares.
• Half of the shares are
deferred for 1 year and the
other half for 2 years.
• The shares are subject to
clawback at the discretion
of the Board. The shares are
forfeited if employment ends
unless departure is for a
Permitted Reason.
• Performance Rights subject
to performance conditions
and Restriction Period over
4 years.
• 50% subject to Relative
Total Shareholder Return.
• 50% subject to Free Cash-
fl ow Return on Investment.
• Performance is measured
over 3 years with an
additional restriction period
of approximately 1 year
before full ownership.
Base level of reward
competitive with the market
Encourages sustainable performance in the medium to longer term
and provides a retention element
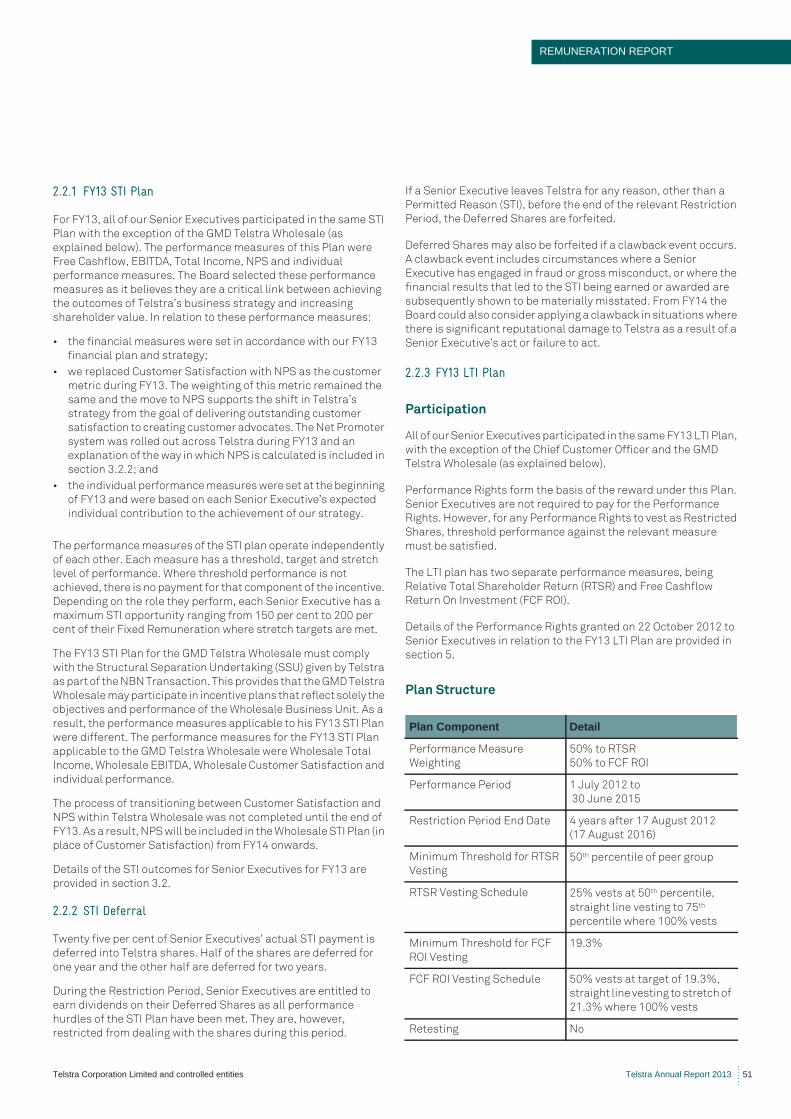
REMUNERATION REPORT
Telstra Corporation Limited and controlled entities Telstra Annual Report 2013 51
2.2.1 FY13 STI Plan
For FY13, all of our Senior Executives participated in the same STI
Plan with the exception of the GMD Telstra Wholesale (as
explained below). The performance measures of this Plan were
Free Cashflow, EBITDA, Total Income, NPS and individual
performance measures. The Board selected these performance
measures as it believes they are a critical link between achieving
the outcomes of Telstra’s business strategy and increasing
shareholder value. In relation to these performance measures:
• the financial measures were set in accordance with our FY13
financial plan and strategy;
• we replaced Customer Satisfaction with NPS as the customer
metric during FY13. The weighting of this metric remained the
same and the move to NPS supports the shift in Telstra’s
strategy from the goal of delivering outstanding customer
satisfaction to creating customer advocates. The Net Promoter
system was rolled out across Telstra during FY13 and an
explanation of the way in which NPS is calculated is included in
section 3.2.2; and
• the individual performance measures were set at the beginning
of FY13 and were based on each Senior Executive’s expected
individual contribution to the achievement of our strategy.
The performance measures of the STI plan operate independently
of each other. Each measure has a threshold, target and stretch
level of performance. Where threshold performance is not
achieved, there is no payment for that component of the incentive.
Depending on the role they perform, each Senior Executive has a
maximum STI opportunity ranging from 150 per cent to 200 per
cent of their Fixed Remuneration where stretch targets are met.
The FY13 STI Plan for the GMD Telstra Wholesale must comply
with the Structural Separation Undertaking (SSU) given by Telstra
as part of the NBN Transaction. This provides that the GMD Telstra
Wholesale may participate in incentive plans that reflect solely the
objectives and performance of the Wholesale Business Unit. As a
result, the performance measures applicable to his FY13 STI Plan
were different. The performance measures for the FY13 STI Plan
applicable to the GMD Telstra Wholesale were Wholesale Total
Income, Wholesale EBITDA, Wholesale Customer Satisfaction and
individual performance.
The process of transitioning between Customer Satisfaction and
NPS within Telstra Wholesale was not completed until the end of
FY13. As a result, NPS will be included in the Wholesale STI Plan (in
place of Customer Satisfaction) from FY14 onwards.
Details of the STI outcomes for Senior Executives for FY13 are
provided in section 3.2.
2.2.2 STI Deferral
Twenty five per cent of Senior Executives’ actual STI payment is
deferred into Telstra shares. Half of the shares are deferred for
one year and the other half are deferred for two years.
During the Restriction Period, Senior Executives are entitled to
earn dividends on their Deferred Shares as all performance
hurdles of the STI Plan have been met. They are, however,
restricted from dealing with the shares during this period.
If a Senior Executive leaves Telstra for any reason, other than a
Permitted Reason (STI), before the end of the relevant Restriction
Period, the Deferred Shares are forfeited.
Deferred Shares may also be forfeited if a clawback event occurs.
A clawback event includes circumstances where a Senior
Executive has engaged in fraud or gross misconduct, or where the
financial results that led to the STI being earned or awarded are
subsequently shown to be materially misstated. From FY14 the
Board could also consider applying a clawback in situations where
there is significant reputational damage to Telstra as a result of a
Senior Executive’s act or failure to act.
2.2.3 FY13 LTI Plan
Participation
All of our Senior Executives participated in the same FY13 LTI Plan,
with the exception of the Chief Customer Officer and the GMD
Telstra Wholesale (as explained below).
Performance Rights form the basis of the reward under this Plan.
Senior Executives are not required to pay for the Performance
Rights. However, for any Performance Rights to vest as Restricted
Shares, threshold performance against the relevant measure
must be satisfied.
The LTI plan has two separate performance measures, being
Relative Total Shareholder Return (RTSR) and Free Cashflow
Return On Investment (FCF ROI).
Details of the Performance Rights granted on 22 October 2012 to
Senior Executives in relation to the FY13 LTI Plan are provided in
section 5.
Plan Structure
Plan Component Detail
Performance Measure
Weighting
50% to RTSR
50% to FCF ROI
Performance Period 1 July 2012 to
30 June 2015
Restriction Period End Date 4 years after 17 August 2012
(17 August 2016)
Minimum Threshold for RTSR
Vesting
50th percentile of peer group
RTSR Vesting Schedule 25% vests at 50th percentile,
straight line vesting to 75th
percentile where 100% vests
Minimum Threshold for FCF
ROI Vesting
19.3%
FCF ROI Vesting Schedule 50% vests at target of 19.3%,
straight line vesting to stretch of
21.3% where 100% vests
Retesting No
REMUNERATION REPORT
52 Telstra Annual Report 2013 Telstra Corporation Limited and controlled entities
Relative Total Shareholder Return
RTSR measures the performance of an ordinary Telstra share
(including the value of any cash dividends and other shareholder
benefits paid during the period) relative to the other companies in
the comparator group over the same period.
The Board believes that RTSR is an appropriate performance
hurdle because it links executive reward to Telstra’s share price
performance relative to its global peers.
The comparator group for the FY13 LTI Plan included the following
large market capitalisation telecommunication firms: AT&T Inc;
Belgacom Group; Bell Canada Enterprises Inc; BT Group plc;
Deutsche Telekom AG; Orange SA; Koninklijke KPN N.V.; KT
Corporation; Nippon Telegraph & Telephone Corp; NTT DoCoMo
Inc; Portugal Telecom SGPS SA; Singapore Telecommunications
Ltd; SK Telecom Co Ltd; Sprint Nextel Corporation; Swisscom AG;
Telekom Austria AG; Telecom Italia Sp.A.; Telecom Corporation of
New Zealand Ltd; Telefonica S.A.; Telenor ASA; TeliaSonera AB;
Verizon Communications Inc and Vodafone Group plc.
During the performance period France Telecom SA changed its
name to Orange SA.
The Board has discretion to change members of the comparator
group under the Plan terms.
No amendments were made to the comparator group in FY13.
Free Cashflow Return On Investment
FCF ROI as determined by the Board is calculated by dividing the
average annual Free Cashflow (less finance costs) over the three
year performance period by Telstra’s average investment over the
same period.
The Board selected the FCF ROI measure as an absolute LTI target
on the basis that cash generation by the business is central to the
creation of shareholder value.
Vesting of Performance Rights as Restricted Shares
At the end of FY15, the Board will review Telstra’s audited financial
results for FCF ROI and RTSR to determine the percentage of
Performance Rights that vest as Restricted Shares under the FY13
LTI Plan.
Until the Performance Rights vest as Restricted Shares, a Senior
Executive has no legal or beneficial interest, no entitlement to
receive dividends and no voting rights in relation to any securities
granted under the FY13 LTI Plan.
If a Senior Executive leaves Telstra for any reason other than a
Permitted Reason (LTI), any Performance Rights lapse. If they
leave Telstra for a Permitted Reason (LTI) a pro rata number of
Performance Rights will lapse based on the proportion of time
remaining until 30 June 2016. The pro rata portion relating to the
Senior Executive’s completed service may still vest as Restricted
Shares subject to achieving the performance measures of the
FY13 LTI Plan at the end of the applicable performance period.
In certain limited circumstances, such as a takeover event where
50 per cent or more of all issued fully paid shares are acquired, the
Board may exercise discretion to vest Performance Rights that
have not lapsed as Restricted Shares.
Any Restricted Shares that are allocated based on the vesting of
Performance Rights are subject to a further Restriction Period
expiring in August 2016 which prevents a Senior Executive from
dealing with their Restricted Shares. If a Senior Executive leaves
Telstra for any reason other than a Permitted Reason (LTI) before
the end of the Restriction Period, the Restricted Shares are
forfeited.
Chief Customer Officer
An LTI Plan was put in place for the Chief Customer Officer in FY11,
as described in section 3.3.2 and Table 5.1. The Chief Customer
Officer does not participate in the FY13 LTI Plan, however will
participate in the LTI Plan for FY14 coinciding with his move to a
permanent contract from 1 July 2013.
GMD Telstra Wholesale
As disclosed in the 2012 Remuneration Report, due to SSU
requirements the GMD Telstra Wholesale participated in a
separate equity plan in lieu of the FY12 LTI Plan for other Senior
Executives.
In FY13, the GMD Telstra Wholesale was allocated 116,371
Restricted Shares based on performance against the FY12 STI
measures. Dividends are available on the Restricted Shares and
they are subject to a Restriction Period that will end in August
2015, which is aligned with the conclusion of the FY12 LTI Plan for
other Senior Executives.
If the GMD Telstra Wholesale leaves Telstra before the end of the
three year Restriction Period for any reason, other than a
Permitted Reason (STI), the Restricted Shares will be forfeited. If
he leaves for a Permitted Reason (STI) he will retain the Restricted
Shares.
The Restricted Shares may be forfeited if a clawback event occurs.
A clawback event includes circumstances where a Senior
Executive has engaged in fraud or gross misconduct, or where the
financial results that led to the shares being awarded are
subsequently shown to be materially misstated.
In lieu of participation in the Senior Executive FY13 LTI Plan the
GMD Telstra Wholesale will be allocated Restricted Shares based
on his performance against his FY13 plan measures, namely
Wholesale Total Income, Wholesale EBITDA, Wholesale Customer
Satisfaction and individual performance. Clawback provisions
relating to these Restricted Shares will be aligned with the STI
Deferral Plan for other Senior Executives.
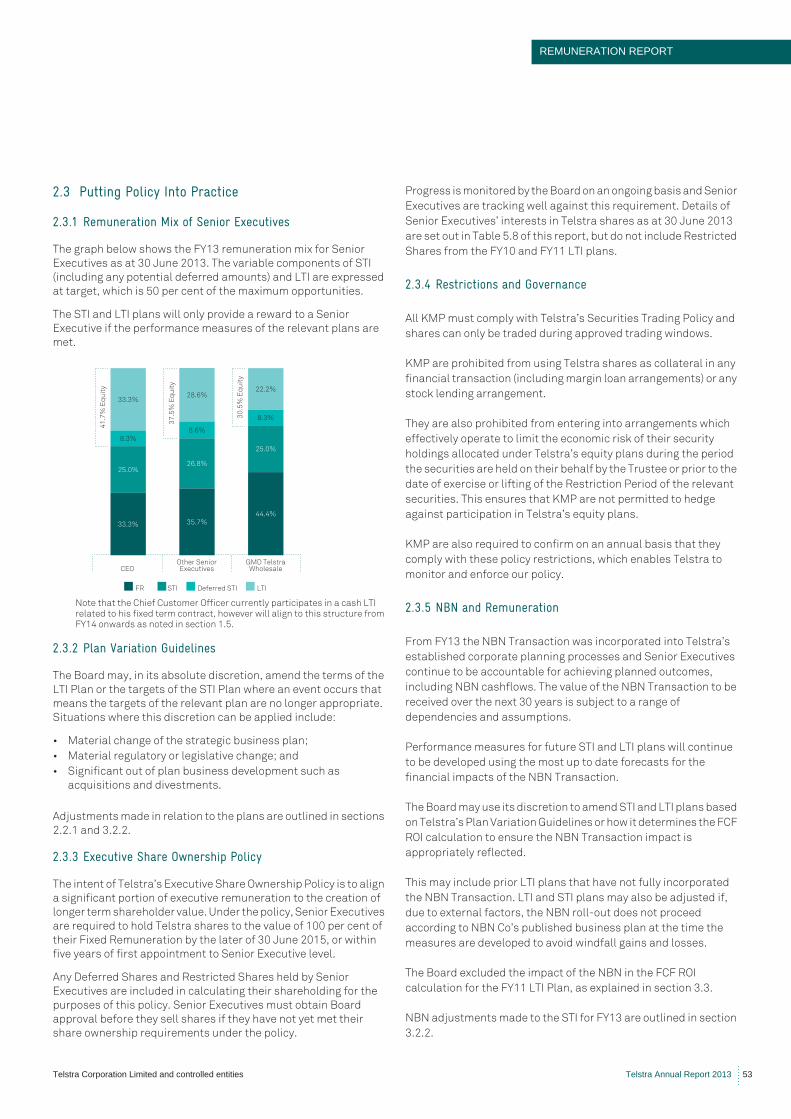
REMUNERATION REPORT
Telstra Corporation Limited and controlled entities Telstra Annual Report 2013 53
2.3 Putting Policy Into Practice
2.3.1 Remuneration Mix of Senior Executives
The graph below shows the FY13 remuneration mix for Senior
Executives as at 30 June 2013. The variable components of STI
(including any potential deferred amounts) and LTI are expressed
at target, which is 50 per cent of the maximum opportunities.
The STI and LTI plans will only provide a reward to a Senior
Executive if the performance measures of the relevant plans are
met.
Note that the Chief Customer Officer currently participates in a cash LTI related to his fixed term contract, however will align to this structure from FY14 onwards as noted in section 1.5.
2.3.2 Plan Variation Guidelines
The Board may, in its absolute discretion, amend the terms of the
LTI Plan or the targets of the STI Plan where an event occurs that
means the targets of the relevant plan are no longer appropriate.
Situations where this discretion can be applied include:
• Material change of the strategic business plan;
• Material regulatory or legislative change; and
• Significant out of plan business development such as
acquisitions and divestments.
Adjustments made in relation to the plans are outlined in sections
2.2.1 and 3.2.2.
2.3.3 Executive Share Ownership Policy
The intent of Telstra’s Executive Share Ownership Policy is to align
a significant portion of executive remuneration to the creation of
longer term shareholder value. Under the policy, Senior Executives
are required to hold Telstra shares to the value of 100 per cent of
their Fixed Remuneration by the later of 30 June 2015, or within
five years of first appointment to Senior Executive level.
Any Deferred Shares and Restricted Shares held by Senior
Executives are included in calculating their shareholding for the
purposes of this policy. Senior Executives must obtain Board
approval before they sell shares if they have not yet met their
share ownership requirements under the policy.
Progress is monitored by the Board on an ongoing basis and Senior
Executives are tracking well against this requirement. Details of
Senior Executives’ interests in Telstra shares as at 30 June 2013
are set out in Table 5.8 of this report, but do not include Restricted
Shares from the FY10 and FY11 LTI plans.
2.3.4 Restrictions and Governance
All KMP must comply with Telstra’s Securities Trading Policy and
shares can only be traded during approved trading windows.
KMP are prohibited from using Telstra shares as collateral in any
financial transaction (including margin loan arrangements) or any
stock lending arrangement.
They are also prohibited from entering into arrangements which
effectively operate to limit the economic risk of their security
holdings allocated under Telstra’s equity plans during the period
the securities are held on their behalf by the Trustee or prior to the
date of exercise or lifting of the Restriction Period of the relevant
securities. This ensures that KMP are not permitted to hedge
against participation in Telstra’s equity plans.
KMP are also required to confirm on an annual basis that they
comply with these policy restrictions, which enables Telstra to
monitor and enforce our policy.
2.3.5 NBN and Remuneration
From FY13 the NBN Transaction was incorporated into Telstra’s
established corporate planning processes and Senior Executives
continue to be accountable for achieving planned outcomes,
including NBN cashflows. The value of the NBN Transaction to be
received over the next 30 years is subject to a range of
dependencies and assumptions.
Performance measures for future STI and LTI plans will continue
to be developed using the most up to date forecasts for the
financial impacts of the NBN Transaction.
The Board may use its discretion to amend STI and LTI plans based
on Telstra’s Plan Variation Guidelines or how it determines the FCF
ROI calculation to ensure the NBN Transaction impact is
appropriately reflected.
This may include prior LTI plans that have not fully incorporated
the NBN Transaction. LTI and STI plans may also be adjusted if,
due to external factors, the NBN roll-out does not proceed
according to NBN Co’s published business plan at the time the
measures are developed to avoid windfall gains and losses.
The Board excluded the impact of the NBN in the FCF ROI
calculation for the FY11 LTI Plan, as explained in section 3.3.
NBN adjustments made to the STI for FY13 are outlined in section
3.2.2.
CEO
FR STI Deferred STI LTI
41
.7%
Eq
uit
y
37
.5%
Eq
uit
y
30
.5%
Eq
uit
y
Other Senior Executives
GMD Telstra Wholesale
33.3%28.6%
22.2%
8.3%8.6%
8.3%
25.0%26.8%
25.0%
33.3% 35.7%44.4%
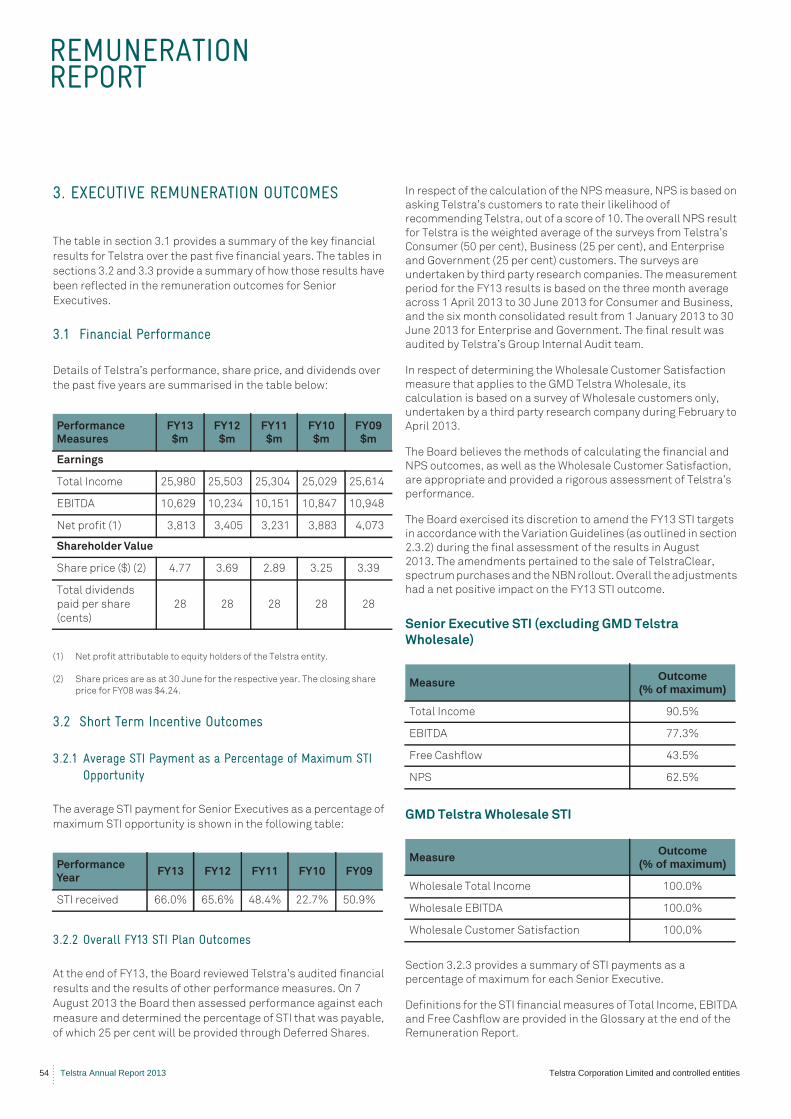
REMUNERATION REPORT
54 Telstra Annual Report 2013 Telstra Corporation Limited and controlled entities
3. EXECUTIVE REMUNERATION OUTCOMES
The table in section 3.1 provides a summary of the key financial
results for Telstra over the past five financial years. The tables in
sections 3.2 and 3.3 provide a summary of how those results have
been reflected in the remuneration outcomes for Senior
Executives.
3.1 Financial Performance
Details of Telstra’s performance, share price, and dividends over
the past five years are summarised in the table below:
(1) Net profit attributable to equity holders of the Telstra entity.
(2) Share prices are as at 30 June for the respective year. The closing share
price for FY08 was $4.24.
3.2 Short Term Incentive Outcomes
3.2.1 Average STI Payment as a Percentage of Maximum STI Opportunity
The average STI payment for Senior Executives as a percentage of
maximum STI opportunity is shown in the following table:
3.2.2 Overall FY13 STI Plan Outcomes
At the end of FY13, the Board reviewed Telstra’s audited financial
results and the results of other performance measures. On 7
August 2013 the Board then assessed performance against each
measure and determined the percentage of STI that was payable,
of which 25 per cent will be provided through Deferred Shares.
In respect of the calculation of the NPS measure, NPS is based on
asking Telstra’s customers to rate their likelihood of
recommending Telstra, out of a score of 10. The overall NPS result
for Telstra is the weighted average of the surveys from Telstra’s
Consumer (50 per cent), Business (25 per cent), and Enterprise
and Government (25 per cent) customers. The surveys are
undertaken by third party research companies. The measurement
period for the FY13 results is based on the three month average
across 1 April 2013 to 30 June 2013 for Consumer and Business,
and the six month consolidated result from 1 January 2013 to 30
June 2013 for Enterprise and Government. The final result was
audited by Telstra’s Group Internal Audit team.
In respect of determining the Wholesale Customer Satisfaction
measure that applies to the GMD Telstra Wholesale, its
calculation is based on a survey of Wholesale customers only,
undertaken by a third party research company during February to
April 2013.
The Board believes the methods of calculating the financial and
NPS outcomes, as well as the Wholesale Customer Satisfaction,
are appropriate and provided a rigorous assessment of Telstra’s
performance.
The Board exercised its discretion to amend the FY13 STI targets
in accordance with the Variation Guidelines (as outlined in section
2.3.2) during the final assessment of the results in August
2013. The amendments pertained to the sale of TelstraClear,
spectrum purchases and the NBN rollout. Overall the adjustments
had a net positive impact on the FY13 STI outcome.
Senior Executive STI (excluding GMD Telstra
Wholesale)
GMD Telstra Wholesale STI
Section 3.2.3 provides a summary of STI payments as a
percentage of maximum for each Senior Executive.
Definitions for the STI financial measures of Total Income, EBITDA
and Free Cashflow are provided in the Glossary at the end of the
Remuneration Report.
Performance Measures
FY13$m
FY12$m
FY11$m
FY10$m
FY09$m
Earnings
Total Income 25,980 25,503 25,304 25,029 25,614
EBITDA 10,629 10,234 10,151 10,847 10,948
Net profit (1) 3,813 3,405 3,231 3,883 4,073
Shareholder Value
Share price ($) (2) 4.77 3.69 2.89 3.25 3.39
Total dividends
paid per share
(cents)
28 28 28 28 28
Performance Year
FY13 FY12 FY11 FY10 FY09
STI received 66.0% 65.6% 48.4% 22.7% 50.9%
MeasureOutcome
(% of maximum)
Total Income 90.5%
EBITDA 77.3%
Free Cashflow 43.5%
NPS 62.5%
MeasureOutcome
(% of maximum)
Wholesale Total Income 100.0%
Wholesale EBITDA 100.0%
Wholesale Customer Satisfaction 100.0%
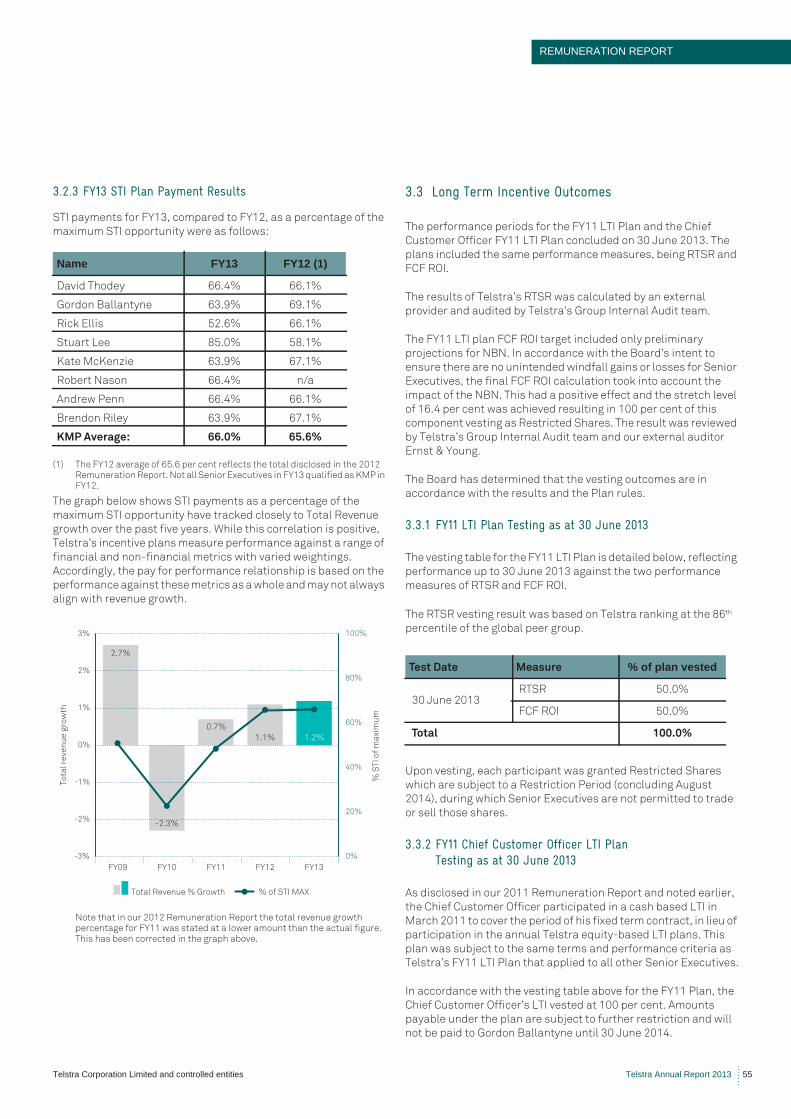
REMUNERATION REPORT
Telstra Corporation Limited and controlled entities Telstra Annual Report 2013 55
3.2.3 FY13 STI Plan Payment Results
STI payments for FY13, compared to FY12, as a percentage of the
maximum STI opportunity were as follows:
(1) The FY12 average of 65.6 per cent reflects the total disclosed in the 2012 Remuneration Report. Not all Senior Executives in FY13 qualified as KMP in FY12.
The graph below shows STI payments as a percentage of the
maximum STI opportunity have tracked closely to Total Revenue
growth over the past five years. While this correlation is positive,
Telstra’s incentive plans measure performance against a range of
financial and non-financial metrics with varied weightings.
Accordingly, the pay for performance relationship is based on the
performance against these metrics as a whole and may not always
align with revenue growth.
Note that in our 2012 Remuneration Report the total revenue growth percentage for FY11 was stated at a lower amount than the actual figure. This has been corrected in the graph above.
3.3 Long Term Incentive Outcomes
The performance periods for the FY11 LTI Plan and the Chief
Customer Officer FY11 LTI Plan concluded on 30 June 2013. The
plans included the same performance measures, being RTSR and
FCF ROI.
The results of Telstra’s RTSR was calculated by an external
provider and audited by Telstra’s Group Internal Audit team.
The FY11 LTI plan FCF ROI target included only preliminary
projections for NBN. In accordance with the Board’s intent to
ensure there are no unintended windfall gains or losses for Senior
Executives, the final FCF ROI calculation took into account the
impact of the NBN. This had a positive effect and the stretch level
of 16.4 per cent was achieved resulting in 100 per cent of this
component vesting as Restricted Shares. The result was reviewed
by Telstra’s Group Internal Audit team and our external auditor
Ernst & Young.
The Board has determined that the vesting outcomes are in
accordance with the results and the Plan rules.
3.3.1 FY11 LTI Plan Testing as at 30 June 2013
The vesting table for the FY11 LTI Plan is detailed below, reflecting
performance up to 30 June 2013 against the two performance
measures of RTSR and FCF ROI.
The RTSR vesting result was based on Telstra ranking at the 86th
percentile of the global peer group.
Upon vesting, each participant was granted Restricted Shares
which are subject to a Restriction Period (concluding August
2014), during which Senior Executives are not permitted to trade
or sell those shares.
3.3.2 FY11 Chief Customer Officer LTI Plan Testing as at 30 June 2013
As disclosed in our 2011 Remuneration Report and noted earlier,
the Chief Customer Officer participated in a cash based LTI in
March 2011 to cover the period of his fixed term contract, in lieu of
participation in the annual Telstra equity-based LTI plans. This
plan was subject to the same terms and performance criteria as
Telstra’s FY11 LTI Plan that applied to all other Senior Executives.
In accordance with the vesting table above for the FY11 Plan, the
Chief Customer Officer’s LTI vested at 100 per cent. Amounts
payable under the plan are subject to further restriction and will
not be paid to Gordon Ballantyne until 30 June 2014.
Name FY13 FY12 (1)
David Thodey 66.4% 66.1%
Gordon Ballantyne 63.9% 69.1%
Rick Ellis 52.6% 66.1%
Stuart Lee 85.0% 58.1%
Kate McKenzie 63.9% 67.1%
Robert Nason 66.4% n/a
Andrew Penn 66.4% 66.1%
Brendon Riley 63.9% 67.1%
KMP Average: 66.0% 65.6%
-3%
-2%
-1%
0%
1%
2%
3%
0%
20%
40%
60%
80%
100%
FY09
Total Revenue % Growth % of STI MAX
FY10
-2.3%
2.7%
0.7%
1.1% 1.2%
FY11 FY12 FY13
% S
TI
of
ma
xim
um
To
tal
reve
nu
e g
row
th
Test Date Measure % of plan vested
30 June 2013 RTSR 50.0%
FCF ROI 50.0%
Total 100.0%
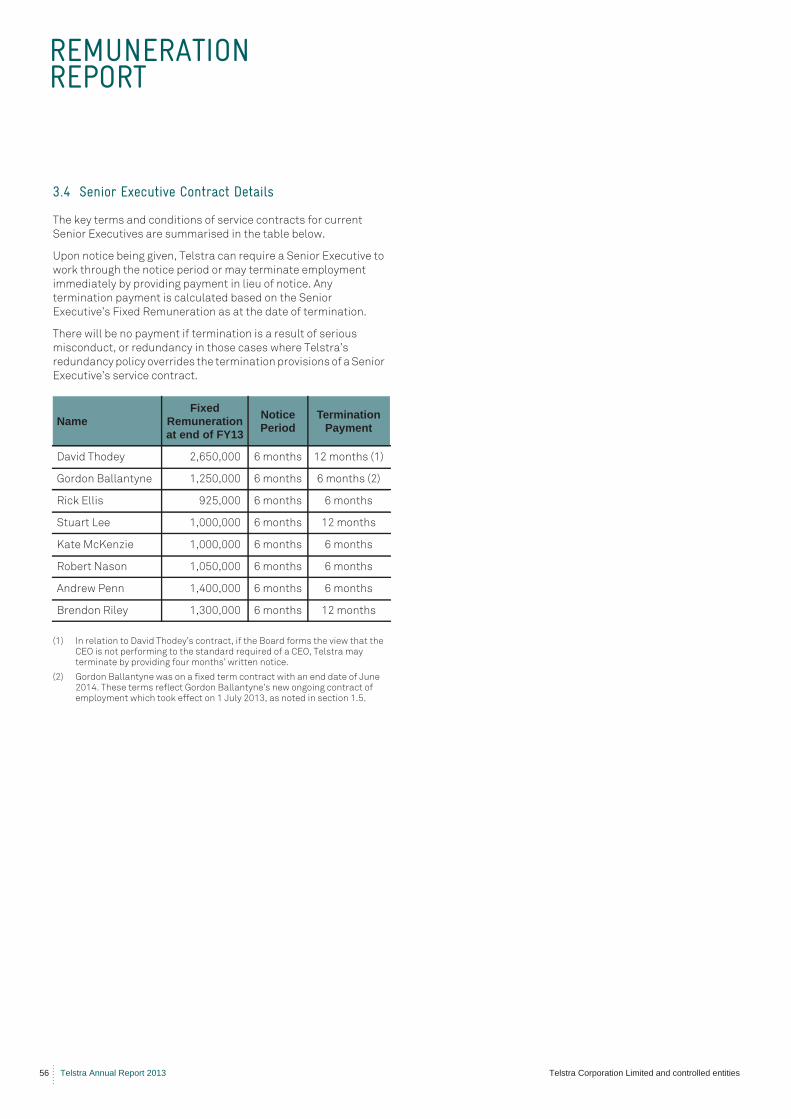
REMUNERATION REPORT
56 Telstra Annual Report 2013 Telstra Corporation Limited and controlled entities
3.4 Senior Executive Contract Details
The key terms and conditions of service contracts for current
Senior Executives are summarised in the table below.
Upon notice being given, Telstra can require a Senior Executive to
work through the notice period or may terminate employment
immediately by providing payment in lieu of notice. Any
termination payment is calculated based on the Senior
Executive’s Fixed Remuneration as at the date of termination.
There will be no payment if termination is a result of serious
misconduct, or redundancy in those cases where Telstra’s
redundancy policy overrides the termination provisions of a Senior
Executive’s service contract.
(1) In relation to David Thodey’s contract, if the Board forms the view that the CEO is not performing to the standard required of a CEO, Telstra may terminate by providing four months’ written notice.
(2) Gordon Ballantyne was on a fixed term contract with an end date of June 2014. These terms reflect Gordon Ballantyne’s new ongoing contract of employment which took effect on 1 July 2013, as noted in section 1.5.
NameFixed
Remuneration at end of FY13
NoticePeriod
TerminationPayment
David Thodey 2,650,000 6 months 12 months (1)
Gordon Ballantyne 1,250,000 6 months 6 months (2)
Rick Ellis 925,000 6 months 6 months
Stuart Lee 1,000,000 6 months 12 months
Kate McKenzie 1,000,000 6 months 6 months
Robert Nason 1,050,000 6 months 6 months
Andrew Penn 1,400,000 6 months 6 months
Brendon Riley 1,300,000 6 months 12 months
REMUNERATION REPORT
Telstra Corporation Limited and controlled entities Telstra Annual Report 2013 57
4. NON-EXECUTIVE DIRECTOR REMUNERATION
4.1 Remuneration Structure
The Telstra Board and Committee fee structure (inclusive of
superannuation) during FY13 was:
(1) The Technology Committee ceased operation on 14 June 2013.
The Chairman of the Board does not receive Committee fees in
respect of her role as a Chair or a member of any Board Committee.
As disclosed in our 2012 Remuneration Report, effective 1 July
2012 the annual Board fee for non-executive Directors was
increased to $235,000, and to $705,000 for the Chairman
(representing an increase of 3.7 per cent). There was no increase
in Committee fees. No increase in Board or Committee fees is
contemplated for FY14.
Telstra’s non-executive Directors are remunerated in accordance
with Telstra’s Constitution, which provides for an aggregate fee
pool which is set and varied only by approval of a resolution of
shareholders at the annual general meeting (AGM). The current
annual fee pool of $3.5 million was approved by shareholders at
Telstra’s 2012 AGM.
The total of Board and Committee fees, including superannuation,
paid to non-executive Directors in FY13 remained within the
approved fee pool.
4.2 Remuneration Policy and Strategy
Telstra’s non-executive Directors are remunerated with set fees
and do not receive any performance based pay. This enables non-
executive Directors to maintain independence and impartiality
when making decisions affecting the future direction of the
company.
To align the non-executive Directors’ interests with the interests
of our shareholders, the Board has established guidelines to
encourage non-executive Directors to hold Telstra shares
equivalent to at least 50 per cent of their annual fees. Such shares
are to be acquired over a five year period from the later of 1 July
2009 or the date of appointment.
Progress is monitored on an ongoing basis and non-executive
Directors are tracking well against the guidelines. Details of non-
executive Directors’ interests in Telstra shares as at 30 June 2013
are set out in Table 5.8 of this report.
4.3 Remuneration Components
Superannuation contributions, in accordance with legislation and
Telstra policy, are included within each non-executive Director’s
Total Remuneration. Non-executive Directors may choose to
increase the proportion of their remuneration taken as
superannuation, subject to legislative requirements.
Telstra does not provide retirement benefits for non-executive
Directors other than superannuation contributions.
Table 5.7 provides full details of non-executive Director
remuneration for FY13.
Section 2.3.4 of this Report provides details on the Telstra
securities trading restrictions which apply to all KMP, including
non-executive Directors.
Board Fees Chairman Non-executive Director
Board 705,000 235,000
Committee Fees Committee Chair
Committee Member
Audit Committee 70,000 35,000
Remuneration Committee 50,000 25,000
Nomination Committee - 7,000
Technology Committee (1) 7,000 7,000
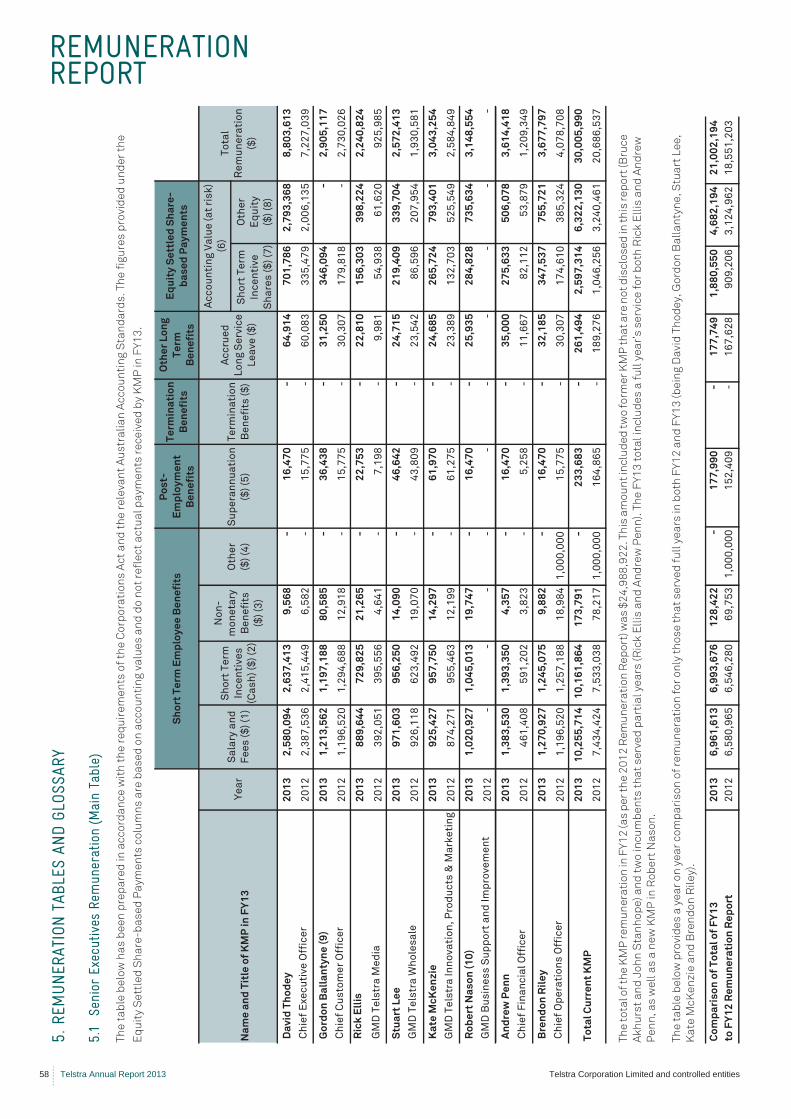
REMUNERATION REPORT
58 Telstra Annual Report 2013 Telstra Corporation Limited and controlled entities
5. R
EMUN
ERAT
ION
TABL
ES A
ND G
LOSS
ARY
5.1
Seni
or E
xecu
tives
Rem
uner
atio
n (M
ain
Tabl
e)
Th
e t
ab
le b
elo
w h
as
be
en
pre
pa
red
in
ac
co
rda
nc
e w
ith
th
e r
eq
uir
em
en
ts o
f th
e C
orp
ora
tio
ns
Ac
t a
nd
th
e r
ele
van
t A
us
tra
lia
n A
cc
ou
nti
ng
Sta
nd
ard
s.
Th
e f
igu
res
pro
vid
ed
un
de
r th
e
Eq
uit
y S
ett
led
Sh
are
-ba
se
d P
ay
me
nts
co
lum
ns
are
ba
se
d o
n a
cc
ou
nti
ng
va
lue
s a
nd
do
no
t re
fle
ct
ac
tua
l p
ay
me
nts
re
ce
ive
d b
y K
MP
in
FY
13
.
Th
e t
ota
l of
the
KM
P r
em
un
era
tio
n in
FY
12
(as
pe
r th
e 2
01
2 R
em
un
era
tio
n R
ep
ort
) wa
s $
24
,98
8,9
22
. Th
is a
mo
un
t in
clu
de
d t
wo
fo
rme
r K
MP
th
at
are
no
t d
isc
los
ed
in t
his
re
po
rt (B
ruc
e
Ak
hu
rst
an
d J
oh
n S
tan
ho
pe
) a
nd
tw
o i
nc
um
be
nts
th
at
se
rve
d p
art
ial
ye
ars
(R
ick
Ell
is a
nd
An
dre
w P
en
n).
Th
e F
Y1
3 t
ota
l in
clu
de
s a
fu
ll y
ea
r’s
se
rvic
e f
or
bo
th R
ick
Ell
is a
nd
An
dre
w
Pe
nn
, a
s w
ell
as
a n
ew
KM
P i
n R
ob
ert
Na
so
n.
Th
e t
ab
le b
elo
w p
rovi
de
s a
ye
ar
on
ye
ar
co
mp
ari
so
n o
f re
mu
ne
rati
on
fo
r o
nly
th
os
e t
ha
t s
erv
ed
fu
ll y
ea
rs in
bo
th F
Y1
2 a
nd
FY
13
(b
ein
g D
avi
d T
ho
de
y, G
ord
on
Ba
lla
nty
ne
, Stu
art
Le
e,
Ka
te M
cK
en
zie
an
d B
ren
do
n R
ile
y).
Sh
ort
Te
rm E
mp
loy
ee
Be
ne
fits
Po
st-
Em
plo
ym
en
t
Be
ne
fits
Te
rmin
ati
on
Be
ne
fits
Oth
er
Lo
ng
Te
rm
Be
ne
fits
Eq
uit
y S
ett
led
Sh
are
-
ba
se
d P
ay
me
nts
Na
me
an
d T
itle
of
KM
P i
n F
Y1
3Y
ea
rS
ala
ry a
nd
Fe
es
($
) (1
)
Sh
ort
Te
rm
Inc
en
tiv
es
(Ca
sh
) ($
) (2
)
No
n-
mo
ne
tary
Be
ne
fits
($)
(3)
Oth
er
($)
(4)
Su
pe
ran
nu
ati
on
($)
(5)
Te
rmin
ati
on
Be
ne
fits
($
)
Ac
cru
ed
Lo
ng
Se
rvic
e
Le
av
e (
$)
Ac
co
un
tin
g V
alu
e (
at
ris
k)
(6)
To
tal
Re
mu
ne
rati
on
($)
Sh
ort
Te
rm
Inc
en
tiv
e
Sh
are
s (
$)
(7)
Oth
er
Eq
uit
y
($)
(8)
Da
vid
Th
od
ey
20
13
2,5
80
,09
4 2
,63
7,4
13
9,5
68
- 1
6,4
70
- 6
4,9
14
70
1,7
86
2,7
93
,36
8 8
,80
3,6
13
Ch
ief
Ex
ec
uti
ve
Off
ice
r2
01
2 2
,38
7,5
36
2,4
15
,44
9 6
,58
2 -
15
,77
5 -
60
,08
3 3
35
,47
9 2
,00
6,1
35
7,2
27
,03
9
Go
rdo
n B
all
an
tyn
e (
9)
20
13
1,2
13
,56
2 1
,19
7,1
88
80
,58
5 -
36
,43
8 -
31
,25
0 3
46
,09
4 -
2,9
05
,11
7
Ch
ief
Cu
sto
me
r O
ffic
er
20
12
1,1
96
,52
0 1
,29
4,6
88
12
,91
8 -
15
,77
5 -
30
,30
7 1
79
,81
8 -
2,7
30
,02
6
Ric
k E
llis
20
13
88
9,6
44
72
9,8
25
21
,26
5 -
22
,75
3 -
22
,81
0 1
56
,30
3 3
98
,22
4 2
,24
0,8
24
GM
D T
els
tra
Me
dia
20
12
39
2,0
51
39
5,5
56
4,6
41
- 7
,19
8 -
9,9
81
54
,93
8 6
1,6
20
92
5,9
85
Stu
art
Le
e2
01
3 9
71
,60
3 9
56
,25
0 1
4,0
90
- 4
6,6
42
- 2
4,7
15
21
9,4
09
33
9,7
04
2,5
72
,41
3
GM
D T
els
tra
Wh
ole
sa
le2
01
2 9
26
,11
8 6
23
,49
2 1
9,0
70
- 4
3,8
09
- 2
3,5
42
86
,59
6 2
07
,95
4 1
,93
0,5
81
Ka
te M
cK
en
zie
20
13
92
5,4
27
95
7,7
50
14
,29
7 -
61
,97
0 -
24
,68
5 2
65
,72
4 7
93
,40
1 3
,04
3,2
54
GM
D T
els
tra
In
no
va
tio
n,
Pro
du
cts
& M
ark
eti
ng
20
12
87
4,2
71
95
5,4
63
12
,19
9 -
61
,27
5 -
23
,38
9 1
32
,70
3 5
25
,54
9 2
,58
4,8
49
Ro
be
rt N
as
on
(1
0)
20
13
1,0
20
,92
7 1
,04
5,0
13
19
,74
7 -
16
,47
0 -
25
,93
5 2
84
,82
8 7
35
,63
4 3
,14
8,5
54
GM
D B
us
ine
ss
Su
pp
ort
an
d I
mp
rov
em
en
t2
01
2 -
- -
- -
- -
- -
-
An
dre
w P
en
n2
01
3 1
,38
3,5
30
1,3
93
,35
0 4
,35
7 -
16
,47
0 -
35
,00
0 2
75
,63
3 5
06
,07
8 3
,61
4,4
18
Ch
ief
Fin
an
cia
l O
ffic
er
20
12
46
1,4
08
59
1,2
02
3,8
23
- 5
,25
8 -
11
,66
7 8
2,1
12
53
,87
9 1
,20
9,3
49
Bre
nd
on
Ril
ey
20
13
1,2
70
,92
7 1
,24
5,0
75
9,8
82
- 1
6,4
70
- 3
2,1
85
34
7,5
37
75
5,7
21
3,6
77
,79
7
Ch
ief
Op
era
tio
ns
Off
ice
r2
01
2 1
,19
6,5
20
1,2
57
,18
81
8,9
84
1,0
00
,00
0 1
5,7
75
- 3
0,3
07
17
4,6
10
38
5,3
24
4,0
78
,70
8
To
tal
Cu
rre
nt
KM
P2
01
31
0,2
55
,71
41
0,1
61
,86
4 1
73
,79
1 -
23
3,6
83
- 2
61
,49
4 2
,59
7,3
14
6,3
22
,13
0 3
0,0
05
,99
0
20
12
7,4
34
,42
4 7
,53
3,0
38
78
,21
71
,00
0,0
00
16
4,8
65
- 1
89
,27
61
,04
6,2
56
3,2
40
,46
12
0,6
86
,53
7
Co
mp
ari
so
n o
f T
ota
l o
f F
Y1
32
01
3 6
,96
1,6
13
6,9
93
,67
6 1
28
,42
2 -
17
7,9
90
- 1
77
,74
91
,88
0,5
50
4,6
82
,19
4 2
1,0
02
,19
4
to F
Y1
2 R
em
un
era
tio
n R
ep
ort
20
12
6,5
80
,96
56
,54
6,2
80
69
,75
31
,00
0,0
00
15
2,4
09
-1
67
,62
8 9
09
,20
6 3
,12
4,9
62
18
,55
1,2
03
REMUNERATION REPORT
Telstra Corporation Limited and controlled entities Telstra Annual Report 2013 59
Fo
otn
ote
s t
o T
ab
le 5
.1:
(1)
Inc
lud
es
sa
lary
, s
ala
ry s
ac
rifi
ce
be
ne
fits
(e
xclu
din
g s
ala
ry s
ac
rifi
ce
su
pe
ran
nu
ati
on
wh
ich
is
in
clu
de
d u
nd
er
Su
pe
ran
nu
ati
on
) a
nd
fri
ng
e b
en
efi
ts t
ax
.
(2)
Sh
ort
te
rm i
nc
en
tive
s (
ca
sh
) re
late
s t
o p
erf
orm
an
ce
in
FY
12
an
d F
Y1
3 r
es
pe
cti
vely
an
d i
s b
as
ed
on
ac
tua
l p
erf
orm
an
ce
fo
r T
els
tra
an
d t
he
in
div
idu
al.
(3)
Inc
lud
es
th
e b
en
efi
t o
f n
on
re
co
urs
e lo
an
s u
nd
er
TE
SO
P9
9 (
wh
ich
ha
ve n
ot
be
en
exp
en
se
d a
s t
he
y w
ere
iss
ue
d p
rio
r to
7 N
ove
mb
er
20
02
an
d w
ere
th
ere
fore
inc
lud
ed
in t
he
ex
em
pti
on
pe
rmit
ted
un
de
r A
AS
B 1
“F
irs
t-ti
me
Ad
op
tio
n o
f A
us
tra
lia
n E
qu
iva
len
ts t
o In
tern
ati
on
al
Fin
an
cia
l R
ep
ort
ing
Sta
nd
ard
s”)
, th
e v
alu
e o
f p
ers
on
al
ho
me
se
cu
rity
se
rvic
es
pro
vid
ed
by
Te
lstr
a a
nd
th
e v
alu
e o
f th
e p
ers
on
al
us
e o
f p
rod
uc
ts a
nd
se
rvic
es
re
late
d t
o T
els
tra
em
plo
ym
en
t a
nd
th
e v
alu
e o
f p
ers
on
al
tra
vel
co
sts
(a
s p
er
the
co
ntr
ac
tua
l a
rra
ng
em
en
ts f
or
Go
rdo
n B
all
an
tyn
e).
(4)
Inc
lud
es
th
e s
ec
on
d a
nd
fin
al
tra
nc
he
of
a s
ign
-on
bo
nu
s f
or
Bre
nd
on
Ril
ey
.
(5)
Re
pre
se
nts
co
mp
an
y c
on
trib
uti
on
s t
o s
up
era
nn
ua
tio
n a
s w
ell
as
an
y a
dd
itio
na
l s
up
era
nn
ua
tio
n c
on
trib
uti
on
s m
ad
e t
hro
ug
h s
ala
ry s
ac
rifi
ce
by
Se
nio
r E
xe
cu
tive
s.
(6)
In a
cc
ord
an
ce
wit
h A
AS
B 2
, th
e a
cc
ou
nti
ng
va
lue
re
pre
se
nts
a p
ort
ion
of
the
fa
ir v
alu
e o
f O
pti
on
s,
Pe
rfo
rma
nc
e R
igh
ts,
Re
str
icte
d S
ha
res
, D
efe
rre
d S
ha
res
an
d P
erf
orm
an
ce
Sh
are
s t
ha
t h
ad
no
t y
et
full
y v
es
ted
as
a
t th
e c
om
me
nc
em
en
t o
f th
e f
ina
nc
ial y
ea
r. T
his
va
lue
inc
lud
es
an
as
su
mp
tio
n t
ha
t O
pti
on
s, P
erf
orm
an
ce
Rig
hts
, Re
str
icte
d S
ha
res
, De
ferr
ed
Sh
are
s a
nd
Pe
rfo
rma
nc
e S
ha
res
wil
l ve
st
at
the
en
d o
f th
e v
es
tin
g p
eri
od
. T
he
am
ou
nt
inc
lud
ed
as
re
mu
ne
rati
on
is n
ot
rela
ted
to
, no
r in
dic
ati
ve o
f th
e b
en
efi
t (i
f a
ny
) th
at
ma
y u
ltim
ate
ly b
e r
ea
lis
ed
by
ea
ch
Se
nio
r E
xec
uti
ve s
ho
uld
th
e O
pti
on
s b
ec
om
e e
xe
rcis
ab
le o
r th
e P
erf
orm
an
ce
Rig
hts
, R
es
tric
ted
Sh
are
s,
De
ferr
ed
Sh
are
s a
nd
Pe
rfo
rma
nc
e S
ha
res
be
re
lea
se
d f
rom
re
str
icti
on
. Th
e a
cc
ou
nti
ng
va
lue
inc
lud
es
th
e n
eg
ati
ve a
mo
un
t fo
r O
pti
on
s a
nd
Pe
rfo
rma
nc
e R
igh
ts l
ap
se
d d
uri
ng
th
e y
ea
r th
at
fail
ed
to
sa
tis
fy n
on
-ma
rke
t (i
.e.
no
n-R
TS
R)
pe
rfo
rma
nc
e t
arg
ets
. R
efe
r to
fo
otn
ote
(8
) a
nd
Ta
ble
5.4
fo
r fu
rth
er
info
rma
tio
n.
(7)
Th
is i
nc
lud
es
th
e v
alu
e o
f D
efe
rre
d S
ha
res
all
oc
ate
d u
nd
er
the
FY
12
an
d F
Y1
3 S
TI
pla
ns
wh
ere
by
25
pe
r c
en
t o
f th
e S
TI
pa
ym
en
t w
as
pro
vid
ed
as
De
ferr
ed
Sh
are
s t
o b
e d
istr
ibu
ted
eve
nly
ove
r o
ne
an
d t
wo
ye
ars
on
th
e a
nn
ive
rsa
ry o
f th
eir
all
oc
ati
on
da
te,
su
bje
ct
to t
he
Se
nio
r E
xec
uti
ve’s
co
nti
nu
ed
em
plo
ym
en
t. T
he
pri
or
ye
ar
am
ou
nts
ha
ve b
ee
n r
es
tate
d t
o i
nc
orp
ora
te a
mo
rtis
ati
on
ove
r th
e R
es
tric
tio
n P
eri
od
.
(8)
As
re
qu
ire
d u
nd
er
AA
SB
2,
ac
co
un
tin
g e
xpe
ns
e t
ha
t w
as
pre
vio
us
ly r
ec
og
nis
ed
as
re
mu
ne
rati
on
ha
s b
ee
n r
eve
rse
d i
n F
Y1
2.
Fo
r F
Y1
2,
this
oc
cu
rre
d f
or
the
FY
09
LT
I p
lan
th
at
fail
ed
to
sa
tis
fy n
on
-ma
rke
t (i
.e.
no
n-
RT
SR
) p
erf
orm
an
ce
ta
rge
ts a
t 3
0 J
un
e 2
01
2,
res
ult
ing
in
eq
uit
y i
ns
tru
me
nts
la
ps
ing
. F
or
ma
rke
t b
as
ed
hu
rdle
s (
i.e
. R
TS
R)
an
ac
co
un
tin
g v
alu
e i
s r
ec
ord
ed
ab
ove
, h
ow
eve
r th
e r
ele
van
t K
MP
re
ce
ive
d n
o v
alu
e f
rom
th
os
e e
qu
ity
in
str
um
en
ts t
ha
t la
ps
ed
in
FY
12
. T
he
re w
as
no
ac
co
un
tin
g e
xpe
ns
e t
ha
t w
as
re
vers
ed
in
FY
13
. R
efe
r to
th
e s
ec
tio
n 3
.3 o
n L
TI
ou
tco
me
s f
or
FY
13
fo
r fu
rth
er
info
rma
tio
n.
(9)
Go
rdo
n B
all
an
tyn
e d
id n
ot
pa
rtic
ipa
te in
an
y L
TI f
or
FY
13
du
e t
o t
he
fix
ed
te
rm n
atu
re (
fou
r y
ea
rs)
of
his
init
ial
em
plo
ym
en
t c
on
tra
ct.
He
pa
rtic
ipa
ted
in a
ca
sh
ba
se
d L
TI b
eg
inn
ing
7 M
arc
h 2
01
1 (
de
tail
s o
f w
hic
h a
re
inc
lud
ed
in T
els
tra
’s 2
01
1 R
em
un
era
tio
n R
ep
ort
). T
he
str
etc
h le
vels
of
FC
F R
OI a
nd
RT
SR
we
re a
ch
ieve
d in
FY
13
an
d p
rovi
de
d h
is s
erv
ice
co
nd
itio
ns
are
me
t a
n a
mo
un
t o
f $
4,5
79
,54
8 w
ill b
e p
aid
to
Go
rdo
n B
all
an
tyn
e
on
30
Ju
ne
20
14
.
(10
)E
ffe
cti
ve 1
Ju
ly 2
01
2,
Ro
be
rt N
as
on
’s r
ole
wa
s e
xpa
nd
ed
to
ta
ke
on
ad
dit
ion
al
ac
co
un
tab
ilit
ies
an
d h
e n
ow
qu
ali
fie
s a
s a
KM
P.
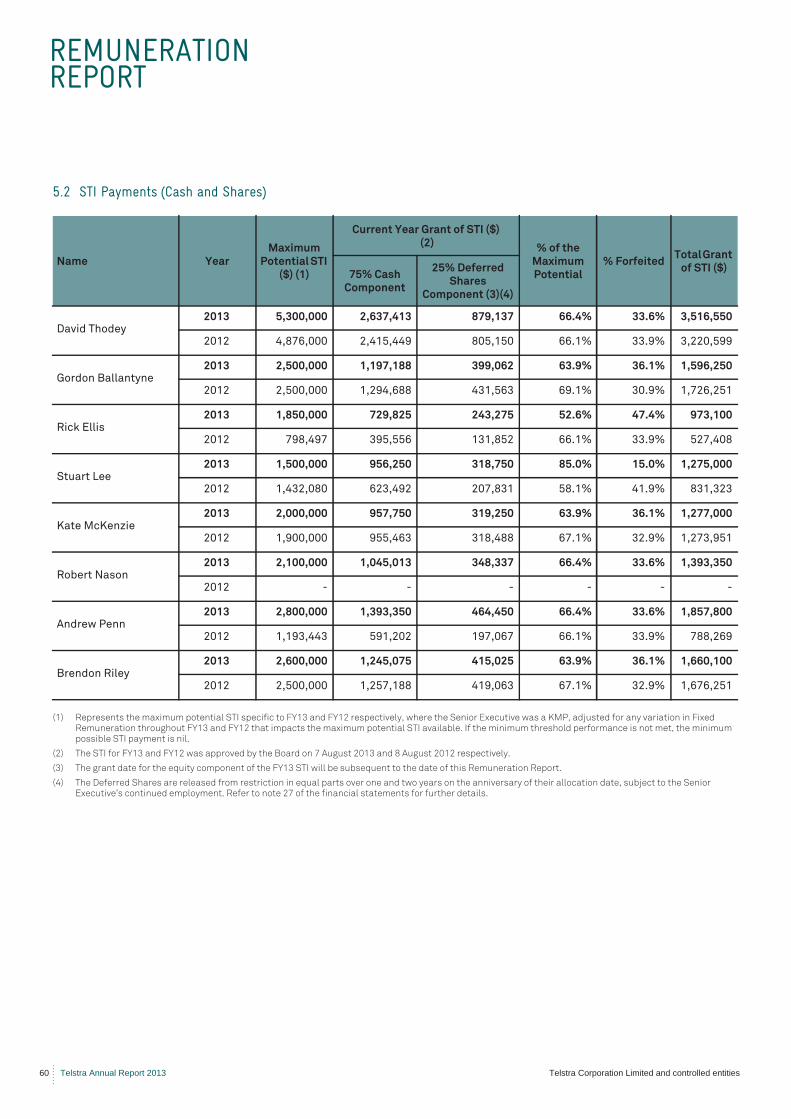
REMUNERATION REPORT
60 Telstra Annual Report 2013 Telstra Corporation Limited and controlled entities
5.2 STI Payments (Cash and Shares)
(1) Represents the maximum potential STI specific to FY13 and FY12 respectively, where the Senior Executive was a KMP, adjusted for any variation in Fixed Remuneration throughout FY13 and FY12 that impacts the maximum potential STI available. If the minimum threshold performance is not met, the minimum possible STI payment is nil.
(2) The STI for FY13 and FY12 was approved by the Board on 7 August 2013 and 8 August 2012 respectively.
(3) The grant date for the equity component of the FY13 STI will be subsequent to the date of this Remuneration Report.
(4) The Deferred Shares are released from restriction in equal parts over one and two years on the anniversary of their allocation date, subject to the Senior Executive’s continued employment. Refer to note 27 of the financial statements for further details.
Name YearMaximum
Potential STI ($) (1)
Current Year Grant of STI ($) (2) % of the
Maximum Potential
% ForfeitedTotal Grant
of STI ($)75% Cash
Component
25% Deferred Shares
Component (3)(4)
David Thodey2013 5,300,000 2,637,413 879,137 66.4% 33.6% 3,516,550
2012 4,876,000 2,415,449 805,150 66.1% 33.9% 3,220,599
Gordon Ballantyne2013 2,500,000 1,197,188 399,062 63.9% 36.1% 1,596,250
2012 2,500,000 1,294,688 431,563 69.1% 30.9% 1,726,251
Rick Ellis2013 1,850,000 729,825 243,275 52.6% 47.4% 973,100
2012 798,497 395,556 131,852 66.1% 33.9% 527,408
Stuart Lee2013 1,500,000 956,250 318,750 85.0% 15.0% 1,275,000
2012 1,432,080 623,492 207,831 58.1% 41.9% 831,323
Kate McKenzie2013 2,000,000 957,750 319,250 63.9% 36.1% 1,277,000
2012 1,900,000 955,463 318,488 67.1% 32.9% 1,273,951
Robert Nason2013 2,100,000 1,045,013 348,337 66.4% 33.6% 1,393,350
2012 - - - - - -
Andrew Penn2013 2,800,000 1,393,350 464,450 66.4% 33.6% 1,857,800
2012 1,193,443 591,202 197,067 66.1% 33.9% 788,269
Brendon Riley2013 2,600,000 1,245,075 415,025 63.9% 36.1% 1,660,100
2012 2,500,000 1,257,188 419,063 67.1% 32.9% 1,676,251
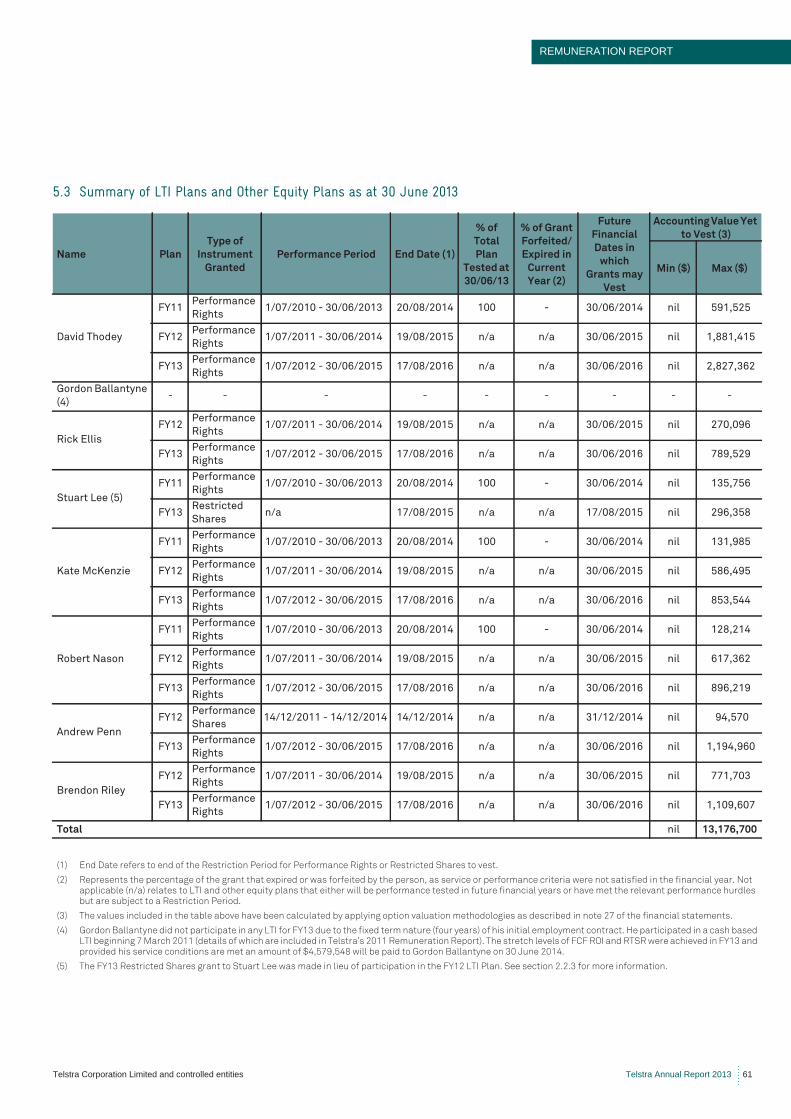
REMUNERATION REPORT
Telstra Corporation Limited and controlled entities Telstra Annual Report 2013 61
5.3 Summary of LTI Plans and Other Equity Plans as at 30 June 2013
Name Plan
Type of
Instrument
Granted
Performance Period End Date (1)
% of
Total
Plan
Tested at
30/06/13
% of Grant
Forfeited/
Expired in
Current
Year (2)
Future
Financial
Dates in
which
Grants may
Vest
Accounting Value Yet
to Vest (3)
Min ($) Max ($)
David Thodey
FY11Performance
Rights1/07/2010 - 30/06/2013 20/08/2014 100 - 30/06/2014 nil 591,525
FY12Performance
Rights1/07/2011 - 30/06/2014 19/08/2015 n/a n/a 30/06/2015 nil 1,881,415
FY13Performance
Rights1/07/2012 - 30/06/2015 17/08/2016 n/a n/a 30/06/2016 nil 2,827,362
Gordon Ballantyne
(4)- - - - - - - - -
Rick Ellis
FY12Performance
Rights1/07/2011 - 30/06/2014 19/08/2015 n/a n/a 30/06/2015 nil 270,096
FY13Performance
Rights1/07/2012 - 30/06/2015 17/08/2016 n/a n/a 30/06/2016 nil 789,529
Stuart Lee (5)
FY11Performance
Rights1/07/2010 - 30/06/2013 20/08/2014 100 - 30/06/2014 nil 135,756
FY13Restricted
Sharesn/a 17/08/2015 n/a n/a 17/08/2015 nil 296,358
Kate McKenzie
FY11Performance
Rights1/07/2010 - 30/06/2013 20/08/2014 100 - 30/06/2014 nil 131,985
FY12Performance
Rights1/07/2011 - 30/06/2014 19/08/2015 n/a n/a 30/06/2015 nil 586,495
FY13Performance
Rights1/07/2012 - 30/06/2015 17/08/2016 n/a n/a 30/06/2016 nil 853,544
Robert Nason
FY11Performance
Rights1/07/2010 - 30/06/2013 20/08/2014 100 - 30/06/2014 nil 128,214
FY12Performance
Rights1/07/2011 - 30/06/2014 19/08/2015 n/a n/a 30/06/2015 nil 617,362
FY13Performance
Rights1/07/2012 - 30/06/2015 17/08/2016 n/a n/a 30/06/2016 nil 896,219
Andrew Penn
FY12Performance
Shares14/12/2011 - 14/12/2014 14/12/2014 n/a n/a 31/12/2014 nil 94,570
FY13Performance
Rights1/07/2012 - 30/06/2015 17/08/2016 n/a n/a 30/06/2016 nil 1,194,960
Brendon Riley
FY12Performance
Rights1/07/2011 - 30/06/2014 19/08/2015 n/a n/a 30/06/2015 nil 771,703
FY13Performance
Rights1/07/2012 - 30/06/2015 17/08/2016 n/a n/a 30/06/2016 nil 1,109,607
Total nil 13,176,700
(1) End Date refers to end of the Restriction Period for Performance Rights or Restricted Shares to vest.
(2) Represents the percentage of the grant that expired or was forfeited by the person, as service or performance criteria were not satisfied in the financial year. Not applicable (n/a) relates to LTI and other equity plans that either will be performance tested in future financial years or have met the relevant performance hurdles but are subject to a Restriction Period.
(3) The values included in the table above have been calculated by applying option valuation methodologies as described in note 27 of the financial statements.
(4) Gordon Ballantyne did not participate in any LTI for FY13 due to the fixed term nature (four years) of his initial employment contract. He participated in a cash based LTI beginning 7 March 2011 (details of which are included in Telstra’s 2011 Remuneration Report). The stretch levels of FCF ROI and RTSR were achieved in FY13 and provided his service conditions are met an amount of $4,579,548 will be paid to Gordon Ballantyne on 30 June 2014.
(5) The FY13 Restricted Shares grant to Stuart Lee was made in lieu of participation in the FY12 LTI Plan. See section 2.2.3 for more information.
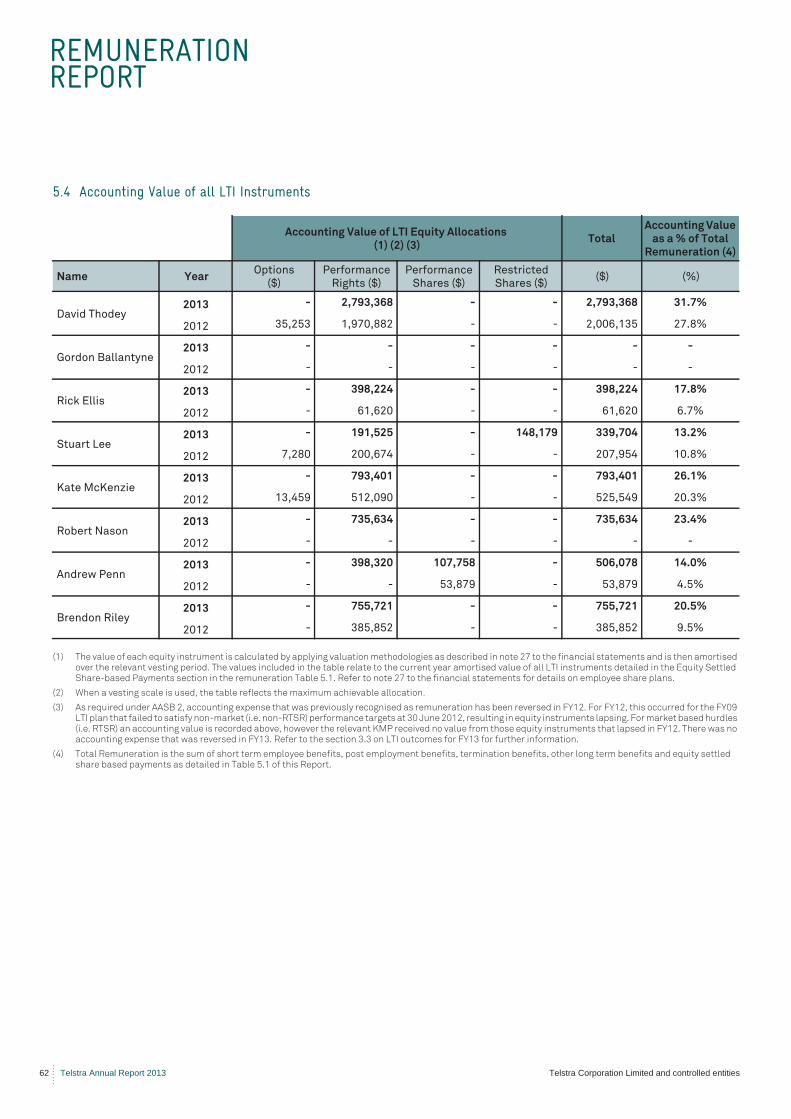
REMUNERATION REPORT
62 Telstra Annual Report 2013 Telstra Corporation Limited and controlled entities
5.4 Accounting Value of all LTI Instruments
(1) The value of each equity instrument is calculated by applying valuation methodologies as described in note 27 to the financial statements and is then amortised over the relevant vesting period. The values included in the table relate to the current year amortised value of all LTI instruments detailed in the Equity Settled Share-based Payments section in the remuneration Table 5.1. Refer to note 27 to the financial statements for details on employee share plans.
(2) When a vesting scale is used, the table reflects the maximum achievable allocation.
(3) As required under AASB 2, accounting expense that was previously recognised as remuneration has been reversed in FY12. For FY12, this occurred for the FY09 LTI plan that failed to satisfy non-market (i.e. non-RTSR) performance targets at 30 June 2012, resulting in equity instruments lapsing. For market based hurdles (i.e. RTSR) an accounting value is recorded above, however the relevant KMP received no value from those equity instruments that lapsed in FY12. There was no accounting expense that was reversed in FY13. Refer to the section 3.3 on LTI outcomes for FY13 for further information.
(4) Total Remuneration is the sum of short term employee benefits, post employment benefits, termination benefits, other long term benefits and equity settled share based payments as detailed in Table 5.1 of this Report.
Accounting Value of LTI Equity Allocations (1) (2) (3)
TotalAccounting Value
as a % of Total Remuneration (4)
Name YearOptions
($)Performance
Rights ($)Performance
Shares ($)Restricted Shares ($)
($) (%)
David Thodey 2013 - 2,793,368 - - 2,793,368 31.7%
2012 35,253 1,970,882 - - 2,006,135 27.8%
Gordon Ballantyne2013 - - - - - -
2012 - - - - - -
Rick Ellis2013 - 398,224 - - 398,224 17.8%
2012 - 61,620 - - 61,620 6.7%
Stuart Lee2013 - 191,525 - 148,179 339,704 13.2%
2012 7,280 200,674 - - 207,954 10.8%
Kate McKenzie2013 - 793,401 - - 793,401 26.1%
2012 13,459 512,090 - - 525,549 20.3%
Robert Nason2013 - 735,634 - - 735,634 23.4%
2012 - - - - - -
Andrew Penn2013 - 398,320 107,758 - 506,078 14.0%
2012 - - 53,879 - 53,879 4.5%
Brendon Riley2013 - 755,721 - - 755,721 20.5%
2012 - 385,852 - - 385,852 9.5%
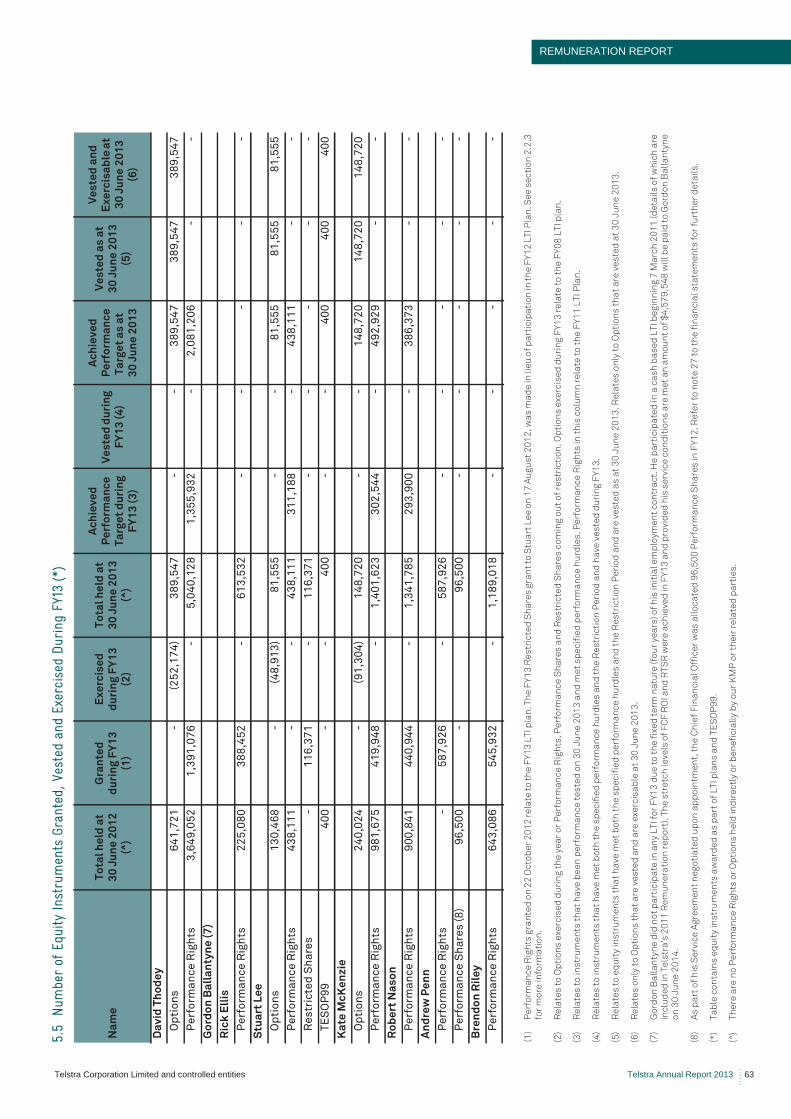
REMUNERATION REPORT
Telstra Corporation Limited and controlled entities Telstra Annual Report 2013 63
5.5
Num
ber
of E
quity
Inst
rum
ents
Gra
nted
, Ves
ted
and
Exer
cise
d Du
ring
FY13
(*)
(1)
Pe
rfo
rma
nc
e R
igh
ts g
ran
ted
on
22
Oc
tob
er
20
12
re
late
to
th
e F
Y1
3 L
TI p
lan
. Th
e F
Y1
3 R
es
tric
ted
Sh
are
s g
ran
t to
Stu
art
Le
e o
n 1
7 A
ug
us
t 2
01
2, w
as
ma
de
in li
eu
of
pa
rtic
ipa
tio
n in
th
e F
Y1
2 L
TI P
lan
. Se
e s
ec
tio
n 2
.2.3
fo
r m
ore
in
form
ati
on
.
(2)
Re
late
s t
o O
pti
on
s e
xerc
ise
d d
uri
ng
th
e y
ea
r o
r P
erf
orm
an
ce
Rig
hts
, P
erf
orm
an
ce
Sh
are
s a
nd
Re
str
icte
d S
ha
res
co
min
g o
ut
of
res
tric
tio
n.
Op
tio
ns
ex
erc
ise
d d
uri
ng
FY
13
re
late
to
th
e F
Y0
8 L
TI
pla
n.
(3)
Re
late
s t
o i
ns
tru
me
nts
th
at
ha
ve b
ee
n p
erf
orm
an
ce
te
ste
d o
n 3
0 J
un
e 2
01
3 a
nd
me
t s
pe
cif
ied
pe
rfo
rma
nc
e h
urd
les
. P
erf
orm
an
ce
Rig
hts
in
th
is c
olu
mn
re
late
to
th
e F
Y1
1 L
TI
Pla
n.
(4)
Re
late
s t
o i
ns
tru
me
nts
th
at
ha
ve m
et
bo
th t
he
sp
ec
ifie
d p
erf
orm
an
ce
hu
rdle
s a
nd
th
e R
es
tric
tio
n P
eri
od
an
d h
ave
ve
ste
d d
uri
ng
FY
13
.
(5)
Re
late
s t
o e
qu
ity
in
str
um
en
ts t
ha
t h
ave
me
t b
oth
th
e s
pe
cif
ied
pe
rfo
rma
nc
e h
urd
les
an
d t
he
Re
str
icti
on
Pe
rio
d a
nd
are
ve
ste
d a
s a
t 3
0 J
un
e 2
01
3.
Re
late
s o
nly
to
Op
tio
ns
th
at
are
ve
ste
d a
t 3
0 J
un
e 2
01
3.
(6)
Re
late
s o
nly
to
Op
tio
ns
th
at
are
ve
ste
d a
nd
are
exe
rcis
ab
le a
t 3
0 J
un
e 2
01
3.
(7)
Go
rdo
n B
all
an
tyn
e d
id n
ot
pa
rtic
ipa
te in
an
y L
TI f
or
FY
13
du
e t
o t
he
fix
ed
te
rm n
atu
re (
fou
r y
ea
rs)
of
his
init
ial
em
plo
ym
en
t c
on
tra
ct.
He
pa
rtic
ipa
ted
in a
ca
sh
ba
se
d L
TI b
eg
inn
ing
7 M
arc
h 2
01
1 (
de
tail
s o
f w
hic
h a
re
inc
lud
ed
in T
els
tra
’s 2
01
1 R
em
un
era
tio
n r
ep
ort
). T
he
str
etc
h le
vels
of
FC
F R
OI a
nd
RT
SR
we
re a
ch
ieve
d in
FY
13
an
d p
rovi
de
d h
is s
erv
ice
co
nd
itio
ns
are
me
t a
n a
mo
un
t o
f $
4,5
79
,54
8 w
ill b
e p
aid
to
Go
rdo
n B
all
an
tyn
e
on
30
Ju
ne
20
14
.
(8)
As
pa
rt o
f h
is S
erv
ice
Ag
ree
me
nt
ne
go
tia
ted
up
on
ap
po
intm
en
t, t
he
Ch
ief
Fin
an
cia
l O
ffic
er
wa
s a
llo
ca
ted
96
,50
0 P
erf
orm
an
ce
Sh
are
s i
n F
Y1
2.
Re
fer
to n
ote
27
to
th
e f
ina
nc
ial
sta
tem
en
ts f
or
furt
he
r d
eta
ils
.
(*)
Ta
ble
co
nta
ins
eq
uit
y i
ns
tru
me
nts
aw
ard
ed
as
pa
rt o
f L
TI
pla
ns
an
d T
ES
OP
99
.
(^)
Th
ere
are
no
Pe
rfo
rma
nc
e R
igh
ts o
r O
pti
on
s h
eld
in
dir
ec
tly
or
be
ne
fic
iall
y b
y o
ur
KM
P o
r th
eir
re
late
d p
art
ies
.
Na
me
To
tal
he
ld a
t 3
0 J
un
e 2
01
2
(^)
Gra
nte
d
du
rin
g F
Y1
3
(1)
Ex
erc
ise
d
du
rin
g F
Y1
3
(2)
To
tal
he
ld a
t 3
0 J
un
e 2
01
3
(^)
Ac
hie
ve
d
Pe
rfo
rma
nc
e
Ta
rge
t d
uri
ng
F
Y1
3 (
3)
Ve
ste
d d
uri
ng
F
Y1
3 (
4)
Ac
hie
ve
d
Pe
rfo
rma
nc
e
Ta
rge
t a
s a
t 3
0 J
un
e 2
01
3
Ve
ste
d a
s a
t 3
0 J
un
e 2
01
3
(5)
Ve
ste
d a
nd
E
xe
rcis
ab
le a
t 3
0 J
un
e 2
01
3
(6)
Da
vid
Th
od
ey
Op
tio
ns
64
1,7
21
-(2
52
,17
4)
38
9,5
47
--
38
9,5
47
38
9,5
47
38
9,5
47
Pe
rfo
rma
nc
e R
igh
ts3
,64
9,0
52
1,3
91
,07
6-
5,0
40
,12
81
,35
5,9
32
-2
,08
1,2
06
--
Go
rdo
n B
all
an
tyn
e (
7)
Ric
k E
llis
Pe
rfo
rma
nc
e R
igh
ts2
25
,08
03
88
,45
2-
61
3,5
32
--
--
-
Stu
art
Le
e
Op
tio
ns
13
0,4
68
-(4
8,9
13
)8
1,5
55
--
81
,55
58
1,5
55
81
,55
5
Pe
rfo
rma
nc
e R
igh
ts4
38
,11
1-
-4
38
,11
13
11
,18
8-
43
8,1
11
--
Re
str
icte
d S
ha
res
-1
16
,37
1-
11
6,3
71
--
--
-
TE
SO
P9
94
00
--
40
0-
-4
00
40
04
00
Ka
te M
cK
en
zie
Op
tio
ns
24
0,0
24
-(9
1,3
04
)1
48
,72
0-
-1
48
,72
01
48
,72
01
48
,72
0
Pe
rfo
rma
nc
e R
igh
ts9
81
,67
54
19
,94
8-
1,4
01
,62
33
02
,54
4-
49
2,9
29
--
Ro
be
rt N
as
on
Pe
rfo
rma
nc
e R
igh
ts9
00
,84
14
40
,94
4-
1,3
41
,78
52
93
,90
0-
38
6,3
73
--
An
dre
w P
en
n
Pe
rfo
rma
nc
e R
igh
ts-
58
7,9
26
-5
87
,92
6-
--
--
Pe
rfo
rma
nc
e S
ha
res
(8
)9
6,5
00
-9
6,5
00
--
--
-
Bre
nd
on
Ril
ey
Pe
rfo
rma
nc
e R
igh
ts6
43
,08
65
45
,93
2-
1,1
89
,01
8-
--
--
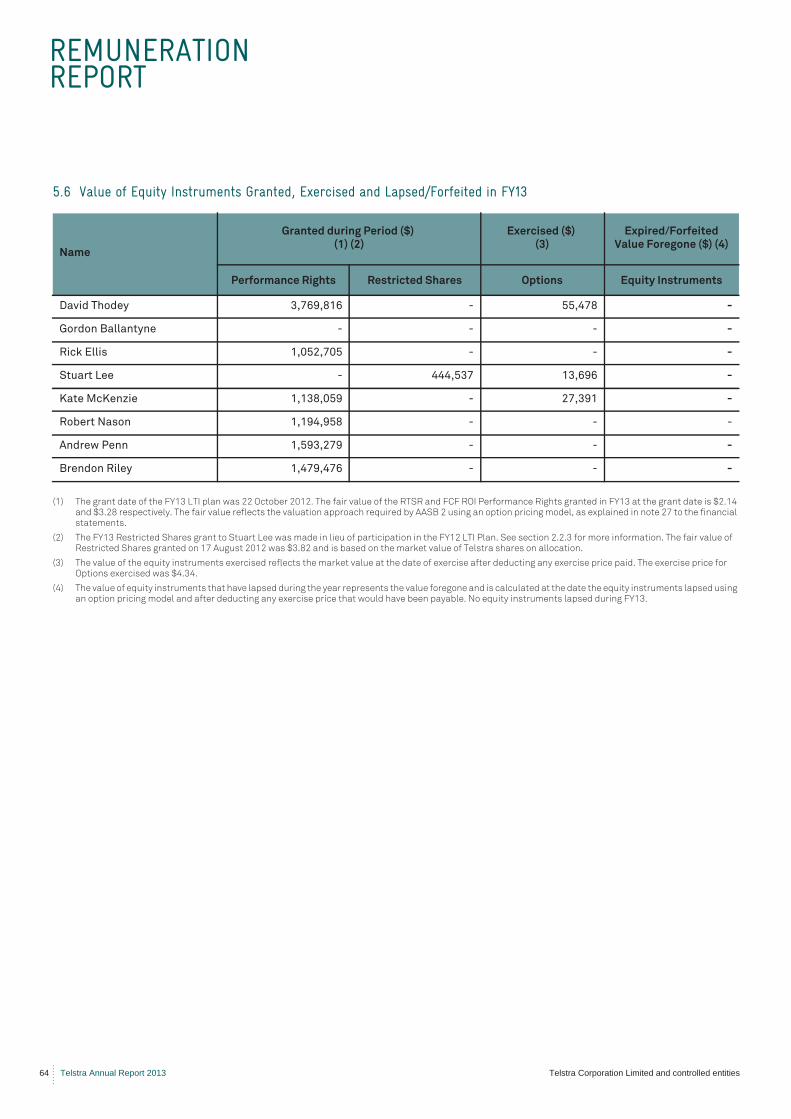
REMUNERATION REPORT
64 Telstra Annual Report 2013 Telstra Corporation Limited and controlled entities
5.6 Value of Equity Instruments Granted, Exercised and Lapsed/Forfeited in FY13
(1) The grant date of the FY13 LTI plan was 22 October 2012. The fair value of the RTSR and FCF ROI Performance Rights granted in FY13 at the grant date is $2.14 and $3.28 respectively. The fair value reflects the valuation approach required by AASB 2 using an option pricing model, as explained in note 27 to the financial statements.
(2) The FY13 Restricted Shares grant to Stuart Lee was made in lieu of participation in the FY12 LTI Plan. See section 2.2.3 for more information. The fair value of Restricted Shares granted on 17 August 2012 was $3.82 and is based on the market value of Telstra shares on allocation.
(3) The value of the equity instruments exercised reflects the market value at the date of exercise after deducting any exercise price paid. The exercise price for Options exercised was $4.34.
(4) The value of equity instruments that have lapsed during the year represents the value foregone and is calculated at the date the equity instruments lapsed using an option pricing model and after deducting any exercise price that would have been payable. No equity instruments lapsed during FY13.
Name
Granted during Period ($) (1) (2)
Exercised ($) (3)
Expired/Forfeited Value Foregone ($) (4)
Performance Rights Restricted Shares Options Equity Instruments
David Thodey 3,769,816 - 55,478 -
Gordon Ballantyne - - - -
Rick Ellis 1,052,705 - - -
Stuart Lee - 444,537 13,696 -
Kate McKenzie 1,138,059 - 27,391 -
Robert Nason 1,194,958 - - -
Andrew Penn 1,593,279 - - -
Brendon Riley 1,479,476 - - -
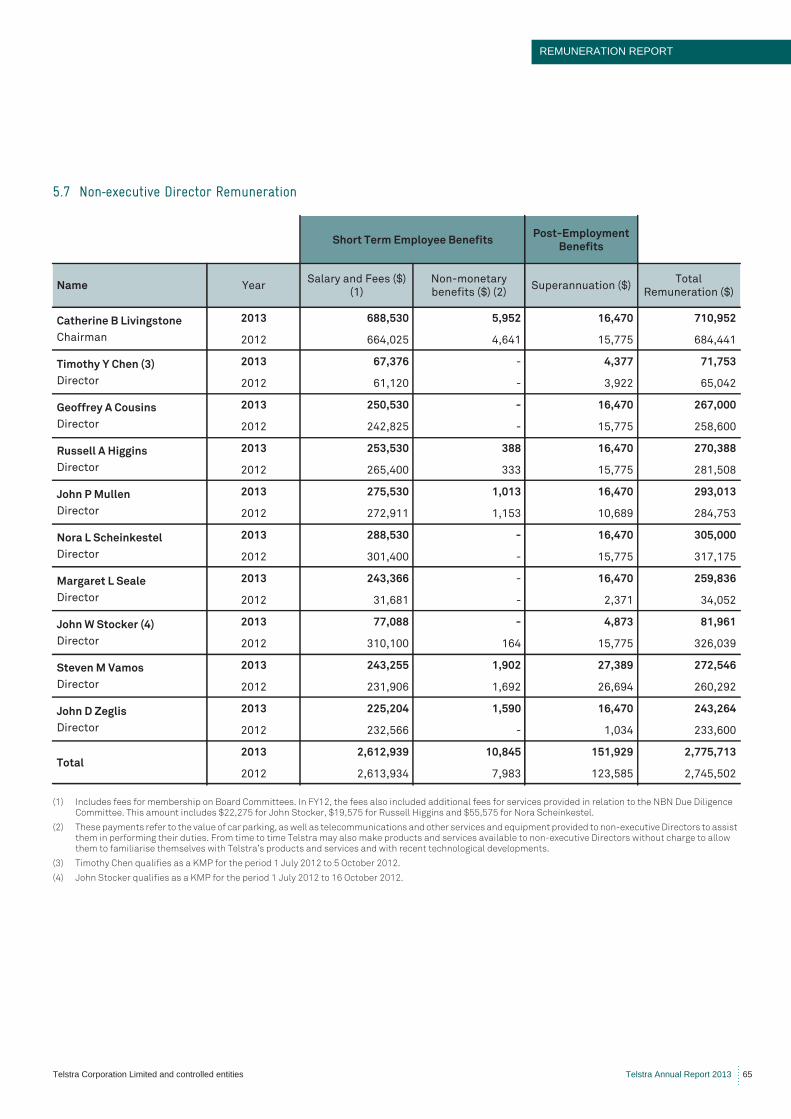
REMUNERATION REPORT
Telstra Corporation Limited and controlled entities Telstra Annual Report 2013 65
5.7 Non-executive Director Remuneration
(1) Includes fees for membership on Board Committees. In FY12, the fees also included additional fees for services provided in relation to the NBN Due Diligence Committee. This amount includes $22,275 for John Stocker, $19,575 for Russell Higgins and $55,575 for Nora Scheinkestel.
(2) These payments refer to the value of car parking, as well as telecommunications and other services and equipment provided to non-executive Directors to assist them in performing their duties. From time to time Telstra may also make products and services available to non-executive Directors without charge to allow them to familiarise themselves with Telstra’s products and services and with recent technological developments.
(3) Timothy Chen qualifies as a KMP for the period 1 July 2012 to 5 October 2012.
(4) John Stocker qualifies as a KMP for the period 1 July 2012 to 16 October 2012.
Short Term Employee BenefitsPost-Employment
Benefits
Name YearSalary and Fees ($)
(1)Non-monetary benefits ($) (2)
Superannuation ($)Total
Remuneration ($)
Catherine B Livingstone
Chairman
2013 688,530 5,952 16,470 710,952
2012 664,025 4,641 15,775 684,441
Timothy Y Chen (3)
Director
2013 67,376 - 4,377 71,753
2012 61,120 - 3,922 65,042
Geoffrey A Cousins
Director
2013 250,530 - 16,470 267,000
2012 242,825 - 15,775 258,600
Russell A Higgins
Director
2013 253,530 388 16,470 270,388
2012 265,400 333 15,775 281,508
John P Mullen
Director
2013 275,530 1,013 16,470 293,013
2012 272,911 1,153 10,689 284,753
Nora L Scheinkestel
Director
2013 288,530 - 16,470 305,000
2012 301,400 - 15,775 317,175
Margaret L Seale
Director
2013 243,366 - 16,470 259,836
2012 31,681 - 2,371 34,052
John W Stocker (4)
Director
2013 77,088 - 4,873 81,961
2012 310,100 164 15,775 326,039
Steven M Vamos
Director
2013 243,255 1,902 27,389 272,546
2012 231,906 1,692 26,694 260,292
John D Zeglis
Director
2013 225,204 1,590 16,470 243,264
2012 232,566 - 1,034 233,600
Total2013 2,612,939 10,845 151,929 2,775,713
2012 2,613,934 7,983 123,585 2,745,502
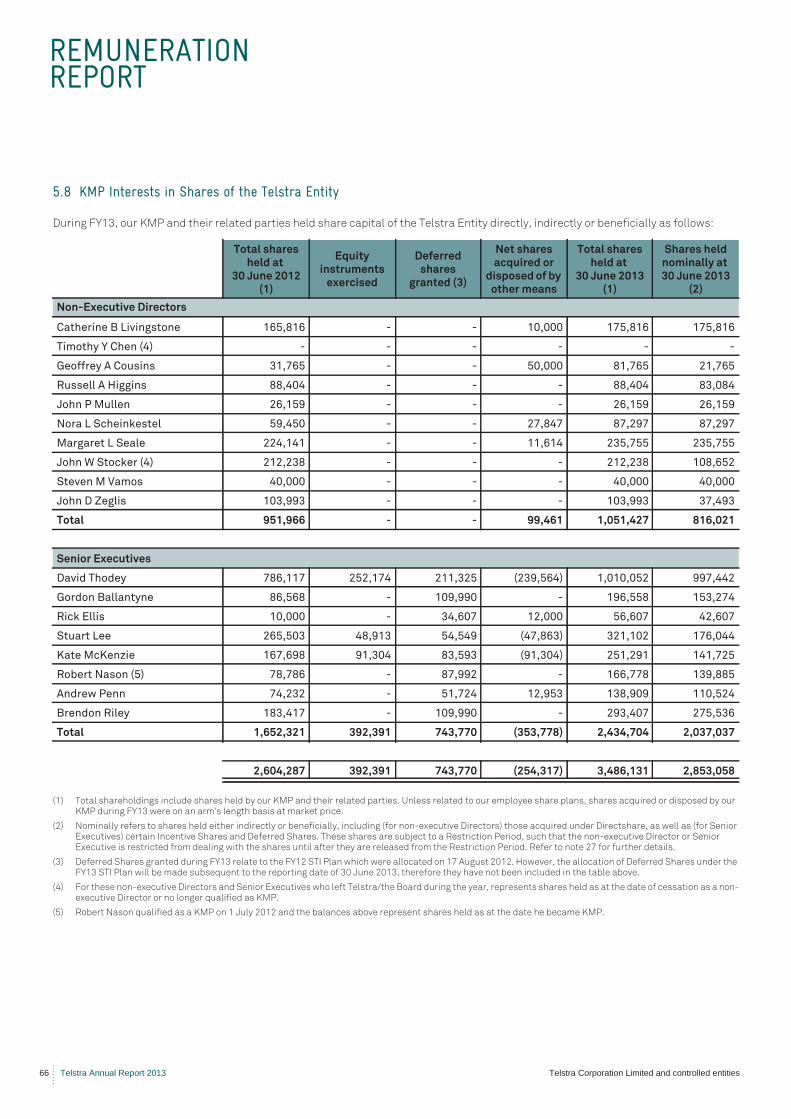
REMUNERATION REPORT
66 Telstra Annual Report 2013 Telstra Corporation Limited and controlled entities
5.8 KMP Interests in Shares of the Telstra Entity
During FY13, our KMP and their related parties held share capital of the Telstra Entity directly, indirectly or beneficially as follows:
(1) Total shareholdings include shares held by our KMP and their related parties. Unless related to our employee share plans, shares acquired or disposed by our KMP during FY13 were on an arm’s length basis at market price.
(2) Nominally refers to shares held either indirectly or beneficially, including (for non-executive Directors) those acquired under Directshare, as well as (for Senior Executives) certain Incentive Shares and Deferred Shares. These shares are subject to a Restriction Period, such that the non-executive Director or Senior Executive is restricted from dealing with the shares until after they are released from the Restriction Period. Refer to note 27 for further details.
(3) Deferred Shares granted during FY13 relate to the FY12 STI Plan which were allocated on 17 August 2012. However, the allocation of Deferred Shares under the FY13 STI Plan will be made subsequent to the reporting date of 30 June 2013, therefore they have not been included in the table above.
(4) For these non-executive Directors and Senior Executives who left Telstra/the Board during the year, represents shares held as at the date of cessation as a non-executive Director or no longer qualified as KMP.
(5) Robert Nason qualified as a KMP on 1 July 2012 and the balances above represent shares held as at the date he became KMP.
Total shares held at
30 June 2012(1)
Equity instruments
exercised
Deferred shares
granted (3)
Net shares acquired or
disposed of by other means
Total shares held at
30 June 2013(1)
Shares held nominally at 30 June 2013
(2)
Non-Executive Directors
Catherine B Livingstone 165,816 - - 10,000 175,816 175,816
Timothy Y Chen (4) - - - - - -
Geoffrey A Cousins 31,765 - - 50,000 81,765 21,765
Russell A Higgins 88,404 - - - 88,404 83,084
John P Mullen 26,159 - - - 26,159 26,159
Nora L Scheinkestel 59,450 - - 27,847 87,297 87,297
Margaret L Seale 224,141 - - 11,614 235,755 235,755
John W Stocker (4) 212,238 - - - 212,238 108,652
Steven M Vamos 40,000 - - - 40,000 40,000
John D Zeglis 103,993 - - - 103,993 37,493
Total 951,966 - - 99,461 1,051,427 816,021
Senior Executives
David Thodey 786,117 252,174 211,325 (239,564) 1,010,052 997,442
Gordon Ballantyne 86,568 - 109,990 - 196,558 153,274
Rick Ellis 10,000 - 34,607 12,000 56,607 42,607
Stuart Lee 265,503 48,913 54,549 (47,863) 321,102 176,044
Kate McKenzie 167,698 91,304 83,593 (91,304) 251,291 141,725
Robert Nason (5) 78,786 - 87,992 - 166,778 139,885
Andrew Penn 74,232 - 51,724 12,953 138,909 110,524
Brendon Riley 183,417 - 109,990 - 293,407 275,536
Total 1,652,321 392,391 743,770 (353,778) 2,434,704 2,037,037
2,604,287 392,391 743,770 (254,317) 3,486,131 2,853,058
REMUNERATION REPORT
Telstra Corporation Limited and controlled entities Telstra Annual Report 2013 67
Glossary and Abbreviations used in Report
Average Investment for LTI Average investment over the period is the average of the sum of net debt and shareholders’ funds
over the entire three year performance period
Customer Satisfaction A non financial measure in Telstra’s FY12 STI Plan. Refer to section 2.2.1 for further information
Deferred Share A Telstra share that is granted under an STI Deferral Plan and cannot be traded until the end of the
Restriction Period
EBITDA Earnings Before Interest, Tax, Depreciation and Amortisation
EBITDA for STI Earnings Before Interest, Tax, Depreciation and Amortisation (excluding profit/loss on Land &
Building disposals)
FCF for LTI FCF for these purposes is annual Free Cashflow less interest paid and adjusting for non-recurring
factors such as spectrum purchases, acquisitions and gains on the sale of assets
FCF ROI for LTI A ratio of the average annual Free Cashflow over the entire three year performance period by
Telstra’s average investment over the same period
FCF for STI Free Cashflow (excluding CAPEX for Investment and Spectrum; and proceeds from Land & Building
disposals)
Fixed Remuneration Base salary plus company and private salary sacrificed superannuation contributions. Specifically
defined as Total Fixed Remuneration in the CEO’s contract
Free Cashflow (FCF) Cashflow from operating and investing activities
GMD Group Managing Director
KMP Key Management Personnel
LTI Long Term Incentive
NBN National Broadband Network
NBN Transaction Agreements with NBN Co and the Government in relation to Telstra’s participation in the rollout of
the NBN
NPS Net Promoter Score. A non financial measure in Telstra’s FY13 STI Plan. Refer to section 2.2.1 for
further information
Performance Right A right to a Restricted Share at the end of a performance period, subject to the satisfaction of
certain performance measures
Permitted Reason (LTI) Death, total and permanent disablement, redundancy or separation by mutual agreement
Permitted Reason (STI) Death, total and permanent disablement, redundancy or retirement where that notice of retirement
is given more than six months after the actual allocation date
Restricted Share A Telstra share that cannot be traded until the end of the Restriction Period
Restriction Period A period during which a Telstra share cannot be traded and is subject to a service condition
RTSR Relative Total Shareholder Return
Senior Executive Refers to the Chief Executive Officer and those executives with authority and responsibility for
planning, directing and controlling the activities of the company and Group, directly or indirectly
Service Agreement A Senior Executive’s contract of employment
SSU Structural Separation Undertaking
STI Short Term Incentive
STI Deferral Plan A plan under which Senior Executives are provided with a percentage of their actual STI payment in
the form of Deferred Shares
Straightline Vesting Describes the vesting calculation between target and stretch of an LTI plan, where the payout
between two levels is based on equal increments determined by performance
Total Income Total Telstra Income excluding profit/loss on Land & Building disposals
Total Remuneration The sum of all the fixed and variable components of remuneration as detailed in Table 5.1 for Senior
Executives, and all the remuneration components as detailed in Table 5.7 for non-executive
Directors
DIRECTORS'REPORT
68 Telstra Annual Report 2013 Telstra Corporation Limited and controlled entities
Ernst & Young8 Exhibition Street Melbourne VIC 3000 AustraliaGPO Box 67 Melbourne VIC 3001Tel: +61 3 9288 8000Fax: +61 3 8650 7777ey.com/au
Rounding of amounts
The Telstra Entity is a company of the kind referred to in the
Australian Securities and Investments Commission Class Order
98/100, dated 10 July 1998 and issued pursuant to section 341(1)
of the Corporations Act 2001. As a result, amounts in this report
and the accompanying financial report have been rounded to the
nearest million dollars ($m), except where otherwise indicated.
This report is made on 8 August 2013 in accordance with a
resolution of the Directors.
Catherine B Livingstone AO
Chairman
8 August 2013
David I Thodey
Chief Executive Officer and Executive Director
8 August 2013
Auditor’s Independence Declaration to the Directors of
Telstra Corporation Limited
In relation to our audit of the financial report of Telstra
Corporation Limited for the financial year ended 30 June 2013, to
the best of my knowledge and belief, there have been no
contraventions of the auditor independence requirements of the
Corporations Act 2001 or any applicable code of professional
conduct.
Ernst & Young
SJ Ferguson
Partner
Sydney, Australia
8 August 2013
A member firm of Ernst & Young Global Limited Liability limited by a scheme approved under Professional Standards Legislation
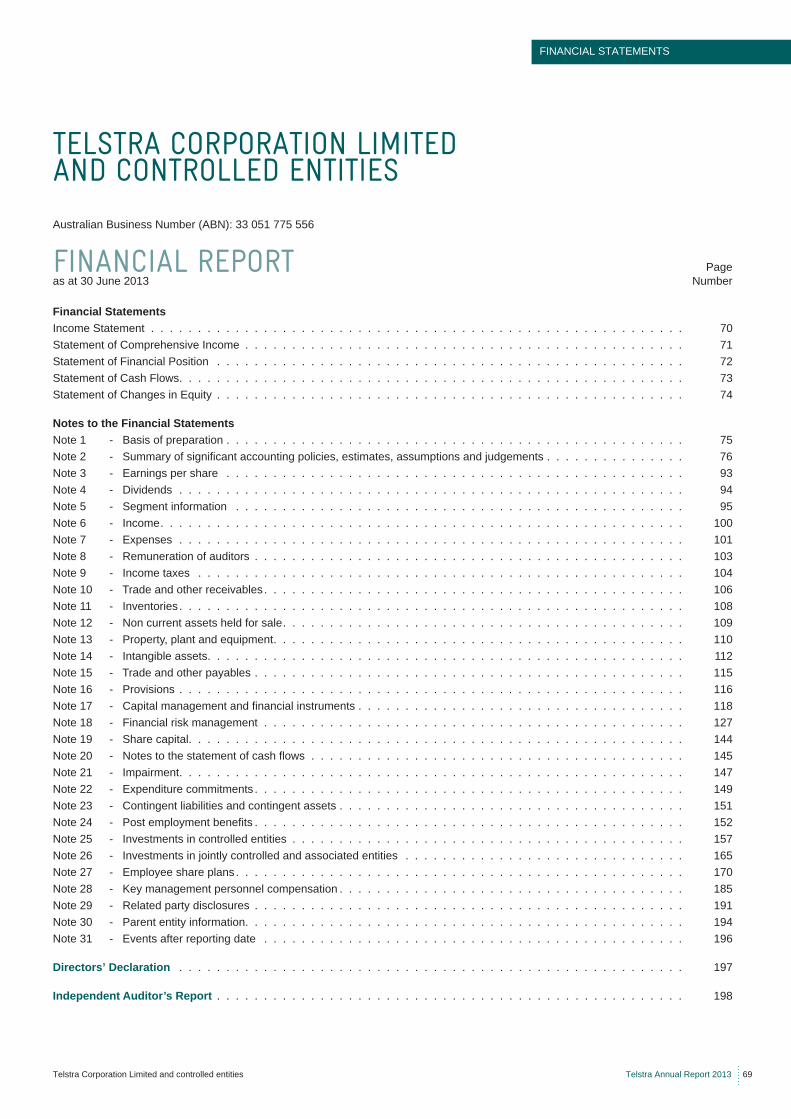
FINANCIAL STATEMENTS
Telstra Corporation Limited and controlled entities Telstra Annual Report 2013 69
TELSTRA CORPORATION LIMITED AND CONTROLLED ENTITIESAustralian Business Number (ABN): 33 051 775 556
FINANCIAL REPORTas at 30 June 2013
Page Number
Financial StatementsIncome Statement . . . . . . . . . . . . . . . . . . . . . . . . . . . . . . . . . . . . . . . . . . . . . . . . . . . . . . . . . 70Statement of Comprehensive Income . . . . . . . . . . . . . . . . . . . . . . . . . . . . . . . . . . . . . . . . . . . . . . . 71Statement of Financial Position . . . . . . . . . . . . . . . . . . . . . . . . . . . . . . . . . . . . . . . . . . . . . . . . . . 72Statement of Cash Flows. . . . . . . . . . . . . . . . . . . . . . . . . . . . . . . . . . . . . . . . . . . . . . . . . . . . . . 73Statement of Changes in Equity . . . . . . . . . . . . . . . . . . . . . . . . . . . . . . . . . . . . . . . . . . . . . . . . . . 74
Notes to the Financial StatementsNote 1 - Basis of preparation . . . . . . . . . . . . . . . . . . . . . . . . . . . . . . . . . . . . . . . . . . . . . . . . . 75Note 2 - Summary of significant accounting policies, estimates, assumptions and judgements . . . . . . . . . . . . . . . 76Note 3 - Earnings per share . . . . . . . . . . . . . . . . . . . . . . . . . . . . . . . . . . . . . . . . . . . . . . . . . 93Note 4 - Dividends . . . . . . . . . . . . . . . . . . . . . . . . . . . . . . . . . . . . . . . . . . . . . . . . . . . . . . 94Note 5 - Segment information . . . . . . . . . . . . . . . . . . . . . . . . . . . . . . . . . . . . . . . . . . . . . . . . 95Note 6 - Income. . . . . . . . . . . . . . . . . . . . . . . . . . . . . . . . . . . . . . . . . . . . . . . . . . . . . . . . 100Note 7 - Expenses . . . . . . . . . . . . . . . . . . . . . . . . . . . . . . . . . . . . . . . . . . . . . . . . . . . . . . 101Note 8 - Remuneration of auditors . . . . . . . . . . . . . . . . . . . . . . . . . . . . . . . . . . . . . . . . . . . . . . 103Note 9 - Income taxes . . . . . . . . . . . . . . . . . . . . . . . . . . . . . . . . . . . . . . . . . . . . . . . . . . . . 104Note 10 - Trade and other receivables . . . . . . . . . . . . . . . . . . . . . . . . . . . . . . . . . . . . . . . . . . . . . 106Note 11 - Inventories . . . . . . . . . . . . . . . . . . . . . . . . . . . . . . . . . . . . . . . . . . . . . . . . . . . . . . 108Note 12 - Non current assets held for sale. . . . . . . . . . . . . . . . . . . . . . . . . . . . . . . . . . . . . . . . . . . 109Note 13 - Property, plant and equipment. . . . . . . . . . . . . . . . . . . . . . . . . . . . . . . . . . . . . . . . . . . . 110Note 14 - Intangible assets. . . . . . . . . . . . . . . . . . . . . . . . . . . . . . . . . . . . . . . . . . . . . . . . . . . 112Note 15 - Trade and other payables . . . . . . . . . . . . . . . . . . . . . . . . . . . . . . . . . . . . . . . . . . . . . . 115Note 16 - Provisions . . . . . . . . . . . . . . . . . . . . . . . . . . . . . . . . . . . . . . . . . . . . . . . . . . . . . . 116Note 17 - Capital management and financial instruments . . . . . . . . . . . . . . . . . . . . . . . . . . . . . . . . . . . 118Note 18 - Financial risk management . . . . . . . . . . . . . . . . . . . . . . . . . . . . . . . . . . . . . . . . . . . . . 127Note 19 - Share capital. . . . . . . . . . . . . . . . . . . . . . . . . . . . . . . . . . . . . . . . . . . . . . . . . . . . . 144Note 20 - Notes to the statement of cash flows . . . . . . . . . . . . . . . . . . . . . . . . . . . . . . . . . . . . . . . . 145Note 21 - Impairment. . . . . . . . . . . . . . . . . . . . . . . . . . . . . . . . . . . . . . . . . . . . . . . . . . . . . . 147Note 22 - Expenditure commitments . . . . . . . . . . . . . . . . . . . . . . . . . . . . . . . . . . . . . . . . . . . . . . 149Note 23 - Contingent liabilities and contingent assets . . . . . . . . . . . . . . . . . . . . . . . . . . . . . . . . . . . . . 151Note 24 - Post employment benefits . . . . . . . . . . . . . . . . . . . . . . . . . . . . . . . . . . . . . . . . . . . . . . 152Note 25 - Investments in controlled entities . . . . . . . . . . . . . . . . . . . . . . . . . . . . . . . . . . . . . . . . . . 157Note 26 - Investments in jointly controlled and associated entities . . . . . . . . . . . . . . . . . . . . . . . . . . . . . . 165Note 27 - Employee share plans . . . . . . . . . . . . . . . . . . . . . . . . . . . . . . . . . . . . . . . . . . . . . . . . 170Note 28 - Key management personnel compensation . . . . . . . . . . . . . . . . . . . . . . . . . . . . . . . . . . . . . 185Note 29 - Related party disclosures . . . . . . . . . . . . . . . . . . . . . . . . . . . . . . . . . . . . . . . . . . . . . . 191Note 30 - Parent entity information. . . . . . . . . . . . . . . . . . . . . . . . . . . . . . . . . . . . . . . . . . . . . . . 194Note 31 - Events after reporting date . . . . . . . . . . . . . . . . . . . . . . . . . . . . . . . . . . . . . . . . . . . . . 196
Directors’ Declaration . . . . . . . . . . . . . . . . . . . . . . . . . . . . . . . . . . . . . . . . . . . . . . . . . . . . . . 197
Independent Auditor’s Report . . . . . . . . . . . . . . . . . . . . . . . . . . . . . . . . . . . . . . . . . . . . . . . . . . 198
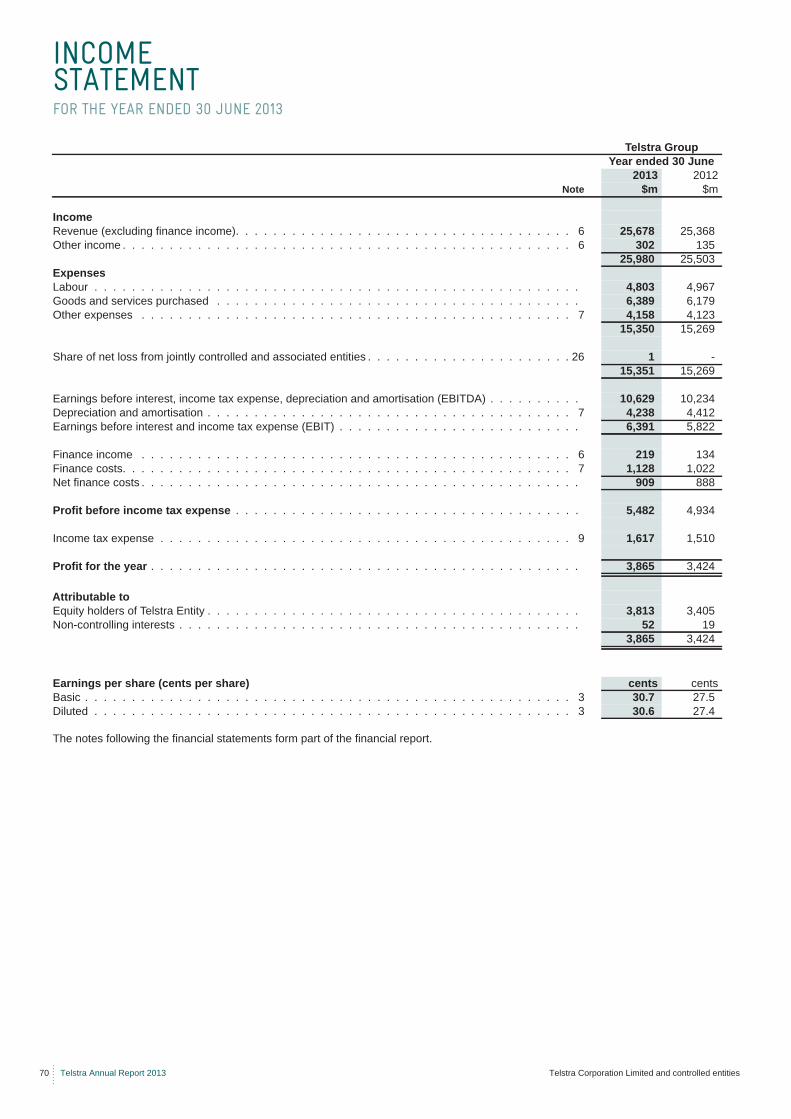
70 Telstra Annual Report 2013 Telstra Corporation Limited and controlled entities
The notes following the financial statements form part of the financial report.
INCOME STATEMENTFOR THE YEAR ENDED 30 JUNE 2013
Telstra GroupYear ended 30 June
2013 2012Note $m $m
IncomeRevenue (excluding finance income). . . . . . . . . . . . . . . . . . . . . . . . . . . . . . . . . . . . 6 25,678 25,368Other income . . . . . . . . . . . . . . . . . . . . . . . . . . . . . . . . . . . . . . . . . . . . . . . . 6 302 135
25,980 25,503ExpensesLabour . . . . . . . . . . . . . . . . . . . . . . . . . . . . . . . . . . . . . . . . . . . . . . . . . . . . 4,803 4,967Goods and services purchased . . . . . . . . . . . . . . . . . . . . . . . . . . . . . . . . . . . . . . . 6,389 6,179Other expenses . . . . . . . . . . . . . . . . . . . . . . . . . . . . . . . . . . . . . . . . . . . . . . 7 4,158 4,123
15,350 15,269
Share of net loss from jointly controlled and associated entities . . . . . . . . . . . . . . . . . . . . . . 26 1 -15,351 15,269
Earnings before interest, income tax expense, depreciation and amortisation (EBITDA) . . . . . . . . . . 10,629 10,234Depreciation and amortisation . . . . . . . . . . . . . . . . . . . . . . . . . . . . . . . . . . . . . . . 7 4,238 4,412Earnings before interest and income tax expense (EBIT) . . . . . . . . . . . . . . . . . . . . . . . . . . 6,391 5,822
Finance income . . . . . . . . . . . . . . . . . . . . . . . . . . . . . . . . . . . . . . . . . . . . . . 6 219 134Finance costs. . . . . . . . . . . . . . . . . . . . . . . . . . . . . . . . . . . . . . . . . . . . . . . . 7 1,128 1,022Net finance costs . . . . . . . . . . . . . . . . . . . . . . . . . . . . . . . . . . . . . . . . . . . . . . . 909 888
Profit before income tax expense . . . . . . . . . . . . . . . . . . . . . . . . . . . . . . . . . . . . . 5,482 4,934
Income tax expense . . . . . . . . . . . . . . . . . . . . . . . . . . . . . . . . . . . . . . . . . . . . 9 1,617 1,510
Profit for the year . . . . . . . . . . . . . . . . . . . . . . . . . . . . . . . . . . . . . . . . . . . . . . 3,865 3,424
Attributable toEquity holders of Telstra Entity . . . . . . . . . . . . . . . . . . . . . . . . . . . . . . . . . . . . . . . . 3,813 3,405Non-controlling interests . . . . . . . . . . . . . . . . . . . . . . . . . . . . . . . . . . . . . . . . . . . 52 19
3,865 3,424
Earnings per share (cents per share) cents centsBasic . . . . . . . . . . . . . . . . . . . . . . . . . . . . . . . . . . . . . . . . . . . . . . . . . . . . 3 30.7 27.5Diluted . . . . . . . . . . . . . . . . . . . . . . . . . . . . . . . . . . . . . . . . . . . . . . . . . . . 3 30.6 27.4
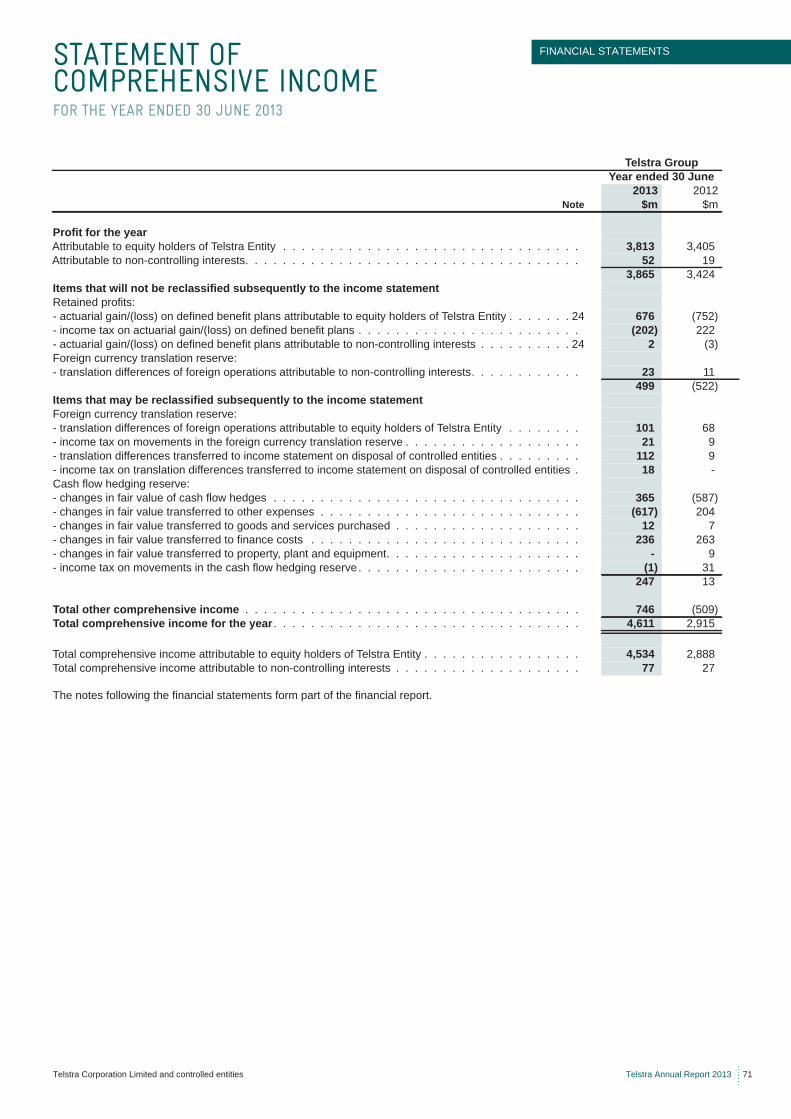
FINANCIAL STATEMENTS
Telstra Corporation Limited and controlled entities Telstra Annual Report 2013 71
The notes following the financial statements form part of the financial report.
STATEMENT OF COMPREHENSIVE INCOMEFOR THE YEAR ENDED 30 JUNE 2013
Telstra GroupYear ended 30 June
2013 2012Note $m $m
Profit for the yearAttributable to equity holders of Telstra Entity . . . . . . . . . . . . . . . . . . . . . . . . . . . . . . . . 3,813 3,405Attributable to non-controlling interests. . . . . . . . . . . . . . . . . . . . . . . . . . . . . . . . . . . . 52 19
3,865 3,424Items that will not be reclassified subsequently to the income statementRetained profits:- actuarial gain/(loss) on defined benefit plans attributable to equity holders of Telstra Entity . . . . . . . 24 676 (752)- income tax on actuarial gain/(loss) on defined benefit plans . . . . . . . . . . . . . . . . . . . . . . . . (202) 222- actuarial gain/(loss) on defined benefit plans attributable to non-controlling interests . . . . . . . . . . 24 2 (3)Foreign currency translation reserve:- translation differences of foreign operations attributable to non-controlling interests. . . . . . . . . . . . 23 11
499 (522)Items that may be reclassified subsequently to the income statementForeign currency translation reserve:- translation differences of foreign operations attributable to equity holders of Telstra Entity . . . . . . . . 101 68- income tax on movements in the foreign currency translation reserve . . . . . . . . . . . . . . . . . . . 21 9- translation differences transferred to income statement on disposal of controlled entities . . . . . . . . . 112 9- income tax on translation differences transferred to income statement on disposal of controlled entities . 18 -Cash flow hedging reserve:- changes in fair value of cash flow hedges . . . . . . . . . . . . . . . . . . . . . . . . . . . . . . . . . 365 (587)- changes in fair value transferred to other expenses . . . . . . . . . . . . . . . . . . . . . . . . . . . . (617) 204- changes in fair value transferred to goods and services purchased . . . . . . . . . . . . . . . . . . . . 12 7- changes in fair value transferred to finance costs . . . . . . . . . . . . . . . . . . . . . . . . . . . . . 236 263- changes in fair value transferred to property, plant and equipment. . . . . . . . . . . . . . . . . . . . . - 9- income tax on movements in the cash flow hedging reserve . . . . . . . . . . . . . . . . . . . . . . . . (1) 31
247 13
Total other comprehensive income . . . . . . . . . . . . . . . . . . . . . . . . . . . . . . . . . . . . 746 (509)Total comprehensive income for the year . . . . . . . . . . . . . . . . . . . . . . . . . . . . . . . . . 4,611 2,915
Total comprehensive income attributable to equity holders of Telstra Entity . . . . . . . . . . . . . . . . . 4,534 2,888Total comprehensive income attributable to non-controlling interests . . . . . . . . . . . . . . . . . . . . 77 27
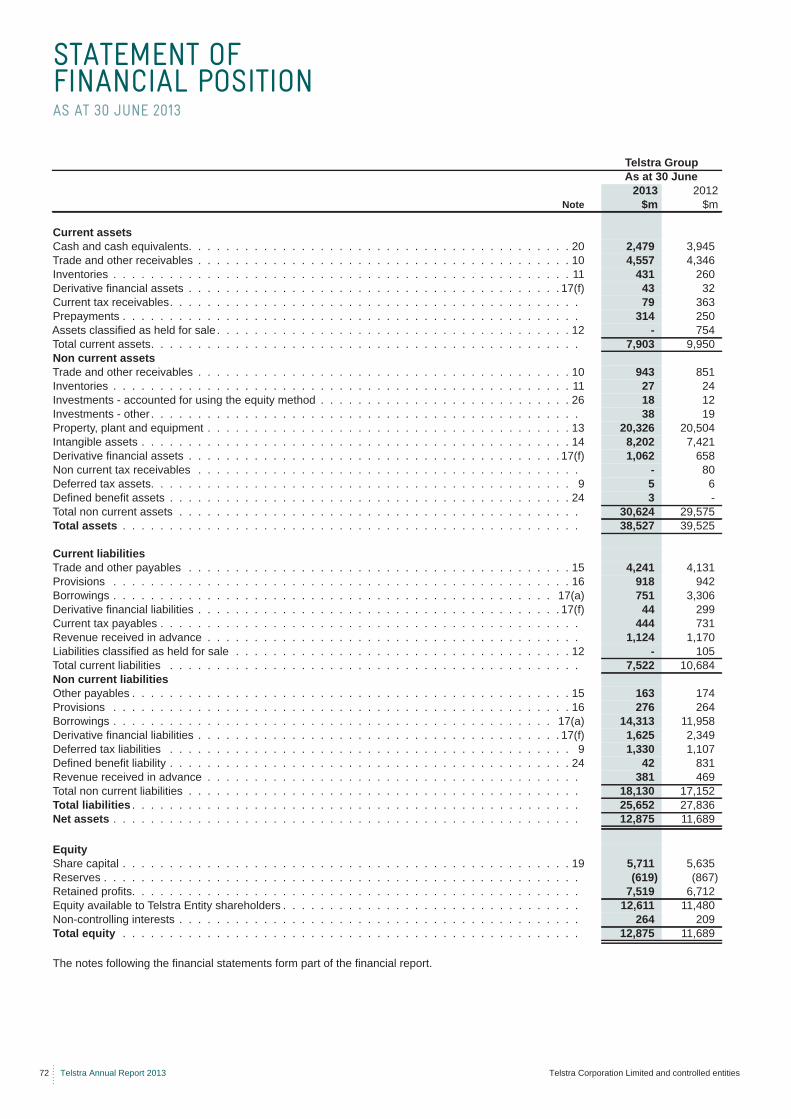
72 Telstra Annual Report 2013 Telstra Corporation Limited and controlled entities
The notes following the financial statements form part of the financial report.
STATEMENT OF FINANCIAL POSITIONAS AT 30 JUNE 2013
Telstra GroupAs at 30 June
2013 2012Note $m $m
Current assetsCash and cash equivalents. . . . . . . . . . . . . . . . . . . . . . . . . . . . . . . . . . . . . . . . . 20 2,479 3,945Trade and other receivables . . . . . . . . . . . . . . . . . . . . . . . . . . . . . . . . . . . . . . . . 10 4,557 4,346Inventories . . . . . . . . . . . . . . . . . . . . . . . . . . . . . . . . . . . . . . . . . . . . . . . . . 11 431 260Derivative financial assets . . . . . . . . . . . . . . . . . . . . . . . . . . . . . . . . . . . . . . . . 17(f) 43 32Current tax receivables. . . . . . . . . . . . . . . . . . . . . . . . . . . . . . . . . . . . . . . . . . . . 79 363Prepayments . . . . . . . . . . . . . . . . . . . . . . . . . . . . . . . . . . . . . . . . . . . . . . . . . 314 250Assets classified as held for sale . . . . . . . . . . . . . . . . . . . . . . . . . . . . . . . . . . . . . . 12 - 754Total current assets. . . . . . . . . . . . . . . . . . . . . . . . . . . . . . . . . . . . . . . . . . . . . . 7,903 9,950Non current assetsTrade and other receivables . . . . . . . . . . . . . . . . . . . . . . . . . . . . . . . . . . . . . . . . 10 943 851Inventories . . . . . . . . . . . . . . . . . . . . . . . . . . . . . . . . . . . . . . . . . . . . . . . . . 11 27 24Investments - accounted for using the equity method . . . . . . . . . . . . . . . . . . . . . . . . . . . 26 18 12Investments - other . . . . . . . . . . . . . . . . . . . . . . . . . . . . . . . . . . . . . . . . . . . . . . 38 19Property, plant and equipment . . . . . . . . . . . . . . . . . . . . . . . . . . . . . . . . . . . . . . . 13 20,326 20,504Intangible assets . . . . . . . . . . . . . . . . . . . . . . . . . . . . . . . . . . . . . . . . . . . . . . 14 8,202 7,421Derivative financial assets . . . . . . . . . . . . . . . . . . . . . . . . . . . . . . . . . . . . . . . . 17(f) 1,062 658Non current tax receivables . . . . . . . . . . . . . . . . . . . . . . . . . . . . . . . . . . . . . . . . . - 80Deferred tax assets. . . . . . . . . . . . . . . . . . . . . . . . . . . . . . . . . . . . . . . . . . . . . 9 5 6Defined benefit assets . . . . . . . . . . . . . . . . . . . . . . . . . . . . . . . . . . . . . . . . . . . 24 3 -Total non current assets . . . . . . . . . . . . . . . . . . . . . . . . . . . . . . . . . . . . . . . . . . . 30,624 29,575Total assets . . . . . . . . . . . . . . . . . . . . . . . . . . . . . . . . . . . . . . . . . . . . . . . . . 38,527 39,525
Current liabilitiesTrade and other payables . . . . . . . . . . . . . . . . . . . . . . . . . . . . . . . . . . . . . . . . . 15 4,241 4,131Provisions . . . . . . . . . . . . . . . . . . . . . . . . . . . . . . . . . . . . . . . . . . . . . . . . . 16 918 942Borrowings . . . . . . . . . . . . . . . . . . . . . . . . . . . . . . . . . . . . . . . . . . . . . . . 17(a) 751 3,306Derivative financial liabilities . . . . . . . . . . . . . . . . . . . . . . . . . . . . . . . . . . . . . . . 17(f) 44 299Current tax payables . . . . . . . . . . . . . . . . . . . . . . . . . . . . . . . . . . . . . . . . . . . . . 444 731Revenue received in advance . . . . . . . . . . . . . . . . . . . . . . . . . . . . . . . . . . . . . . . . 1,124 1,170Liabilities classified as held for sale . . . . . . . . . . . . . . . . . . . . . . . . . . . . . . . . . . . . 12 - 105Total current liabilities . . . . . . . . . . . . . . . . . . . . . . . . . . . . . . . . . . . . . . . . . . . . 7,522 10,684Non current liabilitiesOther payables . . . . . . . . . . . . . . . . . . . . . . . . . . . . . . . . . . . . . . . . . . . . . . . 15 163 174Provisions . . . . . . . . . . . . . . . . . . . . . . . . . . . . . . . . . . . . . . . . . . . . . . . . . 16 276 264Borrowings . . . . . . . . . . . . . . . . . . . . . . . . . . . . . . . . . . . . . . . . . . . . . . . 17(a) 14,313 11,958Derivative financial liabilities . . . . . . . . . . . . . . . . . . . . . . . . . . . . . . . . . . . . . . . 17(f) 1,625 2,349Deferred tax liabilities . . . . . . . . . . . . . . . . . . . . . . . . . . . . . . . . . . . . . . . . . . . 9 1,330 1,107Defined benefit liability . . . . . . . . . . . . . . . . . . . . . . . . . . . . . . . . . . . . . . . . . . . 24 42 831Revenue received in advance . . . . . . . . . . . . . . . . . . . . . . . . . . . . . . . . . . . . . . . . 381 469Total non current liabilities . . . . . . . . . . . . . . . . . . . . . . . . . . . . . . . . . . . . . . . . . . 18,130 17,152Total liabilities . . . . . . . . . . . . . . . . . . . . . . . . . . . . . . . . . . . . . . . . . . . . . . . . 25,652 27,836Net assets . . . . . . . . . . . . . . . . . . . . . . . . . . . . . . . . . . . . . . . . . . . . . . . . . . 12,875 11,689
EquityShare capital . . . . . . . . . . . . . . . . . . . . . . . . . . . . . . . . . . . . . . . . . . . . . . . . 19 5,711 5,635Reserves . . . . . . . . . . . . . . . . . . . . . . . . . . . . . . . . . . . . . . . . . . . . . . . . . . . (619) (867)Retained profits. . . . . . . . . . . . . . . . . . . . . . . . . . . . . . . . . . . . . . . . . . . . . . . . 7,519 6,712Equity available to Telstra Entity shareholders . . . . . . . . . . . . . . . . . . . . . . . . . . . . . . . . 12,611 11,480Non-controlling interests . . . . . . . . . . . . . . . . . . . . . . . . . . . . . . . . . . . . . . . . . . . 264 209Total equity . . . . . . . . . . . . . . . . . . . . . . . . . . . . . . . . . . . . . . . . . . . . . . . . . 12,875 11,689
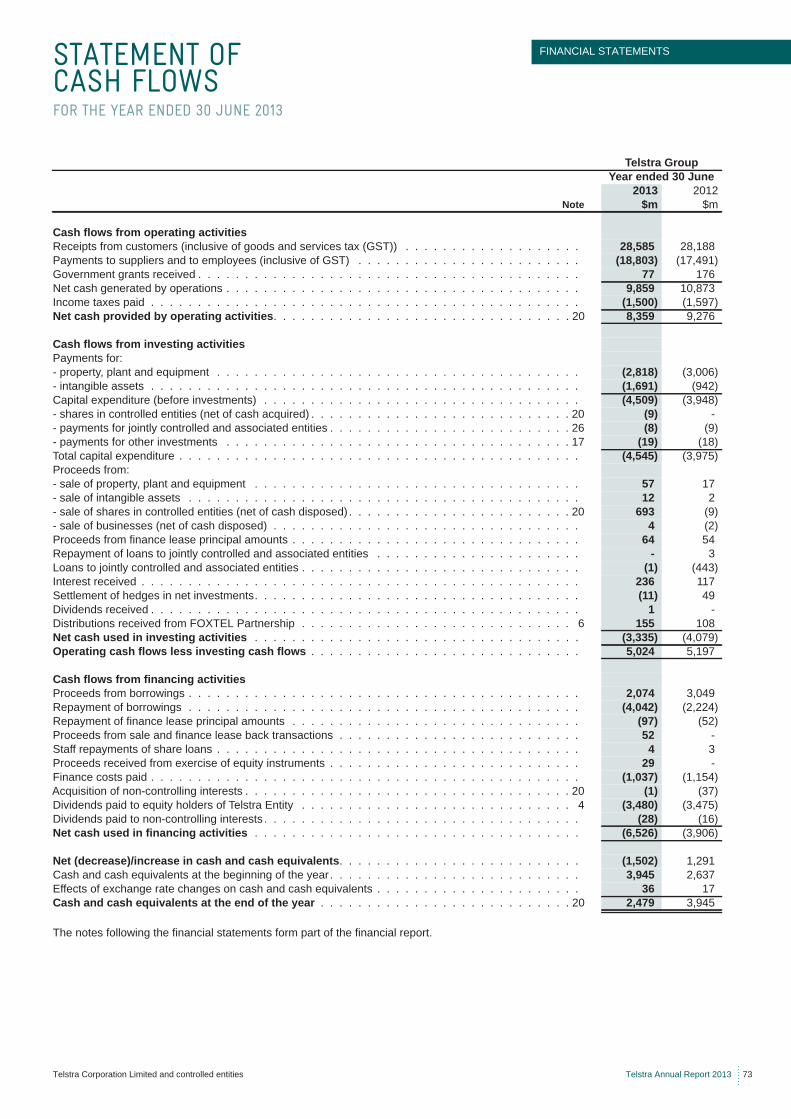
FINANCIAL STATEMENTS
Telstra Corporation Limited and controlled entities Telstra Annual Report 2013 73
The notes following the financial statements form part of the financial report.
STATEMENT OF CASH FLOWSFOR THE YEAR ENDED 30 JUNE 2013
Telstra GroupYear ended 30 June
2013 2012Note $m $m
Cash flows from operating activitiesReceipts from customers (inclusive of goods and services tax (GST)) . . . . . . . . . . . . . . . . . . . 28,585 28,188Payments to suppliers and to employees (inclusive of GST) . . . . . . . . . . . . . . . . . . . . . . . . (18,803) (17,491)Government grants received . . . . . . . . . . . . . . . . . . . . . . . . . . . . . . . . . . . . . . . . . 77 176Net cash generated by operations . . . . . . . . . . . . . . . . . . . . . . . . . . . . . . . . . . . . . . 9,859 10,873Income taxes paid . . . . . . . . . . . . . . . . . . . . . . . . . . . . . . . . . . . . . . . . . . . . . . (1,500) (1,597)Net cash provided by operating activities. . . . . . . . . . . . . . . . . . . . . . . . . . . . . . . . 20 8,359 9,276
Cash flows from investing activitiesPayments for:- property, plant and equipment . . . . . . . . . . . . . . . . . . . . . . . . . . . . . . . . . . . . . . . (2,818) (3,006)- intangible assets . . . . . . . . . . . . . . . . . . . . . . . . . . . . . . . . . . . . . . . . . . . . . . (1,691) (942)Capital expenditure (before investments) . . . . . . . . . . . . . . . . . . . . . . . . . . . . . . . . . . (4,509) (3,948)- shares in controlled entities (net of cash acquired) . . . . . . . . . . . . . . . . . . . . . . . . . . . . 20 (9) -- payments for jointly controlled and associated entities . . . . . . . . . . . . . . . . . . . . . . . . . . 26 (8) (9)- payments for other investments . . . . . . . . . . . . . . . . . . . . . . . . . . . . . . . . . . . . . 17 (19) (18)Total capital expenditure . . . . . . . . . . . . . . . . . . . . . . . . . . . . . . . . . . . . . . . . . . . (4,545) (3,975)Proceeds from:- sale of property, plant and equipment . . . . . . . . . . . . . . . . . . . . . . . . . . . . . . . . . . . 57 17- sale of intangible assets . . . . . . . . . . . . . . . . . . . . . . . . . . . . . . . . . . . . . . . . . . 12 2- sale of shares in controlled entities (net of cash disposed) . . . . . . . . . . . . . . . . . . . . . . . . 20 693 (9)- sale of businesses (net of cash disposed) . . . . . . . . . . . . . . . . . . . . . . . . . . . . . . . . . 4 (2)Proceeds from finance lease principal amounts . . . . . . . . . . . . . . . . . . . . . . . . . . . . . . . 64 54Repayment of loans to jointly controlled and associated entities . . . . . . . . . . . . . . . . . . . . . . - 3Loans to jointly controlled and associated entities . . . . . . . . . . . . . . . . . . . . . . . . . . . . . . (1) (443)Interest received . . . . . . . . . . . . . . . . . . . . . . . . . . . . . . . . . . . . . . . . . . . . . . . 236 117Settlement of hedges in net investments. . . . . . . . . . . . . . . . . . . . . . . . . . . . . . . . . . . (11) 49Dividends received . . . . . . . . . . . . . . . . . . . . . . . . . . . . . . . . . . . . . . . . . . . . . . 1 -Distributions received from FOXTEL Partnership . . . . . . . . . . . . . . . . . . . . . . . . . . . . . 6 155 108Net cash used in investing activities . . . . . . . . . . . . . . . . . . . . . . . . . . . . . . . . . . . (3,335) (4,079)Operating cash flows less investing cash flows . . . . . . . . . . . . . . . . . . . . . . . . . . . . . 5,024 5,197
Cash flows from financing activitiesProceeds from borrowings . . . . . . . . . . . . . . . . . . . . . . . . . . . . . . . . . . . . . . . . . . 2,074 3,049Repayment of borrowings . . . . . . . . . . . . . . . . . . . . . . . . . . . . . . . . . . . . . . . . . . (4,042) (2,224)Repayment of finance lease principal amounts . . . . . . . . . . . . . . . . . . . . . . . . . . . . . . . (97) (52)Proceeds from sale and finance lease back transactions . . . . . . . . . . . . . . . . . . . . . . . . . . 52 -Staff repayments of share loans . . . . . . . . . . . . . . . . . . . . . . . . . . . . . . . . . . . . . . . 4 3Proceeds received from exercise of equity instruments . . . . . . . . . . . . . . . . . . . . . . . . . . . 29 -Finance costs paid . . . . . . . . . . . . . . . . . . . . . . . . . . . . . . . . . . . . . . . . . . . . . . (1,037) (1,154)Acquisition of non-controlling interests . . . . . . . . . . . . . . . . . . . . . . . . . . . . . . . . . . . 20 (1) (37)Dividends paid to equity holders of Telstra Entity . . . . . . . . . . . . . . . . . . . . . . . . . . . . . 4 (3,480) (3,475)Dividends paid to non-controlling interests . . . . . . . . . . . . . . . . . . . . . . . . . . . . . . . . . . (28) (16)Net cash used in financing activities . . . . . . . . . . . . . . . . . . . . . . . . . . . . . . . . . . . (6,526) (3,906)
Net (decrease)/increase in cash and cash equivalents. . . . . . . . . . . . . . . . . . . . . . . . . . (1,502) 1,291Cash and cash equivalents at the beginning of the year . . . . . . . . . . . . . . . . . . . . . . . . . . . 3,945 2,637Effects of exchange rate changes on cash and cash equivalents . . . . . . . . . . . . . . . . . . . . . . 36 17Cash and cash equivalents at the end of the year . . . . . . . . . . . . . . . . . . . . . . . . . . . 20 2,479 3,945
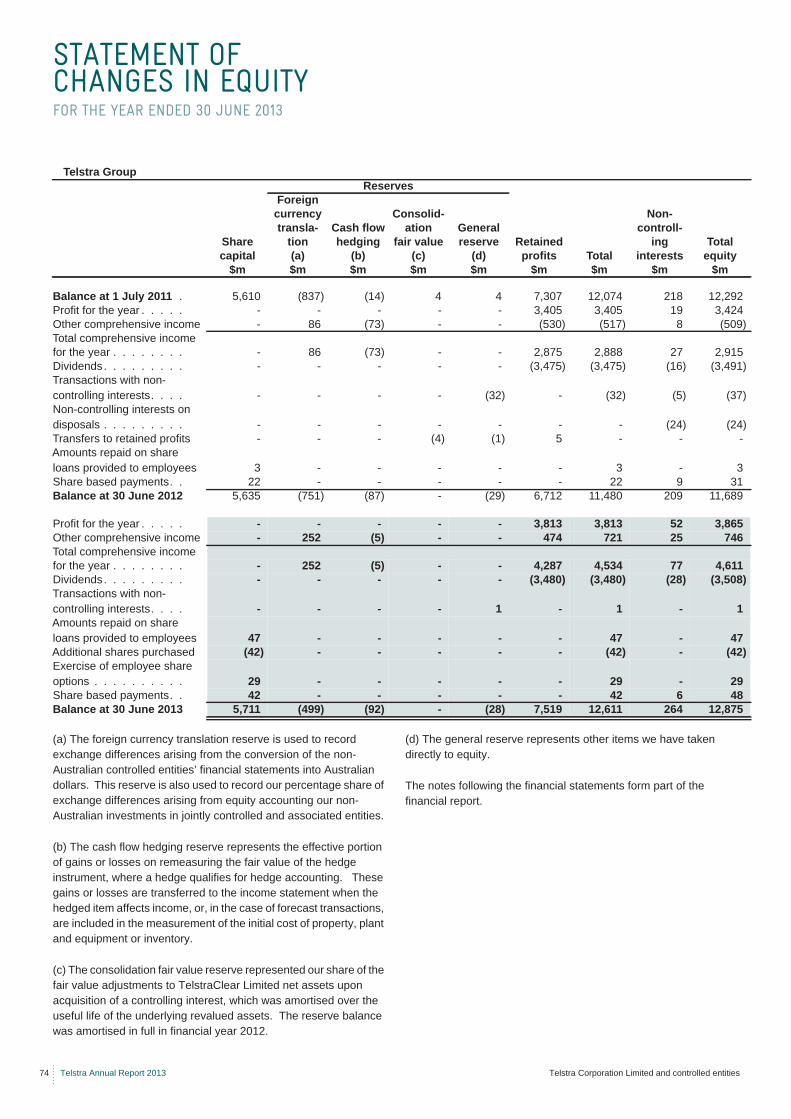
74 Telstra Annual Report 2013 Telstra Corporation Limited and controlled entities
(a) The foreign currency translation reserve is used to record exchange differences arising from the conversion of the non-Australian controlled entities’ financial statements into Australian dollars. This reserve is also used to record our percentage share of exchange differences arising from equity accounting our non-Australian investments in jointly controlled and associated entities.
(b) The cash flow hedging reserve represents the effective portion of gains or losses on remeasuring the fair value of the hedge instrument, where a hedge qualifies for hedge accounting. These gains or losses are transferred to the income statement when the hedged item affects income, or, in the case of forecast transactions, are included in the measurement of the initial cost of property, plant and equipment or inventory.
(c) The consolidation fair value reserve represented our share of the fair value adjustments to TelstraClear Limited net assets upon acquisition of a controlling interest, which was amortised over the useful life of the underlying revalued assets. The reserve balance was amortised in full in financial year 2012.
(d) The general reserve represents other items we have taken directly to equity.
The notes following the financial statements form part of the financial report.
STATEMENT OF CHANGES IN EQUITYFOR THE YEAR ENDED 30 JUNE 2013
Telstra GroupReserves
Foreigncurrency Consolid- Non-transla- Cash flow ation General controll-
Share tion hedging fair value reserve Retained ing Totalcapital (a) (b) (c) (d) profits Total interests equity
$m $m $m $m $m $m $m $m $m
Balance at 1 July 2011 . 5,610 (837) (14) 4 4 7,307 12,074 218 12,292Profit for the year . . . . . - - - - - 3,405 3,405 19 3,424Other comprehensive income - 86 (73) - - (530) (517) 8 (509)Total comprehensive incomefor the year . . . . . . . . - 86 (73) - - 2,875 2,888 27 2,915Dividends. . . . . . . . . - - - - - (3,475) (3,475) (16) (3,491)Transactions with non-controlling interests. . . . - - - - (32) - (32) (5) (37)Non-controlling interests on disposals . . . . . . . . . - - - - - - - (24) (24)Transfers to retained profits - - - (4) (1) 5 - - -Amounts repaid on share loans provided to employees 3 - - - - - 3 - 3Share based payments. . 22 - - - - - 22 9 31Balance at 30 June 2012 5,635 (751) (87) - (29) 6,712 11,480 209 11,689
Profit for the year . . . . . - - - - - 3,813 3,813 52 3,865Other comprehensive income - 252 (5) - - 474 721 25 746Total comprehensive incomefor the year . . . . . . . . - 252 (5) - - 4,287 4,534 77 4,611Dividends. . . . . . . . . - - - - - (3,480) (3,480) (28) (3,508)Transactions with non-controlling interests. . . . - - - - 1 - 1 - 1Amounts repaid on share loans provided to employees 47 - - - - - 47 - 47Additional shares purchased (42) - - - - - (42) - (42)Exercise of employee share options . . . . . . . . . . 29 - - - - - 29 - 29Share based payments. . 42 - - - - - 42 6 48Balance at 30 June 2013 5,711 (499) (92) - (28) 7,519 12,611 264 12,875
NOTES TO THE FINANCIAL STATEMENTS
FINANCIAL STATEMENTS
Telstra Corporation Limited and controlled entities Telstra Annual Report 2013 75
In this financial report, we, us, our, Telstra, the Telstra Group and the Group - all mean Telstra Corporation Limited, an Australian corporation and its controlled entities as a whole. Telstra Entity is the legal entity, Telstra Corporation Limited. Telstra Entity, the Company, is a company limited by shares incorporated in Australia whose shares are publicly traded on the Australian Securities Exchange.
Our financial year ends on 30 June. Unless we state differently the following applies:
• year or financial year means the year ended 30 June;• reporting date means the date 30 June; and• 2013 means financial year 2013 and similarly for other financial
years.
The financial report of the Telstra Group for the year ended 30 June 2013 was authorised for issue in accordance with a resolution of the Telstra Board of Directors on 8 August 2013. The Directors have the power to amend and reissue the financial report.
The principal accounting policies used in preparing the financial report of the Telstra Group are set out in note 2 to our financial statements.
1.1 Basis of preparation of the financial report
This financial report is a general purpose financial report, prepared by a for-profit entity, in accordance with the requirements of the Australian Corporations Act 2001, Accounting Standards applicable in Australia and other authoritative pronouncements of the Australian Accounting Standards Board. This financial report also complies with International Financial Reporting Standards and Interpretations published by the International Accounting Standards Board.
Both the functional and presentation currency of the Telstra Entity and its Australian controlled entities is Australian dollars. The functional currency of certain non Australian controlled entities is not Australian dollars. As a result, the results of these entities are translated into Australian dollars for presentation in the Telstra Group financial report.
This financial report is prepared in accordance with historical cost, except for some categories of investments and some financial instruments which are recorded at fair value. Cost is the fair value of the consideration given in exchange for net assets acquired.
In preparing this financial report, we are required to make judgements and estimates that affect:
• income and expenses for the year;• the reported amounts of assets and liabilities; and• the disclosure of off balance sheet arrangements, including
contingent assets and contingent liabilities.
We continually evaluate our judgements and estimates. We base our judgements and estimates on historical experience, various other assumptions we believe to be reasonable under the circumstances and, where appropriate, practices adopted by international telecommunications companies. Actual results may differ from our estimates.
1.2 Clarification of terminology used in our income statement
Under the requirements of AASB 101: “Presentation of Financial Statements“, we must classify all of our expenses (apart from any finance costs and our share of net profit/loss from jointly controlled and associated entities) according to either the nature (type) of the expense or the function (activity to which the expense relates). We have chosen to classify our expenses using the nature classification as it more accurately reflects the type of operations we undertake.
Earnings before interest, income tax expense, depreciation and amortisation (EBITDA) reflects our profit for the year prior to including the effect of net finance costs, income taxes, depreciation and amortisation. Depreciation and amortisation are calculated in accordance with AASB 116: “Property, Plant and Equipment“ and AASB 138: “Intangible Assets“ respectively. We believe that EBITDA is a relevant and useful financial measure used by management to measure the company’s operating performance.
Our management uses EBITDA and earnings before interest and income tax expense (EBIT), in combination with other financial measures, primarily to evaluate the company’s operating performance before financing, income tax and non-cash capital related expenses. In addition, we believe EBITDA is useful to investors because analysts and other members of the investment community largely view EBITDA as a key and widely recognised measure of operating performance.
EBIT is a similar measure to EBITDA, but it takes into account depreciation and amortisation.
1.3 Rounding
All dollar amounts in this financial report (except where indicated) have been rounded to the nearest million dollars ($m) for presentation. This has been done in accordance with Australian Securities and Investments Commission (ASIC) Class Order 98/100, dated 10 July 1998, issued under section 341(1) of the Corporations Act 2001. Telstra is an entity to which this class order applies.
1. BASIS OF PREPARATION
NOTES TO THE FINANCIAL STATEMENTS (CONTINUED)
76 Telstra Annual Report 2013 Telstra Corporation Limited and controlled entities
2.1 Changes in accounting policies
The following accounting policy change occurred during the year ended 30 June 2013:
(a) Presentation of labour substitution costs
Labour substitution costs were reclassified from other expenses to labour costs in the income statement in order to align with the presentation of total labour expenses in our “Full Year Results and Operations Review”. We believe this provides more relevant information to the users of the financial statements. The reclassification has no impact on profit, equity or earnings per share calculations. Comparatives have been adjusted accordingly as illustrated in the below table to present a like-for-like view:
We have had no other changes in accounting policy during the year ended 30 June 2013. However, we note the following new accounting standard, applicable in the current year:
(b) Deferred Tax: Recovery of Underlying Assets
AASB 2010-8: “Amendments to Australian Accounting Standards - Deferred Tax: Recovery of Underlying Assets” provides clarification regarding the measurement of deferred tax for investment property, where the fair value model is applied, and for property, plant and equipment and intangibles, where the revaluation model is applied. It provides that measurement of deferred tax should be determined under the assumption that the underlying asset will be recovered through sale (as opposed to use) unless otherwise rebutted.
This new accounting standard does not have an impact on Telstra as we do not adopt a revaluation model for any of our property, plant and equipment or intangibles and we have no investment properties.
2.2 Principles of consolidation
The consolidated financial report includes the assets and liabilities of the Telstra Entity and its controlled entities as a whole as at the end of the year and the consolidated results and cash flows for the year. The effect of all intragroup transactions and balances are eliminated in full from our consolidated financial statements.
An entity is considered to be a controlled entity where we are able to dominate decision making, directly or indirectly, relating to the financial and operating policies of that entity so as to obtain benefits from its activities.
Where we do not control an entity for the entire year, results and cash flows for those entities are only included from the date on which control commences, or up until the date on which there is a loss of control.
Non-controlling interests in the results and equity of controlled entities are shown separately in our income statement, statement of comprehensive income and statement of financial position.
We account for the acquisition of our controlled entities using the acquisition method of accounting. This involves recognising the acquiree’s identifiable assets, liabilities and contingent liabilities at their fair value at the date of acquisition. Any excess of the fair value of consideration over our interest in the fair value of the acquiree’s identifiable assets, liabilities and contingent liabilities is recognised as goodwill.
The financial statements of controlled entities are prepared for the same reporting period as the Telstra Entity, using consistent accounting policies. Adjustments are made to bring into line any dissimilar accounting policies.
2.3 Foreign currency translation
(a) Transactions and balances
Foreign currency transactions are converted into the relevant functional currency at market exchange rates applicable at the date of the transactions. Amounts payable or receivable in foreign currencies at reporting date are converted into the relevant functional currency at market exchange rates at reporting date. Any currency translation gains and losses that arise are included in our income statement. Where we enter into a hedge for a specific expenditure commitment or for the construction of an asset, hedging gains and losses are accumulated in other comprehensive income over the period of the hedge and are transferred to the carrying value of the asset upon completion, or included in the income statement at the same time as the discharge of the expenditure commitment.
The consolidated financial statements are presented in Australian dollars, which is the functional and presentation currency of Telstra Corporation Limited.
(b) Financial reports of foreign operations that have a functional currency that is not Australian dollars
Our operations include subsidiaries, associates, and jointly controlled entities, the activities and operations of which are in an economic environment where the functional currency is not Australian dollars. The financial statements of these entities are translated into Australian dollars (our presentation currency) using the following method:
• assets and liabilities are translated into Australian dollars using market exchange rates at reporting date;
• equity at the date of investment is translated into Australian dollars at the exchange rate current at that date. Movements post-acquisition (other than retained profits/accumulated losses) are translated at the exchange rates current at the dates of those movements;
• income statements are translated into Australian dollars at average exchange rates for the year, unless there are significant identifiable transactions, which are translated at the exchange rate that existed on the date of the transaction; and
• currency translation gains and losses are recorded in other comprehensive income.
2. SUMMARY OF SIGNIFICANT ACCOUNTING POLICIES, ESTIMATES, ASSUMPTIONS AND JUDGEMENTS
Expenses line item Telstra Group 30 June 2012
Reported Adjustment Restated$m $m $m
Labour . . . . . . . . . . . 4,061 906 4,967Other expenses . . . . . . 5,029 (906) 4,123
NOTES TO THE FINANCIAL STATEMENTS (CONTINUED)
FINANCIAL STATEMENTS
Telstra Corporation Limited and controlled entities Telstra Annual Report 2013 77
2.3 Foreign currency translation (continued)
(b) Financial reports of foreign operations that have a functional currency that is not Australian dollars (continued)
Refer to note 2.22(c) for details regarding our accounting policy for derivative financial instruments and foreign currency monetary items that are used to hedge our net investment in entities which have a functional currency that is not in Australian dollars.
2.4 Cash and cash equivalents
Cash and cash equivalents include cash at bank and on hand, bank deposits, negotiable certificates of deposit and bills of exchange that are held for the purposes of meeting short term cash commitments rather than investment purposes.
Bank deposits are recorded at amounts to be received. Negotiable certificates of deposit and bills of exchange are classified as “available-for-sale” financial assets and are held at fair value. The carrying amount of these assets approximates their fair value due to the short term to maturity.
2.5 Trade and other receivables
Trade and other receivables are considered financial assets. They are initially recorded at the fair value of the amounts to be received and are subsequently measured at amortised cost using the effective interest method. These financial assets are derecognised when the rights to receive cash flows from the financial assets have expired or have been transferred and we have transferred substantially all the risks and rewards of ownership.
An allowance for doubtful debts is raised to reduce the carrying amount of trade receivables, based on a review of outstanding amounts at reporting date. The allowance for doubtful debts is based on historical trends and management's assessment of general economic conditions. An allowance for doubtful debts is raised when management considers there is a credit risk, insolvency risk or incapacity to pay a legally recoverable debt. Bad debts specifically provided for in previous years are eliminated against the allowance for doubtful debts. In all other cases, bad debts are eliminated directly against the carrying amount and written off as an expense in the income statement.
2.6 Inventories
Our finished goods include goods available for sale, and material and spare parts to be used in constructing and maintaining the telecommunications network. We value inventories at the lower of cost and net realisable value.
For the majority of inventory items, we assign cost using the weighted average cost basis. For materials used in the production of directories the “first in first out” basis is used for assigning cost.
Net realisable value of items expected to be sold is the estimated selling price in the ordinary course of business, less estimated costs of completion and the estimated costs incurred in marketing, selling and distribution. It approximates fair value less costs to sell. We calculate net realisable value of inventories by making certain price assumptions to project selling prices into the future and assumptions about technologies at reporting date.
Net realisable value of items expected to be consumed, for example used in the construction of another asset, is the net value expected to be earned through future use.
2.7 Construction contracts
(a) Valuation
We record construction contracts in progress at cost (including any profits recognised) less progress billings and any provision for foreseeable losses. Cost includes:
• both variable and fixed costs directly related to specific contracts;• amounts that are attributable to contract activity in general and
which can be allocated to specific contracts on a reasonable basis; and
• costs expected to be incurred under penalty clauses, warranty provisions and other variances.
Where a significant loss is estimated to be made on completion, a provision for foreseeable losses is brought to account and recorded against the gross amount of construction work in progress.
(b) Recognition of revenue and profit
Revenue and profit is recognised on an individual project basis using the percentage of completion method. The percentage of completion is calculated based on estimated costs of completion. Refer to note 2.17(d) for further details.
Profits are recognised when:
• the stage of contract completion can be reliably determined;• costs to date can be clearly identified; and• total contract revenues to be received and costs to complete can
be reliably estimated.
(c) Disclosure
The construction work in progress balance is recorded in current inventories after deducting progress billings. Where progress billings exceed the balance of construction work in progress, the net amount is shown as a current liability within trade and other payables.
2. SUMMARY OF SIGNIFICANT ACCOUNTING POLICIES, ESTIMATES, ASSUMPTIONS AND JUDGEMENTS (CONTINUED)
NOTES TO THE FINANCIAL STATEMENTS (CONTINUED)
78 Telstra Annual Report 2013 Telstra Corporation Limited and controlled entities
2.8 Investments
(a) Jointly controlled and associated entities
(i) Jointly controlled entities
A jointly controlled entity is a contractual arrangement (in the form of an entity) whereby two or more parties take on an economic activity that is governed by joint control. Joint control involves the contractually agreed sharing of control over an entity where two or more parties must consent to all major decisions. Our interests in jointly controlled entities, including partnerships, are accounted for using the equity method of accounting in the Telstra Group financial statements.
Under the equity method of accounting, we adjust the initial recorded amount of the investment for our share of:
• profits or losses after tax for the year since the date of investment;
• reserve movements since the date of investment;• unrealised profits or losses;• dividends or distributions received; and• deferred profit brought to account.
Where the equity accounted amount of our investment in an entity falls below zero, we suspend the equity method of accounting and record the investment at zero. When this occurs, the equity method of accounting does not recommence until our share of profits and reserves exceeds the cumulative prior years’ share of losses and reserve reductions. Where we have long term assets that in substance form part of our investment in equity accounted interests and the equity accounted amount of the investment falls below zero, we reduce the value of these long term assets in proportion to our cumulative losses.
(ii) Associated entities
Where we hold an interest in the equity of an entity, generally of between 20 per cent and 50 per cent, and are able to significantly influence the decisions of the entity, that entity is an associated entity. Associated entities are accounted for using the equity method of accounting in the Telstra Group financial statements.
(b) Jointly controlled assets
A jointly controlled asset involves the joint control of one or more assets acquired and dedicated for the purpose of a joint venture. The assets are used to obtain benefits for the venturers. Where the asset is significant we record our share of the asset. We record income and expenses based on our percentage ownership interest of the jointly controlled asset.
(c) Listed securities and investments in other corporations
Our investments in listed securities and in other corporations are classified as “available-for-sale” financial assets and are measured at fair value at each reporting date.
Fair values are calculated on the following basis:
• for listed securities traded in an organised financial market, we use the current quoted market bid price at reporting date; and
• for investments in unlisted entities whose securities are not traded in an organised financial market, we establish fair value by using valuation techniques, including reference to discounted cash flows and fair values of recent arm’s length transactions involving instruments that are substantially the same.
We remeasure the fair value of our investments in listed securities and other corporations at each reporting date. Any gains or losses are recognised in other comprehensive income until we dispose of the investment or we determine it to be impaired, at which time we transfer all cumulative gains and losses to the income statement. Purchases and sales of investments are recognised on settlement date, being the date on which we receive or deliver an asset.
2.9 Impairment
(a) Non-financial assets
Our tangible and intangible assets (excluding inventories, assets arising from construction contracts, current and deferred tax assets, defined benefit assets and financial assets) are measured using the cost basis and are written down to recoverable amount where their carrying value exceeds recoverable amount.
Assets with an indefinite useful life are not subject to amortisation and are tested on an annual basis for impairment, or where an indication of impairment exists. Assets that are subject to amortisation are reviewed for impairment whenever events or changes in circumstances indicate that the carrying amount may not be recoverable.
The recoverable amount of an asset is the higher of its fair value less costs to sell and its value in use. Value in use represents the present value of the future amount expected to be recovered through the cash inflows and outflows arising from the asset’s continued use and subsequent disposal. We recognise any reduction in the carrying value as an expense in the income statement in the reporting period in which the impairment loss occurs.
In determining value in use, we apply management judgement in establishing forecasts of future operating performance, as well as the selection of growth rates, terminal rates and discount rates. These judgements are applied based on our understanding of historical information and expectations of future performance.
The expected net cash flows included in determining recoverable amounts of our assets are discounted to present values using a market determined, risk adjusted discount rate. When determining an appropriate discount rate, we use the weighted average cost of capital (WACC) as an initial point of reference, adjusted for specific risks associated with each different category of assets assessed.
2. SUMMARY OF SIGNIFICANT ACCOUNTING POLICIES, ESTIMATES, ASSUMPTIONS AND JUDGEMENTS (CONTINUED)
NOTES TO THE FINANCIAL STATEMENTS (CONTINUED)
FINANCIAL STATEMENTS
Telstra Corporation Limited and controlled entities Telstra Annual Report 2013 79
2.9 Impairment (continued)
(a) Non-financial assets (continued)
For assets that do not generate largely independent cash inflows, the recoverable amount is determined for the cash generating unit (CGU) to which that asset belongs. In addition, when goodwill is allocated to a CGU, the unit cannot be larger than an operating segment. Our CGUs are determined according to the lowest level of aggregation for which an active market exists and the assets involved generate largely independent cash inflows.
We apply management judgement to establish our CGUs. We have determined that assets forming part of our ubiquitous telecommunications network work together to generate net cash inflows. No one item of telecommunications equipment is of any value without the other assets to which it is connected in order to achieve the delivery of products and services. As a result, we have determined that the ubiquitous telecommunications network is a single CGU. We have referred to this CGU as the Telstra Entity CGU in our financial report.
The Telstra Entity CGU excludes the hybrid fibre coaxial (HFC) cable network, which we consider not to be integrated with the rest of our telecommunications network. Refer to note 21 for further details.
(b) Financial assets
At each reporting date we assess whether there is objective evidence to suggest that any of our financial assets are impaired.
For listed securities and investments in other corporations, we consider the financial asset to be impaired when there has been a significant or prolonged decline in the fair value of the financial asset below its acquisition cost. At this time, all revaluation losses in relation to impaired financial assets that have been accumulated within other comprehensive income are recognised in the income statement.
For financial assets held at cost or amortised cost, we consider the financial asset to be impaired when there is objective evidence as a result of one or more events that the present value of estimated discounted future cash flows is lower than the carrying value. Any impairment losses are recognised immediately in the income statement.
2.10 Property, plant and equipment
(a) Acquisition
Items of property, plant and equipment are recorded at cost and depreciated as described in note 2.10 (b). The cost of our constructed property, plant and equipment is directly attributable in bringing the asset to the location and condition necessary for its intended use and includes:
• the cost of material and direct labour;• an appropriate proportion of direct and indirect overheads; and• where we have an obligation for removal of the asset or
restoration of the site, an estimate of the cost of restoration or removal if that cost can be reliably estimated.
Management judgement is required in the assessment of the types of costs that are directly attributable to the construction of our property, plant and equipment. Satisfying the directly attributable criteria requires an assessment of those unavoidable costs that, if not incurred, would result in the property, plant and equipment not being constructed. We capitalise borrowing costs that are directly attributable to the acquisition, construction or production of a qualifying asset.
We review our property, plant and equipment assets and property, plant and equipment under construction on a regular basis to ensure that the assets are still in use and that the projects are still expected to be completed. Refer to note 7 for details of impairment losses recognised on our property, plant and equipment.
Where settlement of any part of the cash consideration is deferred, the amounts payable in the future are discounted to their present value as at the date of acquisition. The unwinding of this discount is recorded within finance costs.
We account for our assets individually where this is practical, feasible and in line with commercial practice. Where it is not practical and feasible to do so, we account for assets in groups. Group assets are automatically removed from our financial statements on reaching the group life. Therefore, any individual asset may be physically retired before or after the group life is attained. This is the case for certain communication assets as we assess our technologies to be replaced by a certain date.
2. SUMMARY OF SIGNIFICANT ACCOUNTING POLICIES, ESTIMATES, ASSUMPTIONS AND JUDGEMENTS (CONTINUED)
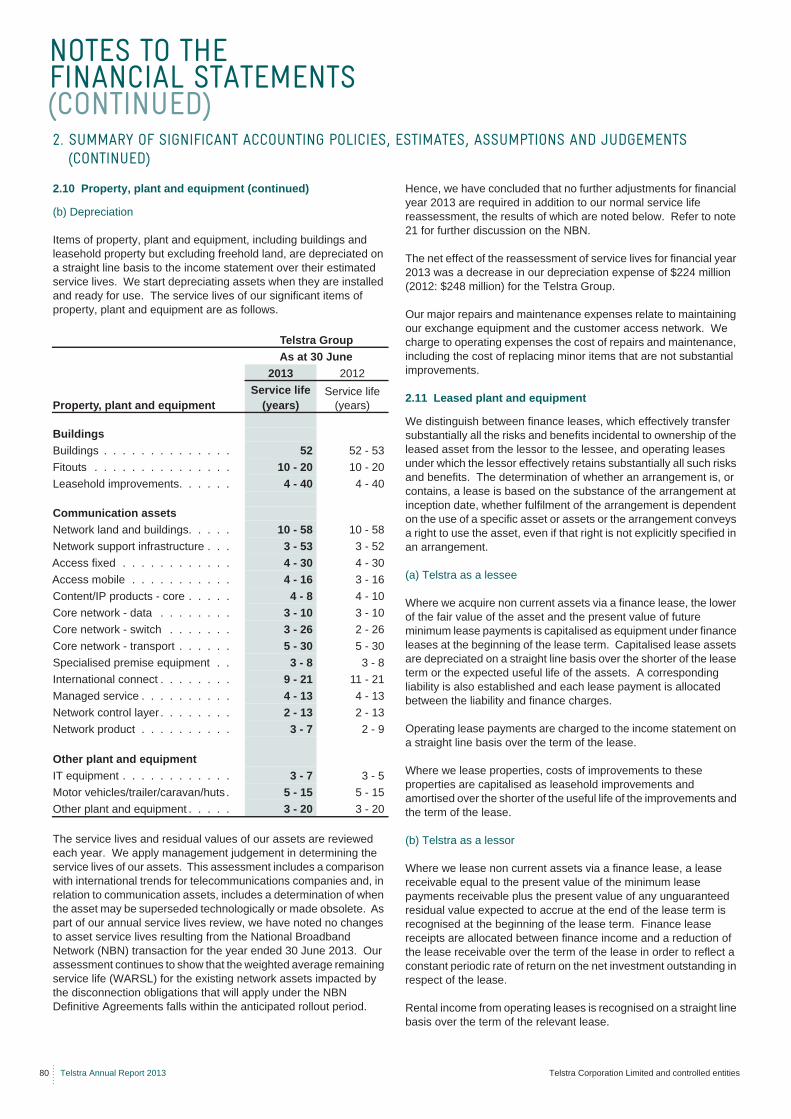
NOTES TO THE FINANCIAL STATEMENTS (CONTINUED)
80 Telstra Annual Report 2013 Telstra Corporation Limited and controlled entities
2.10 Property, plant and equipment (continued)
(b) Depreciation
Items of property, plant and equipment, including buildings and leasehold property but excluding freehold land, are depreciated on a straight line basis to the income statement over their estimated service lives. We start depreciating assets when they are installed and ready for use. The service lives of our significant items of property, plant and equipment are as follows.
The service lives and residual values of our assets are reviewed each year. We apply management judgement in determining the service lives of our assets. This assessment includes a comparison with international trends for telecommunications companies and, in relation to communication assets, includes a determination of when the asset may be superseded technologically or made obsolete. As part of our annual service lives review, we have noted no changes to asset service lives resulting from the National Broadband Network (NBN) transaction for the year ended 30 June 2013. Our assessment continues to show that the weighted average remaining service life (WARSL) for the existing network assets impacted by the disconnection obligations that will apply under the NBN Definitive Agreements falls within the anticipated rollout period.
Hence, we have concluded that no further adjustments for financial year 2013 are required in addition to our normal service life reassessment, the results of which are noted below. Refer to note 21 for further discussion on the NBN.
The net effect of the reassessment of service lives for financial year 2013 was a decrease in our depreciation expense of $224 million (2012: $248 million) for the Telstra Group.
Our major repairs and maintenance expenses relate to maintaining our exchange equipment and the customer access network. We charge to operating expenses the cost of repairs and maintenance, including the cost of replacing minor items that are not substantial improvements.
2.11 Leased plant and equipment
We distinguish between finance leases, which effectively transfer substantially all the risks and benefits incidental to ownership of the leased asset from the lessor to the lessee, and operating leases under which the lessor effectively retains substantially all such risks and benefits. The determination of whether an arrangement is, or contains, a lease is based on the substance of the arrangement at inception date, whether fulfilment of the arrangement is dependent on the use of a specific asset or assets or the arrangement conveys a right to use the asset, even if that right is not explicitly specified in an arrangement.
(a) Telstra as a lessee
Where we acquire non current assets via a finance lease, the lower of the fair value of the asset and the present value of future minimum lease payments is capitalised as equipment under finance leases at the beginning of the lease term. Capitalised lease assets are depreciated on a straight line basis over the shorter of the lease term or the expected useful life of the assets. A corresponding liability is also established and each lease payment is allocated between the liability and finance charges.
Operating lease payments are charged to the income statement on a straight line basis over the term of the lease.
Where we lease properties, costs of improvements to these properties are capitalised as leasehold improvements and amortised over the shorter of the useful life of the improvements and the term of the lease.
(b) Telstra as a lessor
Where we lease non current assets via a finance lease, a lease receivable equal to the present value of the minimum lease payments receivable plus the present value of any unguaranteed residual value expected to accrue at the end of the lease term is recognised at the beginning of the lease term. Finance lease receipts are allocated between finance income and a reduction of the lease receivable over the term of the lease in order to reflect a constant periodic rate of return on the net investment outstanding in respect of the lease.
Rental income from operating leases is recognised on a straight line basis over the term of the relevant lease.
2. SUMMARY OF SIGNIFICANT ACCOUNTING POLICIES, ESTIMATES, ASSUMPTIONS AND JUDGEMENTS (CONTINUED)
Telstra GroupAs at 30 June
2013 2012
Property, plant and equipmentService life
(years)Service life
(years)
BuildingsBuildings . . . . . . . . . . . . . . 52 52 - 53Fitouts . . . . . . . . . . . . . . . 10 - 20 10 - 20Leasehold improvements. . . . . . 4 - 40 4 - 40
Communication assetsNetwork land and buildings. . . . . 10 - 58 10 - 58Network support infrastructure . . . 3 - 53 3 - 52Access fixed . . . . . . . . . . . . 4 - 30 4 - 30Access mobile . . . . . . . . . . . 4 - 16 3 - 16Content/IP products - core . . . . . 4 - 8 4 - 10Core network - data . . . . . . . . 3 - 10 3 - 10Core network - switch . . . . . . . 3 - 26 2 - 26Core network - transport . . . . . . 5 - 30 5 - 30Specialised premise equipment . . 3 - 8 3 - 8International connect . . . . . . . . 9 - 21 11 - 21Managed service . . . . . . . . . . 4 - 13 4 - 13Network control layer . . . . . . . . 2 - 13 2 - 13Network product . . . . . . . . . . 3 - 7 2 - 9
Other plant and equipmentIT equipment . . . . . . . . . . . . 3 - 7 3 - 5Motor vehicles/trailer/caravan/huts . 5 - 15 5 - 15Other plant and equipment . . . . . 3 - 20 3 - 20
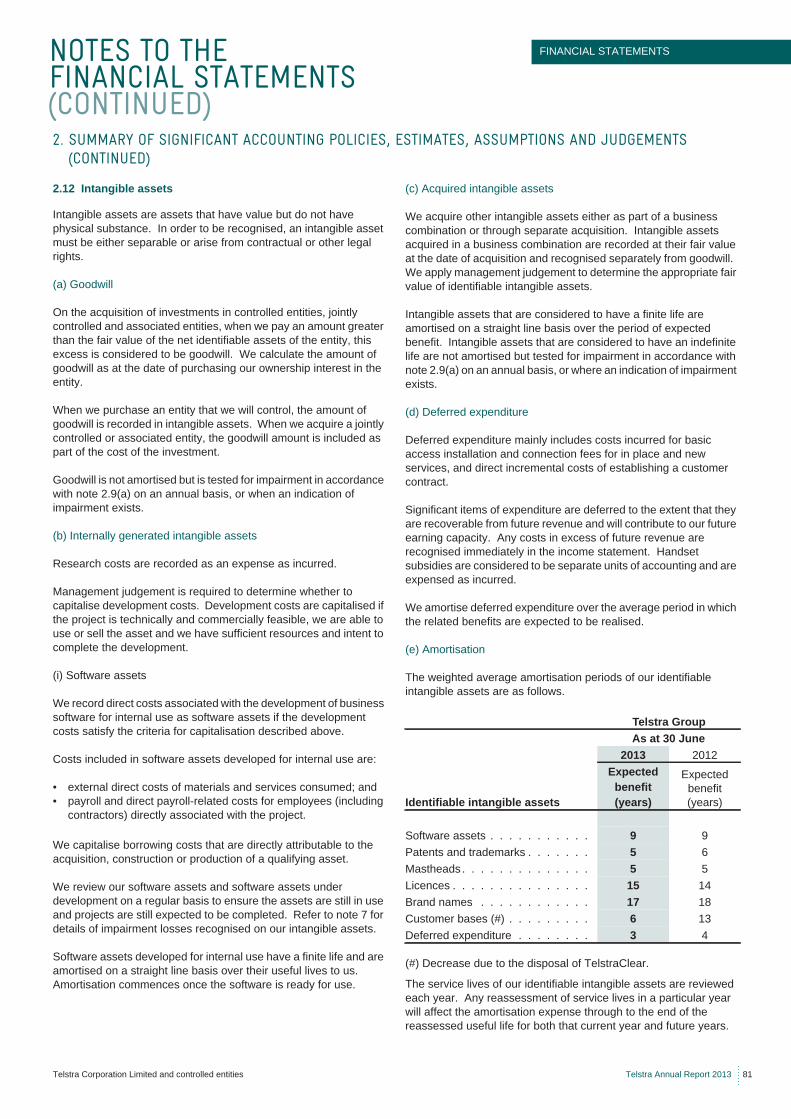
NOTES TO THE FINANCIAL STATEMENTS (CONTINUED)
FINANCIAL STATEMENTS
Telstra Corporation Limited and controlled entities Telstra Annual Report 2013 81
2.12 Intangible assets
Intangible assets are assets that have value but do not have physical substance. In order to be recognised, an intangible asset must be either separable or arise from contractual or other legal rights.
(a) Goodwill
On the acquisition of investments in controlled entities, jointly controlled and associated entities, when we pay an amount greater than the fair value of the net identifiable assets of the entity, this excess is considered to be goodwill. We calculate the amount of goodwill as at the date of purchasing our ownership interest in the entity.
When we purchase an entity that we will control, the amount of goodwill is recorded in intangible assets. When we acquire a jointly controlled or associated entity, the goodwill amount is included as part of the cost of the investment.
Goodwill is not amortised but is tested for impairment in accordance with note 2.9(a) on an annual basis, or when an indication of impairment exists.
(b) Internally generated intangible assets
Research costs are recorded as an expense as incurred.
Management judgement is required to determine whether to capitalise development costs. Development costs are capitalised if the project is technically and commercially feasible, we are able to use or sell the asset and we have sufficient resources and intent to complete the development.
(i) Software assets
We record direct costs associated with the development of business software for internal use as software assets if the development costs satisfy the criteria for capitalisation described above.
Costs included in software assets developed for internal use are:
• external direct costs of materials and services consumed; and• payroll and direct payroll-related costs for employees (including
contractors) directly associated with the project.
We capitalise borrowing costs that are directly attributable to the acquisition, construction or production of a qualifying asset.
We review our software assets and software assets under development on a regular basis to ensure the assets are still in use and projects are still expected to be completed. Refer to note 7 for details of impairment losses recognised on our intangible assets.
Software assets developed for internal use have a finite life and are amortised on a straight line basis over their useful lives to us. Amortisation commences once the software is ready for use.
(c) Acquired intangible assets
We acquire other intangible assets either as part of a business combination or through separate acquisition. Intangible assets acquired in a business combination are recorded at their fair value at the date of acquisition and recognised separately from goodwill. We apply management judgement to determine the appropriate fair value of identifiable intangible assets.
Intangible assets that are considered to have a finite life are amortised on a straight line basis over the period of expected benefit. Intangible assets that are considered to have an indefinite life are not amortised but tested for impairment in accordance with note 2.9(a) on an annual basis, or where an indication of impairment exists.
(d) Deferred expenditure
Deferred expenditure mainly includes costs incurred for basic access installation and connection fees for in place and new services, and direct incremental costs of establishing a customer contract.
Significant items of expenditure are deferred to the extent that they are recoverable from future revenue and will contribute to our future earning capacity. Any costs in excess of future revenue are recognised immediately in the income statement. Handset subsidies are considered to be separate units of accounting and are expensed as incurred.
We amortise deferred expenditure over the average period in which the related benefits are expected to be realised.
(e) Amortisation
The weighted average amortisation periods of our identifiable intangible assets are as follows.
(#) Decrease due to the disposal of TelstraClear.
The service lives of our identifiable intangible assets are reviewed each year. Any reassessment of service lives in a particular year will affect the amortisation expense through to the end of the reassessed useful life for both that current year and future years.
2. SUMMARY OF SIGNIFICANT ACCOUNTING POLICIES, ESTIMATES, ASSUMPTIONS AND JUDGEMENTS (CONTINUED)
Telstra GroupAs at 30 June
2013 2012
Identifiable intangible assets
Expected benefit(years)
Expected benefit(years)
Software assets . . . . . . . . . . . 9 9Patents and trademarks . . . . . . . 5 6Mastheads . . . . . . . . . . . . . . 5 5Licences . . . . . . . . . . . . . . . 15 14Brand names . . . . . . . . . . . . 17 18Customer bases (#) . . . . . . . . . 6 13Deferred expenditure . . . . . . . . 3 4
NOTES TO THE FINANCIAL STATEMENTS (CONTINUED)
82 Telstra Annual Report 2013 Telstra Corporation Limited and controlled entities
2.12 Intangible assets (continued)
(e) Amortisation (continued)
The net effect of the reassessment for financial year 2013 was a decrease in our amortisation expense of $34 million (2012: $32 million) for the Telstra Group.
In relation to acquired intangible assets, we apply management judgement to determine the amortisation period based on the expected useful lives of the respective assets. In some cases, the useful lives of certain acquired intangible assets are supported by external valuation advice on acquisition. In addition, we apply management judgement to assess annually the indefinite useful life assumption applied to certain acquired intangible assets.
2.13 Trade and other payables
Trade and other payables, including accruals, are recorded when we are required to make future payments as a result of purchases of assets or services. Trade and other payables are carried at amortised cost.
2.14 Provisions
Provisions are recognised when the group has:
• a present legal or constructive obligation to make a future sacrifice of economic benefits as a result of past transactions or events;
• it is probable that a future sacrifice of economic benefits will arise; and
• a reliable estimate can be made of the amount of the obligation.
The amount recognised as a provision is the best estimate of the consideration required to settle the present obligation at reporting date, taking into account the risks and uncertainties surrounding the obligation. Where a provision is measured using the cash flows estimated to settle the present obligation, its carrying amount is the present value of those cash flows.
(a) Employee benefits
We accrue liabilities for employee benefits relating to wages and salaries, annual leave and other current employee benefits at their nominal amounts. These are calculated based on remuneration rates expected to be current at the date of settlement and include related on costs.
Certain employees who have been employed by Telstra for at least 10 years are entitled to long service leave of three months (or more depending on the actual length of employment), which is included in our employee benefits provision.
We accrue liabilities for other employee benefits not expected to be paid or settled within 12 months of reporting date, including long service leave, at the present values of future amounts expected to be paid. This is based on projected increases in wage and salary rates over an average of 10 years, experience of employee departures and periods of service.
We calculate present values using rates based on government guaranteed securities with similar due dates to our liabilities.
We apply management judgement in estimating the following key assumptions used in the calculation of our long service leave provision at reporting date:
• weighted average projected increases in salaries; and• discount rate (determined by reference to a State and
Commonwealth blended 10-year Australian government bond rate).
Refer to note 16 for further details on the key management judgements used in the calculation of our long service leave provision.
(b) Workers’ compensation
We self insure our workers’ compensation liabilities. We take up a provision for the present value of these estimated liabilities, based on an actuarial review of the liability. This review includes assessing actual accidents and estimating claims incurred but not reported. Present values are calculated using appropriate rates (determined by reference to a State and Commonwealth blended 10-year Australian government bond rate) based on the risks specific to the liability with similar due dates.
Certain controlled entities do not self insure but pay annual premiums to third party insurance companies for their workers’ compensation liabilities. Refer to note 16 for further details.
(c) Redundancy and restructuring costs
We recognise a provision for redundancy costs when a detailed formal plan for the redundancies has been developed and a valid expectation has been created that the redundancies will be carried out in respect of those employees likely to be affected.
We recognise a provision for restructuring when a detailed formal plan has been approved and we have raised a valid expectation to those affected by the restructuring that it will be carried out.
2.15 Borrowings
Borrowings are included as non current liabilities except for those with maturities less than 12 months from the reporting date, which are classified as current liabilities.
Borrowing costs that are directly attributable to the acquisition, construction or production of a qualifying asset form part of the cost of that asset. All other borrowing costs are recognised as an expense in our income statement when incurred.
We recognise borrowings initially on the trade date, which is the date on which we become a party to the contractual provisions of the instrument. We derecognise borrowings when our contractual obligations are discharged or cancelled or expire.
2. SUMMARY OF SIGNIFICANT ACCOUNTING POLICIES, ESTIMATES, ASSUMPTIONS AND JUDGEMENTS (CONTINUED)
NOTES TO THE FINANCIAL STATEMENTS (CONTINUED)
FINANCIAL STATEMENTS
Telstra Corporation Limited and controlled entities Telstra Annual Report 2013 83
2.15 Borrowings (continued)
Our borrowings fall into two categories: borrowings in a designated hedging relationship and borrowings not in a designated hedging relationship.
(a) Borrowings in a designated hedging relationship
Our offshore borrowings that are designated as hedged items are either in fair value or cash flow hedges. The method by which they are hedged determines their accounting treatment.
Borrowings subject to fair value hedges are recognised initially at fair value. The carrying amount of our borrowings in fair value hedges is adjusted for fair value movements attributable to the hedged risk (being changes in value due to interest rate and currency movements).
Fair value is calculated using valuation techniques which utilise data from observable markets. Assumptions are based on market conditions existing at each reporting date. The fair value is calculated as the present value of the estimated future cash flows using an appropriate market based yield curve which is independently derived and representative of Telstra’s cost of borrowing. These borrowings are remeasured each reporting period and the gains or losses are recognised in the income statement along with the associated gains or losses on the hedging instrument.
Borrowings in cash flow hedges are recognised initially at fair value based on the applicable spot price plus any transaction costs that are directly attributable to the issue of the borrowing. These borrowings are subsequently carried at amortised cost and translated at the applicable spot exchange rate at reporting date. Any difference between the final amount paid to discharge the borrowing and the initial borrowing proceeds (including transaction costs) is recognised in the income statement over the borrowing period using the effective interest method.
When currency gains or losses on the borrowings are recognised in the income statement, the associated gains or losses on the hedging instrument are also transferred from the cash flow hedging reserve to the income statement.
(b) Borrowings not in a designated hedging relationship
Borrowings not in a designated hedging relationship include offshore loans, Telstra bonds and domestic loans.
All such instruments are initially recognised at fair value plus any transaction costs that are directly attributable to the issue of the instruments and are subsequently measured at amortised cost. Any difference between the final amount paid to discharge the borrowing and the initial borrowing proceeds (including transaction costs) is recognised in the income statement over the borrowing period using the effective interest method.
(c) Statement of cash flows presentation
Where our short term borrowings are held for the purposes of meeting short term cash commitments, we report the cash receipts and subsequent repayments on a net basis in the statement of cash flows.
2.16 Share capital
Issued and paid up capital is recognised at the fair value of the consideration received by Telstra Entity.
Any transaction costs arising on the issue of ordinary shares are recognised directly in equity, net of tax, as a reduction of the share proceeds received.
Where we undertake a share buy-back, contributed equity is reduced in accordance with the structure of the buy-back arrangement. Costs associated with the buy-back, net of tax, are also deducted from contributed equity. We also record the purchase of Telstra Entity shares by our employee share plan trusts as a reduction in share capital.
Share based remuneration associated with our employee share plans is recognised as additional share capital. Non-recourse loans provided to employees to participate in these employee share plans are recorded as a reduction in share capital.
Refer to note 2.21 for further details regarding our accounting for employee share plans.
2.17 Revenue recognition
Our categories of sales revenue are recorded after deducting sales returns, trade allowances, discounts, sales incentives, duties and taxes.
(a) Rendering of services
Revenue from the provision of our telecommunications services includes telephone calls and other services and facilities provided, such as internet and data.
We record revenue earned from:
• telephone calls on completion of the call; and• other services generally at completion, or on a straight line basis
over the period of service provided, unless another method better represents the stage of completion.
Installation and connection fee revenues that are not considered to be separate units of accounting are deferred and recognised over the average estimated customer life. Incremental costs directly related to these revenues are also deferred and amortised over the customer contract life in accordance with note 2.12(d). In relation to basic access installation and connection revenue, we apply management judgement to determine the estimated customer contract life. Based on our reviews of historical information and customer trends, we have determined that our average estimated customer life is 5 years (2012: 5 years).
2. SUMMARY OF SIGNIFICANT ACCOUNTING POLICIES, ESTIMATES, ASSUMPTIONS AND JUDGEMENTS (CONTINUED)
NOTES TO THE FINANCIAL STATEMENTS (CONTINUED)
84 Telstra Annual Report 2013 Telstra Corporation Limited and controlled entities
2.17 Revenue recognition (continued)
(b) Sale of goods
Our revenue from the sale of goods includes revenue from the sale of customer equipment and similar goods. This revenue is recorded on delivery of the goods sold.
(c) Rent of network facilities
We earn rent mainly from access to retail and wholesale fixed and mobile networks and from the rent of dedicated lines, customer equipment, property, plant and equipment and other facilities. The revenue from providing access to the network is recorded on an accrual basis over the rental period.
(d) Construction contracts
We record construction revenue and profit on a percentage of contract completion basis. The percentage of completion is calculated based on estimated costs to complete the contract. Our construction contracts are classified according to their type. There are two types of construction contracts, these being material intensive and short duration. Revenue and profit are recognised on a percentage of completion basis using the appropriate measures as follows:
• for material intensive projects: (actual costs divided by planned costs) multiplied by planned revenue, including profit; and
• for short duration projects (those that are expected to be completed within a month), revenues, profit and costs are recognised on completion.
(e) Advertising and directory services
Classified advertisements and display advertisements are published on a daily, weekly and monthly basis for which revenues are recognised when the advertisement is published.
All of our Yellow Pages® and White Pages® directory print revenues are recognised on delivery of the published directories to customers’ premises. Revenue from online directories is recognised over the life of service agreements, which is on average one year. Voice directory revenues are recognised at the time of providing the service to customers.
(f) Royalties
Royalty revenue is recognised on an accrual basis in accordance with the substance of the relevant agreements.
(g) Interest revenue
We record interest revenue on an accruals basis. For financial assets, interest revenue is determined by the effective yield on the instrument.
(h) Revenue arrangements with multiple deliverables
Where two or more revenue-generating activities or deliverables are sold under a single arrangement, each deliverable that is considered to be a separate unit of accounting is accounted for separately. When the deliverables in a multiple deliverable arrangement are not considered to be separate units of accounting, the arrangement is accounted for as a single unit.
A separate unit of accounting exists where the deliverable has value to the customer on a stand-alone basis and any undelivered items cannot be terminated by the customer without incurring penalties if the delivered item was returned.
We allocate the consideration from the revenue arrangement to its separate units based on the relative selling prices of each unit. If neither vendor specific objective evidence nor third party evidence exists for the selling price, then the item is measured based on the best estimate of the selling price of that unit. When allocating revenue to the separate units within an arrangement, the amount allocated to a delivered item is limited to the amount that is not contingent upon the delivery of additional items or meeting other specified performance conditions (non-contingent amount). The non-contingent revenue allocated to each unit is then recognised in accordance with our revenue recognition policies described above.
(i) Principal versus agency relationship (gross versus net revenue recognition)
Generally we record the full gross amount of sales proceeds as revenue. However, if we are acting as an agent, revenue is recorded on a net basis (being the gross amount billed less the amount paid to the supplier acting as a principal in the arrangement). We review the facts and circumstances of each sales arrangement to determine if we are acting as an agent or principal. Indicators which support that we are the principal include:
• Telstra is primarily responsible for the fulfilment of the customer order;
• Telstra has risks of ownership of the product or delivery of the services;
• Telstra is involved in price setting;• Telstra is involved in determining the product or service
specifications; and• Telstra bears the credit risk.
(j) Sales incentives
Sales incentives are provided by Telstra to customers either in the form of cash consideration or non-cash consideration and are accrued for up to the point where it is probable that the customer will earn the incentives.
2. SUMMARY OF SIGNIFICANT ACCOUNTING POLICIES, ESTIMATES, ASSUMPTIONS AND JUDGEMENTS (CONTINUED)
NOTES TO THE FINANCIAL STATEMENTS (CONTINUED)
FINANCIAL STATEMENTS
Telstra Corporation Limited and controlled entities Telstra Annual Report 2013 85
2.17 Revenue recognition (continued)
(j) Sales incentives (continued)
Cash consideration (for example, cash payments, credits and rebates) provided to a customer is generally recorded as a reduction in revenue.
A sales incentive provided to a customer in the form of non-cash consideration (for example, in the form of a free product or service or a gift voucher) is considered to be a separate deliverable in a multiple deliverable arrangement, regardless of whether it is provided to customers at the commencement of a contract or is an amount that can be used to purchase future products and services. A portion of the total revenue under the arrangement is allocated to the non-cash consideration in accordance with note 2.17(h) above. The sales revenue allocated to the incentive is recognised when the customer redeems or utilises the award (i.e. when Telstra provides the product or service).
Cash sales incentives are generally paid to customers where Telstra provides a number of different products and services to the customer under a single arrangement. If this is the case then the reduction in revenue must be allocated to each product/service that contributed towards the customer earning the incentive. The allocation should be based on the relative amounts of revenue earned for each product and service, unless a more appropriate methodology is available.
(k) Government grants
Grants from the government are recognised at their fair value where there is a reasonable assurance that the grant will be received and Telstra will comply with all attached conditions.
Government grants relating to costs are deferred and recognised in the income statement over the period necessary to match them with the costs that they are intended to compensate.
Government grants relating to the purchase of property, plant and equipment are included in non current liabilities as deferred income and are credited to the income statement on a straight line basis over the expected lives of the related assets.
The benefit of a government loan at a below-market rate of interest is treated as a government grant. The loan is measured at amortised cost. The benefit of the below-market rate of interest is measured as the difference between the initial carrying value of the loan, which is measured at amortised cost, and the actual proceeds received. The benefit is accounted for in accordance with our accounting policy for government grants described above.
2.18 Taxation
(a) Income taxes
Our income tax expense represents the sum of current tax and deferred tax. Current tax is calculated on accounting profit after allowing for non-taxable and non-deductible items based on the amount expected to be paid to taxation authorities on taxable profit for the period. Deferred tax is calculated at the tax rates that are expected to apply to the period when the asset is realised or the liability is settled. Both our current tax and deferred tax are calculated using tax rates that have been enacted or substantively enacted at reporting date.
Our current and deferred tax is recognised as an expense in the income statement, except when it relates to items directly debited or credited to other comprehensive income or equity, in which case our current and deferred tax is also recognised directly in other comprehensive income or equity.
We apply the balance sheet liability method for calculating our deferred tax. Deferred tax is the expected tax payable or recoverable on all taxable and deductible temporary differences determined with reference to the tax bases of assets and liabilities and their carrying amount for financial reporting purposes as at the reporting date.
We generally recognise deferred tax liabilities for all taxable temporary differences, except to the extent that the deferred tax liability arises from:
• the initial recognition of goodwill; or• the initial recognition of an asset or liability in a transaction that
is not a business combination and affects neither our accounting profit nor taxable income at the time of the transaction.
In respect of our investments in subsidiaries, jointly controlled and associated entities, we recognise deferred tax liabilities for all taxable temporary differences, except where we are able to control the timing of our temporary difference reversal and it is probable that the temporary difference will not reverse in the foreseeable future.
Management judgement is required to determine the amount of deferred tax assets that can be recognised. Deferred tax assets are recognised to the extent that it is probable that taxable profit will be available against which the deductible temporary differences, and the carry forward of unused tax losses and tax credits, can be utilised.
The carrying amount of our deferred tax assets is reviewed at each reporting date. We reduce the carrying amount to the extent that it is no longer probable that sufficient taxable profit will be available to allow the benefit of part or all of the deferred tax asset to be utilised. At each reporting date, we subsequently reassess our unrecognised deferred tax assets to determine whether it has become probable that future taxable profit will allow this deferred tax asset to be recovered.
2. SUMMARY OF SIGNIFICANT ACCOUNTING POLICIES, ESTIMATES, ASSUMPTIONS AND JUDGEMENTS (CONTINUED)
NOTES TO THE FINANCIAL STATEMENTS (CONTINUED)
86 Telstra Annual Report 2013 Telstra Corporation Limited and controlled entities
2.18 Taxation (continued)
(a) Income taxes (continued)
The Telstra Entity and its Australian resident wholly owned entities have formed a tax consolidated group. The Telstra Entity is the head entity and recognises, in addition to its transactions, the current tax liabilities and the deferred tax assets arising from unused tax losses and tax credits for all entities in the tax consolidated group. The Telstra Entity and the entities in the tax consolidated group account for their own current tax expense and deferred tax amounts arising from temporary differences. These tax amounts are measured as if each entity in the tax consolidated group continues to be a separate taxpayer.
We offset deferred tax assets and deferred tax liabilities in the statement of financial position where they relate to income taxes levied by the same taxation authority and to the extent that we intend to settle our current tax assets and liabilities on a net basis. Our deferred tax assets and deferred tax liabilities are netted within the tax consolidated group, as these deferred tax balances relate to the same taxation authority. We do not net deferred tax balances between controlled entities, apart from those within the tax consolidated group.
(b) Goods and Services Tax (GST) (including other value added taxes)
We record our revenue, expenses and assets net of any applicable GST, except where the amount of GST incurred is not recoverable from the Australian Taxation Office (ATO). In these circumstances the GST is recognised as part of the cost of acquisition of the asset or as part of the expense item.
Receivables and payables balances include GST where we have either included GST in our price charged to customers or a supplier has included GST in their price charged to us. The net amount of GST due, but not paid, to the ATO is included under payables.
2.19 Earnings per share
Basic earnings per share is determined by dividing the profit attributable to ordinary shareholders after tax, excluding any costs of servicing equity other than ordinary shares, by the weighted average number of ordinary shares outstanding during the period.
Diluted earnings per share is calculated by dividing the profit attributable to ordinary shareholders after tax by the weighted average number of ordinary shares outstanding during the period (adjusted for the effects of the instruments in the Telstra Growthshare Trust and the Telstra Employee Share Ownership Plans).
2.20 Post employment benefits
(a) Defined contribution plans
Our commitment to defined contribution plans is limited to making contributions in accordance with our minimum statutory requirements. We do not have any legal or constructive obligation to pay further contributions if the fund does not hold sufficient assets to pay all employee benefits relating to current and past employee services.
Contributions to defined contribution plans are recorded as an expense in the income statement as the contributions become payable. We recognise a liability when we are required to make future payments as a result of employee services provided.
(b) Defined benefit plans
We currently sponsor a number of post employment benefit plans. As these plans have elements of both defined contribution and defined benefit, they are treated as defined benefit plans.
At reporting date, where the fair value of the plan assets is less than the present value of the defined benefit obligations, the net deficit is recognised as a liability. If the fair value of the plan assets exceeds the present value of the defined benefit obligations, the net surplus is recognised as an asset. We recognise the asset as we have the ability to control this surplus to generate future funds that are available to us in the form of reductions in future contributions or as a cash refund. Fair value is used to determine the value of the plan assets at reporting date and is calculated by reference to the net market values of the plan assets.
Defined benefit obligations are based on the expected future payments required to settle the obligations arising from current and past employee services. This obligation is influenced by many factors, including final salaries and employee turnover. We engage qualified actuaries to calculate the present value of the defined benefit obligations. These obligations are measured gross of tax.
The actuaries use the projected unit credit method to determine the present value of the defined benefit obligations of each plan. This method determines each year of service as giving rise to an additional unit of benefit entitlement. Each unit is measured separately to calculate the final obligation. The present value is determined by discounting the estimated future cash outflows using rates based on government guaranteed securities with similar due dates to these expected cash flows.
We recognise all our defined benefit costs in the income statement with the exception of actuarial gains and losses that are recognised directly in other comprehensive income via retained profits. Components of defined benefit costs include current and past service cost, interest cost and expected return on assets. Past service cost is recognised immediately to the extent that the benefits are already vested, and otherwise is amortised on a straight line basis over the average period until the benefits become vested.
2. SUMMARY OF SIGNIFICANT ACCOUNTING POLICIES, ESTIMATES, ASSUMPTIONS AND JUDGEMENTS (CONTINUED)
NOTES TO THE FINANCIAL STATEMENTS (CONTINUED)
FINANCIAL STATEMENTS
Telstra Corporation Limited and controlled entities Telstra Annual Report 2013 87
2.20 Post employment benefits (continued)
(b) Defined benefit plans (continued)
Actuarial gains and losses are based on an actuarial valuation of each defined benefit plan at reporting date. Actuarial gains and losses represent the differences between previous actuarial assumptions of future outcomes and the actual outcome, in addition to the effect of changes in actuarial assumptions.
We apply judgement in estimating the following key assumptions used in the calculation of our defined benefit liabilities and assets at reporting date:
• discount rates (determined by reference to a State and Commonwealth blended 10-year Australian government bond rate);
• salary inflation rate; and• expected return on plan assets.
The estimates applied in the actuarial calculation have a significant impact on the reported amount of our defined benefit plan liabilities and assets. If the estimates prove to be incorrect, the carrying value may be materially impacted in the next reporting period. Additional volatility may also potentially be recorded in other comprehensive income to reflect differences between actuarial assumptions of future outcomes applied at the current reporting date and the actual outcome in the next annual reporting period.
Refer to note 24 for details on the key estimates used in the calculation of our defined benefit liabilities and assets.
2.21 Employee Share Plans
We own 100 per cent of the equity of Telstra ESOP Trustee Pty Ltd, the corporate trustee for the Telstra Employee Share Ownership Plan Trust (TESOP97) and Telstra Employee Share Ownership Plan Trust II (TESOP99). We consolidate the results, position and cash flows of TESOP97 and TESOP99.
The Telstra Growthshare Trust (Growthshare) was established to allocate equity based instruments as required. Current equity based instruments include options, performance rights, restricted shares, deferred shares, incentive shares, and Ownshares. Restricted shares, deferred shares and incentive shares are subject to a specified period of service. Options and performance rights can be subject to performance hurdles or a specified period of service.
We own 100 per cent of the equity of Telstra Growthshare Pty Ltd, the corporate trustee for Growthshare. We also include the results, position and cash flows of Growthshare.
We recognise an expense for all share based remuneration determined with reference to the fair value at grant date of the equity instruments issued. The fair value of our equity instruments is calculated using a valuation technique that is consistent with the Black-Scholes methodology and utilises Monte Carlo simulations. The fair value is recognised in the income statement over the relevant vesting periods, adjusted to reflect actual and expected levels of vesting.
2.22 Derivative financial instruments
We use derivative financial instruments such as forward exchange contracts, cross currency swaps and interest rate swaps to hedge risks associated with foreign currency and interest rate fluctuations.
The use of hedging instruments is governed by the guidelines set by our Board of Directors.
Derivative financial instruments are included as non current assets or liabilities except for those with maturities less than 12 months from the reporting date, which are classified as current assets or liabilities.
Derivatives are initially recognised at fair value on the date on which a derivative contract is entered into and are subsequently remeasured to fair value. Refer to note 17 for details on the basis used to estimate fair value. The method of recognising the resulting remeasurement gain or loss depends on whether the derivative is designated as a hedging instrument, and, if so, the nature of the item being hedged. Where we hold derivative financial instruments that are not designated as hedges, they are categorised as “held for trading” financial instruments. All of our derivative financial instruments are stated at fair value.
Derivative assets are derecognised when the rights to receive cash flows from the derivative assets have expired or have been transferred and we have transferred substantially all the risks and rewards of ownership.
The carrying value of our cross currency and interest rate swaps refers to the fair value of our receivable or payable under the swap contract. We do not offset the receivable or payable with the underlying financial asset or financial liability being hedged, as the transactions are usually with different counterparties and are not generally settled on a net basis.
Where we have a legally recognised right to set off the derivative asset and the derivative liability, and we intend to settle on a net basis or simultaneously, we record this position on a net basis in our statement of financial position. Where we enter into master netting arrangements relating to a number of financial instruments, have a legal right of set off, and intend to do so, we also include this position on a net basis in our statement of financial position.
Our derivative financial instruments that are held to hedge exposures can be classified into three different types, according to the reason we are holding them: fair value hedges, cash flow hedges and hedges of a net investment in a foreign operation.
Hedge accounting can only be utilised where effectiveness tests are met on both a prospective and retrospective basis. For all of our hedging instruments, any gains or losses on remeasuring to fair value any portion of the instrument not considered to be effective are recognised directly in the income statement in the period in which they occur. The extent to which gains or losses on the hedged item and the hedge instrument do not offset represents ineffectiveness which will create volatility in the income statement.
2. SUMMARY OF SIGNIFICANT ACCOUNTING POLICIES, ESTIMATES, ASSUMPTIONS AND JUDGEMENTS (CONTINUED)
NOTES TO THE FINANCIAL STATEMENTS (CONTINUED)
88 Telstra Annual Report 2013 Telstra Corporation Limited and controlled entities
2.22 Derivative financial instruments (continued)
We formally designate and document at the inception of a transaction the relationship between hedging instruments and hedged items, as well as our risk management objective and strategy for undertaking various hedge transactions, together with the methods that will be used to assess the effectiveness of the hedge relationship. We also document our assessment, both at hedge inception and on an ongoing basis, of whether the hedging instruments that are used in hedging transactions have been, and will continue to be, highly effective in offsetting changes in fair values or cash flows of hedged items.
Purchases and sales of derivative financial instruments are recognised on the date on which we commit to purchase or sell an asset or liability.
(a) Fair value hedges
We use fair value hedges to mitigate the risk of changes in the fair value of our foreign currency borrowings from foreign currency and interest rate fluctuations over the hedging period.
Where a fair value hedge qualifies for hedge accounting, gains or losses from remeasuring the fair value of the hedging instrument are recognised within finance costs in the income statement, together with gains and losses in relation to the hedged item where those gains or losses relate to the risks intended to be hedged.
(b) Cash flow hedges
We use cash flow hedges to mitigate the risk of variability of future cash flows attributable to foreign currency fluctuations over the hedging period associated with our foreign currency borrowings and our ongoing business activities, predominantly where we have highly probable purchase or settlement commitments in foreign currencies. We also use cash flow hedges to hedge variability in cash flows due to interest rate movements associated with some of our domestic borrowings.
Where a cash flow hedge qualifies for hedge accounting, the effective portion of gains or losses on remeasuring the fair value of the hedging instrument are recognised directly in other comprehensive income in the cash flow hedging reserve until such time as the hedged item affects profit or loss, then the gains or losses are transferred to the income statement. However, in our hedges of forecast transactions, when the forecast transaction that is hedged results in the recognition of a non-financial asset (for example, property, plant and equipment), the gains and losses previously deferred in other comprehensive income are transferred from other comprehensive income and included in the measurement of the initial cost or carrying amount of the asset. Gains or losses on any portion of the hedge determined to be ineffective are recognised immediately in the income statement. The application of hedge accounting will create volatility in equity reserve balances.
When a hedging instrument expires or is sold or terminated, or when a hedge no longer meets the criteria for hedge accounting, any cumulative gains or losses existing in other comprehensive income at that time remain in other comprehensive income and are recognised when the hedged item is ultimately recognised in the income statement.
If a forecast hedged transaction is no longer expected to occur, the cumulative gains or losses on the hedging instrument that were reported in other comprehensive income are transferred immediately to the income statement.
(c) Hedges of a net investment in a foreign operation
Our investments in foreign operations are exposed to foreign currency risk, which arises when we translate the net assets of our foreign investments from their functional currency to Australian dollars. We hedge our net investments to mitigate exposure to this risk by using forward foreign currency contracts, cross currency swaps and/or borrowings in the relevant currency of the investment.
Gains and losses on remeasurement of our derivative instruments designated as hedges of foreign investments are recognised in the foreign currency translation reserve in equity to the extent that they are considered to be effective.
The cumulative amount of the recognised gains or losses included in equity is transferred to the income statement when the foreign operation is sold.
(d) Derivatives and borrowings that are de-designated from fair value hedge relationships or not in a designated hedging relationship
Derivatives associated with borrowings de-designated from fair value hedge relationships or not in a designated hedge relationship for hedge accounting purposes are classified as “held for trading”.
For borrowings de-designated from fair value hedge relationships, from the date of de-designation the derivatives continue to be recognised at fair value and the borrowings are accounted for on an amortised cost basis consistent with a revised effective interest rate as at the de-designation date. The gains or losses on both the borrowings and derivatives are included within finance costs on the basis that the net result primarily reflects the impact of movements in interest rates and the discounting impact of future cash flows on the derivatives. The cumulative gains or losses previously recognised from the remeasurement of these borrowings as at the date of de-designation are unwound and amortised to the income statement over the remaining life of the borrowing. This amortisation expense is also included within finance costs.
For borrowings not in designated hedge relationships for hedge accounting purposes, the derivatives are recognised at fair value and the borrowings are accounted for on an amortised cost basis. The gains or losses on both the borrowings and derivatives are included within finance costs on the basis that the net result primarily reflects the impact of movements in interest rates and the discounting impact of future cash flows on the derivatives.
2. SUMMARY OF SIGNIFICANT ACCOUNTING POLICIES, ESTIMATES, ASSUMPTIONS AND JUDGEMENTS (CONTINUED)
NOTES TO THE FINANCIAL STATEMENTS (CONTINUED)
FINANCIAL STATEMENTS
Telstra Corporation Limited and controlled entities Telstra Annual Report 2013 89
2.22 Derivative financial instruments (continued)
(d) Derivatives and borrowings that are de-designated from fair value hedge relationships or not in a designated hedging relationship (continued)
Any gains or losses on remeasuring to fair value forward exchange contracts that are not in a designated hedging relationship are recognised directly in the income statement in the period in which they occur within other expenses or other income.
(e) Embedded derivatives
Derivatives embedded in other financial instruments or other host contracts are treated as separate derivatives when their risks and characteristics are not closely related to those of the host contracts and the host contracts are not measured at fair value through profit or loss.
2.23 Contingent liabilities
A contingent liability is a liability of sufficient uncertainty that it does not qualify for recognition as a liability, or a liability whose existence will be confirmed only by the occurrence or non-occurrence of one or more uncertain future events not wholly within the control of Telstra. In addition, the term contingent liability is used for liabilities that do not meet the recognition criteria.
We first determine whether an obligation should be recorded as a liability or a contingent liability. This requires management to assess the probability that Telstra will be required to make payment as well as an estimate of that payment. This assessment is made based on the facts and circumstances, factoring in past experience and, in some cases, reports from independent experts. The evidence considered includes any additional evidence provided by events after the reporting date.
Refer to note 23, note 26 and note 30 for further details on Telstra’s contingent liabilities.
2.24 New accounting standards to be applied in future reporting periods
The accounting standards that have not been early adopted for the year ended 30 June 2013 but will be applicable to the Telstra Group in future reporting periods are detailed below. Apart from these standards, we have considered other accounting standards that will be applicable in future periods but which are considered insignificant to Telstra.
(a) Financial Instruments - Classification, Measurement and Derecognition
AASB 9: “Financial Instruments” was re-issued in December 2010 to include the accounting requirements for classifying and measuring financial liabilities and the derecognition requirements for financial assets and liabilities. Two related omnibus standards AASB 2010-7: “Amendments to Australian Accounting Standards arising from AASB 9 (December 2010)” and AASB 2009-11: “Amendments to Australian Accounting Standards arising from AASB 9” make a number of amendments to other accounting standards as a result of the amendments to AASB 9 and must be adopted at the same time.
Most of the added requirements on the classification and measurement of financial liabilities and all of the added requirements on the derecognition of financial instruments have been carried forward unchanged from the existing standard AASB 139: “Financial Instruments - Classification and Measurement”. The only change made relates to the requirements for the fair value option for financial liabilities, to address the issue of own credit risk.
For financial liabilities designated at fair value, the portion of the change in fair value due to changes in own credit risk now generally must be presented in other comprehensive income, rather than within the income statement.
The amendments to AASB 9 are applicable to annual reporting periods beginning on or after 1 January 2015, with early adoption permitted (the previous effective date of 1 January 2013 was amended via the issue of AASB 2012-6: “Amendments to Australian Accounting Standards - Mandatory Effective Date of AASB 9 and Transition Disclosures”).
It is anticipated that this change will have minimal impact on Telstra as all of our financial liabilities are either classified at amortised cost or in a hedge relationship.
(b) Consolidated Financial Statements
AASB 10: “Consolidated Financial Statements” was released in August 2011 by the AASB and replaces both the existing AASB 127: “Consolidated and Separate Financial Statements” and AASB Interpretation 112: “Consolidation - Special Purpose Entities”. AASB 2011-7: “Amendments to Australian Standards Arising from the Consolidation and Joint Arrangement Standards” was also released by the AASB to update the requirements in other accounting standards as a result of the amendments to the entire suite of consolidation and related standards.
AASB 10 revises the definition of control and related application guidance so that a single control model can be applied to all entities.
These standards will apply to Telstra from 1 July 2013 on a retrospective basis, with early adoption permitted provided that the entire suite of consolidation and related standards is adopted at the same time.
2. SUMMARY OF SIGNIFICANT ACCOUNTING POLICIES, ESTIMATES, ASSUMPTIONS AND JUDGEMENTS (CONTINUED)
NOTES TO THE FINANCIAL STATEMENTS (CONTINUED)
90 Telstra Annual Report 2013 Telstra Corporation Limited and controlled entities
2.24 New accounting standards to be applied in future reporting periods (continued)
(b) Consolidated Financial Statements (continued)
Based on our assessments, it is anticipated that the revised definition of control will have no significant impact to Telstra's current accounting for investments held. Investments currently accounted for as subsidiaries would continue to meet the revised definition of control and therefore continue to be consolidated in the group's financial statements. Investments currently accounted for as associates have been assessed against the revised control definition and there would be no changes in the accounting treatment for these investments. Therefore, Telstra will continue to equity account for them.
(c) Joint Arrangements
AASB 11: “Joint Arrangements” was also released by the AASB in August 2011 and replaces the existing AASB 131: “Interests in Joint Ventures”. This new standard has revised the definition types of joint arrangements, focusing on the rights and obligations of the arrangement, rather than its legal form. The definition types have been consolidated into two joint ventures (currently referred to as jointly controlled entities) and joint operations (currently referred to as jointly controlled assets and jointly controlled operations). Furthermore, the accounting treatment options for joint venture arrangements have been removed to eliminate inconsistent treatments, where equity accounting is mandatory for joint ventures and proportionate consolidation can no longer be used.
This standard is applicable to Telstra from 1 July 2013 on a retrospective basis, with early adoption permitted provided that the entire suite of consolidation and related standards is adopted at the same time.
Based on management’s current assessments, the revised definition types of joint arrangements will have no impact on Telstra's current joint arrangement classifications. The assessment of Telstra's material jointly controlled entities shows there are no jointly controlled entities that give Telstra direct rights over assets or obligations to settle liabilities, such that they should be classified as joint operations. Therefore, all of these jointly controlled entities would be classified as joint ventures and given that Telstra's current accounting policy for jointly controlled entities is to use the equity accounting method, these joint ventures will remain equity accounted for under AASB 11. Overall, we expect no impact on the measurement of any of Telstra's existing joint arrangements.
(d) Disclosures of Interests in Other Entities
AASB 12: “Disclosure of Interests in Other Entities” was issued by the AASB in August 2011 and is a new standard on disclosure requirements for all forms of interests in investments, including subsidiaries, associates, joint arrangements and consolidated and unconsolidated structured entities.
This standard is applicable to Telstra from 1 July 2013 on a retrospective basis, with early adoption permitted provided that the entire suite of consolidation and related standards is adopted at the same time.
Based on our current assessments, we expect additional disclosures will be required by Telstra as a result of AASB 12, in the following areas:
• controlled entities with non-controlling interests that are material to Telstra;
• interests in consolidated structured entities; and• unconsolidated structured entities.
(e) Separate Financial Statements
AASB 127: “Separate Financial Statements” has been released by the AASB in August 2011 to replace the current AASB 127 standard, now only containing the accounting requirements for preparation of separate financial statements of the parent.
This standard is applicable from 1 July 2013, with early adoption permitted provided that the entire suite of consolidation and related standards is adopted at the same time. There is no impact to Telstra’s financial statements as we already comply with the requirements in the standard.
(f) Investments in Associates and Joint Ventures
AASB 128: “Investments in Associates and Joint Ventures” was issued by the AASB in August 2011 and replaces the current AASB 128 standard. Limited amendments have been made to AASB 128, including the application of AASB 5: “Non current assets held for sale and discontinued operations” to interests in associates and joint ventures and how to account for changes in interests in joint ventures and associates.
This standard is applicable from 1 July 2013, with early adoption permitted provided that the entire suite of consolidation and related standards is adopted at the same time.
We have assessed that there will be no impact to Telstra’s financial statements as a result of this standard.
(g) Fair Value Measurement
AASB 13: “Fair Value Measurement” was released by the AASB in August 2011 and is a new standard providing a single source of guidance for all fair value measurements and a precise definition of fair value. It replaces all fair value measurement guidance in Australian Accounting Standards and Interpretations but does not replace existing standards requirements on when fair values should be used. A related omnibus standard AASB 2011-8: “Amendments to Australian Accounting Standards Arising from AASB 13” makes a number of definition and guidance amendments to other accounting standards as a result of the amendments in AASB 13 and must be adopted at the same time.
This standard is applicable to Telstra from 1 July 2013, with early adoption permitted.
2. SUMMARY OF SIGNIFICANT ACCOUNTING POLICIES, ESTIMATES, ASSUMPTIONS AND JUDGEMENTS (CONTINUED)
NOTES TO THE FINANCIAL STATEMENTS (CONTINUED)
FINANCIAL STATEMENTS
Telstra Corporation Limited and controlled entities Telstra Annual Report 2013 91
2.24 New accounting standards to be applied in future reporting periods (continued)
(g) Fair Value Measurement (continued)
Based on our assessment of this new standard, the predominant impact will be additional disclosures required by Telstra, specifically in the following areas:
• investments or assets held for sale, where the fair value less costs to sell is lower than the carrying amount;
• as part of a business combination, any assets and liabilities measured at fair value in the statement of financial position after initial recognition; and
• financial instruments, where the carrying amount differs from the fair value.
(h) Employee Benefits
AASB 119: “Employee Benefits” was released by the AASB in September 2011 and replaces the existing employee benefits standard. A related omnibus standard AASB 2011-10: “Amendments to Australian Accounting Standards Arising from AASB 119” makes a number of amendments to other accounting standards and an interpretation as a result of the amendments in AASB 119.
Both standards are applicable from 1 July 2013 on a retrospective basis, with early adoption permitted.
Based on management’s assessment, AASB 119 will have an impact on Telstra’s financial statements, specifically in the following areas:
• the defined benefit expense will no longer contain the expected return on planned assets; instead this will be replaced by net interest income or expense, calculated using a discount rate (based on government bonds) applied to the net defined benefit asset or liability. Had we adopted the new rules in the current reporting period, profit before income tax for the current period would have been approximately $106 million lower and other comprehensive income would have been approximately $106 million higher than reported. There would be no impact to both total comprehensive income for the current period and the statement of financial position as at 30 June 2013;
• presentation of the defined benefit cost will be disaggregated into three components; service cost to be presented in the income statement, net interest on the net defined benefit asset or liability in the income statement as part of finance costs and remeasurements to be presented in other comprehensive income; and
• additional disclosures about the characteristics and risks arising from our defined benefit plans.
(i) Investment Entities
Investment Entities (Amendments to IFRS 10: “Consolidated Financial Statements”, IFRS 12: “Disclosure of Interests in Other Entities” and IAS 27: “Separate Financial Statements”), issued by the International Accounting Standards Board (IASB) in October 2012, introduces an exception to consolidating particular subsidiaries that meet the definition of “investment entities”. Investment entities are those whose business purpose is to invest funds solely for returns from capital appreciation, investment income, or both. A subsidiary classified as an investment entity will be measured at fair value through profit or loss in accordance with IFRS 9: “Financial Instruments” in its consolidated and separate financial statements. The amendments also introduce new disclosure requirements for investment entities in IFRS 12 and IAS 27.
This standard is applicable to Telstra from 1 July 2014, with earlier adoption permitted. This change is expected to have a minimal impact, as Telstra currently does not have any subsidiaries that meet the definition of investment entities.
(j) Transition Guidance and Other Amendments
AASB 2012-10: “Amendments to Australian Accounting Standards – Transition Guidance and Other Amendments” was issued by the Australian Accounting Standards Board in December 2012.
This standard amends 25 standards and one interpretation and is applicable to Telstra from 1 July 2013, in line with the effective dates of AASB 10: “Consolidated Financial Statements”, AASB 11: “Joint Arrangements” and AASB 12: “Disclosure of Interests in Other Entities.”
AASB 2012-10 amends the retrospective application that was required in AASB 10 when it was issued in May 2011. It also provides additional transitional relief in AASB 10, AASB 11 and AASB 12, limiting the requirement to provide adjusted comparative information to the preceding comparative period. The proposal removes the requirement to present comparative information for periods before AASB 12 is first applied.
Based on our current assessments, we do not expect this standard to affect our financial results, as there will be no material impact on Telstra from the adoption of AASB 10 and AASB 11.
(k) Other
In addition to the above accounting standards which are applicable in future years, we note the following new accounting standards and interpretations also applicable in future years:
• AASB 1053: “The Application of Tiers of Australian Accounting Standards”;
• AASB 2011-4: “Amendments to Australian Accounting Standards to Remove Individual Key Management Personnel Disclosure Requirements”;
• AASB 2012-2: “Amendments to Australian Accounting Standards - Disclosures - Offsetting Financial Assets and Financial Liabilities”;
2. SUMMARY OF SIGNIFICANT ACCOUNTING POLICIES, ESTIMATES, ASSUMPTIONS AND JUDGEMENTS (CONTINUED)
NOTES TO THE FINANCIAL STATEMENTS (CONTINUED)
92 Telstra Annual Report 2013 Telstra Corporation Limited and controlled entities
2. SUMMARY OF SIGNIFICANT ACCOUNTING POLICIES, ESTIMATES, ASSUMPTIONS AND JUDGEMENTS (CONTINUED)
2.24 New accounting standards to be applied in future reporting periods (continued)
(k) Other (continued)
• AASB 2012-3: “Amendments to Australian Accounting Standards - Offsetting Financial Assets and Financial Liabilities”;
• AASB 2012-5: “Amendments to Australian Accounting Standards arising from Annual Improvements 2009-2011 Cycle”;
• AASB 2012-9: “Amendments to AASB 1048 arising from the withdrawal of Australian Interpretation 1039”;
• AASB Interpretation 21: “Levies”;• AASB 2013-3: “Amendments to AASB 136 - Recoverable
Amount Disclosures for Non-Financial Assets”; and• AASB 2013-4: “Amendments to Australian Accounting
Standards - Novation of Derivatives and Continuation of Hedge Accounting”.
We do not expect these accounting standards and interpretations to materially affect our financial results upon adoption.
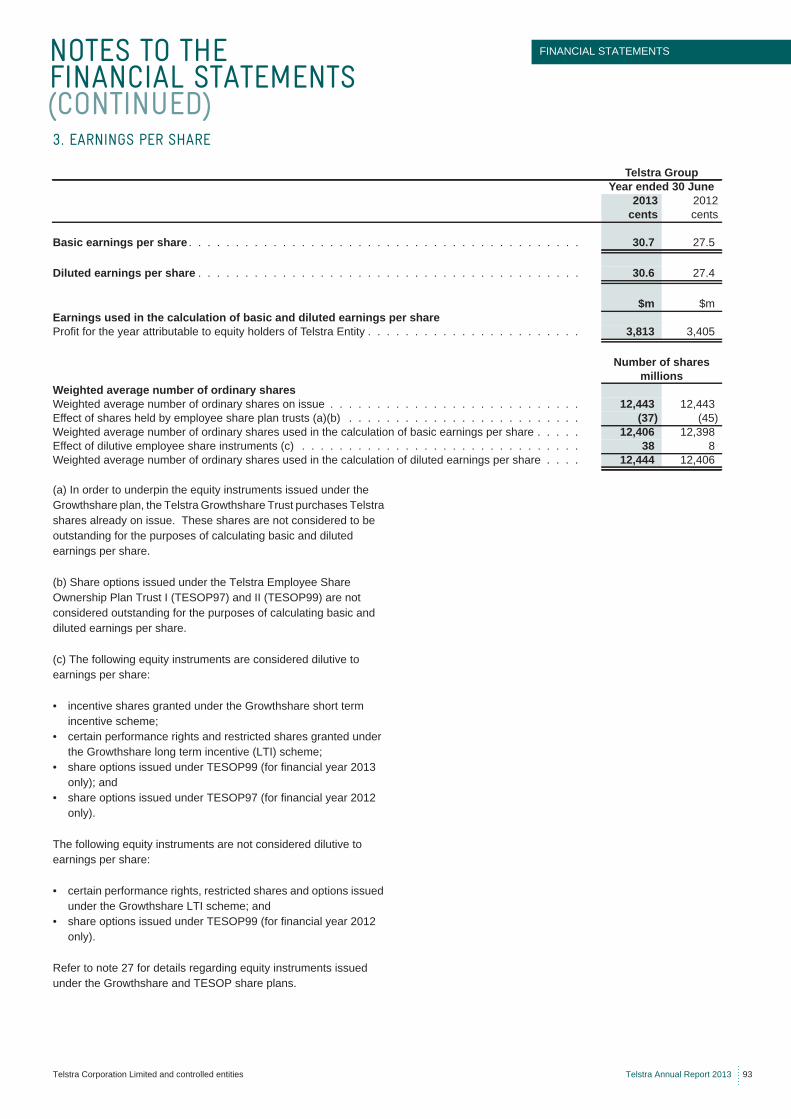
NOTES TO THE FINANCIAL STATEMENTS (CONTINUED)
FINANCIAL STATEMENTS
Telstra Corporation Limited and controlled entities Telstra Annual Report 2013 93
(a) In order to underpin the equity instruments issued under the Growthshare plan, the Telstra Growthshare Trust purchases Telstra shares already on issue. These shares are not considered to be outstanding for the purposes of calculating basic and diluted earnings per share.
(b) Share options issued under the Telstra Employee Share Ownership Plan Trust I (TESOP97) and II (TESOP99) are not considered outstanding for the purposes of calculating basic and diluted earnings per share.
(c) The following equity instruments are considered dilutive to earnings per share:
• incentive shares granted under the Growthshare short term incentive scheme;
• certain performance rights and restricted shares granted under the Growthshare long term incentive (LTI) scheme;
• share options issued under TESOP99 (for financial year 2013 only); and
• share options issued under TESOP97 (for financial year 2012 only).
The following equity instruments are not considered dilutive to earnings per share:
• certain performance rights, restricted shares and options issued under the Growthshare LTI scheme; and
• share options issued under TESOP99 (for financial year 2012 only).
Refer to note 27 for details regarding equity instruments issued under the Growthshare and TESOP share plans.
3. EARNINGS PER SHARE
Telstra GroupYear ended 30 June
2013 2012cents cents
Basic earnings per share . . . . . . . . . . . . . . . . . . . . . . . . . . . . . . . . . . . . . . . . . . 30.7 27.5
Diluted earnings per share . . . . . . . . . . . . . . . . . . . . . . . . . . . . . . . . . . . . . . . . . 30.6 27.4
$m $mEarnings used in the calculation of basic and diluted earnings per shareProfit for the year attributable to equity holders of Telstra Entity . . . . . . . . . . . . . . . . . . . . . . . 3,813 3,405
Number of sharesmillions
Weighted average number of ordinary sharesWeighted average number of ordinary shares on issue . . . . . . . . . . . . . . . . . . . . . . . . . . . 12,443 12,443Effect of shares held by employee share plan trusts (a)(b) . . . . . . . . . . . . . . . . . . . . . . . . . (37) (45)Weighted average number of ordinary shares used in the calculation of basic earnings per share . . . . . 12,406 12,398Effect of dilutive employee share instruments (c) . . . . . . . . . . . . . . . . . . . . . . . . . . . . . . 38 8Weighted average number of ordinary shares used in the calculation of diluted earnings per share . . . . 12,444 12,406
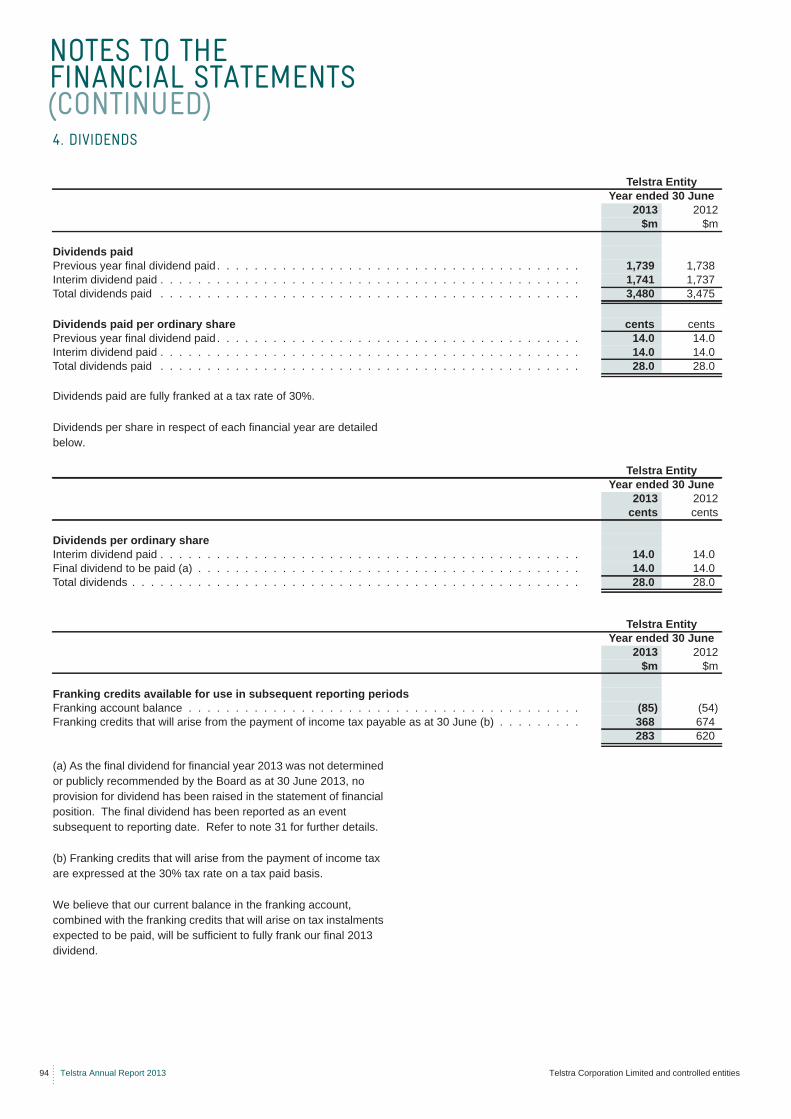
NOTES TO THE FINANCIAL STATEMENTS (CONTINUED)
94 Telstra Annual Report 2013 Telstra Corporation Limited and controlled entities
Dividends paid are fully franked at a tax rate of 30%.
Dividends per share in respect of each financial year are detailed below.
(a) As the final dividend for financial year 2013 was not determined or publicly recommended by the Board as at 30 June 2013, no provision for dividend has been raised in the statement of financial position. The final dividend has been reported as an event subsequent to reporting date. Refer to note 31 for further details.
(b) Franking credits that will arise from the payment of income tax are expressed at the 30% tax rate on a tax paid basis.
We believe that our current balance in the franking account, combined with the franking credits that will arise on tax instalments expected to be paid, will be sufficient to fully frank our final 2013 dividend.
4. DIVIDENDS
Telstra EntityYear ended 30 June
2013 2012$m $m
Dividends paidPrevious year final dividend paid . . . . . . . . . . . . . . . . . . . . . . . . . . . . . . . . . . . . . . . 1,739 1,738Interim dividend paid . . . . . . . . . . . . . . . . . . . . . . . . . . . . . . . . . . . . . . . . . . . . . 1,741 1,737Total dividends paid . . . . . . . . . . . . . . . . . . . . . . . . . . . . . . . . . . . . . . . . . . . . . 3,480 3,475
Dividends paid per ordinary share cents centsPrevious year final dividend paid . . . . . . . . . . . . . . . . . . . . . . . . . . . . . . . . . . . . . . . 14.0 14.0Interim dividend paid . . . . . . . . . . . . . . . . . . . . . . . . . . . . . . . . . . . . . . . . . . . . . 14.0 14.0Total dividends paid . . . . . . . . . . . . . . . . . . . . . . . . . . . . . . . . . . . . . . . . . . . . . 28.0 28.0
Telstra EntityYear ended 30 June
2013 2012cents cents
Dividends per ordinary shareInterim dividend paid . . . . . . . . . . . . . . . . . . . . . . . . . . . . . . . . . . . . . . . . . . . . . 14.0 14.0Final dividend to be paid (a) . . . . . . . . . . . . . . . . . . . . . . . . . . . . . . . . . . . . . . . . . 14.0 14.0Total dividends . . . . . . . . . . . . . . . . . . . . . . . . . . . . . . . . . . . . . . . . . . . . . . . . 28.0 28.0
Telstra EntityYear ended 30 June
2013 2012$m $m
Franking credits available for use in subsequent reporting periodsFranking account balance . . . . . . . . . . . . . . . . . . . . . . . . . . . . . . . . . . . . . . . . . . (85) (54)Franking credits that will arise from the payment of income tax payable as at 30 June (b) . . . . . . . . . 368 674
283 620
NOTES TO THE FINANCIAL STATEMENTS (CONTINUED)
FINANCIAL STATEMENTS
Telstra Corporation Limited and controlled entities Telstra Annual Report 2013 95
Operating segments
We report our segment information on the same basis as our internal management reporting structure, which determines how our Company is organised and managed.
Segment results are reported according to the internal management reporting structure at the reporting date. Segment comparatives are restated to reflect organisational changes that have occurred since the prior reporting period to present a like-for-like view.
During the year ended 30 June 2013, the following changes were made to our operating segments:
• TelstraClear, previously disclosed as a separate reportable segment, is now included in the “All Other” category, up to the date of disposal on 31 October 2012. Refer to notes 12 and 20 for further details;
• a new business unit, Telstra Health was created in April 2013 reporting to the Chief Customer Officer;
• Telstra Consumer and Country Wide changed its name to Telstra Consumer (TC); and
• Telstra Applications and Ventures Group changed its name to Telstra Ventures Group.
The Telstra Group for financial year 2013 is organised into the following reportable segments for internal management reporting purposes:
Telstra Consumer (TC) reports to the Chief Customer Officer and is responsible for providing the full range of telecommunication products, services and solutions (across Mobiles, Fixed and Mobile Broadband, Telephony and Pay TV) to consumer customers in metropolitan, regional, rural and remote areas of Australia. This is achieved through inbound and outbound call centres, Telstra Shops (owned and licensed), Telstra Dealers and Telstra Digital. Telstra Digital is responsible for delivering self service capabilities for all Telstra customers, across all phases of the customer experience from browsing to buying and bill and service requests.
Telstra Business (TB) reports to the Chief Customer Officer and is responsible for providing Australia's small to medium enterprises with a full range of communication based products and solutions.
Telstra Enterprise and Government (TE&G) reports to the Chief Customer Officer and is responsible for the provision of network applications and services and integrated voice, data and mobile solutions via Telstra Next Generation Services® to Australia’s enterprise and government customers.
Telstra Operations (TOps) is responsible for:
• overall planning, design, engineering and architecture of Telstra networks, technology and information technology (IT);
• construction of infrastructure for our Company's fixed, mobile, internet protocol (IP) and data networks;
• delivery of customer services across these networks;• operation, assurance and maintenance, including activation and
restoration of these networks;• supply and delivery of information technology solutions to
support our products, services, customer support functions and our internal needs; and
• delivery of network-centric professional services, managed services and outsourcing services for Telstra customers.
Telstra Wholesale (TW) is responsible for the provision of a wide range of telecommunication products and services delivered over Telstra networks and associated support systems to non-Telstra branded carriers, carriage service providers and internet service providers.
Telstra Media Group (TMG) is responsible for:
• the management and growth of the domestic directories and advertising business, including print, voice and digital directories, digital mapping and satellite navigation, digital display advertising and business information services. This includes the management of leading information brands including Yellow Pages®, White Pages®, Whereis®, Citysearch®, 1234 and Quotify®; and
• the management of our investment in Digital Media content, services and applications, including Trading Post, Telstra Advertising Network, BigPond® content including music, movies, sport and games, IPTV, online portals and the FOXTEL Partnership.
The majority of TMG non-advertising revenue is reported in the domestic retail segments, i.e. TC, TB and TE&G.
Telstra International Group (TIG) is responsible for managing Telstra's assets outside Australia, including:
• CSL New World Mobility Limited, our 76.4 per cent owned subsidiary in Hong Kong, responsible for providing full mobile services including handset and device sales, mobile voice, and mobile data products to the Hong Kong market;
• Telstra China, our mainland China business providing digital media services in auto, IT and consumer electronics (this includes the Autohome and Sequel Media businesses); and
• Telstra Global, our managed services and international connectivity business, providing managed network services, international data and voice, and satellite across the Asia Pacific, China, India, EMEA, and the US. Telstra Global also manages our submarine cable networks and other assets.
5. SEGMENT INFORMATION
NOTES TO THE FINANCIAL STATEMENTS (CONTINUED)
96 Telstra Annual Report 2013 Telstra Corporation Limited and controlled entities
Operating segments (continued)
In our segment results, the “All Other” category consists of various business units that do not qualify as reportable segments in their own right. These include:
• Telstra Innovation, Products and Marketing (TIPM);• Telstra Customer Sales and Services head office function,
reporting to the Chief Customer Officer (excluding the domestic retail business units of TC, TB and TE&G);
• Telstra Health; • Telstra Ventures Group; • TelstraClear; and• our corporate areas.
Finance and Strategy in our corporate areas is the main contributor to the result for the “All Other” category, which is primarily depreciation and amortisation charges, as well as impairment of property, plant and equipment and software.
Segment results
The measurement of segment results is in line with the basis of information presented to management for internal management reporting purposes. The result of each segment is now measured based on its “earnings before interest, income tax expense, depreciation and amortisation (EBITDA) contribution”. EBITDA contribution excludes the effects of all inter-segment balances and transactions (with the exception of transactions referred to in footnote (ii) below). Therefore, only transactions external to the Telstra Group are reported.
Historically, certain items of income and expense were excluded from the segment results to show a measure of “underlying” performance. Such items included gains/losses on disposal of non-current assets, controlled entities, associated entities, and businesses, the impairment of goodwill and intangibles, and revenue for the build of NBN related infrastructure. In prior periods, these were separately disclosed in the reconciliation of segment results to Telstra Group reported EBITDA, earnings before interest and income tax expense (EBIT) and profit before income tax expense in the financial statements.
During financial year 2013, in accordance with the information presented to management for internal management reporting purposes, we have included these items in the measurement of segment results. Therefore, we no longer have any reconciling items between segment results and Telstra Group’s reported EBITDA. The reconciliation of segment results to Telstra Group’s reported EBIT and profit before income tax expense in the financial statements now includes only depreciation and amortisation expenses and net finance costs. Segment comparatives have been updated accordingly to reflect these changes in the measurement of segment results to present a like-for-like view.
Certain items of income and expense are recorded by our corporate areas, rather than being allocated to each segment. These items include the following:
• the adjustment to defer our basic access installation and connection fee revenues and costs in accordance with our accounting policy. Our reportable segments record these amounts upfront;
• the majority of redundancy expenses for the Telstra Entity; and • rental costs associated with printers and other related equipment
for the Telstra Entity.
In addition, the following narrative further explains how some items are allocated and managed, and as a result how they are reflected in our segment results:
• sales revenue associated with mobile handsets for TC, TB and TE&G are mainly allocated to the TC segment along with the associated costs of goods and services purchased;
• ongoing prepaid and postpaid mobile revenues derived from our mobile usage is recorded in TC, TB and TE&G depending on the type of customer serviced;
• TOps recognise certain expenses in relation to the installation and running of the hybrid fibre coaxial cable network;
• domestic promotion and advertising expense for the Telstra Entity is recorded centrally in TIPM; and
• call centre costs associated with TB and TE&G are included in the TC segment.
5. SEGMENT INFORMATION (CONTINUED)
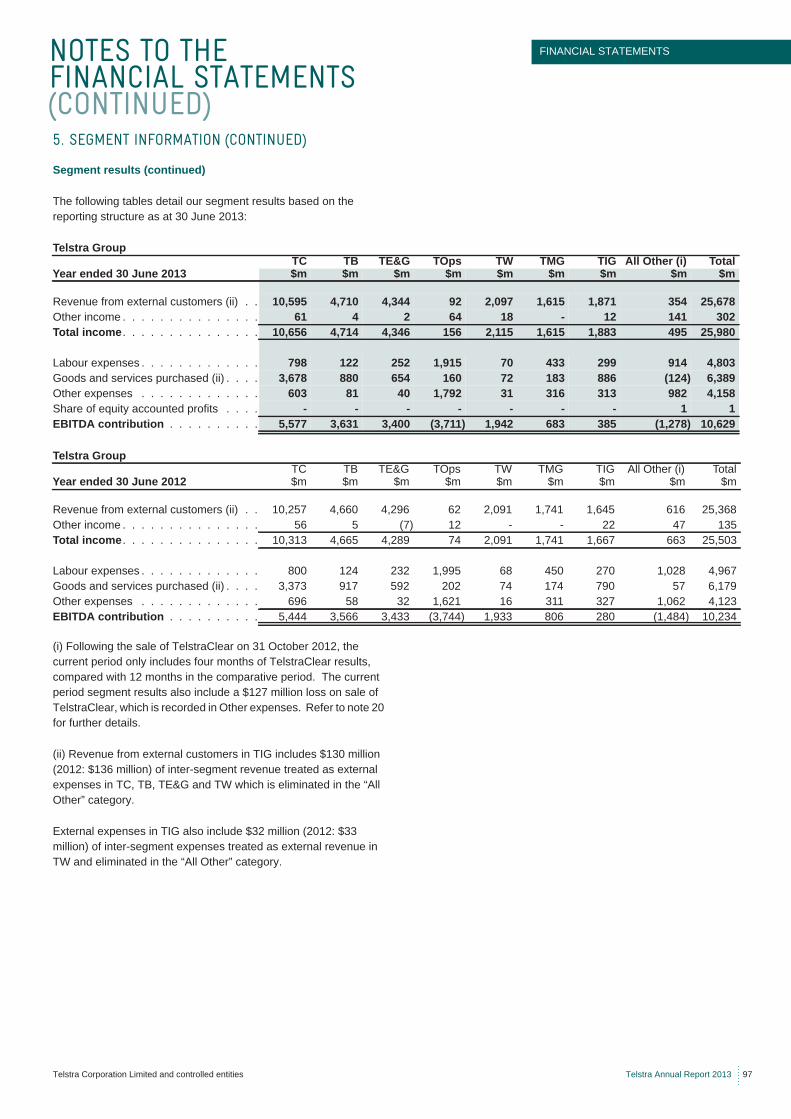
NOTES TO THE FINANCIAL STATEMENTS (CONTINUED)
FINANCIAL STATEMENTS
Telstra Corporation Limited and controlled entities Telstra Annual Report 2013 97
Segment results (continued)
The following tables detail our segment results based on the reporting structure as at 30 June 2013:
(i) Following the sale of TelstraClear on 31 October 2012, the current period only includes four months of TelstraClear results, compared with 12 months in the comparative period. The current period segment results also include a $127 million loss on sale of TelstraClear, which is recorded in Other expenses. Refer to note 20 for further details.
(ii) Revenue from external customers in TIG includes $130 million (2012: $136 million) of inter-segment revenue treated as external expenses in TC, TB, TE&G and TW which is eliminated in the “All Other” category.
External expenses in TIG also include $32 million (2012: $33 million) of inter-segment expenses treated as external revenue in TW and eliminated in the “All Other” category.
5. SEGMENT INFORMATION (CONTINUED)
Telstra GroupTC TB TE&G TOps TW TMG TIG All Other (i) Total
Year ended 30 June 2013 $m $m $m $m $m $m $m $m $m
Revenue from external customers (ii) . . 10,595 4,710 4,344 92 2,097 1,615 1,871 354 25,678Other income . . . . . . . . . . . . . . . 61 4 2 64 18 - 12 141 302Total income. . . . . . . . . . . . . . . 10,656 4,714 4,346 156 2,115 1,615 1,883 495 25,980
Labour expenses . . . . . . . . . . . . . 798 122 252 1,915 70 433 299 914 4,803Goods and services purchased (ii) . . . . 3,678 880 654 160 72 183 886 (124) 6,389Other expenses . . . . . . . . . . . . . 603 81 40 1,792 31 316 313 982 4,158Share of equity accounted profits . . . . - - - - - - - 1 1EBITDA contribution . . . . . . . . . . 5,577 3,631 3,400 (3,711) 1,942 683 385 (1,278) 10,629
Telstra GroupTC TB TE&G TOps TW TMG TIG All Other (i) Total
Year ended 30 June 2012 $m $m $m $m $m $m $m $m $m
Revenue from external customers (ii) . . 10,257 4,660 4,296 62 2,091 1,741 1,645 616 25,368Other income . . . . . . . . . . . . . . . 56 5 (7) 12 - - 22 47 135Total income. . . . . . . . . . . . . . . 10,313 4,665 4,289 74 2,091 1,741 1,667 663 25,503
Labour expenses . . . . . . . . . . . . . 800 124 232 1,995 68 450 270 1,028 4,967Goods and services purchased (ii) . . . . 3,373 917 592 202 74 174 790 57 6,179Other expenses . . . . . . . . . . . . . 696 58 32 1,621 16 311 327 1,062 4,123EBITDA contribution . . . . . . . . . . 5,444 3,566 3,433 (3,744) 1,933 806 280 (1,484) 10,234
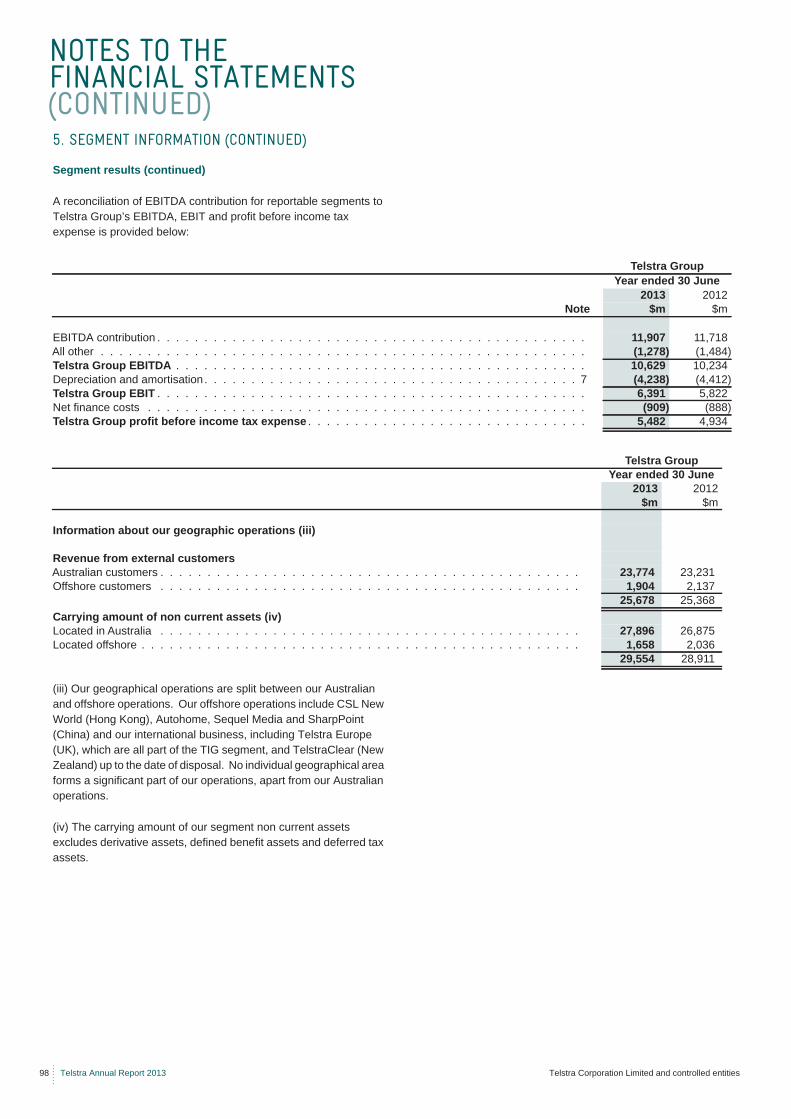
NOTES TO THE FINANCIAL STATEMENTS (CONTINUED)
98 Telstra Annual Report 2013 Telstra Corporation Limited and controlled entities
Segment results (continued)
A reconciliation of EBITDA contribution for reportable segments to Telstra Group’s EBITDA, EBIT and profit before income tax expense is provided below:
(iii) Our geographical operations are split between our Australian and offshore operations. Our offshore operations include CSL New World (Hong Kong), Autohome, Sequel Media and SharpPoint (China) and our international business, including Telstra Europe (UK), which are all part of the TIG segment, and TelstraClear (New Zealand) up to the date of disposal. No individual geographical area forms a significant part of our operations, apart from our Australian operations.
(iv) The carrying amount of our segment non current assets excludes derivative assets, defined benefit assets and deferred tax assets.
5. SEGMENT INFORMATION (CONTINUED)
Telstra GroupYear ended 30 June
2013 2012 Note $m $m
EBITDA contribution . . . . . . . . . . . . . . . . . . . . . . . . . . . . . . . . . . . . . . . . . . . . . . 11,907 11,718All other . . . . . . . . . . . . . . . . . . . . . . . . . . . . . . . . . . . . . . . . . . . . . . . . . . . . (1,278) (1,484)Telstra Group EBITDA . . . . . . . . . . . . . . . . . . . . . . . . . . . . . . . . . . . . . . . . . . . . 10,629 10,234Depreciation and amortisation . . . . . . . . . . . . . . . . . . . . . . . . . . . . . . . . . . . . . . . . 7 (4,238) (4,412)Telstra Group EBIT . . . . . . . . . . . . . . . . . . . . . . . . . . . . . . . . . . . . . . . . . . . . . . 6,391 5,822Net finance costs . . . . . . . . . . . . . . . . . . . . . . . . . . . . . . . . . . . . . . . . . . . . . . . (909) (888)Telstra Group profit before income tax expense . . . . . . . . . . . . . . . . . . . . . . . . . . . . . . 5,482 4,934
Telstra GroupYear ended 30 June
2013 2012$m $m
Information about our geographic operations (iii)
Revenue from external customersAustralian customers . . . . . . . . . . . . . . . . . . . . . . . . . . . . . . . . . . . . . . . . . . . . . 23,774 23,231Offshore customers . . . . . . . . . . . . . . . . . . . . . . . . . . . . . . . . . . . . . . . . . . . . . 1,904 2,137
25,678 25,368Carrying amount of non current assets (iv)Located in Australia . . . . . . . . . . . . . . . . . . . . . . . . . . . . . . . . . . . . . . . . . . . . . 27,896 26,875Located offshore . . . . . . . . . . . . . . . . . . . . . . . . . . . . . . . . . . . . . . . . . . . . . . . 1,658 2,036
29,554 28,911
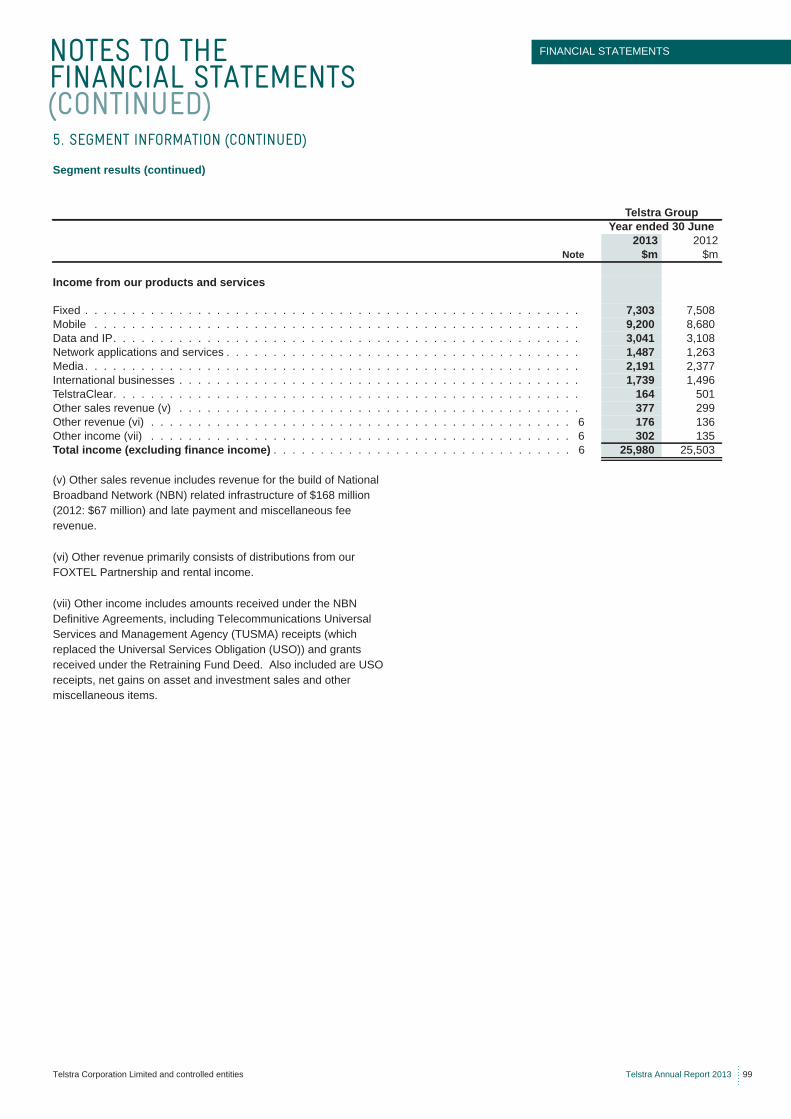
NOTES TO THE FINANCIAL STATEMENTS (CONTINUED)
FINANCIAL STATEMENTS
Telstra Corporation Limited and controlled entities Telstra Annual Report 2013 99
Segment results (continued)
(v) Other sales revenue includes revenue for the build of National Broadband Network (NBN) related infrastructure of $168 million (2012: $67 million) and late payment and miscellaneous fee revenue.
(vi) Other revenue primarily consists of distributions from our FOXTEL Partnership and rental income.
(vii) Other income includes amounts received under the NBN Definitive Agreements, including Telecommunications Universal Services and Management Agency (TUSMA) receipts (which replaced the Universal Services Obligation (USO)) and grants received under the Retraining Fund Deed. Also included are USO receipts, net gains on asset and investment sales and other miscellaneous items.
5. SEGMENT INFORMATION (CONTINUED)
Telstra GroupYear ended 30 June
2013 2012Note $m $m
Income from our products and services
Fixed . . . . . . . . . . . . . . . . . . . . . . . . . . . . . . . . . . . . . . . . . . . . . . . . . . . . . 7,303 7,508Mobile . . . . . . . . . . . . . . . . . . . . . . . . . . . . . . . . . . . . . . . . . . . . . . . . . . . . 9,200 8,680Data and IP. . . . . . . . . . . . . . . . . . . . . . . . . . . . . . . . . . . . . . . . . . . . . . . . . . 3,041 3,108Network applications and services . . . . . . . . . . . . . . . . . . . . . . . . . . . . . . . . . . . . . . 1,487 1,263Media . . . . . . . . . . . . . . . . . . . . . . . . . . . . . . . . . . . . . . . . . . . . . . . . . . . . . 2,191 2,377International businesses . . . . . . . . . . . . . . . . . . . . . . . . . . . . . . . . . . . . . . . . . . . 1,739 1,496TelstraClear. . . . . . . . . . . . . . . . . . . . . . . . . . . . . . . . . . . . . . . . . . . . . . . . . . 164 501Other sales revenue (v) . . . . . . . . . . . . . . . . . . . . . . . . . . . . . . . . . . . . . . . . . . . 377 299Other revenue (vi) . . . . . . . . . . . . . . . . . . . . . . . . . . . . . . . . . . . . . . . . . . . . . 6 176 136Other income (vii) . . . . . . . . . . . . . . . . . . . . . . . . . . . . . . . . . . . . . . . . . . . . . 6 302 135Total income (excluding finance income) . . . . . . . . . . . . . . . . . . . . . . . . . . . . . . . . 6 25,980 25,503
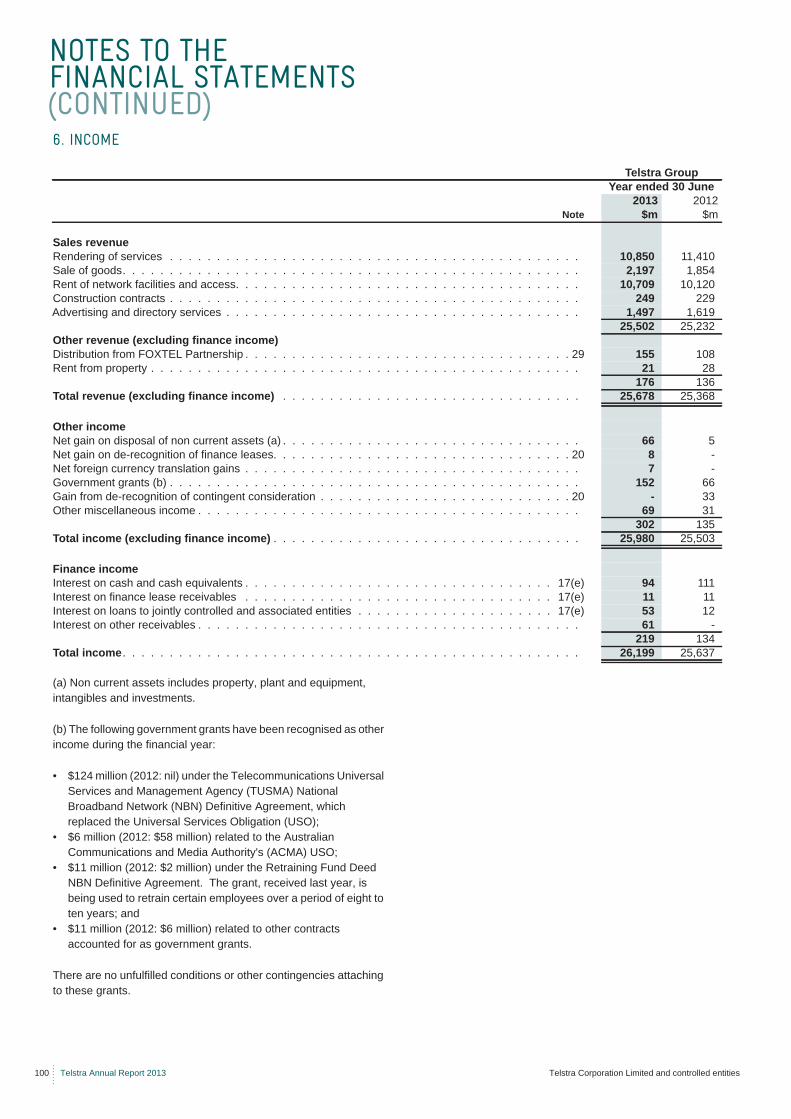
NOTES TO THE FINANCIAL STATEMENTS (CONTINUED)
100 Telstra Annual Report 2013 Telstra Corporation Limited and controlled entities
(a) Non current assets includes property, plant and equipment, intangibles and investments.
(b) The following government grants have been recognised as other income during the financial year:
• $124 million (2012: nil) under the Telecommunications Universal Services and Management Agency (TUSMA) National Broadband Network (NBN) Definitive Agreement, which replaced the Universal Services Obligation (USO);
• $6 million (2012: $58 million) related to the Australian Communications and Media Authority's (ACMA) USO;
• $11 million (2012: $2 million) under the Retraining Fund Deed NBN Definitive Agreement. The grant, received last year, is being used to retrain certain employees over a period of eight to ten years; and
• $11 million (2012: $6 million) related to other contracts accounted for as government grants.
There are no unfulfilled conditions or other contingencies attaching to these grants.
6. INCOME
Telstra GroupYear ended 30 June
2013 2012Note $m $m
Sales revenueRendering of services . . . . . . . . . . . . . . . . . . . . . . . . . . . . . . . . . . . . . . . . . . . . 10,850 11,410Sale of goods. . . . . . . . . . . . . . . . . . . . . . . . . . . . . . . . . . . . . . . . . . . . . . . . . 2,197 1,854Rent of network facilities and access. . . . . . . . . . . . . . . . . . . . . . . . . . . . . . . . . . . . . 10,709 10,120Construction contracts . . . . . . . . . . . . . . . . . . . . . . . . . . . . . . . . . . . . . . . . . . . . 249 229Advertising and directory services . . . . . . . . . . . . . . . . . . . . . . . . . . . . . . . . . . . . . . 1,497 1,619
25,502 25,232Other revenue (excluding finance income)Distribution from FOXTEL Partnership . . . . . . . . . . . . . . . . . . . . . . . . . . . . . . . . . . . 29 155 108Rent from property . . . . . . . . . . . . . . . . . . . . . . . . . . . . . . . . . . . . . . . . . . . . . . 21 28
176 136Total revenue (excluding finance income) . . . . . . . . . . . . . . . . . . . . . . . . . . . . . . . . 25,678 25,368
Other incomeNet gain on disposal of non current assets (a) . . . . . . . . . . . . . . . . . . . . . . . . . . . . . . . . 66 5Net gain on de-recognition of finance leases. . . . . . . . . . . . . . . . . . . . . . . . . . . . . . . . 20 8 -Net foreign currency translation gains . . . . . . . . . . . . . . . . . . . . . . . . . . . . . . . . . . . . 7 -Government grants (b) . . . . . . . . . . . . . . . . . . . . . . . . . . . . . . . . . . . . . . . . . . . . 152 66Gain from de-recognition of contingent consideration . . . . . . . . . . . . . . . . . . . . . . . . . . . 20 - 33Other miscellaneous income . . . . . . . . . . . . . . . . . . . . . . . . . . . . . . . . . . . . . . . . . 69 31
302 135Total income (excluding finance income) . . . . . . . . . . . . . . . . . . . . . . . . . . . . . . . . . 25,980 25,503
Finance incomeInterest on cash and cash equivalents . . . . . . . . . . . . . . . . . . . . . . . . . . . . . . . . . 17(e) 94 111Interest on finance lease receivables . . . . . . . . . . . . . . . . . . . . . . . . . . . . . . . . . 17(e) 11 11Interest on loans to jointly controlled and associated entities . . . . . . . . . . . . . . . . . . . . . 17(e) 53 12Interest on other receivables . . . . . . . . . . . . . . . . . . . . . . . . . . . . . . . . . . . . . . . . . 61 -
219 134Total income. . . . . . . . . . . . . . . . . . . . . . . . . . . . . . . . . . . . . . . . . . . . . . . . . 26,199 25,637
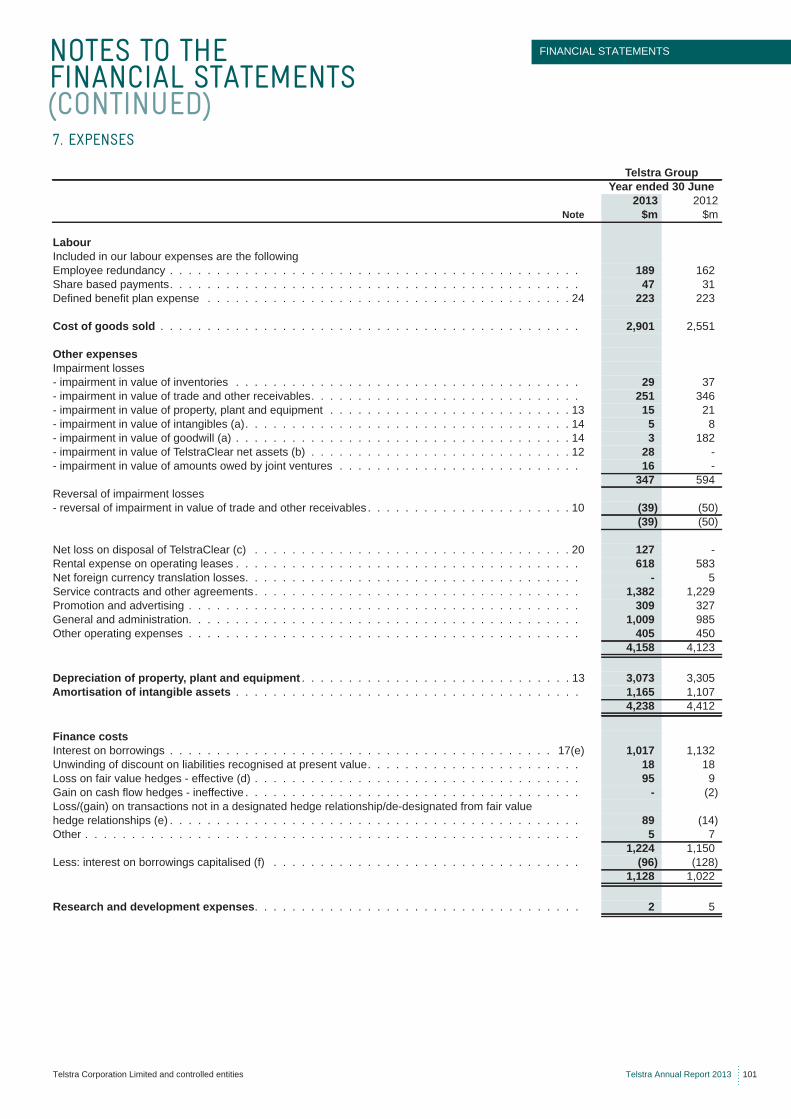
NOTES TO THE FINANCIAL STATEMENTS (CONTINUED)
FINANCIAL STATEMENTS
Telstra Corporation Limited and controlled entities Telstra Annual Report 2013 101
7. EXPENSES
Telstra GroupYear ended 30 June
2013 2012Note $m $m
LabourIncluded in our labour expenses are the followingEmployee redundancy . . . . . . . . . . . . . . . . . . . . . . . . . . . . . . . . . . . . . . . . . . . . 189 162Share based payments. . . . . . . . . . . . . . . . . . . . . . . . . . . . . . . . . . . . . . . . . . . . 47 31Defined benefit plan expense . . . . . . . . . . . . . . . . . . . . . . . . . . . . . . . . . . . . . . . 24 223 223
Cost of goods sold . . . . . . . . . . . . . . . . . . . . . . . . . . . . . . . . . . . . . . . . . . . . . 2,901 2,551
Other expensesImpairment losses- impairment in value of inventories . . . . . . . . . . . . . . . . . . . . . . . . . . . . . . . . . . . . . 29 37- impairment in value of trade and other receivables. . . . . . . . . . . . . . . . . . . . . . . . . . . . . 251 346- impairment in value of property, plant and equipment . . . . . . . . . . . . . . . . . . . . . . . . . . 13 15 21- impairment in value of intangibles (a). . . . . . . . . . . . . . . . . . . . . . . . . . . . . . . . . . . 14 5 8- impairment in value of goodwill (a) . . . . . . . . . . . . . . . . . . . . . . . . . . . . . . . . . . . . 14 3 182- impairment in value of TelstraClear net assets (b) . . . . . . . . . . . . . . . . . . . . . . . . . . . . 12 28 -- impairment in value of amounts owed by joint ventures . . . . . . . . . . . . . . . . . . . . . . . . . . 16 -
347 594Reversal of impairment losses- reversal of impairment in value of trade and other receivables . . . . . . . . . . . . . . . . . . . . . . 10 (39) (50)
(39) (50)
Net loss on disposal of TelstraClear (c) . . . . . . . . . . . . . . . . . . . . . . . . . . . . . . . . . . 20 127 -Rental expense on operating leases . . . . . . . . . . . . . . . . . . . . . . . . . . . . . . . . . . . . . 618 583Net foreign currency translation losses. . . . . . . . . . . . . . . . . . . . . . . . . . . . . . . . . . . . - 5Service contracts and other agreements . . . . . . . . . . . . . . . . . . . . . . . . . . . . . . . . . . . 1,382 1,229Promotion and advertising . . . . . . . . . . . . . . . . . . . . . . . . . . . . . . . . . . . . . . . . . . 309 327General and administration. . . . . . . . . . . . . . . . . . . . . . . . . . . . . . . . . . . . . . . . . . 1,009 985Other operating expenses . . . . . . . . . . . . . . . . . . . . . . . . . . . . . . . . . . . . . . . . . . 405 450
4,158 4,123
Depreciation of property, plant and equipment . . . . . . . . . . . . . . . . . . . . . . . . . . . . . 13 3,073 3,305Amortisation of intangible assets . . . . . . . . . . . . . . . . . . . . . . . . . . . . . . . . . . . . . 1,165 1,107
4,238 4,412
Finance costsInterest on borrowings . . . . . . . . . . . . . . . . . . . . . . . . . . . . . . . . . . . . . . . . . 17(e) 1,017 1,132Unwinding of discount on liabilities recognised at present value. . . . . . . . . . . . . . . . . . . . . . . 18 18Loss on fair value hedges - effective (d) . . . . . . . . . . . . . . . . . . . . . . . . . . . . . . . . . . . 95 9Gain on cash flow hedges - ineffective . . . . . . . . . . . . . . . . . . . . . . . . . . . . . . . . . . . . - (2)Loss/(gain) on transactions not in a designated hedge relationship/de-designated from fair valuehedge relationships (e) . . . . . . . . . . . . . . . . . . . . . . . . . . . . . . . . . . . . . . . . . . . . 89 (14)Other . . . . . . . . . . . . . . . . . . . . . . . . . . . . . . . . . . . . . . . . . . . . . . . . . . . . . 5 7
1,224 1,150Less: interest on borrowings capitalised (f) . . . . . . . . . . . . . . . . . . . . . . . . . . . . . . . . . (96) (128)
1,128 1,022
Research and development expenses. . . . . . . . . . . . . . . . . . . . . . . . . . . . . . . . . . . 2 5
NOTES TO THE FINANCIAL STATEMENTS (CONTINUED)
102 Telstra Annual Report 2013 Telstra Corporation Limited and controlled entities
(a) We have recognised an impairment loss of $8 million (2012: $190 million) relating to impairment of goodwill ($3 million) and other intangible assets ($5 million). Refer to note 14 for further details.
(b) We have recognised an impairment loss of $28 million relating to the impairment of TelstraClear net assets. This was due to the operating results of TelstraClear increasing the net assets at the date of disposal, which were not recoverable through the disposal of TelstraClear. Refer to note 12 for further details.
(c) A $127 million loss on disposal of TelstraClear was recognised during the financial year 2013, which largely comprised foreign exchange losses. Refer to note 20 for further details.
(d) We use our cross currency and interest rate swaps as fair value hedges to convert our foreign currency borrowings into Australian dollar floating rate borrowings.
The $95 million unrealised loss for the current year (2012: $9 million) reflects the following valuation impacts:
• movement in base market rates and Telstra’s borrowing margins between valuation dates;
• reduction in the number of future interest flows as we approach maturity of the financial instruments; and
• discount factor unwinding as borrowings move closer to maturity.
It is important to note that in general it is our intention to hold our borrowings and associated derivative instruments to maturity. Accordingly, unrealised revaluation gains and losses will be recognised in our finance costs over the life of the financial instrument and for each transaction will progressively unwind to nil at maturity.
Refer to note 18 for further details regarding our hedging strategies.
(e) A combination of the following factors has resulted in a net unrealised loss of $89 million (2012: gain of $14 million) associated with financial instruments that are either not in a designated hedge relationship or were previously designated in a hedge relationship and no longer qualify for hedge accounting:
• the valuation impacts described at (d) above for fair value hedges;
• the different measurement bases of the borrowings (measured at amortised cost) and the associated derivatives (measured at fair value); and
• a net loss of $21 million (2012: $21 million) for the amortisation impact of unwinding previously recognised unrealised gains on those borrowings that were de-designated from hedge relationships.
Although these borrowings and the related derivative instruments do not satisfy the requirements for hedge accounting, they are in effective economic relationships based on contractual face value amounts and cash flows over the life of the transaction.
(f) Interest on borrowings has been capitalised using a capitalisation rate of 6.4 per cent (2012: 7.0 per cent).
7. EXPENSES (CONTINUED)
NOTES TO THE FINANCIAL STATEMENTS (CONTINUED)
FINANCIAL STATEMENTS
Telstra Corporation Limited and controlled entities Telstra Annual Report 2013 103
Other services
Other services comprise audit related fees and non-audit services.
(a) Audit related fees charged by EY are for services that are reasonably related to the performance of the audit or review of our financial statements and other assurance engagements. These services include assurance services over debt raising prospectuses, additional control assessments, various accounting advice and additional audit services related to our controlled entities.
(b) Non-audit services comprise the following:
• tax fees charged by EY that mainly relate to income tax return services; and
• other services that relate to all additional services performed by EY, other than those disclosed as auditing and reviewing the financial reports, audit related and tax. These services include various reviews and non assurance services across the Group, including risk assessments and IT related projects.
We have processes in place to maintain the independence of the external auditor, including the level of expenditure on non-audit services. EY also has specific internal processes in place to ensure auditor independence.
The Audit Committee approves the recurring audit and non-audit fees. The provision of additional audit and non-audit services by EY must be approved by either the Chief Financial Officer, the Chairman of the Audit Committee or the Audit Committee, depending upon the fees involved, if not covered by the Audit Committee pre-approval, subject to confirmation by both management and EY that the provision of these services does not compromise auditor independence. Our auditor independence guidelines clearly identify prohibited services. All additional EY engagements approved are reported to the Audit Committee at the next meeting.
8. REMUNERATION OF AUDITORS
Telstra GroupYear ended 30 June
2013 2012$m $m
Audit feesEY has charged the following amounts for auditing and reviewing the financial reports . . . . . . . . . . . 8.079 8.632
Other servicesAudit related (a) . . . . . . . . . . . . . . . . . . . . . . . . . . . . . . . . . . . . . . . . . . . . . . . 1.374 0.840Non-audit services (b) . . . . . . . . . . . . . . . . . . . . . . . . . . . . . . . . . . . . . . . . . . . . 0.515 0.846Other services provided by EY . . . . . . . . . . . . . . . . . . . . . . . . . . . . . . . . . . . . . . . . 1.889 1.686
NOTES TO THE FINANCIAL STATEMENTS (CONTINUED)
104 Telstra Annual Report 2013 Telstra Corporation Limited and controlled entities
(*) This includes the impact of foreign exchange movements in the deferred tax items recognised in the income statement.
9. INCOME TAXES
Telstra GroupAs at 30 June
2013 2012$m $m
Major components of income tax expenseCurrent tax expense . . . . . . . . . . . . . . . . . . . . . . . . . . . . . . . . . . . . . . . . . . . . . 1,588 1,826Deferred tax resulting from the origination and reversal of temporary differences . . . . . . . . . . . . . . 28 (337)Under provision of tax in prior years . . . . . . . . . . . . . . . . . . . . . . . . . . . . . . . . . . . . . 1 21
1,617 1,510
Notional income tax expense on profit differs from actual income tax expense recorded as followsProfit before income tax expense . . . . . . . . . . . . . . . . . . . . . . . . . . . . . . . . . . . . . . 5,482 4,934
Notional income tax expense calculated at the Australian tax rate of 30% . . . . . . . . . . . . . . . . . 1,645 1,480
Which is adjusted by the tax effect of:Different rates of tax on overseas income . . . . . . . . . . . . . . . . . . . . . . . . . . . . . . . . . . (24) (15)Non assessable and non deductible items . . . . . . . . . . . . . . . . . . . . . . . . . . . . . . . . . . (2) 63Amended assessments. . . . . . . . . . . . . . . . . . . . . . . . . . . . . . . . . . . . . . . . . . . . (3) (39)Under provision of tax in prior years . . . . . . . . . . . . . . . . . . . . . . . . . . . . . . . . . . . . . 1 21Income tax expense on profit. . . . . . . . . . . . . . . . . . . . . . . . . . . . . . . . . . . . . . . . . 1,617 1,510
Income tax recognised directly in other comprehensive income or equity during the year . . . . . . . . . 164 (262)
Telstra GroupAs at 30 June
2013 2012$m $m
(Deferred tax liability)/deferred tax asset
Deferred tax items recognised in the income statement (*)Property, plant and equipment . . . . . . . . . . . . . . . . . . . . . . . . . . . . . . . . . . . . . . . . (1,199) (1,241)Intangible assets . . . . . . . . . . . . . . . . . . . . . . . . . . . . . . . . . . . . . . . . . . . . . . . (883) (830)Borrowings and derivative financial instruments . . . . . . . . . . . . . . . . . . . . . . . . . . . . . . . (22) (59)Provision for employee entitlements . . . . . . . . . . . . . . . . . . . . . . . . . . . . . . . . . . . . . 297 292Revenue received in advance . . . . . . . . . . . . . . . . . . . . . . . . . . . . . . . . . . . . . . . . 139 194Provision for workers' compensation . . . . . . . . . . . . . . . . . . . . . . . . . . . . . . . . . . . . . 18 20Allowance for doubtful debts . . . . . . . . . . . . . . . . . . . . . . . . . . . . . . . . . . . . . . . . . 48 57Defined benefit liability/asset (a) . . . . . . . . . . . . . . . . . . . . . . . . . . . . . . . . . . . . . . . 65 98Trade and other payables . . . . . . . . . . . . . . . . . . . . . . . . . . . . . . . . . . . . . . . . . . 153 111Other provisions . . . . . . . . . . . . . . . . . . . . . . . . . . . . . . . . . . . . . . . . . . . . . . . 31 49Income tax losses (b). . . . . . . . . . . . . . . . . . . . . . . . . . . . . . . . . . . . . . . . . . . . . 2 39Other . . . . . . . . . . . . . . . . . . . . . . . . . . . . . . . . . . . . . . . . . . . . . . . . . . . . . (11) (32)
(1,362) (1,302)Deferred tax items recognised in other comprehensive income or equity (c)Defined benefit liability/asset (a) . . . . . . . . . . . . . . . . . . . . . . . . . . . . . . . . . . . . . . . (54) 148Derivative financial instruments . . . . . . . . . . . . . . . . . . . . . . . . . . . . . . . . . . . . . . . 91 53
37 201Net deferred tax liability . . . . . . . . . . . . . . . . . . . . . . . . . . . . . . . . . . . . . . . . . . (1,325) (1,101)
Our net deferred tax liability is split as followsDeferred tax assets recognised in the statement of financial position . . . . . . . . . . . . . . . . . . . . 5 6Deferred tax liabilities recognised in the statement of financial position . . . . . . . . . . . . . . . . . . . (1,330) (1,107)
(1,325) (1,101)
NOTES TO THE FINANCIAL STATEMENTS (CONTINUED)
FINANCIAL STATEMENTS
Telstra Corporation Limited and controlled entities Telstra Annual Report 2013 105
(a) Our net deferred tax asset on our defined benefit liability for the Telstra Group is $11 million (2012: $246 million).
(b) We have recognised a deferred tax asset for the unused tax losses of our offshore controlled entities to the extent that it is probable that future taxable profit will be available against which the unused tax losses can be utilised. We have prepared a management budget in line with our current knowledge of future events to support our view of sufficient future taxable profits being available to offset our unused tax losses.
(c) When the underlying transactions to which our deferred tax relates are recognised directly in other comprehensive income or equity, the temporary differences associated with these adjustments are also recognised directly in other comprehensive income or equity.
(d) Our deferred tax assets not recognised in the statement of financial position may be used in future years if the following criteria are met:
• our controlled entities have sufficient future taxable profit to enable the income tax losses and temporary differences to be offset against that taxable profit;
• we have sufficient future capital gains to be offset against those capital losses;
• we continue to satisfy the conditions required by tax legislation to be able to use the tax losses; and
• there are no future changes in tax legislation that will adversely affect us in using the benefit of the tax losses.
Tax consolidation
The Telstra Entity and its Australian resident wholly owned entities previously elected to form a tax consolidated group. As a consequence of the election to enter tax consolidation, the tax consolidated group is treated as a single entity for income tax purposes.
The Telstra Entity, as the head entity in the tax consolidated group, recognises, in addition to its own transactions, the current tax liabilities and the deferred tax assets arising from unused tax losses and tax credits for all entities in the group. However, the Telstra Entity and its Australian resident wholly owned entities account for their own current tax expense and deferred tax amounts.
Upon tax consolidation, the entities within the tax consolidated group entered into a tax sharing agreement. The terms of this agreement specified the methods of allocating any tax liability in the event of default by the Telstra Entity on its group payment obligations and the treatment where a subsidiary member exits the group. The tax liability of the group otherwise remains with the Telstra Entity for tax purposes.
A tax funding arrangement is also in place for entities within the tax consolidated group under which:
• the Telstra Entity compensates its Australian resident wholly owned controlled entities for any current tax receivable assumed;
• the Telstra Entity compensates its Australian resident wholly owned controlled entities for any deferred tax assets relating to unused tax losses and tax credits; and
• Australian resident wholly owned entities compensate the Telstra Entity for any current tax payable assumed.
The funding amounts are based on the amounts recorded in the financial statements of the wholly owned entities.
Amounts receivable by the Telstra Entity of $34 million (2012: $11 million) and amounts payable by the Telstra Entity of $247 million (2012: $211 million) under the tax funding arrangements are due in the next financial year upon final settlement of the current tax payable for the tax consolidated group.
9. INCOME TAXES (CONTINUED)
Telstra GroupAs at 30 June
2013 2012$m $m
Deferred tax assets not recognised (d)Income tax losses . . . . . . . . . . . . . . . . . . . . . . . . . . . . . . . . . . . . . . . . . . . . . . 98 46Capital tax losses. . . . . . . . . . . . . . . . . . . . . . . . . . . . . . . . . . . . . . . . . . . . . . . 202 161Deductible temporary differences . . . . . . . . . . . . . . . . . . . . . . . . . . . . . . . . . . . . . . 307 307
607 514
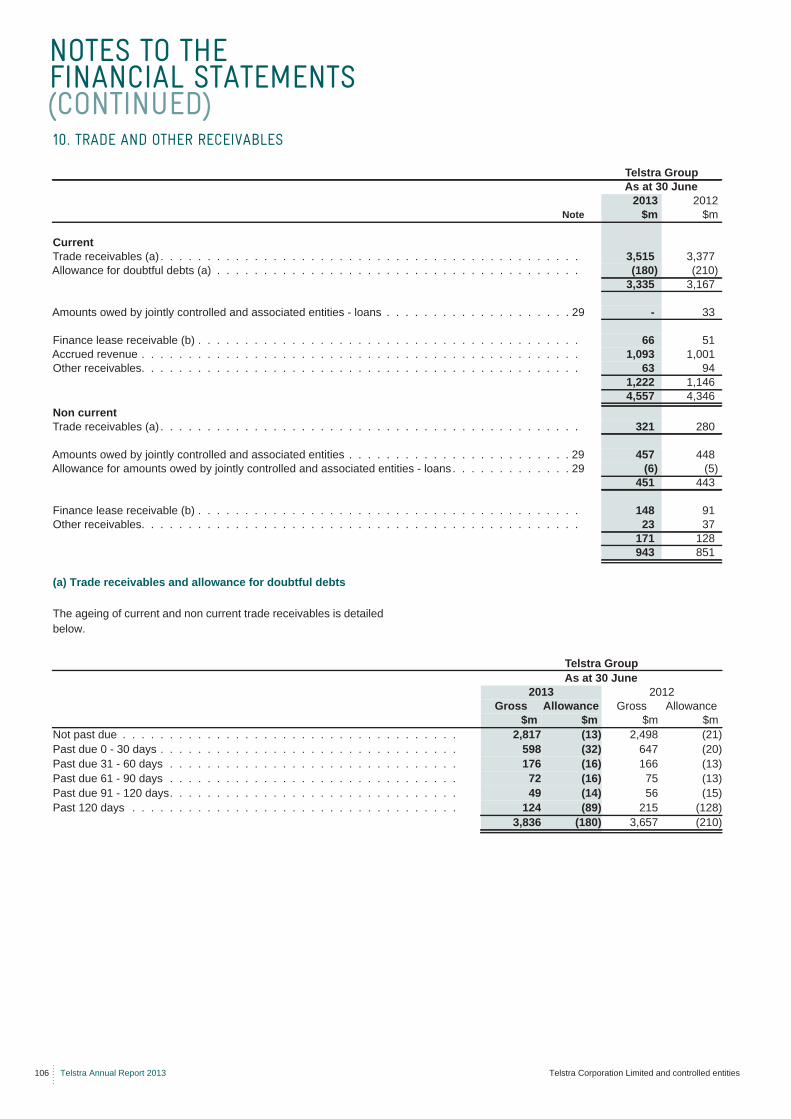
NOTES TO THE FINANCIAL STATEMENTS (CONTINUED)
106 Telstra Annual Report 2013 Telstra Corporation Limited and controlled entities
(a) Trade receivables and allowance for doubtful debts
The ageing of current and non current trade receivables is detailed below.
10. TRADE AND OTHER RECEIVABLES
Telstra GroupAs at 30 June
2013 2012Note $m $m
CurrentTrade receivables (a) . . . . . . . . . . . . . . . . . . . . . . . . . . . . . . . . . . . . . . . . . . . . . 3,515 3,377Allowance for doubtful debts (a) . . . . . . . . . . . . . . . . . . . . . . . . . . . . . . . . . . . . . . . (180) (210)
3,335 3,167
Amounts owed by jointly controlled and associated entities - loans . . . . . . . . . . . . . . . . . . . . 29 - 33
Finance lease receivable (b) . . . . . . . . . . . . . . . . . . . . . . . . . . . . . . . . . . . . . . . . . 66 51Accrued revenue . . . . . . . . . . . . . . . . . . . . . . . . . . . . . . . . . . . . . . . . . . . . . . . 1,093 1,001Other receivables. . . . . . . . . . . . . . . . . . . . . . . . . . . . . . . . . . . . . . . . . . . . . . . 63 94
1,222 1,1464,557 4,346
Non currentTrade receivables (a) . . . . . . . . . . . . . . . . . . . . . . . . . . . . . . . . . . . . . . . . . . . . . 321 280
Amounts owed by jointly controlled and associated entities . . . . . . . . . . . . . . . . . . . . . . . . 29 457 448Allowance for amounts owed by jointly controlled and associated entities - loans . . . . . . . . . . . . . 29 (6) (5)
451 443
Finance lease receivable (b) . . . . . . . . . . . . . . . . . . . . . . . . . . . . . . . . . . . . . . . . . 148 91Other receivables. . . . . . . . . . . . . . . . . . . . . . . . . . . . . . . . . . . . . . . . . . . . . . . 23 37
171 128943 851
Telstra GroupAs at 30 June
2013 2012Gross Allowance Gross Allowance
$m $m $m $mNot past due . . . . . . . . . . . . . . . . . . . . . . . . . . . . . . . . . . . . 2,817 (13) 2,498 (21)Past due 0 - 30 days . . . . . . . . . . . . . . . . . . . . . . . . . . . . . . . . 598 (32) 647 (20)Past due 31 - 60 days . . . . . . . . . . . . . . . . . . . . . . . . . . . . . . . 176 (16) 166 (13)Past due 61 - 90 days . . . . . . . . . . . . . . . . . . . . . . . . . . . . . . . 72 (16) 75 (13)Past due 91 - 120 days. . . . . . . . . . . . . . . . . . . . . . . . . . . . . . . 49 (14) 56 (15)Past 120 days . . . . . . . . . . . . . . . . . . . . . . . . . . . . . . . . . . . 124 (89) 215 (128)
3,836 (180) 3,657 (210)
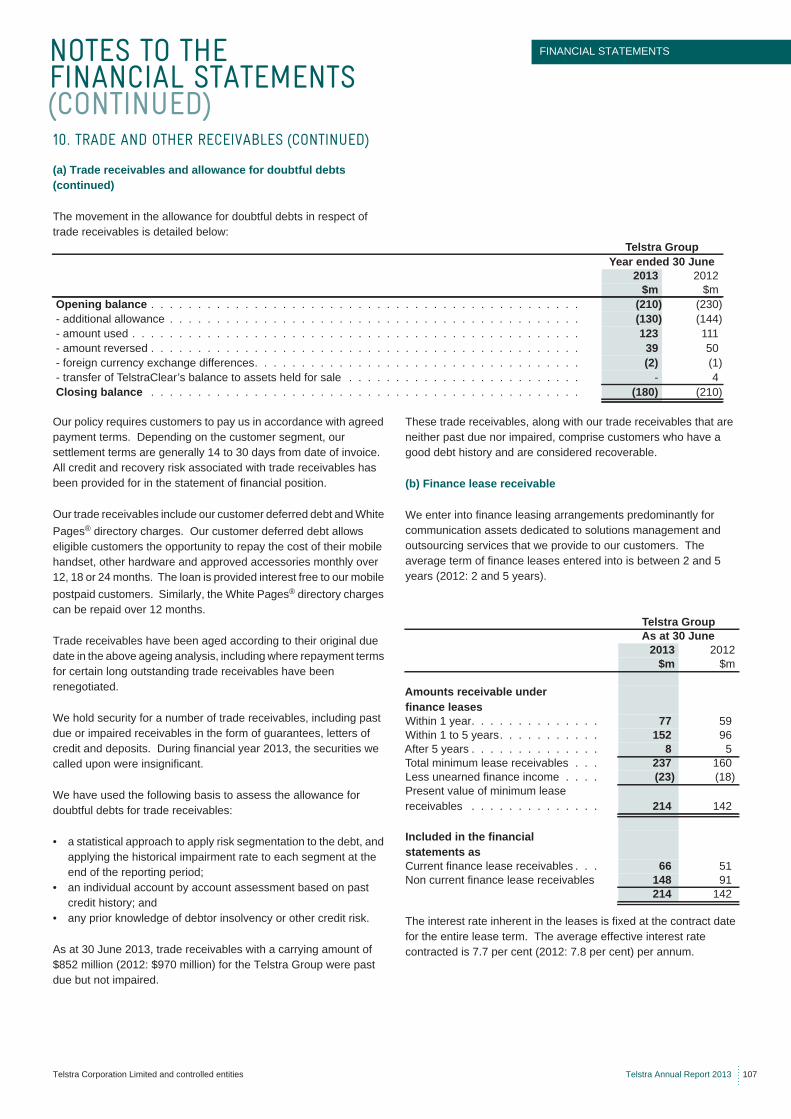
NOTES TO THE FINANCIAL STATEMENTS (CONTINUED)
FINANCIAL STATEMENTS
Telstra Corporation Limited and controlled entities Telstra Annual Report 2013 107
(a) Trade receivables and allowance for doubtful debts (continued)
The movement in the allowance for doubtful debts in respect of trade receivables is detailed below:
Our policy requires customers to pay us in accordance with agreed payment terms. Depending on the customer segment, our settlement terms are generally 14 to 30 days from date of invoice. All credit and recovery risk associated with trade receivables has been provided for in the statement of financial position.
Our trade receivables include our customer deferred debt and White Pages® directory charges. Our customer deferred debt allows eligible customers the opportunity to repay the cost of their mobile handset, other hardware and approved accessories monthly over 12, 18 or 24 months. The loan is provided interest free to our mobile postpaid customers. Similarly, the White Pages® directory charges can be repaid over 12 months.
Trade receivables have been aged according to their original due date in the above ageing analysis, including where repayment terms for certain long outstanding trade receivables have been renegotiated.
We hold security for a number of trade receivables, including past due or impaired receivables in the form of guarantees, letters of credit and deposits. During financial year 2013, the securities we called upon were insignificant.
We have used the following basis to assess the allowance for doubtful debts for trade receivables:
• a statistical approach to apply risk segmentation to the debt, and applying the historical impairment rate to each segment at the end of the reporting period;
• an individual account by account assessment based on past credit history; and
• any prior knowledge of debtor insolvency or other credit risk.
As at 30 June 2013, trade receivables with a carrying amount of $852 million (2012: $970 million) for the Telstra Group were past due but not impaired.
These trade receivables, along with our trade receivables that are neither past due nor impaired, comprise customers who have a good debt history and are considered recoverable.
(b) Finance lease receivable
We enter into finance leasing arrangements predominantly for communication assets dedicated to solutions management and outsourcing services that we provide to our customers. The average term of finance leases entered into is between 2 and 5 years (2012: 2 and 5 years).
The interest rate inherent in the leases is fixed at the contract date for the entire lease term. The average effective interest rate contracted is 7.7 per cent (2012: 7.8 per cent) per annum.
10. TRADE AND OTHER RECEIVABLES (CONTINUED)
Telstra GroupYear ended 30 June
2013 2012$m $m
Opening balance . . . . . . . . . . . . . . . . . . . . . . . . . . . . . . . . . . . . . . . . . . . . . . (210) (230) - additional allowance . . . . . . . . . . . . . . . . . . . . . . . . . . . . . . . . . . . . . . . . . . . . (130) (144) - amount used . . . . . . . . . . . . . . . . . . . . . . . . . . . . . . . . . . . . . . . . . . . . . . . . 123 111 - amount reversed . . . . . . . . . . . . . . . . . . . . . . . . . . . . . . . . . . . . . . . . . . . . . . 39 50 - foreign currency exchange differences. . . . . . . . . . . . . . . . . . . . . . . . . . . . . . . . . . . (2) (1) - transfer of TelstraClear’s balance to assets held for sale . . . . . . . . . . . . . . . . . . . . . . . . . - 4 Closing balance . . . . . . . . . . . . . . . . . . . . . . . . . . . . . . . . . . . . . . . . . . . . . . (180) (210)
Telstra GroupAs at 30 June
2013 2012$m $m
Amounts receivable under finance leasesWithin 1 year. . . . . . . . . . . . . . 77 59Within 1 to 5 years. . . . . . . . . . . 152 96After 5 years . . . . . . . . . . . . . . 8 5Total minimum lease receivables . . . 237 160Less unearned finance income . . . . (23) (18)Present value of minimum lease receivables . . . . . . . . . . . . . . 214 142
Included in the financial statements asCurrent finance lease receivables . . . 66 51Non current finance lease receivables 148 91
214 142
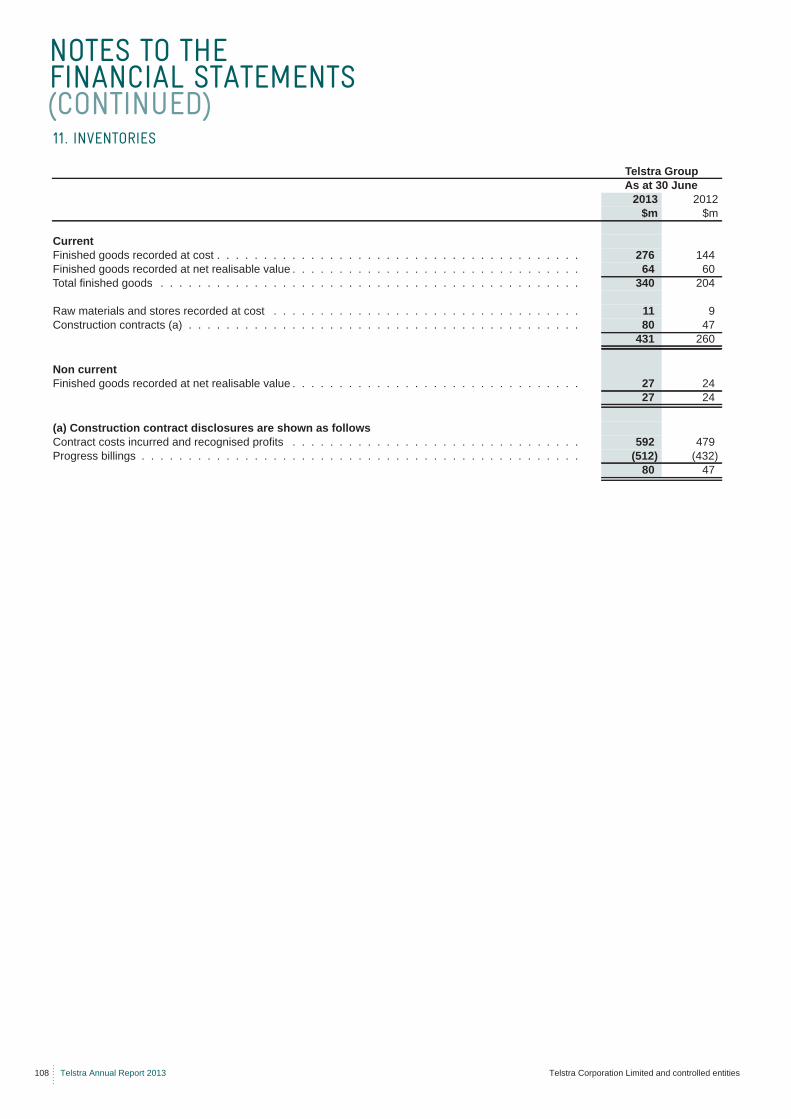
NOTES TO THE FINANCIAL STATEMENTS (CONTINUED)
108 Telstra Annual Report 2013 Telstra Corporation Limited and controlled entities
11. INVENTORIES
Telstra GroupAs at 30 June
2013 2012$m $m
CurrentFinished goods recorded at cost . . . . . . . . . . . . . . . . . . . . . . . . . . . . . . . . . . . . . . . 276 144Finished goods recorded at net realisable value . . . . . . . . . . . . . . . . . . . . . . . . . . . . . . . 64 60Total finished goods . . . . . . . . . . . . . . . . . . . . . . . . . . . . . . . . . . . . . . . . . . . . . 340 204
Raw materials and stores recorded at cost . . . . . . . . . . . . . . . . . . . . . . . . . . . . . . . . . 11 9Construction contracts (a) . . . . . . . . . . . . . . . . . . . . . . . . . . . . . . . . . . . . . . . . . . 80 47
431 260
Non currentFinished goods recorded at net realisable value . . . . . . . . . . . . . . . . . . . . . . . . . . . . . . . 27 24
27 24
(a) Construction contract disclosures are shown as followsContract costs incurred and recognised profits . . . . . . . . . . . . . . . . . . . . . . . . . . . . . . . 592 479Progress billings . . . . . . . . . . . . . . . . . . . . . . . . . . . . . . . . . . . . . . . . . . . . . . . (512) (432)
80 47
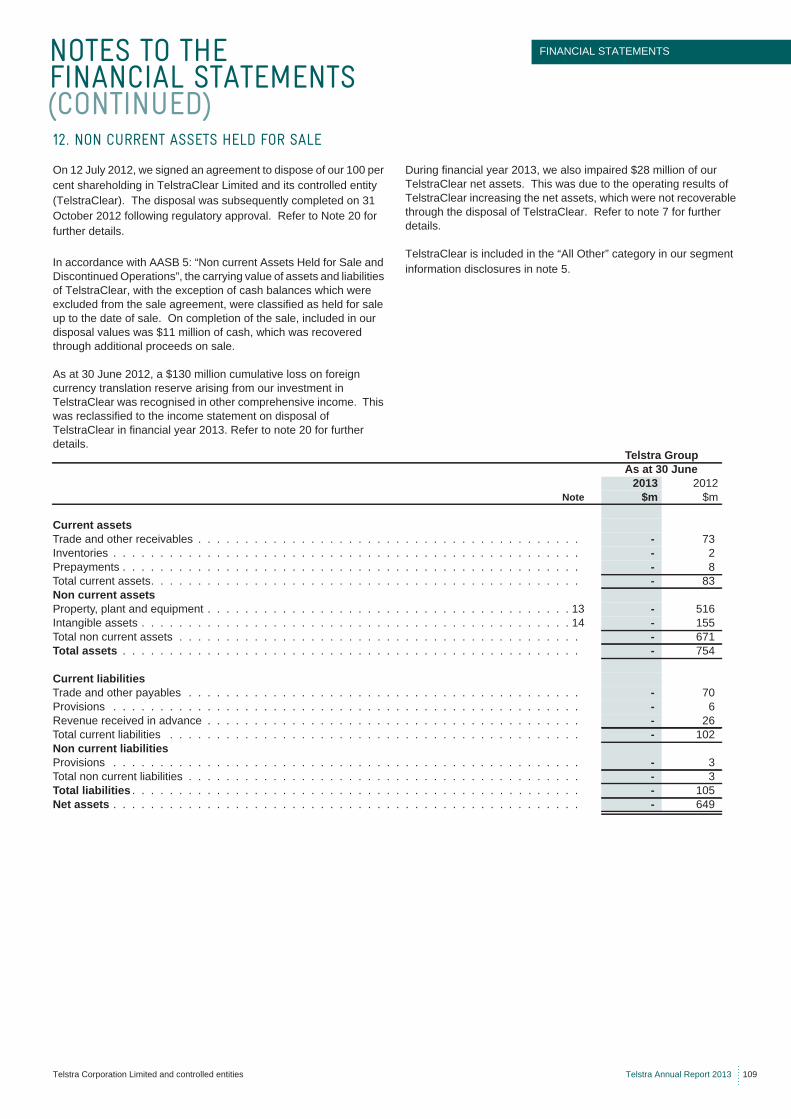
NOTES TO THE FINANCIAL STATEMENTS (CONTINUED)
FINANCIAL STATEMENTS
Telstra Corporation Limited and controlled entities Telstra Annual Report 2013 109
On 12 July 2012, we signed an agreement to dispose of our 100 per cent shareholding in TelstraClear Limited and its controlled entity (TelstraClear). The disposal was subsequently completed on 31 October 2012 following regulatory approval. Refer to Note 20 for further details.
In accordance with AASB 5: “Non current Assets Held for Sale and Discontinued Operations”, the carrying value of assets and liabilities of TelstraClear, with the exception of cash balances which were excluded from the sale agreement, were classified as held for sale up to the date of sale. On completion of the sale, included in our disposal values was $11 million of cash, which was recovered through additional proceeds on sale.
As at 30 June 2012, a $130 million cumulative loss on foreign currency translation reserve arising from our investment in TelstraClear was recognised in other comprehensive income. This was reclassified to the income statement on disposal of TelstraClear in financial year 2013. Refer to note 20 for further details.
During financial year 2013, we also impaired $28 million of our TelstraClear net assets. This was due to the operating results of TelstraClear increasing the net assets, which were not recoverable through the disposal of TelstraClear. Refer to note 7 for further details.
TelstraClear is included in the “All Other” category in our segment information disclosures in note 5.
12. NON CURRENT ASSETS HELD FOR SALE
Telstra GroupAs at 30 June
2013 2012Note $m $m
Current assetsTrade and other receivables . . . . . . . . . . . . . . . . . . . . . . . . . . . . . . . . . . . . . . . . . - 73Inventories . . . . . . . . . . . . . . . . . . . . . . . . . . . . . . . . . . . . . . . . . . . . . . . . . . - 2Prepayments . . . . . . . . . . . . . . . . . . . . . . . . . . . . . . . . . . . . . . . . . . . . . . . . . - 8Total current assets. . . . . . . . . . . . . . . . . . . . . . . . . . . . . . . . . . . . . . . . . . . . . . - 83Non current assetsProperty, plant and equipment . . . . . . . . . . . . . . . . . . . . . . . . . . . . . . . . . . . . . . . 13 - 516Intangible assets . . . . . . . . . . . . . . . . . . . . . . . . . . . . . . . . . . . . . . . . . . . . . . 14 - 155Total non current assets . . . . . . . . . . . . . . . . . . . . . . . . . . . . . . . . . . . . . . . . . . . - 671Total assets . . . . . . . . . . . . . . . . . . . . . . . . . . . . . . . . . . . . . . . . . . . . . . . . . - 754
Current liabilitiesTrade and other payables . . . . . . . . . . . . . . . . . . . . . . . . . . . . . . . . . . . . . . . . . . - 70Provisions . . . . . . . . . . . . . . . . . . . . . . . . . . . . . . . . . . . . . . . . . . . . . . . . . . - 6Revenue received in advance . . . . . . . . . . . . . . . . . . . . . . . . . . . . . . . . . . . . . . . . - 26Total current liabilities . . . . . . . . . . . . . . . . . . . . . . . . . . . . . . . . . . . . . . . . . . . . - 102Non current liabilitiesProvisions . . . . . . . . . . . . . . . . . . . . . . . . . . . . . . . . . . . . . . . . . . . . . . . . . . - 3Total non current liabilities . . . . . . . . . . . . . . . . . . . . . . . . . . . . . . . . . . . . . . . . . . - 3Total liabilities . . . . . . . . . . . . . . . . . . . . . . . . . . . . . . . . . . . . . . . . . . . . . . . . - 105Net assets . . . . . . . . . . . . . . . . . . . . . . . . . . . . . . . . . . . . . . . . . . . . . . . . . . - 649
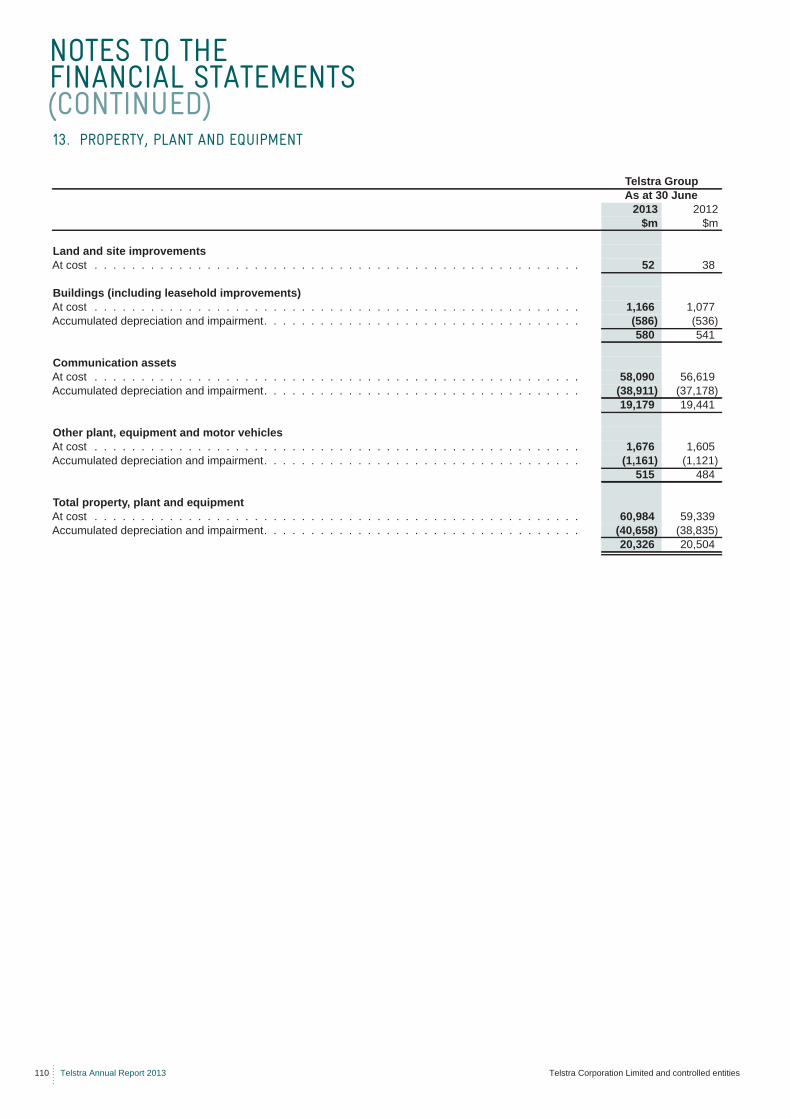
NOTES TO THE FINANCIAL STATEMENTS (CONTINUED)
110 Telstra Annual Report 2013 Telstra Corporation Limited and controlled entities
13. PROPERTY, PLANT AND EQUIPMENT
Telstra GroupAs at 30 June
2013 2012$m $m
Land and site improvementsAt cost . . . . . . . . . . . . . . . . . . . . . . . . . . . . . . . . . . . . . . . . . . . . . . . . . . . . 52 38
Buildings (including leasehold improvements)At cost . . . . . . . . . . . . . . . . . . . . . . . . . . . . . . . . . . . . . . . . . . . . . . . . . . . . 1,166 1,077Accumulated depreciation and impairment. . . . . . . . . . . . . . . . . . . . . . . . . . . . . . . . . . (586) (536)
580 541
Communication assetsAt cost . . . . . . . . . . . . . . . . . . . . . . . . . . . . . . . . . . . . . . . . . . . . . . . . . . . . 58,090 56,619Accumulated depreciation and impairment. . . . . . . . . . . . . . . . . . . . . . . . . . . . . . . . . . (38,911) (37,178)
19,179 19,441
Other plant, equipment and motor vehiclesAt cost . . . . . . . . . . . . . . . . . . . . . . . . . . . . . . . . . . . . . . . . . . . . . . . . . . . . 1,676 1,605Accumulated depreciation and impairment. . . . . . . . . . . . . . . . . . . . . . . . . . . . . . . . . . (1,161) (1,121)
515 484
Total property, plant and equipmentAt cost . . . . . . . . . . . . . . . . . . . . . . . . . . . . . . . . . . . . . . . . . . . . . . . . . . . . 60,984 59,339Accumulated depreciation and impairment. . . . . . . . . . . . . . . . . . . . . . . . . . . . . . . . . . (40,658) (38,835)
20,326 20,504
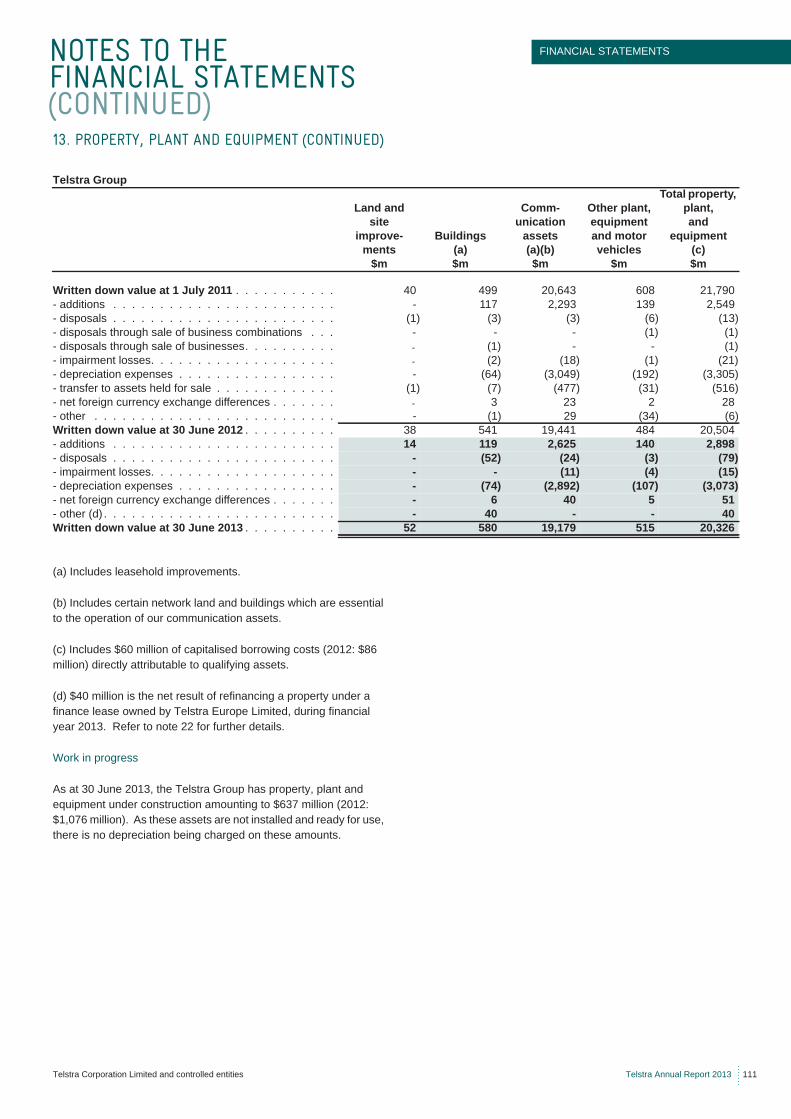
NOTES TO THE FINANCIAL STATEMENTS (CONTINUED)
FINANCIAL STATEMENTS
Telstra Corporation Limited and controlled entities Telstra Annual Report 2013 111
(a) Includes leasehold improvements.
(b) Includes certain network land and buildings which are essential to the operation of our communication assets.
(c) Includes $60 million of capitalised borrowing costs (2012: $86 million) directly attributable to qualifying assets.
(d) $40 million is the net result of refinancing a property under a finance lease owned by Telstra Europe Limited, during financial year 2013. Refer to note 22 for further details.
Work in progress
As at 30 June 2013, the Telstra Group has property, plant and equipment under construction amounting to $637 million (2012: $1,076 million). As these assets are not installed and ready for use, there is no depreciation being charged on these amounts.
13. PROPERTY, PLANT AND EQUIPMENT (CONTINUED)
Telstra GroupTotal property,
Land and Comm- Other plant, plant,site unication equipment and
improve- Buildings assets and motor equipmentments (a) (a)(b) vehicles (c)
$m $m $m $m $m
Written down value at 1 July 2011 . . . . . . . . . . . 40 499 20,643 608 21,790- additions . . . . . . . . . . . . . . . . . . . . . . . . - 117 2,293 139 2,549- disposals . . . . . . . . . . . . . . . . . . . . . . . . (1) (3) (3) (6) (13)- disposals through sale of business combinations . . . - - - (1) (1)- disposals through sale of businesses. . . . . . . . . . - (1) - - (1)- impairment losses. . . . . . . . . . . . . . . . . . . . - (2) (18) (1) (21)- depreciation expenses . . . . . . . . . . . . . . . . . - (64) (3,049) (192) (3,305)- transfer to assets held for sale . . . . . . . . . . . . . (1) (7) (477) (31) (516)- net foreign currency exchange differences . . . . . . . - 3 23 2 28- other . . . . . . . . . . . . . . . . . . . . . . . . . . - (1) 29 (34) (6)Written down value at 30 June 2012 . . . . . . . . . . 38 541 19,441 484 20,504- additions . . . . . . . . . . . . . . . . . . . . . . . . 14 119 2,625 140 2,898- disposals . . . . . . . . . . . . . . . . . . . . . . . . - (52) (24) (3) (79)- impairment losses. . . . . . . . . . . . . . . . . . . . - - (11) (4) (15)- depreciation expenses . . . . . . . . . . . . . . . . . - (74) (2,892) (107) (3,073)- net foreign currency exchange differences . . . . . . . - 6 40 5 51- other (d) . . . . . . . . . . . . . . . . . . . . . . . . . - 40 - - 40Written down value at 30 June 2013 . . . . . . . . . . 52 580 19,179 515 20,326
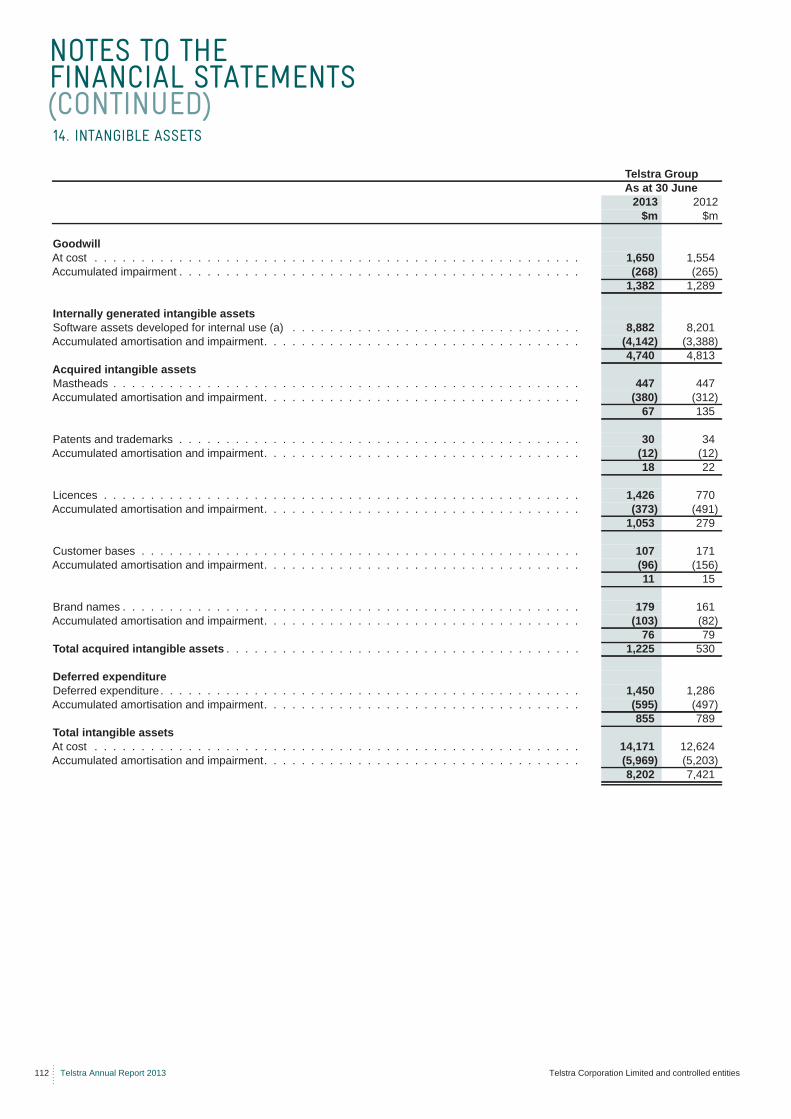
NOTES TO THE FINANCIAL STATEMENTS (CONTINUED)
112 Telstra Annual Report 2013 Telstra Corporation Limited and controlled entities
14. INTANGIBLE ASSETS
Telstra GroupAs at 30 June
2013 2012$m $m
GoodwillAt cost . . . . . . . . . . . . . . . . . . . . . . . . . . . . . . . . . . . . . . . . . . . . . . . . . . . . 1,650 1,554Accumulated impairment . . . . . . . . . . . . . . . . . . . . . . . . . . . . . . . . . . . . . . . . . . . (268) (265)
1,382 1,289
Internally generated intangible assetsSoftware assets developed for internal use (a) . . . . . . . . . . . . . . . . . . . . . . . . . . . . . . . 8,882 8,201Accumulated amortisation and impairment. . . . . . . . . . . . . . . . . . . . . . . . . . . . . . . . . . (4,142) (3,388)
4,740 4,813Acquired intangible assetsMastheads . . . . . . . . . . . . . . . . . . . . . . . . . . . . . . . . . . . . . . . . . . . . . . . . . . 447 447Accumulated amortisation and impairment. . . . . . . . . . . . . . . . . . . . . . . . . . . . . . . . . . (380) (312)
67 135
Patents and trademarks . . . . . . . . . . . . . . . . . . . . . . . . . . . . . . . . . . . . . . . . . . . 30 34Accumulated amortisation and impairment. . . . . . . . . . . . . . . . . . . . . . . . . . . . . . . . . . (12) (12)
18 22
Licences . . . . . . . . . . . . . . . . . . . . . . . . . . . . . . . . . . . . . . . . . . . . . . . . . . . 1,426 770Accumulated amortisation and impairment. . . . . . . . . . . . . . . . . . . . . . . . . . . . . . . . . . (373) (491)
1,053 279
Customer bases . . . . . . . . . . . . . . . . . . . . . . . . . . . . . . . . . . . . . . . . . . . . . . . 107 171Accumulated amortisation and impairment. . . . . . . . . . . . . . . . . . . . . . . . . . . . . . . . . . (96) (156)
11 15
Brand names . . . . . . . . . . . . . . . . . . . . . . . . . . . . . . . . . . . . . . . . . . . . . . . . . 179 161Accumulated amortisation and impairment. . . . . . . . . . . . . . . . . . . . . . . . . . . . . . . . . . (103) (82)
76 79Total acquired intangible assets . . . . . . . . . . . . . . . . . . . . . . . . . . . . . . . . . . . . . . 1,225 530
Deferred expenditureDeferred expenditure . . . . . . . . . . . . . . . . . . . . . . . . . . . . . . . . . . . . . . . . . . . . . 1,450 1,286Accumulated amortisation and impairment. . . . . . . . . . . . . . . . . . . . . . . . . . . . . . . . . . (595) (497)
855 789Total intangible assetsAt cost . . . . . . . . . . . . . . . . . . . . . . . . . . . . . . . . . . . . . . . . . . . . . . . . . . . . 14,171 12,624Accumulated amortisation and impairment. . . . . . . . . . . . . . . . . . . . . . . . . . . . . . . . . . (5,969) (5,203)
8,202 7,421
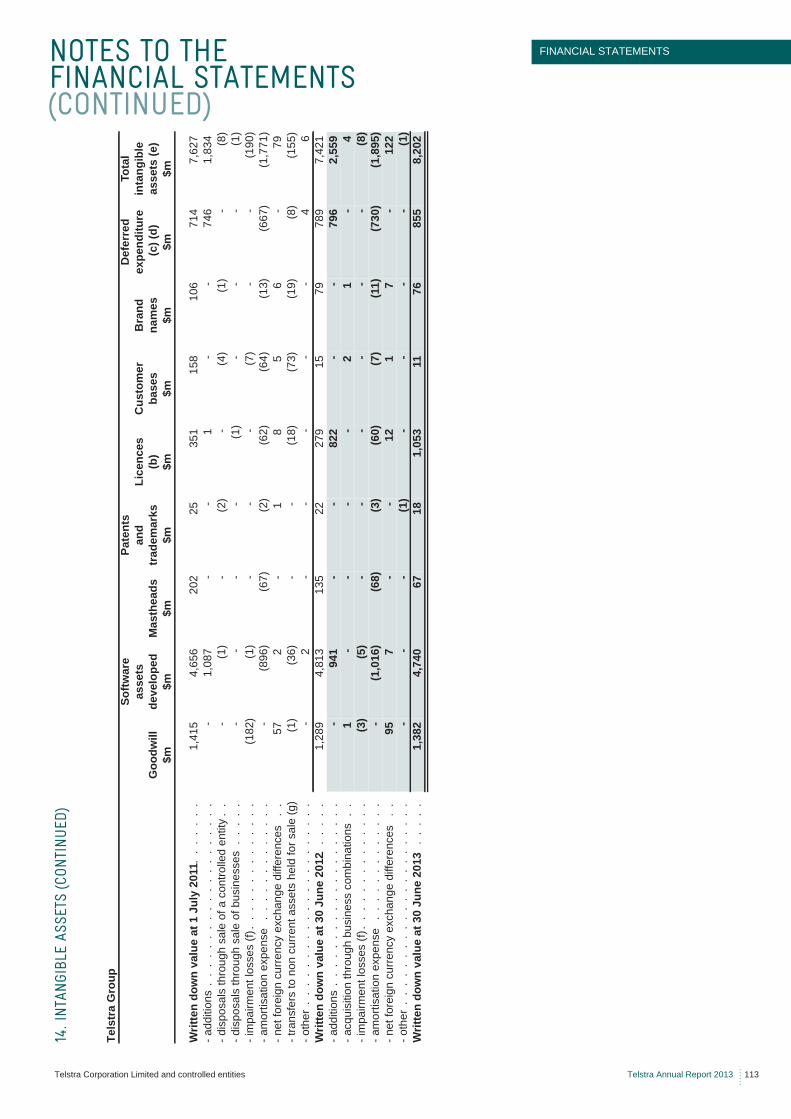
NOTES TO THE FINANCIAL STATEMENTS (CONTINUED)
FINANCIAL STATEMENTS
Telstra Corporation Limited and controlled entities Telstra Annual Report 2013 113
14. I
NTAN
GIBL
E AS
SETS
(CON
TINU
ED)
Tels
tra
Gro
upSo
ftwar
ePa
tent
sD
efer
red
Tota
las
sets
and
Lice
nces
Cus
tom
erB
rand
expe
nditu
rein
tang
ible
Goo
dwill
deve
lope
dM
asth
eads
trad
emar
ks(b
)ba
ses
nam
es (c
) (d)
asse
ts (e
) $m
$m$m
$m$m
$m$m
$m$m
Writ
ten
dow
n va
lue
at 1
Jul
y 20
11 . .
. .
. .
. .
1,41
54,
656
202
2535
115
810
671
47,
627
- add
ition
s .
. .
. .
. .
. .
. .
. .
. .
. .
. .
.-
1,08
7-
-1
--
746
1,83
4- d
ispo
sals
thro
ugh
sale
of a
con
trolle
d en
tity
. .
-(1
)-
(2)
-(4
)(1
)-
(8)
- dis
posa
ls th
roug
h sa
le o
f bus
ines
ses
. .
. .
.-
--
-(1
)-
--
(1)
- im
pairm
ent l
osse
s (f)
. .
. .
. .
. .
. .
. .
. .
(182
)(1
)-
--
(7)
--
(190
)- a
mor
tisat
ion
expe
nse
. .
. .
. .
. .
. .
. .
.-
(896
)(6
7)(2
)(6
2)(6
4)(1
3)(6
67)
(1,7
71)
- net
fore
ign
curr
ency
exc
hang
e di
ffere
nces
. .
572
-1
85
6-
79- t
rans
fers
to n
on c
urre
nt a
sset
s he
ld fo
r sal
e (g
)(1
)(3
6)-
-(1
8)(7
3)(1
9)(8
)(1
55)
- oth
er .
. .
. .
. .
. .
. .
. .
. .
. .
. .
. .
.-
2-
--
--
46
Writ
ten
dow
n va
lue
at 3
0 Ju
ne 2
012
. .
. .
. .
.1,
289
4,81
313
522
279
1579
789
7,42
1- a
dditi
ons
. .
. .
. .
. .
. .
. .
. .
. .
. .
. .
-94
1-
-82
2-
-79
62,
559
- acq
uisi
tion
thro
ugh
busi
ness
com
bina
tions
. .
1-
--
-2
1-
4- i
mpa
irmen
t los
ses
(f).
. .
. .
. .
. .
. .
. .
.(3
)(5
)-
--
--
-(8
)- a
mor
tisat
ion
expe
nse
. .
. .
. .
. .
. .
. .
.-
(1,0
16)
(68)
(3)
(60)
(7)
(11)
(730
)(1
,895
)- n
et fo
reig
n cu
rren
cy e
xcha
nge
diffe
renc
es .
.95
7-
-12
17
-12
2- o
ther
. .
. .
. .
. .
. .
. .
. .
. .
. .
. .
. .
--
-(1
)-
--
-(1
)W
ritte
n do
wn
valu
e at
30
June
201
3 .
. .
. .
1,38
24,
740
6718
1,05
311
7685
58,
202
NOTES TO THE FINANCIAL STATEMENTS (CONTINUED)
114 Telstra Annual Report 2013 Telstra Corporation Limited and controlled entities
(a) As at June 2013, we had software assets under development amounting to $345 million (2012: $509 million). As these assets were not installed and ready for use, there is no amortisation being charged on the amounts.
(b) During financial year 2013, we renewed our existing 800Mhz and 1800Mhz spectrum licences for $779 million.
(c) During financial year 2005, we entered into an arrangement with our jointly controlled entity, Reach Ltd (Reach), and our co-shareholder PCCW, whereby Reach's international cable capacity was allocated between us and PCCW under an indefeasible right of use (IRU) agreement, including committed capital expenditure for the period until 2018.
The IRU is amortised over the contract periods for the capacity on the various international cable systems, which range from 5 to 22 years. The IRU is deemed to be an extension of our investment in Reach. The IRU has a carrying value of nil in the consolidated financial statements due to the recognition of equity accounted losses in Reach.
(d) The majority of the deferred expenditure relates to the deferral of direct incremental costs of establishing a customer contract, which are amortised to goods and services purchased and sold in the income statement. In addition, the deferred expenditure includes basic access installation and connection fees for in place and new services.
(e) Includes $36 million (2012: $42 million) of capitalised borrowing costs directly attributable to qualifying assets.
(f) We have recognised an impairment charge of $3 million against goodwill for the CitySearch CGU which is included in “Other” in note 21. In financial year 2012, we recognised $189 million against goodwill and customer bases of $182 million and $7 million, respectively for the TelstraClear, LMobile Group and CitySearch CGUs.
(g) As at 30 June 2012, assets and liabilities of TelstraClear Limited were classified as held for sale. Refer to note 12 for further details.
14. INTANGIBLE ASSETS (CONTINUED)
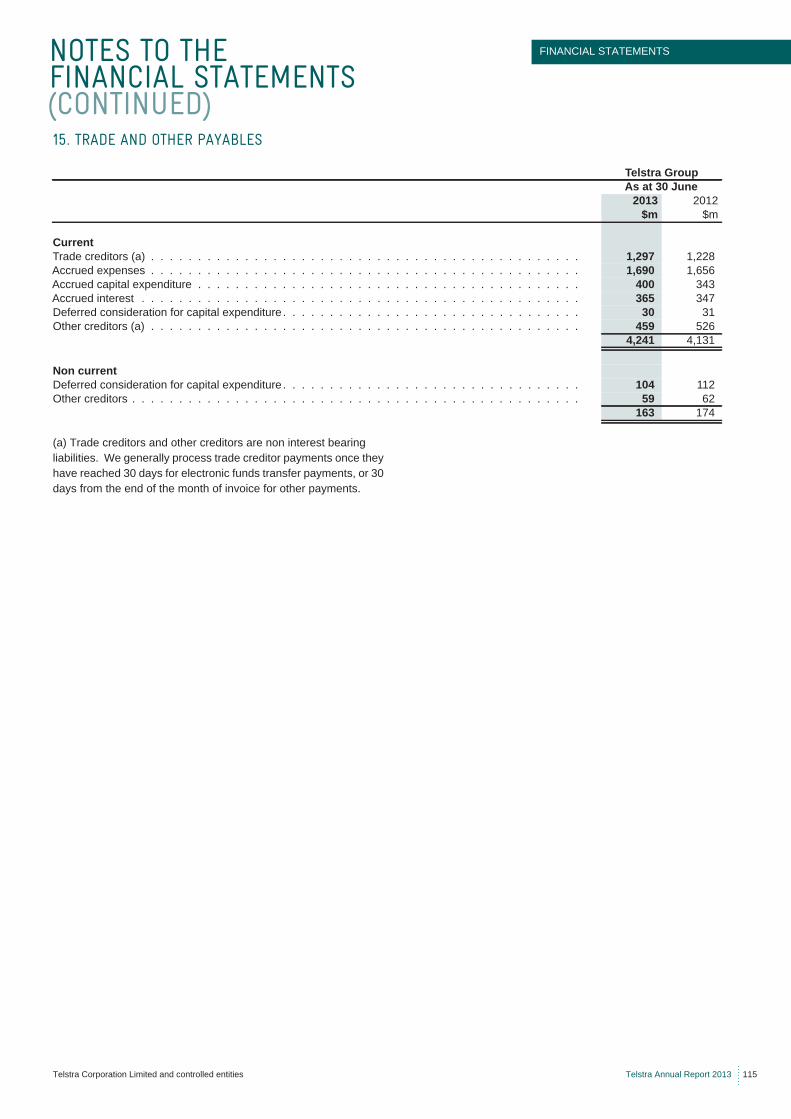
NOTES TO THE FINANCIAL STATEMENTS (CONTINUED)
FINANCIAL STATEMENTS
Telstra Corporation Limited and controlled entities Telstra Annual Report 2013 115
(a) Trade creditors and other creditors are non interest bearing liabilities. We generally process trade creditor payments once they have reached 30 days for electronic funds transfer payments, or 30 days from the end of the month of invoice for other payments.
15. TRADE AND OTHER PAYABLES
Telstra GroupAs at 30 June
2013 2012$m $m
CurrentTrade creditors (a) . . . . . . . . . . . . . . . . . . . . . . . . . . . . . . . . . . . . . . . . . . . . . . 1,297 1,228Accrued expenses . . . . . . . . . . . . . . . . . . . . . . . . . . . . . . . . . . . . . . . . . . . . . . 1,690 1,656Accrued capital expenditure . . . . . . . . . . . . . . . . . . . . . . . . . . . . . . . . . . . . . . . . . 400 343Accrued interest . . . . . . . . . . . . . . . . . . . . . . . . . . . . . . . . . . . . . . . . . . . . . . . 365 347Deferred consideration for capital expenditure . . . . . . . . . . . . . . . . . . . . . . . . . . . . . . . . 30 31Other creditors (a) . . . . . . . . . . . . . . . . . . . . . . . . . . . . . . . . . . . . . . . . . . . . . . 459 526
4,241 4,131
Non currentDeferred consideration for capital expenditure . . . . . . . . . . . . . . . . . . . . . . . . . . . . . . . . 104 112Other creditors . . . . . . . . . . . . . . . . . . . . . . . . . . . . . . . . . . . . . . . . . . . . . . . . 59 62
163 174
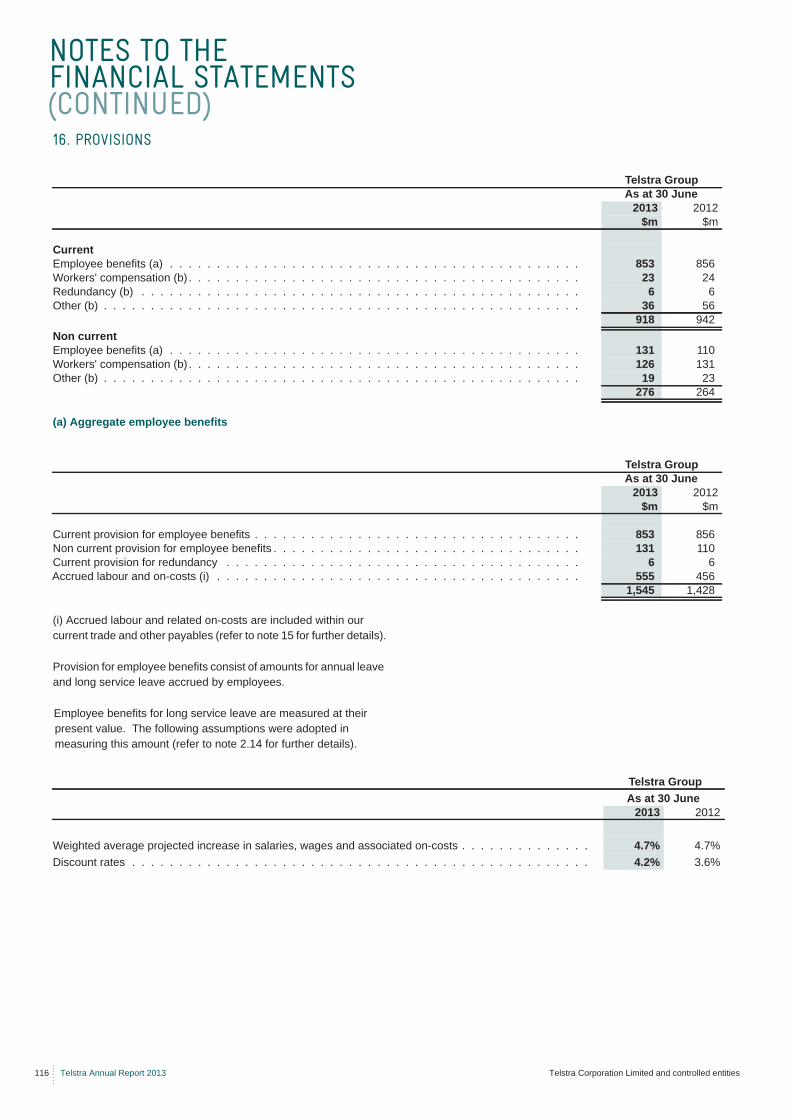
NOTES TO THE FINANCIAL STATEMENTS (CONTINUED)
116 Telstra Annual Report 2013 Telstra Corporation Limited and controlled entities
(a) Aggregate employee benefits
(i) Accrued labour and related on-costs are included within our current trade and other payables (refer to note 15 for further details).
Provision for employee benefits consist of amounts for annual leave and long service leave accrued by employees.
Employee benefits for long service leave are measured at their present value. The following assumptions were adopted in measuring this amount (refer to note 2.14 for further details).
16. PROVISIONS
Telstra GroupAs at 30 June
2013 2012$m $m
CurrentEmployee benefits (a) . . . . . . . . . . . . . . . . . . . . . . . . . . . . . . . . . . . . . . . . . . . . 853 856Workers' compensation (b) . . . . . . . . . . . . . . . . . . . . . . . . . . . . . . . . . . . . . . . . . . 23 24Redundancy (b) . . . . . . . . . . . . . . . . . . . . . . . . . . . . . . . . . . . . . . . . . . . . . . . 6 6Other (b) . . . . . . . . . . . . . . . . . . . . . . . . . . . . . . . . . . . . . . . . . . . . . . . . . . . 36 56
918 942Non currentEmployee benefits (a) . . . . . . . . . . . . . . . . . . . . . . . . . . . . . . . . . . . . . . . . . . . . 131 110Workers' compensation (b) . . . . . . . . . . . . . . . . . . . . . . . . . . . . . . . . . . . . . . . . . . 126 131Other (b) . . . . . . . . . . . . . . . . . . . . . . . . . . . . . . . . . . . . . . . . . . . . . . . . . . . 19 23
276 264
Telstra GroupAs at 30 June
2013 2012$m $m
Current provision for employee benefits . . . . . . . . . . . . . . . . . . . . . . . . . . . . . . . . . . . 853 856Non current provision for employee benefits . . . . . . . . . . . . . . . . . . . . . . . . . . . . . . . . . 131 110Current provision for redundancy . . . . . . . . . . . . . . . . . . . . . . . . . . . . . . . . . . . . . . 6 6Accrued labour and on-costs (i) . . . . . . . . . . . . . . . . . . . . . . . . . . . . . . . . . . . . . . . 555 456
1,545 1,428
Telstra GroupAs at 30 June
2013 2012
Weighted average projected increase in salaries, wages and associated on-costs . . . . . . . . . . . . . . 4.7% 4.7%Discount rates . . . . . . . . . . . . . . . . . . . . . . . . . . . . . . . . . . . . . . . . . . . . . . . . . 4.2% 3.6%
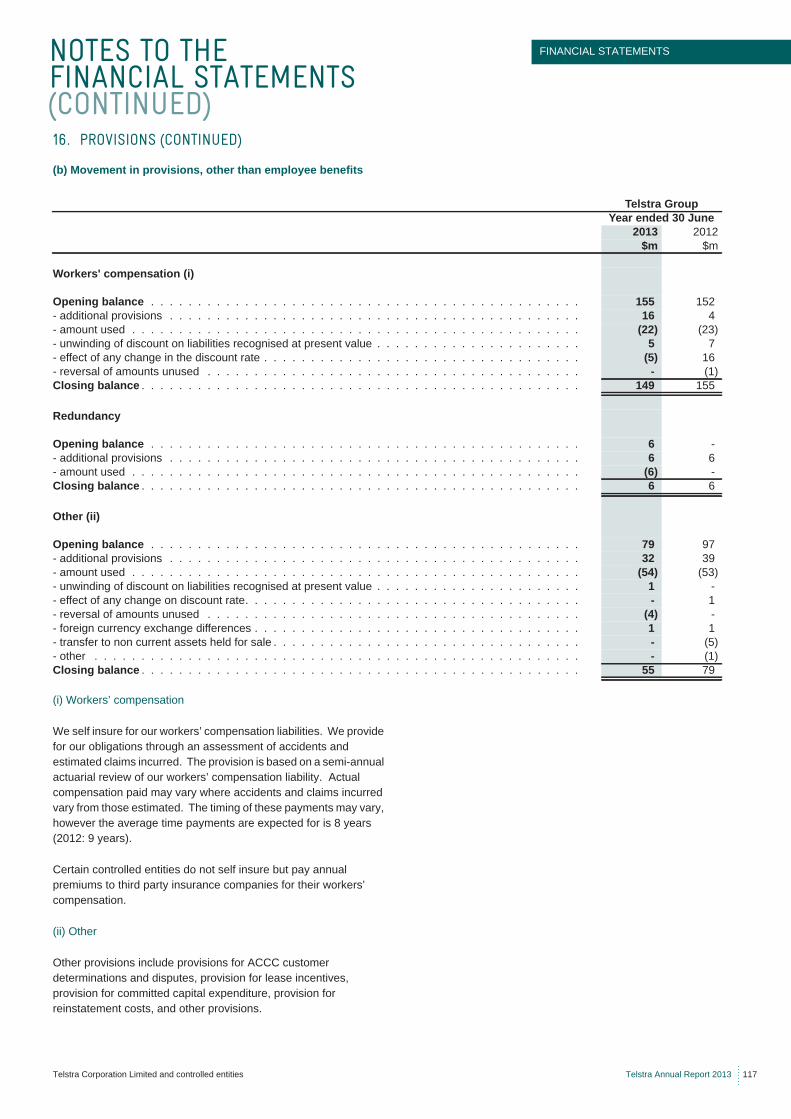
NOTES TO THE FINANCIAL STATEMENTS (CONTINUED)
FINANCIAL STATEMENTS
Telstra Corporation Limited and controlled entities Telstra Annual Report 2013 117
(b) Movement in provisions, other than employee benefits
(i) Workers’ compensation
We self insure for our workers’ compensation liabilities. We provide for our obligations through an assessment of accidents and estimated claims incurred. The provision is based on a semi-annual actuarial review of our workers’ compensation liability. Actual compensation paid may vary where accidents and claims incurred vary from those estimated. The timing of these payments may vary, however the average time payments are expected for is 8 years (2012: 9 years).
Certain controlled entities do not self insure but pay annual premiums to third party insurance companies for their workers’ compensation.
(ii) Other
Other provisions include provisions for ACCC customer determinations and disputes, provision for lease incentives, provision for committed capital expenditure, provision for reinstatement costs, and other provisions.
16. PROVISIONS (CONTINUED)
Telstra GroupYear ended 30 June
2013 2012$m $m
Workers' compensation (i)
Opening balance . . . . . . . . . . . . . . . . . . . . . . . . . . . . . . . . . . . . . . . . . . . . . . 155 152- additional provisions . . . . . . . . . . . . . . . . . . . . . . . . . . . . . . . . . . . . . . . . . . . . 16 4- amount used . . . . . . . . . . . . . . . . . . . . . . . . . . . . . . . . . . . . . . . . . . . . . . . . (22) (23)- unwinding of discount on liabilities recognised at present value . . . . . . . . . . . . . . . . . . . . . . 5 7- effect of any change in the discount rate . . . . . . . . . . . . . . . . . . . . . . . . . . . . . . . . . . (5) 16- reversal of amounts unused . . . . . . . . . . . . . . . . . . . . . . . . . . . . . . . . . . . . . . . . - (1)Closing balance . . . . . . . . . . . . . . . . . . . . . . . . . . . . . . . . . . . . . . . . . . . . . . . 149 155
Redundancy
Opening balance . . . . . . . . . . . . . . . . . . . . . . . . . . . . . . . . . . . . . . . . . . . . . . 6 -- additional provisions . . . . . . . . . . . . . . . . . . . . . . . . . . . . . . . . . . . . . . . . . . . . 6 6- amount used . . . . . . . . . . . . . . . . . . . . . . . . . . . . . . . . . . . . . . . . . . . . . . . . (6) -Closing balance . . . . . . . . . . . . . . . . . . . . . . . . . . . . . . . . . . . . . . . . . . . . . . . 6 6
Other (ii)
Opening balance . . . . . . . . . . . . . . . . . . . . . . . . . . . . . . . . . . . . . . . . . . . . . . 79 97- additional provisions . . . . . . . . . . . . . . . . . . . . . . . . . . . . . . . . . . . . . . . . . . . . 32 39- amount used . . . . . . . . . . . . . . . . . . . . . . . . . . . . . . . . . . . . . . . . . . . . . . . . (54) (53)- unwinding of discount on liabilities recognised at present value . . . . . . . . . . . . . . . . . . . . . . 1 -- effect of any change on discount rate. . . . . . . . . . . . . . . . . . . . . . . . . . . . . . . . . . . . - 1- reversal of amounts unused . . . . . . . . . . . . . . . . . . . . . . . . . . . . . . . . . . . . . . . . (4) -- foreign currency exchange differences . . . . . . . . . . . . . . . . . . . . . . . . . . . . . . . . . . . 1 1- transfer to non current assets held for sale . . . . . . . . . . . . . . . . . . . . . . . . . . . . . . . . . - (5)- other . . . . . . . . . . . . . . . . . . . . . . . . . . . . . . . . . . . . . . . . . . . . . . . . . . . . - (1)Closing balance . . . . . . . . . . . . . . . . . . . . . . . . . . . . . . . . . . . . . . . . . . . . . . . 55 79
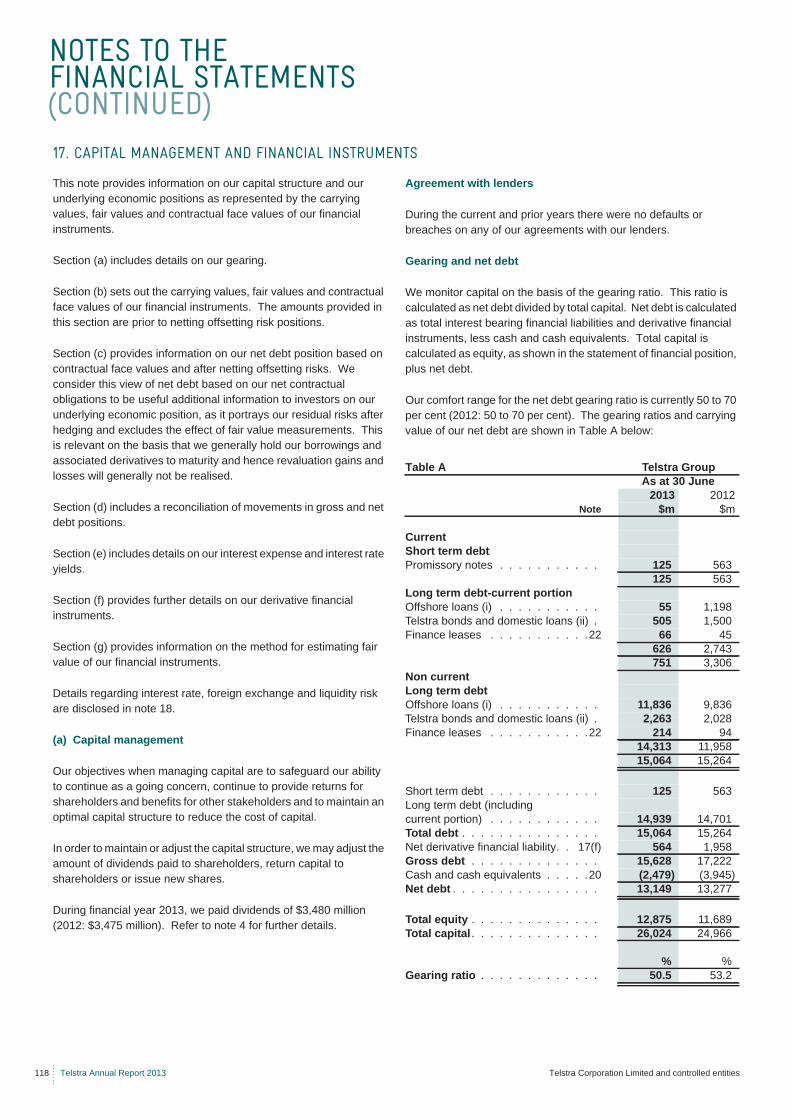
NOTES TO THE FINANCIAL STATEMENTS (CONTINUED)
118 Telstra Annual Report 2013 Telstra Corporation Limited and controlled entities
This note provides information on our capital structure and our underlying economic positions as represented by the carrying values, fair values and contractual face values of our financial instruments.
Section (a) includes details on our gearing.
Section (b) sets out the carrying values, fair values and contractual face values of our financial instruments. The amounts provided in this section are prior to netting offsetting risk positions.
Section (c) provides information on our net debt position based on contractual face values and after netting offsetting risks. We consider this view of net debt based on our net contractual obligations to be useful additional information to investors on our underlying economic position, as it portrays our residual risks after hedging and excludes the effect of fair value measurements. This is relevant on the basis that we generally hold our borrowings and associated derivatives to maturity and hence revaluation gains and losses will generally not be realised.
Section (d) includes a reconciliation of movements in gross and net debt positions.
Section (e) includes details on our interest expense and interest rate yields.
Section (f) provides further details on our derivative financial instruments.
Section (g) provides information on the method for estimating fair value of our financial instruments.
Details regarding interest rate, foreign exchange and liquidity risk are disclosed in note 18.
(a) Capital management
Our objectives when managing capital are to safeguard our ability to continue as a going concern, continue to provide returns for shareholders and benefits for other stakeholders and to maintain an optimal capital structure to reduce the cost of capital.
In order to maintain or adjust the capital structure, we may adjust the amount of dividends paid to shareholders, return capital to shareholders or issue new shares.
During financial year 2013, we paid dividends of $3,480 million (2012: $3,475 million). Refer to note 4 for further details.
Agreement with lenders
During the current and prior years there were no defaults or breaches on any of our agreements with our lenders.
Gearing and net debt
We monitor capital on the basis of the gearing ratio. This ratio is calculated as net debt divided by total capital. Net debt is calculated as total interest bearing financial liabilities and derivative financial instruments, less cash and cash equivalents. Total capital is calculated as equity, as shown in the statement of financial position, plus net debt.
Our comfort range for the net debt gearing ratio is currently 50 to 70 per cent (2012: 50 to 70 per cent). The gearing ratios and carrying value of our net debt are shown in Table A below:
17. CAPITAL MANAGEMENT AND FINANCIAL INSTRUMENTS
Table A Telstra GroupAs at 30 June
2013 2012Note $m $m
CurrentShort term debtPromissory notes . . . . . . . . . . . 125 563
125 563Long term debt-current portionOffshore loans (i) . . . . . . . . . . . 55 1,198Telstra bonds and domestic loans (ii) . 505 1,500Finance leases . . . . . . . . . . .22 66 45
626 2,743751 3,306
Non currentLong term debtOffshore loans (i) . . . . . . . . . . . 11,836 9,836Telstra bonds and domestic loans (ii) . 2,263 2,028Finance leases . . . . . . . . . . .22 214 94
14,313 11,95815,064 15,264
Short term debt . . . . . . . . . . . . 125 563Long term debt (includingcurrent portion) . . . . . . . . . . . . 14,939 14,701Total debt . . . . . . . . . . . . . . . 15,064 15,264Net derivative financial liability. . 17(f) 564 1,958Gross debt . . . . . . . . . . . . . . 15,628 17,222Cash and cash equivalents . . . . .20 (2,479) (3,945)Net debt . . . . . . . . . . . . . . . . 13,149 13,277
Total equity . . . . . . . . . . . . . . 12,875 11,689Total capital . . . . . . . . . . . . . . 26,024 24,966
% %Gearing ratio . . . . . . . . . . . . . 50.5 53.2
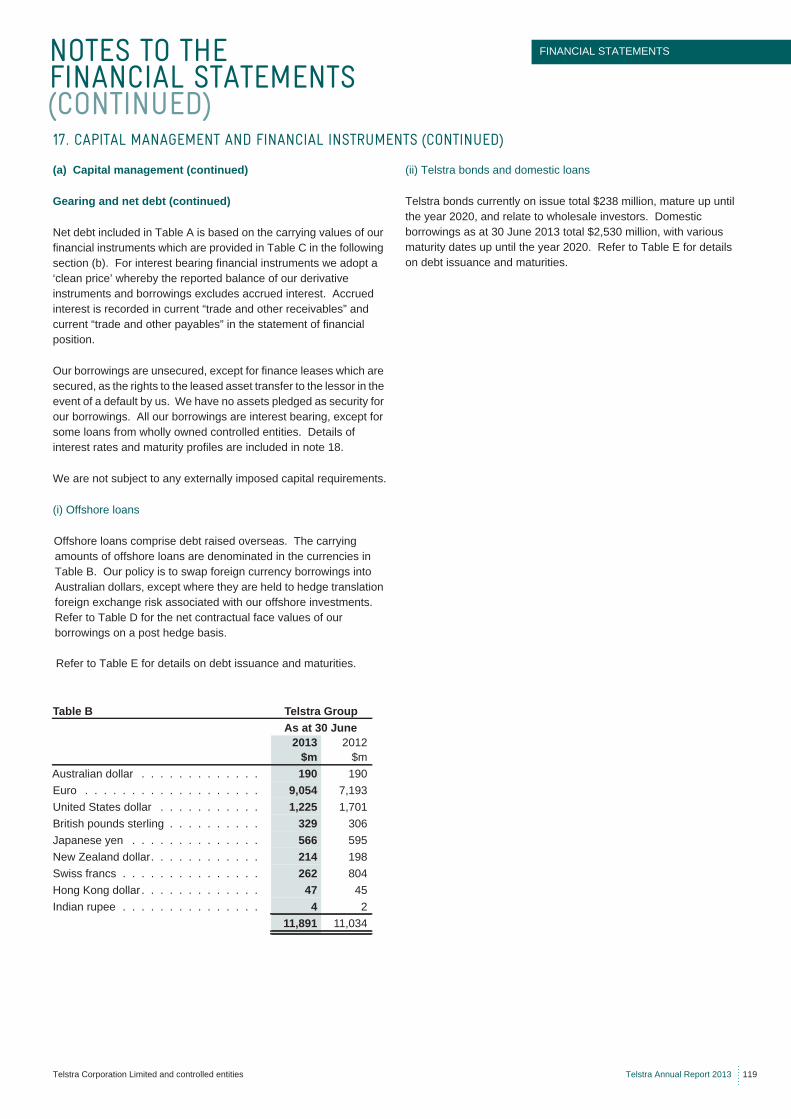
NOTES TO THE FINANCIAL STATEMENTS (CONTINUED)
FINANCIAL STATEMENTS
Telstra Corporation Limited and controlled entities Telstra Annual Report 2013 119
(a) Capital management (continued)
Gearing and net debt (continued)
Net debt included in Table A is based on the carrying values of our financial instruments which are provided in Table C in the following section (b). For interest bearing financial instruments we adopt a ‘clean price’ whereby the reported balance of our derivative instruments and borrowings excludes accrued interest. Accrued interest is recorded in current “trade and other receivables” and current “trade and other payables” in the statement of financial position.
Our borrowings are unsecured, except for finance leases which are secured, as the rights to the leased asset transfer to the lessor in the event of a default by us. We have no assets pledged as security for our borrowings. All our borrowings are interest bearing, except for some loans from wholly owned controlled entities. Details of interest rates and maturity profiles are included in note 18.
We are not subject to any externally imposed capital requirements.
(i) Offshore loans
Offshore loans comprise debt raised overseas. The carrying amounts of offshore loans are denominated in the currencies in Table B. Our policy is to swap foreign currency borrowings into Australian dollars, except where they are held to hedge translation foreign exchange risk associated with our offshore investments. Refer to Table D for the net contractual face values of our borrowings on a post hedge basis.
Refer to Table E for details on debt issuance and maturities.
(ii) Telstra bonds and domestic loans
Telstra bonds currently on issue total $238 million, mature up until the year 2020, and relate to wholesale investors. Domestic borrowings as at 30 June 2013 total $2,530 million, with various maturity dates up until the year 2020. Refer to Table E for details on debt issuance and maturities.
17. CAPITAL MANAGEMENT AND FINANCIAL INSTRUMENTS (CONTINUED)
Table B Telstra GroupAs at 30 June
2013 2012$m $m
Australian dollar . . . . . . . . . . . . . 190 190Euro . . . . . . . . . . . . . . . . . . . 9,054 7,193United States dollar . . . . . . . . . . . 1,225 1,701British pounds sterling . . . . . . . . . . 329 306Japanese yen . . . . . . . . . . . . . . 566 595New Zealand dollar. . . . . . . . . . . . 214 198Swiss francs . . . . . . . . . . . . . . . 262 804Hong Kong dollar . . . . . . . . . . . . . 47 45Indian rupee . . . . . . . . . . . . . . . 4 2
11,891 11,034
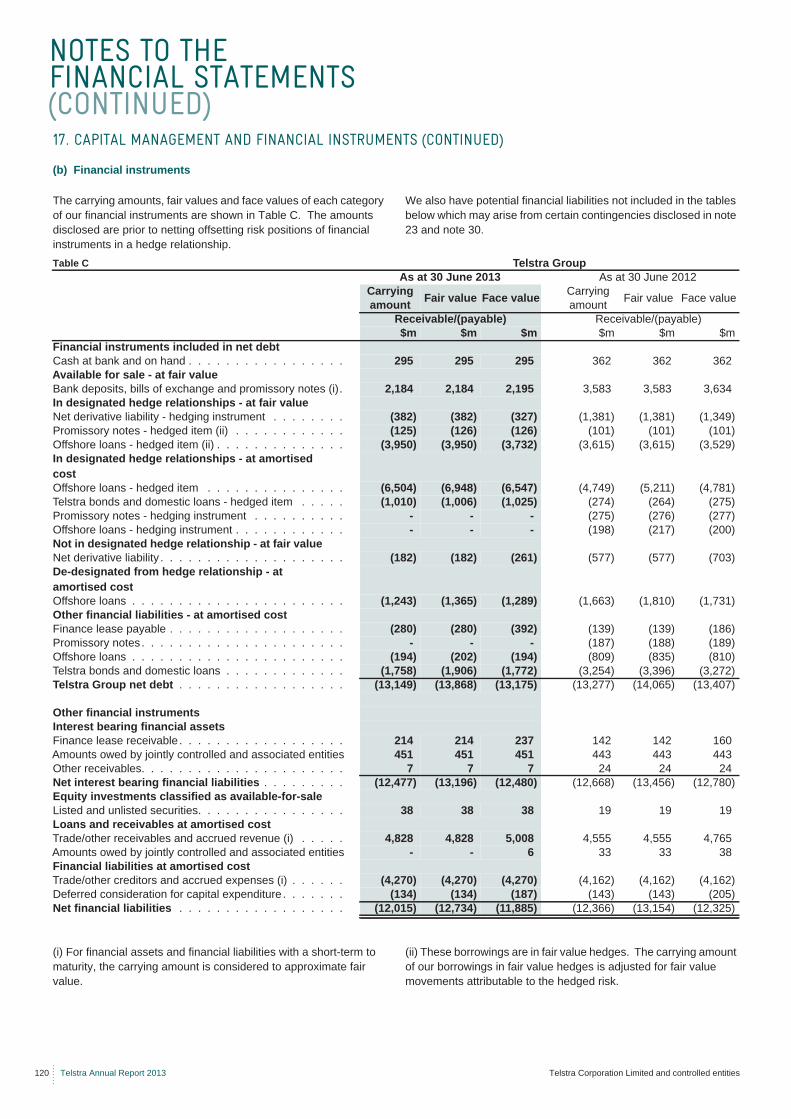
NOTES TO THE FINANCIAL STATEMENTS (CONTINUED)
120 Telstra Annual Report 2013 Telstra Corporation Limited and controlled entities
(b) Financial instruments
The carrying amounts, fair values and face values of each category of our financial instruments are shown in Table C. The amounts disclosed are prior to netting offsetting risk positions of financial instruments in a hedge relationship.
We also have potential financial liabilities not included in the tables below which may arise from certain contingencies disclosed in note 23 and note 30.
(i) For financial assets and financial liabilities with a short-term to maturity, the carrying amount is considered to approximate fair value.
(ii) These borrowings are in fair value hedges. The carrying amount of our borrowings in fair value hedges is adjusted for fair value movements attributable to the hedged risk.
17. CAPITAL MANAGEMENT AND FINANCIAL INSTRUMENTS (CONTINUED)
Table C Telstra GroupAs at 30 June 2013 As at 30 June 2012
Carrying amount Fair value Face value Carrying
amount Fair value Face value
Receivable/(payable) Receivable/(payable)$m $m $m $m $m $m
Financial instruments included in net debtCash at bank and on hand . . . . . . . . . . . . . . . . . 295 295 295 362 362 362Available for sale - at fair valueBank deposits, bills of exchange and promissory notes (i). 2,184 2,184 2,195 3,583 3,583 3,634In designated hedge relationships - at fair valueNet derivative liability - hedging instrument . . . . . . . . (382) (382) (327) (1,381) (1,381) (1,349)Promissory notes - hedged item (ii) . . . . . . . . . . . . (125) (126) (126) (101) (101) (101)Offshore loans - hedged item (ii) . . . . . . . . . . . . . . (3,950) (3,950) (3,732) (3,615) (3,615) (3,529)In designated hedge relationships - at amortised costOffshore loans - hedged item . . . . . . . . . . . . . . . (6,504) (6,948) (6,547) (4,749) (5,211) (4,781)Telstra bonds and domestic loans - hedged item . . . . . (1,010) (1,006) (1,025) (274) (264) (275)Promissory notes - hedging instrument . . . . . . . . . . - - - (275) (276) (277)Offshore loans - hedging instrument . . . . . . . . . . . . - - - (198) (217) (200)Not in designated hedge relationship - at fair valueNet derivative liability . . . . . . . . . . . . . . . . . . . . (182) (182) (261) (577) (577) (703)De-designated from hedge relationship - at amortised costOffshore loans . . . . . . . . . . . . . . . . . . . . . . . (1,243) (1,365) (1,289) (1,663) (1,810) (1,731)Other financial liabilities - at amortised costFinance lease payable . . . . . . . . . . . . . . . . . . . (280) (280) (392) (139) (139) (186)Promissory notes . . . . . . . . . . . . . . . . . . . . . . - - - (187) (188) (189)Offshore loans . . . . . . . . . . . . . . . . . . . . . . . (194) (202) (194) (809) (835) (810)Telstra bonds and domestic loans . . . . . . . . . . . . . (1,758) (1,906) (1,772) (3,254) (3,396) (3,272)Telstra Group net debt . . . . . . . . . . . . . . . . . . (13,149) (13,868) (13,175) (13,277) (14,065) (13,407)
Other financial instrumentsInterest bearing financial assetsFinance lease receivable . . . . . . . . . . . . . . . . . . 214 214 237 142 142 160Amounts owed by jointly controlled and associated entities 451 451 451 443 443 443Other receivables. . . . . . . . . . . . . . . . . . . . . . 7 7 7 24 24 24Net interest bearing financial liabilities . . . . . . . . . (12,477) (13,196) (12,480) (12,668) (13,456) (12,780)Equity investments classified as available-for-saleListed and unlisted securities. . . . . . . . . . . . . . . . 38 38 38 19 19 19Loans and receivables at amortised costTrade/other receivables and accrued revenue (i) . . . . . 4,828 4,828 5,008 4,555 4,555 4,765Amounts owed by jointly controlled and associated entities - - 6 33 33 38Financial liabilities at amortised costTrade/other creditors and accrued expenses (i) . . . . . . (4,270) (4,270) (4,270) (4,162) (4,162) (4,162)Deferred consideration for capital expenditure . . . . . . . (134) (134) (187) (143) (143) (205)Net financial liabilities . . . . . . . . . . . . . . . . . . (12,015) (12,734) (11,885) (12,366) (13,154) (12,325)
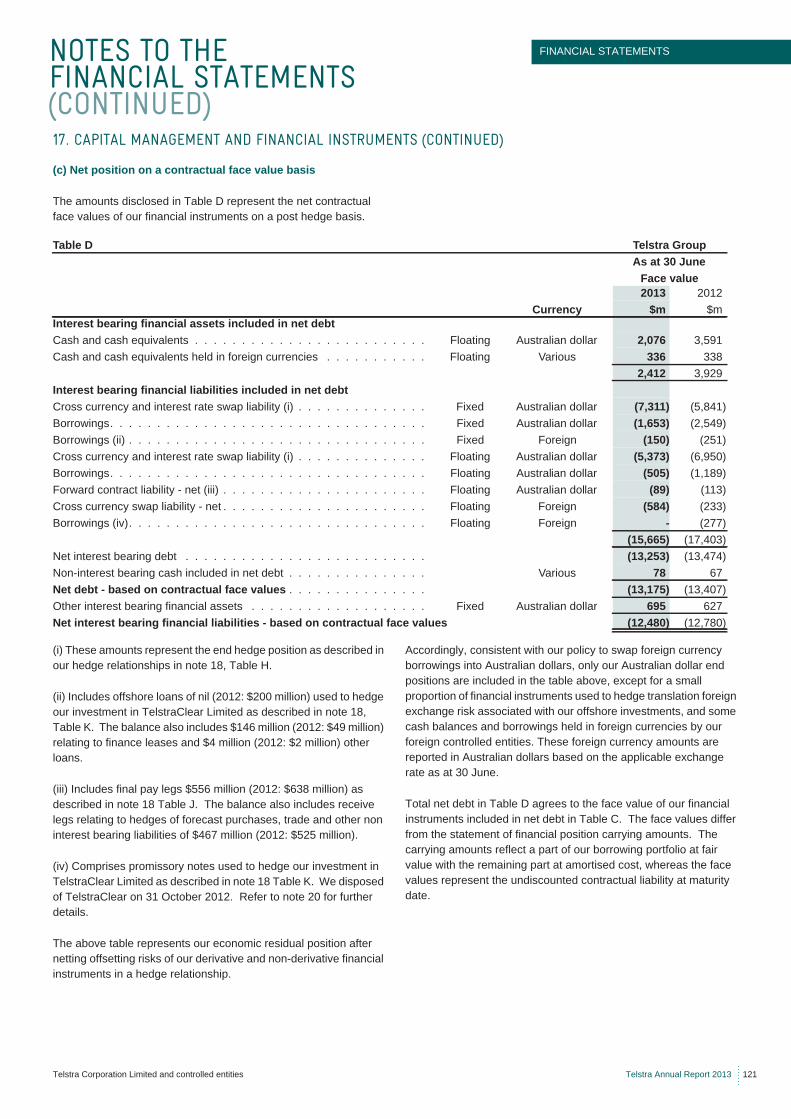
NOTES TO THE FINANCIAL STATEMENTS (CONTINUED)
FINANCIAL STATEMENTS
Telstra Corporation Limited and controlled entities Telstra Annual Report 2013 121
(c) Net position on a contractual face value basis
The amounts disclosed in Table D represent the net contractual face values of our financial instruments on a post hedge basis.
(i) These amounts represent the end hedge position as described in our hedge relationships in note 18, Table H.
(ii) Includes offshore loans of nil (2012: $200 million) used to hedge our investment in TelstraClear Limited as described in note 18, Table K. The balance also includes $146 million (2012: $49 million) relating to finance leases and $4 million (2012: $2 million) other loans.
(iii) Includes final pay legs $556 million (2012: $638 million) as described in note 18 Table J. The balance also includes receive legs relating to hedges of forecast purchases, trade and other non interest bearing liabilities of $467 million (2012: $525 million).
(iv) Comprises promissory notes used to hedge our investment in TelstraClear Limited as described in note 18 Table K. We disposed of TelstraClear on 31 October 2012. Refer to note 20 for further details.
The above table represents our economic residual position after netting offsetting risks of our derivative and non-derivative financial instruments in a hedge relationship.
Accordingly, consistent with our policy to swap foreign currency borrowings into Australian dollars, only our Australian dollar end positions are included in the table above, except for a small proportion of financial instruments used to hedge translation foreign exchange risk associated with our offshore investments, and some cash balances and borrowings held in foreign currencies by our foreign controlled entities. These foreign currency amounts are reported in Australian dollars based on the applicable exchange rate as at 30 June.
Total net debt in Table D agrees to the face value of our financial instruments included in net debt in Table C. The face values differ from the statement of financial position carrying amounts. The carrying amounts reflect a part of our borrowing portfolio at fair value with the remaining part at amortised cost, whereas the face values represent the undiscounted contractual liability at maturity date.
17. CAPITAL MANAGEMENT AND FINANCIAL INSTRUMENTS (CONTINUED)
Table D Telstra GroupAs at 30 June
Face value2013 2012
Currency $m $mInterest bearing financial assets included in net debtCash and cash equivalents . . . . . . . . . . . . . . . . . . . . . . . . . Floating Australian dollar 2,076 3,591Cash and cash equivalents held in foreign currencies . . . . . . . . . . . Floating Various 336 338
2,412 3,929Interest bearing financial liabilities included in net debtCross currency and interest rate swap liability (i) . . . . . . . . . . . . . . Fixed Australian dollar (7,311) (5,841)Borrowings. . . . . . . . . . . . . . . . . . . . . . . . . . . . . . . . . . Fixed Australian dollar (1,653) (2,549)Borrowings (ii) . . . . . . . . . . . . . . . . . . . . . . . . . . . . . . . . Fixed Foreign (150) (251)Cross currency and interest rate swap liability (i) . . . . . . . . . . . . . . Floating Australian dollar (5,373) (6,950)Borrowings. . . . . . . . . . . . . . . . . . . . . . . . . . . . . . . . . . Floating Australian dollar (505) (1,189)Forward contract liability - net (iii) . . . . . . . . . . . . . . . . . . . . . . Floating Australian dollar (89) (113)Cross currency swap liability - net . . . . . . . . . . . . . . . . . . . . . . Floating Foreign (584) (233)Borrowings (iv). . . . . . . . . . . . . . . . . . . . . . . . . . . . . . . . Floating Foreign - (277)
(15,665) (17,403)Net interest bearing debt . . . . . . . . . . . . . . . . . . . . . . . . . . (13,253) (13,474)Non-interest bearing cash included in net debt . . . . . . . . . . . . . . . Various 78 67Net debt - based on contractual face values . . . . . . . . . . . . . . . (13,175) (13,407)Other interest bearing financial assets . . . . . . . . . . . . . . . . . . . Fixed Australian dollar 695 627Net interest bearing financial liabilities - based on contractual face values (12,480) (12,780)
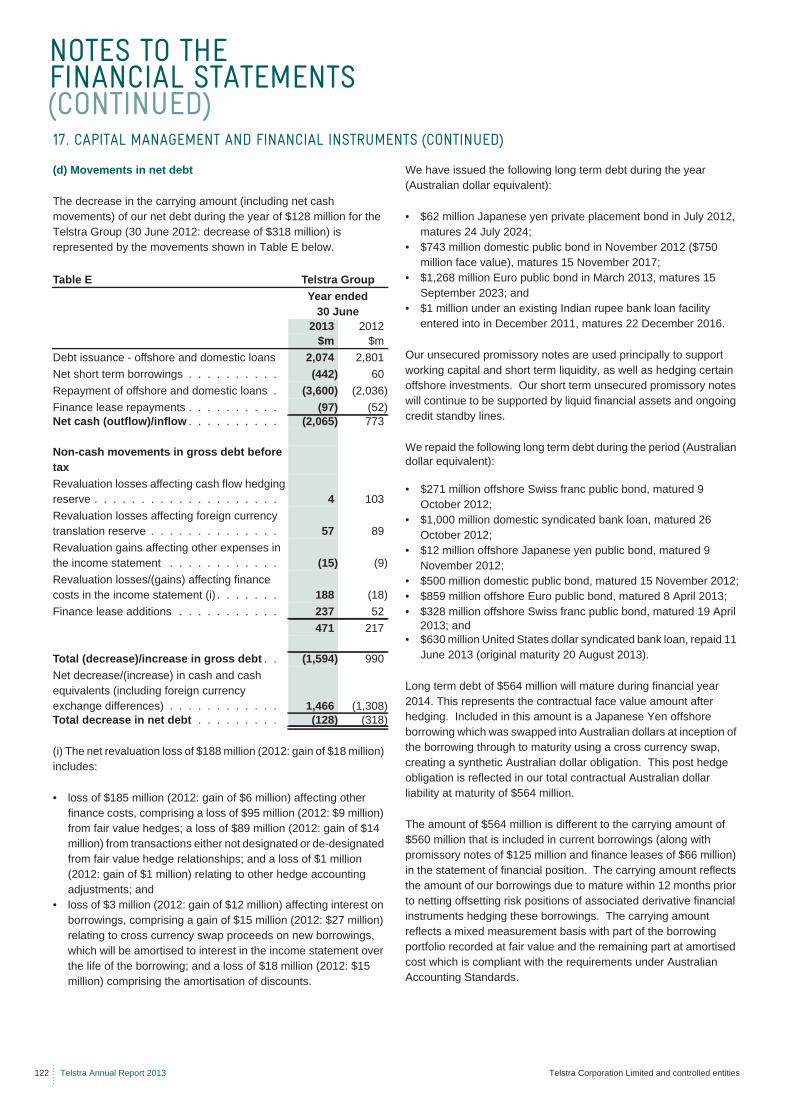
NOTES TO THE FINANCIAL STATEMENTS (CONTINUED)
122 Telstra Annual Report 2013 Telstra Corporation Limited and controlled entities
(d) Movements in net debt
The decrease in the carrying amount (including net cash movements) of our net debt during the year of $128 million for the Telstra Group (30 June 2012: decrease of $318 million) is represented by the movements shown in Table E below.
(i) The net revaluation loss of $188 million (2012: gain of $18 million) includes:
• loss of $185 million (2012: gain of $6 million) affecting other finance costs, comprising a loss of $95 million (2012: $9 million) from fair value hedges; a loss of $89 million (2012: gain of $14 million) from transactions either not designated or de-designated from fair value hedge relationships; and a loss of $1 million (2012: gain of $1 million) relating to other hedge accounting adjustments; and
• loss of $3 million (2012: gain of $12 million) affecting interest on borrowings, comprising a gain of $15 million (2012: $27 million) relating to cross currency swap proceeds on new borrowings, which will be amortised to interest in the income statement over the life of the borrowing; and a loss of $18 million (2012: $15 million) comprising the amortisation of discounts.
We have issued the following long term debt during the year (Australian dollar equivalent):
• $62 million Japanese yen private placement bond in July 2012, matures 24 July 2024;
• $743 million domestic public bond in November 2012 ($750 million face value), matures 15 November 2017;
• $1,268 million Euro public bond in March 2013, matures 15 September 2023; and
• $1 million under an existing Indian rupee bank loan facility entered into in December 2011, matures 22 December 2016.
Our unsecured promissory notes are used principally to support working capital and short term liquidity, as well as hedging certain offshore investments. Our short term unsecured promissory notes will continue to be supported by liquid financial assets and ongoing credit standby lines.
We repaid the following long term debt during the period (Australian dollar equivalent):
• $271 million offshore Swiss franc public bond, matured 9 October 2012;
• $1,000 million domestic syndicated bank loan, matured 26 October 2012;
• $12 million offshore Japanese yen public bond, matured 9 November 2012;
• $500 million domestic public bond, matured 15 November 2012;• $859 million offshore Euro public bond, matured 8 April 2013; • $328 million offshore Swiss franc public bond, matured 19 April
2013; and• $630 million United States dollar syndicated bank loan, repaid 11
June 2013 (original maturity 20 August 2013).
Long term debt of $564 million will mature during financial year 2014. This represents the contractual face value amount after hedging. Included in this amount is a Japanese Yen offshore borrowing which was swapped into Australian dollars at inception of the borrowing through to maturity using a cross currency swap, creating a synthetic Australian dollar obligation. This post hedge obligation is reflected in our total contractual Australian dollar liability at maturity of $564 million.
The amount of $564 million is different to the carrying amount of $560 million that is included in current borrowings (along with promissory notes of $125 million and finance leases of $66 million) in the statement of financial position. The carrying amount reflects the amount of our borrowings due to mature within 12 months prior to netting offsetting risk positions of associated derivative financial instruments hedging these borrowings. The carrying amount reflects a mixed measurement basis with part of the borrowing portfolio recorded at fair value and the remaining part at amortised cost which is compliant with the requirements under Australian Accounting Standards.
17. CAPITAL MANAGEMENT AND FINANCIAL INSTRUMENTS (CONTINUED)
Table E Telstra GroupYear ended
30 June2013 2012
$m $mDebt issuance - offshore and domestic loans 2,074 2,801Net short term borrowings . . . . . . . . . . (442) 60Repayment of offshore and domestic loans . (3,600) (2,036)Finance lease repayments . . . . . . . . . . (97) (52)Net cash (outflow)/inflow . . . . . . . . . . (2,065) 773
Non-cash movements in gross debt before taxRevaluation losses affecting cash flow hedging reserve . . . . . . . . . . . . . . . . . . . . 4 103Revaluation losses affecting foreign currency translation reserve . . . . . . . . . . . . . . 57 89Revaluation gains affecting other expenses in the income statement . . . . . . . . . . . . (15) (9)Revaluation losses/(gains) affecting finance costs in the income statement (i) . . . . . . . 188 (18)Finance lease additions . . . . . . . . . . . 237 52
471 217
Total (decrease)/increase in gross debt . . (1,594) 990Net decrease/(increase) in cash and cash equivalents (including foreign currency exchange differences) . . . . . . . . . . . . 1,466 (1,308)Total decrease in net debt . . . . . . . . . (128) (318)
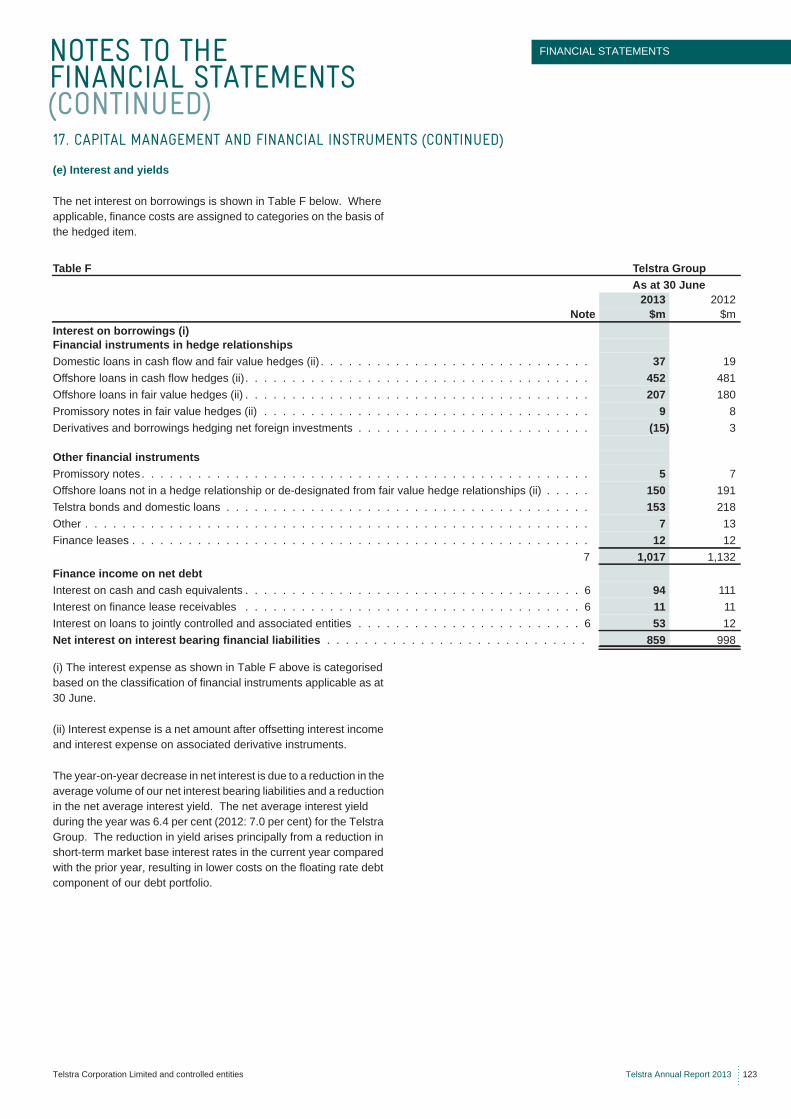
NOTES TO THE FINANCIAL STATEMENTS (CONTINUED)
FINANCIAL STATEMENTS
Telstra Corporation Limited and controlled entities Telstra Annual Report 2013 123
(e) Interest and yields
The net interest on borrowings is shown in Table F below. Where applicable, finance costs are assigned to categories on the basis of the hedged item.
(i) The interest expense as shown in Table F above is categorised based on the classification of financial instruments applicable as at 30 June.
(ii) Interest expense is a net amount after offsetting interest income and interest expense on associated derivative instruments.
The year-on-year decrease in net interest is due to a reduction in the average volume of our net interest bearing liabilities and a reduction in the net average interest yield. The net average interest yield during the year was 6.4 per cent (2012: 7.0 per cent) for the Telstra Group. The reduction in yield arises principally from a reduction in short-term market base interest rates in the current year compared with the prior year, resulting in lower costs on the floating rate debt component of our debt portfolio.
17. CAPITAL MANAGEMENT AND FINANCIAL INSTRUMENTS (CONTINUED)
Table F Telstra GroupAs at 30 June
2013 2012Note $m $m
Interest on borrowings (i)Financial instruments in hedge relationshipsDomestic loans in cash flow and fair value hedges (ii) . . . . . . . . . . . . . . . . . . . . . . . . . . . . . 37 19Offshore loans in cash flow hedges (ii). . . . . . . . . . . . . . . . . . . . . . . . . . . . . . . . . . . . . 452 481Offshore loans in fair value hedges (ii) . . . . . . . . . . . . . . . . . . . . . . . . . . . . . . . . . . . . . 207 180Promissory notes in fair value hedges (ii) . . . . . . . . . . . . . . . . . . . . . . . . . . . . . . . . . . . 9 8Derivatives and borrowings hedging net foreign investments . . . . . . . . . . . . . . . . . . . . . . . . . (15) 3
Other financial instrumentsPromissory notes . . . . . . . . . . . . . . . . . . . . . . . . . . . . . . . . . . . . . . . . . . . . . . . . 5 7Offshore loans not in a hedge relationship or de-designated from fair value hedge relationships (ii) . . . . . 150 191Telstra bonds and domestic loans . . . . . . . . . . . . . . . . . . . . . . . . . . . . . . . . . . . . . . . 153 218Other . . . . . . . . . . . . . . . . . . . . . . . . . . . . . . . . . . . . . . . . . . . . . . . . . . . . . . 7 13Finance leases . . . . . . . . . . . . . . . . . . . . . . . . . . . . . . . . . . . . . . . . . . . . . . . . . 12 12
7 1,017 1,132Finance income on net debtInterest on cash and cash equivalents . . . . . . . . . . . . . . . . . . . . . . . . . . . . . . . . . . . . 6 94 111Interest on finance lease receivables . . . . . . . . . . . . . . . . . . . . . . . . . . . . . . . . . . . . 6 11 11Interest on loans to jointly controlled and associated entities . . . . . . . . . . . . . . . . . . . . . . . . 6 53 12Net interest on interest bearing financial liabilities . . . . . . . . . . . . . . . . . . . . . . . . . . . . 859 998
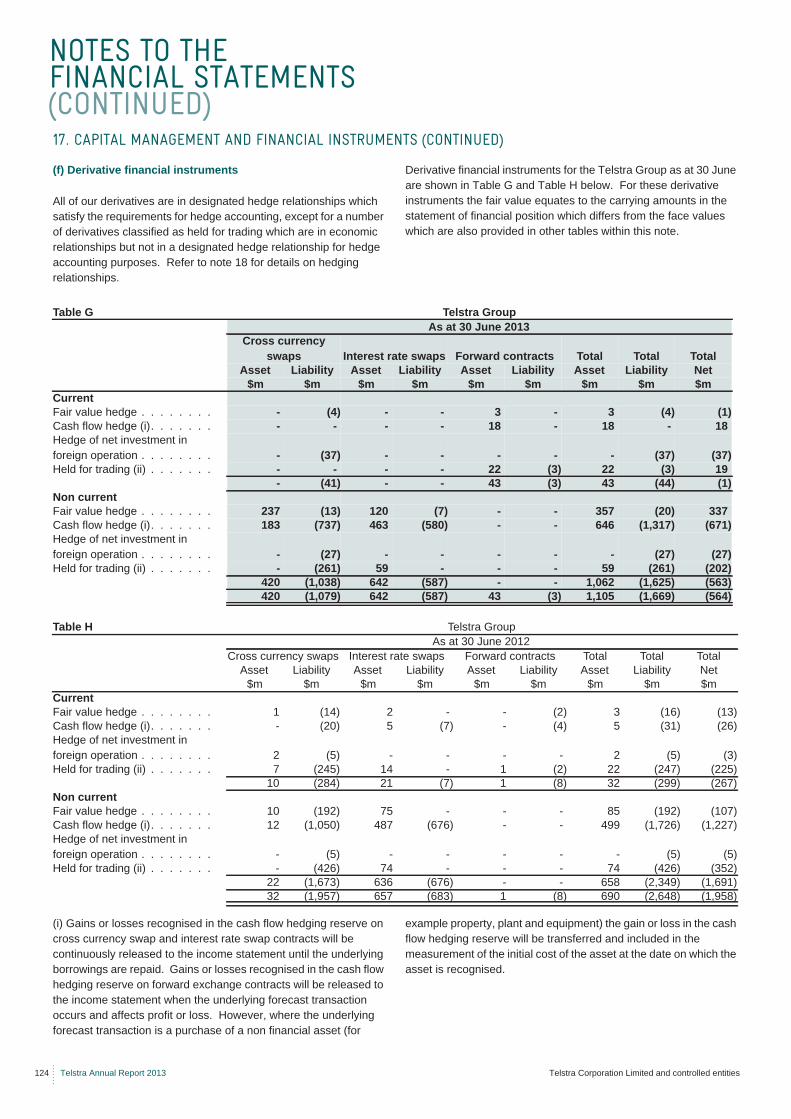
NOTES TO THE FINANCIAL STATEMENTS (CONTINUED)
124 Telstra Annual Report 2013 Telstra Corporation Limited and controlled entities
(f) Derivative financial instruments
All of our derivatives are in designated hedge relationships which satisfy the requirements for hedge accounting, except for a number of derivatives classified as held for trading which are in economic relationships but not in a designated hedge relationship for hedge accounting purposes. Refer to note 18 for details on hedging relationships.
Derivative financial instruments for the Telstra Group as at 30 June are shown in Table G and Table H below. For these derivative instruments the fair value equates to the carrying amounts in the statement of financial position which differs from the face values which are also provided in other tables within this note.
(i) Gains or losses recognised in the cash flow hedging reserve on cross currency swap and interest rate swap contracts will be continuously released to the income statement until the underlying borrowings are repaid. Gains or losses recognised in the cash flow hedging reserve on forward exchange contracts will be released to the income statement when the underlying forecast transaction occurs and affects profit or loss. However, where the underlying forecast transaction is a purchase of a non financial asset (for
example property, plant and equipment) the gain or loss in the cash flow hedging reserve will be transferred and included in the measurement of the initial cost of the asset at the date on which the asset is recognised.
17. CAPITAL MANAGEMENT AND FINANCIAL INSTRUMENTS (CONTINUED)
Table G Telstra GroupAs at 30 June 2013
Cross currency swaps Interest rate swaps Forward contracts Total Total Total
Asset Liability Asset Liability Asset Liability Asset Liability Net$m $m $m $m $m $m $m $m $m
CurrentFair value hedge . . . . . . . . - (4) - - 3 - 3 (4) (1)Cash flow hedge (i). . . . . . . - - - - 18 - 18 - 18Hedge of net investment in foreign operation . . . . . . . . - (37) - - - - - (37) (37)Held for trading (ii) . . . . . . . - - - - 22 (3) 22 (3) 19
- (41) - - 43 (3) 43 (44) (1)Non currentFair value hedge . . . . . . . . 237 (13) 120 (7) - - 357 (20) 337Cash flow hedge (i). . . . . . . 183 (737) 463 (580) - - 646 (1,317) (671)Hedge of net investment in foreign operation . . . . . . . . - (27) - - - - - (27) (27)Held for trading (ii) . . . . . . . - (261) 59 - - - 59 (261) (202)
420 (1,038) 642 (587) - - 1,062 (1,625) (563)420 (1,079) 642 (587) 43 (3) 1,105 (1,669) (564)
Table H Telstra GroupAs at 30 June 2012
Cross currency swaps Interest rate swaps Forward contracts Total Total TotalAsset Liability Asset Liability Asset Liability Asset Liability Net
$m $m $m $m $m $m $m $m $mCurrentFair value hedge . . . . . . . . 1 (14) 2 - - (2) 3 (16) (13)Cash flow hedge (i). . . . . . . - (20) 5 (7) - (4) 5 (31) (26)Hedge of net investment in foreign operation . . . . . . . . 2 (5) - - - - 2 (5) (3)Held for trading (ii) . . . . . . . 7 (245) 14 - 1 (2) 22 (247) (225)
10 (284) 21 (7) 1 (8) 32 (299) (267)Non currentFair value hedge . . . . . . . . 10 (192) 75 - - - 85 (192) (107)Cash flow hedge (i). . . . . . . 12 (1,050) 487 (676) - - 499 (1,726) (1,227)Hedge of net investment in foreign operation . . . . . . . . - (5) - - - - - (5) (5)Held for trading (ii) . . . . . . . - (426) 74 - - - 74 (426) (352)
22 (1,673) 636 (676) - - 658 (2,349) (1,691)32 (1,957) 657 (683) 1 (8) 690 (2,648) (1,958)
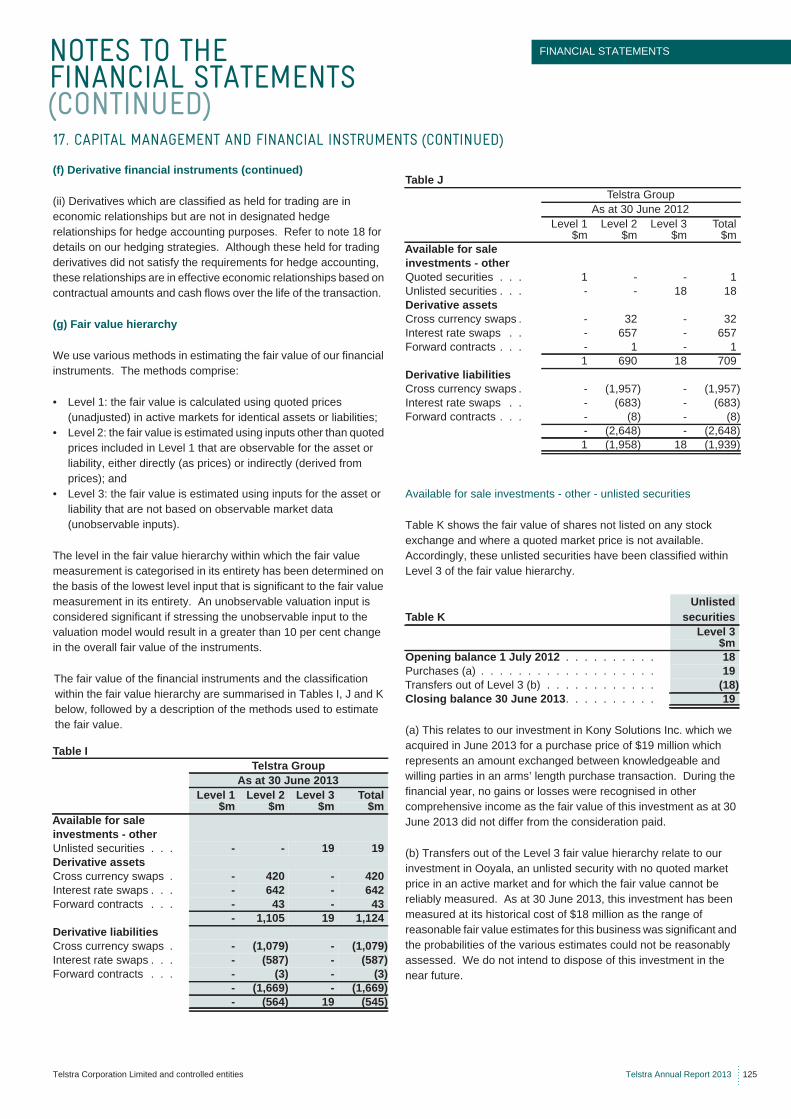
NOTES TO THE FINANCIAL STATEMENTS (CONTINUED)
FINANCIAL STATEMENTS
Telstra Corporation Limited and controlled entities Telstra Annual Report 2013 125
(f) Derivative financial instruments (continued)
(ii) Derivatives which are classified as held for trading are in economic relationships but are not in designated hedge relationships for hedge accounting purposes. Refer to note 18 for details on our hedging strategies. Although these held for trading derivatives did not satisfy the requirements for hedge accounting, these relationships are in effective economic relationships based on contractual amounts and cash flows over the life of the transaction.
(g) Fair value hierarchy
We use various methods in estimating the fair value of our financial instruments. The methods comprise:
• Level 1: the fair value is calculated using quoted prices (unadjusted) in active markets for identical assets or liabilities;
• Level 2: the fair value is estimated using inputs other than quoted prices included in Level 1 that are observable for the asset or liability, either directly (as prices) or indirectly (derived from prices); and
• Level 3: the fair value is estimated using inputs for the asset or liability that are not based on observable market data (unobservable inputs).
The level in the fair value hierarchy within which the fair value measurement is categorised in its entirety has been determined on the basis of the lowest level input that is significant to the fair value measurement in its entirety. An unobservable valuation input is considered significant if stressing the unobservable input to the valuation model would result in a greater than 10 per cent change in the overall fair value of the instruments.
The fair value of the financial instruments and the classification within the fair value hierarchy are summarised in Tables I, J and K below, followed by a description of the methods used to estimate the fair value.
Available for sale investments - other - unlisted securities
Table K shows the fair value of shares not listed on any stock exchange and where a quoted market price is not available. Accordingly, these unlisted securities have been classified within Level 3 of the fair value hierarchy.
(a) This relates to our investment in Kony Solutions Inc. which we acquired in June 2013 for a purchase price of $19 million which represents an amount exchanged between knowledgeable and willing parties in an arms’ length purchase transaction. During the financial year, no gains or losses were recognised in other comprehensive income as the fair value of this investment as at 30 June 2013 did not differ from the consideration paid.
(b) Transfers out of the Level 3 fair value hierarchy relate to our investment in Ooyala, an unlisted security with no quoted market price in an active market and for which the fair value cannot be reliably measured. As at 30 June 2013, this investment has been measured at its historical cost of $18 million as the range of reasonable fair value estimates for this business was significant and the probabilities of the various estimates could not be reasonably assessed. We do not intend to dispose of this investment in the near future.
17. CAPITAL MANAGEMENT AND FINANCIAL INSTRUMENTS (CONTINUED)
Table ITelstra Group
As at 30 June 2013 Level 1 Level 2 Level 3 Total
$m $m $m $mAvailable for sale investments - otherUnlisted securities . . . - - 19 19Derivative assetsCross currency swaps . - 420 - 420Interest rate swaps . . . - 642 - 642Forward contracts . . . - 43 - 43
- 1,105 19 1,124Derivative liabilitiesCross currency swaps . - (1,079) - (1,079)Interest rate swaps . . . - (587) - (587)Forward contracts . . . - (3) - (3)
- (1,669) - (1,669)- (564) 19 (545)
Table JTelstra Group
As at 30 June 2012Level 1 Level 2 Level 3 Total
$m $m $m $mAvailable for sale investments - otherQuoted securities . . . 1 - - 1Unlisted securities . . . - - 18 18Derivative assetsCross currency swaps . - 32 - 32Interest rate swaps . . - 657 - 657Forward contracts . . . - 1 - 1
1 690 18 709Derivative liabilitiesCross currency swaps . - (1,957) - (1,957)Interest rate swaps . . - (683) - (683)Forward contracts . . . - (8) - (8)
- (2,648) - (2,648)1 (1,958) 18 (1,939)
Table KUnlisted
securitiesLevel 3
$mOpening balance 1 July 2012 . . . . . . . . . . 18Purchases (a) . . . . . . . . . . . . . . . . . . . 19Transfers out of Level 3 (b) . . . . . . . . . . . . (18)Closing balance 30 June 2013. . . . . . . . . . 19
NOTES TO THE FINANCIAL STATEMENTS (CONTINUED)
126 Telstra Annual Report 2013 Telstra Corporation Limited and controlled entities
(g) Fair value hierarchy (continued)
Cross currency and interest rate swaps
The net fair values of our cross currency and interest rate swaps are determined using valuation techniques that utilise data from observable and unobservable market data. Assumptions are based on market conditions existing at each reporting date. The fair value is calculated as the present value of the estimated future cash flows using an appropriate market based yield curve, which is independently derived and representative of Telstra’s cost of borrowing. In particular, the following inputs are used to derive yield curves used in the calculation of fair value of our derivatives:
• base curves which are readily available market data and quoted for all major currencies; and
• pricing data reflecting Telstra’s borrowing margins obtained from selected market participants with whom Telstra has transacted or would transact in capital markets. We generally use the mid point of the pricing data range in calculating the yield curve. This pricing data used to estimate Telstra’s borrowing margins is not observable. However, sensitivity analysis on changes to this input, by using the maximum point in the pricing range, does not result in a significant change to the fair value of our cross currency and interest rate swaps.
We have therefore classified these derivatives based on the observable market inputs as Level 2.
Forward contracts
The fair value of our forward exchange contracts is calculated by reference to forward exchange market rates at reporting date for contracts with similar maturity profiles. These market rates are observable and therefore these derivatives have been classified as Level 2.
17. CAPITAL MANAGEMENT AND FINANCIAL INSTRUMENTS (CONTINUED)
NOTES TO THE FINANCIAL STATEMENTS (CONTINUED)
FINANCIAL STATEMENTS
Telstra Corporation Limited and controlled entities Telstra Annual Report 2013 127
We undertake transactions using a range of financial instruments, including:
• cash assets; • receivables; • payables; • negotiable certificates of deposits; • bank deposits;• bills of exchange and promissory notes; • listed investments and investments in other corporations; • various forms of borrowings, including medium term notes,
promissory notes, bank loans and private placements; and• derivatives.
Our activities result in exposure to operational risk and a number of financial risks, including market risk (interest rate risk and foreign currency risk), credit risk and liquidity risk.
Our overall risk management program seeks to mitigate these risks and reduce volatility on our financial performance and support the delivery of our financial targets. We manage our risks with a view to the outcomes of both our financial results and the underlying economic position. Financial risk management is carried out centrally by our Treasury department, which is part of our corporate areas, under policies approved by the Board of Directors (the Board). The Board provides written principles for overall risk management, as well as written policies covering specific areas, such as, foreign exchange risk, interest rate risk, credit risk, use of derivative financial instruments and non derivative financial instruments, and the investment of excess liquidity.
We enter into derivative transactions in accordance with Board approved policies to manage our exposure to market risks and volatility of financial outcomes that arise as part of our normal business operations. These derivative instruments create an obligation or right that effectively transfers one or more of the risks associated with an underlying financial instrument, asset or obligation. Derivative financial instruments that we use to hedge risks such as interest rate and foreign currency movements include:
• cross currency swaps; • interest rate swaps; and• forward exchange contracts.
We do not speculatively trade in derivative financial instruments. Our derivative transactions are entered into to hedge the risks relating to underlying physical positions arising from our business activities.
Section (a) of this note sets out the key financial risk factors that arise from our activities, including our policies for managing these risks.
Sections (b) and (c) provide details of our hedging strategies and hedge relationships that are used for financial risk management. In particular, these sections provide additional context around our hedge transactions and the resulting economic and risk positions.
(a) Risk and mitigation
The risks associated with our main financial instruments and our policies for minimising these risks are detailed below. These risks comprise market risk, credit risk and liquidity risk.
Market risk
Market risk is the risk that the fair value or future cash flows of our financial instruments will fluctuate because of changes in market prices. Components of market risk to which we are exposed are discussed below.
(i) Interest rate risk
Interest rate risk refers to the risk that the value of a financial instrument or cash flows associated with the instrument will fluctuate due to changes in market interest rates.
Interest rate risk arises from interest bearing financial assets and liabilities. Non derivative interest bearing assets are predominantly short term liquid assets. Our interest rate liability risk arises primarily from long term foreign debt issued at fixed rates, which exposes us to fair value interest rate risk. Our borrowings, which have a variable interest rate attached, give rise to cash flow interest rate risk.
Our debt is sourced from a number of financial markets covering domestic and offshore, short term and long term funding. The majority of our debt consists of foreign currency denominated borrowings. We manage our debt in accordance with targeted currency, interest rate, liquidity, and debt portfolio maturity profiles. Specifically, we manage interest rate risk on our net debt portfolio by:
• adjusting the ratio of fixed interest debt to variable interest debt to our target ratio, as required by our debt management policy;
• ensuring access to diverse sources of funding;• reducing risks of refinancing by establishing and managing in
accordance with target maturity profiles; and• undertaking hedging activities through the use of derivative
financial instruments.
Under our interest rate swaps we agree with other parties to exchange, at specified intervals (mainly quarterly), the difference between fixed contract interest rates and floating rate interest amounts calculated by reference to the agreed notional principal amounts. Refer to note 17,Table D, for our residual post hedge fixed and floating interest positions on a contractual face value basis.
We hedge interest rate and currency risk on most of our foreign currency borrowings by entering into cross currency principal swaps and interest rate swaps. “Hedging strategies” and “Hedge relationships” contained in sections (b) and (c) of this note provides further information.
18. FINANCIAL RISK MANAGEMENT
NOTES TO THE FINANCIAL STATEMENTS (CONTINUED)
128 Telstra Annual Report 2013 Telstra Corporation Limited and controlled entities
(a) Risk and mitigation (continued)
Market risk (continued)
(i) Interest rate risk (continued)
The weighted average interest rates on our fixed and floating rate financial instruments as at 30 June, which do not have offsetting risk positions, and the principal/notional amounts on which interest is calculated, are shown in Table A. Interest rate positions on our foreign cross currency and foreign interest rate swaps and on the majority of our foreign borrowings are fully offset. Accordingly, the majority of our instruments in the following table represent Australian dollar interest positions. Principal/notional amounts shown are net of discounts and therefore differ from the face value disclosed in note 17 (Tables C and D).
18. FINANCIAL RISK MANAGEMENT (CONTINUED)
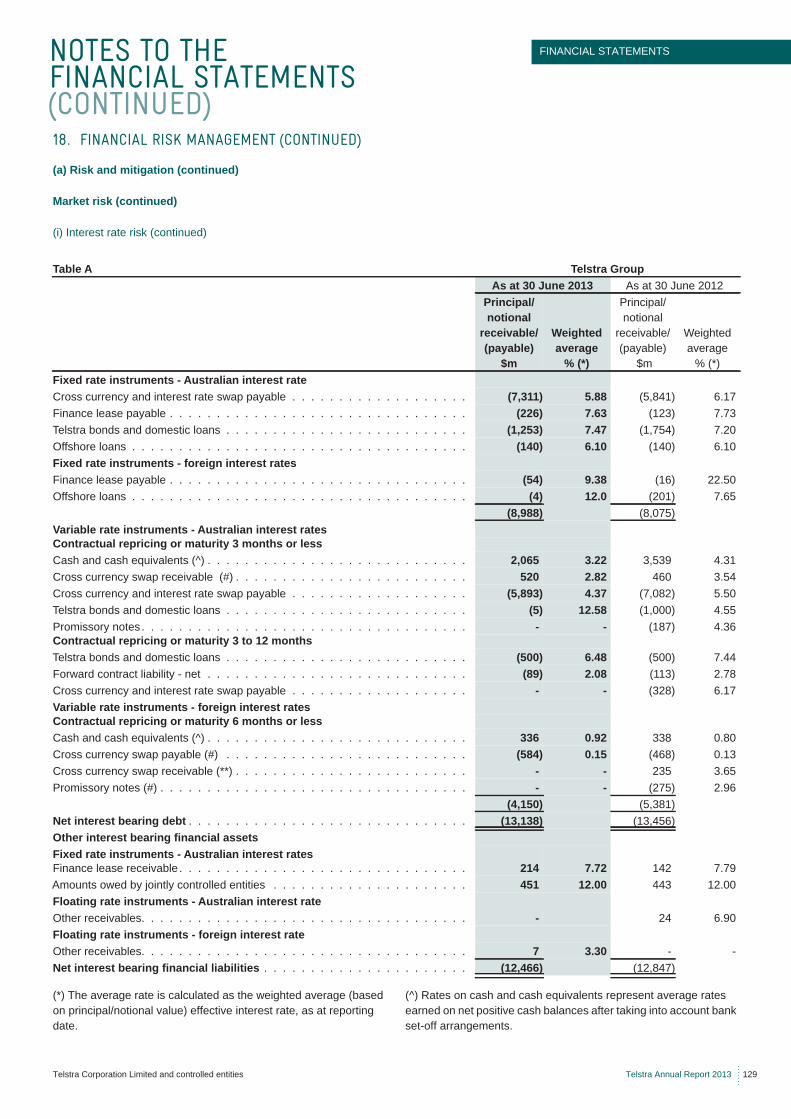
NOTES TO THE FINANCIAL STATEMENTS (CONTINUED)
FINANCIAL STATEMENTS
Telstra Corporation Limited and controlled entities Telstra Annual Report 2013 129
(a) Risk and mitigation (continued)
Market risk (continued)
(i) Interest rate risk (continued)
(*) The average rate is calculated as the weighted average (based on principal/notional value) effective interest rate, as at reporting date.
(^) Rates on cash and cash equivalents represent average rates earned on net positive cash balances after taking into account bank set-off arrangements.
18. FINANCIAL RISK MANAGEMENT (CONTINUED)
Table A Telstra GroupAs at 30 June 2013 As at 30 June 2012
Principal/ notional
receivable/ (payable)
$m
Weighted average
% (*)
Principal/ notional
receivable/ (payable)
$m
Weighted average
% (*)Fixed rate instruments - Australian interest rateCross currency and interest rate swap payable . . . . . . . . . . . . . . . . . . . (7,311) 5.88 (5,841) 6.17Finance lease payable . . . . . . . . . . . . . . . . . . . . . . . . . . . . . . . . (226) 7.63 (123) 7.73Telstra bonds and domestic loans . . . . . . . . . . . . . . . . . . . . . . . . . . (1,253) 7.47 (1,754) 7.20Offshore loans . . . . . . . . . . . . . . . . . . . . . . . . . . . . . . . . . . . . (140) 6.10 (140) 6.10Fixed rate instruments - foreign interest ratesFinance lease payable . . . . . . . . . . . . . . . . . . . . . . . . . . . . . . . . (54) 9.38 (16) 22.50Offshore loans . . . . . . . . . . . . . . . . . . . . . . . . . . . . . . . . . . . . (4) 12.0 (201) 7.65
(8,988) (8,075)Variable rate instruments - Australian interest ratesContractual repricing or maturity 3 months or lessCash and cash equivalents (^) . . . . . . . . . . . . . . . . . . . . . . . . . . . . 2,065 3.22 3,539 4.31Cross currency swap receivable (#) . . . . . . . . . . . . . . . . . . . . . . . . . 520 2.82 460 3.54Cross currency and interest rate swap payable . . . . . . . . . . . . . . . . . . . (5,893) 4.37 (7,082) 5.50Telstra bonds and domestic loans . . . . . . . . . . . . . . . . . . . . . . . . . . (5) 12.58 (1,000) 4.55Promissory notes . . . . . . . . . . . . . . . . . . . . . . . . . . . . . . . . . . . - - (187) 4.36Contractual repricing or maturity 3 to 12 monthsTelstra bonds and domestic loans . . . . . . . . . . . . . . . . . . . . . . . . . . (500) 6.48 (500) 7.44Forward contract liability - net . . . . . . . . . . . . . . . . . . . . . . . . . . . . (89) 2.08 (113) 2.78Cross currency and interest rate swap payable . . . . . . . . . . . . . . . . . . . - - (328) 6.17Variable rate instruments - foreign interest ratesContractual repricing or maturity 6 months or lessCash and cash equivalents (^) . . . . . . . . . . . . . . . . . . . . . . . . . . . . 336 0.92 338 0.80Cross currency swap payable (#) . . . . . . . . . . . . . . . . . . . . . . . . . . (584) 0.15 (468) 0.13Cross currency swap receivable (**) . . . . . . . . . . . . . . . . . . . . . . . . . - - 235 3.65Promissory notes (#) . . . . . . . . . . . . . . . . . . . . . . . . . . . . . . . . . - - (275) 2.96
(4,150) (5,381)Net interest bearing debt . . . . . . . . . . . . . . . . . . . . . . . . . . . . . . (13,138) (13,456)Other interest bearing financial assetsFixed rate instruments - Australian interest ratesFinance lease receivable . . . . . . . . . . . . . . . . . . . . . . . . . . . . . . . 214 7.72 142 7.79Amounts owed by jointly controlled entities . . . . . . . . . . . . . . . . . . . . . 451 12.00 443 12.00Floating rate instruments - Australian interest rateOther receivables. . . . . . . . . . . . . . . . . . . . . . . . . . . . . . . . . . . - 24 6.90Floating rate instruments - foreign interest rateOther receivables. . . . . . . . . . . . . . . . . . . . . . . . . . . . . . . . . . . 7 3.30 - -Net interest bearing financial liabilities . . . . . . . . . . . . . . . . . . . . . . (12,466) (12,847)
NOTES TO THE FINANCIAL STATEMENTS (CONTINUED)
130 Telstra Annual Report 2013 Telstra Corporation Limited and controlled entities
18. FINANCIAL RISK MANAGEMENT (CONTINUED)
(a) Risk and mitigation (continued)
Market risk (continued)
(i) Interest rate risk (continued)
(#) Relates to financial instruments used to hedge our net foreign investments.
(**) Financial instruments used to hedge a loan from wholly owned controlled entity.
(ii) Sensitivity analysis - interest rate risk
The sensitivity analysis included in this section is based on the interest rate risk exposures on our net debt portfolio as at reporting date.
A sensitivity of plus or minus 10 per cent has been selected as this is considered reasonable given the current level of both short term and long term Australian dollar interest rates. For example, a 10 per cent increase would move short term interest rates (cash) at 30 June 2013 from 2.75 per cent (2012: 3.50 per cent) to 3.03 per cent (2012: 3.85 per cent) representing a 28 (2012: 35) basis point shift. This basis point shift is considered reasonable taking into account the absolute rates as at 30 June and current market conditions.
The results in this sensitivity analysis reflect the net impact on a hedged basis, which will be primarily reflecting the Australian dollar floating or Australian dollar fixed position from our cross currency and interest rate swap hedges. Therefore, the movement in the Australian dollar interest rates is a significant assumption in this sensitivity analysis.
Based on the sensitivity analysis, equity would be affected by the revaluation of our derivatives associated with borrowings designated in a cash flow hedge relationship and finance costs would be affected by the following:
• the impact on interest expense being incurred on our net floating rate Australian dollar positions during the year;
• the revaluation of our derivatives associated with borrowings de-designated from a fair value hedge relationship or not in a hedge relationship; and
• the ineffectiveness resulting from the change in fair value of both our derivatives and our borrowings that are designated in a fair value hedge.
The carrying value of borrowings de-designated from fair value hedge relationships or not in a hedge relationship is not adjusted for fair value movements attributable to interest rate risk. Accordingly, the revaluation gain or loss on our foreign currency derivatives associated with these borrowings will not have an offsetting gain or loss attributable to interest rate movements on the underlying borrowing.
It is important to note that this sensitivity analysis does not include the effect of movements in Telstra’s borrowing margins. Whilst margins will be affected by market factors, this risk variable predominantly reflects Telstra specific credit risk and accordingly is not considered a market risk. Furthermore, determining a reasonably possible change in this risk variable with sufficient reliability is impractical. Therefore, the following sensitivity analysis assumes a constant borrowing margin and parallel shifts in interest rates across all currencies.
The following sensitivity analysis is based on our interest rate exposures, comprising:
• the revaluation impact on our derivatives and borrowings from a 10 per cent movement in interest rates based on the net debt balances as at reporting date; and
• the effect on interest expense on our floating rate borrowings from a 10 per cent movement in interest rates at each reset date during the year.
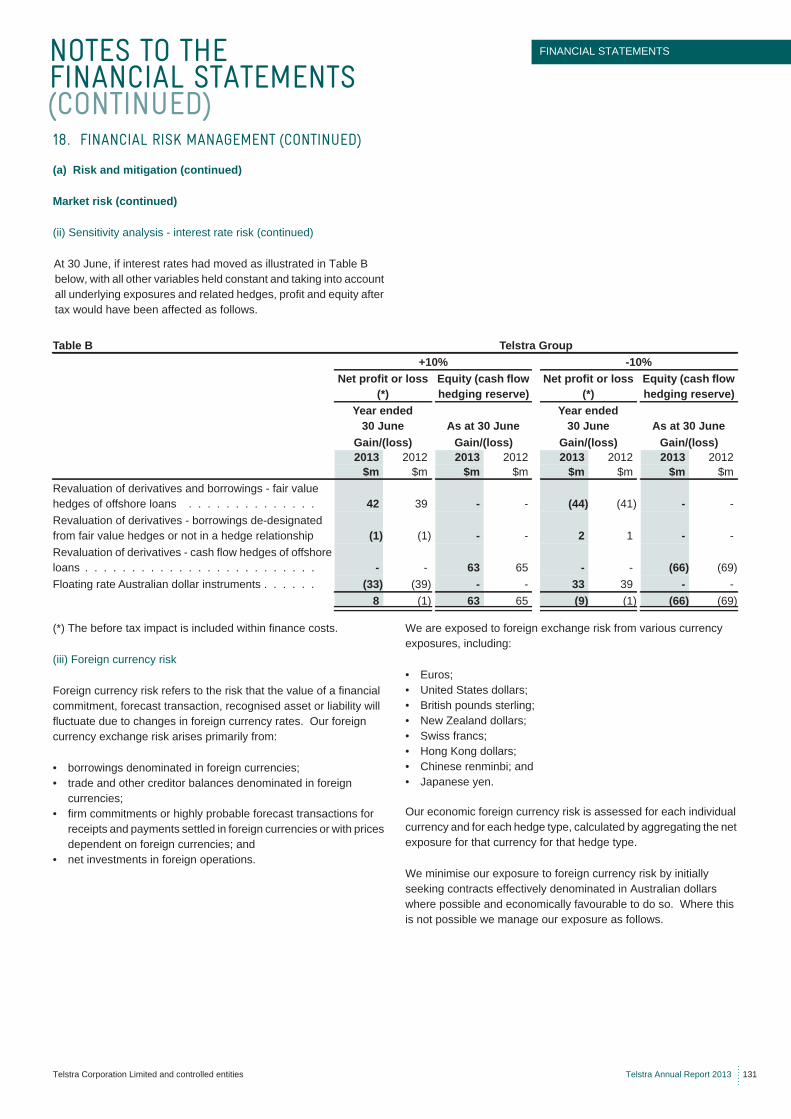
NOTES TO THE FINANCIAL STATEMENTS (CONTINUED)
FINANCIAL STATEMENTS
Telstra Corporation Limited and controlled entities Telstra Annual Report 2013 131
(a) Risk and mitigation (continued)
Market risk (continued)
(ii) Sensitivity analysis - interest rate risk (continued)
At 30 June, if interest rates had moved as illustrated in Table B below, with all other variables held constant and taking into account all underlying exposures and related hedges, profit and equity after tax would have been affected as follows.
(*) The before tax impact is included within finance costs.
(iii) Foreign currency risk
Foreign currency risk refers to the risk that the value of a financial commitment, forecast transaction, recognised asset or liability will fluctuate due to changes in foreign currency rates. Our foreign currency exchange risk arises primarily from:
• borrowings denominated in foreign currencies;• trade and other creditor balances denominated in foreign
currencies;• firm commitments or highly probable forecast transactions for
receipts and payments settled in foreign currencies or with prices dependent on foreign currencies; and
• net investments in foreign operations.
We are exposed to foreign exchange risk from various currency exposures, including:
• Euros;• United States dollars;• British pounds sterling;• New Zealand dollars;• Swiss francs;• Hong Kong dollars;• Chinese renminbi; and• Japanese yen.
Our economic foreign currency risk is assessed for each individual currency and for each hedge type, calculated by aggregating the net exposure for that currency for that hedge type.
We minimise our exposure to foreign currency risk by initially seeking contracts effectively denominated in Australian dollars where possible and economically favourable to do so. Where this is not possible we manage our exposure as follows.
18. FINANCIAL RISK MANAGEMENT (CONTINUED)
Table B Telstra Group+10% -10%
Net profit or loss (*)
Equity (cash flow hedging reserve)
Net profit or loss (*)
Equity (cash flow hedging reserve)
Year ended30 June As at 30 June
Year ended30 June As at 30 June
Gain/(loss) Gain/(loss) Gain/(loss) Gain/(loss)2013 2012 2013 2012 2013 2012 2013 2012
$m $m $m $m $m $m $m $mRevaluation of derivatives and borrowings - fair value hedges of offshore loans . . . . . . . . . . . . . . 42 39 - - (44) (41) - -Revaluation of derivatives - borrowings de-designated from fair value hedges or not in a hedge relationship (1) (1) - - 2 1 - -Revaluation of derivatives - cash flow hedges of offshore loans . . . . . . . . . . . . . . . . . . . . . . . . . - - 63 65 - - (66) (69)Floating rate Australian dollar instruments . . . . . . (33) (39) - - 33 39 - -
8 (1) 63 65 (9) (1) (66) (69)
NOTES TO THE FINANCIAL STATEMENTS (CONTINUED)
132 Telstra Annual Report 2013 Telstra Corporation Limited and controlled entities
(a) Risk and mitigation (continued)
Market risk (continued)
(iii) Foreign currency risk (continued)
Cash flow foreign currency risk arises primarily from foreign currency overseas borrowings. We hedge this risk on the major part of our foreign currency denominated borrowings by entering into a combination of interest rate and cross currency swaps at inception to maturity, effectively converting them to Australian dollar borrowings. Foreign currency borrowings are not swapped into Australian dollars where they are used as hedges for foreign exchange exposure such as translation foreign exchange risk from our offshore investments. Refer to note 17, Table D, for our residual post hedge currency exposures on a contractual face value basis.
Foreign exchange risk that arises from transactional exposures such as firm commitments or highly probable transactions settled in a foreign currency (primarily United States dollars) are managed principally through the use of forward foreign currency derivatives. We hedge a proportion of these transactions (such as property, plant and equipment and inventory purchases settled in foreign currencies) in accordance with our risk management policy.
Foreign currency risk also arises on translation of the net assets of our foreign controlled entities which have a functional currency other than Australian dollars. The foreign currency gains or losses arising from this risk are recorded through the foreign currency translation reserve. We manage this translation foreign exchange risk with forward foreign currency contracts, cross currency swaps and/or borrowings denominated in the currency of the entity concerned. We currently hedge our net investment in Hong Kong CSL Limited in the range of 40 per cent to 50 per cent (2012: 40 per cent to 50 per cent).
In addition, our controlled entities may hedge foreign exchange transactions such as exposures from asset/liability balances or forecast sales/purchases in currencies other than their functional currency. Where this occurs, external foreign exchange contracts are designated at the group level as hedges of foreign exchange risk on the specific asset/liability balance or forecast transaction.
We also economically hedge a proportion of foreign currency risk associated with trade and other creditor balances using forward foreign currency contracts.
Refer to section (b) “Hedging strategies” and section (c) “Hedge relationships” contained in this note for further information.
(iv) Sensitivity analysis - foreign currency risk
The sensitivity analysis included in this section is based on foreign currency risk exposures on our financial instruments and net foreign investment balances as at reporting date.
The translation of our investments in foreign operations from their functional currency to Australian dollars represents a translation risk rather than a financial risk. Nevertheless, in this sensitivity analysis we have included the translation impact on our foreign currency translation reserve from movements in the exchange rate. In doing so, this sensitivity analysis reflects the impact on equity from a movement in the exchange rate associated with both the underlying hedged investment and the financial instruments hedging the translation currency risk.
Adverse versus favourable movements are determined relative to the underlying exposure. An adverse movement in exchange rates implies an increase in our foreign currency risk exposure and a worsening of our financial position. A favourable movement in exchange rates implies a reduction in our foreign currency risk exposure and an improvement of our financial position.
A sensitivity of 10 per cent has been selected as this is considered reasonable taking into account the current level of exchange rates and the volatility observed both on an historical basis and on market expectations for future movements. For example, comparing the Australian dollar exchange rate against the Euro, the year end rate of 0.7096 (2012: 0.8089) would generate a 10 per cent favourable position of 0.7806 (2012: 0.8898) and an adverse position of 0.6386 (2012: 0.7280). This range is considered reasonable given the volatility that has been observed.
Foreign currency risk exposure from recognised assets and liabilities arises primarily from our long term borrowings denominated in foreign currencies. There is no significant impact on profit or loss from foreign currency movements associated with these borrowings as they are effectively hedged.
There is some volatility in profit or loss from exchange rate movements associated with our borrowings de-designated or not in hedge relationships and with our forecast transactions denominated in a foreign currency.
We are exposed to equity impacts from foreign currency movements associated with our offshore investments and our derivatives in cash flow hedges of offshore borrowings. This foreign currency risk is spread over a number of currencies and accordingly we have disclosed the sensitivity analysis on a total portfolio basis and not separately by currency. Our foreign currency exposure associated with cash flow hedge derivatives is predominantly in Euros and our offshore investments mainly in Hong Kong dollars, British pounds sterling and Chinese renminbi (relating to our investments in Hong Kong CSL Limited, Telstra Limited, Autohome Inc. and Sequel Media Inc.).
18. FINANCIAL RISK MANAGEMENT (CONTINUED)
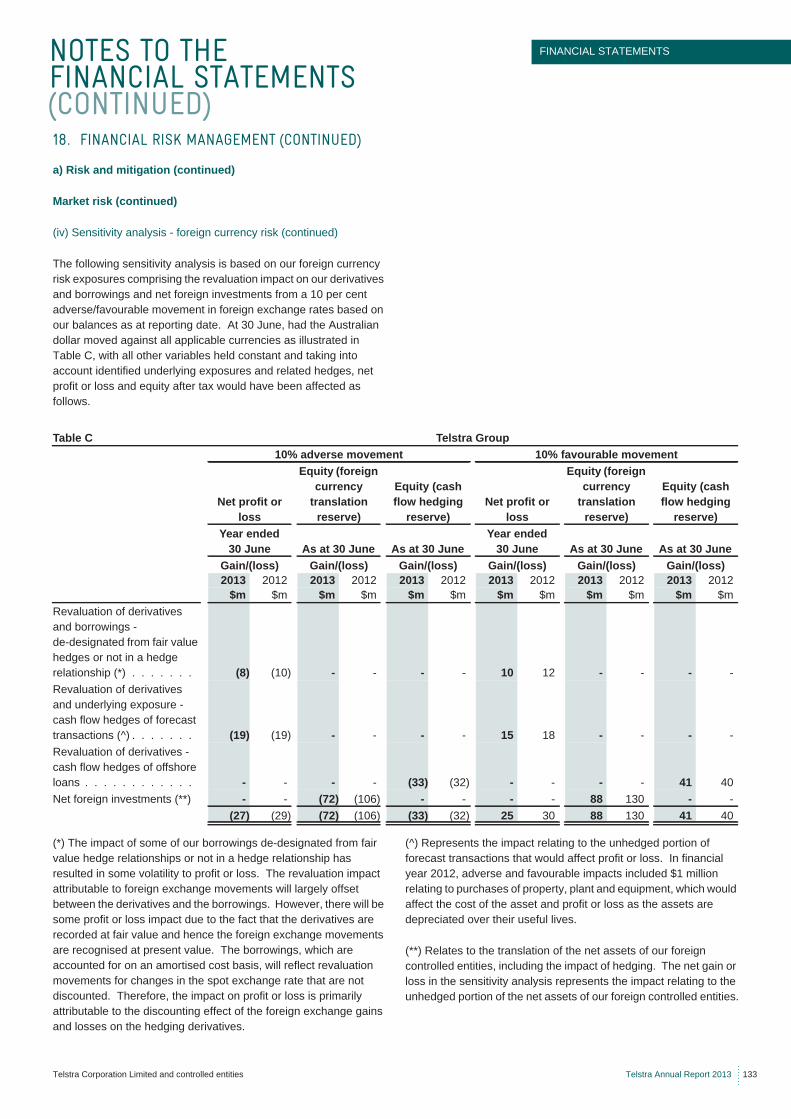
NOTES TO THE FINANCIAL STATEMENTS (CONTINUED)
FINANCIAL STATEMENTS
Telstra Corporation Limited and controlled entities Telstra Annual Report 2013 133
a) Risk and mitigation (continued)
Market risk (continued)
(iv) Sensitivity analysis - foreign currency risk (continued)
The following sensitivity analysis is based on our foreign currency risk exposures comprising the revaluation impact on our derivatives and borrowings and net foreign investments from a 10 per cent adverse/favourable movement in foreign exchange rates based on our balances as at reporting date. At 30 June, had the Australian dollar moved against all applicable currencies as illustrated in Table C, with all other variables held constant and taking into account identified underlying exposures and related hedges, net profit or loss and equity after tax would have been affected as follows.
(*) The impact of some of our borrowings de-designated from fair value hedge relationships or not in a hedge relationship has resulted in some volatility to profit or loss. The revaluation impact attributable to foreign exchange movements will largely offset between the derivatives and the borrowings. However, there will be some profit or loss impact due to the fact that the derivatives are recorded at fair value and hence the foreign exchange movements are recognised at present value. The borrowings, which are accounted for on an amortised cost basis, will reflect revaluation movements for changes in the spot exchange rate that are not discounted. Therefore, the impact on profit or loss is primarily attributable to the discounting effect of the foreign exchange gains and losses on the hedging derivatives.
(^) Represents the impact relating to the unhedged portion of forecast transactions that would affect profit or loss. In financial year 2012, adverse and favourable impacts included $1 million relating to purchases of property, plant and equipment, which would affect the cost of the asset and profit or loss as the assets are depreciated over their useful lives.
(**) Relates to the translation of the net assets of our foreign controlled entities, including the impact of hedging. The net gain or loss in the sensitivity analysis represents the impact relating to the unhedged portion of the net assets of our foreign controlled entities.
18. FINANCIAL RISK MANAGEMENT (CONTINUED)
Table C Telstra Group10% adverse movement 10% favourable movement
Net profit or loss
Equity (foreign currency
translation reserve)
Equity (cash flow hedging
reserve)Net profit or
loss
Equity (foreign currency
translation reserve)
Equity (cash flow hedging
reserve)Year ended
30 June As at 30 June As at 30 JuneYear ended
30 June As at 30 June As at 30 JuneGain/(loss) Gain/(loss) Gain/(loss) Gain/(loss) Gain/(loss) Gain/(loss)2013 2012 2013 2012 2013 2012 2013 2012 2013 2012 2013 2012
$m $m $m $m $m $m $m $m $m $m $m $mRevaluation of derivatives and borrowings - de-designated from fair value hedges or not in a hedge relationship (*) . . . . . . . (8) (10) - - - - 10 12 - - - -Revaluation of derivatives and underlying exposure - cash flow hedges of forecast transactions (^) . . . . . . . (19) (19) - - - - 15 18 - - - -Revaluation of derivatives - cash flow hedges of offshore loans . . . . . . . . . . . . - - - - (33) (32) - - - - 41 40Net foreign investments (**) - - (72) (106) - - - - 88 130 - -
(27) (29) (72) (106) (33) (32) 25 30 88 130 41 40
NOTES TO THE FINANCIAL STATEMENTS (CONTINUED)
134 Telstra Annual Report 2013 Telstra Corporation Limited and controlled entities
a) Risk and mitigation (continued)
Credit risk
Credit risk is the risk that a contracting entity will not complete its obligations under a financial instrument and will cause us to incur a financial loss. We have exposure to credit risk on all financial assets included in our statement of financial position, comprising cash and cash equivalents, trade and other receivables, loan receivables, available-for-sale financial assets, finance lease receivables and derivative financial instruments. To help manage this risk:
• we have a policy for performing credit risk assessments on new and existing customers and, where required, establishing credit limits and payment terms for entities we deal with;
• we monitor exposure to high risk debtors on a predictive and proactive basis;
• we may require collateral where appropriate; and• we manage exposure to individual entities we either transact with
or enter into derivative contracts with, through a system of credit limits.
Where entities have a right of set-off and intend to settle on a net basis, this set-off has been recognised in the financial statements on a net basis. We may also be subject to credit risk for transactions not included in the statement of financial position, such as when we provide a guarantee for another party. Details of our contingent liabilities are disclosed in note 23 and note 30.
Trade and other receivables consist of a large number of customers, spread across the consumer, business, enterprise, government and international sectors. We do not have any significant credit risk exposure to a single customer or groups of customers. Ageing analysis and ongoing credit evaluation are performed on the financial condition of our customers and, where appropriate, an allowance for doubtful debts is raised. In addition, receivable balances are monitored on an ongoing basis so that our exposure to bad debts is not significant. For further details regarding our trade and other receivables refer to note 10.
In relation to our transactions in money market instruments, forward foreign currency contracts and cross currency and interest rate swaps, there is only a credit risk where the contracting entity is liable to pay us in the event of a closeout (i.e. in-the-money). We have policies that limit the amount of credit exposure to any financial institution. These risk limits are regularly monitored. Derivative counterparties and cash transactions are limited to financial institutions that meet minimum credit rating criteria in accordance with our policy requirements. Our credit risk and financial instruments are spread amongst a number of financial institutions.
One of the methods that we use to manage the credit risk exposure relating to these instruments is to monitor our exposure by country of financial institution based on a value at risk (VaR) methodology. VaR calculations are a technique that estimates the potential losses that could occur on risk positions in the future as a result of movements in market rates over a specified time horizon given a specified level of confidence which is statistically determined.
The amounts included in Table D below include the in-the-money market values combined with a potential credit calculation and will therefore not equate to the accounting carrying value, fair value or face value of the transactions as disclosed in note 17.
In determining the potential credit limit factors to be used in these calculations, the following should be noted:
• reference is made to the historical volatility factors relevant to the particular currencies/interest rates applicable to the instruments;
• in determining the volatility factors, reference has been made to the maturity of the instrument. In some cases, the transaction can have a maturity of up to 10 years and the potential volatility needs to reflect the possible movements over this time period given historical observations; and
• we have used 90 per cent (2012: 90 per cent) confidence levels to determine the applicable potential credit limit factors.
The VaR based methodology employed has the following limitations:
• the use of historical data as a proxy for estimating future events may not cover all potential events, in particular this is relevant when trying to estimate potential volatility over a long holding period such as 10 years; and
• the use of a 90 per cent confidence level, by definition, may not take into account movements that may occur outside of this confidence threshold.
18. FINANCIAL RISK MANAGEMENT (CONTINUED)
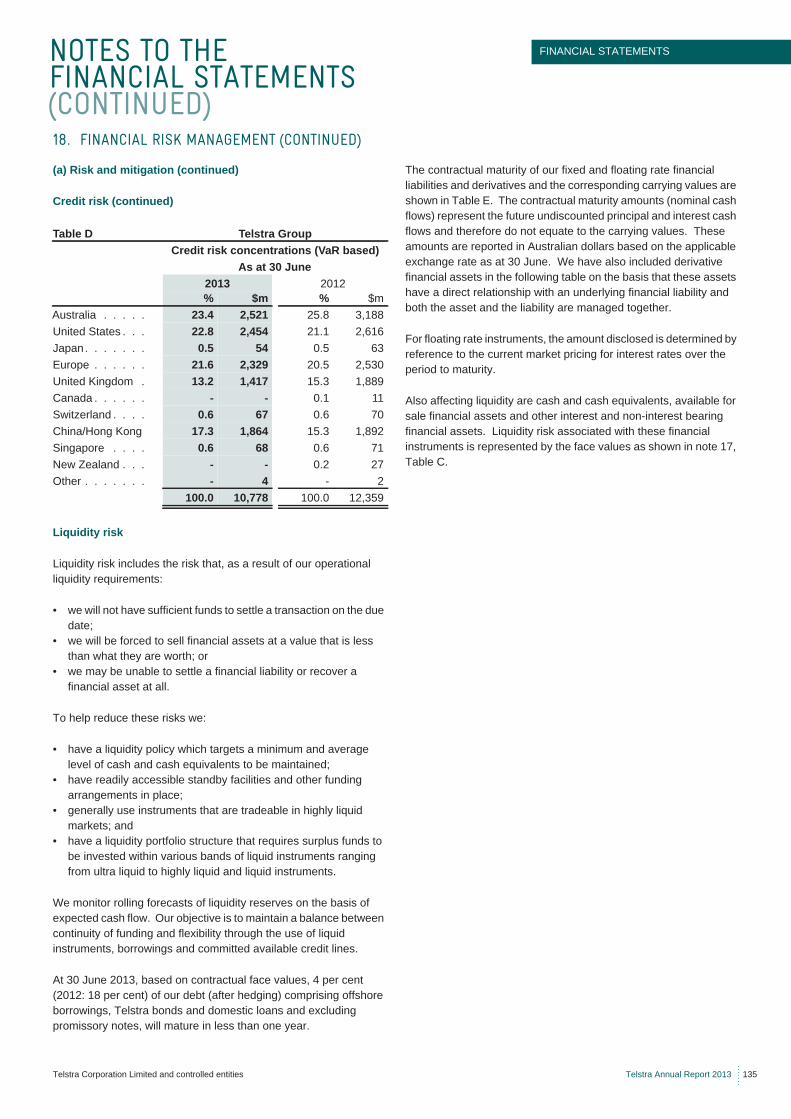
NOTES TO THE FINANCIAL STATEMENTS (CONTINUED)
FINANCIAL STATEMENTS
Telstra Corporation Limited and controlled entities Telstra Annual Report 2013 135
(a) Risk and mitigation (continued)
Credit risk (continued)
Liquidity risk
Liquidity risk includes the risk that, as a result of our operational liquidity requirements:
• we will not have sufficient funds to settle a transaction on the due date;
• we will be forced to sell financial assets at a value that is less than what they are worth; or
• we may be unable to settle a financial liability or recover a financial asset at all.
To help reduce these risks we:
• have a liquidity policy which targets a minimum and average level of cash and cash equivalents to be maintained;
• have readily accessible standby facilities and other funding arrangements in place;
• generally use instruments that are tradeable in highly liquid markets; and
• have a liquidity portfolio structure that requires surplus funds to be invested within various bands of liquid instruments ranging from ultra liquid to highly liquid and liquid instruments.
We monitor rolling forecasts of liquidity reserves on the basis of expected cash flow. Our objective is to maintain a balance between continuity of funding and flexibility through the use of liquid instruments, borrowings and committed available credit lines.
At 30 June 2013, based on contractual face values, 4 per cent (2012: 18 per cent) of our debt (after hedging) comprising offshore borrowings, Telstra bonds and domestic loans and excluding promissory notes, will mature in less than one year.
The contractual maturity of our fixed and floating rate financial liabilities and derivatives and the corresponding carrying values are shown in Table E. The contractual maturity amounts (nominal cash flows) represent the future undiscounted principal and interest cash flows and therefore do not equate to the carrying values. These amounts are reported in Australian dollars based on the applicable exchange rate as at 30 June. We have also included derivative financial assets in the following table on the basis that these assets have a direct relationship with an underlying financial liability and both the asset and the liability are managed together.
For floating rate instruments, the amount disclosed is determined by reference to the current market pricing for interest rates over the period to maturity.
Also affecting liquidity are cash and cash equivalents, available for sale financial assets and other interest and non-interest bearing financial assets. Liquidity risk associated with these financial instruments is represented by the face values as shown in note 17, Table C.
18. FINANCIAL RISK MANAGEMENT (CONTINUED)
Table D Telstra GroupCredit risk concentrations (VaR based)
As at 30 June2013 2012% $m % $m
Australia . . . . . 23.4 2,521 25.8 3,188United States . . . 22.8 2,454 21.1 2,616Japan. . . . . . . 0.5 54 0.5 63Europe . . . . . . 21.6 2,329 20.5 2,530United Kingdom . 13.2 1,417 15.3 1,889Canada . . . . . . - - 0.1 11Switzerland . . . . 0.6 67 0.6 70China/Hong Kong 17.3 1,864 15.3 1,892Singapore . . . . 0.6 68 0.6 71New Zealand . . . - - 0.2 27Other . . . . . . . - 4 - 2
100.0 10,778 100.0 12,359
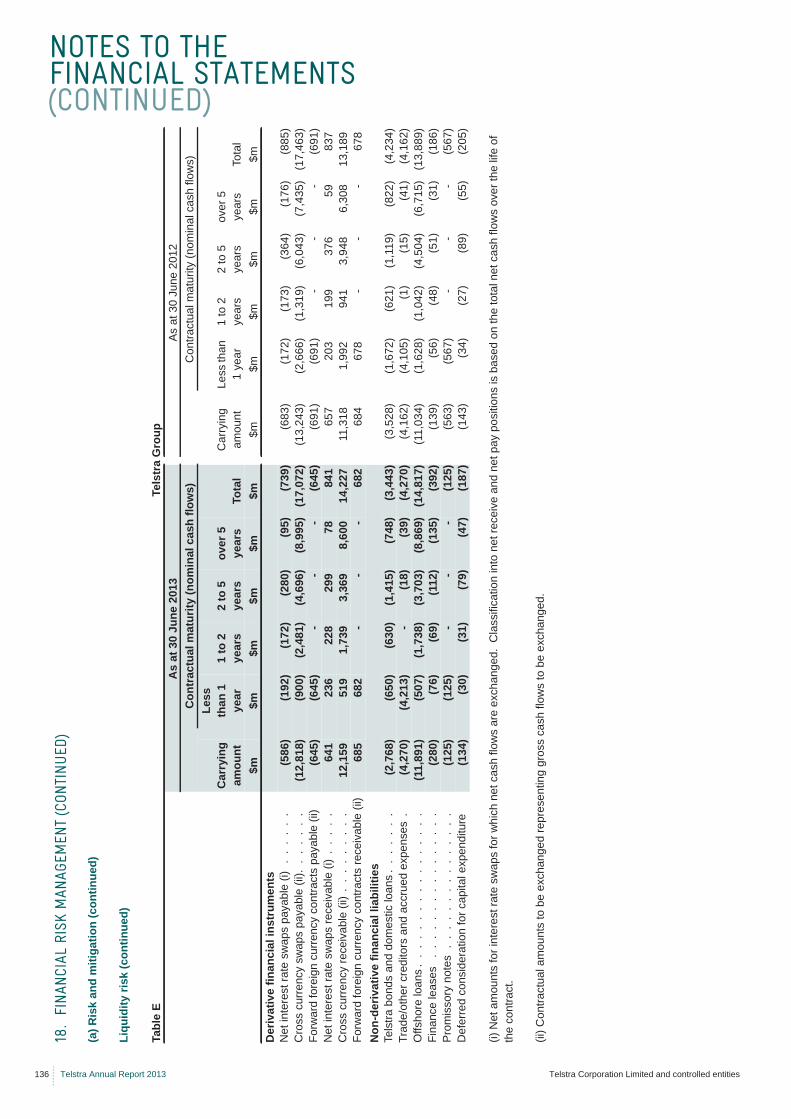
NOTES TO THE FINANCIAL STATEMENTS (CONTINUED)
136 Telstra Annual Report 2013 Telstra Corporation Limited and controlled entities
(a) R
isk
and
miti
gatio
n (c
ontin
ued)
Liqu
idity
risk
(con
tinue
d)
(i) N
et a
mou
nts
for i
nter
est r
ate
swap
s fo
r whi
ch n
et c
ash
flow
s ar
e ex
chan
ged.
Cla
ssifi
catio
n in
to n
et re
ceiv
e an
d ne
t pay
pos
ition
s is
bas
ed o
n th
e to
tal n
et c
ash
flow
s ov
er th
e lif
e of
th
e co
ntra
ct.
(ii) C
ontra
ctua
l am
ount
s to
be
exch
ange
d re
pres
entin
g gr
oss
cash
flow
s to
be
exch
ange
d.
18.
FINA
NCIA
L RI
SK M
ANAG
EMEN
T (C
ONTI
NUED
)
Tabl
e E
Tels
tra
Gro
upA
s at
30
June
201
3A
s at
30
June
201
2C
ontr
actu
al m
atur
ity (n
omin
al c
ash
flow
s)C
ontra
ctua
l mat
urity
(nom
inal
cas
h flo
ws)
Car
ryin
g am
ount
Less
th
an 1
ye
ar1
to 2
ye
ars
2 to
5
year
sov
er 5
ye
ars
Tota
l C
arry
ing
amou
ntLe
ss th
an
1 ye
ar1
to 2
ye
ars
2 to
5
year
sov
er 5
ye
ars
Tota
l$m
$m$m
$m$m
$m$m
$m$m
$m$m
$mD
eriv
ativ
e fin
anci
al in
stru
men
tsN
et in
tere
st ra
te s
wap
s pa
yabl
e (i)
. .
. .
. .
(586
)(1
92)
(172
)(2
80)
(95)
(739
)(6
83)
(172
)(1
73)
(364
)(1
76)
(885
)C
ross
cur
renc
y sw
aps
paya
ble
(ii).
. .
. .
. .
(12,
818)
(900
)(2
,481
)(4
,696
)(8
,995
)(1
7,07
2)(1
3,24
3)(2
,666
)(1
,319
)(6
,043
)(7
,435
)(1
7,46
3)Fo
rwar
d fo
reig
n cu
rren
cy c
ontra
cts
paya
ble
(ii)
(645
)(6
45)
--
-(6
45)
(691
)(6
91)
--
-(6
91)
Net
inte
rest
rate
sw
aps
rece
ivab
le (i
) .
. .
. .
641
236
228
299
7884
165
720
319
937
659
837
Cro
ss c
urre
ncy
rece
ivab
le (i
i) .
. .
. .
. .
. .
12,1
5951
91,
739
3,36
98,
600
14,2
2711
,318
1,99
294
13,
948
6,30
813
,189
Forw
ard
fore
ign
curr
ency
con
tract
s re
ceiv
able
(ii)
685
682
--
-68
268
467
8-
--
678
Non
-der
ivat
ive
finan
cial
liab
ilitie
sTe
lstra
bon
ds a
nd d
omes
tic lo
ans
. .
. .
. .
.(2
,768
)(6
50)
(630
)(1
,415
)(7
48)
(3,4
43)
(3,5
28)
(1,6
72)
(621
)(1
,119
)(8
22)
(4,2
34)
Trad
e/ot
her c
redi
tors
and
acc
rued
exp
ense
s .
(4,2
70)
(4,2
13)
-(1
8)(3
9)(4
,270
)(4
,162
)(4
,105
)(1
)(1
5)(4
1)(4
,162
)O
ffsho
re lo
ans
. .
. .
. .
. .
. .
. .
. .
. .
.(1
1,89
1)(5
07)
(1,7
38)
(3,7
03)
(8,8
69)
(14,
817)
(11,
034)
(1,6
28)
(1,0
42)
(4,5
04)
(6,7
15)
(13,
889)
Fina
nce
leas
es .
. .
. .
. .
. .
. .
. .
. .
.(2
80)
(76)
(69)
(112
)(1
35)
(392
)(1
39)
(56)
(48)
(51)
(31)
(186
)P
rom
isso
ry n
otes
. .
. .
. .
. .
. .
. .
. .
.(1
25)
(125
)-
--
(125
)(5
63)
(567
)-
--
(567
)D
efer
red
cons
ider
atio
n fo
r cap
ital e
xpen
ditu
re(1
34)
(30)
(31)
(79)
(47)
(187
)(1
43)
(34)
(27)
(89)
(55)
(205
)
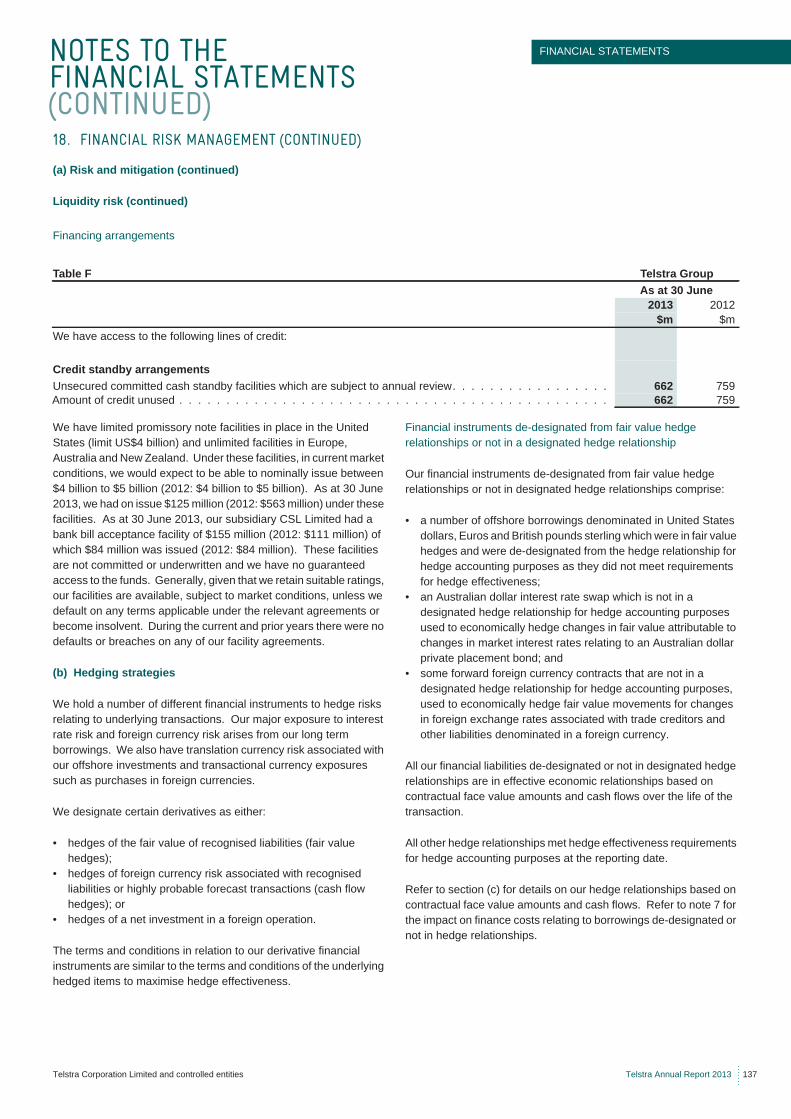
NOTES TO THE FINANCIAL STATEMENTS (CONTINUED)
FINANCIAL STATEMENTS
Telstra Corporation Limited and controlled entities Telstra Annual Report 2013 137
(a) Risk and mitigation (continued)
Liquidity risk (continued)
Financing arrangements
We have limited promissory note facilities in place in the United States (limit US$4 billion) and unlimited facilities in Europe, Australia and New Zealand. Under these facilities, in current market conditions, we would expect to be able to nominally issue between $4 billion to $5 billion (2012: $4 billion to $5 billion). As at 30 June 2013, we had on issue $125 million (2012: $563 million) under these facilities. As at 30 June 2013, our subsidiary CSL Limited had a bank bill acceptance facility of $155 million (2012: $111 million) of which $84 million was issued (2012: $84 million). These facilities are not committed or underwritten and we have no guaranteed access to the funds. Generally, given that we retain suitable ratings, our facilities are available, subject to market conditions, unless we default on any terms applicable under the relevant agreements or become insolvent. During the current and prior years there were no defaults or breaches on any of our facility agreements.
(b) Hedging strategies
We hold a number of different financial instruments to hedge risks relating to underlying transactions. Our major exposure to interest rate risk and foreign currency risk arises from our long term borrowings. We also have translation currency risk associated with our offshore investments and transactional currency exposures such as purchases in foreign currencies.
We designate certain derivatives as either:
• hedges of the fair value of recognised liabilities (fair value hedges);
• hedges of foreign currency risk associated with recognised liabilities or highly probable forecast transactions (cash flow hedges); or
• hedges of a net investment in a foreign operation.
The terms and conditions in relation to our derivative financial instruments are similar to the terms and conditions of the underlying hedged items to maximise hedge effectiveness.
Financial instruments de-designated from fair value hedge relationships or not in a designated hedge relationship
Our financial instruments de-designated from fair value hedge relationships or not in designated hedge relationships comprise:
• a number of offshore borrowings denominated in United States dollars, Euros and British pounds sterling which were in fair value hedges and were de-designated from the hedge relationship for hedge accounting purposes as they did not meet requirements for hedge effectiveness;
• an Australian dollar interest rate swap which is not in a designated hedge relationship for hedge accounting purposes used to economically hedge changes in fair value attributable to changes in market interest rates relating to an Australian dollar private placement bond; and
• some forward foreign currency contracts that are not in a designated hedge relationship for hedge accounting purposes, used to economically hedge fair value movements for changes in foreign exchange rates associated with trade creditors and other liabilities denominated in a foreign currency.
All our financial liabilities de-designated or not in designated hedge relationships are in effective economic relationships based on contractual face value amounts and cash flows over the life of the transaction.
All other hedge relationships met hedge effectiveness requirements for hedge accounting purposes at the reporting date.
Refer to section (c) for details on our hedge relationships based on contractual face value amounts and cash flows. Refer to note 7 for the impact on finance costs relating to borrowings de-designated or not in hedge relationships.
18. FINANCIAL RISK MANAGEMENT (CONTINUED)
Table F Telstra GroupAs at 30 June
2013 2012$m $m
We have access to the following lines of credit:
Credit standby arrangementsUnsecured committed cash standby facilities which are subject to annual review. . . . . . . . . . . . . . . . . 662 759Amount of credit unused . . . . . . . . . . . . . . . . . . . . . . . . . . . . . . . . . . . . . . . . . . . . . . 662 759
NOTES TO THE FINANCIAL STATEMENTS (CONTINUED)
138 Telstra Annual Report 2013 Telstra Corporation Limited and controlled entities
(b) Hedging strategies (continued)
Fair value hedges
We hold cross currency principal and interest rate swaps to mitigate our exposure to changes in the fair value of foreign denominated debt from fluctuations in foreign currency and interest rates. The hedged items designated are a portion of our foreign currency denominated borrowings. The changes in the fair values of the hedged items resulting from movements in exchange rates and interest rates are offset against the changes in the fair value of the cross currency and interest rate swaps. The objective of this hedging is to convert foreign currency borrowings to floating Australian dollar borrowings.
The net impact on finance costs from remeasuring the fair value of the hedge instruments together with the gains and losses in relation to the hedged item where those gains or losses relate to the hedged risks largely represents ineffectiveness attributable to movements in Telstra’s borrowing margins.
The remeasurement of the hedged items resulted in a loss before tax of $599 million (2012: loss of $208 million) and the changes in the fair value of the hedging instruments resulted in a gain before tax of $504 million (2012: gain of $199 million). This results in a net loss before tax of $95 million and a net loss after tax of $67 million (2012: net loss before tax of $9 million and net loss after tax of $6 million).
Refer to note 7 for the impact on finance costs relating to borrowings in fair value hedges.
The effectiveness of the hedging relationship is tested prospectively, both on inception and in subsequent periods, and retrospectively by means of statistical methods using a regression analysis. Regression analysis is used to analyse the relationship between the derivative financial instruments (the dependent variable) and the underlying borrowings (the independent variable). The primary objective is to determine if changes to the hedged item and derivative are highly correlated and, thus, supportive of the assertion that there will be a high degree of offset in fair values achieved by the hedge.
Refer to note 17, Table G and Table H, for the value of our derivatives designated as fair value hedges.
Cash flow hedges
Cash flow hedges are predominantly used to hedge exposures relating to our borrowings and our ongoing business activities where we have highly probable purchase or settlement commitments in foreign currencies.
We enter into cross currency and interest rate swaps as cash flow hedges of future payments denominated in foreign currency resulting from our long term offshore borrowings. The hedged items designated are a portion of the outflows associated with these foreign denominated borrowings. The objective of this hedging is to hedge foreign currency risks arising from spot rate changes and thereby mitigate the risk of payment fluctuations as a result of exchange rate movements.
We also enter into forward exchange contracts as cash flow hedges to hedge forecast transactions denominated in foreign currency which hedge foreign currency risk arising from spot rate changes. The hedged items comprise a portion of highly probable forecast payments for operating and capital items primarily denominated in United States dollars.
The effectiveness of the hedging relationship relating to our borrowings is tested prospectively, both on inception and in subsequent periods, and retrospectively by means of statistical methods using a regression analysis. The actual derivative financial instruments in a cash flow hedge are regressed against a hypothetical derivative. The primary objective is to determine if changes to the hedged item and derivative are highly correlated and, thus, supportive of the assertion that there will be a high degree of offset in cash flows achieved by the hedge.
The effectiveness of our hedges relating to highly probable forecast transactions is assessed prospectively based on matching of critical terms. As both the nominal volumes and currencies of the hedged item and the hedging instrument are identical, a highly effective hedging relationship is expected. An effectiveness test is carried out retrospectively using the cumulative dollar-offset method. For this, the changes in the fair values of the hedging instrument and the hedged item attributable to exchange rate changes are calculated and a ratio is created. If this ratio is between 80 and 125, the hedge is effective.
In relation to our offshore borrowings, ineffectiveness on our cash flow hedges is recognised in the income statement to the extent that the change in the fair value of the hedging derivatives in the cash flow hedge exceed the change in value of the underlying borrowings in the cash flow hedge during the hedging period. During the year, there was no material ineffectiveness attributable to our cash flow hedges (refer to note 7). Also during the year, there was no material impact on profit or loss as a result of discontinuing hedge accounting for forecast transactions no longer expected to occur.
For hedge gains or losses transferred to and from the cash flow hedging reserve refer to the statement of comprehensive income.
Refer to note 17, Table G and Table H, for the value of our derivatives designated as cash flow hedges.
18. FINANCIAL RISK MANAGEMENT (CONTINUED)
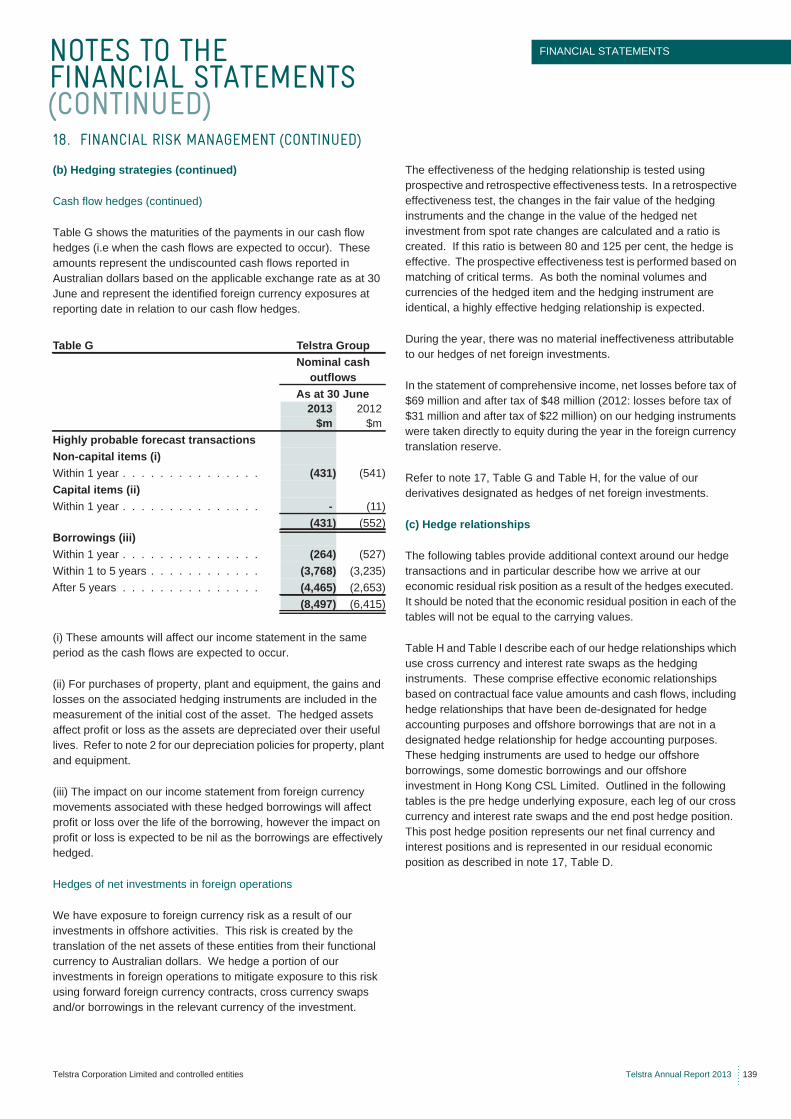
NOTES TO THE FINANCIAL STATEMENTS (CONTINUED)
FINANCIAL STATEMENTS
Telstra Corporation Limited and controlled entities Telstra Annual Report 2013 139
(b) Hedging strategies (continued)
Cash flow hedges (continued)
Table G shows the maturities of the payments in our cash flow hedges (i.e when the cash flows are expected to occur). These amounts represent the undiscounted cash flows reported in Australian dollars based on the applicable exchange rate as at 30 June and represent the identified foreign currency exposures at reporting date in relation to our cash flow hedges.
(i) These amounts will affect our income statement in the same period as the cash flows are expected to occur.
(ii) For purchases of property, plant and equipment, the gains and losses on the associated hedging instruments are included in the measurement of the initial cost of the asset. The hedged assets affect profit or loss as the assets are depreciated over their useful lives. Refer to note 2 for our depreciation policies for property, plant and equipment.
(iii) The impact on our income statement from foreign currency movements associated with these hedged borrowings will affect profit or loss over the life of the borrowing, however the impact on profit or loss is expected to be nil as the borrowings are effectively hedged.
Hedges of net investments in foreign operations
We have exposure to foreign currency risk as a result of our investments in offshore activities. This risk is created by the translation of the net assets of these entities from their functional currency to Australian dollars. We hedge a portion of our investments in foreign operations to mitigate exposure to this risk using forward foreign currency contracts, cross currency swaps and/or borrowings in the relevant currency of the investment.
The effectiveness of the hedging relationship is tested using prospective and retrospective effectiveness tests. In a retrospective effectiveness test, the changes in the fair value of the hedging instruments and the change in the value of the hedged net investment from spot rate changes are calculated and a ratio is created. If this ratio is between 80 and 125 per cent, the hedge is effective. The prospective effectiveness test is performed based on matching of critical terms. As both the nominal volumes and currencies of the hedged item and the hedging instrument are identical, a highly effective hedging relationship is expected.
During the year, there was no material ineffectiveness attributable to our hedges of net foreign investments.
In the statement of comprehensive income, net losses before tax of $69 million and after tax of $48 million (2012: losses before tax of $31 million and after tax of $22 million) on our hedging instruments were taken directly to equity during the year in the foreign currency translation reserve.
Refer to note 17, Table G and Table H, for the value of our derivatives designated as hedges of net foreign investments.
(c) Hedge relationships
The following tables provide additional context around our hedge transactions and in particular describe how we arrive at our economic residual risk position as a result of the hedges executed. It should be noted that the economic residual position in each of the tables will not be equal to the carrying values.
Table H and Table I describe each of our hedge relationships which use cross currency and interest rate swaps as the hedging instruments. These comprise effective economic relationships based on contractual face value amounts and cash flows, including hedge relationships that have been de-designated for hedge accounting purposes and offshore borrowings that are not in a designated hedge relationship for hedge accounting purposes. These hedging instruments are used to hedge our offshore borrowings, some domestic borrowings and our offshore investment in Hong Kong CSL Limited. Outlined in the following tables is the pre hedge underlying exposure, each leg of our cross currency and interest rate swaps and the end post hedge position. This post hedge position represents our net final currency and interest positions and is represented in our residual economic position as described in note 17, Table D.
18. FINANCIAL RISK MANAGEMENT (CONTINUED)
Table G Telstra GroupNominal cash
outflowsAs at 30 June
2013 2012$m $m
Highly probable forecast transactionsNon-capital items (i)Within 1 year . . . . . . . . . . . . . . . (431) (541)Capital items (ii)Within 1 year . . . . . . . . . . . . . . . - (11)
(431) (552)Borrowings (iii)Within 1 year . . . . . . . . . . . . . . . (264) (527)Within 1 to 5 years . . . . . . . . . . . . (3,768) (3,235)After 5 years . . . . . . . . . . . . . . . (4,465) (2,653)
(8,497) (6,415)
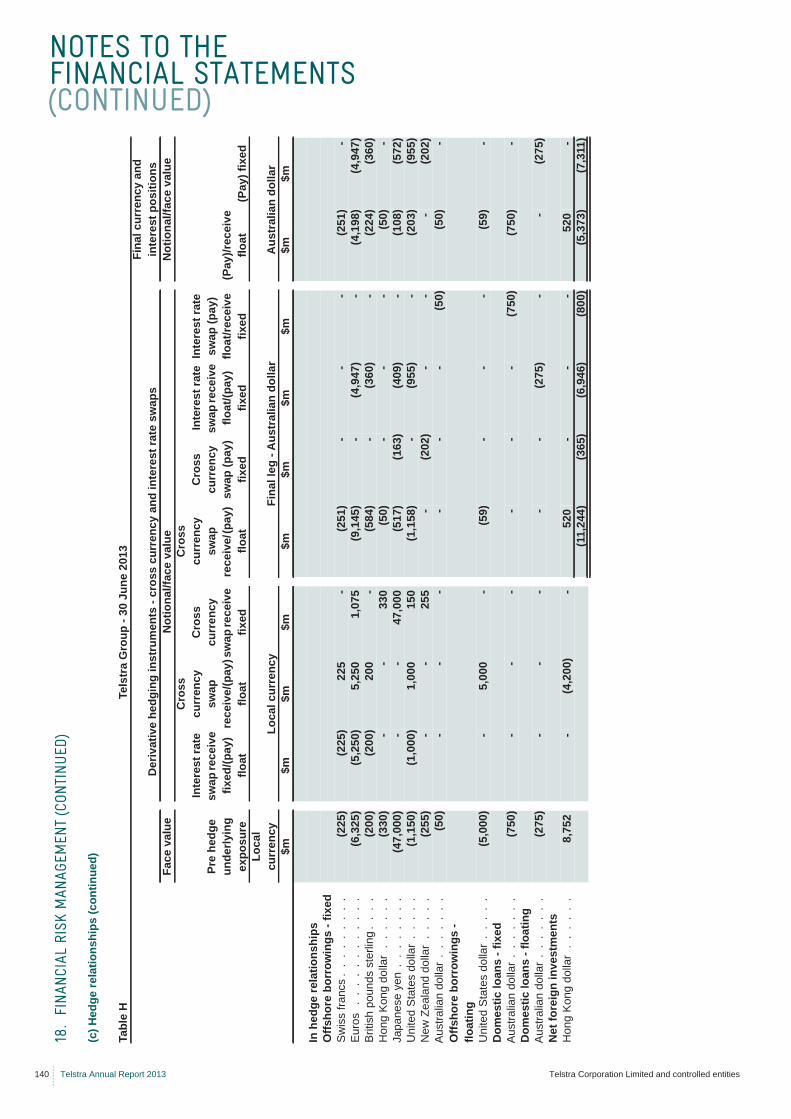
NOTES TO THE FINANCIAL STATEMENTS (CONTINUED)
140 Telstra Annual Report 2013 Telstra Corporation Limited and controlled entities
(c) H
edge
rela
tions
hips
(con
tinue
d)
18.
FINA
NCIA
L RI
SK M
ANAG
EMEN
T (C
ONTI
NUED
)
Tabl
e H
Tels
tra
Gro
up -
30 J
une
2013
Der
ivat
ive
hedg
ing
inst
rum
ents
- cr
oss
curr
ency
and
inte
rest
rate
sw
aps
Fina
l cur
renc
y an
d in
tere
st p
ositi
ons
Face
val
ueN
otio
nal/f
ace
valu
eN
otio
nal/f
ace
valu
e
Pre
hedg
e un
derly
ing
expo
sure
Inte
rest
rate
sw
ap re
ceiv
e fix
ed/(p
ay)
float
Cro
ss
curr
ency
sw
ap
rece
ive/
(pay
) flo
at
Cro
ss
curr
ency
sw
ap re
ceiv
e fix
ed
Cro
ss
curr
ency
sw
ap
rece
ive/
(pay
) flo
at
Cro
ss
curr
ency
sw
ap (p
ay)
fixed
Inte
rest
rate
sw
ap re
ceiv
e flo
at/(p
ay)
fixed
Inte
rest
rate
sw
ap (p
ay)
float
/rece
ive
fixed
(Pay
)/rec
eive
flo
at(P
ay) f
ixed
Loca
l cu
rren
cyLo
cal c
urre
ncy
Fina
l leg
- A
ustr
alia
n do
llar
Aus
tral
ian
dolla
r$m
$m$m
$m$m
$m$m
$m$m
$m
In h
edge
rela
tions
hips
Offs
hore
bor
row
ings
- fix
edS
wis
s fra
ncs
. .
. .
. .
. .
.(2
25)
(225
)22
5-
(251
)-
--
(251
)-
Eur
os .
. .
. .
. .
. .
. .
.(6
,325
)(5
,250
)5,
250
1,07
5(9
,145
)-
(4,9
47)
-(4
,198
)(4
,947
)B
ritis
h po
unds
ste
rling
. .
. .
(200
)(2
00)
200
-(5
84)
-(3
60)
-(2
24)
(360
)H
ong
Kon
g do
llar
. .
. .
. .
(330
)-
-33
0(5
0)-
--
(50)
-Ja
pane
se y
en .
. .
. .
. .
.(4
7,00
0)-
-47
,000
(517
)(1
63)
(409
)-
(108
)(5
72)
Uni
ted
Sta
tes
dolla
r .
. .
. .
(1,1
50)
(1,0
00)
1,00
015
0(1
,158
)-
(955
)-
(203
)(9
55)
New
Zea
land
dol
lar
. .
. .
.(2
55)
--
255
-(2
02)
--
-(2
02)
Aus
tralia
n do
llar
. .
. .
. .
.(5
0)-
--
--
-(5
0)(5
0)-
Offs
hore
bor
row
ings
- flo
atin
gU
nite
d S
tate
s do
llar
. .
. .
.(5
,000
)-
5,00
0-
(59)
--
-(5
9)-
Dom
estic
loan
s - f
ixed
Aus
tralia
n do
llar
. .
. .
. .
.(7
50)
--
--
--
(750
)(7
50)
-D
omes
tic lo
ans
- flo
atin
gA
ustra
lian
dolla
r .
. .
. .
. .
(275
)-
--
--
(275
)-
-(2
75)
Net
fore
ign
inve
stm
ents
Hon
g K
ong
dolla
r .
. .
. .
.8,
752
-(4
,200
)-
520
--
-52
0-
(11,
244)
(365
)(6
,946
)(8
00)
(5,3
73)
(7,3
11)
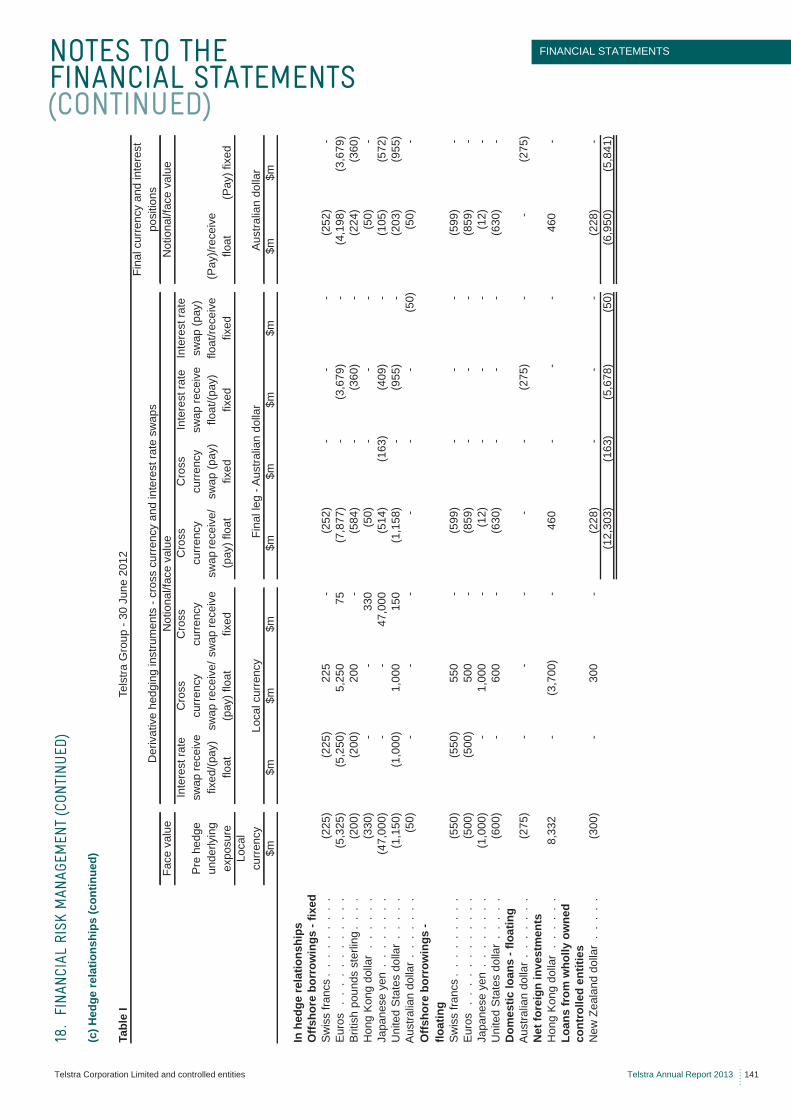
NOTES TO THE FINANCIAL STATEMENTS (CONTINUED)
FINANCIAL STATEMENTS
Telstra Corporation Limited and controlled entities Telstra Annual Report 2013 141
(c) H
edge
rela
tions
hips
(con
tinue
d)
18.
FINA
NCIA
L RI
SK M
ANAG
EMEN
T (C
ONTI
NUED
)
Tabl
e I
Tels
tra G
roup
- 30
Jun
e 20
12
Der
ivat
ive
hedg
ing
inst
rum
ents
- cr
oss
curr
ency
and
inte
rest
rate
sw
aps
Fina
l cur
renc
y an
d in
tere
st
posi
tions
Face
val
ueN
otio
nal/f
ace
valu
eN
otio
nal/f
ace
valu
e
Pre
hed
ge
unde
rlyin
g ex
posu
re
Inte
rest
rate
sw
ap re
ceiv
e fix
ed/(p
ay)
float
Cro
ss
curr
ency
sw
ap re
ceiv
e/(p
ay) f
loat
Cro
ss
curr
ency
sw
ap re
ceiv
e fix
ed
Cro
ss
curr
ency
sw
ap re
ceiv
e/
(pay
) flo
at
Cro
ss
curr
ency
sw
ap (p
ay)
fixed
Inte
rest
rate
sw
ap re
ceiv
e flo
at/(p
ay)
fixed
Inte
rest
rate
sw
ap (p
ay)
float
/rece
ive
fixed
(Pay
)/rec
eive
flo
at(P
ay) f
ixed
Loca
l cu
rren
cyLo
cal c
urre
ncy
Fina
l leg
- A
ustra
lian
dolla
rA
ustra
lian
dolla
r$m
$m$m
$m$m
$m$m
$m$m
$m
In h
edge
rela
tions
hips
Offs
hore
bor
row
ings
- fix
edS
wis
s fra
ncs
. .
. .
. .
. .
.(2
25)
(225
)22
5-
(252
)-
--
(252
)-
Eur
os .
. .
. .
. .
. .
. .
.(5
,325
)(5
,250
)5,
250
75(7
,877
)-
(3,6
79)
-(4
,198
)(3
,679
)B
ritis
h po
unds
ste
rling
. .
. .
(200
)(2
00)
200
-(5
84)
-(3
60)
-(2
24)
(360
)H
ong
Kon
g do
llar
. .
. .
. .
(330
)-
-33
0(5
0)-
--
(50)
-Ja
pane
se y
en .
. .
. .
. .
.(4
7,00
0)-
-47
,000
(514
)(1
63)
(409
)-
(105
)(5
72)
Uni
ted
Sta
tes
dolla
r .
. .
. .
(1,1
50)
(1,0
00)
1,00
015
0(1
,158
)-
(955
)-
(203
)(9
55)
Aus
tralia
n do
llar
. .
. .
. .
.(5
0)-
--
--
-(5
0)(5
0)-
Offs
hore
bor
row
ings
- flo
atin
gS
wis
s fra
ncs
. .
. .
. .
. .
.(5
50)
(550
)55
0-
(599
)-
--
(599
)-
Eur
os .
. .
. .
. .
. .
. .
.(5
00)
(500
)50
0-
(859
)-
--
(859
)-
Japa
nese
yen
. .
. .
. .
. .
(1,0
00)
-1,
000
-(1
2)-
--
(12)
-U
nite
d S
tate
s do
llar
. .
. .
.(6
00)
-60
0-
(630
)-
--
(630
)-
Dom
estic
loan
s - f
loat
ing
Aus
tralia
n do
llar
. .
. .
. .
.(2
75)
--
--
-(2
75)
--
(275
)N
et fo
reig
n in
vest
men
tsH
ong
Kon
g do
llar
. .
. .
. .
8,33
2-
(3,7
00)
-46
0-
--
460
-Lo
ans
from
who
lly o
wne
d co
ntro
lled
entit
ies
New
Zea
land
dol
lar
. .
. .
.(3
00)
-30
0-
(228
)-
--
(228
)-
(12,
303)
(163
)(5
,678
)(5
0)(6
,950
)(5
,841
)
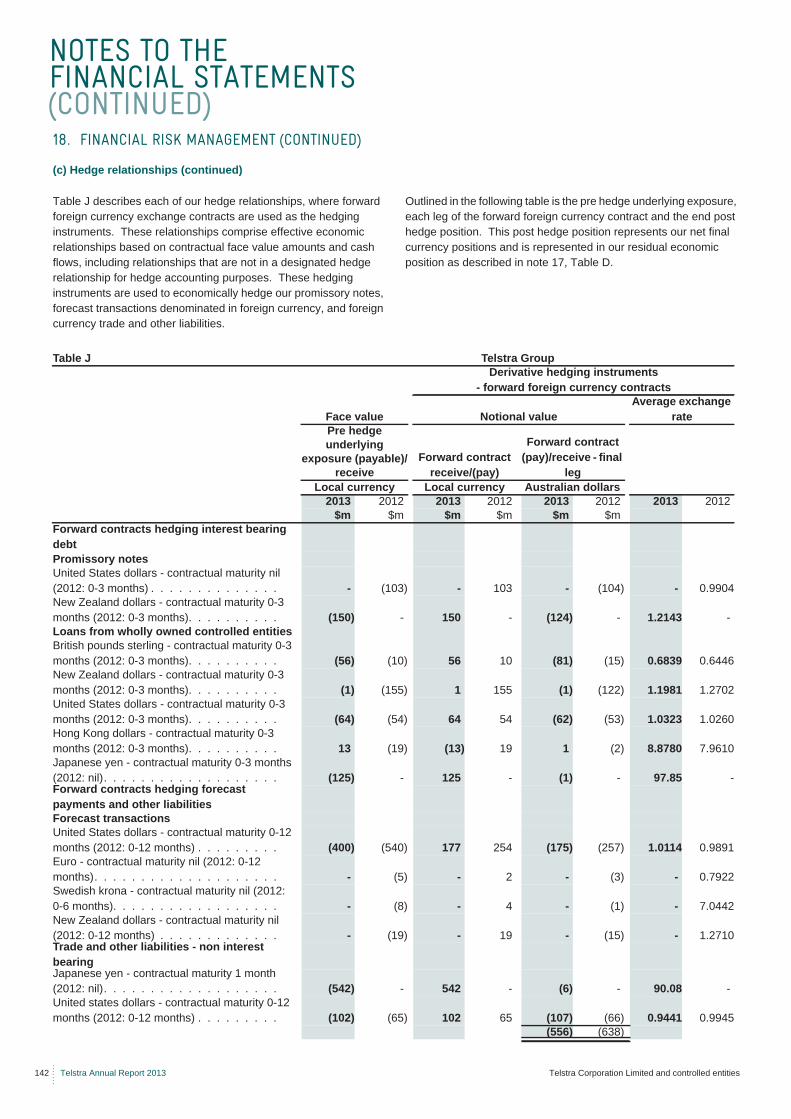
NOTES TO THE FINANCIAL STATEMENTS (CONTINUED)
142 Telstra Annual Report 2013 Telstra Corporation Limited and controlled entities
(c) Hedge relationships (continued)
Table J describes each of our hedge relationships, where forward foreign currency exchange contracts are used as the hedging instruments. These relationships comprise effective economic relationships based on contractual face value amounts and cash flows, including relationships that are not in a designated hedge relationship for hedge accounting purposes. These hedging instruments are used to economically hedge our promissory notes, forecast transactions denominated in foreign currency, and foreign currency trade and other liabilities.
Outlined in the following table is the pre hedge underlying exposure, each leg of the forward foreign currency contract and the end post hedge position. This post hedge position represents our net final currency positions and is represented in our residual economic position as described in note 17, Table D.
18. FINANCIAL RISK MANAGEMENT (CONTINUED)
Table J Telstra GroupDerivative hedging instruments
- forward foreign currency contracts
Face value Notional valueAverage exchange
ratePre hedge underlying
exposure (payable)/receive
Forward contract receive/(pay)
Forward contract (pay)/receive - final
legLocal currency Local currency Australian dollars
2013 2012 2013 2012 2013 2012 2013 2012$m $m $m $m $m $m
Forward contracts hedging interest bearing debtPromissory notesUnited States dollars - contractual maturity nil (2012: 0-3 months) . . . . . . . . . . . . . . - (103) - 103 - (104) - 0.9904New Zealand dollars - contractual maturity 0-3 months (2012: 0-3 months). . . . . . . . . . (150) - 150 - (124) - 1.2143 -Loans from wholly owned controlled entitiesBritish pounds sterling - contractual maturity 0-3 months (2012: 0-3 months). . . . . . . . . . (56) (10) 56 10 (81) (15) 0.6839 0.6446New Zealand dollars - contractual maturity 0-3 months (2012: 0-3 months). . . . . . . . . . (1) (155) 1 155 (1) (122) 1.1981 1.2702United States dollars - contractual maturity 0-3 months (2012: 0-3 months). . . . . . . . . . (64) (54) 64 54 (62) (53) 1.0323 1.0260Hong Kong dollars - contractual maturity 0-3 months (2012: 0-3 months). . . . . . . . . . 13 (19) (13) 19 1 (2) 8.8780 7.9610Japanese yen - contractual maturity 0-3 months (2012: nil). . . . . . . . . . . . . . . . . . . (125) - 125 - (1) - 97.85 -Forward contracts hedging forecast payments and other liabilitiesForecast transactionsUnited States dollars - contractual maturity 0-12 months (2012: 0-12 months) . . . . . . . . . (400) (540) 177 254 (175) (257) 1.0114 0.9891Euro - contractual maturity nil (2012: 0-12 months). . . . . . . . . . . . . . . . . . . . - (5) - 2 - (3) - 0.7922Swedish krona - contractual maturity nil (2012: 0-6 months). . . . . . . . . . . . . . . . . . - (8) - 4 - (1) - 7.0442New Zealand dollars - contractual maturity nil (2012: 0-12 months) . . . . . . . . . . . . . - (19) - 19 - (15) - 1.2710Trade and other liabilities - non interest bearingJapanese yen - contractual maturity 1 month (2012: nil). . . . . . . . . . . . . . . . . . . (542) - 542 - (6) - 90.08 -United states dollars - contractual maturity 0-12 months (2012: 0-12 months) . . . . . . . . . (102) (65) 102 65 (107) (66) 0.9441 0.9945
(556) (638)
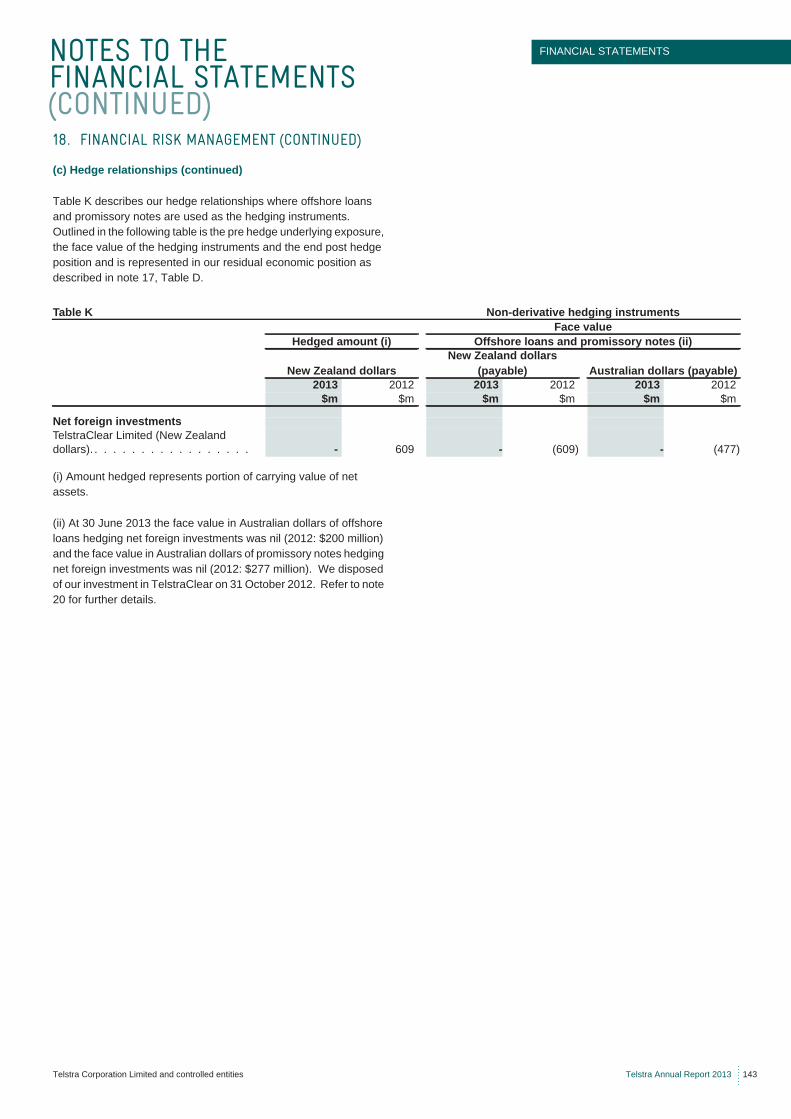
NOTES TO THE FINANCIAL STATEMENTS (CONTINUED)
FINANCIAL STATEMENTS
Telstra Corporation Limited and controlled entities Telstra Annual Report 2013 143
(c) Hedge relationships (continued)
Table K describes our hedge relationships where offshore loans and promissory notes are used as the hedging instruments. Outlined in the following table is the pre hedge underlying exposure, the face value of the hedging instruments and the end post hedge position and is represented in our residual economic position as described in note 17, Table D.
(i) Amount hedged represents portion of carrying value of net assets.
(ii) At 30 June 2013 the face value in Australian dollars of offshore loans hedging net foreign investments was nil (2012: $200 million) and the face value in Australian dollars of promissory notes hedging net foreign investments was nil (2012: $277 million). We disposed of our investment in TelstraClear on 31 October 2012. Refer to note 20 for further details.
18. FINANCIAL RISK MANAGEMENT (CONTINUED)
Table K Non-derivative hedging instrumentsFace value
Hedged amount (i) Offshore loans and promissory notes (ii)
New Zealand dollarsNew Zealand dollars
(payable) Australian dollars (payable)2013 2012 2013 2012 2013 2012
$m $m $m $m $m $m
Net foreign investmentsTelstraClear Limited (New Zealand dollars). . . . . . . . . . . . . . . . . . - 609 - (609) - (477)
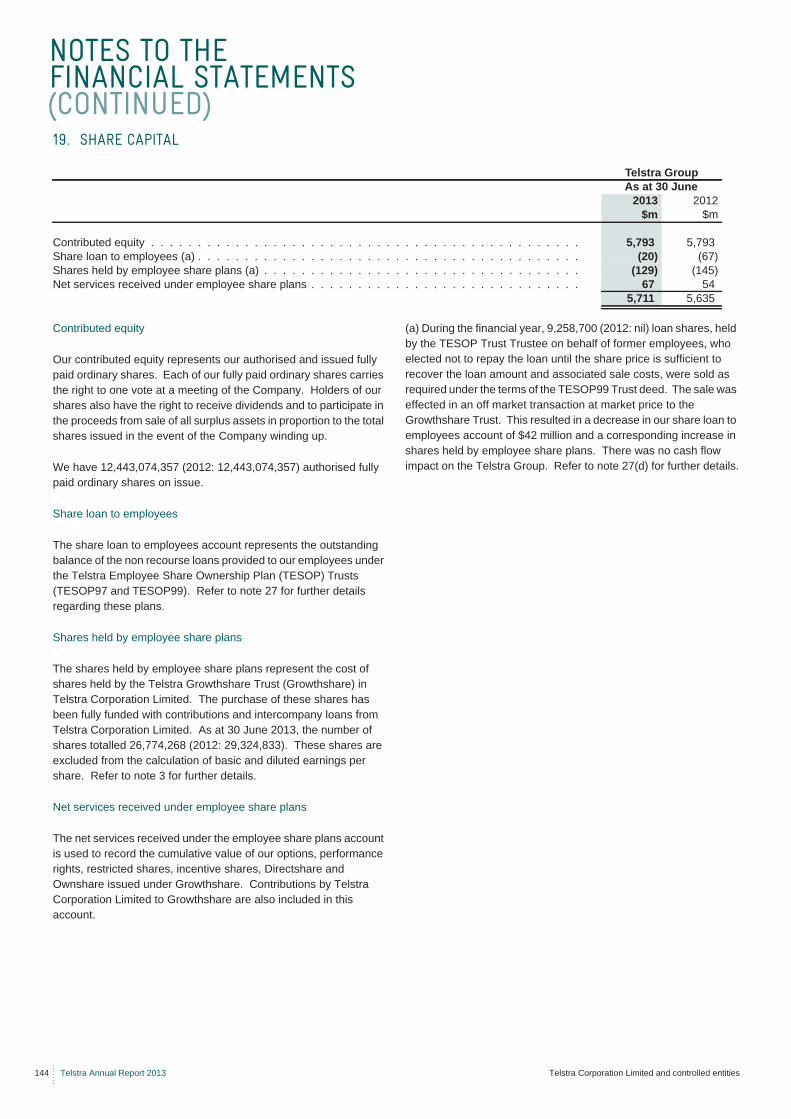
NOTES TO THE FINANCIAL STATEMENTS (CONTINUED)
144 Telstra Annual Report 2013 Telstra Corporation Limited and controlled entities
Contributed equity
Our contributed equity represents our authorised and issued fully paid ordinary shares. Each of our fully paid ordinary shares carries the right to one vote at a meeting of the Company. Holders of our shares also have the right to receive dividends and to participate in the proceeds from sale of all surplus assets in proportion to the total shares issued in the event of the Company winding up.
We have 12,443,074,357 (2012: 12,443,074,357) authorised fully paid ordinary shares on issue.
Share loan to employees
The share loan to employees account represents the outstanding balance of the non recourse loans provided to our employees under the Telstra Employee Share Ownership Plan (TESOP) Trusts (TESOP97 and TESOP99). Refer to note 27 for further details regarding these plans.
Shares held by employee share plans
The shares held by employee share plans represent the cost of shares held by the Telstra Growthshare Trust (Growthshare) in Telstra Corporation Limited. The purchase of these shares has been fully funded with contributions and intercompany loans from Telstra Corporation Limited. As at 30 June 2013, the number of shares totalled 26,774,268 (2012: 29,324,833). These shares are excluded from the calculation of basic and diluted earnings per share. Refer to note 3 for further details.
Net services received under employee share plans
The net services received under the employee share plans account is used to record the cumulative value of our options, performance rights, restricted shares, incentive shares, Directshare and Ownshare issued under Growthshare. Contributions by Telstra Corporation Limited to Growthshare are also included in this account.
(a) During the financial year, 9,258,700 (2012: nil) loan shares, held by the TESOP Trust Trustee on behalf of former employees, who elected not to repay the loan until the share price is sufficient to recover the loan amount and associated sale costs, were sold as required under the terms of the TESOP99 Trust deed. The sale was effected in an off market transaction at market price to the Growthshare Trust. This resulted in a decrease in our share loan to employees account of $42 million and a corresponding increase in shares held by employee share plans. There was no cash flow impact on the Telstra Group. Refer to note 27(d) for further details.
19. SHARE CAPITAL
Telstra GroupAs at 30 June
2013 2012$m $m
Contributed equity . . . . . . . . . . . . . . . . . . . . . . . . . . . . . . . . . . . . . . . . . . . . . . 5,793 5,793Share loan to employees (a) . . . . . . . . . . . . . . . . . . . . . . . . . . . . . . . . . . . . . . . . . (20) (67)Shares held by employee share plans (a) . . . . . . . . . . . . . . . . . . . . . . . . . . . . . . . . . . (129) (145)Net services received under employee share plans . . . . . . . . . . . . . . . . . . . . . . . . . . . . . 67 54
5,711 5,635
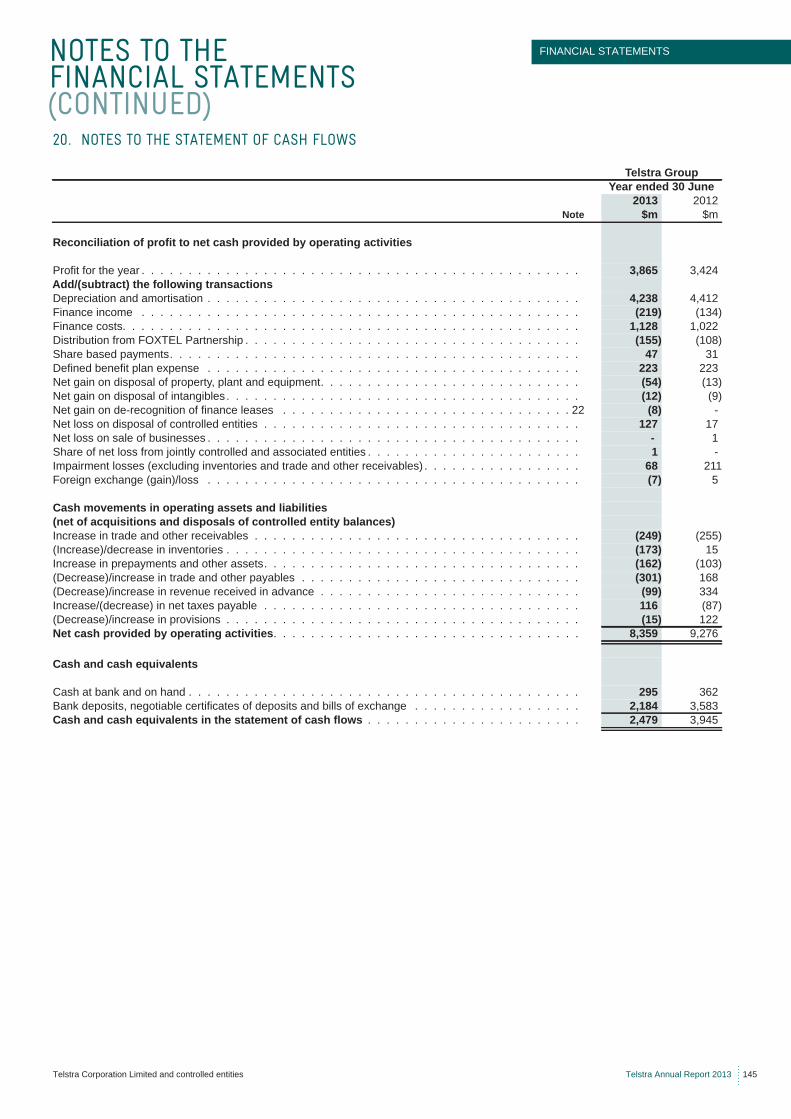
NOTES TO THE FINANCIAL STATEMENTS (CONTINUED)
FINANCIAL STATEMENTS
Telstra Corporation Limited and controlled entities Telstra Annual Report 2013 145
20. NOTES TO THE STATEMENT OF CASH FLOWS
Telstra GroupYear ended 30 June
2013 2012Note $m $m
Reconciliation of profit to net cash provided by operating activities
Profit for the year . . . . . . . . . . . . . . . . . . . . . . . . . . . . . . . . . . . . . . . . . . . . . . . 3,865 3,424Add/(subtract) the following transactionsDepreciation and amortisation . . . . . . . . . . . . . . . . . . . . . . . . . . . . . . . . . . . . . . . . 4,238 4,412Finance income . . . . . . . . . . . . . . . . . . . . . . . . . . . . . . . . . . . . . . . . . . . . . . . (219) (134)Finance costs. . . . . . . . . . . . . . . . . . . . . . . . . . . . . . . . . . . . . . . . . . . . . . . . . 1,128 1,022Distribution from FOXTEL Partnership . . . . . . . . . . . . . . . . . . . . . . . . . . . . . . . . . . . . (155) (108)Share based payments. . . . . . . . . . . . . . . . . . . . . . . . . . . . . . . . . . . . . . . . . . . . 47 31Defined benefit plan expense . . . . . . . . . . . . . . . . . . . . . . . . . . . . . . . . . . . . . . . . 223 223Net gain on disposal of property, plant and equipment. . . . . . . . . . . . . . . . . . . . . . . . . . . . (54) (13)Net gain on disposal of intangibles . . . . . . . . . . . . . . . . . . . . . . . . . . . . . . . . . . . . . . (12) (9)Net gain on de-recognition of finance leases . . . . . . . . . . . . . . . . . . . . . . . . . . . . . . . 22 (8) -Net loss on disposal of controlled entities . . . . . . . . . . . . . . . . . . . . . . . . . . . . . . . . . . 127 17Net loss on sale of businesses . . . . . . . . . . . . . . . . . . . . . . . . . . . . . . . . . . . . . . . . - 1Share of net loss from jointly controlled and associated entities . . . . . . . . . . . . . . . . . . . . . . . 1 -Impairment losses (excluding inventories and trade and other receivables) . . . . . . . . . . . . . . . . . 68 211Foreign exchange (gain)/loss . . . . . . . . . . . . . . . . . . . . . . . . . . . . . . . . . . . . . . . . (7) 5
Cash movements in operating assets and liabilities(net of acquisitions and disposals of controlled entity balances)Increase in trade and other receivables . . . . . . . . . . . . . . . . . . . . . . . . . . . . . . . . . . . (249) (255)(Increase)/decrease in inventories . . . . . . . . . . . . . . . . . . . . . . . . . . . . . . . . . . . . . . (173) 15Increase in prepayments and other assets. . . . . . . . . . . . . . . . . . . . . . . . . . . . . . . . . . (162) (103)(Decrease)/increase in trade and other payables . . . . . . . . . . . . . . . . . . . . . . . . . . . . . . (301) 168(Decrease)/increase in revenue received in advance . . . . . . . . . . . . . . . . . . . . . . . . . . . . (99) 334Increase/(decrease) in net taxes payable . . . . . . . . . . . . . . . . . . . . . . . . . . . . . . . . . . 116 (87)(Decrease)/increase in provisions . . . . . . . . . . . . . . . . . . . . . . . . . . . . . . . . . . . . . . (15) 122Net cash provided by operating activities. . . . . . . . . . . . . . . . . . . . . . . . . . . . . . . . . 8,359 9,276
Cash and cash equivalents
Cash at bank and on hand . . . . . . . . . . . . . . . . . . . . . . . . . . . . . . . . . . . . . . . . . . 295 362Bank deposits, negotiable certificates of deposits and bills of exchange . . . . . . . . . . . . . . . . . . 2,184 3,583Cash and cash equivalents in the statement of cash flows . . . . . . . . . . . . . . . . . . . . . . . 2,479 3,945
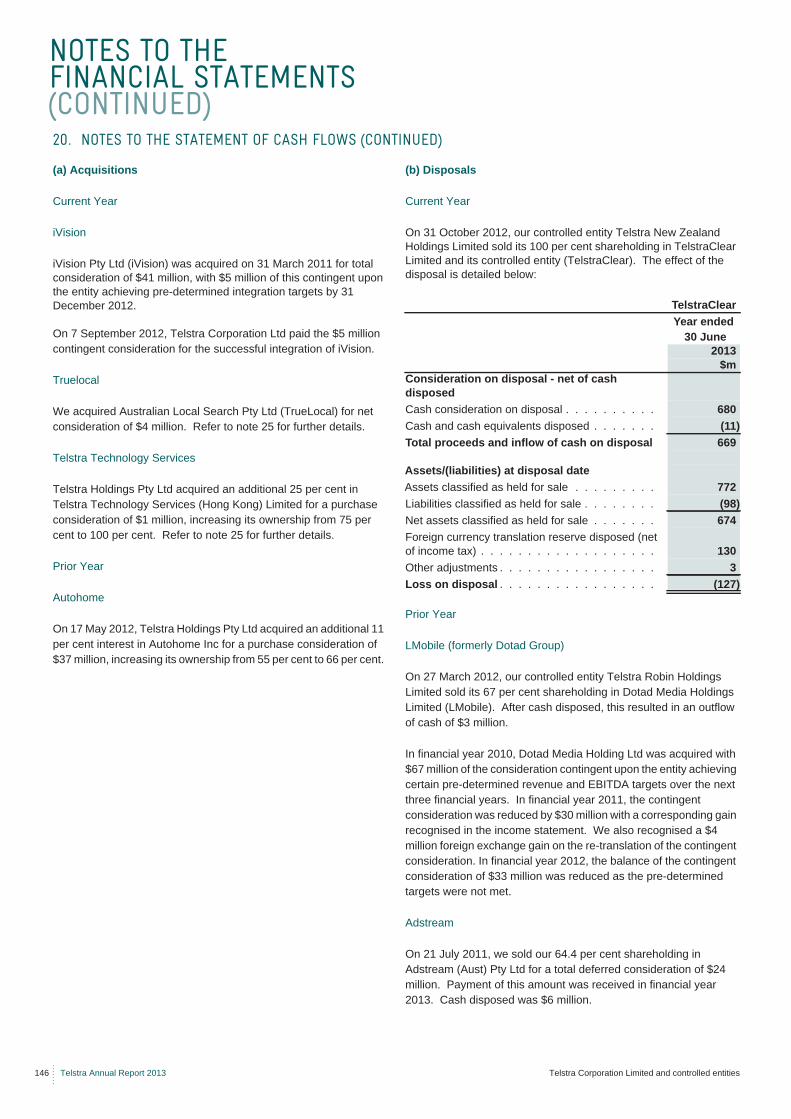
NOTES TO THE FINANCIAL STATEMENTS (CONTINUED)
146 Telstra Annual Report 2013 Telstra Corporation Limited and controlled entities
(a) Acquisitions
Current Year
iVision
iVision Pty Ltd (iVision) was acquired on 31 March 2011 for total consideration of $41 million, with $5 million of this contingent upon the entity achieving pre-determined integration targets by 31 December 2012.
On 7 September 2012, Telstra Corporation Ltd paid the $5 million contingent consideration for the successful integration of iVision.
Truelocal
We acquired Australian Local Search Pty Ltd (TrueLocal) for net consideration of $4 million. Refer to note 25 for further details.
Telstra Technology Services
Telstra Holdings Pty Ltd acquired an additional 25 per cent in Telstra Technology Services (Hong Kong) Limited for a purchase consideration of $1 million, increasing its ownership from 75 per cent to 100 per cent. Refer to note 25 for further details.
Prior Year
Autohome
On 17 May 2012, Telstra Holdings Pty Ltd acquired an additional 11 per cent interest in Autohome Inc for a purchase consideration of $37 million, increasing its ownership from 55 per cent to 66 per cent.
(b) Disposals
Current Year
On 31 October 2012, our controlled entity Telstra New Zealand Holdings Limited sold its 100 per cent shareholding in TelstraClear Limited and its controlled entity (TelstraClear). The effect of the disposal is detailed below:
Prior Year
LMobile (formerly Dotad Group)
On 27 March 2012, our controlled entity Telstra Robin Holdings Limited sold its 67 per cent shareholding in Dotad Media Holdings Limited (LMobile). After cash disposed, this resulted in an outflow of cash of $3 million.
In financial year 2010, Dotad Media Holding Ltd was acquired with $67 million of the consideration contingent upon the entity achieving certain pre-determined revenue and EBITDA targets over the next three financial years. In financial year 2011, the contingent consideration was reduced by $30 million with a corresponding gain recognised in the income statement. We also recognised a $4 million foreign exchange gain on the re-translation of the contingent consideration. In financial year 2012, the balance of the contingent consideration of $33 million was reduced as the pre-determined targets were not met.
Adstream
On 21 July 2011, we sold our 64.4 per cent shareholding in Adstream (Aust) Pty Ltd for a total deferred consideration of $24 million. Payment of this amount was received in financial year 2013. Cash disposed was $6 million.
20. NOTES TO THE STATEMENT OF CASH FLOWS (CONTINUED)
TelstraClearYear ended
30 June2013
$mConsideration on disposal - net of cash disposedCash consideration on disposal . . . . . . . . . . 680Cash and cash equivalents disposed . . . . . . . (11)Total proceeds and inflow of cash on disposal 669
Assets/(liabilities) at disposal dateAssets classified as held for sale . . . . . . . . . 772Liabilities classified as held for sale . . . . . . . . (98)Net assets classified as held for sale . . . . . . . 674Foreign currency translation reserve disposed (net of income tax) . . . . . . . . . . . . . . . . . . . 130Other adjustments . . . . . . . . . . . . . . . . . 3Loss on disposal . . . . . . . . . . . . . . . . . (127)
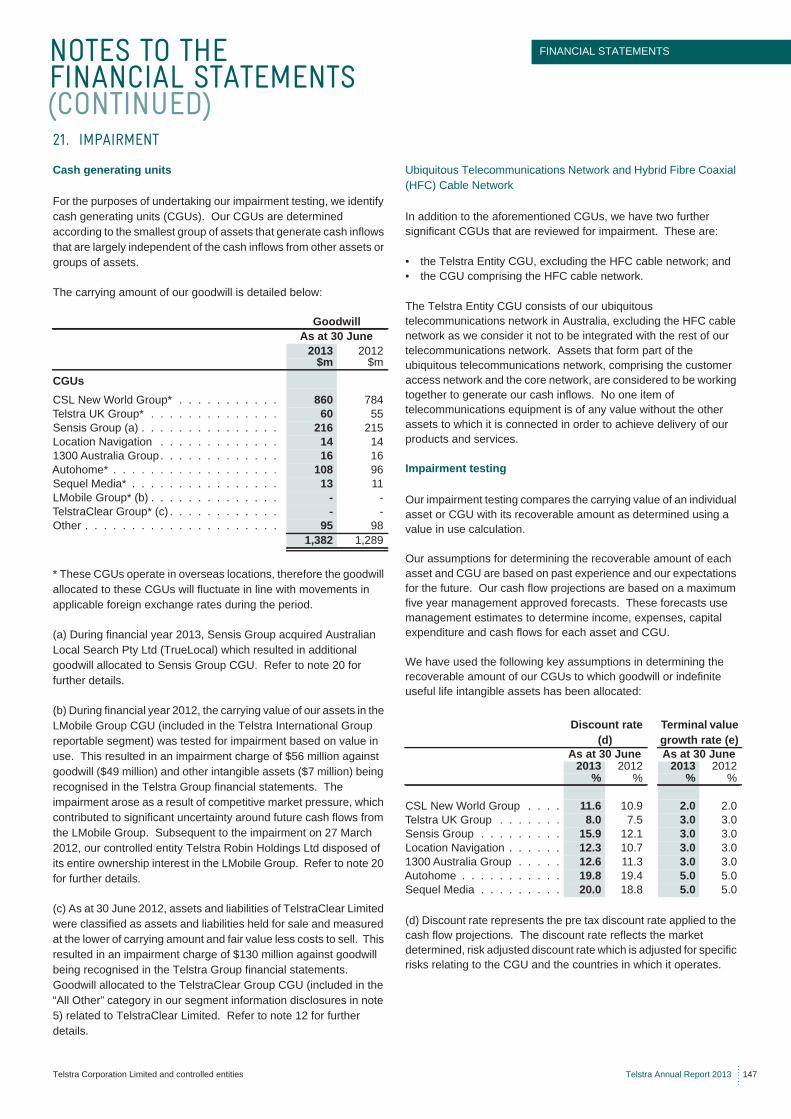
NOTES TO THE FINANCIAL STATEMENTS (CONTINUED)
FINANCIAL STATEMENTS
Telstra Corporation Limited and controlled entities Telstra Annual Report 2013 147
Cash generating units
For the purposes of undertaking our impairment testing, we identify cash generating units (CGUs). Our CGUs are determined according to the smallest group of assets that generate cash inflows that are largely independent of the cash inflows from other assets or groups of assets.
The carrying amount of our goodwill is detailed below:
* These CGUs operate in overseas locations, therefore the goodwill allocated to these CGUs will fluctuate in line with movements in applicable foreign exchange rates during the period.
(a) During financial year 2013, Sensis Group acquired Australian Local Search Pty Ltd (TrueLocal) which resulted in additional goodwill allocated to Sensis Group CGU. Refer to note 20 for further details.
(b) During financial year 2012, the carrying value of our assets in the LMobile Group CGU (included in the Telstra International Group reportable segment) was tested for impairment based on value in use. This resulted in an impairment charge of $56 million against goodwill ($49 million) and other intangible assets ($7 million) being recognised in the Telstra Group financial statements. The impairment arose as a result of competitive market pressure, which contributed to significant uncertainty around future cash flows from the LMobile Group. Subsequent to the impairment on 27 March 2012, our controlled entity Telstra Robin Holdings Ltd disposed of its entire ownership interest in the LMobile Group. Refer to note 20 for further details.
(c) As at 30 June 2012, assets and liabilities of TelstraClear Limited were classified as assets and liabilities held for sale and measured at the lower of carrying amount and fair value less costs to sell. This resulted in an impairment charge of $130 million against goodwill being recognised in the Telstra Group financial statements. Goodwill allocated to the TelstraClear Group CGU (included in the “All Other” category in our segment information disclosures in note 5) related to TelstraClear Limited. Refer to note 12 for further details.
Ubiquitous Telecommunications Network and Hybrid Fibre Coaxial (HFC) Cable Network
In addition to the aforementioned CGUs, we have two further significant CGUs that are reviewed for impairment. These are:
• the Telstra Entity CGU, excluding the HFC cable network; and• the CGU comprising the HFC cable network.
The Telstra Entity CGU consists of our ubiquitous telecommunications network in Australia, excluding the HFC cable network as we consider it not to be integrated with the rest of our telecommunications network. Assets that form part of the ubiquitous telecommunications network, comprising the customer access network and the core network, are considered to be working together to generate our cash inflows. No one item of telecommunications equipment is of any value without the other assets to which it is connected in order to achieve delivery of our products and services.
Impairment testing
Our impairment testing compares the carrying value of an individual asset or CGU with its recoverable amount as determined using a value in use calculation.
Our assumptions for determining the recoverable amount of each asset and CGU are based on past experience and our expectations for the future. Our cash flow projections are based on a maximum five year management approved forecasts. These forecasts use management estimates to determine income, expenses, capital expenditure and cash flows for each asset and CGU.
We have used the following key assumptions in determining the recoverable amount of our CGUs to which goodwill or indefinite useful life intangible assets has been allocated:
(d) Discount rate represents the pre tax discount rate applied to the cash flow projections. The discount rate reflects the market determined, risk adjusted discount rate which is adjusted for specific risks relating to the CGU and the countries in which it operates.
21. IMPAIRMENT
GoodwillAs at 30 June
2013 2012$m $m
CGUsCSL New World Group* . . . . . . . . . . . 860 784Telstra UK Group* . . . . . . . . . . . . . . 60 55Sensis Group (a) . . . . . . . . . . . . . . . 216 215Location Navigation . . . . . . . . . . . . . 14 141300 Australia Group. . . . . . . . . . . . . 16 16Autohome* . . . . . . . . . . . . . . . . . . 108 96Sequel Media* . . . . . . . . . . . . . . . . 13 11LMobile Group* (b) . . . . . . . . . . . . . . - -TelstraClear Group* (c) . . . . . . . . . . . . - -Other . . . . . . . . . . . . . . . . . . . . . 95 98
1,382 1,289
Discount rate (d)
Terminal value growth rate (e)
As at 30 June As at 30 June2013 2012 2013 2012
% % % %
CSL New World Group . . . . 11.6 10.9 2.0 2.0Telstra UK Group . . . . . . . 8.0 7.5 3.0 3.0Sensis Group . . . . . . . . . 15.9 12.1 3.0 3.0Location Navigation . . . . . . 12.3 10.7 3.0 3.01300 Australia Group . . . . . 12.6 11.3 3.0 3.0Autohome . . . . . . . . . . . 19.8 19.4 5.0 5.0Sequel Media . . . . . . . . . 20.0 18.8 5.0 5.0
NOTES TO THE FINANCIAL STATEMENTS (CONTINUED)
148 Telstra Annual Report 2013 Telstra Corporation Limited and controlled entities
Impairment testing (continued)
(e) Terminal value growth rate represents the growth rate applied to extrapolate our cash flows beyond the five year forecast period. These growth rates are based on our expectation of the CGUs’ long term performance in their respective markets.
The discount rate would need to increase by 480 basis points (30 June 2012: 350 basis points) or the terminal value growth rate would need to be negative growth of 3.5 per cent (30 June 2012: negative 2.2 per cent) before the recoverable amount of any of the CGUs would be equal to the carrying value. Accordingly, management has determined there are no reasonably possible changes that could occur in these two key assumptions that would cause the carrying amount of these CGUs to exceed their recoverable amount.
Ubiquitous telecommunications network and Hybrid Fibre Coaxial (HFC) cable network (“the networks”)
Our discounted expected future cash flows more than support the carrying amount of the networks. This is based on:
• forecast cash flows from continuing to:
- use the core network; and- provide Pay TV services via the HFC cable network into the
future; and
• the consideration we expect to receive under the National Broadband Network (NBN) Definitive Agreements (DAs) for:
- the progressive disconnection of copper-based Customer Access Network services and broadband services on our HFC cable network (excluding Pay TV services on the HFC cable network) provided to premises in the NBN fibre footprint;
- providing access to certain infrastructure, including dark fibre links, exchange rack spaces and ducts; and
- the sale of lead-in-conduits.
Given this, the results of our impairment testing for the networks show that the carrying amounts are recoverable at 30 June 2013.
21. IMPAIRMENT (CONTINUED)
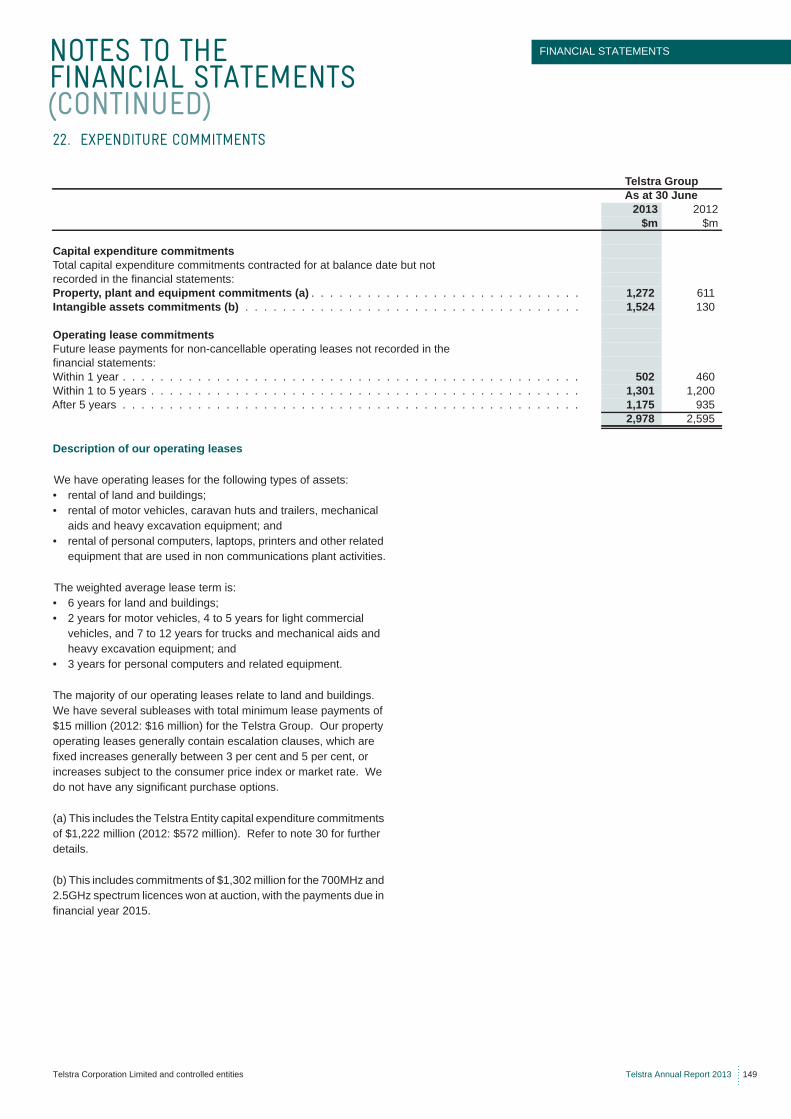
NOTES TO THE FINANCIAL STATEMENTS (CONTINUED)
FINANCIAL STATEMENTS
Telstra Corporation Limited and controlled entities Telstra Annual Report 2013 149
Description of our operating leases
We have operating leases for the following types of assets:• rental of land and buildings;• rental of motor vehicles, caravan huts and trailers, mechanical
aids and heavy excavation equipment; and• rental of personal computers, laptops, printers and other related
equipment that are used in non communications plant activities.
The weighted average lease term is:• 6 years for land and buildings;• 2 years for motor vehicles, 4 to 5 years for light commercial
vehicles, and 7 to 12 years for trucks and mechanical aids and heavy excavation equipment; and
• 3 years for personal computers and related equipment.
The majority of our operating leases relate to land and buildings. We have several subleases with total minimum lease payments of $15 million (2012: $16 million) for the Telstra Group. Our property operating leases generally contain escalation clauses, which are fixed increases generally between 3 per cent and 5 per cent, or increases subject to the consumer price index or market rate. We do not have any significant purchase options.
(a) This includes the Telstra Entity capital expenditure commitments of $1,222 million (2012: $572 million). Refer to note 30 for further details.
(b) This includes commitments of $1,302 million for the 700MHz and 2.5GHz spectrum licences won at auction, with the payments due in financial year 2015.
22. EXPENDITURE COMMITMENTS
Telstra GroupAs at 30 June
2013 2012$m $m
Capital expenditure commitmentsTotal capital expenditure commitments contracted for at balance date but notrecorded in the financial statements:Property, plant and equipment commitments (a) . . . . . . . . . . . . . . . . . . . . . . . . . . . . . 1,272 611Intangible assets commitments (b) . . . . . . . . . . . . . . . . . . . . . . . . . . . . . . . . . . . . 1,524 130
Operating lease commitmentsFuture lease payments for non-cancellable operating leases not recorded in thefinancial statements:Within 1 year . . . . . . . . . . . . . . . . . . . . . . . . . . . . . . . . . . . . . . . . . . . . . . . . . 502 460Within 1 to 5 years . . . . . . . . . . . . . . . . . . . . . . . . . . . . . . . . . . . . . . . . . . . . . . 1,301 1,200After 5 years . . . . . . . . . . . . . . . . . . . . . . . . . . . . . . . . . . . . . . . . . . . . . . . . . 1,175 935
2,978 2,595
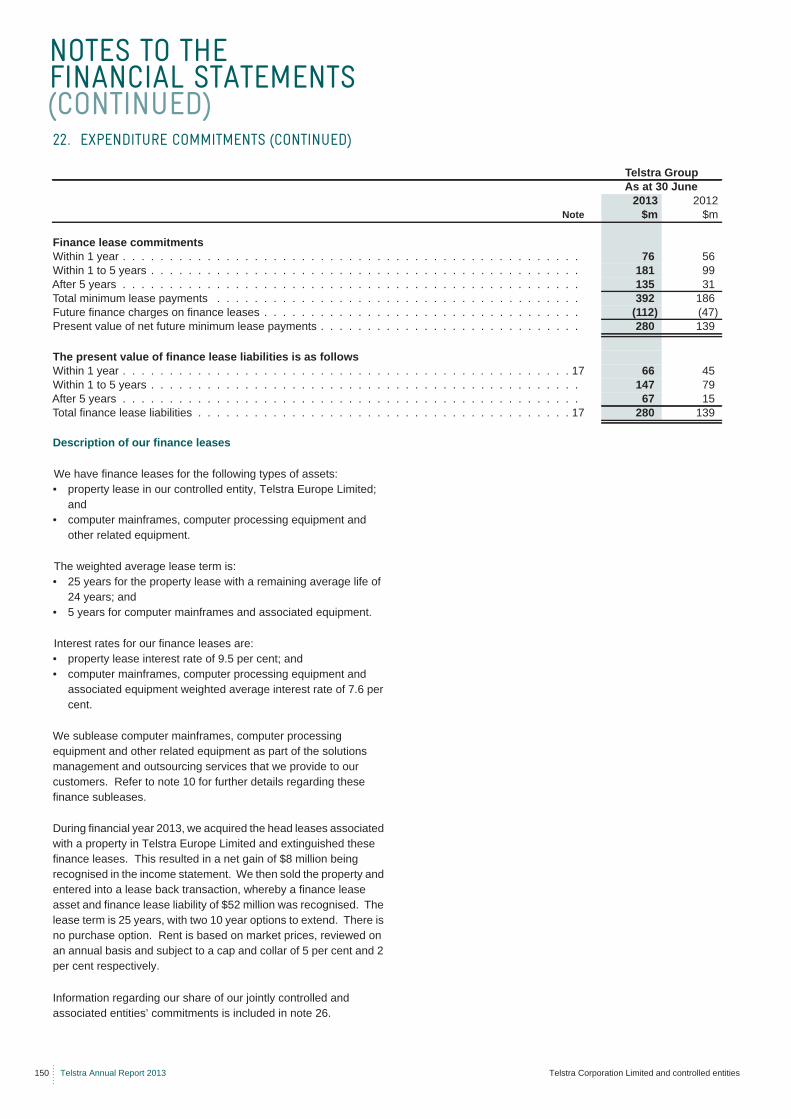
NOTES TO THE FINANCIAL STATEMENTS (CONTINUED)
150 Telstra Annual Report 2013 Telstra Corporation Limited and controlled entities
Description of our finance leases
We have finance leases for the following types of assets:• property lease in our controlled entity, Telstra Europe Limited;
and• computer mainframes, computer processing equipment and
other related equipment.
The weighted average lease term is:• 25 years for the property lease with a remaining average life of
24 years; and• 5 years for computer mainframes and associated equipment.
Interest rates for our finance leases are:• property lease interest rate of 9.5 per cent; and• computer mainframes, computer processing equipment and
associated equipment weighted average interest rate of 7.6 per cent.
We sublease computer mainframes, computer processing equipment and other related equipment as part of the solutions management and outsourcing services that we provide to our customers. Refer to note 10 for further details regarding these finance subleases.
During financial year 2013, we acquired the head leases associated with a property in Telstra Europe Limited and extinguished these finance leases. This resulted in a net gain of $8 million being recognised in the income statement. We then sold the property and entered into a lease back transaction, whereby a finance lease asset and finance lease liability of $52 million was recognised. The lease term is 25 years, with two 10 year options to extend. There is no purchase option. Rent is based on market prices, reviewed on an annual basis and subject to a cap and collar of 5 per cent and 2 per cent respectively.
Information regarding our share of our jointly controlled and associated entities’ commitments is included in note 26.
22. EXPENDITURE COMMITMENTS (CONTINUED)
Telstra GroupAs at 30 June
2013 2012Note $m $m
Finance lease commitmentsWithin 1 year . . . . . . . . . . . . . . . . . . . . . . . . . . . . . . . . . . . . . . . . . . . . . . . . . 76 56Within 1 to 5 years . . . . . . . . . . . . . . . . . . . . . . . . . . . . . . . . . . . . . . . . . . . . . . 181 99After 5 years . . . . . . . . . . . . . . . . . . . . . . . . . . . . . . . . . . . . . . . . . . . . . . . . . 135 31Total minimum lease payments . . . . . . . . . . . . . . . . . . . . . . . . . . . . . . . . . . . . . . . 392 186Future finance charges on finance leases . . . . . . . . . . . . . . . . . . . . . . . . . . . . . . . . . . (112) (47)Present value of net future minimum lease payments . . . . . . . . . . . . . . . . . . . . . . . . . . . . 280 139
The present value of finance lease liabilities is as followsWithin 1 year . . . . . . . . . . . . . . . . . . . . . . . . . . . . . . . . . . . . . . . . . . . . . . . . 17 66 45Within 1 to 5 years . . . . . . . . . . . . . . . . . . . . . . . . . . . . . . . . . . . . . . . . . . . . . . 147 79After 5 years . . . . . . . . . . . . . . . . . . . . . . . . . . . . . . . . . . . . . . . . . . . . . . . . . 67 15Total finance lease liabilities . . . . . . . . . . . . . . . . . . . . . . . . . . . . . . . . . . . . . . . . 17 280 139
NOTES TO THE FINANCIAL STATEMENTS (CONTINUED)
FINANCIAL STATEMENTS
Telstra Corporation Limited and controlled entities Telstra Annual Report 2013 151
We have no significant contingent assets as at 30 June 2013. The details and maximum amounts (where reasonable estimates can be made) are set out below for our contingent liabilities.
Telstra Entity
Refer to note 30 for Telstra Entity contingent liabilities.
Other
Other contingent liabilities identified for the Telstra Group are as follows:
ASIC deed of cross guarantee
A list of the companies that are part of our deed of cross guarantee appear in note 25. Each of these companies (except Telstra Finance Limited) guarantees the payment in full of the debts of the other named companies in the event of their winding up. Refer to note 25 for further details.
3GIS Dissolution
Upon dissolution of our 3GIS Partnership with Vodafone Hutchison Australia on 31 August 2012, we are no longer subject to contingent liabilities in relation to agreements entered into as part of the partnership where we were liable if our partner in this relationship failed to meet any of its obligations (2012: $96 million).
23. CONTINGENT LIABILITIES AND CONTINGENT ASSETS
NOTES TO THE FINANCIAL STATEMENTS (CONTINUED)
152 Telstra Annual Report 2013 Telstra Corporation Limited and controlled entities
We participate in or sponsor defined benefit and defined contribution schemes. It is our policy to contribute to the schemes at rates specified in the governing rules for defined contribution schemes or at rates determined by the actuaries for defined benefit schemes.
The defined contribution divisions receive fixed contributions and our legal or constructive obligation is limited to these contributions.
The present value of our obligations for the defined benefit plans are calculated by an actuary using the projected unit credit method. This method determines each year of service as giving rise to an additional unit of benefit entitlement and measures each unit separately to calculate the final obligation.
Details of the defined benefit plans we participate in are set out below.
Telstra Superannuation Scheme (Telstra Super)
On 1 July 1990, Telstra Super was established and the majority of Telstra staff transferred into Telstra Super. The Telstra Entity and some of our Australian controlled entities participate in Telstra Super.
Telstra Super has both defined benefit and defined contribution divisions. The defined benefit divisions of Telstra Super are closed to new members.
The defined benefit divisions provide benefits based on years of service and final average salary. Post employment benefits do not include payments for medical costs.
Contribution levels made to the defined benefit divisions are designed to ensure that benefits accruing to members and beneficiaries are fully funded as the benefits fall due. The benefits received by members of each defined benefit division take into account factors such as the employees’ length of service, final average salary and employer and employee contributions.
An actuarial investigation of this scheme is carried out at least every three years.
CSL Retirement Scheme
Our controlled entity, CSL Limited (CSL), participates in a superannuation scheme known as the CSL Retirement Scheme. This scheme was established under the Occupational Retirement Schemes Ordinance and is administered by an independent trustee. The scheme has three defined benefit sections and one defined contribution section. Actuarial assessments are undertaken annually for this scheme.
The benefits received by members of the defined benefit schemes are based on the employees’ remuneration and length of service.
Measurement dates
For Telstra Super, actual membership data as at 30 April was used to value the defined obligations as at that date. Details of assets, benefit payments and other cash flows as at 31 May were also used in relation to Telstra Super. These April and May figures were then rolled forward to 30 June to allow for changes in the membership and actual asset return. Contributions as at 30 June were used in relation to the defined benefit and defined contribution divisions.
Asset values as at 30 June were used to measure the defined benefit liability as at that date for the CSL Retirement Scheme. Details of membership data, contributions, benefit payments and other cash flows as at 30 June were also used in relation to the CSL Retirement Scheme.
The fair value of the defined benefit plan assets and the present value of the defined benefit obligations as at the reporting date are determined by our actuaries. The details of the defined benefit divisions are set out in the following pages.
Other defined contribution schemes
A number of our controlled entities also participate in defined contribution schemes which receive employer and employee contributions based on a percentage of the employees’ salaries. We made contributions to these schemes of $24 million for 2013 (2012: $19 million).
24. POST EMPLOYMENT BENEFITS
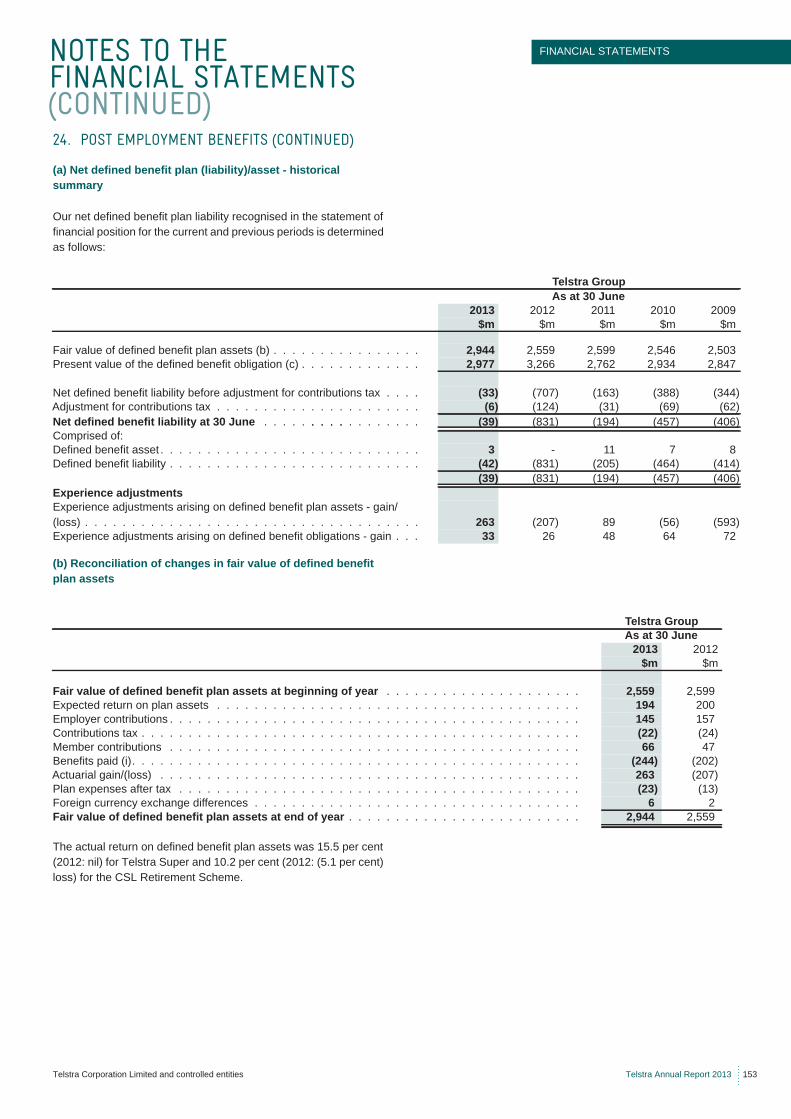
NOTES TO THE FINANCIAL STATEMENTS (CONTINUED)
FINANCIAL STATEMENTS
Telstra Corporation Limited and controlled entities Telstra Annual Report 2013 153
(a) Net defined benefit plan (liability)/asset - historical summary
Our net defined benefit plan liability recognised in the statement of financial position for the current and previous periods is determined as follows:
(b) Reconciliation of changes in fair value of defined benefit plan assets
The actual return on defined benefit plan assets was 15.5 per cent (2012: nil) for Telstra Super and 10.2 per cent (2012: (5.1 per cent) loss) for the CSL Retirement Scheme.
24. POST EMPLOYMENT BENEFITS (CONTINUED)
Telstra GroupAs at 30 June
2013 2012 2011 2010 2009$m $m $m $m $m
Fair value of defined benefit plan assets (b) . . . . . . . . . . . . . . . . 2,944 2,559 2,599 2,546 2,503Present value of the defined benefit obligation (c) . . . . . . . . . . . . . 2,977 3,266 2,762 2,934 2,847
Net defined benefit liability before adjustment for contributions tax . . . . (33) (707) (163) (388) (344)Adjustment for contributions tax . . . . . . . . . . . . . . . . . . . . . . (6) (124) (31) (69) (62)Net defined benefit liability at 30 June . . . . . . . . . . . . . . . . . . . . . (39) (831) (194) (457) (406)Comprised of:Defined benefit asset . . . . . . . . . . . . . . . . . . . . . . . . . . . . 3 - 11 7 8Defined benefit liability . . . . . . . . . . . . . . . . . . . . . . . . . . . (42) (831) (205) (464) (414)
(39) (831) (194) (457) (406)Experience adjustmentsExperience adjustments arising on defined benefit plan assets - gain/(loss) . . . . . . . . . . . . . . . . . . . . . . . . . . . . . . . . . . . . 263 (207) 89 (56) (593)Experience adjustments arising on defined benefit obligations - gain . . . 33 26 48 64 72
Telstra GroupAs at 30 June
2013 2012$m $m
Fair value of defined benefit plan assets at beginning of year . . . . . . . . . . . . . . . . . . . . . 2,559 2,599Expected return on plan assets . . . . . . . . . . . . . . . . . . . . . . . . . . . . . . . . . . . . . . . 194 200Employer contributions . . . . . . . . . . . . . . . . . . . . . . . . . . . . . . . . . . . . . . . . . . . . 145 157Contributions tax . . . . . . . . . . . . . . . . . . . . . . . . . . . . . . . . . . . . . . . . . . . . . . . (22) (24)Member contributions . . . . . . . . . . . . . . . . . . . . . . . . . . . . . . . . . . . . . . . . . . . . 66 47Benefits paid (i). . . . . . . . . . . . . . . . . . . . . . . . . . . . . . . . . . . . . . . . . . . . . . . . (244) (202)Actuarial gain/(loss) . . . . . . . . . . . . . . . . . . . . . . . . . . . . . . . . . . . . . . . . . . . . . 263 (207)Plan expenses after tax . . . . . . . . . . . . . . . . . . . . . . . . . . . . . . . . . . . . . . . . . . . (23) (13)Foreign currency exchange differences . . . . . . . . . . . . . . . . . . . . . . . . . . . . . . . . . . . 6 2Fair value of defined benefit plan assets at end of year . . . . . . . . . . . . . . . . . . . . . . . . . 2,944 2,559
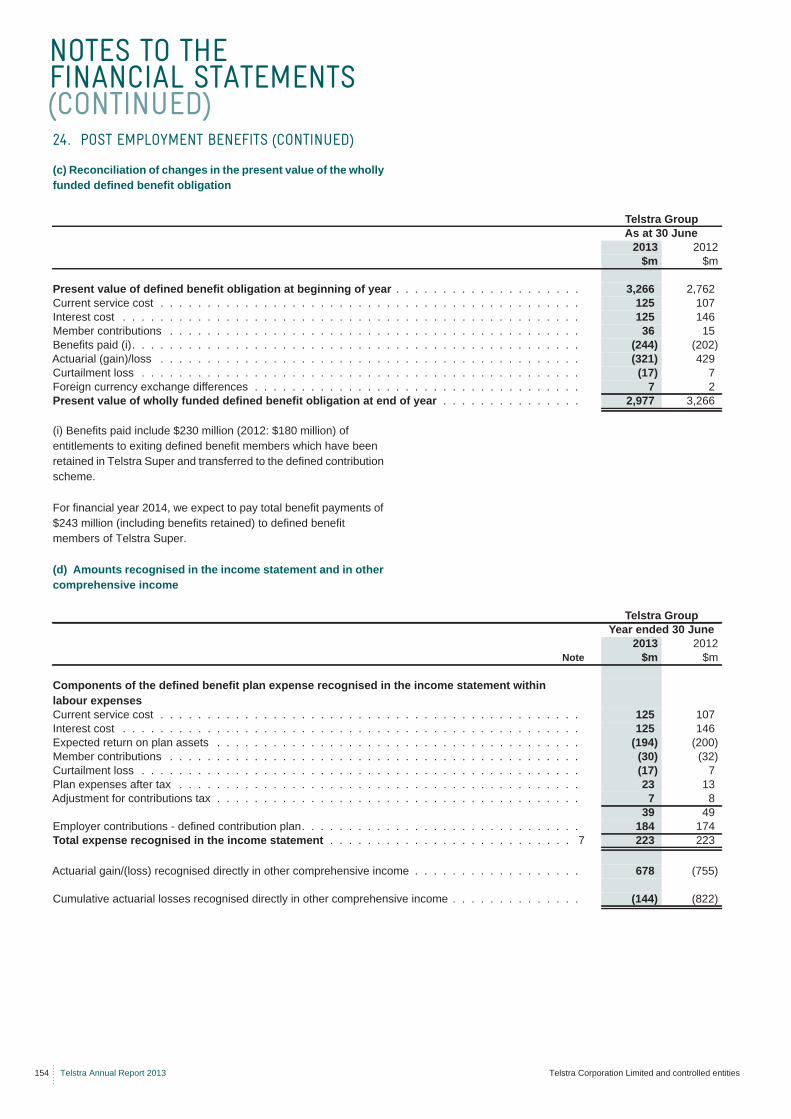
NOTES TO THE FINANCIAL STATEMENTS (CONTINUED)
154 Telstra Annual Report 2013 Telstra Corporation Limited and controlled entities
(c) Reconciliation of changes in the present value of the wholly funded defined benefit obligation
(i) Benefits paid include $230 million (2012: $180 million) of entitlements to exiting defined benefit members which have been retained in Telstra Super and transferred to the defined contribution scheme.
For financial year 2014, we expect to pay total benefit payments of $243 million (including benefits retained) to defined benefit members of Telstra Super.
(d) Amounts recognised in the income statement and in other comprehensive income
24. POST EMPLOYMENT BENEFITS (CONTINUED)
Telstra GroupAs at 30 June
2013 2012$m $m
Present value of defined benefit obligation at beginning of year . . . . . . . . . . . . . . . . . . . . 3,266 2,762Current service cost . . . . . . . . . . . . . . . . . . . . . . . . . . . . . . . . . . . . . . . . . . . . . 125 107Interest cost . . . . . . . . . . . . . . . . . . . . . . . . . . . . . . . . . . . . . . . . . . . . . . . . . 125 146Member contributions . . . . . . . . . . . . . . . . . . . . . . . . . . . . . . . . . . . . . . . . . . . . 36 15Benefits paid (i). . . . . . . . . . . . . . . . . . . . . . . . . . . . . . . . . . . . . . . . . . . . . . . . (244) (202)Actuarial (gain)/loss . . . . . . . . . . . . . . . . . . . . . . . . . . . . . . . . . . . . . . . . . . . . . (321) 429Curtailment loss . . . . . . . . . . . . . . . . . . . . . . . . . . . . . . . . . . . . . . . . . . . . . . . (17) 7Foreign currency exchange differences . . . . . . . . . . . . . . . . . . . . . . . . . . . . . . . . . . . 7 2Present value of wholly funded defined benefit obligation at end of year . . . . . . . . . . . . . . . 2,977 3,266
Telstra GroupYear ended 30 June
2013 2012Note $m $m
Components of the defined benefit plan expense recognised in the income statement within labour expensesCurrent service cost . . . . . . . . . . . . . . . . . . . . . . . . . . . . . . . . . . . . . . . . . . . . . 125 107Interest cost . . . . . . . . . . . . . . . . . . . . . . . . . . . . . . . . . . . . . . . . . . . . . . . . . 125 146Expected return on plan assets . . . . . . . . . . . . . . . . . . . . . . . . . . . . . . . . . . . . . . . (194) (200)Member contributions . . . . . . . . . . . . . . . . . . . . . . . . . . . . . . . . . . . . . . . . . . . . (30) (32)Curtailment loss . . . . . . . . . . . . . . . . . . . . . . . . . . . . . . . . . . . . . . . . . . . . . . . (17) 7Plan expenses after tax . . . . . . . . . . . . . . . . . . . . . . . . . . . . . . . . . . . . . . . . . . . 23 13Adjustment for contributions tax . . . . . . . . . . . . . . . . . . . . . . . . . . . . . . . . . . . . . . . 7 8
39 49Employer contributions - defined contribution plan. . . . . . . . . . . . . . . . . . . . . . . . . . . . . . 184 174Total expense recognised in the income statement . . . . . . . . . . . . . . . . . . . . . . . . . . 7 223 223
Actuarial gain/(loss) recognised directly in other comprehensive income . . . . . . . . . . . . . . . . . . 678 (755)
Cumulative actuarial losses recognised directly in other comprehensive income . . . . . . . . . . . . . . (144) (822)
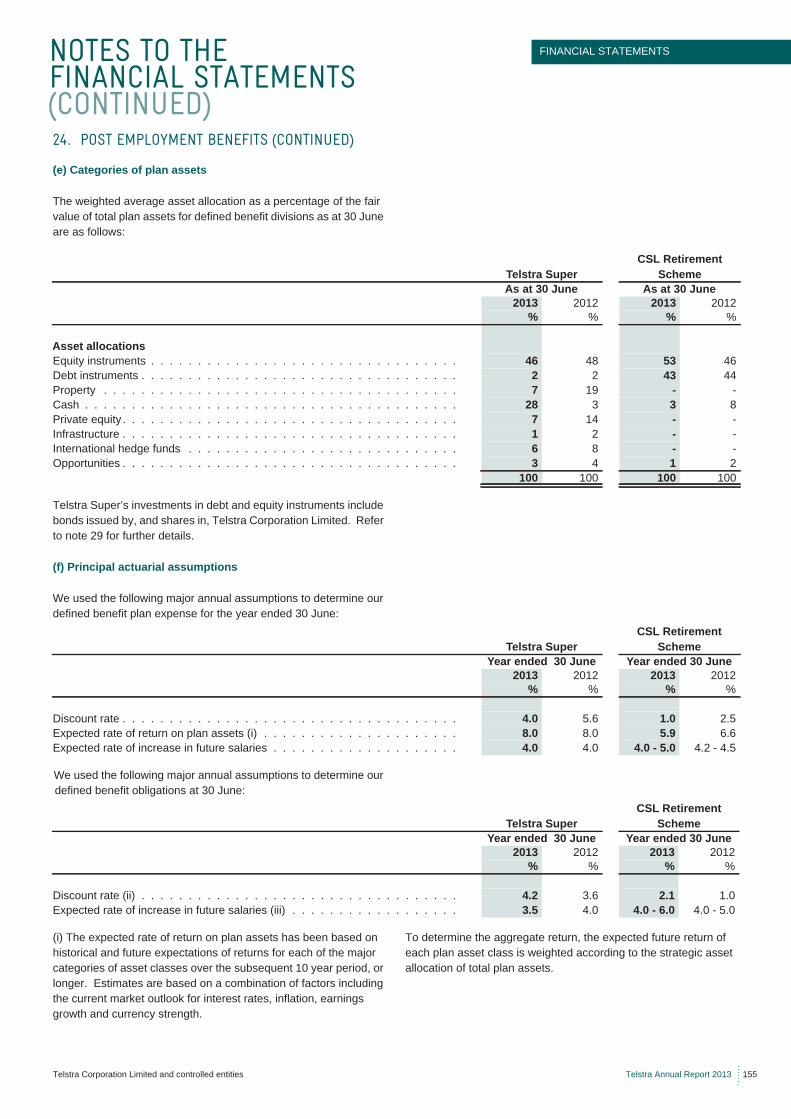
NOTES TO THE FINANCIAL STATEMENTS (CONTINUED)
FINANCIAL STATEMENTS
Telstra Corporation Limited and controlled entities Telstra Annual Report 2013 155
(d) (e) Categories of plan assets
The weighted average asset allocation as a percentage of the fair value of total plan assets for defined benefit divisions as at 30 June are as follows:
Telstra Super’s investments in debt and equity instruments include bonds issued by, and shares in, Telstra Corporation Limited. Refer to note 29 for further details.
(f) Principal actuarial assumptions
We used the following major annual assumptions to determine our defined benefit plan expense for the year ended 30 June:
We used the following major annual assumptions to determine our defined benefit obligations at 30 June:
(i) The expected rate of return on plan assets has been based on historical and future expectations of returns for each of the major categories of asset classes over the subsequent 10 year period, or longer. Estimates are based on a combination of factors including the current market outlook for interest rates, inflation, earnings growth and currency strength.
To determine the aggregate return, the expected future return of each plan asset class is weighted according to the strategic asset allocation of total plan assets.
24. POST EMPLOYMENT BENEFITS (CONTINUED)
Telstra SuperCSL Retirement
SchemeAs at 30 June As at 30 June
2013 2012 2013 2012% % % %
Asset allocationsEquity instruments . . . . . . . . . . . . . . . . . . . . . . . . . . . . . . . . . 46 48 53 46Debt instruments . . . . . . . . . . . . . . . . . . . . . . . . . . . . . . . . . . 2 2 43 44Property . . . . . . . . . . . . . . . . . . . . . . . . . . . . . . . . . . . . . . 7 19 - -Cash . . . . . . . . . . . . . . . . . . . . . . . . . . . . . . . . . . . . . . . . 28 3 3 8Private equity . . . . . . . . . . . . . . . . . . . . . . . . . . . . . . . . . . . . 7 14 - -Infrastructure . . . . . . . . . . . . . . . . . . . . . . . . . . . . . . . . . . . . 1 2 - -International hedge funds . . . . . . . . . . . . . . . . . . . . . . . . . . . . . 6 8 - -Opportunities . . . . . . . . . . . . . . . . . . . . . . . . . . . . . . . . . . . . 3 4 1 2
100 100 100 100
Telstra SuperCSL Retirement
SchemeYear ended 30 June Year ended 30 June
2013 2012 2013 2012% % % %
Discount rate . . . . . . . . . . . . . . . . . . . . . . . . . . . . . . . . . . . . 4.0 5.6 1.0 2.5Expected rate of return on plan assets (i) . . . . . . . . . . . . . . . . . . . . . 8.0 8.0 5.9 6.6Expected rate of increase in future salaries . . . . . . . . . . . . . . . . . . . . 4.0 4.0 4.0 - 5.0 4.2 - 4.5
Telstra SuperCSL Retirement
SchemeYear ended 30 June Year ended 30 June
2013 2012 2013 2012% % % %
Discount rate (ii) . . . . . . . . . . . . . . . . . . . . . . . . . . . . . . . . . . 4.2 3.6 2.1 1.0Expected rate of increase in future salaries (iii) . . . . . . . . . . . . . . . . . . 3.5 4.0 4.0 - 6.0 4.0 - 5.0
NOTES TO THE FINANCIAL STATEMENTS (CONTINUED)
156 Telstra Annual Report 2013 Telstra Corporation Limited and controlled entities
(f) Principal actuarial assumptions (continued)
(ii) The present value of our defined benefit obligation is determined by discounting the estimated future cash outflows using a discount rate based on government guaranteed securities with similar due dates to these expected cash flows.
For Telstra Super we have used a blended 10-year Australian government bond rate as it has the closest term from the Australian bond market to match the term of the defined benefit obligations. We have not made any adjustment to reflect the difference between the term of the bonds and the estimated term of liabilities due to the observation that the current government bond yield curve is reasonably flat, implying that the yields from government bonds with a term less than 10 years are expected to be very similar to the extrapolated bond yields with a term of 12 to 13 years.
For the CSL Retirement Scheme we have extrapolated the 5, 7, 10 and 15 year yields of the Hong Kong Exchange Fund Notes to 11 years to match the term of the defined benefit obligations.
(iii) Our assumption for the salary inflation rate for Telstra Super is 3.5 per cent, which is reflective of our long term expectation for salary increases. The salary inflation rate for the CSL Retirement Scheme is 5.0 per cent in 2013 to 2015, and 4.0 per cent thereafter which reflects the long term expectations for salary increases.
(g) Employer contributions
Telstra Super
The funding deed we have with Telstra Super requires contributions to be made when the average vested benefits index (VBI) in respect of the defined benefit membership (the ratio of defined benefit plan assets to defined benefit members’ vested benefits) of a calendar quarter falls to 103 per cent or below. For the quarter ended 30 June 2013, the VBI was 103 per cent (30 June 2012: 91 per cent). We have paid contributions totalling $435 million during the year (2012: $467 million). This includes employer contributions to the accumulation divisions, payroll tax and employee pre and post tax salary sacrifice contributions, which are excluded from the employer contributions in the reconciliations above. The current contribution rate for the defined benefit divisions of Telstra Super, effective June 2013, is 16 per cent of defined benefit member’s salaries (June 2012: 27 per cent).
The VBI, which forms the basis for determining our contribution levels under the funding deed, represents the total amount that Telstra Super would be required to pay if all defined benefit members were to voluntarily leave the fund on the valuation date. The VBI assesses the short term financial position of the plan. On the other hand the liability recognised in the statement of financial position is based on the projected benefit obligation (PBO), which represents the present value of employees’ benefits assuming that employees will continue to work and be part of the fund until their exit. The PBO takes into account future increases in an employee’s salary and provides a longer term financial position of the plan.
We will continue to monitor the performance of Telstra Super and reassess our employer contributions in light of actuarial recommendations. We expect to contribute approximately $385 million in financial year 2014, which includes contributions to the defined benefit divisions at a contribution rate of 16 per cent for financial year 2014. This contribution rate could change depending on market conditions during financial year 2014. This includes employer contributions to the accumulation divisions, payroll tax and employee pre and post tax salary sacrifice contributions.
CSL Retirement Scheme
The contributions payable to the defined benefit divisions are determined by the actuary using the attained age normal funding actuarial valuation method.
There were no employer contributions made to the CSL Retirement Scheme for financial year 2013 (2012: nil). We do not expect to make any contributions to our CSL Retirement Scheme in financial year 2014.
24. POST EMPLOYMENT BENEFITS (CONTINUED)
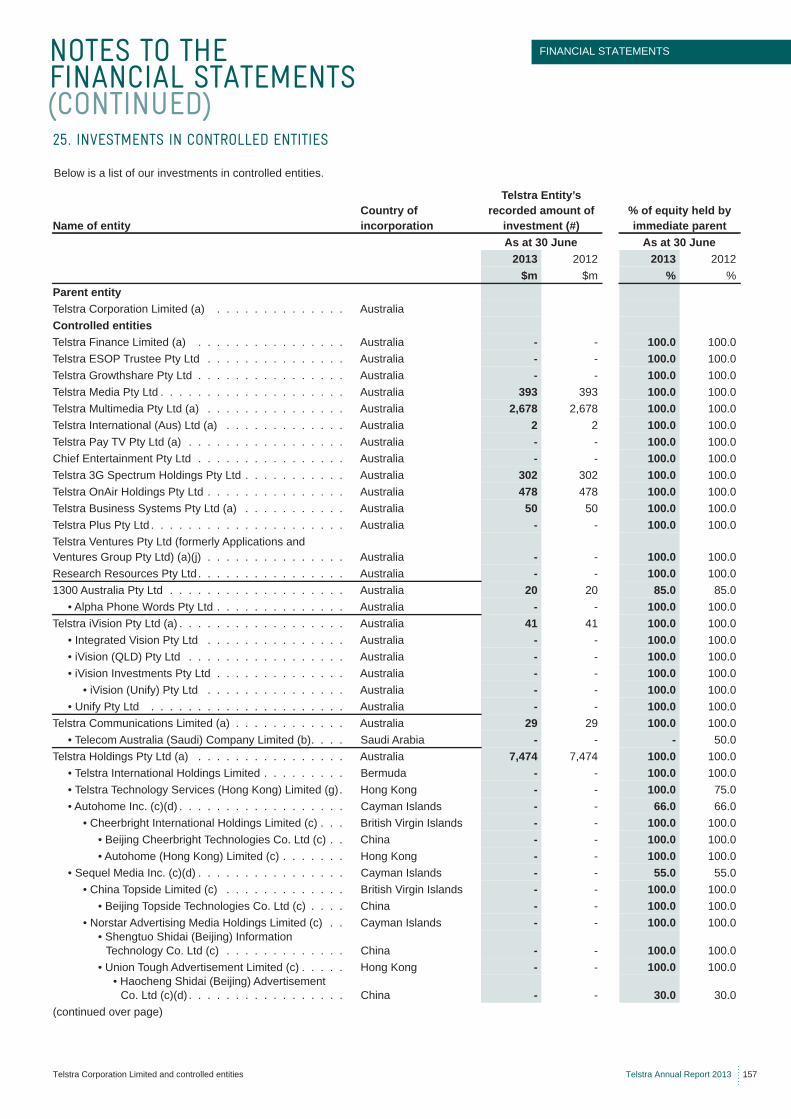
NOTES TO THE FINANCIAL STATEMENTS (CONTINUED)
FINANCIAL STATEMENTS
Telstra Corporation Limited and controlled entities Telstra Annual Report 2013 157
Below is a list of our investments in controlled entities.
25. INVESTMENTS IN CONTROLLED ENTITIES
Name of entityCountry of incorporation
Telstra Entity’s recorded amount of
investment (#)% of equity held by immediate parent
As at 30 June As at 30 June2013 2012 2013 2012
$m $m % %Parent entityTelstra Corporation Limited (a) . . . . . . . . . . . . . . AustraliaControlled entitiesTelstra Finance Limited (a) . . . . . . . . . . . . . . . . Australia - - 100.0 100.0Telstra ESOP Trustee Pty Ltd . . . . . . . . . . . . . . . Australia - - 100.0 100.0Telstra Growthshare Pty Ltd . . . . . . . . . . . . . . . . Australia - - 100.0 100.0Telstra Media Pty Ltd . . . . . . . . . . . . . . . . . . . . Australia 393 393 100.0 100.0Telstra Multimedia Pty Ltd (a) . . . . . . . . . . . . . . . Australia 2,678 2,678 100.0 100.0Telstra International (Aus) Ltd (a) . . . . . . . . . . . . . Australia 2 2 100.0 100.0Telstra Pay TV Pty Ltd (a) . . . . . . . . . . . . . . . . . Australia - - 100.0 100.0Chief Entertainment Pty Ltd . . . . . . . . . . . . . . . . Australia - - 100.0 100.0Telstra 3G Spectrum Holdings Pty Ltd . . . . . . . . . . . Australia 302 302 100.0 100.0Telstra OnAir Holdings Pty Ltd . . . . . . . . . . . . . . . Australia 478 478 100.0 100.0Telstra Business Systems Pty Ltd (a) . . . . . . . . . . . Australia 50 50 100.0 100.0Telstra Plus Pty Ltd . . . . . . . . . . . . . . . . . . . . . Australia - - 100.0 100.0Telstra Ventures Pty Ltd (formerly Applications and Ventures Group Pty Ltd) (a)(j) . . . . . . . . . . . . . . . Australia - - 100.0 100.0Research Resources Pty Ltd . . . . . . . . . . . . . . . . Australia - - 100.0 100.01300 Australia Pty Ltd . . . . . . . . . . . . . . . . . . . Australia 20 20 85.0 85.0
• Alpha Phone Words Pty Ltd . . . . . . . . . . . . . . Australia - - 100.0 100.0Telstra iVision Pty Ltd (a) . . . . . . . . . . . . . . . . . . Australia 41 41 100.0 100.0
• Integrated Vision Pty Ltd . . . . . . . . . . . . . . . Australia - - 100.0 100.0• iVision (QLD) Pty Ltd . . . . . . . . . . . . . . . . . Australia - - 100.0 100.0• iVision Investments Pty Ltd . . . . . . . . . . . . . . Australia - - 100.0 100.0
• iVision (Unify) Pty Ltd . . . . . . . . . . . . . . . Australia - - 100.0 100.0• Unify Pty Ltd . . . . . . . . . . . . . . . . . . . . . Australia - - 100.0 100.0
Telstra Communications Limited (a) . . . . . . . . . . . . Australia 29 29 100.0 100.0• Telecom Australia (Saudi) Company Limited (b). . . . Saudi Arabia - - - 50.0
Telstra Holdings Pty Ltd (a) . . . . . . . . . . . . . . . . Australia 7,474 7,474 100.0 100.0• Telstra International Holdings Limited . . . . . . . . . Bermuda - - 100.0 100.0• Telstra Technology Services (Hong Kong) Limited (g). Hong Kong - - 100.0 75.0• Autohome Inc. (c)(d) . . . . . . . . . . . . . . . . . . Cayman Islands - - 66.0 66.0
• Cheerbright International Holdings Limited (c) . . . British Virgin Islands - - 100.0 100.0• Beijing Cheerbright Technologies Co. Ltd (c) . . China - - 100.0 100.0• Autohome (Hong Kong) Limited (c) . . . . . . . Hong Kong - - 100.0 100.0
• Sequel Media Inc. (c)(d) . . . . . . . . . . . . . . . . Cayman Islands - - 55.0 55.0• China Topside Limited (c) . . . . . . . . . . . . . British Virgin Islands - - 100.0 100.0
• Beijing Topside Technologies Co. Ltd (c) . . . . China - - 100.0 100.0• Norstar Advertising Media Holdings Limited (c) . . Cayman Islands - - 100.0 100.0
• Shengtuo Shidai (Beijing) Information Technology Co. Ltd (c) . . . . . . . . . . . . . China - - 100.0 100.0
• Union Tough Advertisement Limited (c) . . . . . Hong Kong - - 100.0 100.0• Haocheng Shidai (Beijing) Advertisement
Co. Ltd (c)(d) . . . . . . . . . . . . . . . . . China - - 30.0 30.0(continued over page)
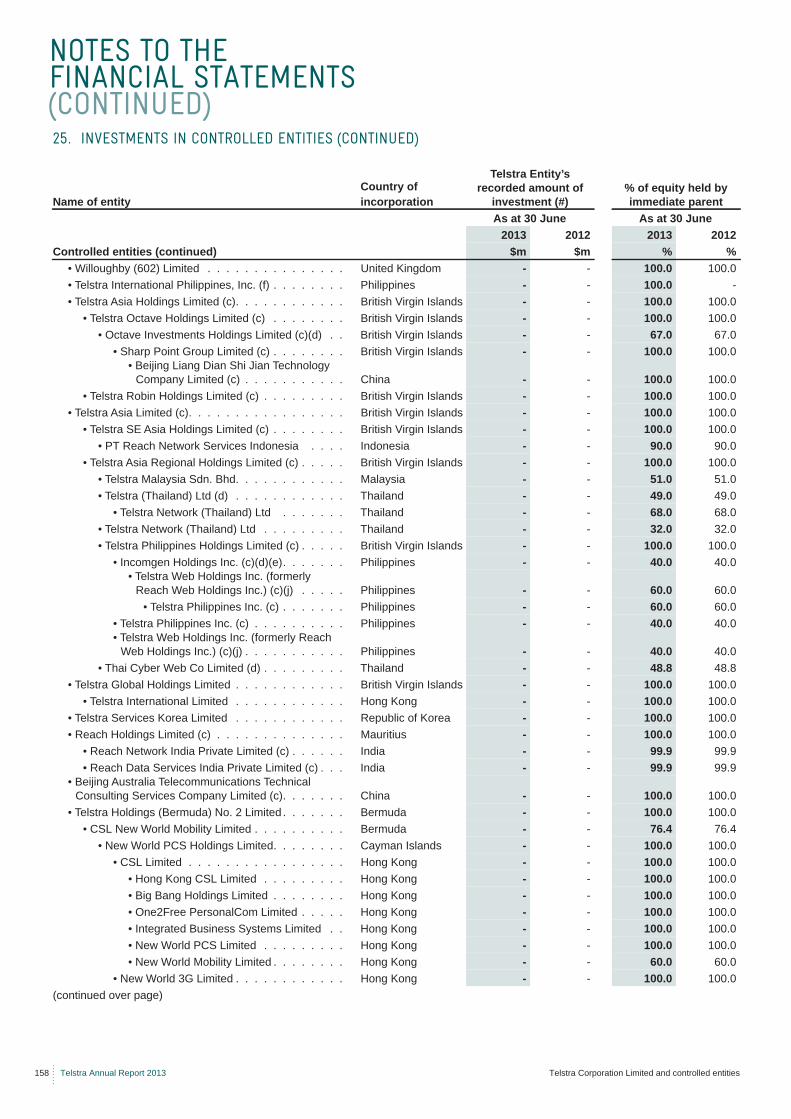
NOTES TO THE FINANCIAL STATEMENTS (CONTINUED)
158 Telstra Annual Report 2013 Telstra Corporation Limited and controlled entities
25. INVESTMENTS IN CONTROLLED ENTITIES (CONTINUED)
Name of entityCountry of incorporation
Telstra Entity’s recorded amount of
investment (#)% of equity held by immediate parent
As at 30 June As at 30 June2013 2012 2013 2012
Controlled entities (continued) $m $m % %• Willoughby (602) Limited . . . . . . . . . . . . . . . United Kingdom - - 100.0 100.0• Telstra International Philippines, Inc. (f) . . . . . . . . Philippines - - 100.0 -• Telstra Asia Holdings Limited (c). . . . . . . . . . . . British Virgin Islands - - 100.0 100.0
• Telstra Octave Holdings Limited (c) . . . . . . . . British Virgin Islands - - 100.0 100.0• Octave Investments Holdings Limited (c)(d) . . British Virgin Islands - - 67.0 67.0
• Sharp Point Group Limited (c) . . . . . . . . British Virgin Islands - - 100.0 100.0• Beijing Liang Dian Shi Jian Technology
Company Limited (c) . . . . . . . . . . . China - - 100.0 100.0• Telstra Robin Holdings Limited (c) . . . . . . . . . British Virgin Islands - - 100.0 100.0
• Telstra Asia Limited (c). . . . . . . . . . . . . . . . . British Virgin Islands - - 100.0 100.0• Telstra SE Asia Holdings Limited (c) . . . . . . . . British Virgin Islands - - 100.0 100.0
• PT Reach Network Services Indonesia . . . . Indonesia - - 90.0 90.0• Telstra Asia Regional Holdings Limited (c) . . . . . British Virgin Islands - - 100.0 100.0
• Telstra Malaysia Sdn. Bhd. . . . . . . . . . . . Malaysia - - 51.0 51.0• Telstra (Thailand) Ltd (d) . . . . . . . . . . . . Thailand - - 49.0 49.0
• Telstra Network (Thailand) Ltd . . . . . . . Thailand - - 68.0 68.0• Telstra Network (Thailand) Ltd . . . . . . . . . Thailand - - 32.0 32.0• Telstra Philippines Holdings Limited (c) . . . . . British Virgin Islands - - 100.0 100.0
• Incomgen Holdings Inc. (c)(d)(e). . . . . . . Philippines - - 40.0 40.0• Telstra Web Holdings Inc. (formerly
Reach Web Holdings Inc.) (c)(j) . . . . . Philippines - - 60.0 60.0• Telstra Philippines Inc. (c) . . . . . . . Philippines - - 60.0 60.0
• Telstra Philippines Inc. (c) . . . . . . . . . . Philippines - - 40.0 40.0• Telstra Web Holdings Inc. (formerly Reach
Web Holdings Inc.) (c)(j) . . . . . . . . . . . Philippines - - 40.0 40.0• Thai Cyber Web Co Limited (d) . . . . . . . . . Thailand - - 48.8 48.8
• Telstra Global Holdings Limited . . . . . . . . . . . . British Virgin Islands - - 100.0 100.0• Telstra International Limited . . . . . . . . . . . . Hong Kong - - 100.0 100.0
• Telstra Services Korea Limited . . . . . . . . . . . . Republic of Korea - - 100.0 100.0• Reach Holdings Limited (c) . . . . . . . . . . . . . . Mauritius - - 100.0 100.0
• Reach Network India Private Limited (c) . . . . . . India - - 99.9 99.9• Reach Data Services India Private Limited (c) . . . India - - 99.9 99.9
• Beijing Australia Telecommunications Technical Consulting Services Company Limited (c). . . . . . . China - - 100.0 100.0
• Telstra Holdings (Bermuda) No. 2 Limited . . . . . . . Bermuda - - 100.0 100.0• CSL New World Mobility Limited . . . . . . . . . . Bermuda - - 76.4 76.4
• New World PCS Holdings Limited. . . . . . . . Cayman Islands - - 100.0 100.0• CSL Limited . . . . . . . . . . . . . . . . . Hong Kong - - 100.0 100.0
• Hong Kong CSL Limited . . . . . . . . . Hong Kong - - 100.0 100.0• Big Bang Holdings Limited . . . . . . . . Hong Kong - - 100.0 100.0• One2Free PersonalCom Limited . . . . . Hong Kong - - 100.0 100.0• Integrated Business Systems Limited . . Hong Kong - - 100.0 100.0• New World PCS Limited . . . . . . . . . Hong Kong - - 100.0 100.0• New World Mobility Limited . . . . . . . . Hong Kong - - 60.0 60.0
• New World 3G Limited . . . . . . . . . . . . Hong Kong - - 100.0 100.0(continued over page)
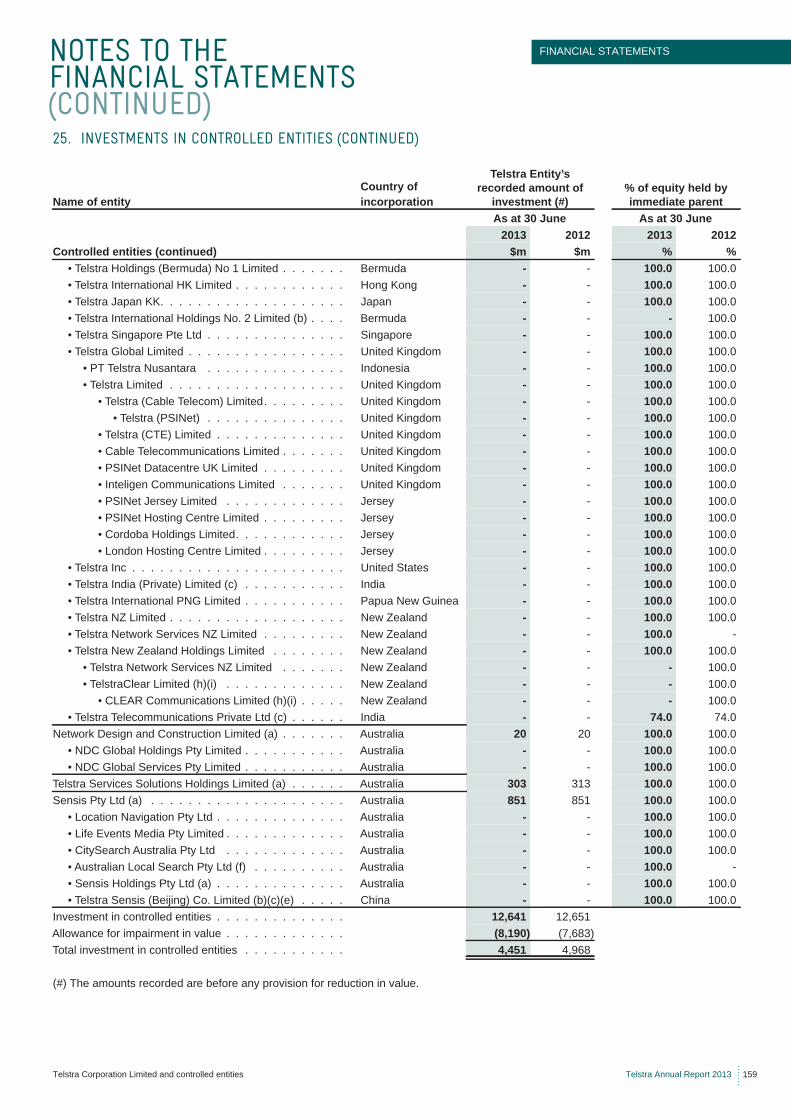
NOTES TO THE FINANCIAL STATEMENTS (CONTINUED)
FINANCIAL STATEMENTS
Telstra Corporation Limited and controlled entities Telstra Annual Report 2013 159
25. INVESTMENTS IN CONTROLLED ENTITIES (CONTINUED)
Name of entityCountry of incorporation
Telstra Entity’s recorded amount of
investment (#)% of equity held by immediate parent
As at 30 June As at 30 June2013 2012 2013 2012
Controlled entities (continued) $m $m % %• Telstra Holdings (Bermuda) No 1 Limited . . . . . . . Bermuda - - 100.0 100.0• Telstra International HK Limited . . . . . . . . . . . . Hong Kong - - 100.0 100.0• Telstra Japan KK. . . . . . . . . . . . . . . . . . . . Japan - - 100.0 100.0• Telstra International Holdings No. 2 Limited (b) . . . . Bermuda - - - 100.0• Telstra Singapore Pte Ltd . . . . . . . . . . . . . . . Singapore - - 100.0 100.0• Telstra Global Limited . . . . . . . . . . . . . . . . . United Kingdom - - 100.0 100.0
• PT Telstra Nusantara . . . . . . . . . . . . . . . Indonesia - - 100.0 100.0• Telstra Limited . . . . . . . . . . . . . . . . . . . United Kingdom - - 100.0 100.0
• Telstra (Cable Telecom) Limited. . . . . . . . . United Kingdom - - 100.0 100.0• Telstra (PSINet) . . . . . . . . . . . . . . . United Kingdom - - 100.0 100.0
• Telstra (CTE) Limited . . . . . . . . . . . . . . United Kingdom - - 100.0 100.0• Cable Telecommunications Limited . . . . . . . United Kingdom - - 100.0 100.0• PSINet Datacentre UK Limited . . . . . . . . . United Kingdom - - 100.0 100.0• Inteligen Communications Limited . . . . . . . United Kingdom - - 100.0 100.0• PSINet Jersey Limited . . . . . . . . . . . . . Jersey - - 100.0 100.0• PSINet Hosting Centre Limited . . . . . . . . . Jersey - - 100.0 100.0• Cordoba Holdings Limited. . . . . . . . . . . . Jersey - - 100.0 100.0• London Hosting Centre Limited . . . . . . . . . Jersey - - 100.0 100.0
• Telstra Inc . . . . . . . . . . . . . . . . . . . . . . . United States - - 100.0 100.0• Telstra India (Private) Limited (c) . . . . . . . . . . . India - - 100.0 100.0• Telstra International PNG Limited . . . . . . . . . . . Papua New Guinea - - 100.0 100.0• Telstra NZ Limited . . . . . . . . . . . . . . . . . . . New Zealand - - 100.0 100.0• Telstra Network Services NZ Limited . . . . . . . . . New Zealand - - 100.0 -• Telstra New Zealand Holdings Limited . . . . . . . . New Zealand - - 100.0 100.0
• Telstra Network Services NZ Limited . . . . . . . New Zealand - - - 100.0• TelstraClear Limited (h)(i) . . . . . . . . . . . . . New Zealand - - - 100.0
• CLEAR Communications Limited (h)(i) . . . . . New Zealand - - - 100.0• Telstra Telecommunications Private Ltd (c) . . . . . . India - - 74.0 74.0
Network Design and Construction Limited (a) . . . . . . . Australia 20 20 100.0 100.0• NDC Global Holdings Pty Limited . . . . . . . . . . . Australia - - 100.0 100.0• NDC Global Services Pty Limited . . . . . . . . . . . Australia - - 100.0 100.0
Telstra Services Solutions Holdings Limited (a) . . . . . . Australia 303 313 100.0 100.0Sensis Pty Ltd (a) . . . . . . . . . . . . . . . . . . . . . Australia 851 851 100.0 100.0
• Location Navigation Pty Ltd . . . . . . . . . . . . . . Australia - - 100.0 100.0• Life Events Media Pty Limited . . . . . . . . . . . . . Australia - - 100.0 100.0• CitySearch Australia Pty Ltd . . . . . . . . . . . . . Australia - - 100.0 100.0• Australian Local Search Pty Ltd (f) . . . . . . . . . . Australia - - 100.0 -• Sensis Holdings Pty Ltd (a) . . . . . . . . . . . . . . Australia - - 100.0 100.0• Telstra Sensis (Beijing) Co. Limited (b)(c)(e) . . . . . China - - 100.0 100.0
Investment in controlled entities . . . . . . . . . . . . . . 12,641 12,651Allowance for impairment in value . . . . . . . . . . . . . (8,190) (7,683)Total investment in controlled entities . . . . . . . . . . . 4,451 4,968
(#) The amounts recorded are before any provision for reduction in value.

NOTES TO THE FINANCIAL STATEMENTS (CONTINUED)
160 Telstra Annual Report 2013 Telstra Corporation Limited and controlled entities
(a) ASIC deed of cross guarantee financial information
A deed of cross guarantee was entered into on 17 May 2010, as defined in ASIC Class Order 98/1418 (Class Order).
The following entities form part of the deed of cross guarantee:
• Telstra Corporation Limited;• Telstra Multimedia Pty Ltd;• Telstra International (Aus) Ltd; • Telstra Pay TV Pty Ltd;• Telstra Ventures Pty Ltd;• Telstra iVision Pty Ltd;• Telstra Communications Limited;• Telstra Holdings Pty Ltd;• Network Design and Construction Limited;• Telstra Services Solutions Holdings Limited;• Sensis Pty Ltd; and• Sensis Holdings Pty Ltd.
Telstra Business Systems Pty Ltd was released from its obligations from the deed by way of a revocation deed on 18 December 2012.
Telstra Finance Limited is trustee of the closed group. However, it is not a group entity under the deed.
The relevant group entities under the deed:
• form a closed group and extended closed group as defined in the ASIC Class Order 98/1418 (Class Order);
• do not have to prepare and lodge audited financial reports under the Corporations Act 2001; and
• guarantee the payment in full of the debts of the other parties to the deed in the event of their winding up.
25. INVESTMENTS IN CONTROLLED ENTITIES (CONTINUED)
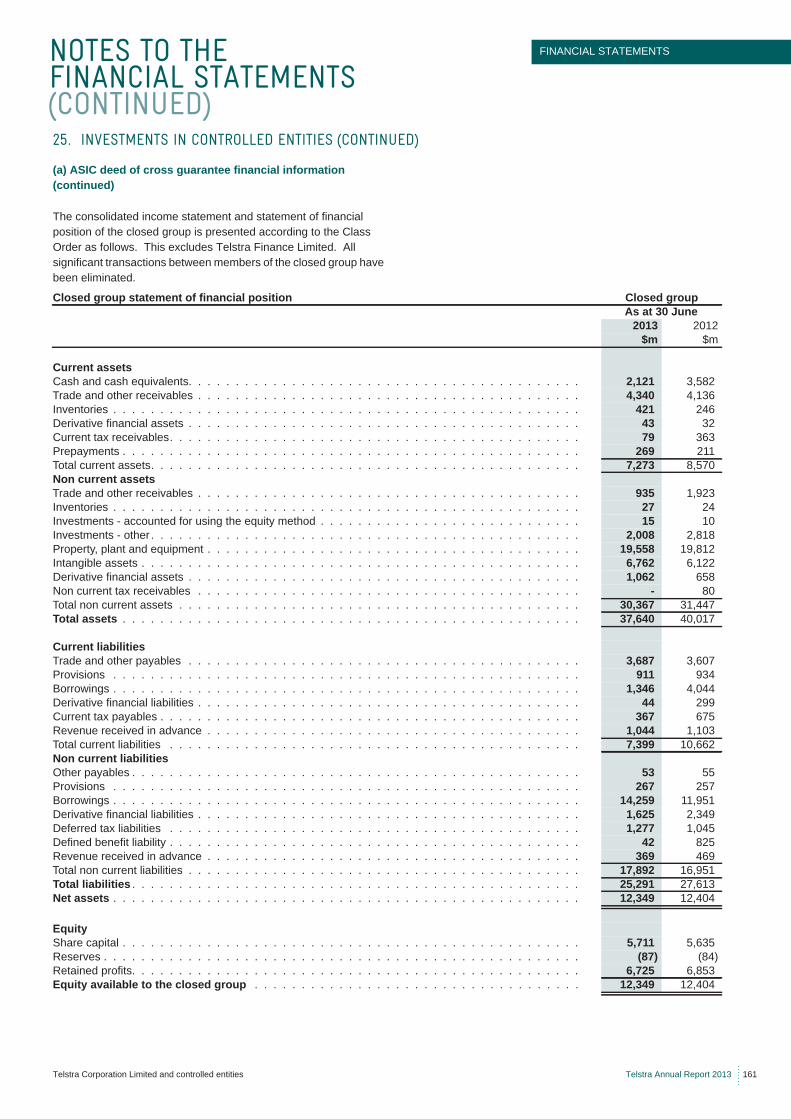
NOTES TO THE FINANCIAL STATEMENTS (CONTINUED)
FINANCIAL STATEMENTS
Telstra Corporation Limited and controlled entities Telstra Annual Report 2013 161
(a) ASIC deed of cross guarantee financial information (continued)
The consolidated income statement and statement of financial position of the closed group is presented according to the Class Order as follows. This excludes Telstra Finance Limited. All significant transactions between members of the closed group have been eliminated.
25. INVESTMENTS IN CONTROLLED ENTITIES (CONTINUED)
Closed group statement of financial position Closed groupAs at 30 June
2013 2012$m $m
Current assetsCash and cash equivalents. . . . . . . . . . . . . . . . . . . . . . . . . . . . . . . . . . . . . . . . . . 2,121 3,582Trade and other receivables . . . . . . . . . . . . . . . . . . . . . . . . . . . . . . . . . . . . . . . . . 4,340 4,136Inventories . . . . . . . . . . . . . . . . . . . . . . . . . . . . . . . . . . . . . . . . . . . . . . . . . . 421 246Derivative financial assets . . . . . . . . . . . . . . . . . . . . . . . . . . . . . . . . . . . . . . . . . . 43 32Current tax receivables. . . . . . . . . . . . . . . . . . . . . . . . . . . . . . . . . . . . . . . . . . . . 79 363Prepayments . . . . . . . . . . . . . . . . . . . . . . . . . . . . . . . . . . . . . . . . . . . . . . . . . 269 211Total current assets. . . . . . . . . . . . . . . . . . . . . . . . . . . . . . . . . . . . . . . . . . . . . . 7,273 8,570Non current assetsTrade and other receivables . . . . . . . . . . . . . . . . . . . . . . . . . . . . . . . . . . . . . . . . . 935 1,923Inventories . . . . . . . . . . . . . . . . . . . . . . . . . . . . . . . . . . . . . . . . . . . . . . . . . . 27 24Investments - accounted for using the equity method . . . . . . . . . . . . . . . . . . . . . . . . . . . . 15 10Investments - other . . . . . . . . . . . . . . . . . . . . . . . . . . . . . . . . . . . . . . . . . . . . . . 2,008 2,818Property, plant and equipment . . . . . . . . . . . . . . . . . . . . . . . . . . . . . . . . . . . . . . . . 19,558 19,812Intangible assets . . . . . . . . . . . . . . . . . . . . . . . . . . . . . . . . . . . . . . . . . . . . . . . 6,762 6,122Derivative financial assets . . . . . . . . . . . . . . . . . . . . . . . . . . . . . . . . . . . . . . . . . . 1,062 658Non current tax receivables . . . . . . . . . . . . . . . . . . . . . . . . . . . . . . . . . . . . . . . . . - 80Total non current assets . . . . . . . . . . . . . . . . . . . . . . . . . . . . . . . . . . . . . . . . . . . 30,367 31,447Total assets . . . . . . . . . . . . . . . . . . . . . . . . . . . . . . . . . . . . . . . . . . . . . . . . . 37,640 40,017
Current liabilitiesTrade and other payables . . . . . . . . . . . . . . . . . . . . . . . . . . . . . . . . . . . . . . . . . . 3,687 3,607Provisions . . . . . . . . . . . . . . . . . . . . . . . . . . . . . . . . . . . . . . . . . . . . . . . . . . 911 934Borrowings . . . . . . . . . . . . . . . . . . . . . . . . . . . . . . . . . . . . . . . . . . . . . . . . . . 1,346 4,044Derivative financial liabilities . . . . . . . . . . . . . . . . . . . . . . . . . . . . . . . . . . . . . . . . . 44 299Current tax payables . . . . . . . . . . . . . . . . . . . . . . . . . . . . . . . . . . . . . . . . . . . . . 367 675Revenue received in advance . . . . . . . . . . . . . . . . . . . . . . . . . . . . . . . . . . . . . . . . 1,044 1,103Total current liabilities . . . . . . . . . . . . . . . . . . . . . . . . . . . . . . . . . . . . . . . . . . . . 7,399 10,662Non current liabilitiesOther payables . . . . . . . . . . . . . . . . . . . . . . . . . . . . . . . . . . . . . . . . . . . . . . . . 53 55Provisions . . . . . . . . . . . . . . . . . . . . . . . . . . . . . . . . . . . . . . . . . . . . . . . . . . 267 257Borrowings . . . . . . . . . . . . . . . . . . . . . . . . . . . . . . . . . . . . . . . . . . . . . . . . . . 14,259 11,951Derivative financial liabilities . . . . . . . . . . . . . . . . . . . . . . . . . . . . . . . . . . . . . . . . . 1,625 2,349Deferred tax liabilities . . . . . . . . . . . . . . . . . . . . . . . . . . . . . . . . . . . . . . . . . . . . 1,277 1,045Defined benefit liability . . . . . . . . . . . . . . . . . . . . . . . . . . . . . . . . . . . . . . . . . . . . 42 825Revenue received in advance . . . . . . . . . . . . . . . . . . . . . . . . . . . . . . . . . . . . . . . . 369 469Total non current liabilities . . . . . . . . . . . . . . . . . . . . . . . . . . . . . . . . . . . . . . . . . . 17,892 16,951Total liabilities . . . . . . . . . . . . . . . . . . . . . . . . . . . . . . . . . . . . . . . . . . . . . . . . 25,291 27,613Net assets . . . . . . . . . . . . . . . . . . . . . . . . . . . . . . . . . . . . . . . . . . . . . . . . . . 12,349 12,404
EquityShare capital . . . . . . . . . . . . . . . . . . . . . . . . . . . . . . . . . . . . . . . . . . . . . . . . . 5,711 5,635Reserves . . . . . . . . . . . . . . . . . . . . . . . . . . . . . . . . . . . . . . . . . . . . . . . . . . . (87) (84)Retained profits. . . . . . . . . . . . . . . . . . . . . . . . . . . . . . . . . . . . . . . . . . . . . . . . 6,725 6,853Equity available to the closed group . . . . . . . . . . . . . . . . . . . . . . . . . . . . . . . . . . . 12,349 12,404
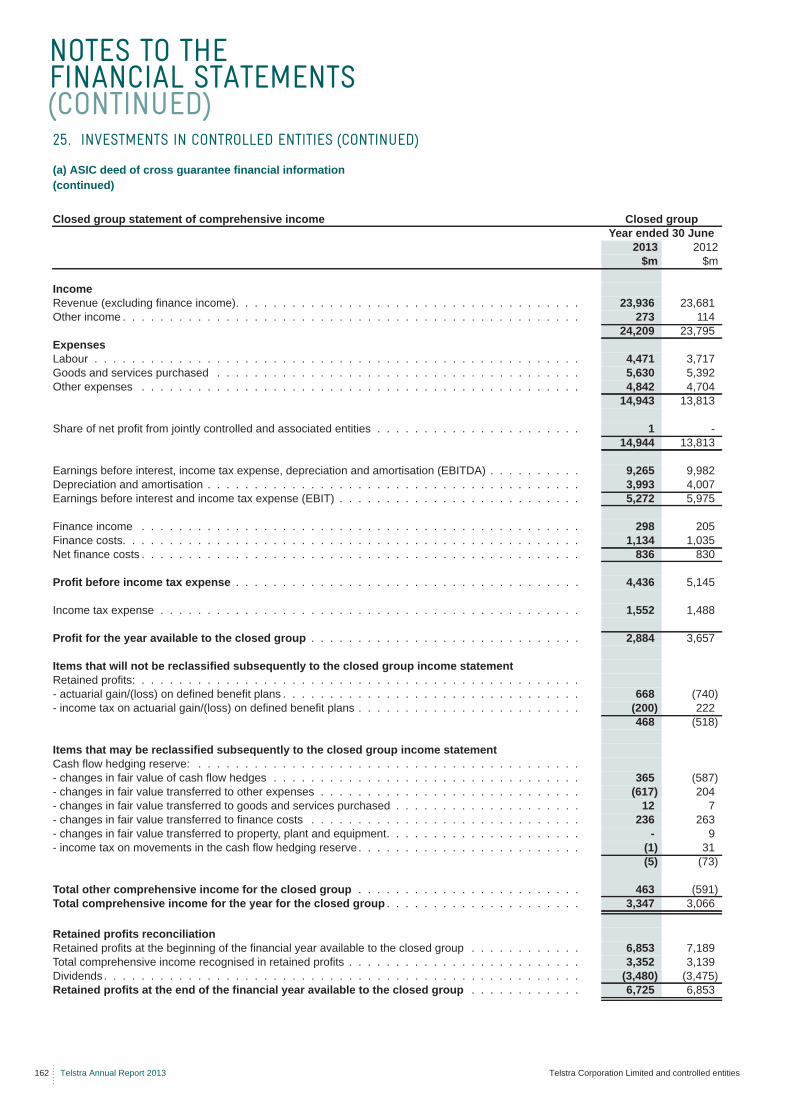
NOTES TO THE FINANCIAL STATEMENTS (CONTINUED)
162 Telstra Annual Report 2013 Telstra Corporation Limited and controlled entities
(a) ASIC deed of cross guarantee financial information (continued)
25. INVESTMENTS IN CONTROLLED ENTITIES (CONTINUED)
Closed group statement of comprehensive income Closed groupYear ended 30 June
2013 2012$m $m
IncomeRevenue (excluding finance income). . . . . . . . . . . . . . . . . . . . . . . . . . . . . . . . . . . . . 23,936 23,681Other income . . . . . . . . . . . . . . . . . . . . . . . . . . . . . . . . . . . . . . . . . . . . . . . . . 273 114
24,209 23,795ExpensesLabour . . . . . . . . . . . . . . . . . . . . . . . . . . . . . . . . . . . . . . . . . . . . . . . . . . . . 4,471 3,717Goods and services purchased . . . . . . . . . . . . . . . . . . . . . . . . . . . . . . . . . . . . . . . 5,630 5,392Other expenses . . . . . . . . . . . . . . . . . . . . . . . . . . . . . . . . . . . . . . . . . . . . . . . 4,842 4,704
14,943 13,813
Share of net profit from jointly controlled and associated entities . . . . . . . . . . . . . . . . . . . . . . 1 -14,944 13,813
Earnings before interest, income tax expense, depreciation and amortisation (EBITDA) . . . . . . . . . . 9,265 9,982Depreciation and amortisation . . . . . . . . . . . . . . . . . . . . . . . . . . . . . . . . . . . . . . . . 3,993 4,007Earnings before interest and income tax expense (EBIT) . . . . . . . . . . . . . . . . . . . . . . . . . . 5,272 5,975
Finance income . . . . . . . . . . . . . . . . . . . . . . . . . . . . . . . . . . . . . . . . . . . . . . . 298 205Finance costs. . . . . . . . . . . . . . . . . . . . . . . . . . . . . . . . . . . . . . . . . . . . . . . . . 1,134 1,035Net finance costs . . . . . . . . . . . . . . . . . . . . . . . . . . . . . . . . . . . . . . . . . . . . . . . 836 830
Profit before income tax expense . . . . . . . . . . . . . . . . . . . . . . . . . . . . . . . . . . . . . 4,436 5,145
Income tax expense . . . . . . . . . . . . . . . . . . . . . . . . . . . . . . . . . . . . . . . . . . . . . 1,552 1,488
Profit for the year available to the closed group . . . . . . . . . . . . . . . . . . . . . . . . . . . . . 2,884 3,657
Items that will not be reclassified subsequently to the closed group income statementRetained profits: . . . . . . . . . . . . . . . . . . . . . . . . . . . . . . . . . . . . . . . . . . . . . . . - actuarial gain/(loss) on defined benefit plans . . . . . . . . . . . . . . . . . . . . . . . . . . . . . . . . 668 (740)- income tax on actuarial gain/(loss) on defined benefit plans . . . . . . . . . . . . . . . . . . . . . . . . (200) 222
468 (518)
Items that may be reclassified subsequently to the closed group income statementCash flow hedging reserve: . . . . . . . . . . . . . . . . . . . . . . . . . . . . . . . . . . . . . . . . . - changes in fair value of cash flow hedges . . . . . . . . . . . . . . . . . . . . . . . . . . . . . . . . . 365 (587)- changes in fair value transferred to other expenses . . . . . . . . . . . . . . . . . . . . . . . . . . . . (617) 204- changes in fair value transferred to goods and services purchased . . . . . . . . . . . . . . . . . . . . 12 7- changes in fair value transferred to finance costs . . . . . . . . . . . . . . . . . . . . . . . . . . . . . 236 263- changes in fair value transferred to property, plant and equipment. . . . . . . . . . . . . . . . . . . . . - 9- income tax on movements in the cash flow hedging reserve . . . . . . . . . . . . . . . . . . . . . . . . (1) 31
(5) (73)
Total other comprehensive income for the closed group . . . . . . . . . . . . . . . . . . . . . . . . 463 (591)Total comprehensive income for the year for the closed group . . . . . . . . . . . . . . . . . . . . . 3,347 3,066
Retained profits reconciliationRetained profits at the beginning of the financial year available to the closed group . . . . . . . . . . . . 6,853 7,189Total comprehensive income recognised in retained profits . . . . . . . . . . . . . . . . . . . . . . . . . 3,352 3,139Dividends. . . . . . . . . . . . . . . . . . . . . . . . . . . . . . . . . . . . . . . . . . . . . . . . . . . (3,480) (3,475)Retained profits at the end of the financial year available to the closed group . . . . . . . . . . . . 6,725 6,853
NOTES TO THE FINANCIAL STATEMENTS (CONTINUED)
FINANCIAL STATEMENTS
Telstra Corporation Limited and controlled entities Telstra Annual Report 2013 163
(b) Liquidations
During 2013, the following entities were liquidated:
• Telecom Australia (Saudi) Company Limited; and• Telstra International Holdings No. 2 Limited.
At 30 June 2013, the following entity was in voluntary liquidation:
• Telstra Sensis (Beijing) Co. Limited.
(c) Controlled entities with different reporting dates
The following companies have reporting dates that differ from our reporting date of 30 June for financial year 2013:
• Autohome Inc. and its controlled entities - 31 December;• Sequel Media Inc. and its controlled entities - 31 December;• Telstra Asia Holdings Limited and its controlled entities - 31
December;• Telstra Asia Limited - 31 December;• Telstra SE Asia Holdings Limited - 31 December;• Telstra Asia Regional Holdings Limited - 31 December;• Telstra Philippines Holdings Limited and its controlled entities -
31 December;• Reach Holdings Limited - 31 December;• Reach Network India Private Limited - 31 March;• Reach Data Services India Private Limited - 31 March;• Beijing Australia Telecommunications Technical Consulting
Services Company Limited - 31 December;• Telstra India (Private) Limited - 31 March; • Telstra Telecommunications Private Ltd - 31 March; and• Telstra Sensis (Beijing) Co Limited - 31 December.
Financial reports prepared as at 30 June are used for consolidation purposes.
(d) Controlled entities in which our equity ownership is less than or equal to 50 per cent
We have no direct equity interest in the following entities within the Autohome Inc. Group:
• Beijing Autohome Information Technology Co. Ltd;• Shanghai Youcheyoujia Advertising Co. Ltd; and • Guangzhou You Che You Jia Advertising Co. Ltd.
The purpose of these entities is to hold the licences and approvals required to operate Autohome Inc.’s internet content provision and advertising business respectively, for which Autohome Inc. has the decision-making powers to control these entities. Autohome Inc. is one of our controlled entities, therefore we have consolidated the financial results, position and cash flows of these entities into our Telstra Group financial report.
We have no direct equity interest in the following entities within the Sequel Media Inc. Group:
• Beijing Haochen Domain Information Technology Co. Ltd;• Lianhe Shangqing (Beijing) Advertisement Co. Ltd;• Beijing POP Information Technology Co. Ltd; and• Shijiazhuang Xinrong Advertising Co. Ltd.
In addition, our controlled entity Union Tough Advertisement Limited has a 30 per cent direct interest in Haocheng Shidai (Beijing) Advertisement Co. Ltd.
The purpose of these entities is to hold the licences and approvals required to operate Sequel Media Inc.’s internet content provision and advertising business respectively. Sequel Media Inc. has the decision-making powers to control these entities. Sequel Media Inc. is one of our controlled entities, therefore we have consolidated the financial results, position and cash flows of these entities into our Telstra Group financial report.
We have no direct equity interest in the following entities within the Octave Investments Holdings Limited Group:
• Beijing Xunjie Yingxiang Network Technology Company Ltd;• Beijing Rui Xin Zai Xian System Technology Company Limited;• Guangzhou Rui Yin Digital Technology Company Limited;• Shijiazhuang Ruixin Yin Shang Digital Technology Company
Limited; and• Wuhan Rui Yin Zai Xian Digital Technology Company Limited.
The purpose of these entities is to hold the licences and approvals required to operate Octave Investments Holdings Limited’s internet content provision and mobile value added services. Octave Investments Holdings Limited has the decision-making powers to control these entities. Octave Investments Holdings Limited is one of our controlled entities, therefore we have consolidated the financial results, position and cash flows of these entities into our Telstra Group financial report.
25. INVESTMENTS IN CONTROLLED ENTITIES (CONTINUED)
NOTES TO THE FINANCIAL STATEMENTS (CONTINUED)
164 Telstra Annual Report 2013 Telstra Corporation Limited and controlled entities
(d) Controlled entities in which our equity ownership is less than or equal to 50 per cent (continued)
We have effective control over the following entities through economic dependency and contractual arrangements with the majority shareholders and have consolidated them into our group:
• Telstra (Thailand) Ltd;• Incomgen Holdings Inc.; and• Thai Cyber Web Co Limited.
(e) Controlled entities not individually audited by EY
These companies are not audited by EY, our Australian statutory auditor.
(f) New incorporations and business combinations
On 3 April 2013, a new controlled entity Telstra International Philippines, Inc. was incorporated.
On 29 April 2013, our controlled entity Sensis Pty Ltd acquired 100 per cent of the issued share capital of Australian Local Search Pty Ltd for consideration of $4 million. Refer to note 20 for further details.
(g) Purchase of additional interest
On 18 June 2013, Telstra Holdings Pty Ltd increased its ownership in Telstra Technology Services (Hong Kong) Limited from 75 per cent to 100 per cent for consideration of $1 million. Refer to note 20 for further details.
(h) Non current assets held for sale
On 30 June 2012, the carrying value of the assets and liabilities of TelstraClear Limited and its controlled entity were classified as held for sale. The sale was completed on 31 October 2012. Refer to note 12 for further details.
(i) Sales and disposals
On 31 October 2012, we sold our 100 per cent shareholding in TelstraClear Limited and its controlled entity for a total consideration of $669 million. Refer to note 20 for further details on our disposal.
(j) Name change
The following entities changed their names during financial year 2013:
• Application and Ventures Group Pty Ltd changed its name to Telstra Ventures Pty Ltd; and
• Reach Web Holdings Inc. changed its name to Telstra Web Holdings Inc.
25. INVESTMENTS IN CONTROLLED ENTITIES (CONTINUED)
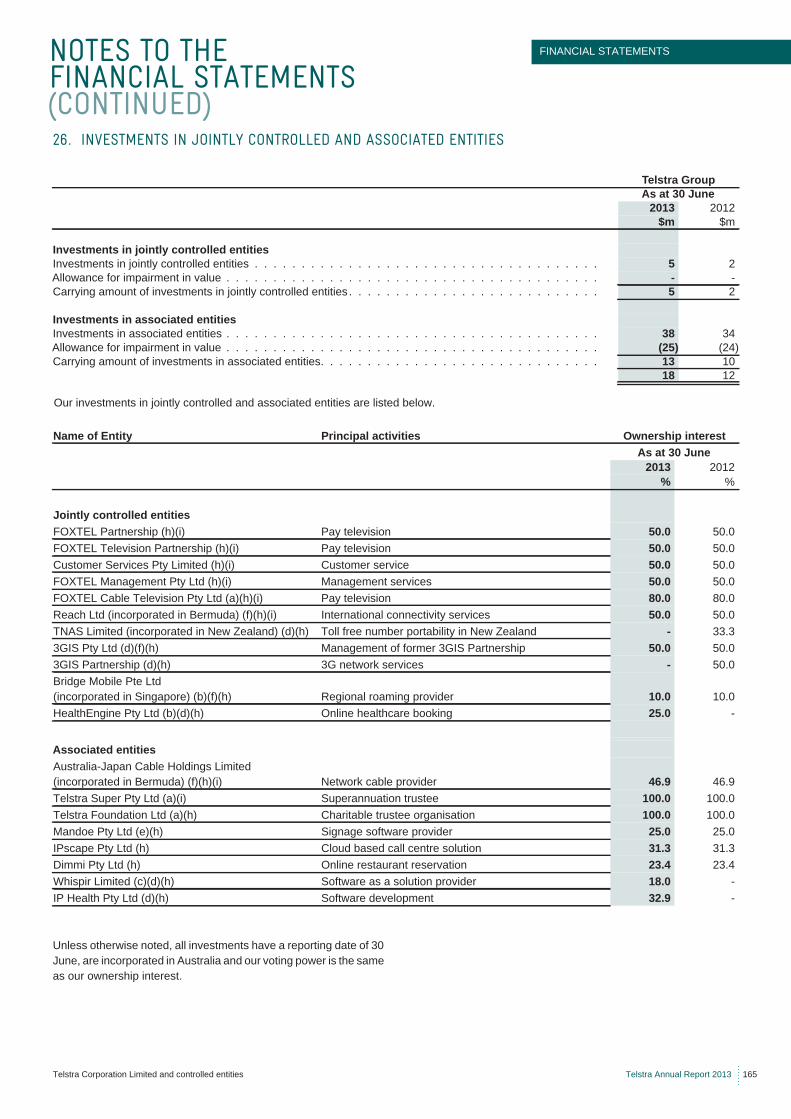
NOTES TO THE FINANCIAL STATEMENTS (CONTINUED)
FINANCIAL STATEMENTS
Telstra Corporation Limited and controlled entities Telstra Annual Report 2013 165
Our investments in jointly controlled and associated entities are listed below.
Unless otherwise noted, all investments have a reporting date of 30 June, are incorporated in Australia and our voting power is the same as our ownership interest.
26. INVESTMENTS IN JOINTLY CONTROLLED AND ASSOCIATED ENTITIES
Telstra GroupAs at 30 June
2013 2012$m $m
Investments in jointly controlled entitiesInvestments in jointly controlled entities . . . . . . . . . . . . . . . . . . . . . . . . . . . . . . . . . . . . . 5 2Allowance for impairment in value . . . . . . . . . . . . . . . . . . . . . . . . . . . . . . . . . . . . . . . . - -Carrying amount of investments in jointly controlled entities . . . . . . . . . . . . . . . . . . . . . . . . . . . 5 2
Investments in associated entitiesInvestments in associated entities . . . . . . . . . . . . . . . . . . . . . . . . . . . . . . . . . . . . . . . . 38 34Allowance for impairment in value . . . . . . . . . . . . . . . . . . . . . . . . . . . . . . . . . . . . . . . . (25) (24)Carrying amount of investments in associated entities. . . . . . . . . . . . . . . . . . . . . . . . . . . . . . 13 10
18 12
Name of Entity Principal activities Ownership interestAs at 30 June
2013 2012% %
Jointly controlled entitiesFOXTEL Partnership (h)(i) Pay television 50.0 50.0FOXTEL Television Partnership (h)(i) Pay television 50.0 50.0Customer Services Pty Limited (h)(i) Customer service 50.0 50.0FOXTEL Management Pty Ltd (h)(i) Management services 50.0 50.0FOXTEL Cable Television Pty Ltd (a)(h)(i) Pay television 80.0 80.0Reach Ltd (incorporated in Bermuda) (f)(h)(i) International connectivity services 50.0 50.0TNAS Limited (incorporated in New Zealand) (d)(h) Toll free number portability in New Zealand - 33.33GIS Pty Ltd (d)(f)(h) Management of former 3GIS Partnership 50.0 50.03GIS Partnership (d)(h) 3G network services - 50.0Bridge Mobile Pte Ltd (incorporated in Singapore) (b)(f)(h) Regional roaming provider 10.0 10.0HealthEngine Pty Ltd (b)(d)(h) Online healthcare booking 25.0 -
Associated entitiesAustralia-Japan Cable Holdings Limited (incorporated in Bermuda) (f)(h)(i) Network cable provider 46.9 46.9Telstra Super Pty Ltd (a)(i) Superannuation trustee 100.0 100.0Telstra Foundation Ltd (a)(h) Charitable trustee organisation 100.0 100.0Mandoe Pty Ltd (e)(h) Signage software provider 25.0 25.0IPscape Pty Ltd (h) Cloud based call centre solution 31.3 31.3Dimmi Pty Ltd (h) Online restaurant reservation 23.4 23.4Whispir Limited (c)(d)(h) Software as a solution provider 18.0 -IP Health Pty Ltd (d)(h) Software development 32.9 -
NOTES TO THE FINANCIAL STATEMENTS (CONTINUED)
166 Telstra Annual Report 2013 Telstra Corporation Limited and controlled entities
(a) Jointly controlled and associated entities in which we own more than 50 per cent equity
• We own 80 per cent of the equity of FOXTEL Cable Television Pty Ltd. This entity is disclosed as a jointly controlled entity as the other equity shareholders have participating rights that prevent us from dominating the decision-making of the board. Effective voting power is restricted to 50 per cent and we have joint control.
• We own 100 per cent of the equity of Telstra Super Pty Ltd, the trustee for the Telstra Superannuation Scheme (Telstra Super). We do not consolidate Telstra Super Pty Ltd as we do not control the Board of Directors. We have equal representation with employee representatives on the board. Our voting power is limited to 44 per cent, which is equivalent to our representation on the board. The entity is therefore classified as an associated entity as we have significant influence over it.
• We own 100 per cent of the equity of Telstra Foundation Ltd (TFL). TFL is limited by guarantee (guaranteed to $100) with Telstra Corporation Limited being the sole member. We did not contribute any equity to TFL on incorporation. TFL is the trustee of the Telstra Community Development Fund and manager of the Telstra Kids Fund. We do not consolidate TFL as we do not control the board. Our voting power on the board is limited to 38 per cent, which is equivalent to our representation on the board.
(b) Jointly controlled entities in which we own less than or equal to 50 per cent equity
We own 10 per cent of Bridge Mobile Pte Ltd and we have joint control over Bridge Mobile Pty Ltd through our decision making ability on the board.
We own 25 per cent of HealthEngine Pty Ltd and we have joint control over HealthEngine Pty Ltd through our decision making ability on the board.
(c) Associated entities in which we own less than or equal to 20 per cent equity
We own 18 per cent of Whispir Limited and we have significant influence over this entity through our decision making ability on the board.
(d) Other changes in jointly controlled and associated entities
During financial year 2013, we acquired interests in the following entities for a total consideration of $8 million:
• IP Health Pty Ltd;• HealthEngine Pty Ltd; and• Whispir Limited.
On 31 October 2012, we disposed of our 100 per cent shareholding in TelstraClear Limited and its controlled entity. The disposal included the investment in TNAS Limited.
Telstra and Vodafone Hutchison Australia concluded the 3GIS Partnership on 31 August 2012. We still retain our ownership interest in 3GIS Pty Ltd, which has been non-operating since that date.
(e) Dividends received
A $1 million dividend was received from Mandoe Pty Ltd during the year (2012: nil).
(f) Jointly controlled and associated entities with different reporting dates
The following jointly controlled and associated entities have different reporting dates from our reporting date of 30 June for financial year 2013:
• Reach Ltd - 31 December; • 3GIS Pty Ltd - 31 December;• Bridge Mobile Pte Ltd - 31 March; and• Australia-Japan Cable Holdings Limited - 31 December.
Financial reports prepared as at 30 June are used for equity accounting purposes. Our ownership interest in jointly controlled and associated entities with different reporting dates is the same at that reporting date as at 30 June unless otherwise noted.
(g) Share of net profits/(losses)
In financial year 2013, there was $1 million (2012: nil) share of losses from jointly controlled and associated entities.
26. INVESTMENTS IN JOINTLY CONTROLLED AND ASSOCIATED ENTITIES (CONTINUED)
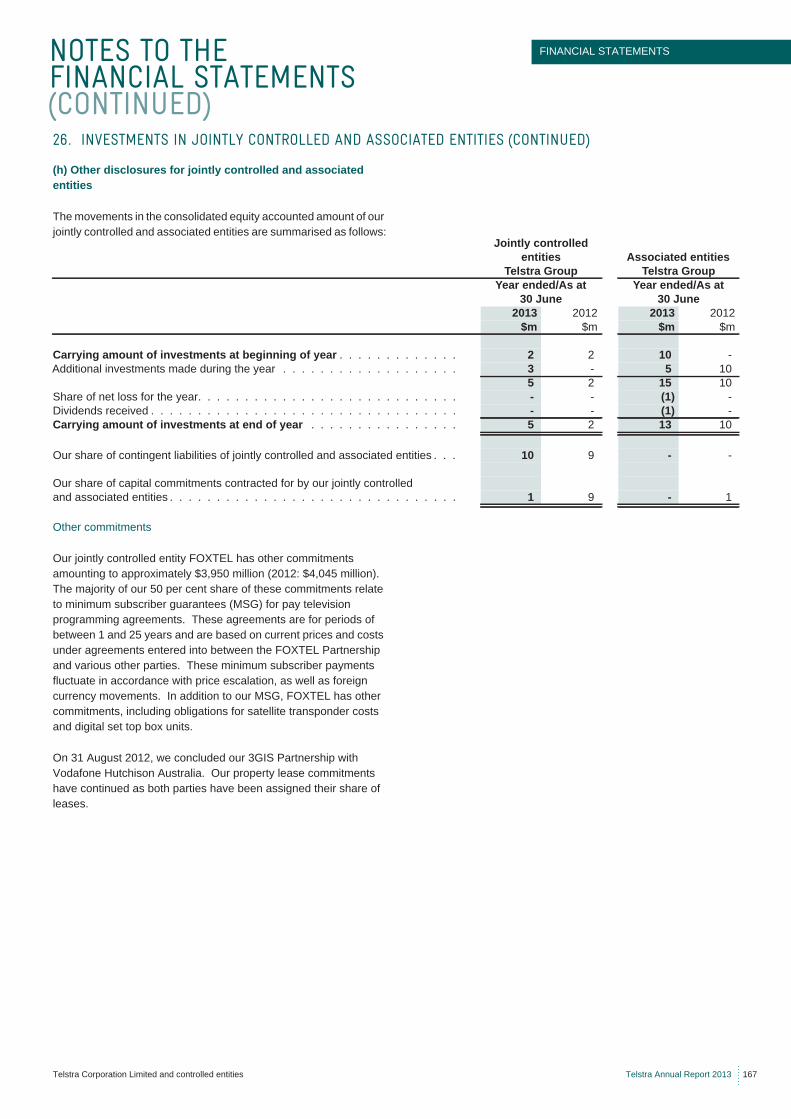
NOTES TO THE FINANCIAL STATEMENTS (CONTINUED)
FINANCIAL STATEMENTS
Telstra Corporation Limited and controlled entities Telstra Annual Report 2013 167
(h) Other disclosures for jointly controlled and associated entities
The movements in the consolidated equity accounted amount of our jointly controlled and associated entities are summarised as follows:
Other commitments
Our jointly controlled entity FOXTEL has other commitments amounting to approximately $3,950 million (2012: $4,045 million). The majority of our 50 per cent share of these commitments relate to minimum subscriber guarantees (MSG) for pay television programming agreements. These agreements are for periods of between 1 and 25 years and are based on current prices and costs under agreements entered into between the FOXTEL Partnership and various other parties. These minimum subscriber payments fluctuate in accordance with price escalation, as well as foreign currency movements. In addition to our MSG, FOXTEL has other commitments, including obligations for satellite transponder costs and digital set top box units.
On 31 August 2012, we concluded our 3GIS Partnership with Vodafone Hutchison Australia. Our property lease commitments have continued as both parties have been assigned their share of leases.
26. INVESTMENTS IN JOINTLY CONTROLLED AND ASSOCIATED ENTITIES (CONTINUED)
Jointly controlledentities Associated entities
Telstra Group Telstra GroupYear ended/As at Year ended/As at
30 June 30 June2013 2012 2013 2012
$m $m $m $m
Carrying amount of investments at beginning of year . . . . . . . . . . . . . 2 2 10 -Additional investments made during the year . . . . . . . . . . . . . . . . . . . 3 - 5 10
5 2 15 10Share of net loss for the year. . . . . . . . . . . . . . . . . . . . . . . . . . . . - - (1) -Dividends received . . . . . . . . . . . . . . . . . . . . . . . . . . . . . . . . . - - (1) -Carrying amount of investments at end of year . . . . . . . . . . . . . . . . 5 2 13 10
Our share of contingent liabilities of jointly controlled and associated entities . . . 10 9 - -
Our share of capital commitments contracted for by our jointly controlledand associated entities . . . . . . . . . . . . . . . . . . . . . . . . . . . . . . . 1 9 - 1
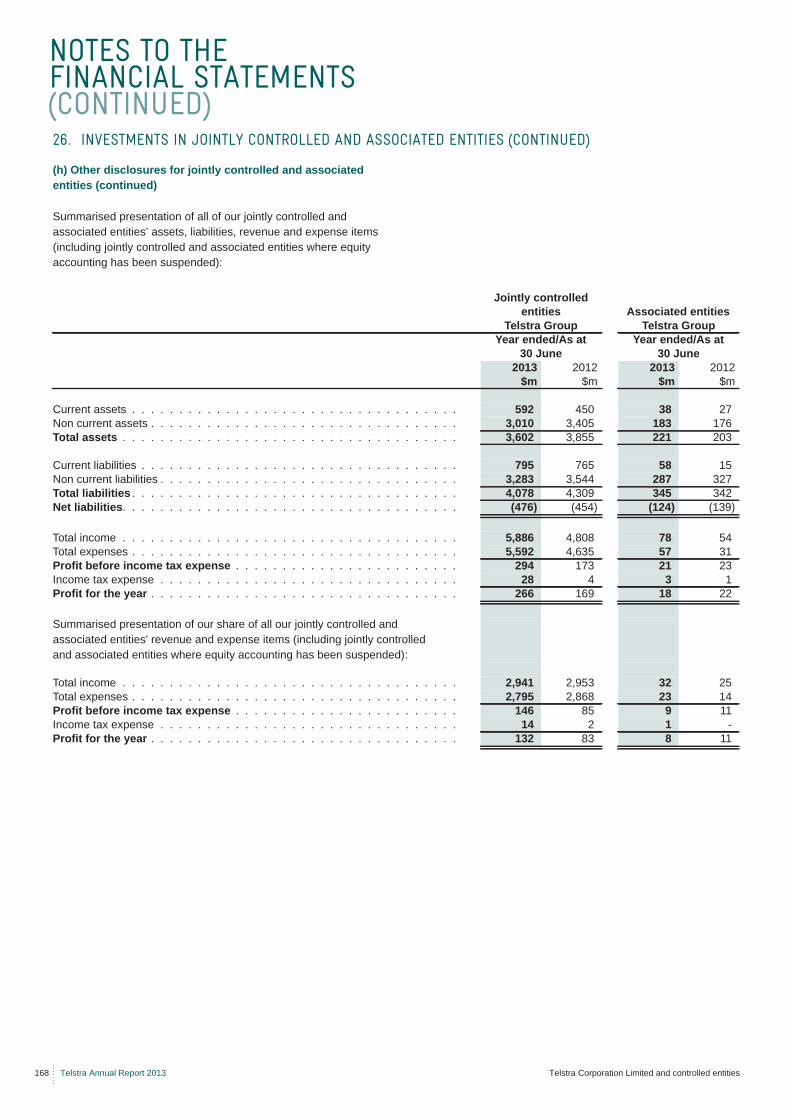
NOTES TO THE FINANCIAL STATEMENTS (CONTINUED)
168 Telstra Annual Report 2013 Telstra Corporation Limited and controlled entities
(h) Other disclosures for jointly controlled and associated entities (continued)
Summarised presentation of all of our jointly controlled and associated entities’ assets, liabilities, revenue and expense items (including jointly controlled and associated entities where equity accounting has been suspended):
26. INVESTMENTS IN JOINTLY CONTROLLED AND ASSOCIATED ENTITIES (CONTINUED)
Jointly controlledentities Associated entities
Telstra Group Telstra GroupYear ended/As at Year ended/As at
30 June 30 June2013 2012 2013 2012
$m $m $m $m
Current assets . . . . . . . . . . . . . . . . . . . . . . . . . . . . . . . . . . . 592 450 38 27Non current assets . . . . . . . . . . . . . . . . . . . . . . . . . . . . . . . . . 3,010 3,405 183 176Total assets . . . . . . . . . . . . . . . . . . . . . . . . . . . . . . . . . . . . 3,602 3,855 221 203
Current liabilities . . . . . . . . . . . . . . . . . . . . . . . . . . . . . . . . . . 795 765 58 15Non current liabilities . . . . . . . . . . . . . . . . . . . . . . . . . . . . . . . . 3,283 3,544 287 327Total liabilities . . . . . . . . . . . . . . . . . . . . . . . . . . . . . . . . . . . 4,078 4,309 345 342Net liabilities. . . . . . . . . . . . . . . . . . . . . . . . . . . . . . . . . . . . (476) (454) (124) (139)
Total income . . . . . . . . . . . . . . . . . . . . . . . . . . . . . . . . . . . . 5,886 4,808 78 54Total expenses . . . . . . . . . . . . . . . . . . . . . . . . . . . . . . . . . . . 5,592 4,635 57 31Profit before income tax expense . . . . . . . . . . . . . . . . . . . . . . . . 294 173 21 23Income tax expense . . . . . . . . . . . . . . . . . . . . . . . . . . . . . . . . 28 4 3 1Profit for the year . . . . . . . . . . . . . . . . . . . . . . . . . . . . . . . . . 266 169 18 22
Summarised presentation of our share of all our jointly controlled and associated entities' revenue and expense items (including jointly controlled and associated entities where equity accounting has been suspended):
Total income . . . . . . . . . . . . . . . . . . . . . . . . . . . . . . . . . . . . 2,941 2,953 32 25Total expenses . . . . . . . . . . . . . . . . . . . . . . . . . . . . . . . . . . . 2,795 2,868 23 14Profit before income tax expense . . . . . . . . . . . . . . . . . . . . . . . . 146 85 9 11Income tax expense . . . . . . . . . . . . . . . . . . . . . . . . . . . . . . . . 14 2 1 -Profit for the year . . . . . . . . . . . . . . . . . . . . . . . . . . . . . . . . . 132 83 8 11
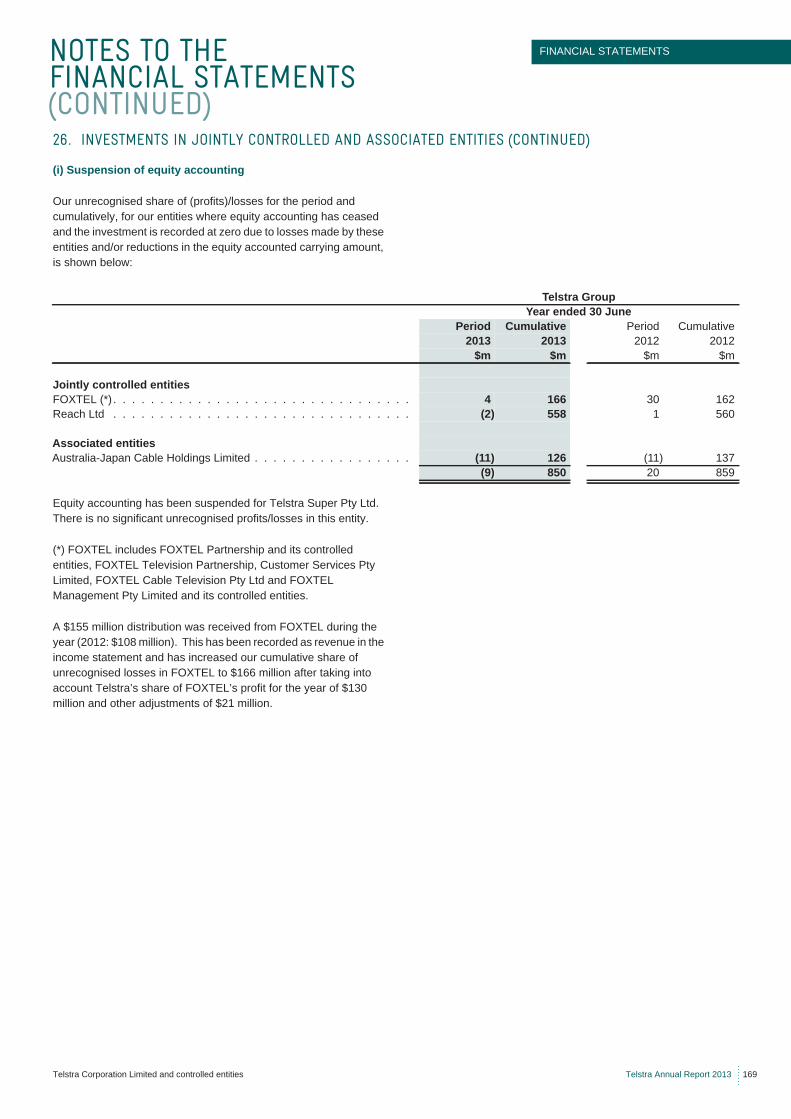
NOTES TO THE FINANCIAL STATEMENTS (CONTINUED)
FINANCIAL STATEMENTS
Telstra Corporation Limited and controlled entities Telstra Annual Report 2013 169
(i) Suspension of equity accounting
Our unrecognised share of (profits)/losses for the period and cumulatively, for our entities where equity accounting has ceased and the investment is recorded at zero due to losses made by these entities and/or reductions in the equity accounted carrying amount, is shown below:
Equity accounting has been suspended for Telstra Super Pty Ltd. There is no significant unrecognised profits/losses in this entity.
(*) FOXTEL includes FOXTEL Partnership and its controlled entities, FOXTEL Television Partnership, Customer Services Pty Limited, FOXTEL Cable Television Pty Ltd and FOXTEL Management Pty Limited and its controlled entities.
A $155 million distribution was received from FOXTEL during the year (2012: $108 million). This has been recorded as revenue in the income statement and has increased our cumulative share of unrecognised losses in FOXTEL to $166 million after taking into account Telstra’s share of FOXTEL’s profit for the year of $130 million and other adjustments of $21 million.
26. INVESTMENTS IN JOINTLY CONTROLLED AND ASSOCIATED ENTITIES (CONTINUED)
Telstra GroupYear ended 30 June
Period Cumulative Period Cumulative2013 2013 2012 2012
$m $m $m $m
Jointly controlled entitiesFOXTEL (*) . . . . . . . . . . . . . . . . . . . . . . . . . . . . . . . . 4 166 30 162Reach Ltd . . . . . . . . . . . . . . . . . . . . . . . . . . . . . . . . (2) 558 1 560
Associated entitiesAustralia-Japan Cable Holdings Limited . . . . . . . . . . . . . . . . . (11) 126 (11) 137
(9) 850 20 859
NOTES TO THE FINANCIAL STATEMENTS (CONTINUED)
170 Telstra Annual Report 2013 Telstra Corporation Limited and controlled entities
The Company has a number of employee share plans that are available for Directors, executives and employees. These include those conducted through the: • Telstra Growthshare Trust; and • Telstra Employee Share Ownership Plan Trusts (TESOP99 and
TESOP97).
The nature of each plan, details of plan holdings, movements in holdings, and other relevant information is disclosed below.
Telstra Growthshare Trust
The Telstra Growthshare Trust commenced in financial year 2000. Under the trust, Telstra operates a number of different equity plans, including:• short term incentive plans;• long term incentive plans; • Ownshare; and• other equity plans.
The trustee for the trust is Telstra Growthshare Pty Ltd. This company is 100 per cent owned by Telstra. Funding is provided to the Telstra Growthshare Trust to purchase Telstra shares to underpin the equity instruments issued.
In financial year 2013, we recorded an expense of $42 million for our share based payment plans operated by the Telstra Growthshare Trust (2012: $19 million). As at 30 June 2013, we had an estimated total expense yet to be recognised of $26 million (2012: $36 million), which is expected to be recognised over a weighted average of 1.6 years (2012: 1.5 years).
(a) Short term incentive (STI) plans
The purpose of the STI is to link key executives’ rewards to individual key performance indicators and to Telstra's financial performance. The STI is delivered in cash and incentive shares and the executive is paid an annual STI only when the threshold targets are met or exceeded.
(i) Description of equity instruments
Deferred shares for the Chief Executive Officer (CEO) and other senior executives (previously referred to as deferred incentive shares)
For financial years 2013, 2012 and 2011, the Board approved 25 per cent of the CEO and other senior executives’ STI to be allocated as deferred shares. The effective allocation date will be 16 August 2013 for financial year 2013, and was 17 August 2012 and 19 August 2011 for financial years 2012 and 2011, respectively. These shares vest in equal parts over one and two years on the anniversary of their effective allocation date, subject to the CEO or a senior executive’s continued employment with any entity that forms part of the Telstra Group. However, the CEO or a senior executive may retain the shares if they cease employment in a
number of circumstances, for example because of death, total and permanent disablement or redundancy (in each case subject to applicable law relating to the provision of benefits).
Applicable only to allocations from August 2012, deferred shares may also be retained if the CEO or a senior executive ceases employment due to retirement, expiry of a fixed term contract or country relocation, where that notice of retirement, fixed term contract expiry or request and agreement to relocate is more than six months after the actual allocation date. The CEO and senior executives are able to vote and receive dividends as and from the actual allocation date. Performance hurdles are applied in determining the number of deferred shares allocated and therefore deferred shares are not subject to any performance hurdles.
Deferred shares for other executives (previously referred to as deferred incentive shares)
For financial years 2013 and 2012, the Board approved 25 per cent of executives’ (other than the CEO and senior executives) short term incentive to be allocated as deferred shares. The effective allocation date for the financial year 2013 plan will be 16 August 2013 and was 17 August 2012 for the financial year 2012 plan. These shares will vest on the three year anniversary of their allocation date, subject to the executive’s continued employment with any entity that forms part of the Telstra Group. However, the executives may retain the shares if they cease employment in a number of circumstances, for example because of death, total and permanent disablement or redundancy (in each case subject to applicable law relating to the provision of benefits). Deferred shares may also be retained if the executive ceases employment due to retirement, expiry of a fixed term contract or country relocation where that notice of retirement, fixed term expiry or request and agreement to relocate is more than six months after the actual allocation date. The executive is able to vote and receive dividends as and from the allocation date. Performance hurdles are applied in determining the number of deferred shares allocated and therefore the deferred shares are not subject to any performance hurdles.
Incentive shares
In relation to the financial year 2008 and 2007 allocations of incentive shares, the incentive shares vested immediately, and the executive is able to use the incentive shares to vote and receive dividends from the vesting date. However, the executive is restricted from dealing with the vested incentive shares until after they are released from the restriction period.
Vested incentive shares are released from trust on the earliest of:
• five years from the date of effective allocation;• when the minimum level of executive shareholding has been
achieved and the Board approves removal of the five year restriction period;
• upon the ceasing of employment by the executive; or
27. EMPLOYEE SHARE PLANS
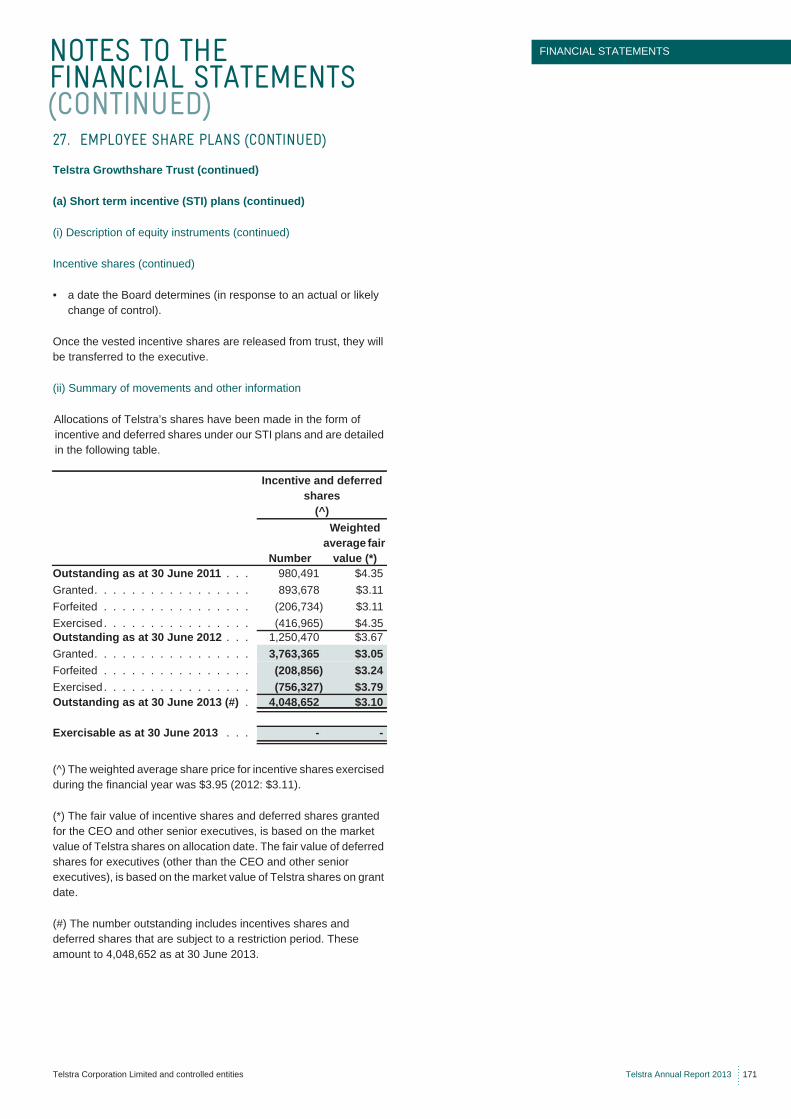
NOTES TO THE FINANCIAL STATEMENTS (CONTINUED)
FINANCIAL STATEMENTS
Telstra Corporation Limited and controlled entities Telstra Annual Report 2013 171
Telstra Growthshare Trust (continued)
(a) Short term incentive (STI) plans (continued)
(i) Description of equity instruments (continued)
Incentive shares (continued)
• a date the Board determines (in response to an actual or likely change of control).
Once the vested incentive shares are released from trust, they will be transferred to the executive.
(ii) Summary of movements and other information
Allocations of Telstra’s shares have been made in the form of incentive and deferred shares under our STI plans and are detailed in the following table.
(^) The weighted average share price for incentive shares exercised during the financial year was $3.95 (2012: $3.11).
(*) The fair value of incentive shares and deferred shares granted for the CEO and other senior executives, is based on the market value of Telstra shares on allocation date. The fair value of deferred shares for executives (other than the CEO and other senior executives), is based on the market value of Telstra shares on grant date.
(#) The number outstanding includes incentives shares and deferred shares that are subject to a restriction period. These amount to 4,048,652 as at 30 June 2013.
27. EMPLOYEE SHARE PLANS (CONTINUED)
Incentive and deferred shares
(^)
Number
Weighted average fair
value (*)Outstanding as at 30 June 2011 . . . 980,491 $4.35Granted. . . . . . . . . . . . . . . . . 893,678 $3.11Forfeited . . . . . . . . . . . . . . . . (206,734) $3.11Exercised. . . . . . . . . . . . . . . . (416,965) $4.35Outstanding as at 30 June 2012 . . . 1,250,470 $3.67Granted. . . . . . . . . . . . . . . . . 3,763,365 $3.05Forfeited . . . . . . . . . . . . . . . . (208,856) $3.24Exercised. . . . . . . . . . . . . . . . (756,327) $3.79Outstanding as at 30 June 2013 (#) . 4,048,652 $3.10
Exercisable as at 30 June 2013 . . . - -
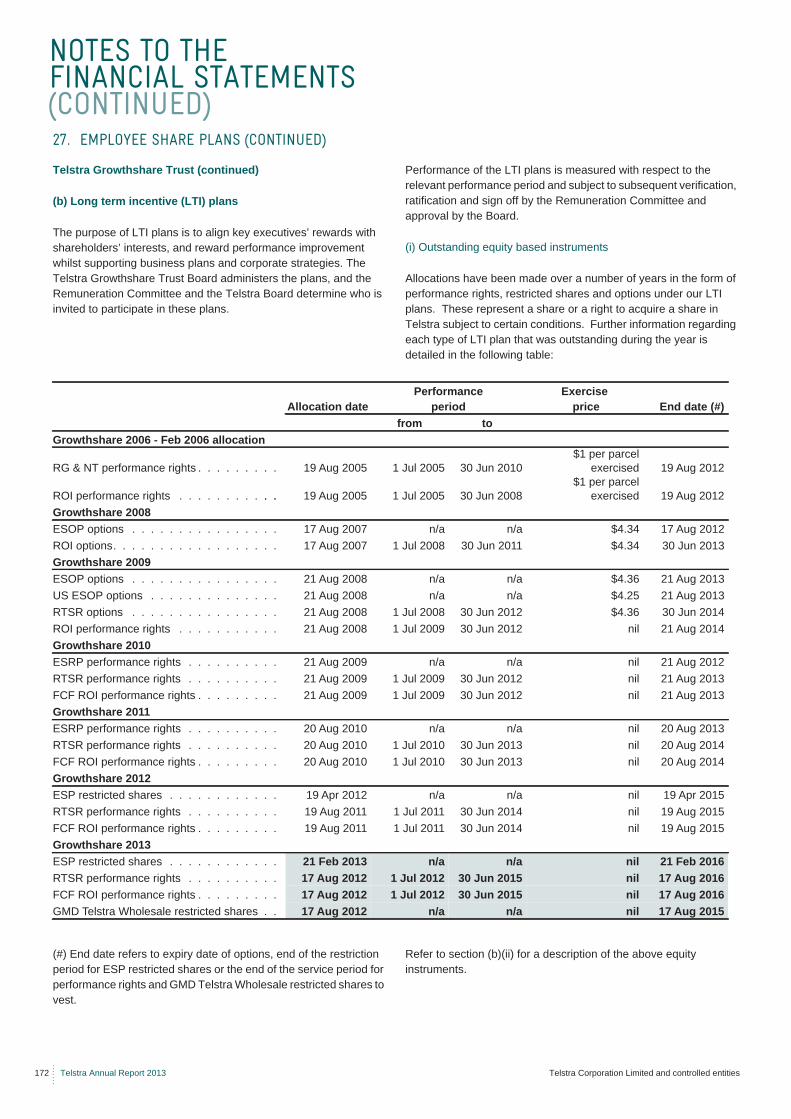
NOTES TO THE FINANCIAL STATEMENTS (CONTINUED)
172 Telstra Annual Report 2013 Telstra Corporation Limited and controlled entities
Telstra Growthshare Trust (continued)
(b) Long term incentive (LTI) plans
The purpose of LTI plans is to align key executives’ rewards with shareholders’ interests, and reward performance improvement whilst supporting business plans and corporate strategies. The Telstra Growthshare Trust Board administers the plans, and the Remuneration Committee and the Telstra Board determine who is invited to participate in these plans.
Performance of the LTI plans is measured with respect to the relevant performance period and subject to subsequent verification, ratification and sign off by the Remuneration Committee and approval by the Board.
(i) Outstanding equity based instruments
Allocations have been made over a number of years in the form of performance rights, restricted shares and options under our LTI plans. These represent a share or a right to acquire a share in Telstra subject to certain conditions. Further information regarding each type of LTI plan that was outstanding during the year is detailed in the following table:
(#) End date refers to expiry date of options, end of the restriction period for ESP restricted shares or the end of the service period for performance rights and GMD Telstra Wholesale restricted shares to vest.
Refer to section (b)(ii) for a description of the above equity instruments.
27. EMPLOYEE SHARE PLANS (CONTINUED)
Allocation datePerformance
periodExercise
price End date (#)from to
Growthshare 2006 - Feb 2006 allocation
RG & NT performance rights . . . . . . . . . 19 Aug 2005 1 Jul 2005 30 Jun 2010$1 per parcel
exercised 19 Aug 2012
ROI performance rights . . . . . . . . . . . . . 19 Aug 2005 1 Jul 2005 30 Jun 2008$1 per parcel
exercised 19 Aug 2012Growthshare 2008ESOP options . . . . . . . . . . . . . . . . 17 Aug 2007 n/a n/a $4.34 17 Aug 2012ROI options. . . . . . . . . . . . . . . . . . 17 Aug 2007 1 Jul 2008 30 Jun 2011 $4.34 30 Jun 2013Growthshare 2009ESOP options . . . . . . . . . . . . . . . . 21 Aug 2008 n/a n/a $4.36 21 Aug 2013US ESOP options . . . . . . . . . . . . . . 21 Aug 2008 n/a n/a $4.25 21 Aug 2013RTSR options . . . . . . . . . . . . . . . . 21 Aug 2008 1 Jul 2008 30 Jun 2012 $4.36 30 Jun 2014ROI performance rights . . . . . . . . . . . 21 Aug 2008 1 Jul 2009 30 Jun 2012 nil 21 Aug 2014Growthshare 2010ESRP performance rights . . . . . . . . . . 21 Aug 2009 n/a n/a nil 21 Aug 2012RTSR performance rights . . . . . . . . . . 21 Aug 2009 1 Jul 2009 30 Jun 2012 nil 21 Aug 2013FCF ROI performance rights . . . . . . . . . 21 Aug 2009 1 Jul 2009 30 Jun 2012 nil 21 Aug 2013Growthshare 2011ESRP performance rights . . . . . . . . . . 20 Aug 2010 n/a n/a nil 20 Aug 2013RTSR performance rights . . . . . . . . . . 20 Aug 2010 1 Jul 2010 30 Jun 2013 nil 20 Aug 2014FCF ROI performance rights . . . . . . . . . 20 Aug 2010 1 Jul 2010 30 Jun 2013 nil 20 Aug 2014Growthshare 2012ESP restricted shares . . . . . . . . . . . . 19 Apr 2012 n/a n/a nil 19 Apr 2015RTSR performance rights . . . . . . . . . . 19 Aug 2011 1 Jul 2011 30 Jun 2014 nil 19 Aug 2015FCF ROI performance rights . . . . . . . . . 19 Aug 2011 1 Jul 2011 30 Jun 2014 nil 19 Aug 2015Growthshare 2013ESP restricted shares . . . . . . . . . . . . 21 Feb 2013 n/a n/a nil 21 Feb 2016RTSR performance rights . . . . . . . . . . 17 Aug 2012 1 Jul 2012 30 Jun 2015 nil 17 Aug 2016FCF ROI performance rights . . . . . . . . . 17 Aug 2012 1 Jul 2012 30 Jun 2015 nil 17 Aug 2016GMD Telstra Wholesale restricted shares . . 17 Aug 2012 n/a n/a nil 17 Aug 2015
NOTES TO THE FINANCIAL STATEMENTS (CONTINUED)
FINANCIAL STATEMENTS
Telstra Corporation Limited and controlled entities Telstra Annual Report 2013 173
Telstra Growthshare Trust (continued)
(b) Long term incentive (LTI) plans (continued)
(i) Outstanding equity based instruments (continued)
In relation to these executive LTI plans, the Board may, in its discretion, reset the hurdles governing the financial year 2013, 2012, 2011, 2010 and 2009 equity instruments to make them consistent with the changed circumstances resulting from the occurrence of factors including:
• a material change in the strategic business plan; • a material regulatory change; or • a significant out-of-plan business development (this could
include a major acquisition outside the current business plan, resulting in a significant change to the business of Telstra or the Telstra Group, that means that (in the reasonable opinion of the Board) the targets for that class of equity instruments are no longer appropriate).
In financial year 2013, the Board did not reset the hurdles governing the equity instruments issued in financial years 2013, 2012, 2011, 2010 or 2009.
(ii) Description of equity instruments
Performance rights
Executive LTI performance rights (previously referred to as restricted shares)
In respect of performance rights, an executive has no legal or beneficial interest in the underlying shares, no entitlement to dividends received from the shares and no voting rights in relation to the shares until the performance rights become restricted trust shares.
In relation to performance rights issued, except for the 2006 financial year, if the performance hurdle is satisfied during the applicable performance period, a specified number of performance rights, as determined in accordance with the trust deed and terms of issue, will become restricted trust shares. Although the trustee holds the shares in trust, the executive will retain beneficial interest (dividends, voting rights, bonuses and rights issues) in the shares until they vest and are transferred to them or sold on their behalf, at the end of the restriction period (unless forfeited).
In respect of performance rights allocated in financial year 2006, if the performance hurdle is satisfied during the applicable performance period, a specified number of performance rights, as determined in accordance with the trust deed and terms of issue, will become vested performance rights. The exercise price for these rights is $1 in total for all of the performance rights exercised on a particular day.
Employee share rights plan (ESRP) performance rights
For ESRP performance rights allocated in financial years 2011 and 2010, there is no exercise price payable. Once the performance rights have vested, the rights will be automatically exercised and Telstra shares will be transferred to the employee. Until this time, the employee cannot use the performance rights (or vested performance rights) to vote or receive dividends
A description of each type of performance right that existed in financial year 2013 is set out below:
Executive LTI performance rights:
• revenue growth (RG) performance rights - the performance hurdle for these rights is based on increases in Telstra’s revenue;
• network transformation (NT) performance rights - the performance hurdle for these rights is based on completion of certain elements in Telstra’s network transformation program;
• return on investment (ROI) performance rights - the performance hurdle for these rights is based on an increase in the earnings before interest and tax for Telstra divided by the average investment;
• relative total shareholder return (RTSR) performance rights - the performance hurdle for these rights is based on growth in Telstra's total shareholder return relative to the growth in total shareholder return of the companies in a peer group; and
• free cashflow return on investment (FCF ROI) performance rights - the performance hurdle for these rights is based on Telstra’s annual free cashflow (less finance costs) over the performance period divided by the average investment over the performance period.
Employee performance rights:
• employee share rights plan (ESRP) performance rights - the vesting condition for these rights is based on the completion of three years continuous service by the participant (and once granted are not subject to any performance conditions).
Restricted shares
GMD Telstra Wholesale restricted shares
Due to the Structural Separation Undertaking (SSU) arising from the NBN transaction, the GMD of Telstra Wholesale is prohibited from participating in the financial year 2013 and 2012 LTI plans. As a result, an alternative remuneration arrangement has been provided in financial year 2013, which is a restricted share plan where the number of restricted shares allocated is based on the same performance measures as his financial year 2012 STI plan.
27. EMPLOYEE SHARE PLANS (CONTINUED)
NOTES TO THE FINANCIAL STATEMENTS (CONTINUED)
174 Telstra Annual Report 2013 Telstra Corporation Limited and controlled entities
Telstra Growthshare Trust (continued)
(b) Long term incentive (LTI) plans (continued)
(ii) Description of equity instruments (continued)
Restricted shares (continued)
Employee Share Plan (ESP) restricted shares
Restricted shares provided under the ESP in financial years 2013 and 2012 were allocated at no cost to certain eligible employees (excluding executives). The shares are held by the Trustee on behalf of employees until the restriction period ends. During the restriction period, employees are entitled to exercise the voting rights attached to the shares and to receive dividends on the shares. The shares are released from trust on the earlier of three years from the date of allocation or the date the participating employee ceases relevant employment.
A description of each type of restricted share that existed in financial year 2013 is set out below:
Executive LTI restricted shares
• GMD Telstra Wholesale restricted shares - performance hurdles are applied in determining the number of restricted shares allocated and therefore the restricted shared are not subject to any performance hurdles.
Employee restricted shares
• Employee Share Plan (ESP) restricted shares - there are no performance hurdles for these restricted shares.
Options
An employee or executive is not entitled to Telstra shares unless the options initially vest (subject to the achievement of the relevant performance hurdles) and then are exercised. This means that the employee or executive cannot use options to vote or receive dividends until they have vested and been exercised. If the performance hurdles are satisfied in the applicable performance period, options must be exercised at any time before the expiry date, otherwise they will lapse. Once the options are exercised and the exercise price paid, Telstra shares will be transferred to the eligible employee or executive.
A description of each type of option that existed in financial year 2013 is set out below:
Executive LTI options • relative total shareholder return options (RTSR options) - the
performance hurdle for these options is based on growth in
Telstra's total shareholder return relative to the growth in total shareholder return of the companies in a peer group; and
• return on investment options (ROI options) - the performance hurdle for these options is based on an increase in the earnings before interest and tax for Telstra relative to the average investment.
Employee options
• ESOP options - the vesting condition for these options is based on the completion of three years continuous service by the participant (and once granted are not subject to any performance conditions); and
• US ESOP options - the vesting condition for these options is based on the completion of three years continuous service by the participant (and once granted are not subject to any performance conditions).
(iii) Performance hurdles
Performance rights
Details of the relevant performance hurdles in relation to performance rights, are set out below:
Relative Total Shareholder Return (RTSR) performance rights
For financial years 2013, 2012, 2011 and 2010 RTSR performance rights, the single performance period is the three year period ending on 30 June 2015, 30 June 2014, 30 June 2013 and 30 June 2012 respectively.
If Telstra achieves a result placing it in at least the 50th percentile for the performance period, then:
• the number of RTSR performance rights that will meet the hurdle for that performance period is scaled proportionately from the 50th percentile (which equates to 25 per cent of the allocation) to the 75th percentile (which equates to 100 per cent of the allocation); and
• any performance rights that do not meet the hurdle will lapse.
If Telstra does not reach the 50th percentile, all of these RTSR performance rights will lapse.
Any RTSR performance rights that meet the hurdle become restricted trust shares and are held by the Trustee until the restriction period ends (four years after the effective allocation date of the restricted shares) at which point they then vest.
Free Cashflow Return on Investment (FCF ROI) performance rights
For financial years 2013, 2012, 2011 and 2010 FCF ROI performance rights, the single performance period is the three year period ending on 30 June 2015, 30 June 2014, 30 June 2013 and 30 June 2012 respectively.
27. EMPLOYEE SHARE PLANS (CONTINUED)
NOTES TO THE FINANCIAL STATEMENTS (CONTINUED)
FINANCIAL STATEMENTS
Telstra Corporation Limited and controlled entities Telstra Annual Report 2013 175
Telstra Growthshare Trust (continued)
(b) Long term incentive (LTI) plans (continued)
(iii) Performance hurdles (continued)
Performance rights (continued)
The number of FCF ROI performance rights that will meet the hurdle is calculated as follows:
• if the threshold target is achieved, then 50 per cent of the allocation of FCF ROI performance rights will meet the hurdle;
• if the result achieved is between the threshold and stretch targets, then the number of FCF ROI performance rights that will meet the hurdle is scaled proportionately between 50 per cent and 100 per cent;
• if the stretch target is achieved or exceeded, then 100 per cent of the FCF ROI performance rights will meet the hurdle; and
• if the threshold target is not achieved, all of these FCF ROI performance rights will lapse.
Any FCF ROI performance rights that meet the hurdle become restricted trust shares and are held by the Trustee until the end of the restriction period (four years after the effective allocation date of the performance rights) at which point they then vest.
Return on Investment (ROI) performance rights
For ROI performance rights for financial year 2009, there are three performance periods as follows:
• first performance period - 1 July 2009 to 30 June 2010;• second performance period - 1 July 2010 to 30 June 2011; and• third performance period - 1 July 2011 to 30 June 2012.
For each of the performance periods, the number of performance rights that will vest is calculated as follows:
• if the threshold target is achieved, then 50 per cent of the allocation of performance rights for that period will vest;
• if the result achieved is between the threshold and stretch target, then the number of performance rights for that period that will vest is scaled proportionately between 50 per cent and 100 per cent; and
• if the stretch target is achieved or exceeded, then 100 per cent of the performance rights for that period will vest.
Any performance rights that vest become restricted trust shares. Any performance rights which do not vest in their respective performance periods will lapse.
Employee Share Rights Plan (ESRP) performance rights
As part of the employee share rights plan for financial years 2011 and 2010, certain eligible employees were provided performance rights that vest upon completing certain employment requirements. If an eligible employee continues to be employed by an entity that forms part of the Telstra Group three years after the effective allocation date of the performance rights (and in certain other circumstances) the performance rights will vest. These performance rights are not subject to any performance hurdles.
Options
Details of the relevant performance hurdles in relation to options are set out below:
ESOP options and US ESOP options
As part of the employee share option plan for financial years 2009 and 2008, certain eligible employees were provided options that vest upon completing certain employment requirements. If an eligible employee continues to be employed by an entity that forms part of the Telstra Group three years after the effective allocation date of the options (and in certain other circumstances), the options will vest. These options are not subject to any performance hurdles.
Relative Total Shareholder Return (RTSR) options
For RTSR options for financial year 2009, the applicable performance hurdle is based on comparing the TSR growth of Telstra against other companies in the peer group. Telstra is then given a score to determine its rank in comparison to the peer group. The RTSR options vest only if Telstra achieves a rank of at least the 50th percentile.
The Board has the discretion to amend the members in the peer group, as well as make necessary adjustments to the calculation of the TSR amount, TSR growth or rank.
For RTSR options, there are three performance periods as follows:
• first performance period - 1 July 2008 to 30 June 2010;• second performance period - 1 July 2008 to 30 June 2011; and• third performance period - 1 July 2008 to 30 June 2012.
The result for each performance period is separately measured. If Telstra achieves a rank greater than or equal to the 50th percentile for the performance period, then:
• the number of TSR options that will vest for that performance period is scaled proportionately from the 50th percentile (at which 25 per cent of the allocation becomes exercisable) to the 75th percentile (at which 100 per cent of the allocation becomes exercisable); and
• 25 per cent of any unvested options for that performance period will lapse.
27. EMPLOYEE SHARE PLANS (CONTINUED)
NOTES TO THE FINANCIAL STATEMENTS (CONTINUED)
176 Telstra Annual Report 2013 Telstra Corporation Limited and controlled entities
Telstra Growthshare Trust (continued)
(b) Long term incentive (LTI) plans (continued)
(iii) Performance hurdles (continued)
Options (continued)
If Telstra achieves a rank of less than the 50th percentile for the performance period, then none of the options allocated for that performance period will vest and 25 per cent of the options will lapse.
In addition, for the third performance period, if Telstra's rank meets or exceeds:
• both the 50th percentile and the rank achieved in the first performance period, the remaining unvested options from the first performance period will vest; and/or
• both the 50th percentile and the rank achieved in the second performance period, the remaining unvested options from the second performance period will vest.
The number of additional unvested options which may vest is also determined by using a linear scale.
If Telstra achieves a rank of less than the 50th percentile for the third performance period, then no options will vest for the third performance period. Furthermore, any remaining unvested options will lapse following the end of the third performance period.
Return on Investment (ROI) options
The ROI hurdle for financial year 2008 has been measured over the following three performance periods:
• First performance period - 1 July 2008 to 30 June 2009;• Second performance period - 1 July 2009 to 30 June 2010; and• Third performance period - 1 July 2010 to 30 June 2011.
For each of the performance periods, the number of options that will vest is calculated as follows:
• if the threshold target is achieved in the applicable performance period, then 50 per cent of the allocation of options will vest;
• if the result achieved is between the threshold and stretch targets, then the number of vested options is scaled proportionately between 50 per cent and 100 per cent; and
• if the stretch target is achieved, then 100 per cent of the options will vest.
Any options which do not vest in their respective performance period lapse.
Restricted shares
Details of the relevant performance hurdles in relation to restricted shares are set out below:
GMD Telstra Wholesale restricted shares
As part of the financial year 2013 GMD Telstra Wholesale restricted share plan, the GMD of Telstra Wholesale was provided restricted shares. Performance hurdles were applied in determining the number of restricted shares allocated and therefore the restricted shares are not subject to any performance hurdles.
Employee Share Plan (ESP) restricted shares
As part of the financial year 2013 and 2012 ESP, certain eligible employees were provided restricted shares. There are no performance hurdles for these restricted shares.
27. EMPLOYEE SHARE PLANS (CONTINUED)
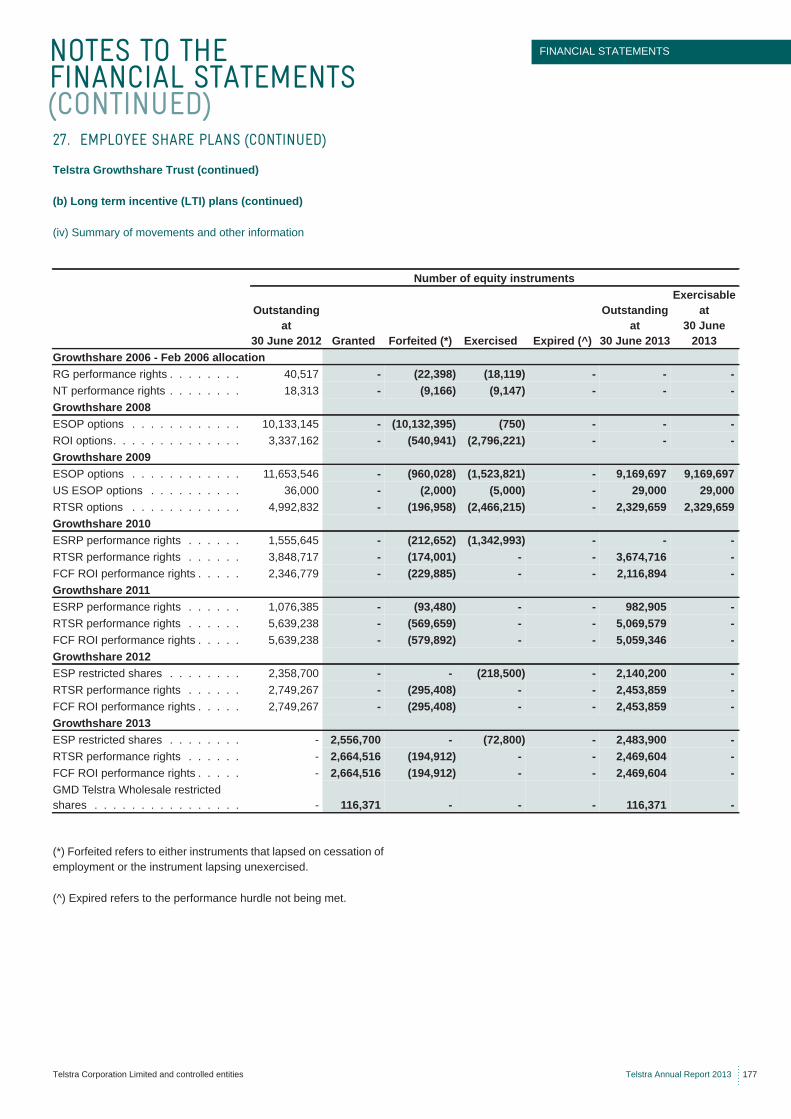
NOTES TO THE FINANCIAL STATEMENTS (CONTINUED)
FINANCIAL STATEMENTS
Telstra Corporation Limited and controlled entities Telstra Annual Report 2013 177
.
Telstra Growthshare Trust (continued)
(b) Long term incentive (LTI) plans (continued)
(iv) Summary of movements and other information
(*) Forfeited refers to either instruments that lapsed on cessation of employment or the instrument lapsing unexercised.
(^) Expired refers to the performance hurdle not being met.
27. EMPLOYEE SHARE PLANS (CONTINUED)
Number of equity instruments
Outstanding at
30 June 2012 Granted Forfeited (*) Exercised Expired (^)
Outstanding at
30 June 2013
Exercisable at
30 June 2013
Growthshare 2006 - Feb 2006 allocationRG performance rights . . . . . . . . 40,517 - (22,398) (18,119) - - -NT performance rights . . . . . . . . 18,313 - (9,166) (9,147) - - -Growthshare 2008ESOP options . . . . . . . . . . . . 10,133,145 - (10,132,395) (750) - - -ROI options. . . . . . . . . . . . . . 3,337,162 - (540,941) (2,796,221) - - -Growthshare 2009ESOP options . . . . . . . . . . . . 11,653,546 - (960,028) (1,523,821) - 9,169,697 9,169,697US ESOP options . . . . . . . . . . 36,000 - (2,000) (5,000) - 29,000 29,000RTSR options . . . . . . . . . . . . 4,992,832 - (196,958) (2,466,215) - 2,329,659 2,329,659Growthshare 2010ESRP performance rights . . . . . . 1,555,645 - (212,652) (1,342,993) - - -RTSR performance rights . . . . . . 3,848,717 - (174,001) - - 3,674,716 -FCF ROI performance rights . . . . . 2,346,779 - (229,885) - - 2,116,894 -Growthshare 2011ESRP performance rights . . . . . . 1,076,385 - (93,480) - - 982,905 -RTSR performance rights . . . . . . 5,639,238 - (569,659) - - 5,069,579 -FCF ROI performance rights . . . . . 5,639,238 - (579,892) - - 5,059,346 -Growthshare 2012ESP restricted shares . . . . . . . . 2,358,700 - - (218,500) - 2,140,200 -RTSR performance rights . . . . . . 2,749,267 - (295,408) - - 2,453,859 -FCF ROI performance rights . . . . . 2,749,267 - (295,408) - - 2,453,859 -Growthshare 2013ESP restricted shares . . . . . . . . - 2,556,700 - (72,800) - 2,483,900 -RTSR performance rights . . . . . . - 2,664,516 (194,912) - - 2,469,604 -FCF ROI performance rights . . . . . - 2,664,516 (194,912) - - 2,469,604 -GMD Telstra Wholesale restricted shares . . . . . . . . . . . . . . . . - 116,371 - - - 116,371 -
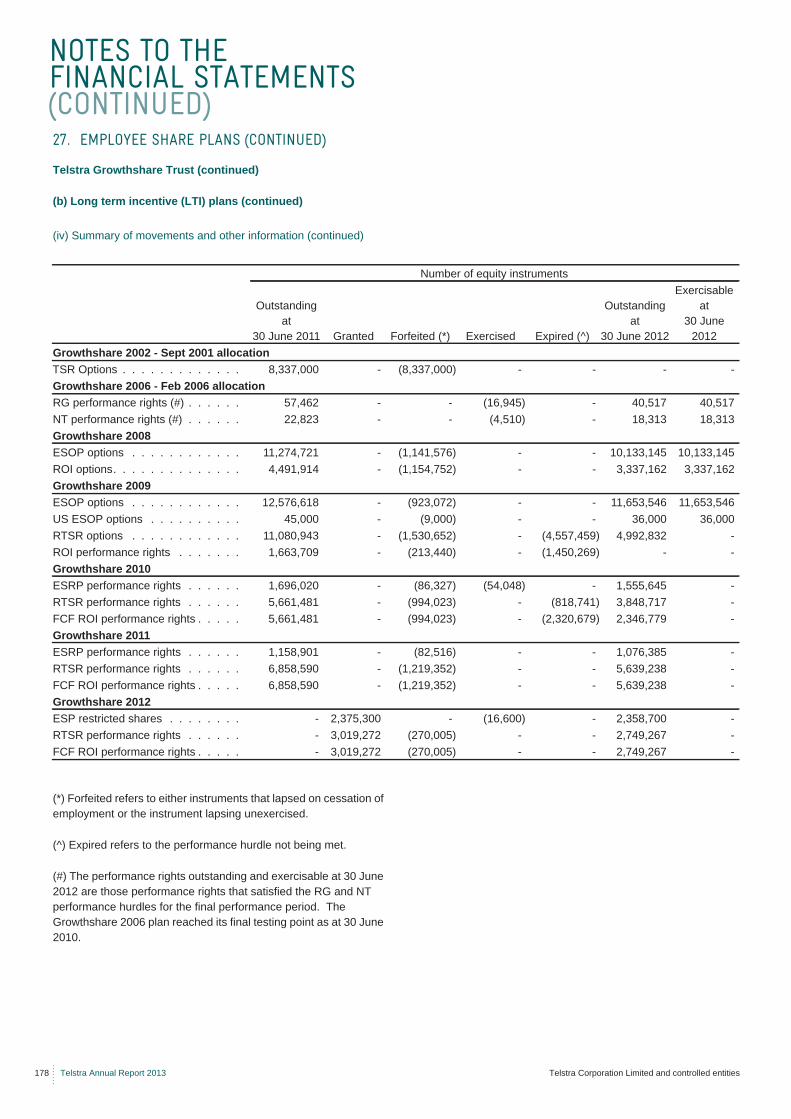
NOTES TO THE FINANCIAL STATEMENTS (CONTINUED)
178 Telstra Annual Report 2013 Telstra Corporation Limited and controlled entities
Telstra Growthshare Trust (continued)
(b) Long term incentive (LTI) plans (continued)
(iv) Summary of movements and other information (continued)
(*) Forfeited refers to either instruments that lapsed on cessation of employment or the instrument lapsing unexercised.
(^) Expired refers to the performance hurdle not being met.
(#) The performance rights outstanding and exercisable at 30 June 2012 are those performance rights that satisfied the RG and NT performance hurdles for the final performance period. The Growthshare 2006 plan reached its final testing point as at 30 June 2010.
27. EMPLOYEE SHARE PLANS (CONTINUED)
Number of equity instruments
Outstanding at
30 June 2011 Granted Forfeited (*) Exercised Expired (^)
Outstanding at
30 June 2012
Exercisable at
30 June 2012
Growthshare 2002 - Sept 2001 allocationTSR Options . . . . . . . . . . . . . 8,337,000 - (8,337,000) - - - -Growthshare 2006 - Feb 2006 allocationRG performance rights (#) . . . . . . 57,462 - - (16,945) - 40,517 40,517NT performance rights (#) . . . . . . 22,823 - - (4,510) - 18,313 18,313Growthshare 2008ESOP options . . . . . . . . . . . . 11,274,721 - (1,141,576) - - 10,133,145 10,133,145ROI options. . . . . . . . . . . . . . 4,491,914 - (1,154,752) - - 3,337,162 3,337,162Growthshare 2009ESOP options . . . . . . . . . . . . 12,576,618 - (923,072) - - 11,653,546 11,653,546US ESOP options . . . . . . . . . . 45,000 - (9,000) - - 36,000 36,000RTSR options . . . . . . . . . . . . 11,080,943 - (1,530,652) - (4,557,459) 4,992,832 -ROI performance rights . . . . . . . 1,663,709 - (213,440) - (1,450,269) - -Growthshare 2010ESRP performance rights . . . . . . 1,696,020 - (86,327) (54,048) - 1,555,645 -RTSR performance rights . . . . . . 5,661,481 - (994,023) - (818,741) 3,848,717 -FCF ROI performance rights . . . . . 5,661,481 - (994,023) - (2,320,679) 2,346,779 -Growthshare 2011ESRP performance rights . . . . . . 1,158,901 - (82,516) - - 1,076,385 -RTSR performance rights . . . . . . 6,858,590 - (1,219,352) - - 5,639,238 -FCF ROI performance rights . . . . . 6,858,590 - (1,219,352) - - 5,639,238 -Growthshare 2012ESP restricted shares . . . . . . . . - 2,375,300 - (16,600) - 2,358,700 -RTSR performance rights . . . . . . - 3,019,272 (270,005) - - 2,749,267 -FCF ROI performance rights . . . . . - 3,019,272 (270,005) - - 2,749,267 -
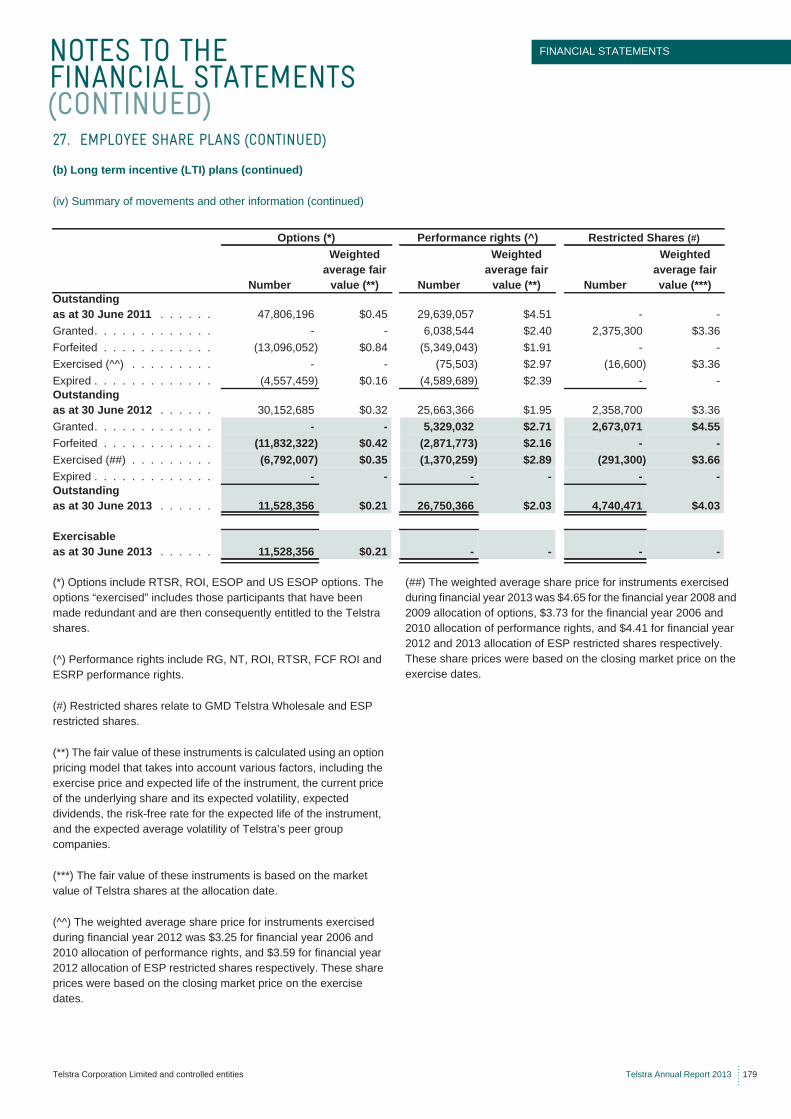
NOTES TO THE FINANCIAL STATEMENTS (CONTINUED)
FINANCIAL STATEMENTS
Telstra Corporation Limited and controlled entities Telstra Annual Report 2013 179
(b) Long term incentive (LTI) plans (continued)
(iv) Summary of movements and other information (continued)
(*) Options include RTSR, ROI, ESOP and US ESOP options. The options “exercised” includes those participants that have been made redundant and are then consequently entitled to the Telstra shares.
(^) Performance rights include RG, NT, ROI, RTSR, FCF ROI and ESRP performance rights.
(#) Restricted shares relate to GMD Telstra Wholesale and ESP restricted shares.
(**) The fair value of these instruments is calculated using an option pricing model that takes into account various factors, including the exercise price and expected life of the instrument, the current price of the underlying share and its expected volatility, expected dividends, the risk-free rate for the expected life of the instrument, and the expected average volatility of Telstra’s peer group companies.
(***) The fair value of these instruments is based on the market value of Telstra shares at the allocation date.
(^^) The weighted average share price for instruments exercised during financial year 2012 was $3.25 for financial year 2006 and 2010 allocation of performance rights, and $3.59 for financial year 2012 allocation of ESP restricted shares respectively. These share prices were based on the closing market price on the exercise dates.
(##) The weighted average share price for instruments exercised during financial year 2013 was $4.65 for the financial year 2008 and 2009 allocation of options, $3.73 for the financial year 2006 and 2010 allocation of performance rights, and $4.41 for financial year 2012 and 2013 allocation of ESP restricted shares respectively. These share prices were based on the closing market price on the exercise dates.
27. EMPLOYEE SHARE PLANS (CONTINUED)
Options (*) Performance rights (^) Restricted Shares (#)
Number
Weighted average fair
value (**) Number
Weighted average fair
value (**) Number
Weighted average fair value (***)
Outstanding as at 30 June 2011 . . . . . . 47,806,196 $0.45 29,639,057 $4.51 - -Granted. . . . . . . . . . . . . - - 6,038,544 $2.40 2,375,300 $3.36Forfeited . . . . . . . . . . . . (13,096,052) $0.84 (5,349,043) $1.91 - -Exercised (^^) . . . . . . . . . - - (75,503) $2.97 (16,600) $3.36Expired . . . . . . . . . . . . . (4,557,459) $0.16 (4,589,689) $2.39 - -Outstanding as at 30 June 2012 . . . . . . 30,152,685 $0.32 25,663,366 $1.95 2,358,700 $3.36Granted. . . . . . . . . . . . . - - 5,329,032 $2.71 2,673,071 $4.55Forfeited . . . . . . . . . . . . (11,832,322) $0.42 (2,871,773) $2.16 - -Exercised (##) . . . . . . . . . (6,792,007) $0.35 (1,370,259) $2.89 (291,300) $3.66Expired . . . . . . . . . . . . . - - - - - -Outstanding as at 30 June 2013 . . . . . . 11,528,356 $0.21 26,750,366 $2.03 4,740,471 $4.03
Exercisable as at 30 June 2013 . . . . . . 11,528,356 $0.21 - - - -
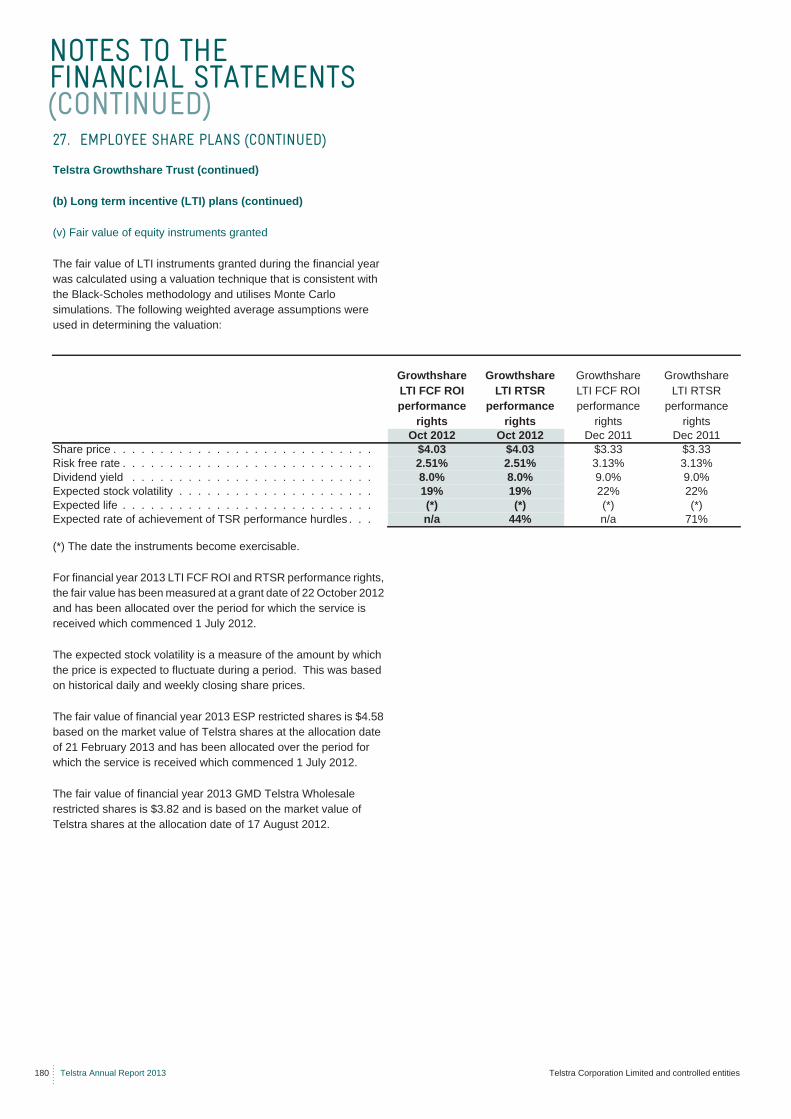
NOTES TO THE FINANCIAL STATEMENTS (CONTINUED)
180 Telstra Annual Report 2013 Telstra Corporation Limited and controlled entities
Telstra Growthshare Trust (continued)
(b) Long term incentive (LTI) plans (continued)
(v) Fair value of equity instruments granted
The fair value of LTI instruments granted during the financial year was calculated using a valuation technique that is consistent with the Black-Scholes methodology and utilises Monte Carlo simulations. The following weighted average assumptions were used in determining the valuation:
(*) The date the instruments become exercisable.
For financial year 2013 LTI FCF ROI and RTSR performance rights, the fair value has been measured at a grant date of 22 October 2012 and has been allocated over the period for which the service is received which commenced 1 July 2012.
The expected stock volatility is a measure of the amount by which the price is expected to fluctuate during a period. This was based on historical daily and weekly closing share prices.
The fair value of financial year 2013 ESP restricted shares is $4.58 based on the market value of Telstra shares at the allocation date of 21 February 2013 and has been allocated over the period for which the service is received which commenced 1 July 2012.
The fair value of financial year 2013 GMD Telstra Wholesale restricted shares is $3.82 and is based on the market value of Telstra shares at the allocation date of 17 August 2012.
27. EMPLOYEE SHARE PLANS (CONTINUED)
Growthshare LTI FCF ROI performance
rights
Growthshare LTI RTSR
performance rights
Growthshare LTI FCF ROI performance
rights
Growthshare LTI RTSR
performance rights
Oct 2012 Oct 2012 Dec 2011 Dec 2011Share price . . . . . . . . . . . . . . . . . . . . . . . . . . . . $4.03 $4.03 $3.33 $3.33Risk free rate . . . . . . . . . . . . . . . . . . . . . . . . . . . 2.51% 2.51% 3.13% 3.13%Dividend yield . . . . . . . . . . . . . . . . . . . . . . . . . . 8.0% 8.0% 9.0% 9.0%Expected stock volatility . . . . . . . . . . . . . . . . . . . . . 19% 19% 22% 22%Expected life . . . . . . . . . . . . . . . . . . . . . . . . . . . (*) (*) (*) (*)Expected rate of achievement of TSR performance hurdles . . . n/a 44% n/a 71%
NOTES TO THE FINANCIAL STATEMENTS (CONTINUED)
FINANCIAL STATEMENTS
Telstra Corporation Limited and controlled entities Telstra Annual Report 2013 181
Telstra Growthshare Trust (continued)
(c) Telstra Directshare and Ownshare
(i) Nature of Telstra Directshare and Ownshare
Telstra Directshare
The Directshare plan, previously operated by the Company, was cancelled with effect from August 2012 as it is no longer in use. Under the Directshare plan, non-executive Directors could nominate to receive a percentage of their total remuneration package as Telstra shares (allocated to participating Directors at market price). As a result of its cancellation, no new grants may be made under the Directshare plan. Existing grants under the plan will remain on foot and under the terms of the Directshare plan and the relevant trust deed will continue to apply to such grants.
The restriction period on Directshares already allocated continues until the earliest of:
• 10 years from the date of allocation of the shares;• the participating Director is no longer a Director of, or is no longer
employed by, a company in the Telstra Group; and• the Trustee determines that an ‘event’ under the terms of
Directshare has occurred.
Telstra Ownshare
The Ownshare plan has been cancelled with effect from October 2013. Under the Ownshare plan, certain eligible employees could, at their election, be provided part of their remuneration in Telstra shares. Shares were acquired by the trustee from time to time and allocated to these employees at the time their application was accepted. Although the trustee holds the shares in trust, the participant retains the beneficial interest in the shares (dividends, voting rights, bonuses or rights issues) until they are transferred at the expiration of the restriction period.
The restriction period continues until the earliest of:
• three years from the date of allocation;• the participant ceases employment with the Telstra Group; and • the Board of Telstra determines that an ‘event’ has occurred.
At the end of the restriction period, the Ownshares will be transferred to the participant (unless the participant directs the trustee to sell the Ownshares on the participant’s behalf). The participant is not able to deal in the shares until this transfer has taken place.
(ii) Instruments granted during the financial year
The fair value of the instruments granted under the Ownshare plan is determined by the remuneration foregone by the participant. On the grant of Ownshares, the participants in the plan are not required to make any payment to the Telstra Entity. The 23 October 2012 grant of Ownshares relates to shares acquired through salary sacrifice by employees.
For the Ownshare plan, the weighted average fair value of fully paid shares granted to participants as at 30 June 2013 was $4.03 (2012: $3.15) and the total fair value of shares granted was $632,808 (2012: $553,637).
27. EMPLOYEE SHARE PLANS (CONTINUED)
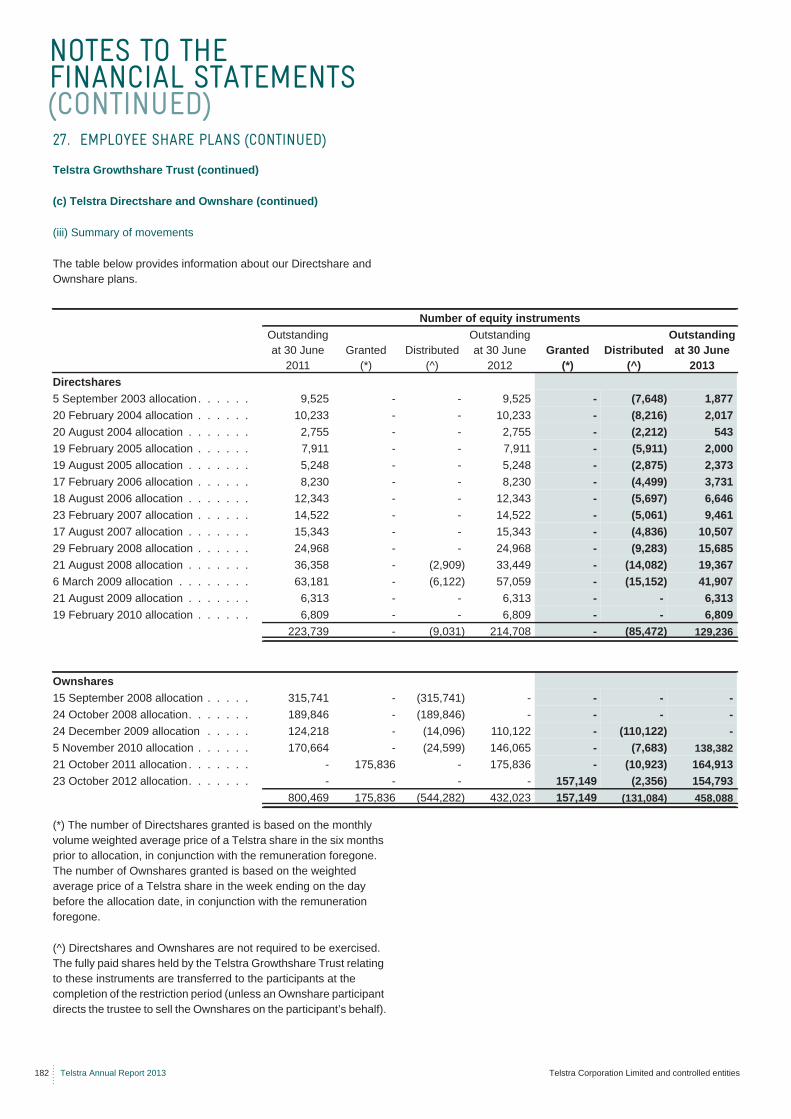
NOTES TO THE FINANCIAL STATEMENTS (CONTINUED)
182 Telstra Annual Report 2013 Telstra Corporation Limited and controlled entities
Telstra Growthshare Trust (continued)
(c) Telstra Directshare and Ownshare (continued)
(iii) Summary of movements
The table below provides information about our Directshare and Ownshare plans.
(*) The number of Directshares granted is based on the monthly volume weighted average price of a Telstra share in the six months prior to allocation, in conjunction with the remuneration foregone. The number of Ownshares granted is based on the weighted average price of a Telstra share in the week ending on the day before the allocation date, in conjunction with the remuneration foregone.
(^) Directshares and Ownshares are not required to be exercised. The fully paid shares held by the Telstra Growthshare Trust relating to these instruments are transferred to the participants at the completion of the restriction period (unless an Ownshare participant directs the trustee to sell the Ownshares on the participant’s behalf).
27. EMPLOYEE SHARE PLANS (CONTINUED)
Number of equity instrumentsOutstanding at 30 June
2011Granted
(*)Distributed
(^)
Outstanding at 30 June
2012Granted
(*)Distributed
(^)
Outstanding at 30 June
2013Directshares5 September 2003 allocation. . . . . . 9,525 - - 9,525 - (7,648) 1,87720 February 2004 allocation . . . . . . 10,233 - - 10,233 - (8,216) 2,01720 August 2004 allocation . . . . . . . 2,755 - - 2,755 - (2,212) 54319 February 2005 allocation . . . . . . 7,911 - - 7,911 - (5,911) 2,00019 August 2005 allocation . . . . . . . 5,248 - - 5,248 - (2,875) 2,37317 February 2006 allocation . . . . . . 8,230 - - 8,230 - (4,499) 3,73118 August 2006 allocation . . . . . . . 12,343 - - 12,343 - (5,697) 6,64623 February 2007 allocation . . . . . . 14,522 - - 14,522 - (5,061) 9,46117 August 2007 allocation . . . . . . . 15,343 - - 15,343 - (4,836) 10,50729 February 2008 allocation . . . . . . 24,968 - - 24,968 - (9,283) 15,68521 August 2008 allocation . . . . . . . 36,358 - (2,909) 33,449 - (14,082) 19,3676 March 2009 allocation . . . . . . . . 63,181 - (6,122) 57,059 - (15,152) 41,90721 August 2009 allocation . . . . . . . 6,313 - - 6,313 - - 6,31319 February 2010 allocation . . . . . . 6,809 - - 6,809 - - 6,809
223,739 - (9,031) 214,708 - (85,472) 129,236
Ownshares15 September 2008 allocation . . . . . 315,741 - (315,741) - - - -24 October 2008 allocation. . . . . . . 189,846 - (189,846) - - - -24 December 2009 allocation . . . . . 124,218 - (14,096) 110,122 - (110,122) -5 November 2010 allocation . . . . . . 170,664 - (24,599) 146,065 - (7,683) 138,38221 October 2011 allocation . . . . . . . - 175,836 - 175,836 - (10,923) 164,91323 October 2012 allocation. . . . . . . - - - - 157,149 (2,356) 154,793
800,469 175,836 (544,282) 432,023 157,149 (131,084) 458,088
NOTES TO THE FINANCIAL STATEMENTS (CONTINUED)
FINANCIAL STATEMENTS
Telstra Corporation Limited and controlled entities Telstra Annual Report 2013 183
(d) Other equity plans
In exceptional circumstances, Telstra has put in place structured retention incentive plans. These are designed to protect Telstra from the loss of employees who possess specific skill sets considered critical to the business and where Telstra is vulnerable to losing key personnel. Such retention plans are not restricted to senior executives. The plans are granted on an ad hoc basis and the participants receive Telstra shares deferred for a certain amount of time.
As part of his Service Agreement negotiated upon appointment, the Chief Financial Officer (CFO) was allocated 96,500 performance shares of which 50 per cent are eligible to vest after two years and the remaining 50 per cent are eligible to vest after three years from the date of commencement of his employment. Vesting is subject to an assessment of performance by the Board and performance shares are forfeited in the event of resignation before vesting. In the event of redundancy or termination of employment for no reason, a pro rata entitlement of the performance shares as at the time of cessation of employment vest.
TESOP99 and TESOP97
As part of the Commonwealth’s sale of its shareholding in financial years 2000 and 1998, Telstra offered eligible employees the opportunity to buy ordinary shares of Telstra. These share plans were:
• the Telstra Employee Share Ownership Plan II (TESOP99); and • the Telstra Employee Share Ownership Plan (TESOP97).
Although the Telstra ESOP Trustee Pty Ltd (wholly owned subsidiary of Telstra) is the trustee for TESOP99 and TESOP97 and holds the shares in the trust, the participating employee retains the beneficial interest in the shares (dividends and voting rights).
Generally, employees were offered interest free loans by the Telstra Entity to acquire certain shares, and in some cases the employees became entitled to certain extra shares and loyalty shares as a result of participating in the plans. All shares acquired under the plans were transferred from the Commonwealth either to the employees or to the trustee for the benefit of the employees.
While a participant remains an employee of an entity within the Telstra Group or, in the case of TESOP97 only, the company that was their employer when the shares were acquired, there is no date by which the employee has to repay the loan. However, a participant may, at any time:
• elect to repay the loan and have the shares transferred into their name; or
• arrange through the trustee the sale of the shares where the proceeds of the sale (after deducting the costs of sale) will be enough to repay the loan.
The loan shares, extra shares and, in the case of TESOP99, the loyalty shares were subject to a restriction on the sale of the shares or transfer to the employee for three years or until the relevant employment ceased. This restriction period has now been fulfilled under each plan.
If a participant ceases to be employed by an entity within the Telstra Group or, in the case of TESOP97 only, the company that was their employer when the shares were acquired the employee must repay their loan within two months of leaving to acquire the relevant shares. This is the case except where the restriction period has ended because of the employee’s death or disablement (in which case the loan must be repaid within 12 months).
If the employee has ceased employment and does not repay the loan when required, the trustee must sell the shares if the sale proceeds (after deducting the costs of sale) will be enough to repay the loan. The sale proceeds must then be used to pay the costs of the sale and any amount outstanding on the loan, after which the balance will be paid to the employee. The Telstra Entity’s recourse under the loan is limited to the amount recoverable through the sale of the employee’s shares.
27. EMPLOYEE SHARE PLANS (CONTINUED)
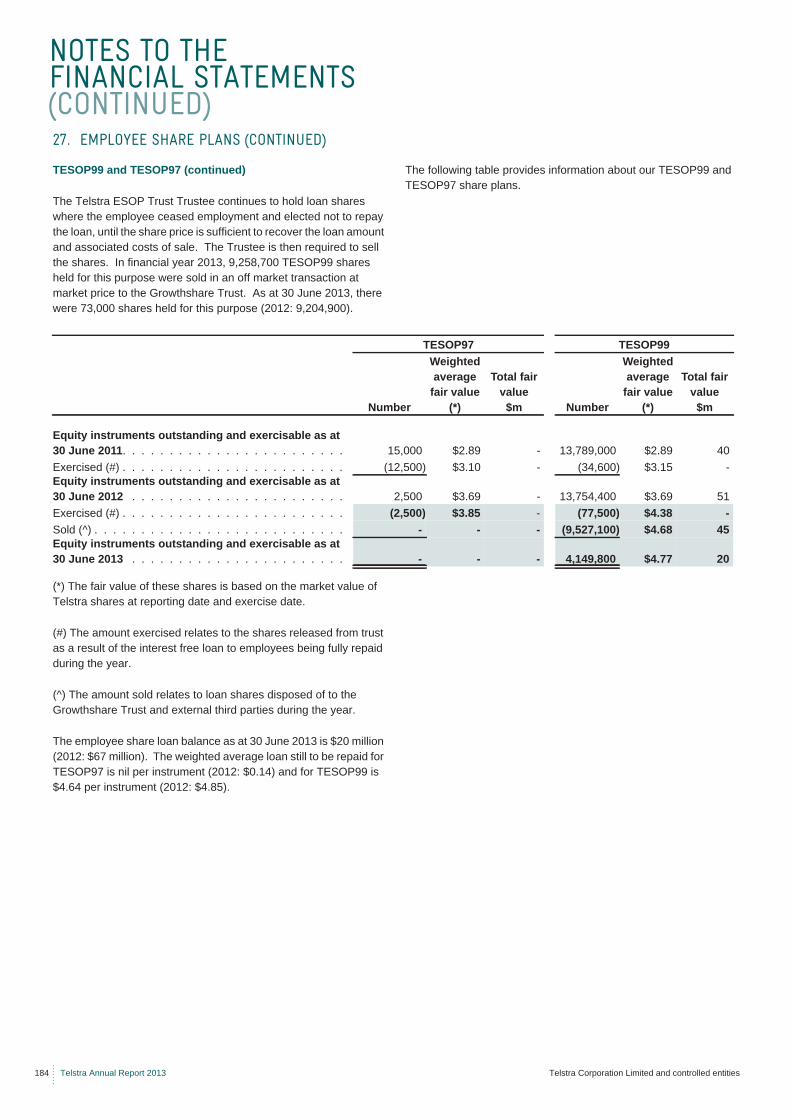
NOTES TO THE FINANCIAL STATEMENTS (CONTINUED)
184 Telstra Annual Report 2013 Telstra Corporation Limited and controlled entities
TESOP99 and TESOP97 (continued)
The Telstra ESOP Trust Trustee continues to hold loan shares where the employee ceased employment and elected not to repay the loan, until the share price is sufficient to recover the loan amount and associated costs of sale. The Trustee is then required to sell the shares. In financial year 2013, 9,258,700 TESOP99 shares held for this purpose were sold in an off market transaction at market price to the Growthshare Trust. As at 30 June 2013, there were 73,000 shares held for this purpose (2012: 9,204,900).
The following table provides information about our TESOP99 and TESOP97 share plans.
(*) The fair value of these shares is based on the market value of Telstra shares at reporting date and exercise date.
(#) The amount exercised relates to the shares released from trust as a result of the interest free loan to employees being fully repaid during the year.
(^) The amount sold relates to loan shares disposed of to the Growthshare Trust and external third parties during the year.
The employee share loan balance as at 30 June 2013 is $20 million (2012: $67 million). The weighted average loan still to be repaid for TESOP97 is nil per instrument (2012: $0.14) and for TESOP99 is $4.64 per instrument (2012: $4.85).
27. EMPLOYEE SHARE PLANS (CONTINUED)
TESOP97 TESOP99
Number
Weighted average
fair value (*)
Total fair value$m Number
Weighted average
fair value (*)
Total fair value$m
Equity instruments outstanding and exercisable as at 30 June 2011. . . . . . . . . . . . . . . . . . . . . . . . 15,000 $2.89 - 13,789,000 $2.89 40Exercised (#) . . . . . . . . . . . . . . . . . . . . . . . . (12,500) $3.10 - (34,600) $3.15 -Equity instruments outstanding and exercisable as at 30 June 2012 . . . . . . . . . . . . . . . . . . . . . . . 2,500 $3.69 - 13,754,400 $3.69 51Exercised (#) . . . . . . . . . . . . . . . . . . . . . . . . (2,500) $3.85 - (77,500) $4.38 -Sold (^) . . . . . . . . . . . . . . . . . . . . . . . . . . . - - - (9,527,100) $4.68 45Equity instruments outstanding and exercisable as at 30 June 2013 . . . . . . . . . . . . . . . . . . . . . . . - - - 4,149,800 $4.77 20
NOTES TO THE FINANCIAL STATEMENTS (CONTINUED)
FINANCIAL STATEMENTS
Telstra Corporation Limited and controlled entities Telstra Annual Report 2013 185
In accordance with AASB 124: “Related Party Disclosures”, key management personnel (KMP) have authority and responsibility for planning, directing and controlling the activities of the Telstra Group. Hence, KMP are deemed to include the following:
• the non-executive Directors of the Telstra Entity; and• certain executives in the Chief Executive Officer’s (CEO’s) senior
leadership team, including the CEO, referred to as a “senior executive” in this note.
Directors
During financial years 2013 and 2012, the Directors of the Telstra Entity were:
Senior executives
The senior executives who qualified as KMP for financial years 2013 and 2012 were:
28. KEY MANAGEMENT PERSONNEL COMPENSATION
Name Position
Current DirectorsCatherine B Livingstone Chairman, non-executive DirectorDavid I Thodey Executive Director and Chief Executive OfficerGeoffrey A Cousins non-executive DirectorRussell A Higgins non-executive DirectorJohn P Mullen non-executive DirectorNora L Scheinkestel non-executive DirectorMargaret L Seale non-executive DirectorSteven M Vamos non-executive DirectorJohn D Zeglis non-executive Director
Former Directors
Timothy Y Chen, resigned as non-executive Director on 5 October 2012John W Stocker, retired as non-executive Director on 16 October 2012
Name Position
Current Senior ExecutivesDavid I Thodey Executive Director and Chief Executive OfficerGordon Ballantyne Chief Customer Officer, Group Managing Director, Telstra Customer Sales and ServiceRick Ellis Group Managing Director, Telstra MediaStuart Lee Group Managing Director, Telstra WholesaleKate McKenzie Group Managing Director, Telstra Innovation Products and MarketingRobert Nason Group Managing Director, Business Support and Improvement (KMP effective from 1 July 2012)Andrew Penn Chief Financial OfficerBrendon Riley Chief Operations Officer
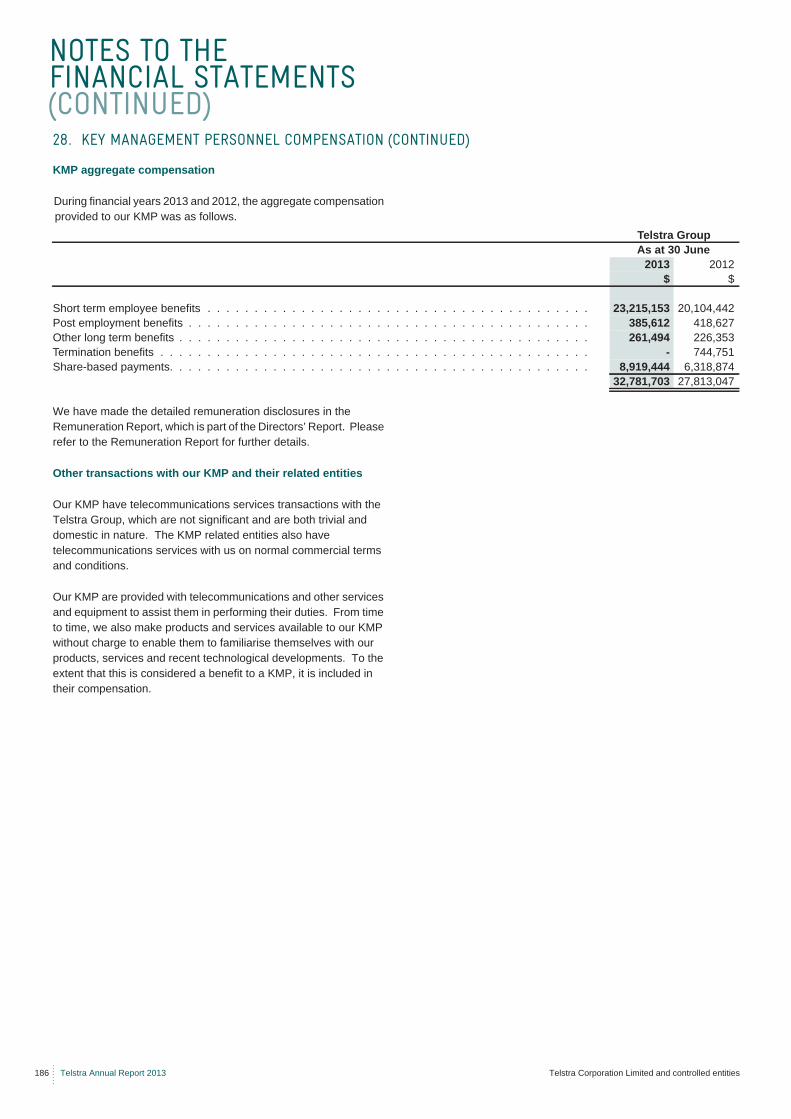
NOTES TO THE FINANCIAL STATEMENTS (CONTINUED)
186 Telstra Annual Report 2013 Telstra Corporation Limited and controlled entities
KMP aggregate compensation
During financial years 2013 and 2012, the aggregate compensation provided to our KMP was as follows.
We have made the detailed remuneration disclosures in the Remuneration Report, which is part of the Directors’ Report. Please refer to the Remuneration Report for further details.
Other transactions with our KMP and their related entities
Our KMP have telecommunications services transactions with the Telstra Group, which are not significant and are both trivial and domestic in nature. The KMP related entities also have telecommunications services with us on normal commercial terms and conditions.
Our KMP are provided with telecommunications and other services and equipment to assist them in performing their duties. From time to time, we also make products and services available to our KMP without charge to enable them to familiarise themselves with our products, services and recent technological developments. To the extent that this is considered a benefit to a KMP, it is included in their compensation.
28. KEY MANAGEMENT PERSONNEL COMPENSATION (CONTINUED)
Telstra GroupAs at 30 June
2013 2012$ $
Short term employee benefits . . . . . . . . . . . . . . . . . . . . . . . . . . . . . . . . . . . . . . . . . 23,215,153 20,104,442Post employment benefits . . . . . . . . . . . . . . . . . . . . . . . . . . . . . . . . . . . . . . . . . . . 385,612 418,627Other long term benefits . . . . . . . . . . . . . . . . . . . . . . . . . . . . . . . . . . . . . . . . . . . . 261,494 226,353Termination benefits . . . . . . . . . . . . . . . . . . . . . . . . . . . . . . . . . . . . . . . . . . . . . . - 744,751Share-based payments. . . . . . . . . . . . . . . . . . . . . . . . . . . . . . . . . . . . . . . . . . . . . 8,919,444 6,318,874
32,781,703 27,813,047
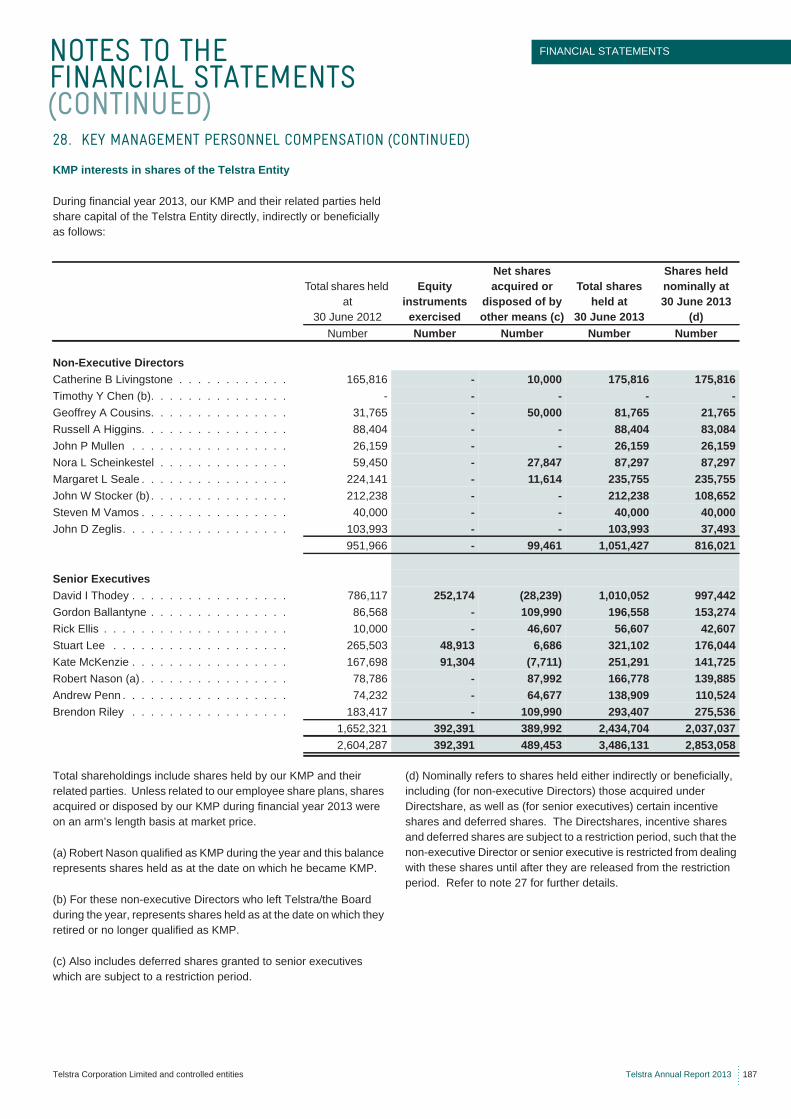
NOTES TO THE FINANCIAL STATEMENTS (CONTINUED)
FINANCIAL STATEMENTS
Telstra Corporation Limited and controlled entities Telstra Annual Report 2013 187
KMP interests in shares of the Telstra Entity
During financial year 2013, our KMP and their related parties held share capital of the Telstra Entity directly, indirectly or beneficially as follows:
Total shareholdings include shares held by our KMP and their related parties. Unless related to our employee share plans, shares acquired or disposed by our KMP during financial year 2013 were on an arm’s length basis at market price.
(a) Robert Nason qualified as KMP during the year and this balance represents shares held as at the date on which he became KMP.
(b) For these non-executive Directors who left Telstra/the Board during the year, represents shares held as at the date on which they retired or no longer qualified as KMP.
(c) Also includes deferred shares granted to senior executives which are subject to a restriction period.
(d) Nominally refers to shares held either indirectly or beneficially, including (for non-executive Directors) those acquired under Directshare, as well as (for senior executives) certain incentive shares and deferred shares. The Directshares, incentive shares and deferred shares are subject to a restriction period, such that the non-executive Director or senior executive is restricted from dealing with these shares until after they are released from the restriction period. Refer to note 27 for further details.
28. KEY MANAGEMENT PERSONNEL COMPENSATION (CONTINUED)
Total shares held at
30 June 2012
Equity instruments exercised
Net shares acquired or
disposed of by other means (c)
Total shares held at
30 June 2013
Shares held nominally at30 June 2013
(d)Number Number Number Number Number
Non-Executive DirectorsCatherine B Livingstone . . . . . . . . . . . . 165,816 - 10,000 175,816 175,816Timothy Y Chen (b). . . . . . . . . . . . . . . - - - - -Geoffrey A Cousins. . . . . . . . . . . . . . . 31,765 - 50,000 81,765 21,765Russell A Higgins. . . . . . . . . . . . . . . . 88,404 - - 88,404 83,084John P Mullen . . . . . . . . . . . . . . . . . 26,159 - - 26,159 26,159Nora L Scheinkestel . . . . . . . . . . . . . . 59,450 - 27,847 87,297 87,297Margaret L Seale . . . . . . . . . . . . . . . . 224,141 - 11,614 235,755 235,755John W Stocker (b) . . . . . . . . . . . . . . . 212,238 - - 212,238 108,652Steven M Vamos . . . . . . . . . . . . . . . . 40,000 - - 40,000 40,000John D Zeglis. . . . . . . . . . . . . . . . . . 103,993 - - 103,993 37,493
951,966 - 99,461 1,051,427 816,021
Senior ExecutivesDavid I Thodey . . . . . . . . . . . . . . . . . 786,117 252,174 (28,239) 1,010,052 997,442Gordon Ballantyne . . . . . . . . . . . . . . . 86,568 - 109,990 196,558 153,274Rick Ellis . . . . . . . . . . . . . . . . . . . . 10,000 - 46,607 56,607 42,607Stuart Lee . . . . . . . . . . . . . . . . . . . 265,503 48,913 6,686 321,102 176,044Kate McKenzie . . . . . . . . . . . . . . . . . 167,698 91,304 (7,711) 251,291 141,725Robert Nason (a) . . . . . . . . . . . . . . . . 78,786 - 87,992 166,778 139,885Andrew Penn . . . . . . . . . . . . . . . . . . 74,232 - 64,677 138,909 110,524Brendon Riley . . . . . . . . . . . . . . . . . 183,417 - 109,990 293,407 275,536
1,652,321 392,391 389,992 2,434,704 2,037,0372,604,287 392,391 489,453 3,486,131 2,853,058
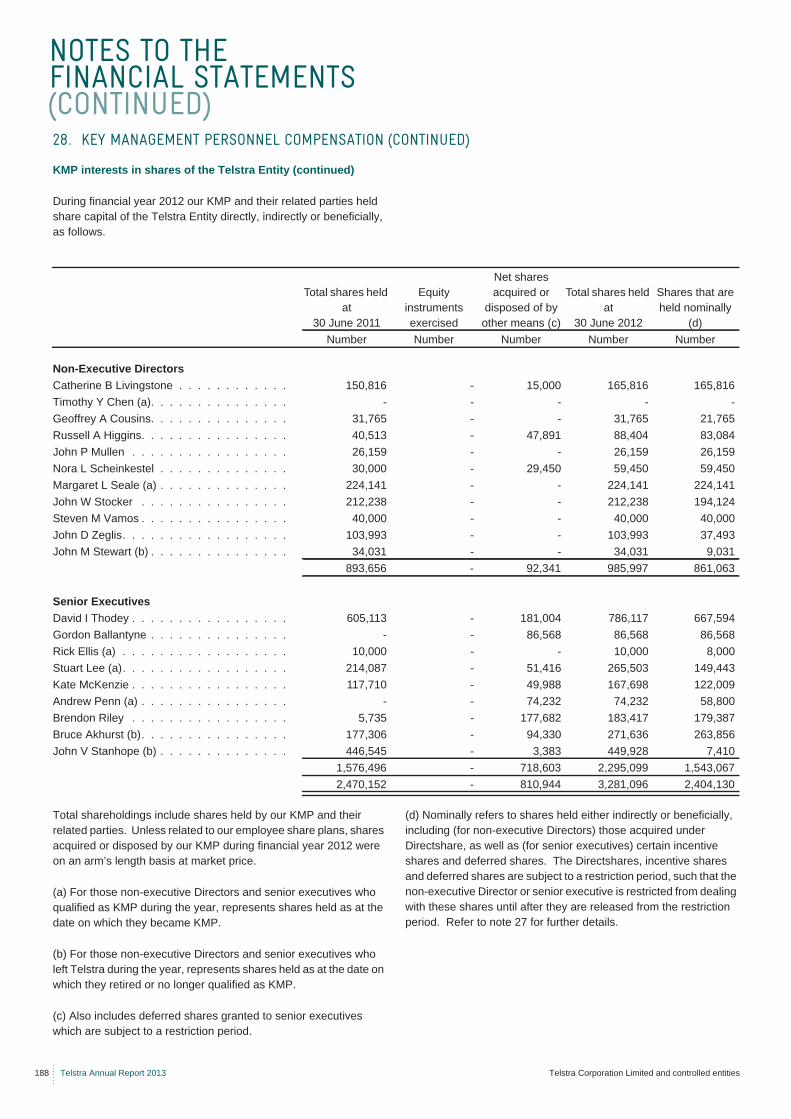
NOTES TO THE FINANCIAL STATEMENTS (CONTINUED)
188 Telstra Annual Report 2013 Telstra Corporation Limited and controlled entities
KMP interests in shares of the Telstra Entity (continued)
During financial year 2012 our KMP and their related parties held share capital of the Telstra Entity directly, indirectly or beneficially, as follows.
Total shareholdings include shares held by our KMP and their related parties. Unless related to our employee share plans, shares acquired or disposed by our KMP during financial year 2012 were on an arm’s length basis at market price.
(a) For those non-executive Directors and senior executives who qualified as KMP during the year, represents shares held as at the date on which they became KMP.
(b) For those non-executive Directors and senior executives who left Telstra during the year, represents shares held as at the date on which they retired or no longer qualified as KMP.
(c) Also includes deferred shares granted to senior executives which are subject to a restriction period.
(d) Nominally refers to shares held either indirectly or beneficially, including (for non-executive Directors) those acquired under Directshare, as well as (for senior executives) certain incentive shares and deferred shares. The Directshares, incentive shares and deferred shares are subject to a restriction period, such that the non-executive Director or senior executive is restricted from dealing with these shares until after they are released from the restriction period. Refer to note 27 for further details.
28. KEY MANAGEMENT PERSONNEL COMPENSATION (CONTINUED)
Total shares held at
30 June 2011
Equity instruments exercised
Net shares acquired or
disposed of by other means (c)
Total shares held at
30 June 2012
Shares that are held nominally
(d)Number Number Number Number Number
Non-Executive DirectorsCatherine B Livingstone . . . . . . . . . . . . 150,816 - 15,000 165,816 165,816Timothy Y Chen (a). . . . . . . . . . . . . . . - - - - -Geoffrey A Cousins. . . . . . . . . . . . . . . 31,765 - - 31,765 21,765Russell A Higgins. . . . . . . . . . . . . . . . 40,513 - 47,891 88,404 83,084John P Mullen . . . . . . . . . . . . . . . . . 26,159 - - 26,159 26,159Nora L Scheinkestel . . . . . . . . . . . . . . 30,000 - 29,450 59,450 59,450Margaret L Seale (a) . . . . . . . . . . . . . . 224,141 - - 224,141 224,141John W Stocker . . . . . . . . . . . . . . . . 212,238 - - 212,238 194,124Steven M Vamos . . . . . . . . . . . . . . . . 40,000 - - 40,000 40,000John D Zeglis. . . . . . . . . . . . . . . . . . 103,993 - - 103,993 37,493John M Stewart (b) . . . . . . . . . . . . . . . 34,031 - - 34,031 9,031
893,656 - 92,341 985,997 861,063
Senior ExecutivesDavid I Thodey . . . . . . . . . . . . . . . . . 605,113 - 181,004 786,117 667,594Gordon Ballantyne . . . . . . . . . . . . . . . - - 86,568 86,568 86,568Rick Ellis (a) . . . . . . . . . . . . . . . . . . 10,000 - - 10,000 8,000Stuart Lee (a). . . . . . . . . . . . . . . . . . 214,087 - 51,416 265,503 149,443Kate McKenzie . . . . . . . . . . . . . . . . . 117,710 - 49,988 167,698 122,009Andrew Penn (a) . . . . . . . . . . . . . . . . - - 74,232 74,232 58,800Brendon Riley . . . . . . . . . . . . . . . . . 5,735 - 177,682 183,417 179,387Bruce Akhurst (b). . . . . . . . . . . . . . . . 177,306 - 94,330 271,636 263,856John V Stanhope (b) . . . . . . . . . . . . . . 446,545 - 3,383 449,928 7,410
1,576,496 - 718,603 2,295,099 1,543,0672,470,152 - 810,944 3,281,096 2,404,130
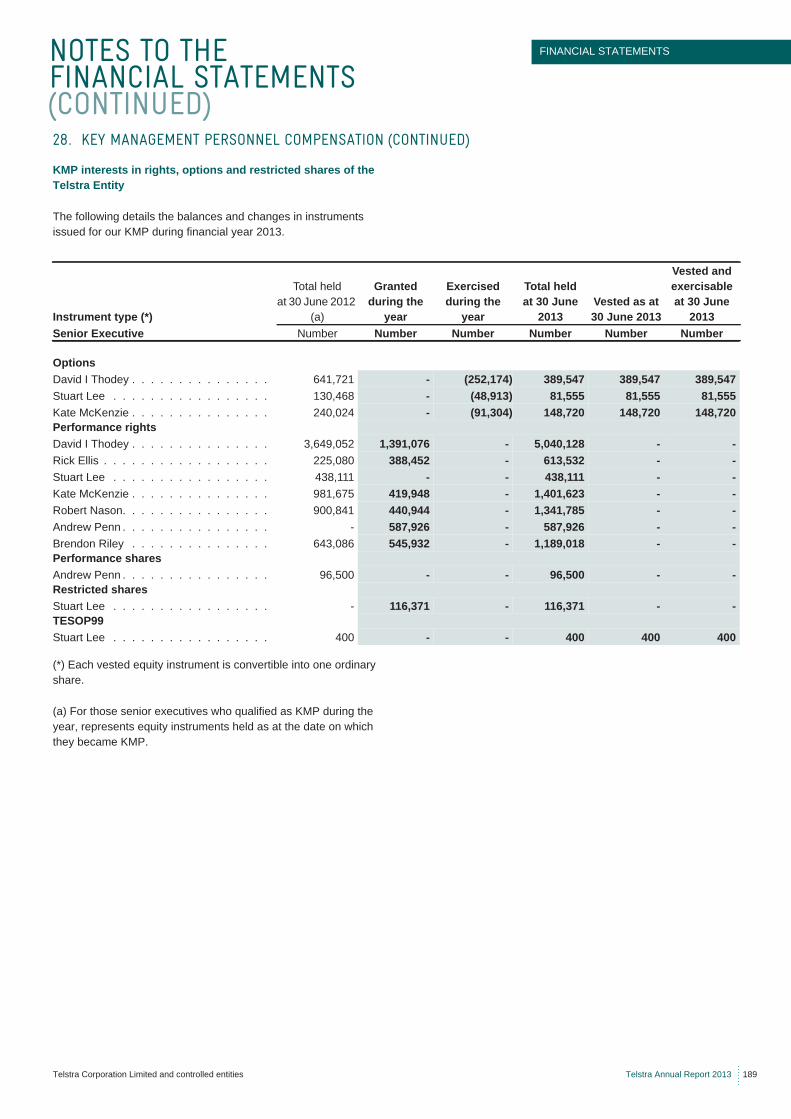
NOTES TO THE FINANCIAL STATEMENTS (CONTINUED)
FINANCIAL STATEMENTS
Telstra Corporation Limited and controlled entities Telstra Annual Report 2013 189
KMP interests in rights, options and restricted shares of the Telstra Entity
The following details the balances and changes in instruments issued for our KMP during financial year 2013.
(*) Each vested equity instrument is convertible into one ordinary share.
(a) For those senior executives who qualified as KMP during the year, represents equity instruments held as at the date on which they became KMP.
28. KEY MANAGEMENT PERSONNEL COMPENSATION (CONTINUED)
Instrument type (*)
Total held at 30 June 2012
(a)
Granted during the
year
Exercised during the
year
Total held at 30 June
2013Vested as at 30 June 2013
Vested and exercisable at 30 June
2013Senior Executive Number Number Number Number Number Number
OptionsDavid I Thodey . . . . . . . . . . . . . . . 641,721 - (252,174) 389,547 389,547 389,547Stuart Lee . . . . . . . . . . . . . . . . . 130,468 - (48,913) 81,555 81,555 81,555Kate McKenzie . . . . . . . . . . . . . . . 240,024 - (91,304) 148,720 148,720 148,720Performance rightsDavid I Thodey . . . . . . . . . . . . . . . 3,649,052 1,391,076 - 5,040,128 - -Rick Ellis . . . . . . . . . . . . . . . . . . 225,080 388,452 - 613,532 - -Stuart Lee . . . . . . . . . . . . . . . . . 438,111 - - 438,111 - -Kate McKenzie . . . . . . . . . . . . . . . 981,675 419,948 - 1,401,623 - -Robert Nason. . . . . . . . . . . . . . . . 900,841 440,944 - 1,341,785 - -Andrew Penn . . . . . . . . . . . . . . . . - 587,926 - 587,926 - -Brendon Riley . . . . . . . . . . . . . . . 643,086 545,932 - 1,189,018 - -Performance sharesAndrew Penn . . . . . . . . . . . . . . . . 96,500 - - 96,500 - -Restricted sharesStuart Lee . . . . . . . . . . . . . . . . . - 116,371 - 116,371 - -TESOP99Stuart Lee . . . . . . . . . . . . . . . . . 400 - - 400 400 400
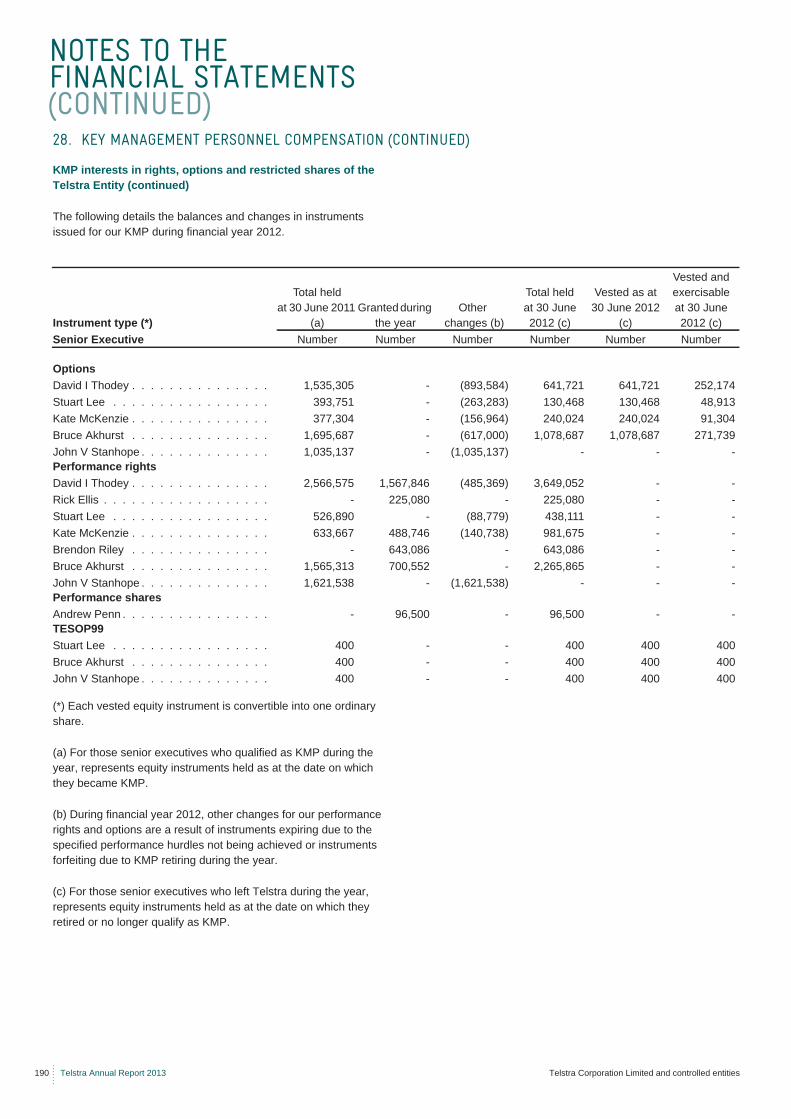
NOTES TO THE FINANCIAL STATEMENTS (CONTINUED)
190 Telstra Annual Report 2013 Telstra Corporation Limited and controlled entities
KMP interests in rights, options and restricted shares of the Telstra Entity (continued)
The following details the balances and changes in instruments issued for our KMP during financial year 2012.
(*) Each vested equity instrument is convertible into one ordinary share.
(a) For those senior executives who qualified as KMP during the year, represents equity instruments held as at the date on which they became KMP.
(b) During financial year 2012, other changes for our performance rights and options are a result of instruments expiring due to the specified performance hurdles not being achieved or instruments forfeiting due to KMP retiring during the year.
(c) For those senior executives who left Telstra during the year, represents equity instruments held as at the date on which they retired or no longer qualify as KMP.
28. KEY MANAGEMENT PERSONNEL COMPENSATION (CONTINUED)
Instrument type (*)
Total held at 30 June 2011
(a)Granted during
the yearOther
changes (b)
Total held at 30 June 2012 (c)
Vested as at 30 June 2012
(c)
Vested and exercisable at 30 June 2012 (c)
Senior Executive Number Number Number Number Number Number
OptionsDavid I Thodey . . . . . . . . . . . . . . . 1,535,305 - (893,584) 641,721 641,721 252,174Stuart Lee . . . . . . . . . . . . . . . . . 393,751 - (263,283) 130,468 130,468 48,913Kate McKenzie . . . . . . . . . . . . . . . 377,304 - (156,964) 240,024 240,024 91,304Bruce Akhurst . . . . . . . . . . . . . . . 1,695,687 - (617,000) 1,078,687 1,078,687 271,739John V Stanhope . . . . . . . . . . . . . . 1,035,137 - (1,035,137) - - -Performance rightsDavid I Thodey . . . . . . . . . . . . . . . 2,566,575 1,567,846 (485,369) 3,649,052 - -Rick Ellis . . . . . . . . . . . . . . . . . . - 225,080 - 225,080 - -Stuart Lee . . . . . . . . . . . . . . . . . 526,890 - (88,779) 438,111 - -Kate McKenzie . . . . . . . . . . . . . . . 633,667 488,746 (140,738) 981,675 - -Brendon Riley . . . . . . . . . . . . . . . - 643,086 - 643,086 - -Bruce Akhurst . . . . . . . . . . . . . . . 1,565,313 700,552 - 2,265,865 - -John V Stanhope . . . . . . . . . . . . . . 1,621,538 - (1,621,538) - - -Performance sharesAndrew Penn . . . . . . . . . . . . . . . . - 96,500 - 96,500 - -TESOP99Stuart Lee . . . . . . . . . . . . . . . . . 400 - - 400 400 400Bruce Akhurst . . . . . . . . . . . . . . . 400 - - 400 400 400John V Stanhope . . . . . . . . . . . . . . 400 - - 400 400 400
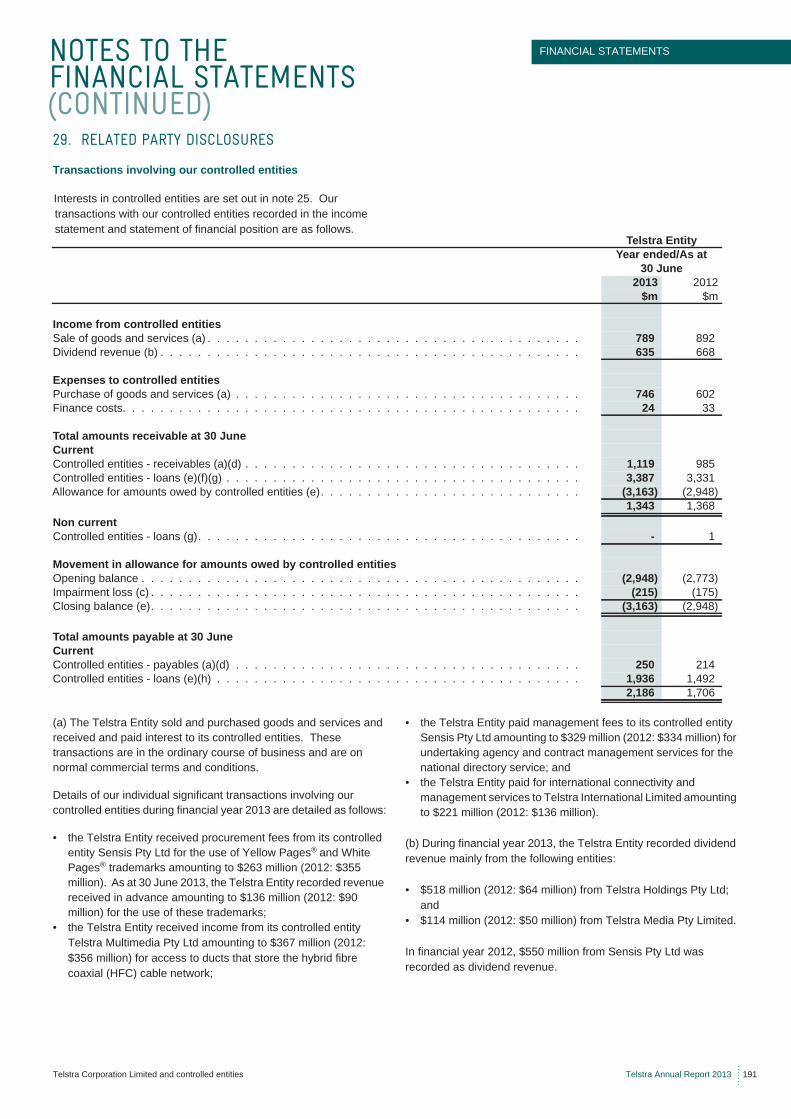
NOTES TO THE FINANCIAL STATEMENTS (CONTINUED)
FINANCIAL STATEMENTS
Telstra Corporation Limited and controlled entities Telstra Annual Report 2013 191
Transactions involving our controlled entities
Interests in controlled entities are set out in note 25. Our transactions with our controlled entities recorded in the income statement and statement of financial position are as follows.
(a) The Telstra Entity sold and purchased goods and services and received and paid interest to its controlled entities. These transactions are in the ordinary course of business and are on normal commercial terms and conditions.
Details of our individual significant transactions involving our controlled entities during financial year 2013 are detailed as follows:
• the Telstra Entity received procurement fees from its controlled entity Sensis Pty Ltd for the use of Yellow Pages® and White Pages® trademarks amounting to $263 million (2012: $355 million). As at 30 June 2013, the Telstra Entity recorded revenue received in advance amounting to $136 million (2012: $90 million) for the use of these trademarks;
• the Telstra Entity received income from its controlled entity Telstra Multimedia Pty Ltd amounting to $367 million (2012: $356 million) for access to ducts that store the hybrid fibre coaxial (HFC) cable network;
• the Telstra Entity paid management fees to its controlled entity Sensis Pty Ltd amounting to $329 million (2012: $334 million) for undertaking agency and contract management services for the national directory service; and
• the Telstra Entity paid for international connectivity and management services to Telstra International Limited amounting to $221 million (2012: $136 million).
(b) During financial year 2013, the Telstra Entity recorded dividend revenue mainly from the following entities:
• $518 million (2012: $64 million) from Telstra Holdings Pty Ltd; and
• $114 million (2012: $50 million) from Telstra Media Pty Limited.
In financial year 2012, $550 million from Sensis Pty Ltd was recorded as dividend revenue.
29. RELATED PARTY DISCLOSURES
Telstra EntityYear ended/As at
30 June2013 2012
$m $m
Income from controlled entitiesSale of goods and services (a) . . . . . . . . . . . . . . . . . . . . . . . . . . . . . . . . . . . . . . . . 789 892Dividend revenue (b) . . . . . . . . . . . . . . . . . . . . . . . . . . . . . . . . . . . . . . . . . . . . . 635 668
Expenses to controlled entitiesPurchase of goods and services (a) . . . . . . . . . . . . . . . . . . . . . . . . . . . . . . . . . . . . . 746 602Finance costs. . . . . . . . . . . . . . . . . . . . . . . . . . . . . . . . . . . . . . . . . . . . . . . . . 24 33
Total amounts receivable at 30 JuneCurrentControlled entities - receivables (a)(d) . . . . . . . . . . . . . . . . . . . . . . . . . . . . . . . . . . . . 1,119 985Controlled entities - loans (e)(f)(g) . . . . . . . . . . . . . . . . . . . . . . . . . . . . . . . . . . . . . . 3,387 3,331Allowance for amounts owed by controlled entities (e). . . . . . . . . . . . . . . . . . . . . . . . . . . . (3,163) (2,948)
1,343 1,368Non currentControlled entities - loans (g). . . . . . . . . . . . . . . . . . . . . . . . . . . . . . . . . . . . . . . . . - 1
Movement in allowance for amounts owed by controlled entitiesOpening balance . . . . . . . . . . . . . . . . . . . . . . . . . . . . . . . . . . . . . . . . . . . . . . . (2,948) (2,773)Impairment loss (c) . . . . . . . . . . . . . . . . . . . . . . . . . . . . . . . . . . . . . . . . . . . . . . (215) (175)Closing balance (e). . . . . . . . . . . . . . . . . . . . . . . . . . . . . . . . . . . . . . . . . . . . . . (3,163) (2,948)
Total amounts payable at 30 JuneCurrentControlled entities - payables (a)(d) . . . . . . . . . . . . . . . . . . . . . . . . . . . . . . . . . . . . . 250 214Controlled entities - loans (e)(h) . . . . . . . . . . . . . . . . . . . . . . . . . . . . . . . . . . . . . . . 1,936 1,492
2,186 1,706
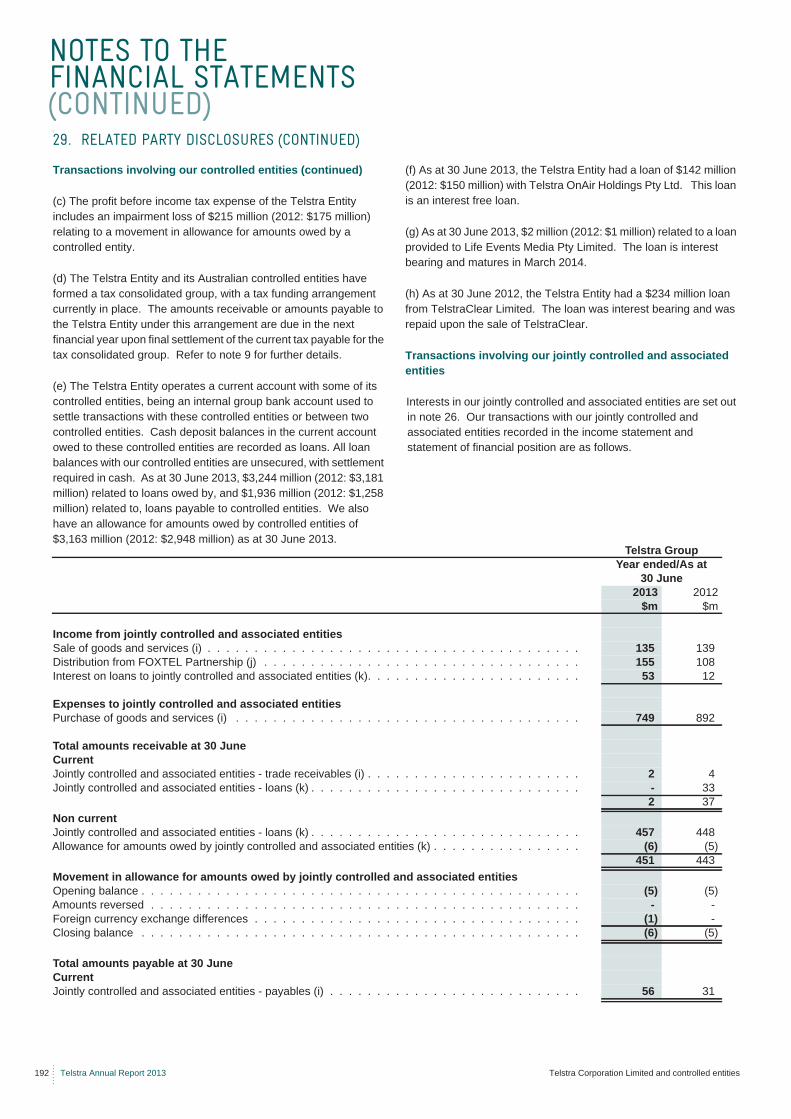
NOTES TO THE FINANCIAL STATEMENTS (CONTINUED)
192 Telstra Annual Report 2013 Telstra Corporation Limited and controlled entities
(
Transactions involving our controlled entities (continued)
(c) The profit before income tax expense of the Telstra Entity includes an impairment loss of $215 million (2012: $175 million) relating to a movement in allowance for amounts owed by a controlled entity.
(d) The Telstra Entity and its Australian controlled entities have formed a tax consolidated group, with a tax funding arrangement currently in place. The amounts receivable or amounts payable to the Telstra Entity under this arrangement are due in the next financial year upon final settlement of the current tax payable for the tax consolidated group. Refer to note 9 for further details.
(e) The Telstra Entity operates a current account with some of its controlled entities, being an internal group bank account used to settle transactions with these controlled entities or between two controlled entities. Cash deposit balances in the current account owed to these controlled entities are recorded as loans. All loan balances with our controlled entities are unsecured, with settlement required in cash. As at 30 June 2013, $3,244 million (2012: $3,181 million) related to loans owed by, and $1,936 million (2012: $1,258 million) related to, loans payable to controlled entities. We also have an allowance for amounts owed by controlled entities of $3,163 million (2012: $2,948 million) as at 30 June 2013.
(f) As at 30 June 2013, the Telstra Entity had a loan of $142 million (2012: $150 million) with Telstra OnAir Holdings Pty Ltd. This loan is an interest free loan.
(g) As at 30 June 2013, $2 million (2012: $1 million) related to a loan provided to Life Events Media Pty Limited. The loan is interest bearing and matures in March 2014.
(h) As at 30 June 2012, the Telstra Entity had a $234 million loan from TelstraClear Limited. The loan was interest bearing and was repaid upon the sale of TelstraClear.
Transactions involving our jointly controlled and associated entities
Interests in our jointly controlled and associated entities are set out in note 26. Our transactions with our jointly controlled and associated entities recorded in the income statement and statement of financial position are as follows.
29. RELATED PARTY DISCLOSURES (CONTINUED)
Telstra GroupYear ended/As at
30 June2013 2012
$m $m
Income from jointly controlled and associated entitiesSale of goods and services (i) . . . . . . . . . . . . . . . . . . . . . . . . . . . . . . . . . . . . . . . . 135 139Distribution from FOXTEL Partnership (j) . . . . . . . . . . . . . . . . . . . . . . . . . . . . . . . . . . 155 108Interest on loans to jointly controlled and associated entities (k). . . . . . . . . . . . . . . . . . . . . . . 53 12
Expenses to jointly controlled and associated entitiesPurchase of goods and services (i) . . . . . . . . . . . . . . . . . . . . . . . . . . . . . . . . . . . . . 749 892
Total amounts receivable at 30 JuneCurrentJointly controlled and associated entities - trade receivables (i) . . . . . . . . . . . . . . . . . . . . . . . 2 4Jointly controlled and associated entities - loans (k) . . . . . . . . . . . . . . . . . . . . . . . . . . . . . - 33
2 37Non currentJointly controlled and associated entities - loans (k) . . . . . . . . . . . . . . . . . . . . . . . . . . . . . 457 448Allowance for amounts owed by jointly controlled and associated entities (k) . . . . . . . . . . . . . . . . (6) (5)
451 443Movement in allowance for amounts owed by jointly controlled and associated entitiesOpening balance . . . . . . . . . . . . . . . . . . . . . . . . . . . . . . . . . . . . . . . . . . . . . . . (5) (5)Amounts reversed . . . . . . . . . . . . . . . . . . . . . . . . . . . . . . . . . . . . . . . . . . . . . . - -Foreign currency exchange differences . . . . . . . . . . . . . . . . . . . . . . . . . . . . . . . . . . . (1) -Closing balance . . . . . . . . . . . . . . . . . . . . . . . . . . . . . . . . . . . . . . . . . . . . . . . (6) (5)
Total amounts payable at 30 JuneCurrentJointly controlled and associated entities - payables (i) . . . . . . . . . . . . . . . . . . . . . . . . . . . 56 31
NOTES TO THE FINANCIAL STATEMENTS (CONTINUED)
FINANCIAL STATEMENTS
Telstra Corporation Limited and controlled entities Telstra Annual Report 2013 193
Transactions involving our jointly controlled and associated entities (continued)
(i) We sold and purchased goods and services, and received interest from our jointly controlled and associated entities. These transactions were in the ordinary course of business and on normal commercial terms and conditions.
Details of our individual significant transactions involving our jointly controlled and associated entities during financial year 2013 are detailed as follows:
• we purchased pay television services amounting to $655 million (2012: $649 million) from our jointly controlled entity FOXTEL. The purchases were to enable the resale of FOXTEL services, including pay television content, to our existing customers as part of our ongoing product bundling initiatives. In addition, we made sales to FOXTEL for our cost recoveries of $119 million (2012: $118 million); and
• purchases were made by the Telstra Group of $27 million (2012: $79 million) from our jointly controlled entity Reach Ltd (Reach) in line with market prices. These were for the purchase of, and entitlement to, capacity and connectivity services.
(j) A $155 million (2012: $108 million) distribution was received from our jointly controlled entity FOXTEL during the year.
(k) Loans provided to jointly controlled and associated entities relate to loans provided to Reach of $6 million (2012: $5 million) and FOXTEL Management Pty Ltd of $451 million (2012: $443 million).
The loan provided to Reach is an interest free loan and repayable upon the giving of 12 months’ notice by both PCCW Limited and us. We have fully provided for the non-recoverability of the loan as we do not consider that Reach is in a position to be able to repay the loan amount in the medium term.
In April 2012, Telstra Corporation Limited provided a loan to FOXTEL Management Pty Ltd to fund the acquisition of shares in AUSTAR. The loan is interest bearing and it has a minimum term of just over 10 years and a maximum of 15 years.
The $33 million loan provided to 3GIS represented interest free funding for operational expenditure purposes. Telstra and Vodafone Hutchison Australia Pty Ltd concluded their joint venture agreement for the 3GIS network on 31 August 2012. In accordance with the partnership agreement, the loan was partially recovered on dissolution of the partnership.
Transactions involving other related entities
Post employment benefits
As at 30 June 2013, the Telstra Superannuation Scheme (Telstra Super) owned 40,152,463 shares in Telstra Corporation Limited (2012: 38,383,958) at a cost of $136 million (2012: $118 million) and a market value of $192 million (2012: $142 million). All of these shares were fully paid at 30 June 2013. In financial year 2013, we paid dividends to Telstra Super of $10 million (2012: $13 million). We own 100 per cent of the equity of Telstra Super Pty Ltd, the trustee of Telstra Super.
Telstra Super also holds bonds issued by Telstra Corporation Limited. These bonds had a cost of $6 million (2012: $11 million) and a market value of $6 million (2012: $11 million) at 30 June 2013.
All purchases and sales of Telstra shares and bonds by Telstra Super are determined by the trustee and/or its investment managers on behalf of the members of Telstra Super.
Key management personnel (KMP)
For details regarding our KMP’s remuneration and interests in Telstra, as well as other related party transactions, refer to note 28 for further details.
29. RELATED PARTY DISCLOSURES (CONTINUED)
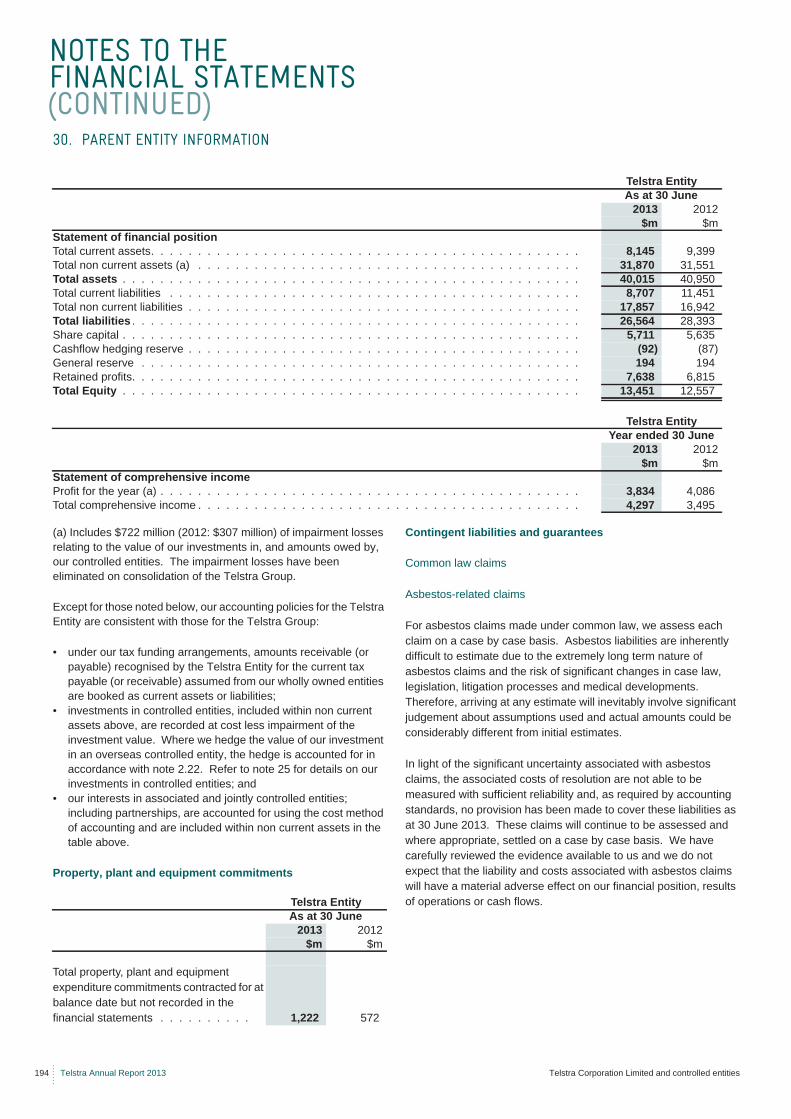
NOTES TO THE FINANCIAL STATEMENTS (CONTINUED)
194 Telstra Annual Report 2013 Telstra Corporation Limited and controlled entities
(a) Includes $722 million (2012: $307 million) of impairment losses relating to the value of our investments in, and amounts owed by, our controlled entities. The impairment losses have been eliminated on consolidation of the Telstra Group.
Except for those noted below, our accounting policies for the Telstra Entity are consistent with those for the Telstra Group:
• under our tax funding arrangements, amounts receivable (or payable) recognised by the Telstra Entity for the current tax payable (or receivable) assumed from our wholly owned entities are booked as current assets or liabilities;
• investments in controlled entities, included within non current assets above, are recorded at cost less impairment of the investment value. Where we hedge the value of our investment in an overseas controlled entity, the hedge is accounted for in accordance with note 2.22. Refer to note 25 for details on our investments in controlled entities; and
• our interests in associated and jointly controlled entities; including partnerships, are accounted for using the cost method of accounting and are included within non current assets in the table above.
Property, plant and equipment commitments
Contingent liabilities and guarantees
Common law claims
Asbestos-related claims
For asbestos claims made under common law, we assess each claim on a case by case basis. Asbestos liabilities are inherently difficult to estimate due to the extremely long term nature of asbestos claims and the risk of significant changes in case law, legislation, litigation processes and medical developments. Therefore, arriving at any estimate will inevitably involve significant judgement about assumptions used and actual amounts could be considerably different from initial estimates.
In light of the significant uncertainty associated with asbestos claims, the associated costs of resolution are not able to be measured with sufficient reliability and, as required by accounting standards, no provision has been made to cover these liabilities as at 30 June 2013. These claims will continue to be assessed and where appropriate, settled on a case by case basis. We have carefully reviewed the evidence available to us and we do not expect that the liability and costs associated with asbestos claims will have a material adverse effect on our financial position, results of operations or cash flows.
30. PARENT ENTITY INFORMATION
Telstra EntityAs at 30 June
2013 2012$m $m
Statement of financial positionTotal current assets. . . . . . . . . . . . . . . . . . . . . . . . . . . . . . . . . . . . . . . . . . . . . . 8,145 9,399Total non current assets (a) . . . . . . . . . . . . . . . . . . . . . . . . . . . . . . . . . . . . . . . . . 31,870 31,551Total assets . . . . . . . . . . . . . . . . . . . . . . . . . . . . . . . . . . . . . . . . . . . . . . . . . 40,015 40,950Total current liabilities . . . . . . . . . . . . . . . . . . . . . . . . . . . . . . . . . . . . . . . . . . . . 8,707 11,451Total non current liabilities . . . . . . . . . . . . . . . . . . . . . . . . . . . . . . . . . . . . . . . . . . 17,857 16,942Total liabilities . . . . . . . . . . . . . . . . . . . . . . . . . . . . . . . . . . . . . . . . . . . . . . . . 26,564 28,393Share capital . . . . . . . . . . . . . . . . . . . . . . . . . . . . . . . . . . . . . . . . . . . . . . . . . 5,711 5,635Cashflow hedging reserve . . . . . . . . . . . . . . . . . . . . . . . . . . . . . . . . . . . . . . . . . . (92) (87)General reserve . . . . . . . . . . . . . . . . . . . . . . . . . . . . . . . . . . . . . . . . . . . . . . . 194 194Retained profits. . . . . . . . . . . . . . . . . . . . . . . . . . . . . . . . . . . . . . . . . . . . . . . . 7,638 6,815Total Equity . . . . . . . . . . . . . . . . . . . . . . . . . . . . . . . . . . . . . . . . . . . . . . . . . 13,451 12,557
Telstra EntityYear ended 30 June
2013 2012$m $m
Statement of comprehensive incomeProfit for the year (a) . . . . . . . . . . . . . . . . . . . . . . . . . . . . . . . . . . . . . . . . . . . . . 3,834 4,086Total comprehensive income . . . . . . . . . . . . . . . . . . . . . . . . . . . . . . . . . . . . . . . . . 4,297 3,495
Telstra EntityAs at 30 June
2013 2012$m $m
Total property, plant and equipment expenditure commitments contracted for at balance date but not recorded in the financial statements . . . . . . . . . . 1,222 572
NOTES TO THE FINANCIAL STATEMENTS (CONTINUED)
FINANCIAL STATEMENTS
Telstra Corporation Limited and controlled entities Telstra Annual Report 2013 195
Contingent liabilities and guarantees (continued)
Common law claims (continued)
Other claims
Certain common law claims by employees and third parties are yet to be resolved. As at 30 June 2013, management believes that the resolution of these contingencies will not have a significant effect on the Telstra Entity’s financial results. The maximum amount of these contingent liabilities cannot be reliably estimated.
Indemnities, performance guarantees and financial support
We have provided the following indemnities, performance guarantees and financial support through the Telstra Entity:
• indemnities to financial institutions to support bank guarantees to the value of $455 million (2012: $279 million) in respect of the performance of contracts;
• indemnities to financial institutions in respect of the obligations of our controlled entities. The maximum amount of our contingent liabilities for this purpose is $152 million (2012: $156 million);
• indemnities to financial institutions in respect of the obligations of TelstraClear to third parties of $25 million (2012: $33 million). We have, however, received an indemnity for an equal amount from the acquirer as part of the TelstraClear disposal;
• financial support for certain controlled entities to the amount necessary to enable those entities to meet their obligations as and when they fall due. The financial support is subject to conditions including individual monetary limits totalling $134 million (2012: $108 million) and a requirement that the entity remains our controlled entity;
• guarantee of the performance of a controlled entity under a lease contract for 25 years to the amount of $49 million (2012: nil);
• guarantees of the performance of jointly controlled entities under contractual agreements to a maximum amount of $11 million (2012: $10 million); and
• during financial year 1998, we resolved to provide IBM Global Services Australia Limited (IBMGSA) with guarantees issued on a several basis up to $210 million as a shareholder of IBMGSA. We issued a guarantee of $68 million on behalf of IBMGSA during financial year 2000. During financial year 2004, we sold our shareholding in this entity. The $68 million guarantee is provided to support service contracts entered into by IBMGSA and third parties, and was made with IBMGSA bankers, or directly to IBMGSA customers. As at 30 June 2013, this guarantee remains unchanged and $142 million (2012: $142 million) of the $210 million guarantee facility remains unused.
Upon sale of our shareholding in IBMGSA and under the deed of indemnity between shareholders, our liability under these performance guarantees has been indemnified for all guarantees that were in place at the time of sale. Therefore, the overall net exposure to any loss associated with a claim has effectively been offset.
The guarantees we provided over the performance of third parties under defeasance arrangements, whereby lease payments were made on our behalf by the third parties over the terms of the finance leases, expired during the year (2012: $96 million (US$98 million)).
30. PARENT ENTITY INFORMATION (CONTINUED)
NOTES TO THE FINANCIAL STATEMENTS (CONTINUED)
196 Telstra Annual Report 2013 Telstra Corporation Limited and controlled entities
We are not aware of any matter or circumstance that has occurred since 30 June 2013 that, in our opinion, has significantly affected or may significantly affect in future years:
• our operations;• the results of those operations; or• the state of our affairs;
other than:
Final Dividend
On 8 August 2013, the Directors of Telstra Corporation Limited resolved to pay a fully franked final dividend of 14 cents per ordinary share. The record date for the final dividend will be 23 August 2013, with payment being made on 20 September 2013. Shares will trade excluding the entitlement to the dividend on 19 August 2013.
A provision for dividend payable has been raised as at the date of resolution, amounting to $1,738 million. The final dividend will be fully franked at a tax rate of 30 per cent. The financial effect of the dividend resolution was not brought to account as at 30 June 2013.
There are no income tax consequences for the Telstra Group resulting from the resolution and payment of the final ordinary dividend, except for $745 million of franking debits arising from the payment of this dividend that will be adjusted in our franking account balance.
The Dividend Reinvestment Plan continues to be suspended.
31. EVENTS AFTER REPORTING DATE
Telstra Corporation Limited and controlled entities Telstra Annual Report 2013 197
DIRECTORS'DECLARATION
DIRECTORS' DECLARATION
This Directors’ Declaration is required by the Corporations Act 2001 of Australia.
The Directors of Telstra Corporation Limited have made a resolution that declared:
For and on behalf of the board
(a) in the Directors’ opinion, the financial statements and notes of the Telstra Group for the financial year ended 30 June 2013 set out on pages 70 to 196:
(i) comply with the Accounting Standards applicable in Australia, International Financial Reporting Standards and Interpretations (as disclosed in note 1.1 to the financial statements), and Corporations Regulations 2001;
(ii) give a true and fair view of the financial position of Telstra Corporation Limited and the Telstra Group as at 30 June 2013 and of the performance of Telstra Corporation Limited and the Telstra Group, for the year ended 30 June 2013; and
(iii) have been made out in accordance with the Corporations Act 2001.
(b) they have received declarations as required by section 295A of the Corporations Act 2001;
(c) at the date of this declaration, in the Directors’ opinion, there are reasonable grounds to believe that Telstra Corporation Limited will be able to pay its debts as and when they become due and payable; and
(d) at the date of this declaration there are reasonable grounds to believe that the members of the extended closed group identified in note 25(a) to the financial statements, as parties to a Deed of Cross Guarantee, will be able to meet any obligations or liabilities to which they are, or may become subject to, under the Deed of Cross Guarantee described in note 25(a).
Catherine B Livingstone AOChairman
8 August 2013Sydney, Australia
David I ThodeyChief Executive Officer and Executive Director
Ernst & Young8 Exhibition Street Melbourne VIC 3000 AustraliaGPO Box 67 Melbourne VIC 3001
Tel: +61 3 9288 8000Fax: +61 3 8650 7777ey.com/au
198 Telstra Annual Report 2013 A member firm of Ernst & Young Global LimitedLiability limited by a scheme approved under Professional Standards Legislation
Report on the Financial Report
We have audited the accompanying financial report of Telstra Corporation Limited, which comprises the consolidated statement of financial position as at 30 June 2013, the consolidated income statement and consolidated statement of comprehensive income, the consolidated statement of changes in equity and the consolidated statement of cash flows for the year then ended, notes comprising a summary of significant accounting policies and other explanatory information, and the Directors’ declaration of the consolidated entity comprising the Company and the entities it controlled at the year’s end or from time to time during the financial year.
Directors’ Responsibility for the Financial Report
The Directors of the Company are responsible for the preparation of the financial report that gives a true and fair in accordance with Australian Accounting Standards and the Corporations Act 2001 and for such internal controls as the Directors determine are necessary to enable the preparation of the financial report that is free from material misstatement, whether due to fraud or error. In note 1, the Directors also state, in accordance with Accounting Standard AASB 101 Presentation of Financial Statements, that the financial statements comply with International Financial Reporting Standards.
Auditor’s Responsibility
Our responsibility is to express an opinion on the financial report based on our audit. We conducted our audit in accordance with Australian Auditing Standards. Those standards require that we comply with relevant ethical requirements relating to audit engagements and plan and perform the audit to obtain reasonable assurance about whether the financial report is free from material misstatement.
An audit involves performing procedures to obtain audit evidence about the amounts and disclosures in the financial report. The procedures selected depend on the auditor’s judgment, including the assessment of the risks of material misstatement of the financial report, whether due to fraud or error. In making those risk assessments, the auditor considers internal controls relevant to the entity’s preparation and fair presentation of the financial report in order to design audit procedures that are appropriate in the circumstances, but not for the purpose of expressing an opinion on the effectiveness of the entity’s internal controls. An audit also includes evaluating the appropriateness of accounting policies used and the reasonableness of accounting estimates made by the Directors, as well as evaluating the overall presentation of the financial report.
We believe that the audit evidence we have obtained is sufficient and appropriate to provide a basis for our audit opinion.
Independence
In conducting our audit we have complied with the independence requirements of the Corporations Act 2001. We have given to the Directors of the Company a written Auditor’s Independence Declaration, a copy of which is included in the Directors’ report.
Opinion
In our opinion:
a. the financial report of Telstra Corporation Limited is in accordance with the Corporations Act 2001, including:
i giving a true and fair view of the consolidated entity’s financial position as at 30 June 2013 and of its performance for the year ended on that date; and
ii complying with Australian Accounting Standards and the Corporations Regulations 2001; and
b. the financial report also complies with International Financial Reporting Standards as disclosed in note 1.
Report on the Remuneration Report
We have audited the Remuneration Report included in pages 46 to 67 of the Directors’ Report for the year ended 30 June 2013. The Directors of the Company are responsible for the preparation and presentation of the Remuneration Report in accordance with section 300A of the Corporations Act 2001. Our responsibility is to express an opinion on the Remuneration Report, based on our audit conducted in accordance with Australian Auditing Standards.
Opinion
In our opinion the Remuneration Report of Telstra Corporation Limited for the year ended 30 June 2013, complies with section 300A of the Corporations Act 2001.
Ernst & Young
SJ FergusonPartnerSydney, Australia8 August 2013
INDEPENDENT AUDITOR’S REPORT TO THE MEMBERS OF TELSTRA CORPORATION LIMITED
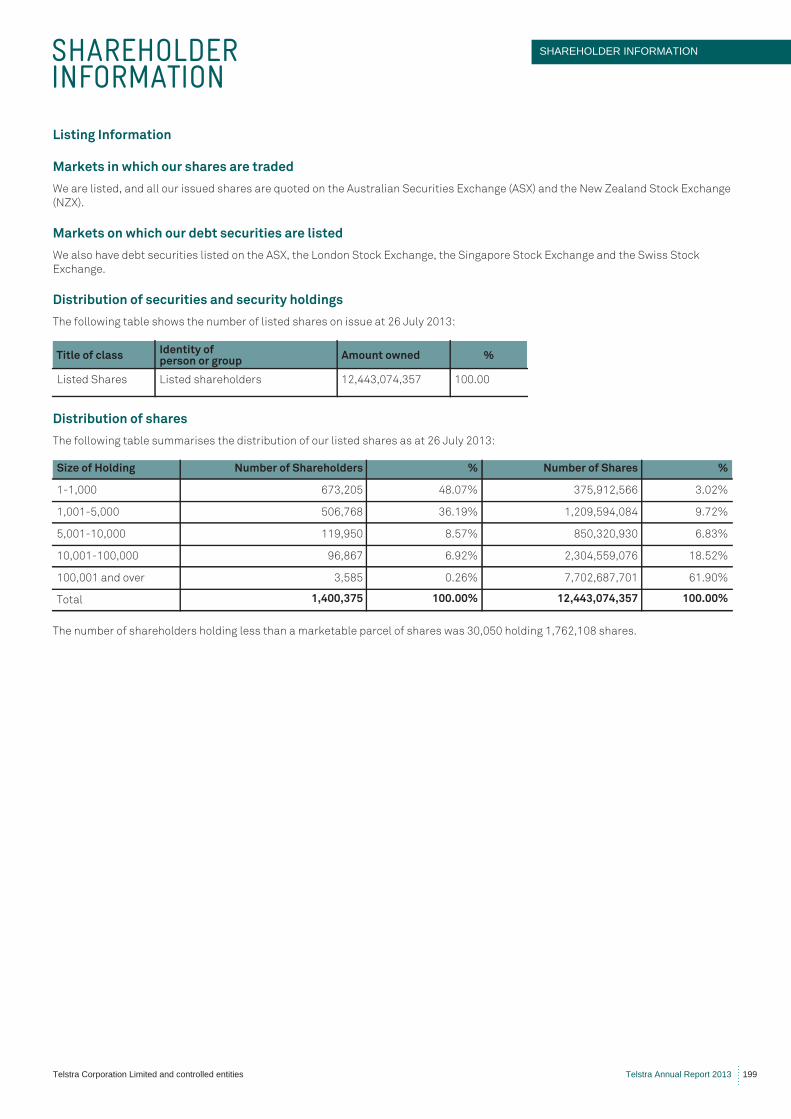
SHAREHOLDER INFORMATION
SHAREHOLDER INFORMATION
Telstra Corporation Limited and controlled entities Telstra Annual Report 2013 199
Listing Information
Markets in which our shares are traded
We are listed, and all our issued shares are quoted on the Australian Securities Exchange (ASX) and the New Zealand Stock Exchange
(NZX).
Markets on which our debt securities are listed
We also have debt securities listed on the ASX, the London Stock Exchange, the Singapore Stock Exchange and the Swiss Stock
Exchange.
Distribution of securities and security holdings
The following table shows the number of listed shares on issue at 26 July 2013:
Distribution of shares
The following table summarises the distribution of our listed shares as at 26 July 2013:
The number of shareholders holding less than a marketable parcel of shares was 30,050 holding 1,762,108 shares.
Title of classIdentity of person or group
Amount owned %
Listed Shares Listed shareholders 12,443,074,357 100.00
Size of Holding Number of Shareholders % Number of Shares %
1-1,000 673,205 48.07% 375,912,566 3.02%
1,001-5,000 506,768 36.19% 1,209,594,084 9.72%
5,001-10,000 119,950 8.57% 850,320,930 6.83%
10,001-100,000 96,867 6.92% 2,304,559,076 18.52%
100,001 and over 3,585 0.26% 7,702,687,701 61.90%
Total 1,400,375 100.00% 12,443,074,357 100.00%
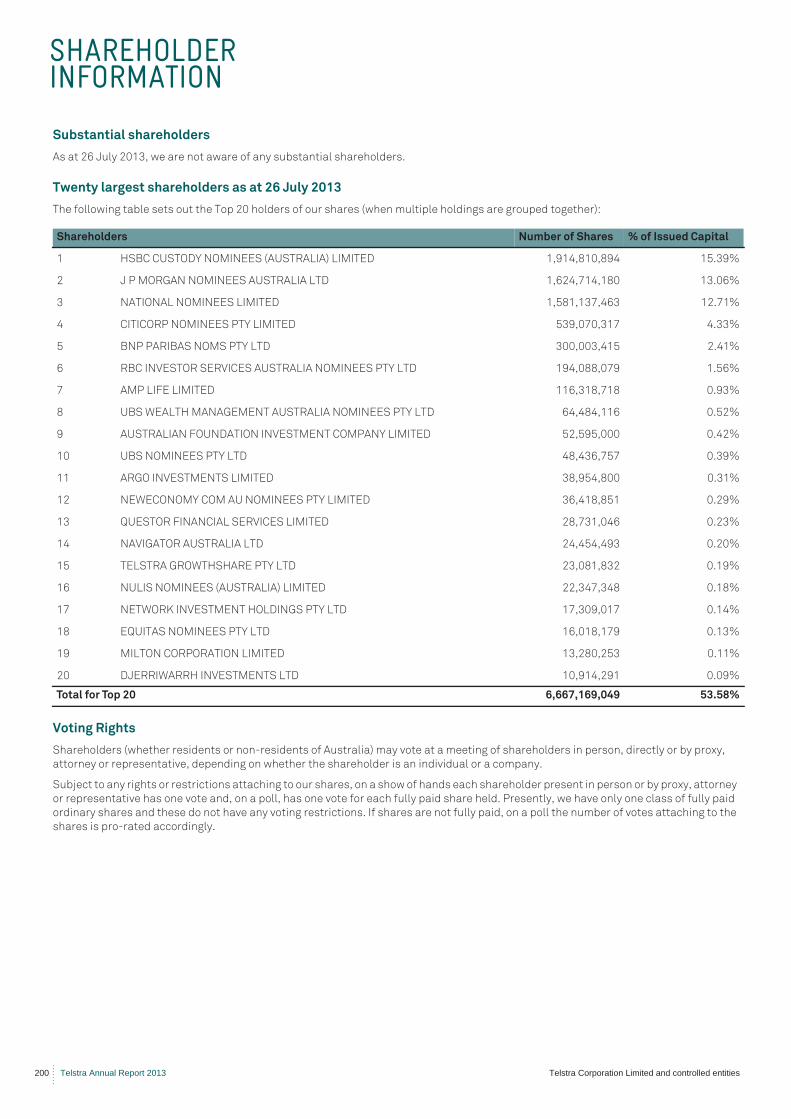
SHAREHOLDER INFORMATION
200 Telstra Annual Report 2013 Telstra Corporation Limited and controlled entities
Substantial shareholders
As at 26 July 2013, we are not aware of any substantial shareholders.
Twenty largest shareholders as at 26 July 2013
The following table sets out the Top 20 holders of our shares (when multiple holdings are grouped together):
Voting Rights
Shareholders (whether residents or non-residents of Australia) may vote at a meeting of shareholders in person, directly or by proxy,
attorney or representative, depending on whether the shareholder is an individual or a company.
Subject to any rights or restrictions attaching to our shares, on a show of hands each shareholder present in person or by proxy, attorney
or representative has one vote and, on a poll, has one vote for each fully paid share held. Presently, we have only one class of fully paid
ordinary shares and these do not have any voting restrictions. If shares are not fully paid, on a poll the number of votes attaching to the
shares is pro-rated accordingly.
Shareholders Number of Shares % of Issued Capital
1 HSBC CUSTODY NOMINEES (AUSTRALIA) LIMITED 1,914,810,894 15.39%
2 J P MORGAN NOMINEES AUSTRALIA LTD 1,624,714,180 13.06%
3 NATIONAL NOMINEES LIMITED 1,581,137,463 12.71%
4 CITICORP NOMINEES PTY LIMITED 539,070,317 4.33%
5 BNP PARIBAS NOMS PTY LTD 300,003,415 2.41%
6 RBC INVESTOR SERVICES AUSTRALIA NOMINEES PTY LTD 194,088,079 1.56%
7 AMP LIFE LIMITED 116,318,718 0.93%
8 UBS WEALTH MANAGEMENT AUSTRALIA NOMINEES PTY LTD 64,484,116 0.52%
9 AUSTRALIAN FOUNDATION INVESTMENT COMPANY LIMITED 52,595,000 0.42%
10 UBS NOMINEES PTY LTD 48,436,757 0.39%
11 ARGO INVESTMENTS LIMITED 38,954,800 0.31%
12 NEWECONOMY COM AU NOMINEES PTY LIMITED 36,418,851 0.29%
13 QUESTOR FINANCIAL SERVICES LIMITED 28,731,046 0.23%
14 NAVIGATOR AUSTRALIA LTD 24,454,493 0.20%
15 TELSTRA GROWTHSHARE PTY LTD 23,081,832 0.19%
16 NULIS NOMINEES (AUSTRALIA) LIMITED 22,347,348 0.18%
17 NETWORK INVESTMENT HOLDINGS PTY LTD 17,309,017 0.14%
18 EQUITAS NOMINEES PTY LTD 16,018,179 0.13%
19 MILTON CORPORATION LIMITED 13,280,253 0.11%
20 DJERRIWARRH INVESTMENTS LTD 10,914,291 0.09%
Total for Top 20 6,667,169,049 53.58%
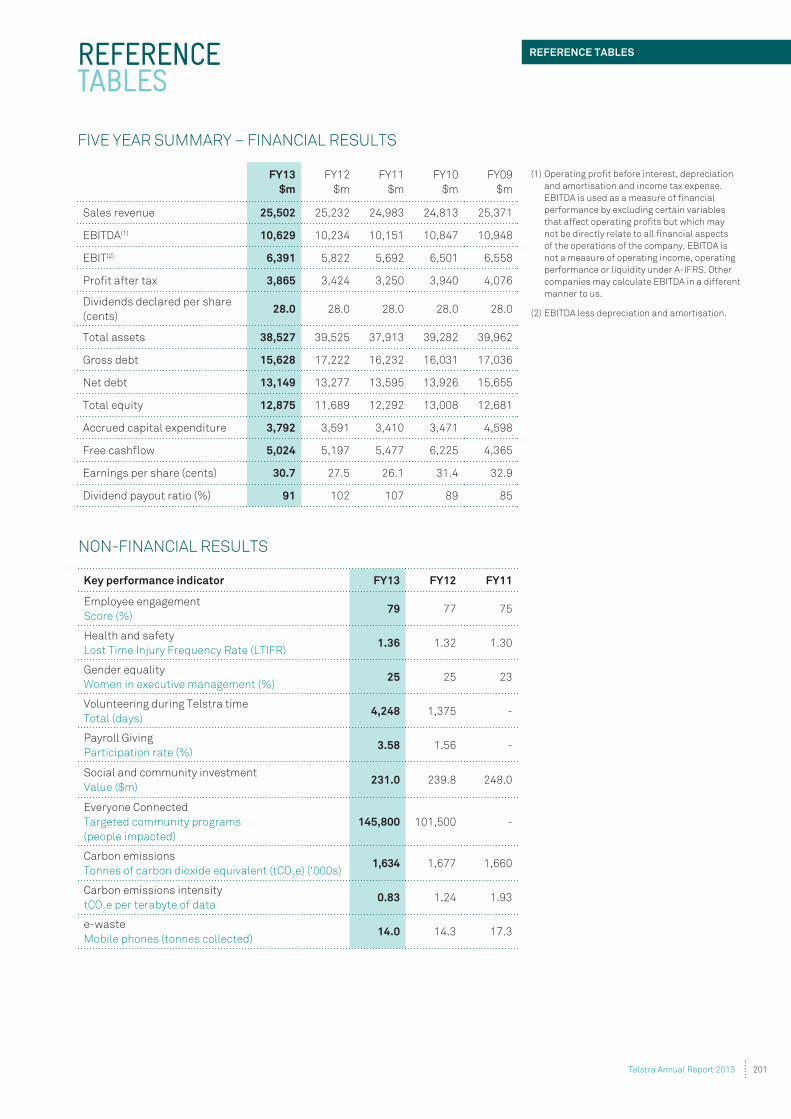
(1) Operating profit before interest, depreciation
and amortisation and income tax expense.
EBITDA is used as a measure of financial
performance by excluding certain variables
that affect operating profits but which may
not be directly relate to all financial aspects
of the operations of the company. EBITDA is
not a measure of operating income, operating
performance or liquidity under A-IFRS. Other
companies may calculate EBITDA in a different
manner to us.
(2) EBITDA less depreciation and amortisation.
FIVE YEAR SUMMARY – FINANCIAL RESULTS
FY13
$m
FY12
$m
FY11
$m
FY10
$m
FY09
$m
Sales revenue 25,502 25,232 24,983 24,813 25,371
EBITDA(1) 10,629 10,234 10,151 10,847 10,948
EBIT(2) 6,391 5,822 5,692 6,501 6,558
Profit after tax 3,865 3,424 3,250 3,940 4,076
Dividends declared per share
(cents) 28.0 28.0 28.0 28.0 28.0
Total assets 38,527 39,525 37,913 39,282 39,962
Gross debt 15,628 17,222 16,232 16,031 17,036
Net debt 13,149 13,277 13,595 13,926 15,655
Total equity 12,875 11,689 12,292 13,008 12,681
Accrued capital expenditure 3,792 3,591 3,410 3,471 4,598
5,024 5,197 5,477 6,225 4,365
Earnings per share (cents) 30.7 27.5 26.1 31.4 32.9
Dividend payout ratio (%) 91 102 107 89 85
REFERENCE TABLES
NON-FINANCIAL RESULTS
Key performance indicator FY13 FY12 FY11
Employee engagement
Score (%)79 77 75
Health and safety
Lost Time Injury Frequency Rate (LTIFR)1.36 1.32 1.30
Gender equality
Women in executive management (%)25 25 23
Volunteering during Telstra time
Total (days)4,248 1,375 -
Payroll Giving
Participation rate (%)3.58 1.56 -
Social and community investment
Value ($m)231.0 239.8 248.0
Everyone Connected
Targeted community programs
(people impacted)
145,800 101,500 -
Carbon emissions
Tonnes of carbon dioxide equivalent (tCO2e) ('000s)
1,634 1,677 1,660
Carbon emissions intensity
tCO2e per terabyte of data
0.83 1.24 1.93
e-waste
Mobile phones (tonnes collected)14.0 14.3 17.3
201Telstra Annual Report 2013
REFERENCE TABLES
PROOF MON 05.08.13
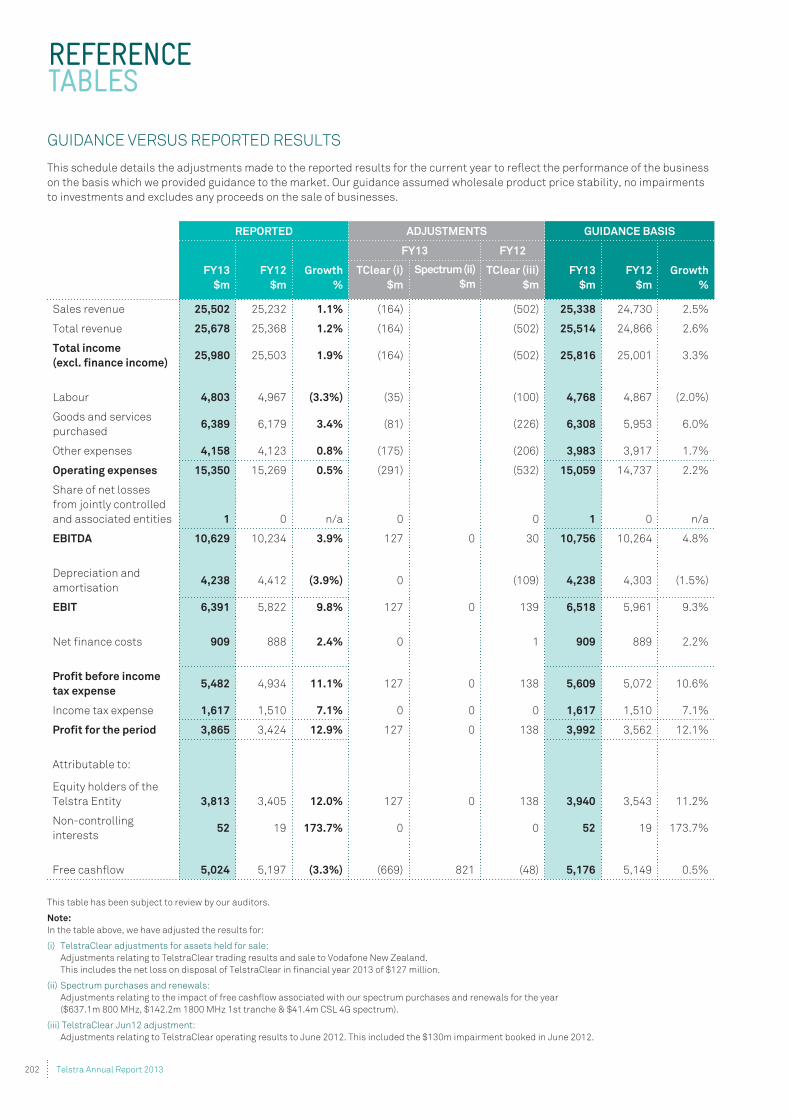
on the basis which we provided guidance to the market. Our guidance assumed wholesale product price stability, no impairments
REPORTED ADJUSTMENTS GUIDANCE BASIS
FY13
$m
FY12
$m
Growth
%
FY13 FY12
FY13
$m
FY12
$m
Growth
%
TClear (i)
$m
Spectrum (ii)
$m
TClear (iii)
$m
25,502 25,232 1.1% 25,338 24,730 2.5%
Total revenue 25,678 1.2% 25,514
Total income
(excl. finance income)25,980 25,503 1.9% 25,816 25,001 3.3%
4,803 (3.3%) 4,768
purchased6,389 3.4% 6,308
4,158 4,123 0.8% 3,983 1.7%
Operating expenses 15,350 0.5% 15,059 14,737 2.2%
from jointly controlled
and associated entities 1 0 n/a 0 0 1 0 n/a
EBITDA 10,629 10,234 3.9% 127 0 30 10,756 4.8%
amortisation4,238 4,412 (3.9%) 0 4,238 4,303
EBIT 6,391 5,822 9.8% 127 0 6,518
909 888 2.4% 0 1 909 2.2%
Profit before income
tax expense5,482 11.1% 127 0 138 5,609 5,072
1,617 1,510 7.1% 0 0 0 1,617 1,510 7.1%
Profit for the period 3,865 3,424 12.9% 127 0 138 3,992 12.1%
3,813 3,405 12.0% 127 0 138 3,940 3,543 11.2%
interests52 173.7% 0 0 52 173.7%
5,024 (3.3%) 821 5,176 0.5%
This table has been subject to review by our auditors.
Note:
REFERENCE TABLES
202 Telstra Annual Report 2013

(This page has been left blank intentionally)
Telstra Corporation Limited and controlled entities Telstra Annual Report 2013 203

(This page has been left blank intentionally)
204 Telstra Annual Report 2013 Telstra Corporation Limited and controlled entities
CONTACT DETAILS
REGISTERED OFFICE
Level 41, 242 Exhibition Street
Melbourne Victoria 3000 Australia
Damien Coleman
Company Secretary
email: [email protected]
GENERAL ENQUIRIES – REGISTERED OFFICE
Australia: 1300 368 387
All Other: +61 (8) 8308 1721
SHAREHOLDER ENQUIRIES
AUSTRALIAN SHARE REGISTER
Australia: 1300 88 66 77
All Other: +61 1300 88 66 77
Fax: +61 (2) 9287 0303
email: [email protected]
website: www.linkmarketservices.com.au/telstra
Link Market Services Limited
PO Box A942
Sydney South NSW 1234 Australia
NEW ZEALAND SHARE REGISTER
New Zealand: 0800 835 787
All Other:) +64 9 375 5998
Fax: +64 (9) 375 5990
email: [email protected]
website: www.linkmarketservices.co.nz
Link Market Services Limited
PO Box 91976
Auckland 1142
New Zealand
INVESTOR RELATIONS
Level 32, 242 Exhibition Street
Melbourne Victoria 3000 Australia
Australia: 1800 880 679
All Other: +61 (3) 8647 4954
email: [email protected]
SUSTAINABILITY
Level 37, 242 Exhibition Street
Melbourne Victoria 3000 Australia
email: [email protected]
TELSTRA CORPORATION LIMITED
ABN 33 051 775 556
Incorporated in the Australian Capital Territory
Telstra is listed on Stock Exchanges in
Australia and in New Zealand (Wellington)
WEBSITES
Telstra Investor Centre:
www.telstra.com.au/investor
Telstra’s Sustainability home page:
www.telstra.com.au/sustainability
Indicative Financial Calendar*
Final dividend paid Friday 20 September 2013
Annual General Meeting Tuesday 15 October 2013
Half Year Results Announcement Thursday 13 February 2014
Ex-dividend share trading commences Monday 24 February 2014
Record date for interim dividend Friday 28 February 2014
Interim dividend paid Friday 28 March 2014
Annual Results Announcement Thursday 14 August 2014
Ex-dividend share trading commences Monday 25 August 2014
Record date for final dividend Friday 29 August 2014
Final dividend paid Friday 26 September 2014
Annual General Meeting Tuesday 14 October 2014
* Timing of events may be subject to change.
Any change will be notified to the Australian Securities Exchange (ASX).

telstra.com.au/investor