teller, christoph, kotzab, herbert, grant, david b.. 2006
TRANSCRIPT

Teller, Christoph, Kotzab, Herbert, Grant, David B.. 2006. The Consumer Direct Services
Revolution in Grocery Retailing: an exploratory investigation. Managing Service Quality
Journal, 16 (1), pp. 78-96.
The Consumer Direct Services Revolution in Grocery Retailing: An Exploratory
Investigation
Christoph Teller
Department of Retailing and Marketing, Vienna University of Economics and Business
Administration, Vienna, Austria
Herbert Kotzab
Department of Operations Management, Copenhagen Business School, Frederiksberg,
Denmark, and
David B. Grant
School of Management and Languages, Heriot-Watt University, Edinburgh, UK
Abstract
Purpose - To provide empirical evidence and explanation of the phenomenon that providers of home delivery of
groceries are still of minor importance in highly concentrated retail markets.
Design/methodology/approach - Based on a critical literature review three propositions were set up. A web based
survey was conducted with two prospective consumer groups for home delivery providers: time starved consumers
and consumers with Internet affinity. A structural equation modeling analysis was applied in addition to uni- and
bivariate analysis.
Findings - In contrast to some assumptions in the literature shopping in stores for groceries was not generally
perceived to be an annoying activity. Respondents were aware of their own shopping logistics efforts in terms of
spatial and temporal distance when shopping in stores but were unable to convert these efforts into costs. Any

perceived inconvenience connected with shopping for groceries had no impact on respondents’ willingness to pay for
home delivery services or their future intentions to use such services.
Research limitations/implications - The study only investigated two specific consumer groups within highly
concentrated urban grocery retail markets. However these groups may be considered typical of most western
European countries and thus the study’s findings are of importance to retailers.
Practical implications - The major findings suggest that in general home delivery service may not be considered a
strategic competitive advantage in grocery retail markets. Other marketing issues such as pricing, assortment and
store personnel still substantially affect a consumer’s choice of retail formats. This leads to the conclusion that home
delivery providers should either appeal to niche markets and/or offer additional differential criteria compared to
traditional retail formats.
Originality/value - The paper argues for a different viewpoint for researchers investigating the topic of Internet-
based distance retailing. Further, the reintegration of logistical tasks from consumers should not be considered
detached from other format choice criteria.
Keywords Home delivery, Grocery retailing, Internet, Consumer direct service, Consumer logistics
Paper type Research paper
Introduction
This paper discusses the area of consumer direct (CD) related logistics, particularly how the
logistics related to home delivered groceries ordered over the Internet are perceived by
consumers. As academic and practical discussions in logistics focus more on technical
suggestions of how to solve the ‘last-mile’ problem to the private households (e.g. Pflaum et al.,
2000; Cairns, 1996), CD logistics still appears to be problematic.
Different studies have shown that costs for CD logistics are very high compared with the
traditional model, and consumers have high expectations of 100 per cent order fulfillment (Britt,
1998). The notion here is that extra costs for this service are met by consumers as there is an
underlying assumption that certain groups of consumers are demanding CD services and are
willing to pay for the extra services provided by CD logistics (Anonymous, 2001a; Anonymous,
2001b). This ‘consumer willingness to pay for the last mile’ hypothesis (Anonymous, 2002) was
the starting point for this research. We believe this hypothesis represents an example of what
Stock (2002) calls a ‘logistics myopia’ as both practitioners and academics might fail to
recognize the strategic implications of logistics activities. Thus, we refute this hypothesis and
argue what is missing in the whole CD discussion is the integration of the consumer’s voice.
The purpose of this study therefore is to evaluate consumers’ perceived awareness of their
logistical efforts in time, space and related costs to overcome the last mile problem, and their
readiness to use alternative channels to supply their households with groceries. Additionally we
want to identify consumers’ available logistics infrastructure and logistical behavior when using
CD services. We therefore examined shoppers and consumers directly with notions of CD in
order to receive a detailed assessment regarding the attractiveness of this particular way of
grocery shopping. From a marketing point of view we have tried to discover how logistical
efforts undertaken by consumers are relevant in their choice of a retail format.
The paper is structured as follows. After a theoretical presentation of the retail character
of CD, which we see simply as another form of distance retailing (Berman and Evans, 1998), the
second part of the paper presents the results of a web-based consumer survey (n=528;
representing two different target groups for CD). The findings show that the ‘willingness to pay
for the last mile’ hypothesis cannot be supported as consumers perceive traditional shopping not
to be that much of a burden. Further, some consumers have a clear idea of their logistics efforts in
terms of time and space but are not able to transfer these efforts into costs. Based on these
findings, we will conclude with a discussion on the threats and opportunities for retailers
involved in grocery distance shopping.
The concept of consumer direct
Consumer direct – a new retail format?
The home delivery (HD) of grocery goods ordered over the Internet is called consumer direct
(CD) and includes outbound ordering and inbound logistics from a consumer’s perspective. It
means that private users or consumers use some form of electronic means or other online services
for the ordering of food/grocery items that are later delivered to their private homes (Orler and
Friedman, 1998). Corbae and Balchandani (2002) expect the market for CD services in Europe to
reach over Euro 100 billion by the year 2010. This would represent a market share on total
grocery retail sales of over 10 percent.
Efficient Consumer Response Europe (2002), Pflaum et al. (2000), Siebel (2000) and
Orler and Friedman (1998) argue that the successful implementation of this food/grocery home
shopping growth requires technological maturity in the marketplace. Looking at the current state
of consumer Internet use and their technological maturity, there is huge potential for online food
or grocery retailing. Recent studies have shown that over 110 million people in the US,
representing 69 percent of the adult population, use the Internet (GfK, 2005). A similar pattern is
in Europe; for example Internet penetration in Sweden is over 75 percent (GfK, 2005). Also,
other IT-based interfaces such as fax machines, mobile phones or the use of credit cards and
client cards will help to drive the success of CD (Efficient Consumer Response Italy, 2002).
However, there are certain barriers that make CD difficult, e.g. the case of unattended deliveries
to a household and their related security issues (McKinnon and Tallam, 2003). The success of CD
also depends on logistics. Corbae and Balchandani (2001) estimated that over 900 million
deliveries need to be carried out to 35 million households in Europe, thus there is a need for
specific small-scale logistics in this area.
Consumer direct segments
From a classical marketing channel perspective, CD is a distribution channel that produces a
consumer specific service output like any other channel (Coughlan et al., 2001). From a retail
marketing point of view, any retail store format or retail institution can be seen as the result of a
segmentation process and an attempt to satisfy specific consumer needs (Levy and Weitz, 2004).
The basic notion of CD suggests that certain groups of consumers appreciate the value-added of
CD (Brown et al., 2003). CD services are presented as a practical way for a lot of consumers to
shop for their groceries as the majority of shoppers are not satisfied with their shopping
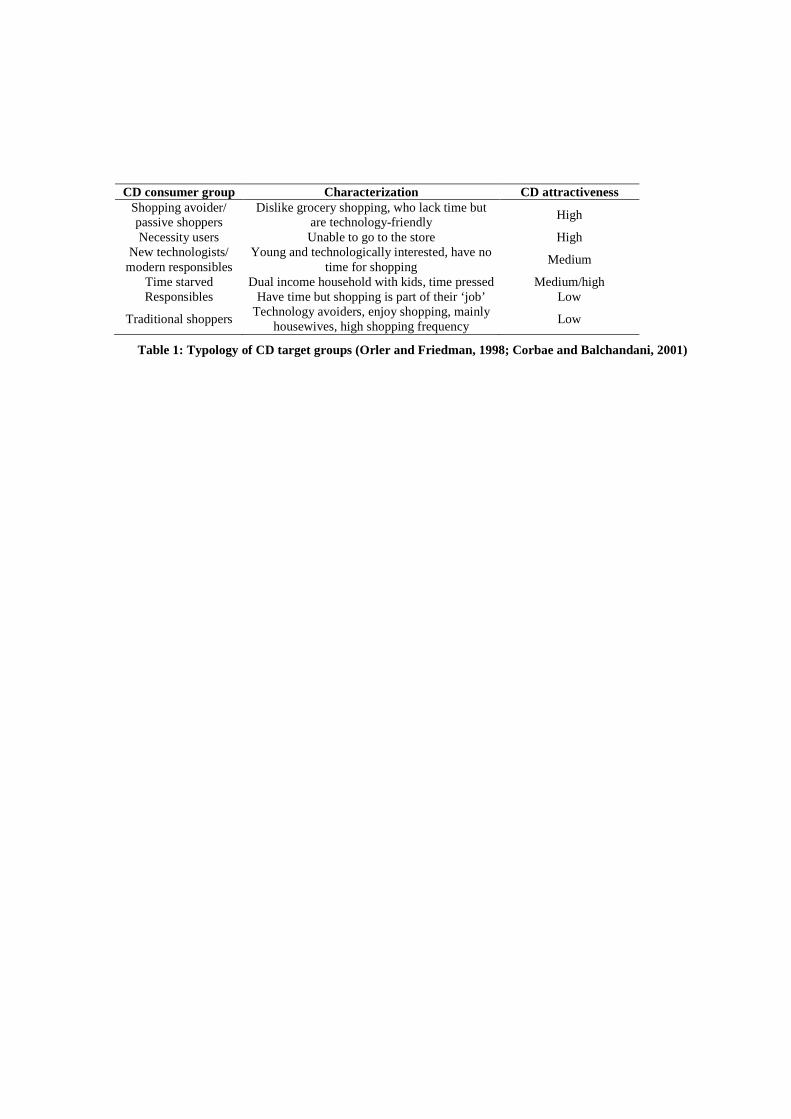
experiences (Siebel, 2000; Anckar et al., 2002). Orler and Friedman (1998) characterize this
group as ‘shopping avoiders’ and present other segments that CD appeals to (see Table 1).
Place Table 1 here
Table 1: Typology of CD target groups (Orler and Friedman, 1998; Corbae and Balchandani, 2001)
Different segments demand different CD services and Orler and Friedman (1998) and Corbae and
Balchandani (2001) predict a fast growing market share for CD. However, the authors also refer
to the logistical challenges of home delivery (HD) being the logistical side of CD and a low
consumer loyalty towards such services.
Overall, this suggested segmentation is reasonable as opposed to the suggestions of
Coughlan et al. (2001) who argue that whenever a group of consumers is willing to accept a
service output, here in terms of spatial convenience and/or waiting and delivery time, a new
marketing channel can be set up. However this typology can be characterized as a normative
approach that considers technology affinity and time for shopping as the main factors for CD
services choice. The descriptions of the segments are also vague in terms of ‘classical’ socio-
demographic variables, such as age, household size and family life cycle (Berman and Evans,
1998).
The logistics behind consumer direct services and its consumers’ attractiveness
With the introduction of the Internet CD initiatives have presented themselves as a counterpart to
in-store format-based grocery retailers who offer their services from one central point or store to
a maximum of people (Van den Poel and Leunis, 1999). Consumers here take up the logistical
responsibility by collecting their goods in the store, i.e. materials handling, and carrying the
purchased goods to their homes either on foot or by car, i.e. transportation. This effort can be
calculated in terms of time, where time for waiting at the cash desk has to be added to the total
delivery time. Alba et al,. (1997) introduced a transaction cost based choice model that a
consumer has in mind while weighing up which purchasing alternative might be the best. They
determined that consumer transaction costs for supermarket shopping are high, while those for
interactive home shopping, i.e. CD are low. This might be the case for the so-called precaution-
shopper, who – in terms of logistics – sources huge lot-sizes at once in order to have high
inventory levels at home as ‘safety stocks’. Such a scenario introduces the assumption of a
rational acting and deciding consumer (Bretzke, 1999). In fact all consumers have to provide
storage (e.g. a refrigerator) and transportation facilities (e.g. a vehicle) to bridge the time and
space between procurement and consumption (Granzin and Bahn, 1989; Granzin et al., 1997).
Those cost factors should also be taken into account when assessing the hidden costs of store
shopping (Bell et al., 1998).
Although these market numbers may make Internet-driven commerce to private
households, or Business to Consumer (B2C), appear attractive, recent market data show that such
sales account for only 1.6 percent of total trade volume is discouraging (Hudetz, 2002). But CD-
experts predict the market share for CD services in the European and US-market to be up to 12
percent; the ‘devil’ seems to be in the logistical detail (Pflaum et al., 2000; Engelsleben, 2000;
Siebel, 2000).
The European Efficient Consumer Response Initiative (ECRE, 2002) has offered an
overview of existing last mile business models for CD logistics highlighting differences between
various modes for delivery points (from pick up at the store to unattended HD), and delivery time
(from nearly just-in-time to non definite). From a CD logistics point of view, Morganosky and
Cude (2002) present the ‘pick-up-from-store’ as the most favored delivery option, which could be
seen as the best-practice from benchmarking the real consumer way of shopping. The authors
suggest therefore that the long-term feasibility of picking and delivering from stores from a cost
perspective presents a number of supply side questions that need to be further addressed by future
researchers. The issue is serious as Schlögel and Tomczak (1999) point out a CD provider has to
find the balance between sales and logistics costs per location. While in the classical store model
there are high sales and low costs for one location, sales decrease and costs increase the more a
provider delivers direct to consumers. This is mainly due to the missing consolidation effects and
economies of scale (Bretzke, 1999). The literature suggests extra costs will be paid by consumers
since they can calculate their own cost and savings. If the difference between the costs of their
own shopping and the costs of getting the groceries delivered to the homes is positive, the
consumers will achieve savings. However Barth et al,. (2002) argue consumers do not calculate
the costs of shopping since this process seems to be too complex, time consuming and not
necessary. These contrary views led to the following research assumptions and problem, which
will then be further discussed based on the empirical study.
Overall it is difficult to identify a ‘best-in-class’ business model, other than Tesco in the
UK, who is today’s ‘home-delivery champion’ at least in the UK. By 2002, Tesco had 750,000
online registered customers and was processing 110,000 orders a week (Butler, 2005; Bawden,
2005). In early 2003 Tesco’s online sales were more than 65 percent of the UK Internet grocery
markets (Bawden, 2005).
Consequences for the research problem
Summarizing the foregoing discussion, we have argued that the CD debate is missing the
integration of the consumer in examining their logistical activities (e.g. Bretzke, 1999; Alba et
al., 1997). Therefore this study’s efforts concentrated on the demand and consumer side of the
CD logistics, i.e. HD services, and generated the following research propositions:
P1. Consumer Logistics Awareness proposition: A consumer is aware of his/her shopping
logistics in terms of spatial and timely distance and related costs.
This proposition tests the concept of the rational consumer who knows about the costs of various
shopping possibilities and perceives the provision of storage and transportation facilities. The CD
studies indicate consumers are willing to demand HD services if they are convenient, however
the studies did not investigate the logistical burden as perceived by consumers.
P2. Consumer Logistics willingness to pay proposition: A consumer who outsources the
shopping logistics is willing to pay for CD service because he/she is aware of his/her
opportunity costs (i.e. transaction and logistical costs).
This proposition seeks to confirm notions that the rational consumer, who economically assesses
all shopping possibilities, chooses the best alternative on that basis. P2 can be considered a
continuation of P1. Further, if consumers perceive shopping as a logistical burden and can assess
the costs behind this burden, then what price are they willing to pay for an ‘outsourced’ service?
P3. Consumer Logistics inconvenience proposition: Perceived inconvenience of shopping
groceries in stores has a positive influence on the willingness to pay for and use of HD of
groceries.
To test this proposition the exogenous variable ‘inconvenience’ was operationalized by the
general (negative) attitude towards shopping of groceries in stores and the assessment of the most
frequently shopped outlet. This approach adopted the view of authors cited above who state that
the growing attractiveness of CD and therefore HD is a logical consequence of shopping
inconvenience in physical retail outlets.
Methodology
In order to test these research propositions we surveyed consumers with a high affinity to the
Internet who are said to represent prospective CD customer groups as suggested by Orler and
Friedman (1998) (see Table 1). Table 2 summarizes the research design:
Place Table 2 here
Table 2: Research design
The questionnaire dramaturgy was designed to mentally lead respondents through their shopping
habits and endeavors when procuring goods in their most frequently used outlet. Thereafter they

were presented with the possibility to ‘outsource’ grocery shopping to a third party. By doing so
the ‘spill over’ effect from the first questions made HD tangible for those respondents who have
never used distance retailing services. As the number of consumers presently using HD for
groceries is limited compared to the general population we focussed on two specific segments:
‘time starved’ and ‘new technologist’ stemming from the typology of Orler and Friedman (1998)
and Corbae and Balchandani (2001). These notions have been pre-tested previously (see Teller
and Kotzab, 2003; Kotzab and Teller, 2003) and in this study an alumni group from the Vienna
University of Economics and Business Administration represented the ‘time starved’ while
current students represented the ‘new technologists.’ The Internet was consciously used as the
research medium to reach those respondents actually using it and/or able and willing to use it
(Grant, Teller and Teller, 2005).
Univariate and bivariate analyses (e.g. correlation analysis, Mann-Whitney U test). were
conducted to test Propositions 1 and 2. Structural Equation Modeling (SEM) was applied to
identify causal effects between the different variables for Proposition 3.
Research results
Sample characterization
Table 12 in the Appendix provides the socio-demographic characteristics of the two respondent
groups. In both cases the Internet was found to be used on a regular basis. Respondents indicated
that they were mainly responsible for grocery shopping in their own household (~70 percent of
the total grocery supply). This does not seem to be surprising since most of them live alone. The
average respondent buys groceries at least twice a week. Table 3 shows that the two groups are
homogeneous regarding the criteria procurement responsibility (t-test, p>0.05) meaning that the
person who uses the Internet is also mainly responsible for the purchases. Contrary to that the

shopping frequency and the amount spent at each trip significantly differs between the two
groups (t-test, p<0.05). This might be due to the significant difference in household income and
therefore available amount of money for buying groceries (Correlation analysis; Spearman’s rho;
p<0.05).
Place Table 3 here
Table 3: Shopping behaviour
In a next step those respondents who have had groceries delivered to their home (see Table 4)
were given a list of statements and asked to evaluate their shopping experience in case of
shopping for goods in the supermarket or via HD. The different statements were grouped into
three categories of convenience, logistics and marketing (Eastlick and Feinberg, 1999). When it
comes to the comparison of the shopping experience in a store with the shopping experience of
home shopping, a sober picture for HD services emerged as there were no significant differences
in the assessment of both purchasing in stores and (for those who have experience) with HD (see
Table 4 and Figure 1).
Place Table 4 here
Table 4: Experience with HD of groceries
Figure 1 shows that the concept of HD is perceived as very convenient but all respondents
considered this shopping possibility as being almost as pleasant as shopping groceries in stores.
Only the logistics of HD was seen as timesaving and less laborious while most marketing criteria
of stores were better evaluated than the marketing criteria of HD. The typical home delivered
product were beverages (26 percent multiple response, n=125), followed by frozen food (9
percent) and bakery products (8 percent), which can be seen as kind of difficult to handle
products in terms of weight, size and protection. Next, the evaluation of both shopping in store

and HD were compared for those respondents (alumni and students, n=130) who have had
groceries delivered to their homes. Again, there were significant differences between the
assessments of the different statements regarding the two modes of shopping within the two
samples. Only ‘friendly personnel’, ‘cleanness’, ‘advice’ and ‘pleasant’ were assessed in the
same way (Wilcoxon-Test; p>0.05).
The differences between the samples showed there is almost overall homogeneity
(p>0.05) in the assessment of store shopping and HD between the groups. In particular, looking
at shopping with HD, there was no significant difference between the assessments of the
‘convenience’ statements. However, nearly all groups evaluated store shopping as not such a
burden as reported in the CD literature. This was even surprising in the group of shoppers, where
we expected a confirmation of the ‘time-starved’ scenario (Orler and Friedman, 1998).
Place Figure 1 here
Figure 1: Assessment of store- vs. non store shopping
Consumer Logistics Awareness (P1)
Table 5 shows the results of consumers’ perceived logistical framework of individual shopping
action in terms of distance in space and time.
Place Table 5 here
Table 5: Estimation of distances between stores and household in meters and minutes
Most of the respondents estimated the distance between their homes and their usual stores to be
between 100 and 1,000 meters. This would take them between 3 and 5 minutes to walk. The
differences among the two groups can be regarded as significantly different (Mann-Whitney U
test, p<0.001) whereas the ‘time starved’ overcome a larger temporal and spatial distance.
These results can be interpreted twofold. Either consumers are definitely aware of their
shopping logistics or they are not. We believe the findings are reliable, since Schnedlitz et al,.
(1999) discussed a high shop density in Austria concluding that any Austrian can shop for
groceries within 5 minutes from their homes or workplace. From these results, we can better
understand the indicated high shopping frequency and the low average amount spent per
shopping trip (see Table 3).
The results of how consumers convert their logistics efforts into costs (see Table 6) were
not supportive as most respondents, independent of which group they belong to, evaluated their
costs as being zero.
Place Table 6 here
Table 6: Estimated logistical costs of shopping
Based on these findings consumers in this context appear to partially rational: they know about
the logistics side of shopping but are unable to calculate these efforts in terms of prices/costs.
Consumer Logistics willingness to pay (P2)
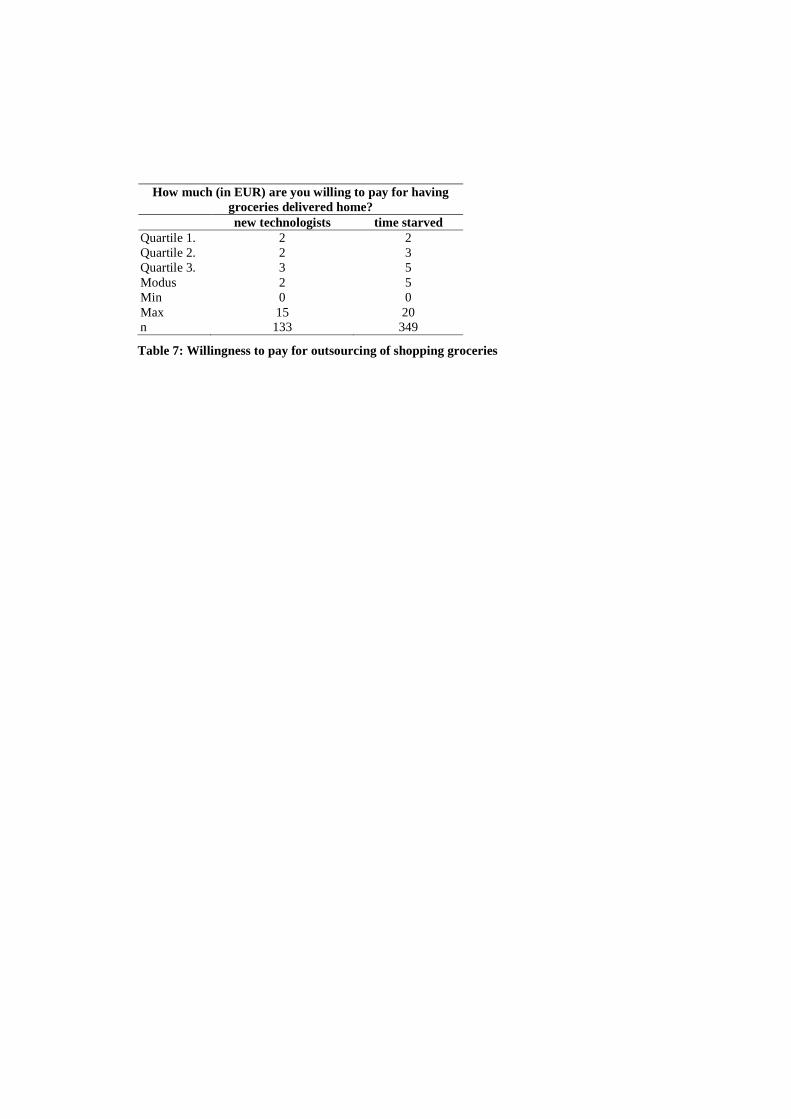
Following the notions of Wertenbroch and Skiera (2002) respondents were asked at the end of the
questionnaire whether they were willing to pay for HD services. The results are shown in Table
7. The most frequent answers (modus) were Euro 2.00 by the ‘new technologists’ and Euro 5.00
by the ’time starved’ respondents. The assessments were significantly different between the two
groups whereas ‘new technologists’ were willing to pay less than ‘time starved’ (Mann-Whitney
U test, p<0.05). Interestingly we could not identify a significant correlation between household
income and the willingness to pay in both groups (correlation analysis; Spearman’s rho; p>0.05).
Place Table 7 here

Table 7: Willingness to pay for outsourcing of shopping groceries
The relationship between the willingness to pay for outsourcing the shopping function and the
logistical variables ‘distance in meters from home to store’ and ‘distance in minutes from home
to store’ is shown in Table 8.
Place Table 8 here
Table 8: Correlations between logistical dimensions and directly/indirectly estimated costs of
shopping
Although most of the correlations are significant (p<0.05) they appear to be rather weak (r<0.42).
This implies that spatial and temporal distances do not influence the willingness to outsource
shopping endeavors to a considerable degree. The same pattern, significant but weak correlations,
emerged when investigating the relationship between the willingness to pay for HD and other
factors operationalizing the degree of carried out shopping logistics (see Table 3) such as:
- Size of the shopping basket (expenditures per shopping trip)
- Frequency of grocery procurement (average shopping frequency)
- Degree of procurement responsibility (share of grocery procurement for the household)
In summary the data indicates that the observed willingness to pay for HD cannot be
satisfactorily explained by the degree of logistical endeavors undertaken by respondents when
shopping groceries in stores.
Finally respondents were asked about their future use intentions for HD of groceries (see
Table 9) and identified a more pessimistic attitude (Mean>3.7; six point rating scale; 1=will
certainly use HD, 6=will certainly not use HD). The majority appear not very likely to use HD of
groceries in the future. However, the willingness to outsource grocery shopping is significantly
higher in the group of ‘time starved’ respondents (Mann-Whitney U test, p<0.001).
Place Table 9 here

Table 9: Prospective chances of the Internet used as a media to carry out grocery shopping
Comprising the results from testing P1 and P2 we conclude that while consumers have the
ability to assess shopping logistics by given parameters, they have an inability to convert these
endeavors into monetary dimensions at the same time. These findings seem to be surprising when
considering the specific kind of education of respondents which is said to sharpen economic
and/or rational thinking.
Consumer Logistics inconvenience (P3)
Figure 2 provides an overview over the variables and constructs included in the model set up
based on proposition 3. To test the model Structural Equation Modeling (SEM; using Amos 5.0)
was applied to try and explain structures or patterns amongst a set of latent variables, i.e.
constructs, typically measured by manifest variables by analysing the correlation or
variance/covariance input matrices of all variables (Hair et al., 1995).
The analysis was applied to both respondent-groups in order to reach the critical sample
size of 200 necessary to conduct SEM (Bentler, 1990). Most latent variables were measured by
means of multi-item scales. The item generation was drawn from literature and/or previous
studies. According to Proposition 3 the model consists of the exogenous (latent) variables
‘assessment of (negative) general attitudes towards shopping groceries in stores’ and ‘assessment
of perceived inconveniences of shopping in the most frequently visited store’ and the endogenous
(latent) variables ‘willingness to pay for HD’ and ‘willingness to use HD in the future’.
According to this proposition both exogenous variables positively affect the two endogenous
variables. A more detailed description of these constructs and their indicating variables is
described in Table 14 in the Appendix. Figure 2 illustrates the proposed causal effects within our
model.

Place Figure 2 here
Figure 2: Proposed Structural Model
Before interpreting the results of the causal effects between constructs in the structural model
(X1, X2 � Y1, Y2), we determined that the empirical data fit the model. The most important
descriptive overall fit measures Goodness of Fit (GFI) and the adjusted goodness-of-fit index
(AGFI) meet the criteria of being higher than 0.9 (Baumgarten and Homburg, 1996; Hair et al.,
1995). The Root Mean Square Error of Approximation (RMSEA) is also below the required level
of 0.08 which indicates also a good fit of the model (Hair et al., 1995). Tables 14 and 15 in the
Appendix shows other fit measures necessary to evaluate the overall and local fit of the model
which – without going into detail – turn out to be satisfactory.
Table 10 shows the parameter estimates of our structural model (g11 – g23). All
parameters are insignificant at the 5 percent level which means that the exogenous variables or
constructs do not significantly influence the endogenous variables or constructs.
Place Table 10 here
Table 10: Estimates of structural equation coefficients
The Squared Multiple Correlations values of Y1 (0.1) and Y2 (0.6) appear to be very low, which
means that only the exogenous variables X1 and X2 explain variance in the ‘willingness to pay
for HD’ and the ‘willingness to use HD’ constructs to any great degree. Looking at the
standardized estimates of the model the coefficients (g11-g22) are very low between all
constructs (see Figure 3).
Interestingly the construct ‘general attitude’, i.e. the rating of the overall perceived
inconvenience of grocery shopping, affects the willingness to pay and use HD negatively. In
summary, the constructs ‘assessment of shopping’ and ‘general attitude’ do not have a significant

or strong positive impact on ‘willingness to pay for HD’ and ’willingness to use HD’. Proposition
3 can therefore clearly be rejected.
Place Figure 3 here
Figure 3: Standardized Estimates
Conclusion and Outlook
Synopsis
This paper examined the consumer side of CD logistics services according to three research
propositions which were empirically tested. The results are summarized in Table 11.
Place Table 11 here
Table 11: Synopsis of research propositions
The findings showed that there is a discrepancy between CD research and practice, when it
comes to listening to the voice of the consumer as most CD research concentrates on technical
issues of how to solve the last mile by assuming a high consumer appreciation as a given factor.
Here we believe that Stock’s (2002) myopia notions can be supported. This study has shown that
consumers are logistical experts in time and space, but amateurs in cost consciousness. They are
willing to pay for HD as the logistical core of CD but their preferred payment seems not to
represent their real cost and/or physical burden in their shopping behavior.
Managerial implications
From a managerial point of view the results of the empirical study show that the delivery service
within the concept of CD can not be considered as a strategic competitive advantage in grocery
retail markets. This is due to the fact as consumers are (still) not able to perceive an important

difference between home delivery and traditional grocery shopping. Other marketing issues like
pricing, assortment, personnel etc. still affects consumers’ choice of retail formats substantially.
This may lead to the conclusion that current home delivery providers should either appeal to
niche markets and/or offer additional differential criteria compared to traditional suppliers.
Managers, who invest into home delivery systems, have to consider to explicitly showing their
customers sustainable, important and perceivable advantages of this specific logistics offering.
We also suggest that retail managers, who are thinking of integrating HD into their existing
channels, will first have to convince consumers about supplementary and costly activities, and
secondly will have to identify rationalization possibilities within their HD concept.
Limitations and directions for further research
Since the retail sector can be seen as a local activity (Omar, 1999) we have to limit our results
and findings to retail markets having a similar structure like the Austrian retail sector, i.e. high
concentration and high outlet density. Nevertheless the success of ‘Tesco.com’ in the UK cannot
be explained by our findings. Another limitation is our approach of focusing on the service HD
and treating all other retail mix criteria, such as assortment, price and other services, as being
similar to all other store-based retail formats. All these ‘ceteris paribus’ assumptions should be
seen as starting points for further research. We suggest examining the consumer side of HD in
larger distance grocery environments as well as among consumers with more extensive distance
shopping experience. We also propose to test our model in different country markets in order to
identify certain differences and similarities in international and global consumer behavior when
shopping over the Internet. Furthermore the perception of consumer logistics tasks within
households which can be seen as the ‘dark side of shopping’ (Babin et al., 1994) should be

focused more in following research endeavors in order to understand the perceived value of CD
services in more detail.
References
Alba, J., Lynch, J., Weitz, B., Janiszewski, C., Lutz, R., Sawyer, A. and Wood, S. (1997),
“Interactive home shopping: consumer, retailer, and manufacturer incentives to participate
in electronic market places”, Journal of Marketing, Vol. 61 No. 3, pp. 38-53.
Anckar, B., Walden, P. and Jelassi T. (2002), “Creating customer value in online grocery
shopping“, International Journal of Retail & Distribution Management, Vol. 30 No. 4,
pp. 211-220.
Anderson, J.C. and Gerbing, D.W. (1988), “Structural Equation Modeling in Practice: A Review
and Recommended Two-Step Approach“, Psychological Bulletin, Vol. 103 No. 3, pp.
411-423.
Anonymous (2001a), “Lebensmittel-Online. Lokale Umsätze im weltweiten Netz“, LP-
International, Vol. 10 No. 1, pp. 1-2.
Anonymous (2001b), “Tesco als online-Händler. Kampf um Platz Eins“, LP-International, Vol. 3
No. 1, p. 2.
Anonymous (2002), “Dossier Globale Handelsstrukturen“, LP-International, Vol. 11 No. 2, pp.
10-13.
Arbuckle, J.L. and Wothke, W. (1999), Amos 4.0 User’s Guide, SmallWaters Corporation,
Chicago.
Babin, B. J., Darden, W. R. and Griffin, M. (1994), Work and/or fun: Measuring hedonic and
utilitarian shopping, Journal of Consumer Research, Vol. 20 No. 4, pp. 644-656.
Barth, K., Hartmann, M. and Schröder, H. (2002), Betriebswirtschaftslehre des Handels, Gabler,
Wiesbaden.
Baumgarten, H. and Homburg, Ch. (1996), “Applications of structural equation modelling in
marketing and consumer research: A review”, International Journal of Research in
Marketing, Vol. 13 No. 2, pp. 139-161.
Bawden, T. (2005), “Tesco’s web sales soar”, The Times, No. 8, p. 60.
Bell, D. R., Ho, T.-H. and Tang, C. S. (1998). “Determining where to shop: Fixed and variable
costs of shopping”, Journal of Marketing Research, Vol. 35 No. 3, pp. 352-369.
Bentler, P.M. (1990), “Comparative Fit Indexes in Structural Models”, Psychological Bulletin,
Vol. 107 No. 2, pp. 238-246.
Berman, B. and Evans, J. R. (1998), Retail management. A strategic approach, Prentice Hall,
Upper Saddle River.
Bretzke, W.-R. (1999), “Smart Shopping im Internet: Industrie und Handel im Zeitalter von
Electronic Commerce“, in Kopfer, H. and Bierwirth, C. (Eds.), Logistik Management
Intelligente I+K-Technologien, Springer, Heidelberg, pp. 231-243.
Britt, F. (1998), “The logistics of consumer direct”, Progressive Grocer, Vol. 77 No. 5, p. 39.
Brown, M., Pope, N. and Voges, K. (2003), “Buying or browsing? An exploration of shopping
orientations and online purchase intention”, European Journal of Marketing, Vol. 37 No.
11/12, pp. 1666-1684.
Butler, S. (2005), “Impressive growth in sales ‘will keep tesco to the fore”, The Times, No. 19, p.
41.
Cairns, S. (1996), “Delivering alternatives. Success and failures of home delivery service for food
shopping”, Transport Policy, Vol. 3 No. 4, pp. 155-176.
Corbae, J. and Balchandani, A. (2001), “Consumer Direct Europe (CDE) – Erfolg durch
Zusammenarbeit“, in Ahlert, D., Becker, J., Kenning, P. and Schütte, R. (Eds.), Internet &
Co. im Handel. Strategien, Geschäftsmodelle, Erfahrungen, Springer, Berlin et al., pp.
63-78.
Coughlan, A., Anderson, E., Stern, L. and El-Ansary, A. (2001), Marketing Channels, Prentice-
Hall, Upper Saddle River.
Eastlick, M. A. and Feinberg, R. A. (1999), “Shopping Motives for Mail Catalog Shopping”,
Journal of Business Research, Vol. 45 No. 3, pp. 281-290.
Efficient Consumer Response Europe (2002), Consumer Direct Logistics, Germa Press,
Hamburg.
Efficient Consumer Response Italy (2002), New technologies for direct consumer interaction.
Special summary for ECR Europe Conference, ECR-Italia.
Engelsleben, T. (2000), E-Commerce and the marketing mix, Presentation Simon Kucher &
Partner, Paris et al..
Fornell, C. (1983) “Issues in the Application of Covariance Structure Analysis: A Comment”,
Journal of Consumer Research, Vol 9. No. 2, pp. 443-448.
Gfk (2005), “Map of Internet use”, www.gfk.at.
Grant, D.B., Teller, C. and Teller, W. (2005), “Web-based Surveys in Logistics Research: An
Empirical Application”, in Kotzab H., Seuring S., Müller M. and Reiner G. (eds.)
Research Methodologies in Supply Chain Management, Heidelberg, Germany: Physica,
pp. 139-154.
Granzin, K. L. and Bahn, K. D. (1989), “Consumer Logistics: Conceptualization, Pertinent Issues
and a Proposed Program for Research”, Academy of Marketing Science, Vol. 17 No. 1,
pp. 91-101.
Granzin, K. L., Painter, J. J. and Valentin, E. K. (1997), “Consumer logistics as a basis for
segmenting retail markets. An exploratory inquiry”, Journal of Retailing and Consumer
Services, Vol. 4 No. 2, pp. 99-107.
Hair, J.F., Anderson, R.E., Tatham R.L. and Black, W.C. (1995), Multivariate Data Analysis,
Prentice-Hall, Englewood Cliffs, NJ.
Hudetz, K. (2003), “E-commerce im Jahr 2002”, Handelsjournal, No. 1, pp. 32-33.
Kotzab, H. and Teller, C. (2003), “The Consumer Direct Myopia”, in Kent, J. (Ed.), Proceedings
of the Thirty-Second Annual Logistics Educators Conference, Chicago, CD-Rom.
Levy, M. and Weitz, B.A. (2004), Retailing Management, Irwin, New York.
Loehlin, J.C. (1998), Latent Variable Models: an introduction to factor, path, and structural
analysis, Lawrence Erlbaum Associates, Malwah, NJ.
McKinnon, A. C. and Tallam, D. (2003), “Unattended delivery to the home: An assessment of the
security implications”, International Journal of Retail & Distribution Management, Vol.
31 No. 1, pp. 30-41.
Morganosky, M. and Cude, B. (2002), “Consumer demand for online food retailing: is it really a
supply side issue?”, International Journal of Retail & Distribution Management, Vol. 30
No. 10, pp. 451-458.
Omar, O. (1999), Retail Marketing, Financial Times Pitman Publishing, London.
Orler, V. and Friedman, D. (1998), “The consumer behind consumer direct”, Progressive Grocer,
No. 2, pp. 39-42.
Pflaum, D., Kille, C., Mirko, W. and Prockl, G. (2000), Heimlieferdienste für Lebensmittel und
Konsumgüter des täglichen Bedarfs im Internet - die ‚letzte Meile' zum Kunden aus der
logistischen Perspektive, Nürnberg.
Schlögel, M. and Tomczak, T. (1999), “Consumer Direct: Food-Lieferdienste auf dem Weg zu
einem neuen Vertriebskanal“, in Tomczak, T., Belz, C., Schlögel, M. and Birkhofer, B.
(Eds.), Alternative Vertriebswege, Schaeffer-Poeschel, Stuttgart, pp. 288-308.
Schnedlitz, P., Kotzab, H. and Cerha, C. (1999), “Betriebstypenspezifische Einkaufsstättenwahl
und Nahversorgungsproblematik“, in Trommsdorff, V. (Ed.), Handelsforschung
1999/2000: Verhalten im Handel und gegenüber dem Handel, Gabler, Wiesbaden, pp.
195-212.
Schumacker, R.E. and Lomax, R.G. (2004), A Beginner’s Guide to Structural Equation
Modeling, Lawrence Erlbaum Associates, Malwah, NJ.
Siebel, L. (2000), Food Logistics: Lebensmittel via Internet, Symposion Publishing, Düsseldorf.
Steenkamp, J-B.E.M. and van Trijp, H.C.M. (1991), „The use of LISREL in validating marketing
constructs,“ International Journal of Research in Marketing, Vol. 8 No. 4, pp. 283-299.
Stock, J. R. (2002), “Marketing myopia revisited: lessons for logistics”, International Journal of
Physical Distribution & Logistics Management, Vol. 32 No. 1, pp. 12-21.
Teller, C. and Kotzab, H. (2003), “A Consumer Response to the Home Delivery of Groceries”, in
Manachof, D. A., Sodhi, M. S., Browne, M. and Allen, J. (Eds.): Logistics Research
Network 2003 Conference Proceedings, The Institute of Logistics and Transport, London,
pp. 398-405.
Van den Poel, D. and Leunis, J. (1999), “Consumer Acceptance of the Internet as a Channel of
Distribution”, Journal of Business Research, Vol. 45 No. 3, pp. 249-256.
Wertenbroch, K. and Skiera, B. (2002), “Measuring consumers’ willingness to pay at the point of
purchase“, Journal of Marketing Research, Vol. 39 No. 2, pp. 228-241.

APPENDIX
Place Table 12 here
Place Table 13 here
Place Table 14 here
Place Table 15 here
CD consumer group Characterization CD attractiveness Shopping avoider/ passive shoppers
Dislike grocery shopping, who lack time but are technology-friendly
High
Necessity users Unable to go to the store High New technologists/ modern responsibles
Young and technologically interested, have no time for shopping
Medium
Time starved Dual income household with kids, time pressed Medium/high Responsibles Have time but shopping is part of their ‘job’ Low
Traditional shoppers Technology avoiders, enjoy shopping, mainly
housewives, high shopping frequency Low
Table 1: Typology of CD target groups (Orler and Friedman, 1998; Corbae and Balchandani, 2001)
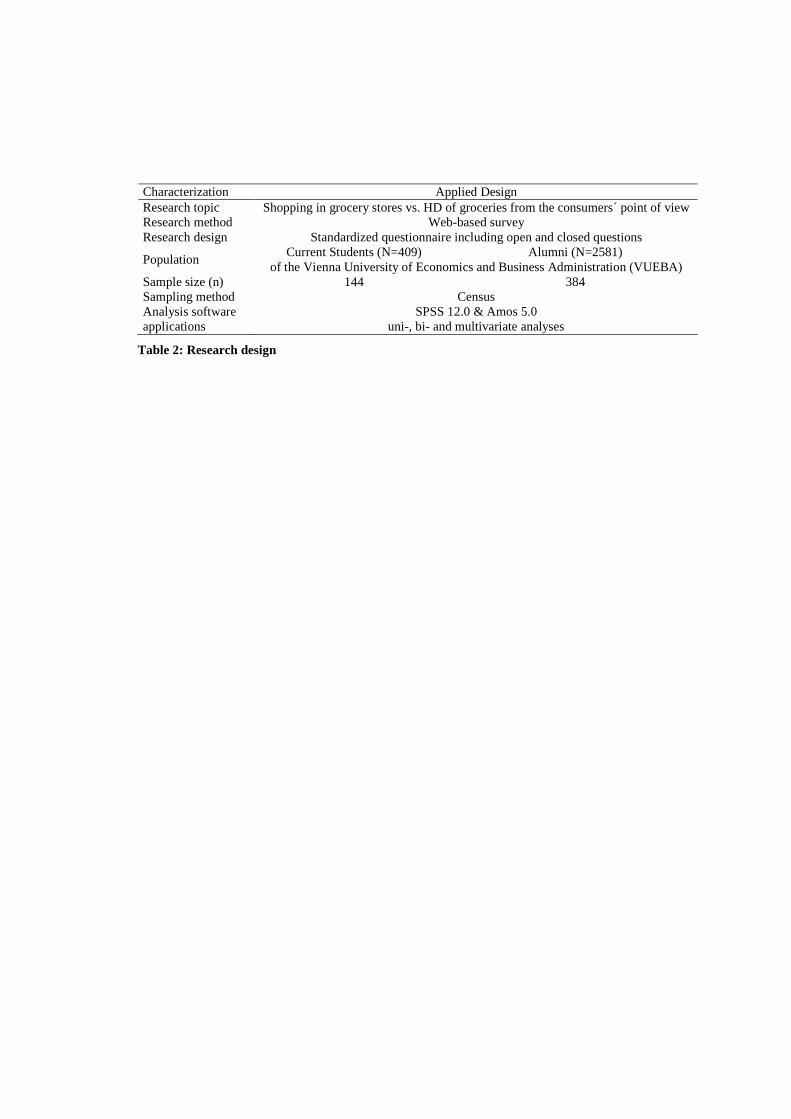
Characterization Applied Design Research topic Shopping in grocery stores vs. HD of groceries from the consumers´ point of view Research method Web-based survey Research design Standardized questionnaire including open and closed questions
Population Current Students (N=409) Alumni (N=2581)
of the Vienna University of Economics and Business Administration (VUEBA) Sample size (n) 144 384 Sampling method Census Analysis software applications
SPSS 12.0 & Amos 5.0 uni-, bi- and multivariate analyses
Table 2: Research design

What is the share (%) of grocery shopping that you buy for your household?
new technologists time starved Mean 71.03 71.51 Std. dev. 29.28 27.57 Min 3.00 3.00 Max 100 100 n 143 379
How often do you buy groceries? (per month) Mean 11.93 9.85 Std. dev. 5.29 5.54 Min 1.00 0.08 Max 26.09 26.09 n 142 379
How much do you spend on average for groceries per shopping trip?
Mean 21.50 43.15 Std. dev. 11.98 45.01 Min 5 5 Max 80 600 n 139 368
Table 3: Shopping behaviour

Have you ever had groceries delivered to your home? (%) new technologists time starved
Yes 13.19 28.91 No 86.81 71.09 n 144 384 How often did you have groceries delivered to your home?
(per month) Mean 0.55 1.01 Std. dev. 0.86 2.00 Min 0.04 0.04 Max 3 13.045 n 19 107
What is the share of all grocery purchases that you have had delivered to your home? (%)
Mean 5.42 12.66 Std. dev. 9.06 20.50 Min 0 0 Max 40 90 n 19 106
Table 4: Experience with HD of groceries

What is the distance (in meters) between the (this) supermarket (where you frequently buy groceries) and
your home? new technologists time starved
Quartile 1. 100 200 Quartile 2. 300 700 Quartile 3. 1,000 2,000 Modus 100 2,000 Min 2 2 Max 30,000 50,012 n 132 350
How many minutes does it take to get home from the (this) supermarket (where you frequently buy
groceries)? Quartile 1. 2 3 Quartile 2. 4 5 Quartile 3. 6 10 Modus 3 5 Min 1 1 Max 20 45 n 140 371
Table 5: Estimation of distances between stores and household in meters and minutes

Please try to estimate the costs (in EUR) occurring when you do grocery shopping. Think of costs in terms of time
and space! new technologists time starved
Quartile 1. 0 0.775 Quartile 2. 1 3 Quartile 3. 3 10 Modus 0 0 Min 0 0 Max 20 200 n 108 276
Table 6: Estimated logistical costs of shopping
How much (in EUR) are you willing to pay for having groceries delivered home?
new technologists time starved Quartile 1. 2 2 Quartile 2. 2 3 Quartile 3. 3 5 Modus 2 5 Min 0 0 Max 15 20 n 133 349
Table 7: Willingness to pay for outsourcing of shopping groceries

Correlations (Spearman's rho) Time (minutes) Distance (meters) Average Shopping expenditures (in
EUR)
Estimated costs of shopping in stores (EUR)
new technologists 0.22* 0.29** 0.19* time starved 0.37** 0.41** 0.3**
Willingness to pay for home delivery services (EUR)
new technologists 0.03 0.03 0.25** time starved 0.15** 0.09 0.17**
Caption: *…p<0.05; **…p<0.01
Table 8: Correlations between logistical dimensions and directly/indirectly estimated costs of
shopping

Are you (still) going to have groceries delivered home in the future?(1=yes certainly, 6=certainly not)
new technologists time starved Mean 4.48 3.74 Std. dev. 1.59 1.62 n 143 371
Table 9: Prospective chances of the Internet used as a media to carry out grocery shopping

Parameter Parameter value (unstandardized) p g11 -0.321 0.266 g12 0.145 0.693 g22 0.052 0.696 g21 -0.156 0.134 g23 0.099 <0.05
Table 10: Estimates of structural equation coefficients

Research proposition Characterization Accept/Reject P1. Consumer Logistics awareness proposition
A consumer is aware of his/her shopping logistics in terms of spatial and timely distance and the related costs.
Partly accept – all consumers were aware of their logistics efforts in terms of spatial and timely distances, but unable to convert their efforts into costs.
P2. Consumer logistics willingness to pay proposition
A consumer is willing to outsource the shopping logistics and to pay for this service.
Partly accept – consumers were willing to pay a price for HD although undertaken shopping logistics do not influence the observed degree of willingness. Most of respondents are not likely to have groceries delivered in the future.
P3. Consumer Logistics inconvenience proposition
Perceived inconvenience of shopping groceries in stores has a positive influence on the willingness to pay for and use of HD of groceries.
Rejected – neither negative attitudes towards shopping groceries in stores nor the assessment of most frequently carried out shopping processes affect the willingness to pay for HD and the future use of HD.
Table 11: Synopsis of research propositions

Age new technologists time starved
Mean 23.8 35.8 Std. dev. 2.7 8.8 Min 19 20 Max 32 72 n 144 382
# of persons in householdes Mean 2.3 2.1 Std. dev. 1.1 1.1 Min 1 1 Max 6 7 n 144 384
Gender (%) Male 35.4 44.5 Female 64.6 55.5 n 144 384
Household income before taxes (EUR) Mean 2,296.7 4,773.7 Std. dev. 2,307.2 2,870.5 Min 220 500 Max 12,000 20,000 n 91 259
Table 12: Socio-demographic description of the samples
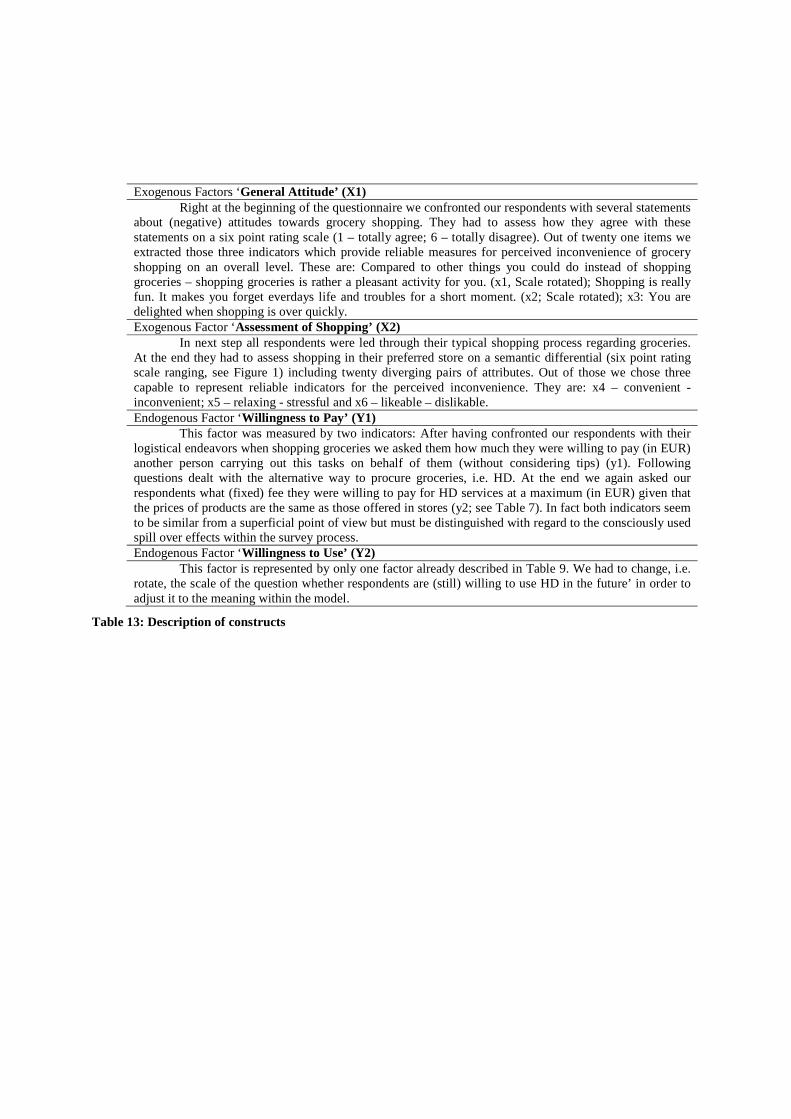
Exogenous Factors ‘General Attitude’ (X1) Right at the beginning of the questionnaire we confronted our respondents with several statements
about (negative) attitudes towards grocery shopping. They had to assess how they agree with these statements on a six point rating scale (1 – totally agree; 6 – totally disagree). Out of twenty one items we extracted those three indicators which provide reliable measures for perceived inconvenience of grocery shopping on an overall level. These are: Compared to other things you could do instead of shopping groceries – shopping groceries is rather a pleasant activity for you. (x1, Scale rotated); Shopping is really fun. It makes you forget everdays life and troubles for a short moment. (x2; Scale rotated); x3: You are delighted when shopping is over quickly. Exogenous Factor ‘Assessment of Shopping’ (X2)
In next step all respondents were led through their typical shopping process regarding groceries. At the end they had to assess shopping in their preferred store on a semantic differential (six point rating scale ranging, see Figure 1) including twenty diverging pairs of attributes. Out of those we chose three capable to represent reliable indicators for the perceived inconvenience. They are: x4 – convenient - inconvenient; x5 – relaxing - stressful and x6 – likeable – dislikable. Endogenous Factor ‘Willingness to Pay’ (Y1)
This factor was measured by two indicators: After having confronted our respondents with their logistical endeavors when shopping groceries we asked them how much they were willing to pay (in EUR) another person carrying out this tasks on behalf of them (without considering tips) (y1). Following questions dealt with the alternative way to procure groceries, i.e. HD. At the end we again asked our respondents what (fixed) fee they were willing to pay for HD services at a maximum (in EUR) given that the prices of products are the same as those offered in stores (y2; see Table 7). In fact both indicators seem to be similar from a superficial point of view but must be distinguished with regard to the consciously used spill over effects within the survey process. Endogenous Factor ‘Willingness to Use’ (Y2)
This factor is represented by only one factor already described in Table 9. We had to change, i.e. rotate, the scale of the question whether respondents are (still) willing to use HD in the future’ in order to adjust it to the meaning within the model.
Table 13: Description of constructs
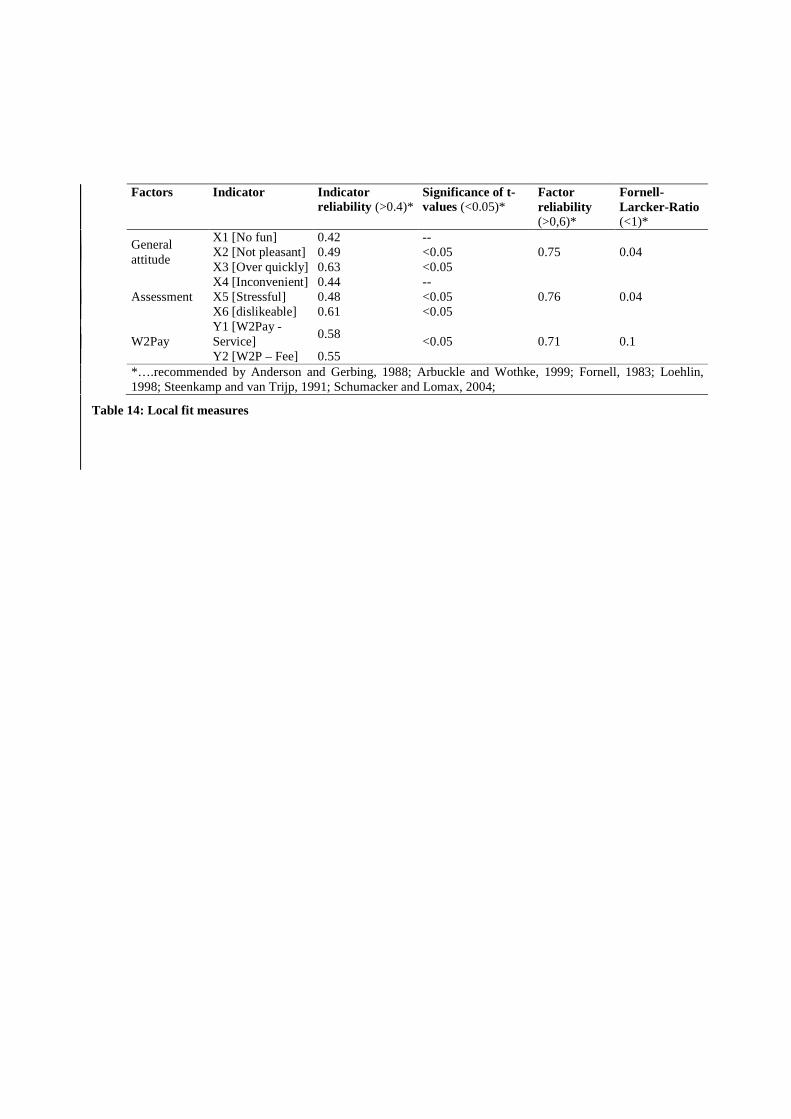
Factors Indicator Indicator reliability (>0.4)*
Significance of t-values (<0.05)*
Factor reliability (>0,6)*
Fornell-Larcker-Ratio (<1)*
General attitude
X1 [No fun] 0.42 -- 0.75 0.04 X2 [Not pleasant] 0.49 <0.05
X3 [Over quickly] 0.63 <0.05
Assessment X4 [Inconvenient] 0.44 --
0.76 0.04 X5 [Stressful] 0.48 <0.05 X6 [dislikeable] 0.61 <0.05
W2Pay Y1 [W2Pay - Service]
0.58 <0.05 0.71 0.1
Y2 [W2P – Fee] 0.55 *….recommended by Anderson and Gerbing, 1988; Arbuckle and Wothke, 1999; Fornell, 1983; Loehlin, 1998; Steenkamp and van Trijp, 1991; Schumacker and Lomax, 2004;
Table 14: Local fit measures
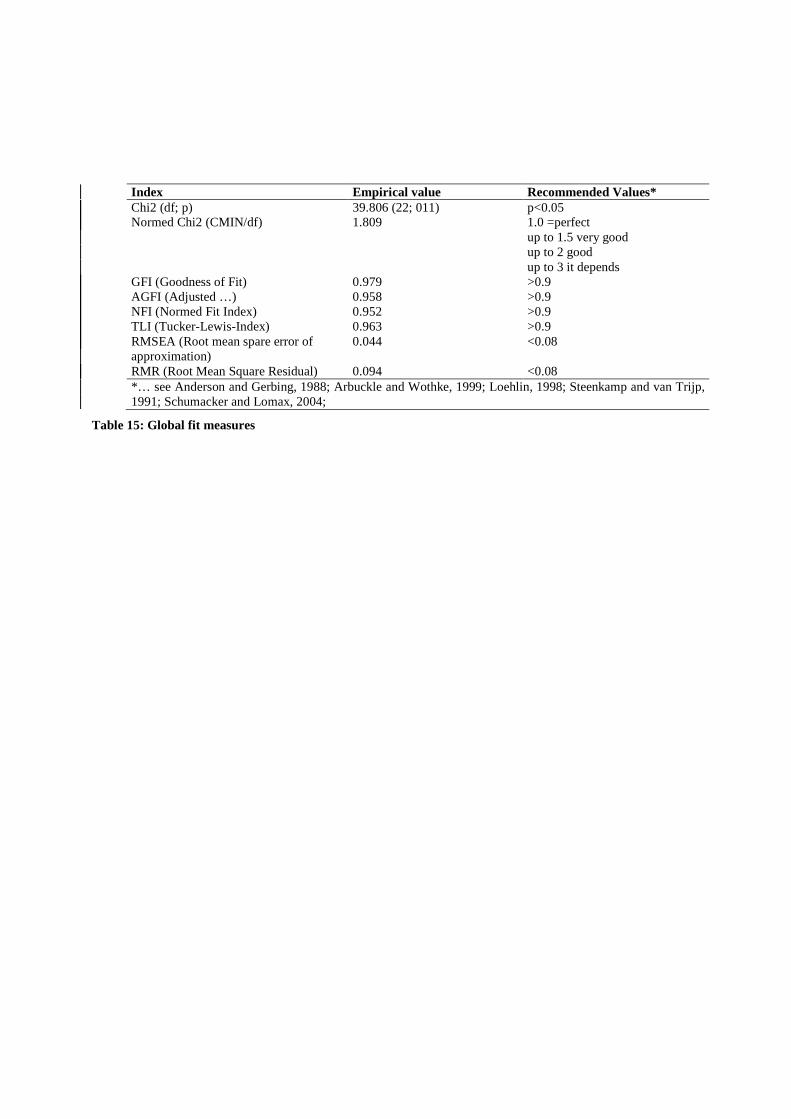
Index Empirical value Recommended Values* Chi2 (df; p) 39.806 (22; 011) p<0.05 Normed Chi2 (CMIN/df) 1.809 1.0 =perfect
up to 1.5 very good up to 2 good up to 3 it depends
GFI (Goodness of Fit) 0.979 >0.9 AGFI (Adjusted …) 0.958 >0.9 NFI (Normed Fit Index) 0.952 >0.9 TLI (Tucker-Lewis-Index) 0.963 >0.9 RMSEA (Root mean spare error of approximation)
0.044 <0.08
RMR (Root Mean Square Residual) 0.094 <0.08 *… see Anderson and Gerbing, 1988; Arbuckle and Wothke, 1999; Loehlin, 1998; Steenkamp and van Trijp, 1991; Schumacker and Lomax, 2004;
Table 15: Global fit measures
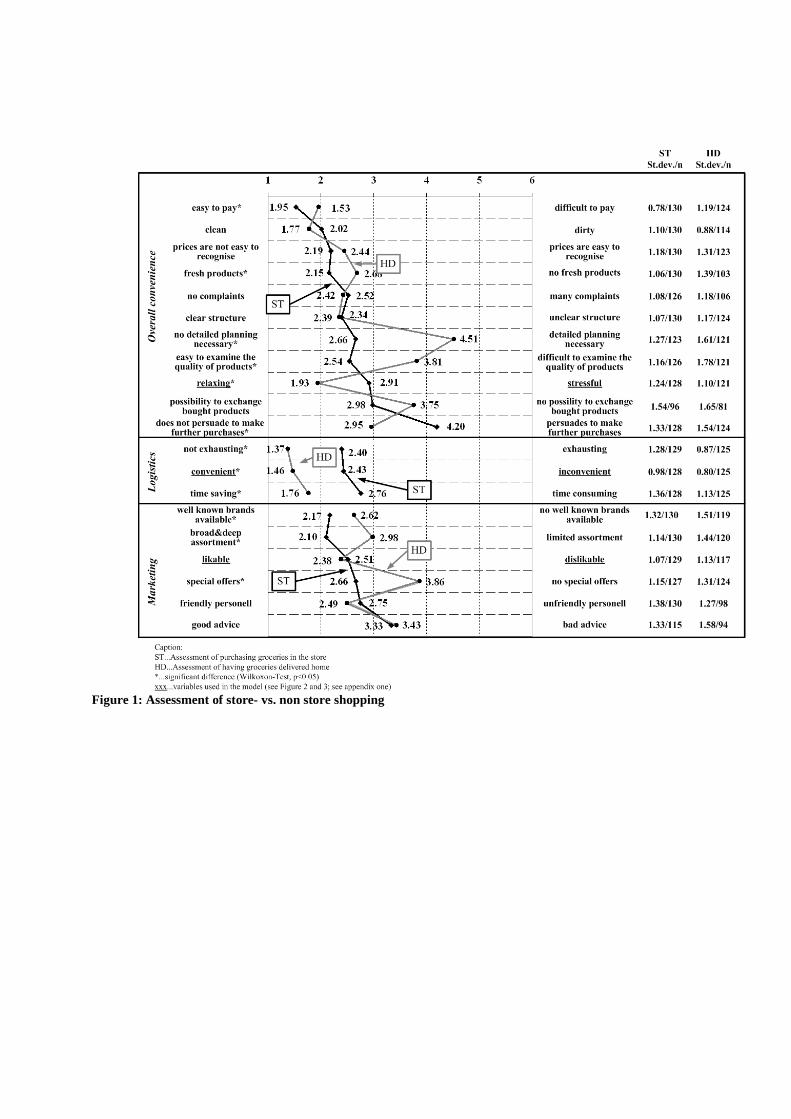
Figure 1: Assessment of store- vs. non store shopping

Figure 2: Proposed structural model
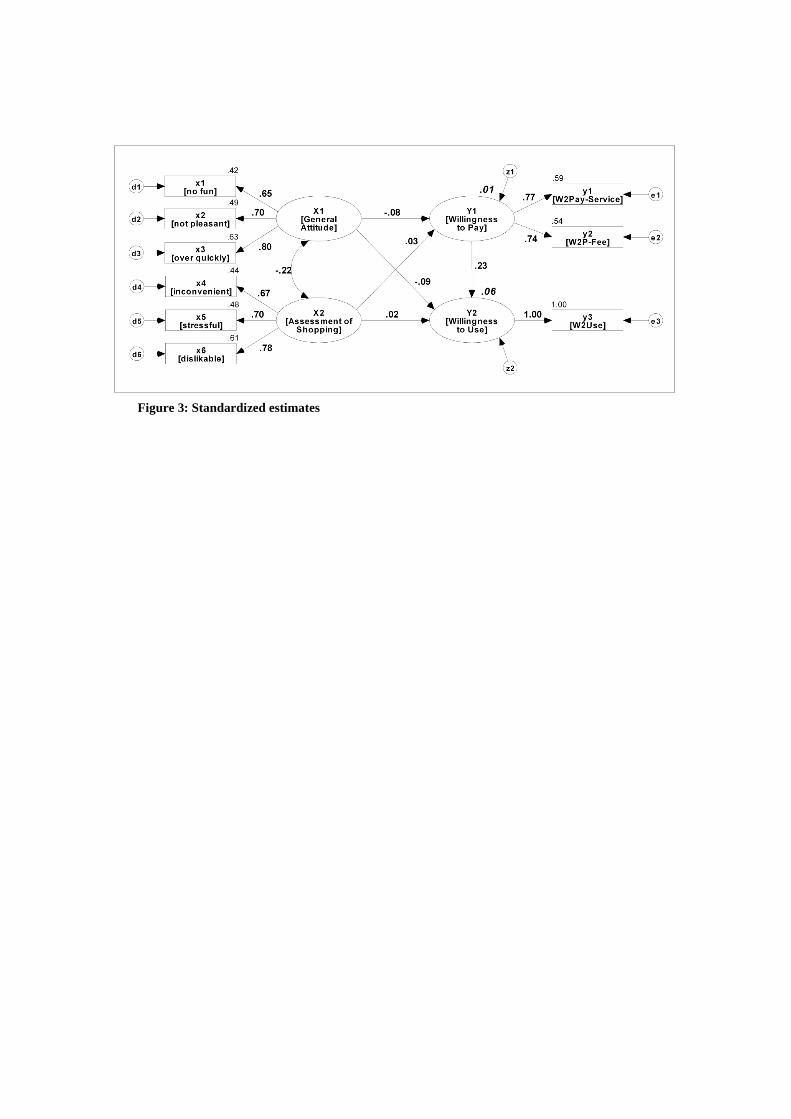
Figure 3: Standardized estimates