telenor group -co2 emission reduction activities ... · pdf fileand kpi have been defined...
TRANSCRIPT

Telenor Group - CO2 emission reduction activitiesHarald Birkeland, International energy Adviser
March 23rd 2010

Content
CO2 emission reduction strategy and activities
Energy projects
Non-financial reporting

A global provider of telecommunications services
– Mobile operations in 13 markets across the Nordic region, Central Eastern Europe and in Asia
– One of the world’s largest mobile operators with 174 mill. mobile subscribers *
– A leading Nordic position in mobile, broadband and TV services
– Total workforce of more than 40 000
– Headquartered in Norway
– Listed on the Oslo Stock Exchange
– Revenues 2009: NOK 107 billion*
* all companies Kyivstar included as per Q4 2009
14 countries
174 million mobile subscribers
More than 40 000 employees

Operating in three regions
AsiaThailand
Malaysia
Bangladesh
Pakistan
IndiaCentral Eastern
EuropeUkraine
Montenegro
Hungary
Serbia
Russia
NordicNorway
Denmark
Sweden
Finland
Geographic footprint 1 200 million

In 2008, Telenor`s long term strategic climate ambitions and KPI have been defined
*measured in: CO2 / Value Added (tonns / millions of USD)
(Value added = EBITDA + Personnel cost)
Management controls
• Business Review
• Group monitoring of Climate KPI (CO2/value added)
• Incentives
Measures• Internal cuts – NW, IT, transport
•Green base stations
•Green power purchase
•All measures are NPV positive
Goal
By 2017, Telenor will reduce the CO2 emission intensity of its global operations by 40% compared with 2008 levels.*

Menu of Climate Change initiatives, ongoing or planned…
Investigate renewable energy
sources, and run pilots
Improve energy metering
Improve energy
efficiency of networks
Reduce travel and transport
More efficient IT-systems
Collaborate with the WoW
project
Internal e-learning
programme
Internal competitions / campaigns
Develop & implement green
procurement guidelines
Machine-to-Machine
communication
Identify Business
Opportunities
Increase understanding of CO2 impact of our products for customers
Mobile Recycling Programme
Implement Environmental Management System (ISO
14001)

For internal and external
communication
For regional assessment,
business review and BU-
level communication
Group Target
Climate KPI*
OpCo Target
tonnes of CO2
Manageable Indicators
kWh / MB Kg CO2/FTE kWh / FTE
Supporting benchmark
indicators, internal and
external
Group targets are defined in different levels
*the Climate KPI on group level is the indexed CSI (relative to 2008)
where CSI = CO2 / EBITDA + personnel cost
Network transport buildings

CO2
VALUE ADDED
CSI=
where VALUE ADDED* = EBITDA + personnel cost
Advantages
• Links environmental, operational and financial performance
• Accommodates growth
• Framework for modelling future strategy
• Facilitates competitor benchmarking
Disadvantages
• Can mask absolute increases in CO2
emissions
• Affected by exchange rates fluctuations
*set by Group Finance per each year
Climate KPI on Group level is Carbon Stabilisation Intensity

0
200
400
600
800
1000
1200
1400
2006 2007 2008 2009 2010
Thousand tonnes CO2/yr
India
2010 Target
Transport
Network
Buildings
Total CO2 emissions are likely to continue to rise –
network infrastructure is approx 86 % of total emissions (2009)

525
535
404
7
403 602743
74354
323522
Source: IEA
CO2 tonnes per GWh (g/kWh) (electricity from national grid)
927

Grid electricity price & forecast
Hungary
Thailand
Serbia*
Montenegro
Ukraine
Malaysia
Pakistan
Bangladesh
India
0,04
0,06
0,08
0,10
0,12
0,14
0,16
2009 2010 2011 2012 2013 2014 2015
Euro
cent/kW
h

Oil price 2005-2009 [USD/barrel]
0
20
40
60
80
100
120
140
160
2005 2006 2007 2008 2009
1st draft Climate strategy
2nd draft Climate strategy
Climate strategy
Operationalize the strategy
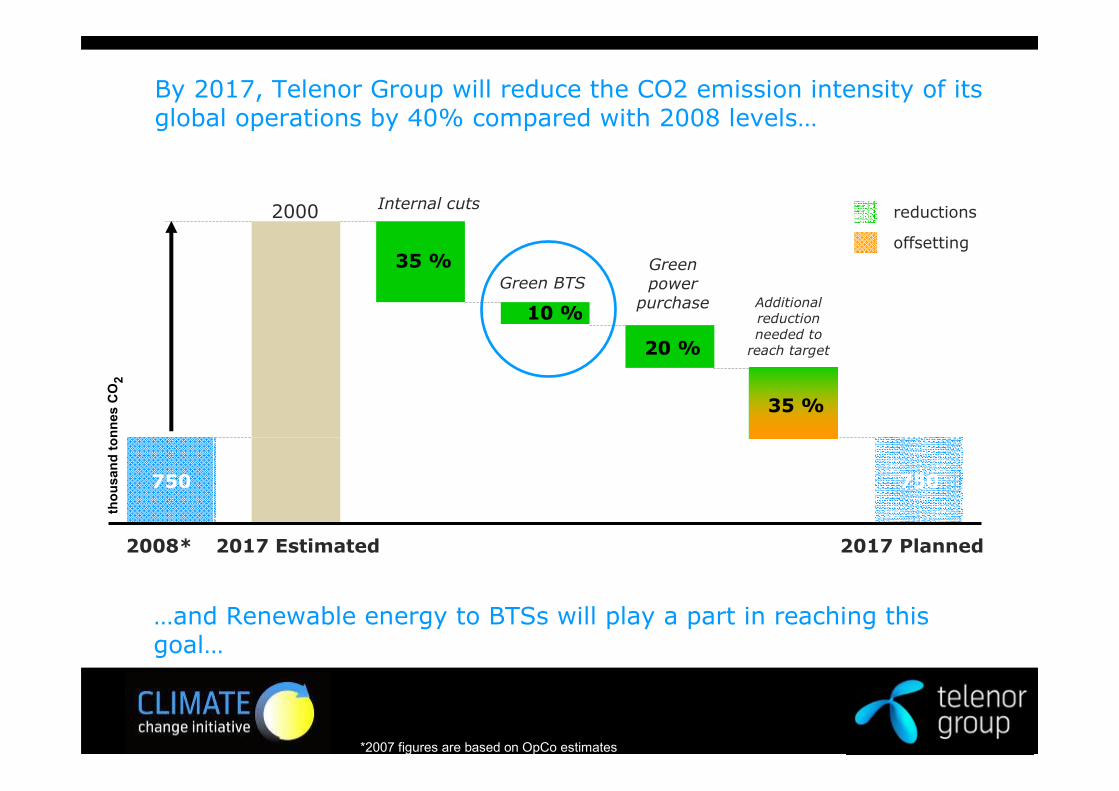
By 2017, Telenor Group will reduce the CO2 emission intensity of its global operations by 40% compared with 2008 levels…
*2007 figures are based on OpCo estimates
2017 Planned
750750
2008* 2017 Estimated
thousand tonnes
CO
2
20 %
Green power
purchase10 %
Green BTS
Internal cuts
35 %
Additional reduction needed to reach target
reductions
35 %
offsetting
…and Renewable energy to BTSs will play a part in reaching this goal…
2000
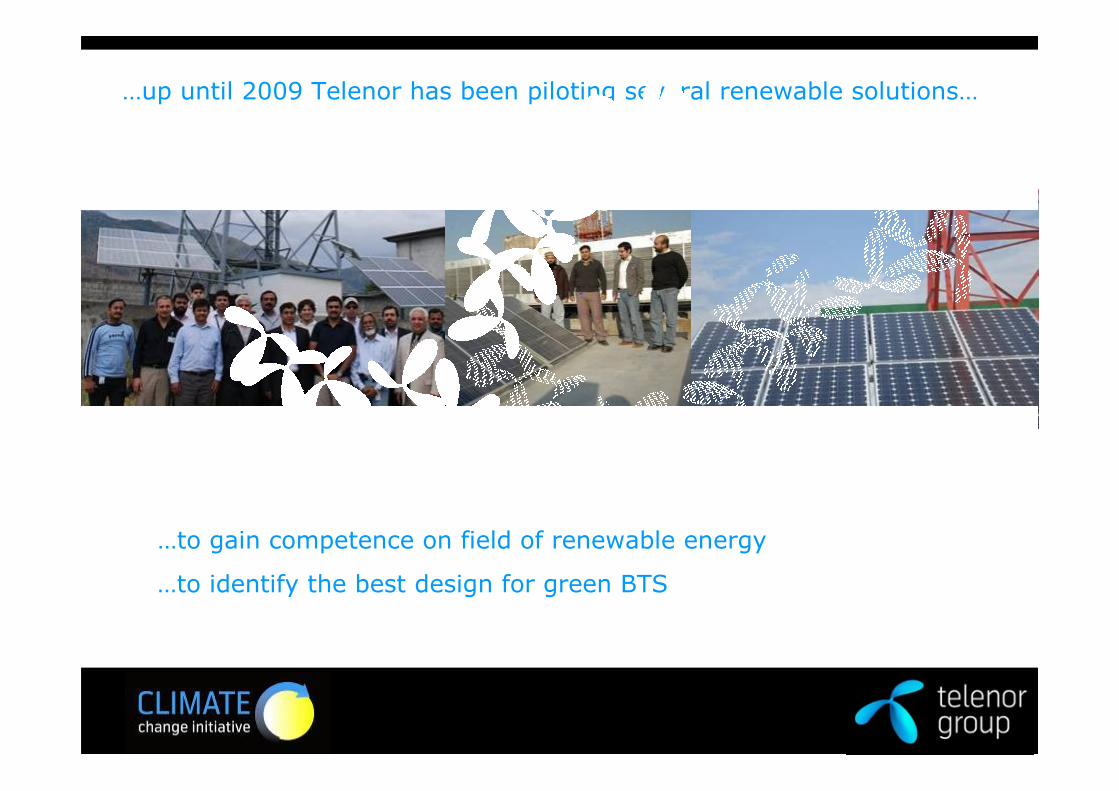
…up until 2009 Telenor has been piloting several renewable solutions…
2006 2007 2008
…to identify the best design for green BTS
…to gain competence on field of renewable energy
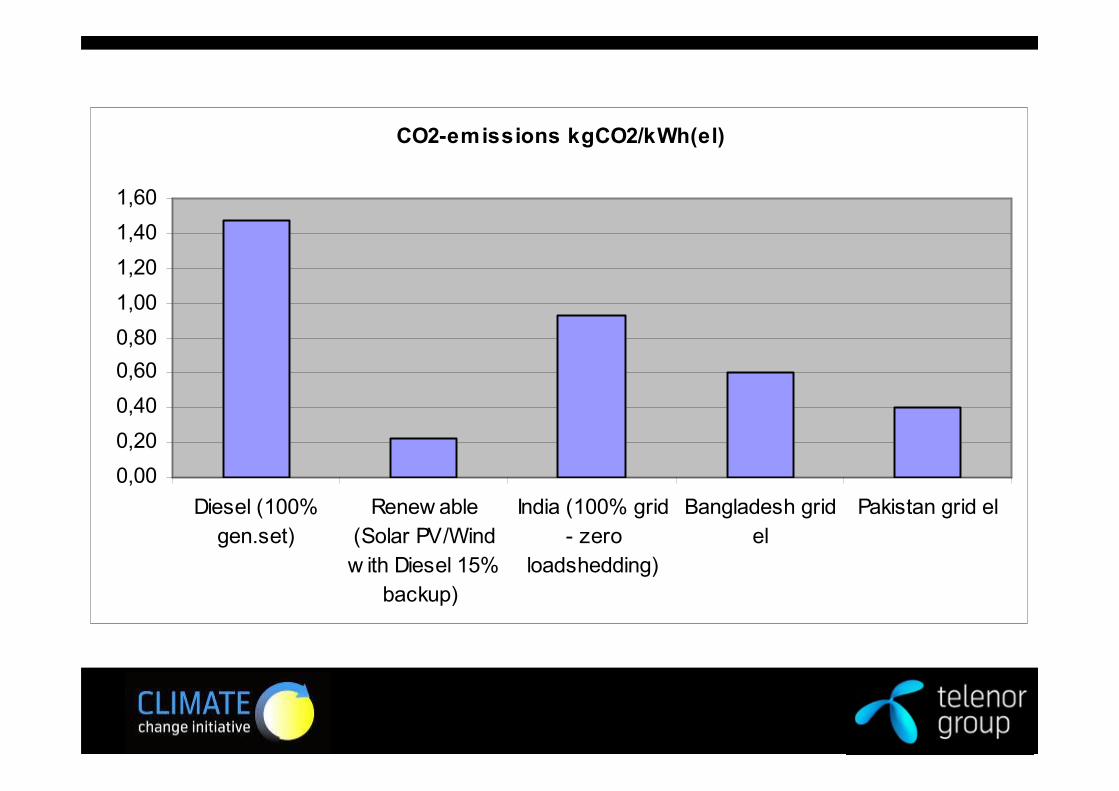
CO2-emissions kgCO2/kWh(el)
0,00
0,20
0,40
0,60
0,80
1,00
1,20
1,40
1,60
Diesel (100%
gen.set)
Renew able
(Solar PV/Wind
w ith Diesel 15%
backup)
India (100% grid
- zero
loadshedding)
Bangladesh grid
el
Pakistan grid el

The affordable Green BTS concept focuses on…
REN
Solar
Wind
Fuel Cell
Hybrids
Site Solutions
Indoor / Outdoor
Housing Insulation
Shade Roof
Air / Free Cooling
Cool Zones
Operation & Maintenance
Temperature control
Genset operation
Technology
BTS Design
Traffic Dep. Control
High Temperature
Main - Remote
DC generation and inv.
Generator
High eff. power unit
2. minimising site power consumption
1. minimising BTS power consumption
3. feeding site with renewable energy
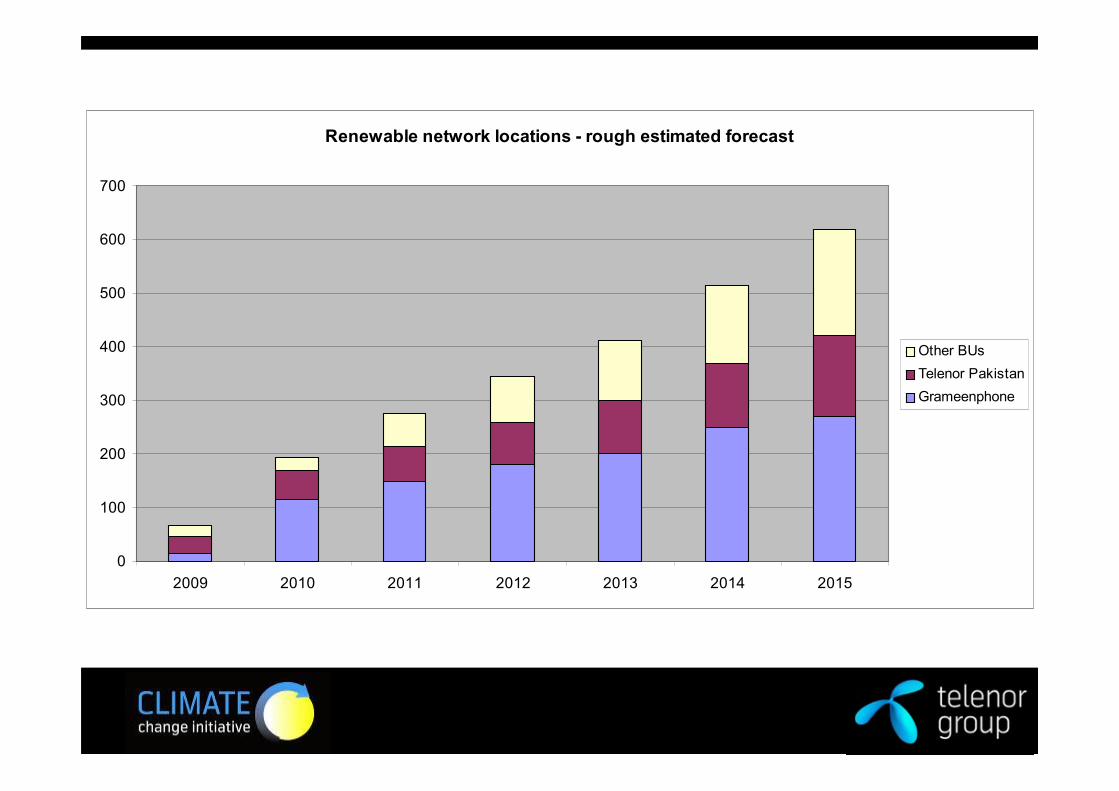
Renewable network locations - rough estimated forecast
0
100
200
300
400
500
600
700
2009 2010 2011 2012 2013 2014 2015
Other BUs
Telenor Pakistan
Grameenphone

Energy Snapshot of Pakistan
-
5,000
10,000
15,000
20,000
25,000
30,000
35,000
40,000
45,000
1995 2000 2005 2010 2015 2020
Gap in Capacity Required
Rental
Committed IPPs
Committed GENCO
Committed Hydro
Existing Nuclear
Existing Thermal
Existing Hydropower
Demand expected to outpace increased supply over the next 15 years even after 1000 MW of rental power are included in
supply:
• 2010 – 3000 MW• 2015 – 4250 MW• 2020 – 9150 MW

Renewable Energy Potential in Pakistan

Renewable energy is a focus area of Telenor Pakistan
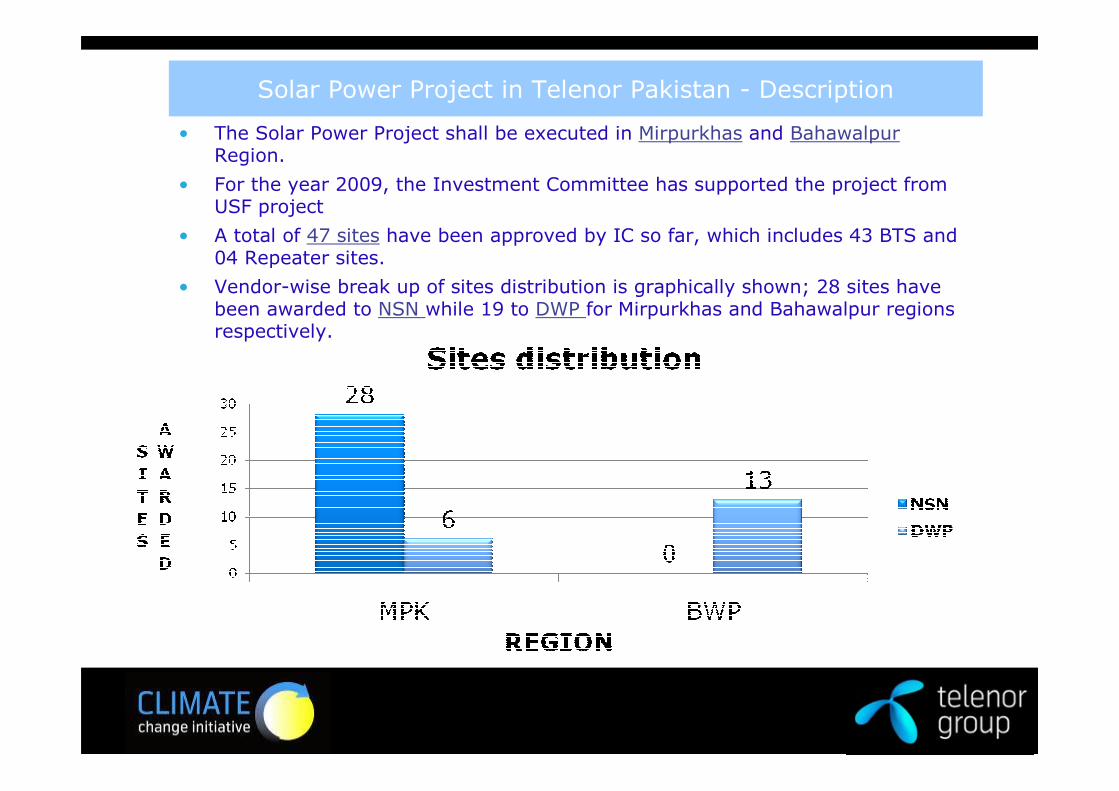
Solar Power Project in Telenor Pakistan - Description
• The Solar Power Project shall be executed in Mirpurkhas and BahawalpurRegion.
• For the year 2009, the Investment Committee has supported the project from USF project
• A total of 47 sites have been approved by IC so far, which includes 43 BTS and04 Repeater sites.
• Vendor-wise break up of sites distribution is graphically shown; 28 sites have been awarded to NSN while 19 to DWP for Mirpurkhas and Bahawalpur regions respectively.

Design Specifications
Site Model No. of solar panels/ site
Peak load
(KWp)
Proposed Output Power
of Solar Panels (KWp)
SM 1 39 1.7 5.1
SM 2 48 2.5 7.5
SM 3 54 2.7 8.2
SM 4 (Repeater) 10 ‹‹‹‹ 1 1.73
• Battery back-up time on Solar Sites will be 17 hours
• 40% Backup Time will be reduced if site is used for sharing
• Pilot site for the Project shall be chosen within the premises of Islamabad
• Average Power Production from Solar cells on daily basis is 5.2 kWh/ m²/ day
• Separate test site within the city will also help during on-site training for solar installations in future

DWP Supply
Items Manufacturer Origin
Batteries TROJAN USA
Solar panels SHARP USA
Items Manufacturer Origin
Batteries EXIDE Germany
Solar panels RISEN China
NSN Supply
Items Manufacturer Origin
Cable trays Build Core/IIC/IKAN Pakistan
Solar Panel Frame and Pole Build Core/IIC Pakistan
Battery Banks racks Build Core/IIC Pakistan
DC+AC Cables FAST Pakistan
Accessories (Nuts, Bolts) Build Core/IIC Pakistan
Onshore Ordering Plan (both NSN/DWP)

Rural Electrification:Project Tatu
• Provided renewable energy to 800+ residents of Tatu Village
• Energy provided in two renewableforms
• Micro-hydel station (30kW) ona stream flowing next to thevillage
• Heating mosque via harnessing hot water from geothermal sulphur springs.
• Successfully running sinceNovember 22, 09

Geothermal Potential at TATU
Channeling HW for heating the Mosque
Steam rising out of hot springs at TATU
Village mosque –the locations that was heated by using hot springs and
Indoor heating unit
•Large energy potential in the geothermal
springs – to be used directly for heating or
generation of electricity by use of steam
•Reducing deforestration as wood is
largely used for cooking and heating

According to the Greenhouse Gas Protocol
Question categories:
• Staff Key Figures
• Compensation and benefits
• Trade Unions
• Training and development
• Health, safety and working environment
• Corporate Responsibility and Environment
The annual Non-financial Reporting
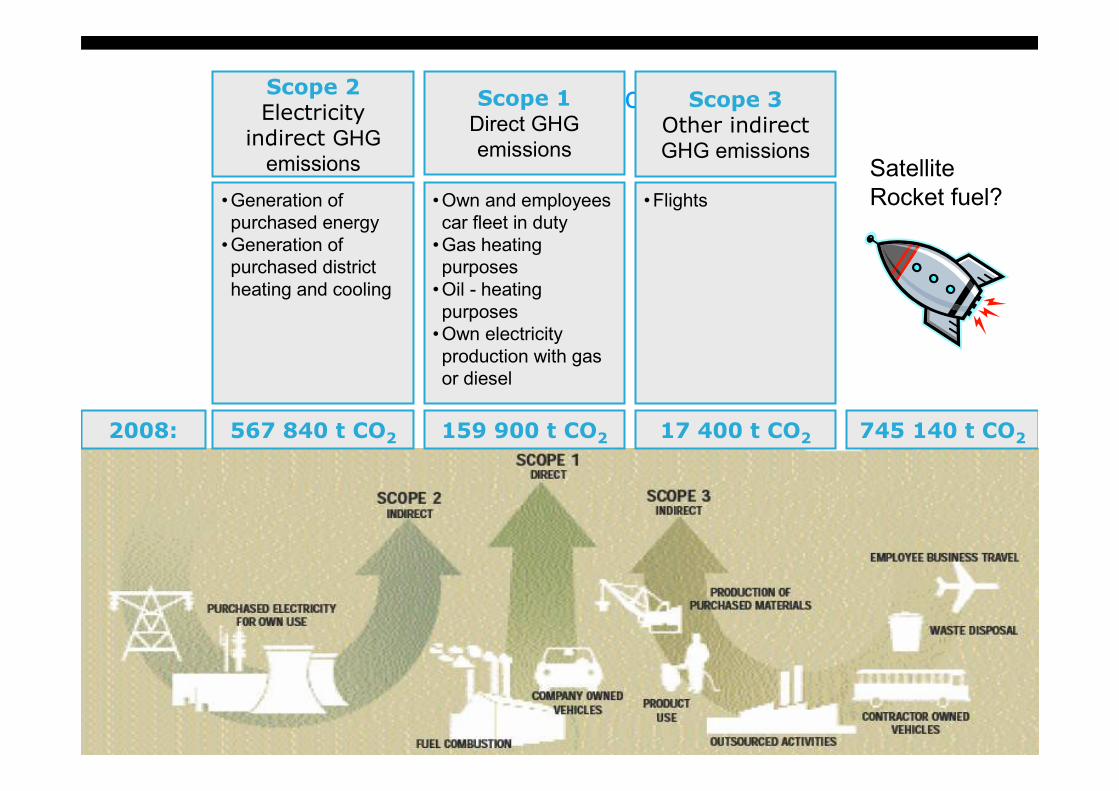
GHG ProtocolScope 1Direct GHG
emissions
•Own and employees
car fleet in duty
•Gas heating
purposes
•Oil - heating
purposes
•Own electricity
production with gas
or diesel
Scope 2 Electricity
indirect GHG emissions
•Generation of
purchased energy
•Generation of
purchased district
heating and cooling
Scope 3 Other indirectGHG emissions
• Flights
567 840 t CO2 159 900 t CO2 17 400 t CO2 745 140 t CO22008:
Satellite
Rocket fuel?

For internal and external
communication
For regional assessment,
business review and BU-
level communication
Group Target
Climate KPI*
OpCo Target
tonnes of CO2
Manageable Indicators
kWh / MB Kg CO2/FTE kWh / FTE
Supporting benchmark
indicators, internal and
external
Group targets are defined in different levels
*the Climate KPI on group level is the indexed CSI (relative to 2008)
where CSI = CO2 / EBITDA + personnel cost
Network transport buildings

Energy use in Telenor buildings per FTE 2008 [kWh/FTE*yr]
4086 4218 4286
5342 53466088 6237 6617
77498240
8755
0
2000
4000
6000
8000
10000
12000
14000
DTAC
Telenor Ukraine
Digi
Telenor Serbia
Pannon
Average *
Telenor
Pakistan
Telenor
Sweden
ProMonte
GrameenPhone
Telenor
Denmark
Norway (Norge
& ASA)

Specific flight emissions per FTE 2008
0
200
400
600
800
1000
1200
1400
1600
1800
2000
Telenor Norge
Broadcast
Montenegro
Sweden
Pakistan
Malaysia
Bangladesh
Denmark
Hungary
Ukraine
Serbia
Thailand
India
kg C
02/F
TE
2008
2009

Road transport emissions per FTE 2008-2009
0
500
1000
1500
2000
2500
3000Hungary
Malaysia
Ukraine
Bangladesh
Pakistan
Thailand
Serbia
Sweden
Denmark
Montenegro
Telenor Norge
Broadcast
kg C
O2/F
TE
2008
2009

• In networks it is challenging to create indicators which can give exact benchmark, because:
– different characteristics of networks
– mix of 2G / 3G equipment
– different traffic characteristics, etc…
• The focus is rather on benchmarking the year-on-year change in each OpCo.
Possible benchmark indicators for networks:
– kWh / TRX / year
– kWh / cell site / year
– kWh / traffic unit
– Energy indicators based on selected parameters
Benchmark indicators on network emissions will be introduced...

kWh/TrX*yr
0
2000
4000
6000
8000
10000
12000
14000
16000
Telenor Mobil
Pannon
Telenor Sweden
Sonofon
DIGI
Kyivstar
Promonte
Telenor Pakistan
GrameenPhone
Telenor Serbia
DTAC
Total
2007
2008
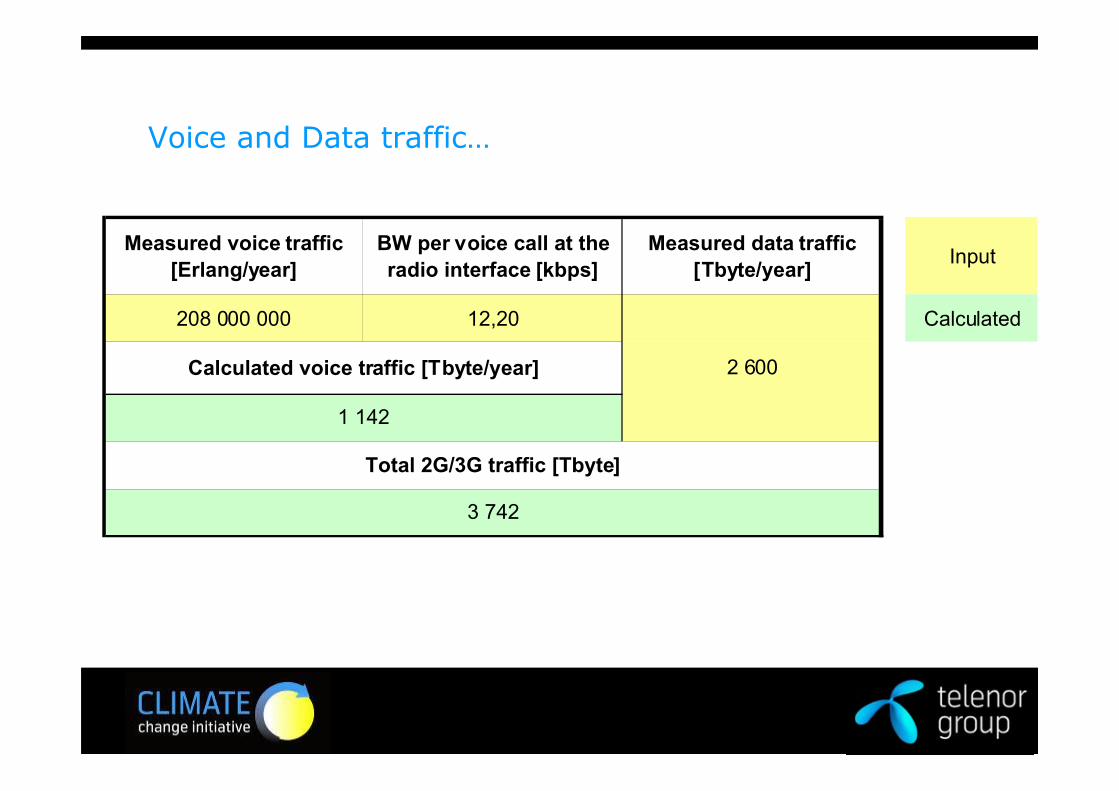
Voice and Data traffic…
Measured voice traffic
[Erlang/year]
BW per voice call at the
radio interface [kbps]
Measured data traffic
[Tbyte/year]Input
208 000 000 12,20 Calculated
3 742
Calculated voice traffic [Tbyte/year]
1 142
2 600
Total 2G/3G traffic [Tbyte]

DUMMY Indexed specific energy use per network traffic [kWh/MB*yr]
0
20
40
60
80
100
120
2008 2009 2010 2011 2012
Indexed
DTAC
Telenor Ukraine
Digi
Telenor Serbia
Pannon
Telenor Pakistan
Telenor Sweden
ProMonte
GrameenPhone
Telenor Denmark
Norway (Norge & ASA)

Recycling is a focus area of the updated Climate Strategy of Telenor Group (approved by GEM on 25.01.2010)
Strategic focus area:
• Telenor Group will fully implement self-sustaining handset recycling programmes in all Business Units by 2010
• A recycling programme for IS / IT, network and customer-premises equipment should be in place in all Business Units by 2012
Follow up:
• Number of collected handsets is measured through the monthly HSSE reporting
• by Business Assurance and TCCI

More than 70 million handsets were sold to Telenor customers
new with subscription replacementrecycled
&
reused
in drawers
garbage
25 million handsets lying around
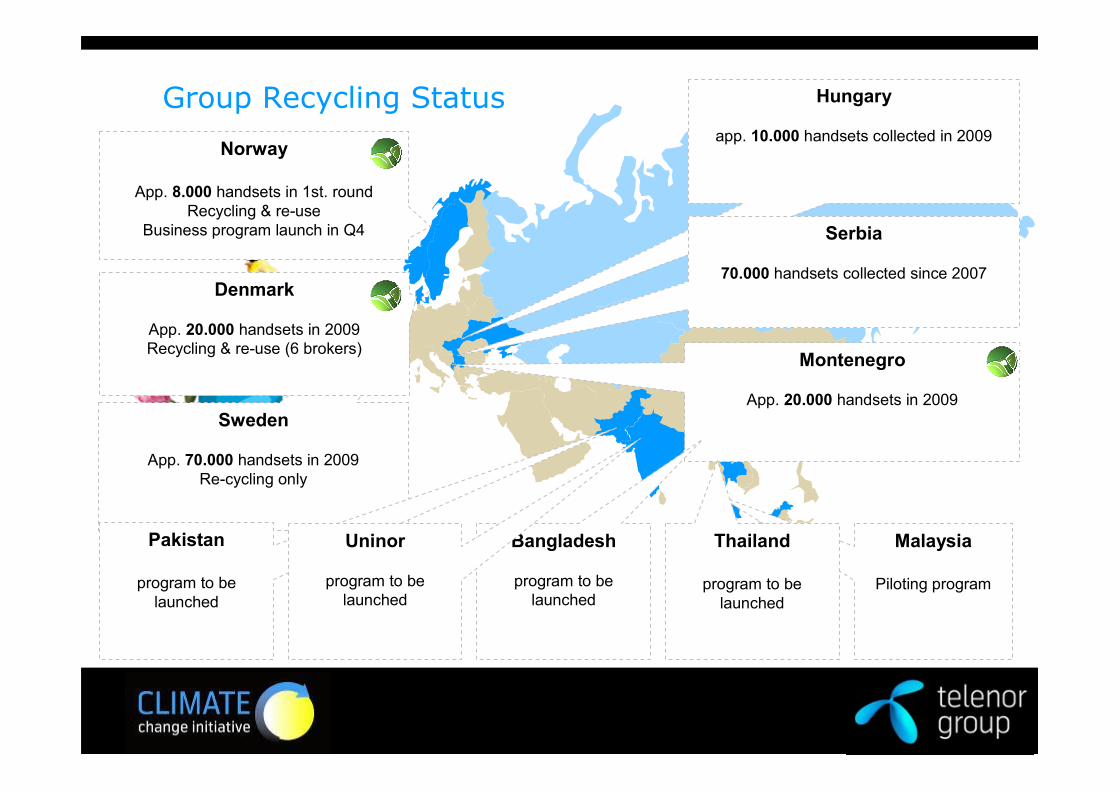
Sweden
App. 70.000 handsets in 2009
Re-cycling only
Group Recycling Status
Denmark
App. 20.000 handsets in 2009
Recycling & re-use (6 brokers)
Hungary
app. 10.000 handsets collected in 2009
Montenegro
App. 20.000 handsets in 2009
Serbia
70.000 handsets collected since 2007
Pakistan
program to be
launched
Malaysia
Piloting program
Bangladesh
program to be
launched
Norway
App. 8.000 handsets in 1st. round
Recycling & re-use
Business program launch in Q4
Uninor
program to be
launched
Thailand
program to be
launched

Menu of Climate Change initiatives, ongoing or planned…
Investigate renewable energy
sources, and run pilots
Improve energy metering
Improve energy
efficiency of networks
Reduce travel and transport
More efficient IT-systems
Collaborate with the WoW
project
Internal e-learning
programme
Internal competitions / campaigns
Develop & implement green
procurement guidelines
Machine-to-Machine
communication
Identify Business
Opportunities
Increase understanding of CO2 impact of our products for customers
Mobile Recycling Programme
Implement Environmental Management System (ISO
14001)

Thank you for your attention!
Harald Birkeland
Climate Change Initiative
Telenor Group Communications
Mob +4795179167
Contact for further information…