telehealth visit use among u.s. adults
TRANSCRIPT
@ssrs_research | ssrs.com
AUGUST 2021
Telehealth Visit Use Among U.S. Adults


Methodology
§ SSRS, on behalf of Bipartisan Policy Center (BPC), launched a survey on experiences with telehealth services on the weekly SSRS Omnibus from June 28-July 18, 2021– Dual frame random digit dial (RDD) sample of landline and
cell phone numbers reaching US adults age 18+
§ Focused on barriers faced by consumers, types of services used, and perceptions of quality and effectiveness
§ Total of 1,776 adults interviewed including an oversample of older adults, rural residents as well as Hispanic and Black adults
§ Conducted in English and Spanish (appx 35 interviews in Spanish per week)
§ Weighted to provide nationally representative estimate of the US adult population age 18+
3
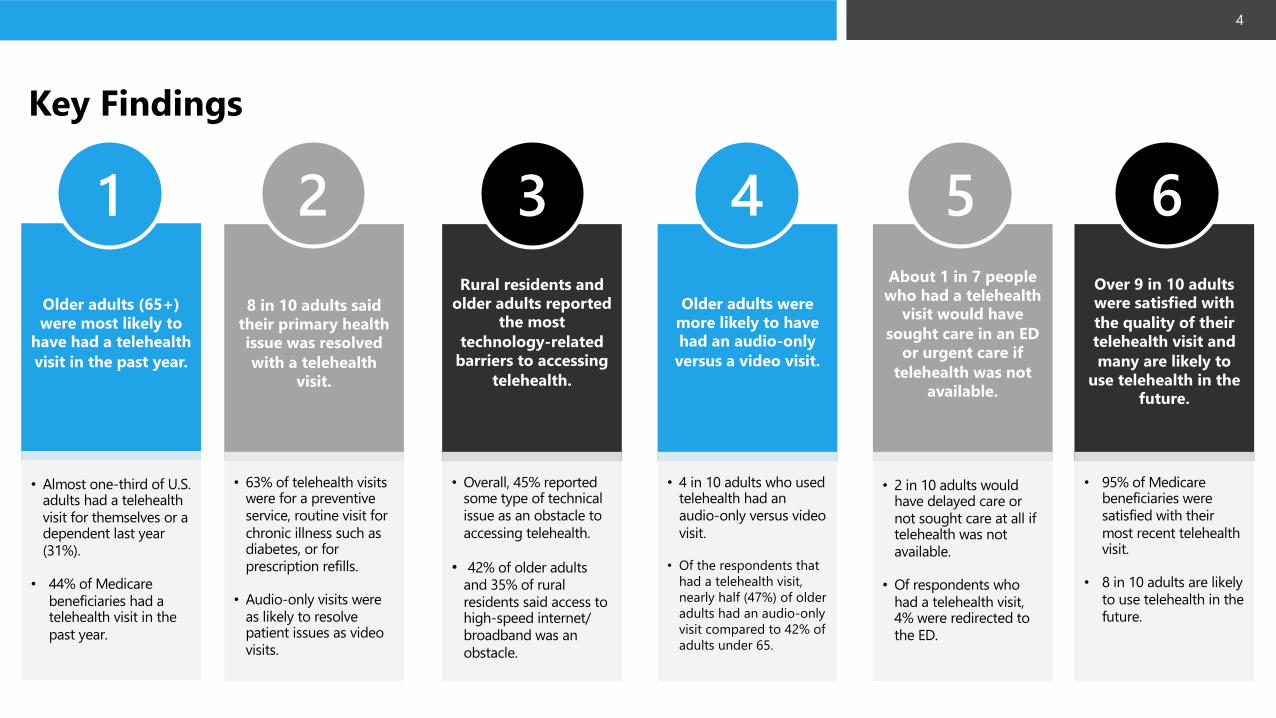
8 in 10 adults said their primary health issue was resolved with a telehealth
visit.
Rural residents and older adults reported
the most technology-related
barriers to accessing telehealth.
Older adults were more likely to have had an audio-only versus a video visit.
About 1 in 7 people who had a telehealth
visit would have sought care in an ED
or urgent care if telehealth was not
available.
Over 9 in 10 adults were satisfied with the quality of their telehealth visit and many are likely to
use telehealth in the future.
• 63% of telehealth visits were for a preventive service, routine visit for chronic illness such as diabetes, or for prescription refills.
• Audio-only visits were as likely to resolve patient issues as video visits.
• Overall, 45% reported some type of technical issue as an obstacle to accessing telehealth.
• 42% of older adults and 35% of rural residents said access to high-speed internet/ broadband was an obstacle.
• 4 in 10 adults who used telehealth had an audio-only versus video visit.
• Of the respondents that had a telehealth visit, nearly half (47%) of older adults had an audio-only visit compared to 42% of adults under 65.
• 2 in 10 adults would have delayed care or not sought care at all if telehealth was not available.
• Of respondents who had a telehealth visit, 4% were redirected to the ED.
• 95% of Medicare beneficiaries were satisfied with their most recent telehealth visit.
• 8 in 10 adults are likely to use telehealth in the future.
Older adults (65+) were most likely to
have had a telehealth visit in the past year.
Key Findings
4
1 2 3 4 5 6
• Almost one-third of U.S. adults had a telehealth visit for themselves or a dependent last year (31%).
• 44% of Medicare beneficiaries had a telehealth visit in the past year.

Telehealth Use
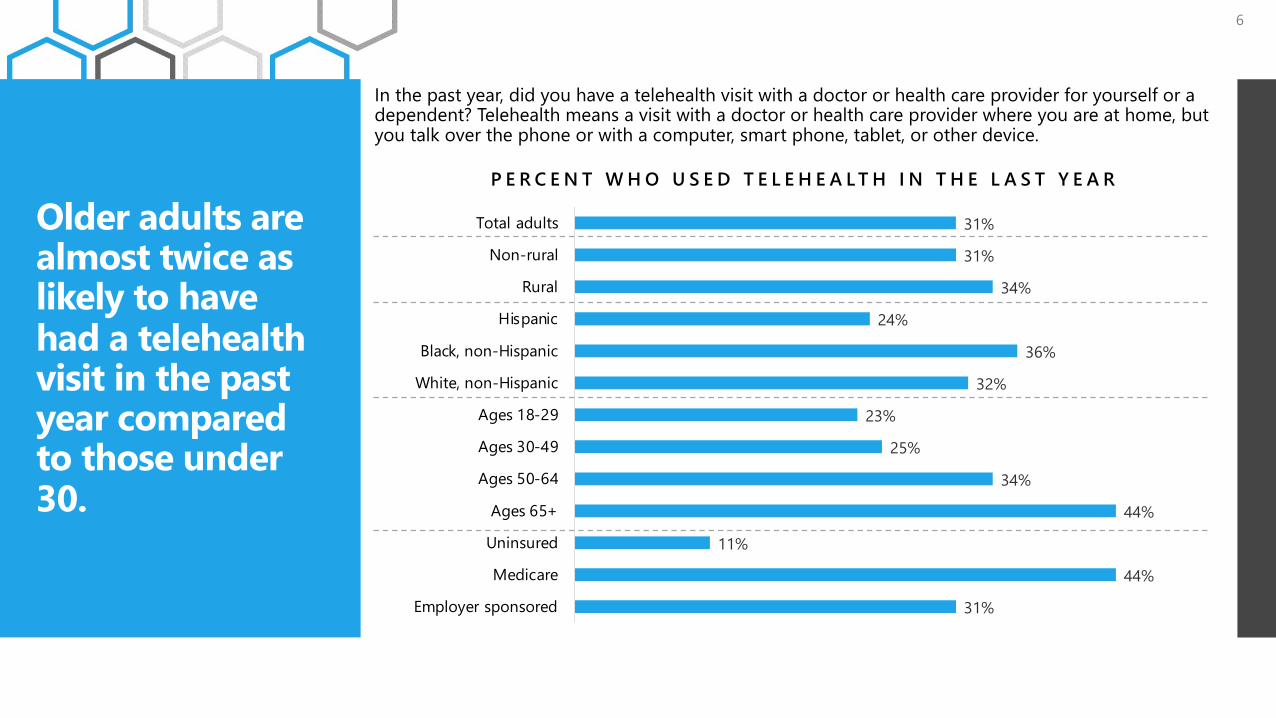
Older adults are almost twice as likely to have had a telehealth visit in the past year compared to those under 30.
31%
44%
11%
44%
34%
25%
23%
32%
36%
24%
34%
31%
31%
Employer sponsored
Medicare
Uninsured
Ages 65+
Ages 50-64
Ages 30-49
Ages 18-29
White, non-Hispanic
Black, non-Hispanic
Hispanic
Rural
Non-rural
Total adults
P E R C E N T W H O U S E D T E L E H E A L T H I N T H E L A S T Y E A R
6
In the past year, did you have a telehealth visit with a doctor or health care provider for yourself or a dependent? Telehealth means a visit with a doctor or health care provider where you are at home, but you talk over the phone or with a computer, smart phone, tablet, or other device.

55%
44%
52%
47%
51%
42%
47%
43%
46%
43%
2%
7%
3%
7%
4%
1%
2%
2%
1%
Under 65
Ages 65+
Non-rural
Rural
Total with a telehealth visit
Video visit Audio-only Don't remember Refused
Older adults are more likely to have audio-only (rather than video) visits compared to younger adults.
7
T H I N K I N G O F Y O U O R Y O U R D E P E N D E N T ’ S M O S T R E C E N T T E L E H E A L T H V I S I T , W A S T H A T V I S I T : A T W O - W AY V I D E O V I S I T W H E R E Y O U C O U L D S E E Y O U R D O C T O R O R H E A L T H C A R E P R O V I D E R ’ S F A C E
A N D T H E Y C O U L D S E E Y O U R S O R A N A U D I O - O N L Y V I S I T T H A T I S A P H O N E C A L L W I T H Y O U R D O C T O R O R H E A L T H C A R E P R O V I D E R ?
*
*
*indicates statistically significant difference

21%
21%
21%
11%
9%
6%
4%
5%
Annual physical or preventive service
Routine visit for a chronic illness such as diabetes or high blood pressure
Prescription refill only
Illness, injury or condition that needed care right away
Mental health or substance use treatment
Consult for a surgical procedure or operation
Physical therapy
Other
T H I N K I N G O F Y O U O R Y O U R D E P E N D E N T ’ S M O S T R E C E N T T E L E H E A L T H V I S I T , W H A T W A S T H E P R I M A R Y P U R P O S E ?
The most common purpose for a telehealth visit was a preventive service, prescription refill, or routine visit for chronic illness.
8

24%
18%
10%
11%
5%
12%
7%
10%
4%
21%
21%
23%
12%
9%
5%
3%
4%
2%
Annual physical or preventive service
Routine visit for a chronic illness such as diabetes or high blood pressure
Prescription refill only
Illness, injury or condition that needed care right away
Mental health or substance use treatment
Consult for a surgical procedure or operation
Physical therapy
Other
Don't know/Refused
Rural Non-rural
Rural residents more likely to use telehealth for surgical consults and non-rural more likely to use for prescription refill.
9
T H I N K I N G O F Y O U O R Y O U R D E P E N D E N T ’ S M O S T R E C E N T T E L E H E A L T H V I S I T , W H A T W A S T H E P R I M A R Y P U R P O S E ?
*
*
*
*indicates statistically significant difference

Satisfaction with Quality of Care

8 in 10 say their primary issue was resolved during telehealth visits.
11
T H I N K I N G O F Y O U O R Y O U R D E P E N D E N T ’ S M O S T R E C E N T T E L E H E A L T H V I S I T , W A S T H E P R I M A R Y I S S U E R E S O L V E D D U R I N G T H E V I S I T ?
80%
4%13%
Yes No, sent tothe Emergency
Department
No, asked tosee provider
in person
T O T A L W I T H A T E L E H E A L T H V I S I T
96%
82%
80%
80%
4%
16%
19%
19%
Prescription refill only
Routine visit for a chronic illness such asdiabetes or high blood pressure
Annual physical or preventive service
Other*
Yes, resolved No, not resolved
*includes illness and injury, surgical consult, mental health, and other visits with insufficient sample sizes to report individually
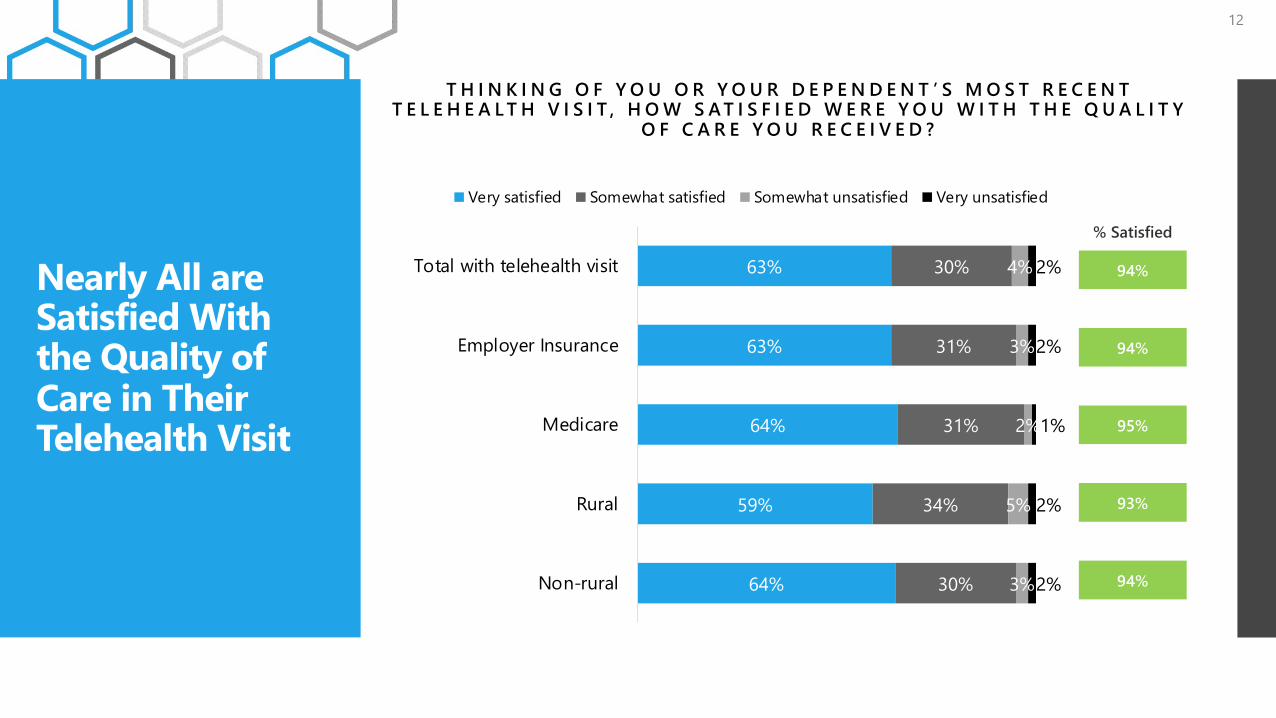
Nearly All are Satisfied With the Quality of Care in Their Telehealth Visit
63%
63%
64%
59%
64%
30%
31%
31%
34%
30%
4%
3%
2%
5%
3%
2%
2%
1%
2%
2%
Total with telehealth visit
Employer Insurance
Medicare
Rural
Non-rural
Very satisfied Somewhat satisfied Somewhat unsatisfied Very unsatisfied
12
T H I N K I N G O F Y O U O R Y O U R D E P E N D E N T ’ S M O S T R E C E N T T E L E H E A L T H V I S I T , H O W S A T I S F I E D W E R E Y O U W I T H T H E Q U A L I T Y
O F C A R E Y O U R E C E I V E D ?
% Satisfied
94%
94%
95%
93%
94%
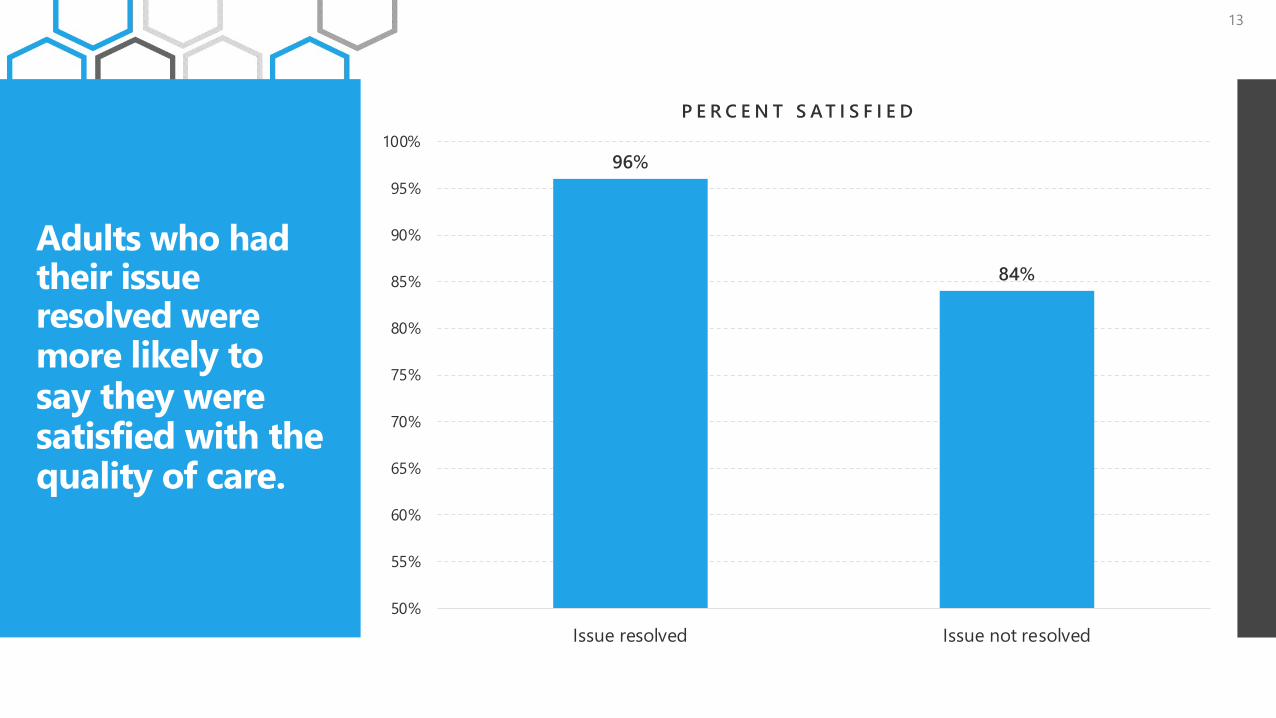
Adults who had their issue resolved were more likely to say they were satisfied with the quality of care.
13
96%
84%
50%
55%
60%
65%
70%
75%
80%
85%
90%
95%
100%
Issue resolved Issue not resolved
P E R C E N T S A T I S F I E D
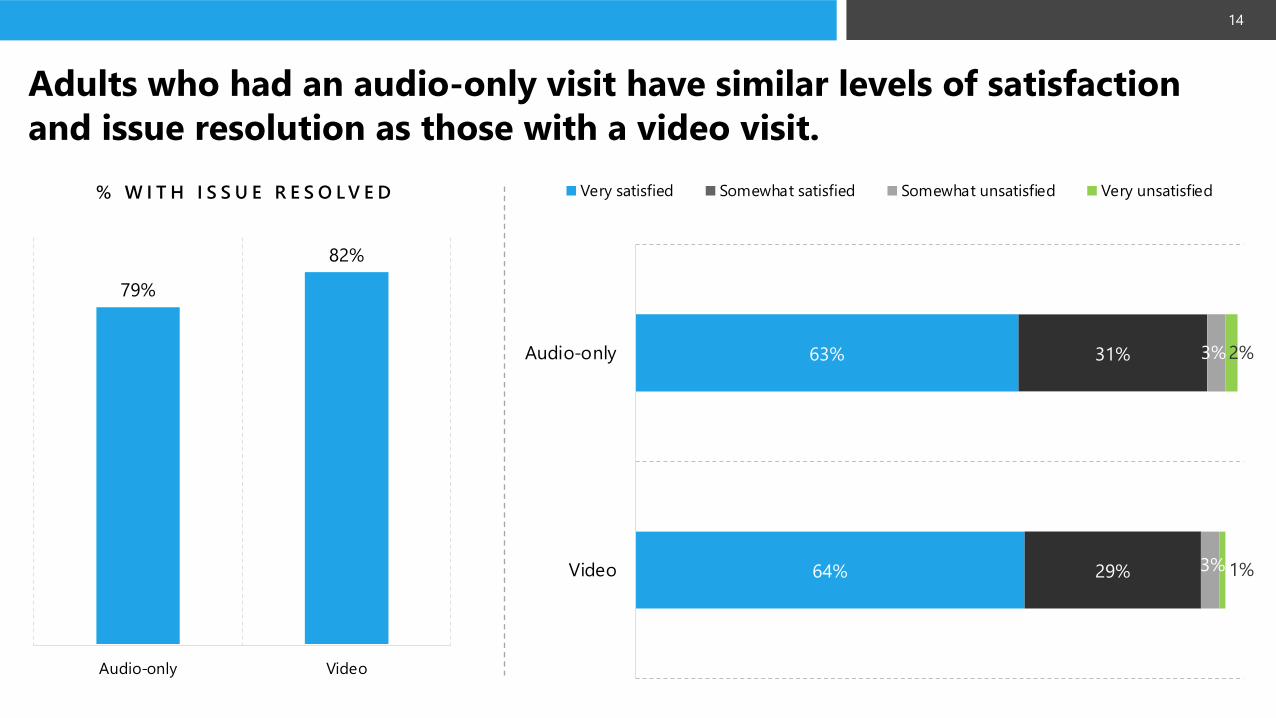
79%
82%
Audio-only Video
% W I T H I S S U E R E S O L V E D
Adults who had an audio-only visit have similar levels of satisfaction and issue resolution as those with a video visit.
14
63%
64%
31%
29%
3%
3%
2%
1%
Audio-only
Video
Very satisfied Somewhat satisfied Somewhat unsatisfied Very unsatisfied

66%
71%
63%
60%
67%
14%
13%
12%
14%
13%
9%
8%
7%
12%
9%
10%
8%
15%
14%
9%
Total with telehealth visit
Employer Insurance
Medicare
Rural
Non-rural
I F Y O U D I D N O T H A V E A C C E S S T O T E L E H E A L T H F O R Y O U O R Y O U R D E P E N D E N T ’ S M O S T R E C E N T T E L E H E A L T H V I S I T , W O U L D Y O U H A V E :
Sought care in person with provider Sought in person care at an Emergency Department or urgent care Delayed seeking care Not sought care at all
One in seven telehealth users would have sought care from an Emergency Department or Urgent Care if telehealth were unavailable.
15

8% of telehealth users say their primary issue was resolved but they would have sought care in an Emergency Department or Urgent care center.
16
Would have sought care from provider
66%
Don't know/Refused1%
Not sought care at all
10%
Delayed care9% Would have sought care
from ED or urgent care and issue resolved
8%
Would have sought care from ED or urgent care and
sent to ED…
Would have sought care from ED and sent to
provider3%
Would have sought care from ED
14%
A M O N G T E L E H E A L T H U S E R S

Obstacles to Telehealth Use
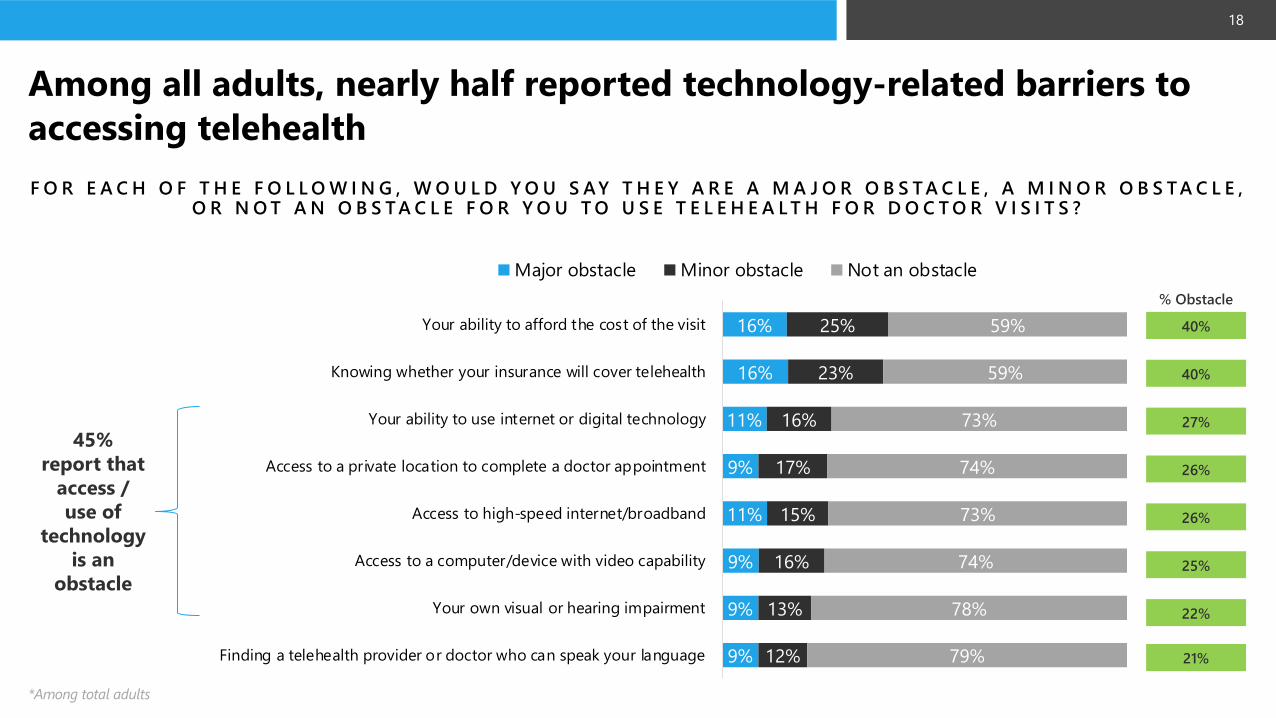
16%
16%
11%
9%
11%
9%
9%
9%
25%
23%
16%
17%
15%
16%
13%
12%
59%
59%
73%
74%
73%
74%
78%
79%
Your ability to afford the cost of the visit
Knowing whether your insurance will cover telehealth
Your ability to use internet or digital technology
Access to a private location to complete a doctor appointment
Access to high-speed internet/broadband
Access to a computer/device with video capability
Your own visual or hearing impairment
Finding a telehealth provider or doctor who can speak your language
Major obstacle Minor obstacle Not an obstacle
Among all adults, nearly half reported technology-related barriers to accessing telehealth
18
F O R E A C H O F T H E F O L L O W I N G , W O U L D Y O U S AY T H E Y A R E A M A J O R O B S T A C L E , A M I N O R O B S T A C L E , O R N O T A N O B S T A C L E F O R Y O U T O U S E T E L E H E A L T H F O R D O C T O R V I S I T S ?
% Obstacle
40%
40%
27%
26%
26%
25%
22%
21%
45% report that
access / use of
technology is an
obstacle
*Among total adults

35% 37%
28%24% 25% 25%
22%19%
56%
48%
25% 27% 27% 27%24%
21%
45% 44%
30%34%
28% 28%
22%
34%
Your ability to affordthe cost of the visit
Knowing whether yourinsurance will cover
telehealth
Your ability to useinternet or digital
technology
Access to a privatelocation to complete adoctor appointment
Access to high-speedinternet/broadband
Access to acomputer/device with
video capability
Your own visual orhearing impairment
Finding a telehealthprovider or doctor who
can speak yourlanguage
% M A J O R O R M I N O R O B S T A C L E
White, non-hispanic Black, non-hispanic HispanicA
A
B
C
C
D
DD
B
A
Black adults are more likely to report cost as an obstacle; language and access to a private location are an obstacle for Hispanic adults.
19
F O R E A C H O F T H E F O L L O W I N G , W O U L D Y O U S AY T H E Y A R E A M A J O R O B S T A C L E , A M I N O R O B S T A C L E , O R N O T A N O B S T A C L E F O R Y O U T O U S E T E L E H E A L T H F O R D O C T O R V I S I T S ?
Bars with the same letter are significantly different from one another
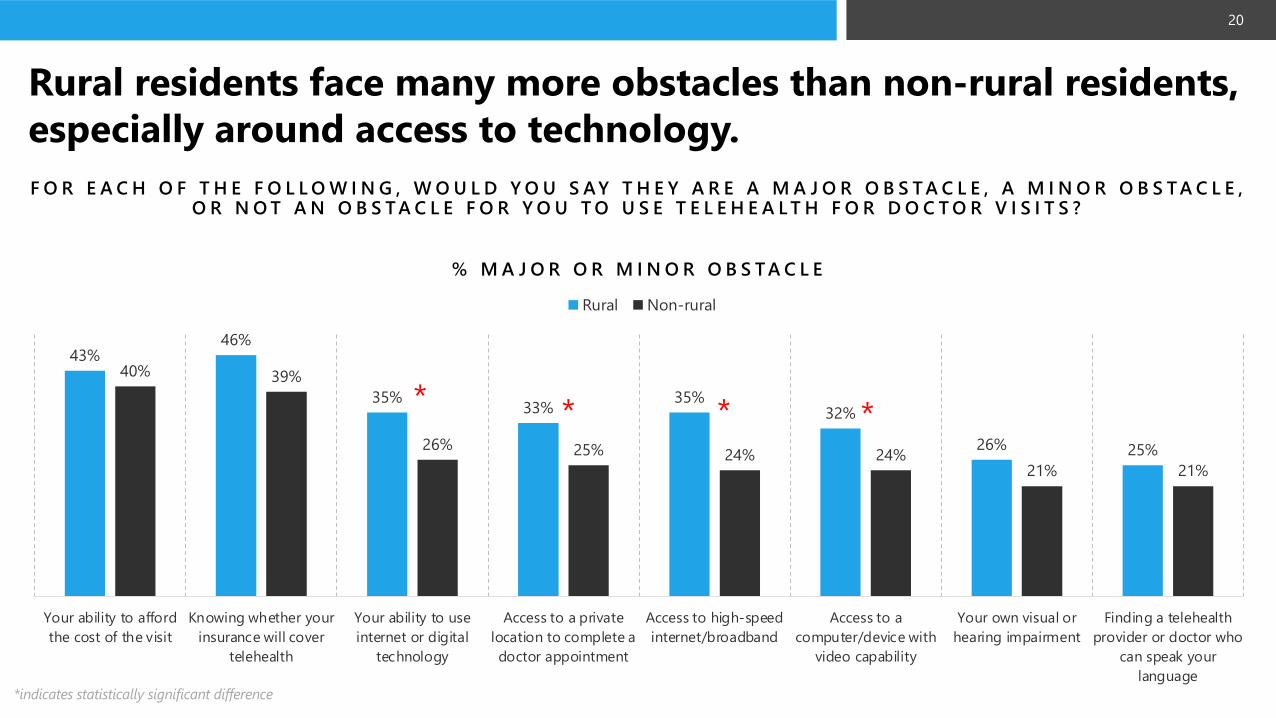
43%46%
35% 33% 35%32%
26% 25%
40% 39%
26% 25% 24% 24%21% 21%
Your ability to affordthe cost of the visit
Knowing whether yourinsurance will cover
telehealth
Your ability to useinternet or digital
technology
Access to a privatelocation to complete adoctor appointment
Access to high-speedinternet/broadband
Access to acomputer/device with
video capability
Your own visual orhearing impairment
Finding a telehealthprovider or doctor who
can speak yourlanguage
% M A J O R O R M I N O R O B S T A C L E
Rural Non-rural
Rural residents face many more obstacles than non-rural residents, especially around access to technology.
20
F O R E A C H O F T H E F O L L O W I N G , W O U L D Y O U S AY T H E Y A R E A M A J O R O B S T A C L E , A M I N O R O B S T A C L E , O R N O T A N O B S T A C L E F O R Y O U T O U S E T E L E H E A L T H F O R D O C T O R V I S I T S ?
* * * *
*indicates statistically significant difference
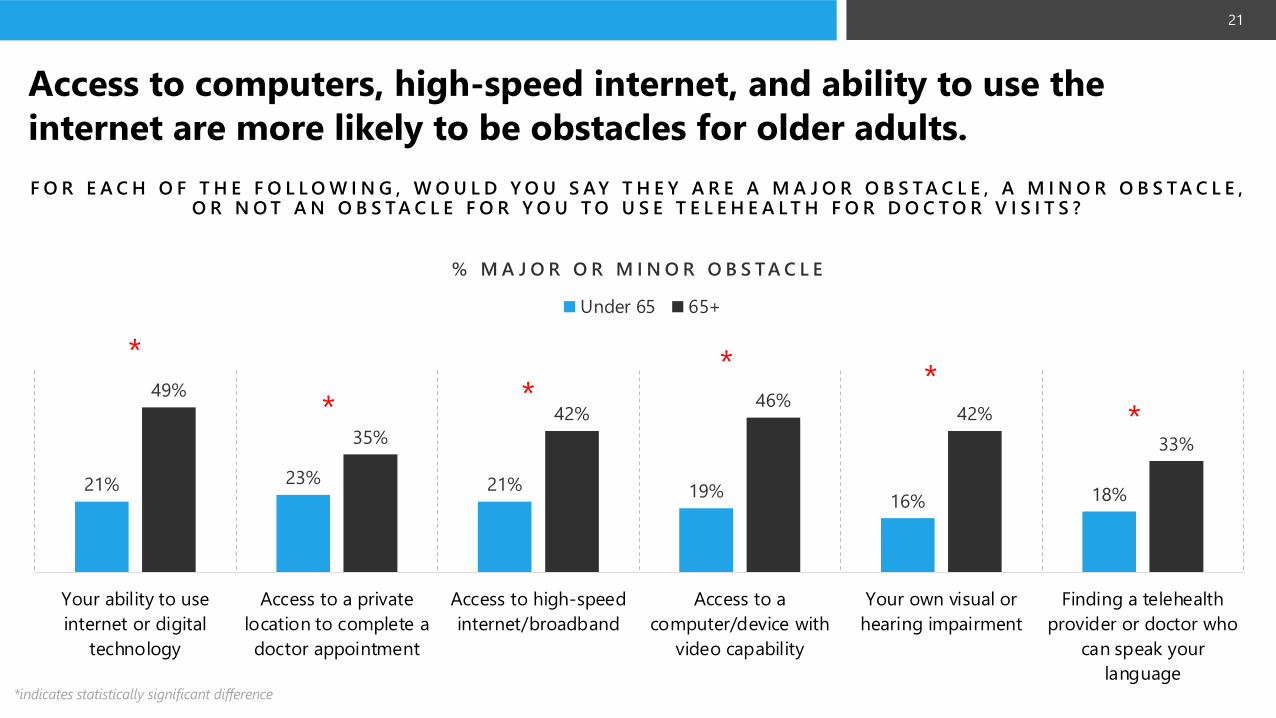
21% 23% 21% 19% 16% 18%
49%
35%42%
46%42%
33%
Your ability to useinternet or digital
technology
Access to a privatelocation to complete adoctor appointment
Access to high-speedinternet/broadband
Access to acomputer/device with
video capability
Your own visual orhearing impairment
Finding a telehealthprovider or doctor who
can speak yourlanguage
% M A J O R O R M I N O R O B S T A C L E
Under 65 65+
Access to computers, high-speed internet, and ability to use the internet are more likely to be obstacles for older adults.
21
F O R E A C H O F T H E F O L L O W I N G , W O U L D Y O U S AY T H E Y A R E A M A J O R O B S T A C L E , A M I N O R O B S T A C L E , O R N O T A N O B S T A C L E F O R Y O U T O U S E T E L E H E A L T H F O R D O C T O R V I S I T S ?
* ***
**
*indicates statistically significant difference

The Future of Telehealth

43%
21%
20%
17%
17%
14%
14%
29%
26%
22%
20%
17%
20%
20%
10%
17%
19%
15%
15%
19%
20%
19%
36%
38%
47%
50%
46%
46%
A prescription refill only
A routine visit for a chronic illness
Annual physical or preventive service
Mental health or substance use treatment
Illness, injury, or condition that needs care right away
A consult for a surgical procedure or operation
Physical therapy
I F Y O U R D O C T O R O R H E A L T H C A R E P R O V I D E R O F F E R S T E L E H E A L T H I N T H E F U T U R E , H O W L I K E L Y A R E Y O U T O U S E T E L E H E A L T H V I S I T S F O R …
Very likely Somewhat likely Somewhat unlikely Very unlikely
Eight in ten adults are likely to use telehealth in the future for some type of visit with a health care provider.
23
% Likely
71%
47%
43%
36%
35%
34%
34%
*Among total adults

Appendix

29%
22%
19%
10%
3%
5%
3%
7%
2%
19%
19%
23%
14%
10%
7%
3%
3%
2%
Annual physical or preventive service
Routine visit for a chronic illness such as diabetes or high blood pressure
Prescription refill only
Illness, injury or condition that needed care right away
Mental health or substance use treatment
Consult for a surgical procedure or operation
Physical therapy
Other
Don't know/Refused
Medicare Employer sponsored
*
Type of Telehealth Visit Among Medicare v. Employee Sponsored Insurance
25
*indicates statistically significant difference

Issue Resolved for Rural/Non-rural and Medicare/Employer Sponsored
26
72%
4%
20%
82%
4%
12%
Yes No, sent to theEmergency Department
No, asked to seeprovider in person
R U R A L V. N O N - R U R A L
Rural Non-rural
81%
4%
14%
79%
5%
15%
Yes No, sent to theEmergency Department
No, asked to seeprovider in person
M E D I C A R E V. E M P L O Y E R S P O N S O R E D
Medicare Employer sponsored
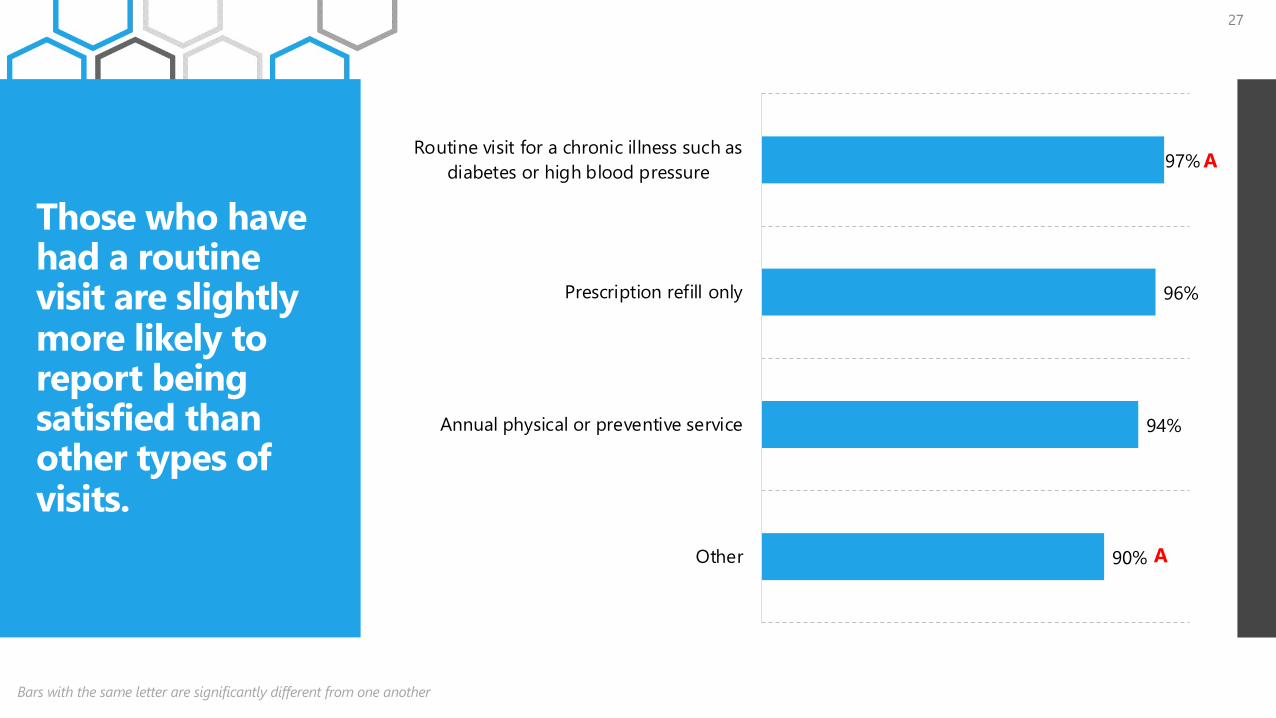
Those who have had a routine visit are slightly more likely to report being satisfied than other types of visits.
27
97%
96%
94%
90%
Routine visit for a chronic illness such asdiabetes or high blood pressure
Prescription refill only
Annual physical or preventive service
Other
A
A
Bars with the same letter are significantly different from one another

68%
10% 9% 11%
54%
29%
11%4%
Sought care in person withprovider
Sought care in EmergencyDepartment or urgent care
Delayed care Not sought care at all
Issue resolved Issue not resolved
Those who did not have their issue resolved were more likely to have sought care in an emergency department or urgent care had they not had access to telehealth.
28
*
*
*indicates statistically significant difference
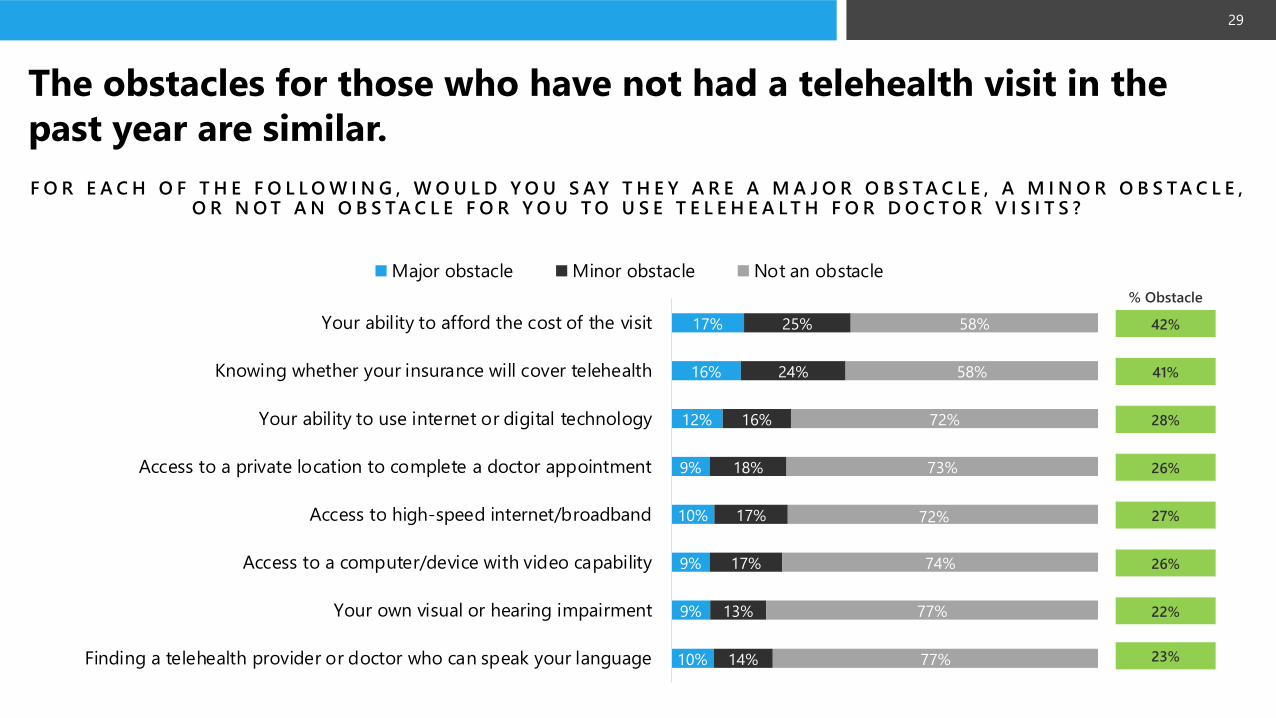
17%
16%
12%
9%
10%
9%
9%
10%
25%
24%
16%
18%
17%
17%
13%
14%
58%
58%
72%
73%
72%
74%
77%
77%
Your ability to afford the cost of the visit
Knowing whether your insurance will cover telehealth
Your ability to use internet or digital technology
Access to a private location to complete a doctor appointment
Access to high-speed internet/broadband
Access to a computer/device with video capability
Your own visual or hearing impairment
Finding a telehealth provider or doctor who can speak your language
Major obstacle Minor obstacle Not an obstacle
The obstacles for those who have not had a telehealth visit in the past year are similar.
29
F O R E A C H O F T H E F O L L O W I N G , W O U L D Y O U S AY T H E Y A R E A M A J O R O B S T A C L E , A M I N O R O B S T A C L E , O R N O T A N O B S T A C L E F O R Y O U T O U S E T E L E H E A L T H F O R D O C T O R V I S I T S ?
% Obstacle
42%
41%
28%
26%
27%
26%
22%
23%

81%83%
Rural Non-rural
% V E R Y O R S O M E W H A T L I K E L Y
Similar amounts of adults in rural and non-rural areas are likely to use telehealth in the future.
30
83% 84%
79%
74%
EmployerSponsored
Medicare Other Uninsured
% V E R Y O R S O M E W H A T L I K E L Y
I F Y O U R D O C T O R O R H E A L T H C A R E P R O V I D E R O F F E R S T E L E H E A L T H I N T H E F U T U R E , H O W L I K E L Y A R E Y O U T O U S E T E L E H E A L T H V I S I T S F O R …
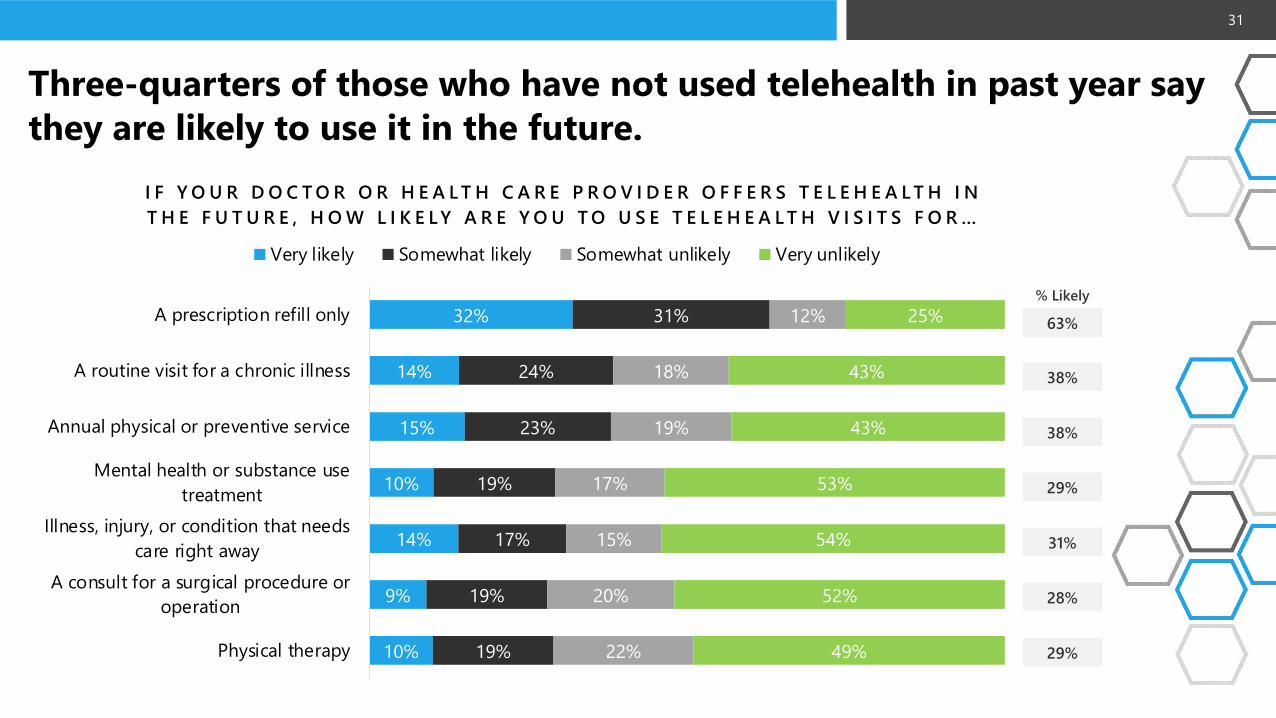
32%
14%
15%
10%
14%
9%
10%
31%
24%
23%
19%
17%
19%
19%
12%
18%
19%
17%
15%
20%
22%
25%
43%
43%
53%
54%
52%
49%
A prescription refill only
A routine visit for a chronic illness
Annual physical or preventive service
Mental health or substance usetreatment
Illness, injury, or condition that needscare right away
A consult for a surgical procedure oroperation
Physical therapy
I F Y O U R D O C T O R O R H E A L T H C A R E P R O V I D E R O F F E R S T E L E H E A L T H I N T H E F U T U R E , H O W L I K E L Y A R E Y O U T O U S E T E L E H E A L T H V I S I T S F O R …
Very likely Somewhat likely Somewhat unlikely Very unlikely
Three-quarters of those who have not used telehealth in past year say they are likely to use it in the future.
31
% Likely
63%
38%
38%
29%
31%
28%
29%

73%
45%
40%
34%
32%
33%
30%
72%
55%
50%
45%
43%
42%
46%
64%
51%
43%
31%
37%
30%
39%
A prescription refill only
A routine visit for a chronic illness
Annual physical or preventive service
Mental health or substance use treatment
Illness, injury, or condition that needs care rightaway
A consult for a surgical procedure or operation
Physical therapy
% V E R Y O R S O M E W H A T L I K E L Y
White Black Hispanic
Black adults are more likely to use telehealth in the future for routine visits for chronic illness and preventive care.
32
AA
BB
CC
DD
D
EE
FF
F
GG
G
Bars with the same letter are significantly different from one another