telecommunications - business opportunities in india
TRANSCRIPT

For updated information, please visit www.ibef.org August 2019
TELECOMMUNICATIONS
Table of Content
Executive Summary……………….….…….3
Advantage India…………………..….……..4
Market Overview …………………….……..6
Recent Trends and Strategies …………...16
Growth Drivers…………………….............21
Opportunities…….……….......……………31
Industry Associations……………...……...34
Useful Information……….......…………….36

For updated information, please visit www.ibef.orgTelecommunication3
EXECUTIVE SUMMARY
India has the second largest telecom network in the world.
Total subscriber base in the country stood at 1,183.15 million at the end of May 2019.
Second-largest
subscriber base
India has the second highest number of internet subscribers globally.
India’s active internet subscription has reached 530 million in 2018 at a run rate of 65 million users per year
in the last two years.
Second-highest number
of internet users
Telecom penetration, also known as tele-density, has grown rapidly over the course of the past few years.
Tele-density grew from 18.23 per cent in FY07 to 90.05 per cent in FY19.Rising penetration rate
Availability of affordable smartphones and lower rates of data are expected to drive growth in the Indian
telecom industry.
Affordability and lower
rates
Source: Telecom Regulatory Authority of India, TechSci Research
Telecommunication
ADVANTAGE INDIA

For updated information, please visit www.ibef.orgTelecommunication5
The government of India has introduced
Digital India programme under which all the
sectors such as healthcare, retail, etc. will
be connected through internet.
Also, with 70 per cent of the population
staying in rural areas and a rapidly
increasing rural telecom penetration, the
rural market would be a key growth driver in
the coming years.
ADVANTAGE INDIA
India ranks second in terms of number of
telecommunication subscriptions, internet
subscribers and app downloads* globally.
Moreover, India is also one of the largest
data consumers globally. Total mobile data
usage in the country grew 109 per cent
year-on-year to 4,867 PB per month in
December 2018.^
India's internet users is expected to reach
627 million in 2019.
Telecommunication ratings in the country
are expected to start rising within the next
two quarters (Q3 and Q4 2018-19), providing
higher pricing power to incumbent players.
The government has been proactive in its
efforts to transform India into a global
telecommunication hub.
The Government of India unveiled the
National Digital Communications Policy,
2018 in September 2018. The policy aims
to attract US$ 100 billion worth of
investments and generate 4 million jobs in
the sector by 2022.
As of January 2019, expenditure on telecom
infrastructure and services by Government of India grew
six-fold to Rs 60,000 crore (US$ 8.31 billion) between
2014-19.
ADVANTAGE
INDIA
Source: Economic Times, TRAI, App Annie, Department of Telecommunications
Notes: *Combined iOS App Store, Google Play and third-party android, ^Nokia MBiT Index 2018, PB- Petabytes

Telecommunication
MARKET OVERVIEW

For updated information, please visit www.ibef.orgTelecommunication7
THE TELECOM MARKET SPLIT INTO THREE
SEGMENTS
Source: TechSci Research
Telecom
Mobile (wireless) Fixed-line (wireline)
Comprises
establishments
operating and
maintaining switching
and transmission
facilities to provide direct
communications via
airwaves
Internet services
Consists of companies
that operate and
maintain switching and
transmission facilities to
provide direct
communications through
landlines, microwave or
a combination of
landlines and satellite
link-ups
Includes Internet Service
Providers (ISPs) that
offer broadband internet
connections through
consumer and corporate
channels

For updated information, please visit www.ibef.orgTelecommunication8
TELECOM SUBSCRIBER BASE EXPANDS
SUBSTANTIALLY
20
5.8
6
30
0.4
9 42
9.7
2 6
21
.28
84
6.3
2
95
1.3
4
89
8.0
2
93
3.0
0
99
6.4
9
1,0
58
.86
1,1
94
.58
1,2
06
.22
1,1
83
.51
11
83
.15
18.23
26.22
36.98
52.74
70.89
78.66
73.32
75.23
79.38
83.36
92.98 92.8490.11
89.92
0
10
20
30
40
50
60
70
80
90
100
0
200
400
600
800
1,000
1,200
1,400
FY
07
FY
08
FY
09
FY
10
FY
11
FY
12
FY
13
FY
14
FY
15
FY
16
FY
17
FY
18
FY
19
FY
20(…
Telephone Subscriber (in million) Teledensity
Source: Telecom Regulatory Authority of India
Note: CAGR - Compound Annual Growth Rate
India is currently the second largest telecommunication market and
has the second highest number of internet users in the world.
India’s telephone subscriber base expanded at a CAGR of 17.44 per
cent, reaching 1,206.22 million during FY07–18.
Tele-density (defined as the number of telephone connections for
every 100 individuals) in India, increased from 18.3 per cent in FY07
to 92.84 per cent in FY18.
Total telephone subscriber base and tele-density reached 1,183.15
million and 89.92 per cent, respectively, at the end of April 2019.
Visakhapatnam port traffic (million tonnes)Growth in total subscribers and tele-density

For updated information, please visit www.ibef.orgTelecommunication9
WIRELESS AND RURAL SEGMENTS GAINING SHARE
Source: Telecom Regulatory Authority of India
The share of the wireless segment in India’s telecommunications market has increased steadily.
As of March 2019, the wireless segment comprises 98.17 per cent and in May 2019 it reached 98.2 per cent of telephone subscriptions, compared
to 95.90 per cent in FY11.
Similarly, share of rural subscribers in total telephone subscribers has surged as telecommunications penetration has increased.
As of March 2019, rural subscribers form 43.46 per cent of total telephone subscribers and 42.9 per cent in May 2019, compared to 33.35 per cent
in FY11.
98.17%
1.83%
Wireline
95.90%
4.10%
Wireless
56.54%
43.46%
Rural
66.65%
33.35%
Urban
Visakhapatnam port traffic (million tonnes)Urban and Rural share in telephone subscriptionsWireless and Wireline share in telephone subscriptions
FY11 FY19 FY11 FY19

For updated information, please visit www.ibef.orgTelecommunication10
WIRELESS SUBSCRIPTIONS WITNESS ROBUST
GROWTH OVER THE YEARS
16
5.1
1
26
1.0
7 39
1.7
6
58
4.3
2
81
1.5
9
91
9.1
7
86
7.8
0
90
4.5
1
96
9.8
9
1,0
33
.63
1,1
70
.18
1,1
83
.41
1,1
61
.81
1,1
61
.86
18.23
26.22
36.98
52.74
70.89
78.66
73.32
75.2379.38
83.36
92.98 92.8490.1188.31
0
10
20
30
40
50
60
70
80
90
100
0
100
200
300
400
500
600
700
800
900
1,000
1,100
1,200
1,300
FY
07
FY
08
FY
09
FY
10
FY
11
FY
12
FY
13
FY
14
FY
15
FY
16
FY
17
FY
18
FY
19
FY
20(t
ill M
ay)
Source: Telecom Regulatory Authority of India
Note: CAGR - Compound Annual Growth Rate, ^CAGR is up to FY18
Wireless subscriptions have grown robustly over the past few years.
Between FY07-18, wireless subscriptions in the country increased at
a CAGR of 19.61 per cent to 1,183.41 million.
The growth in wireless subscriptions has led to a significant rise in
wireless tele-density.
Wireless tele-density of India has increased more than five-fold from
18.23 per cent in FY07 to 92.84 per cent in FY18.
At the end of May 2019, wireless subscriptions stood at 1161.86
million while wireless tele-density reached 88.31 per cent.
Visakhapatnam port traffic (million tonnes)Wireless Subscription (in Million)
^CAGR 19.61%
For updated information, please visit www.ibef.orgTelecommunication11
STRONG GROWTH IN BROADBAND DRIVES
INTERNET ACCESS REVENUES
2.3
4
3.8
7
6.2
2
8.7
7
11
.87
13
.79
15
.05
60
.87
99
.20
14
9.7
5
27
6.5
2
41
2.6
0
56
3.3
1
58
1.5
1
0
100
200
300
400
500
600
700
FY
07
FY
08
FY
09
FY
10
FY
11
FY
12
FY
13
FY
14
FY
15
FY
16
FY
17
FY
18
FY
19
FY
20…
Note: CAGR - Compound Annual Growth Rate, ^CAGR is up to FY18, #Includes Mobile devices users and Fixed wireless subscribers
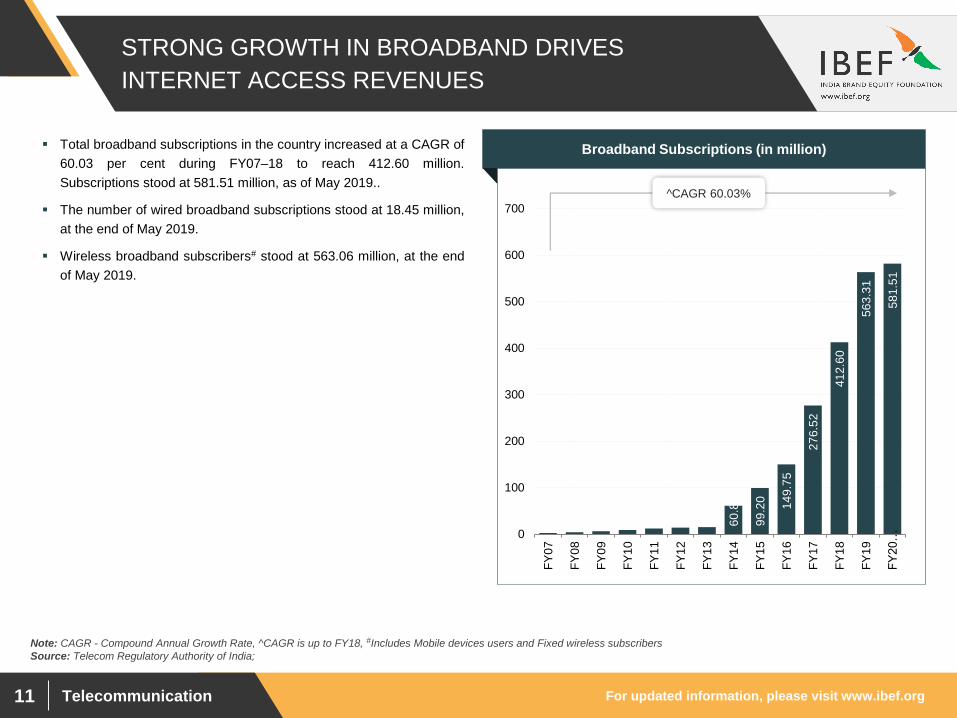
Total broadband subscriptions in the country increased at a CAGR of
60.03 per cent during FY07–18 to reach 412.60 million.
Subscriptions stood at 581.51 million, as of May 2019..
The number of wired broadband subscriptions stood at 18.45 million,
at the end of May 2019.
Wireless broadband subscribers# stood at 563.06 million, at the end
of May 2019.
Visakhapatnam port traffic (million tonnes)Broadband Subscriptions (in million)
^CAGR 60.03%
Source: Telecom Regulatory Authority of India;
For updated information, please visit www.ibef.orgTelecommunication12
9.2
7
11
.09
13
.54
16
.18
19
.67
22
.86
16
4.8
1
25
1.5
9
30
2.3
5
34
2.6
5
42
2.1
9 49
3.9
6
63
6.7
3
0
100
200
300
400
500
600
700
FY
07
FY
08
FY
09
FY
10
FY
11
FY
12
FY
13
FY
14
FY
15
FY
16
FY
17
FY
18
FY
19
NUMBER OF INTERNET SUBSCRIBERS INCREASING
AT A FAST PACE
Source: Telecom Regulatory Authority of India, Business Monitor International
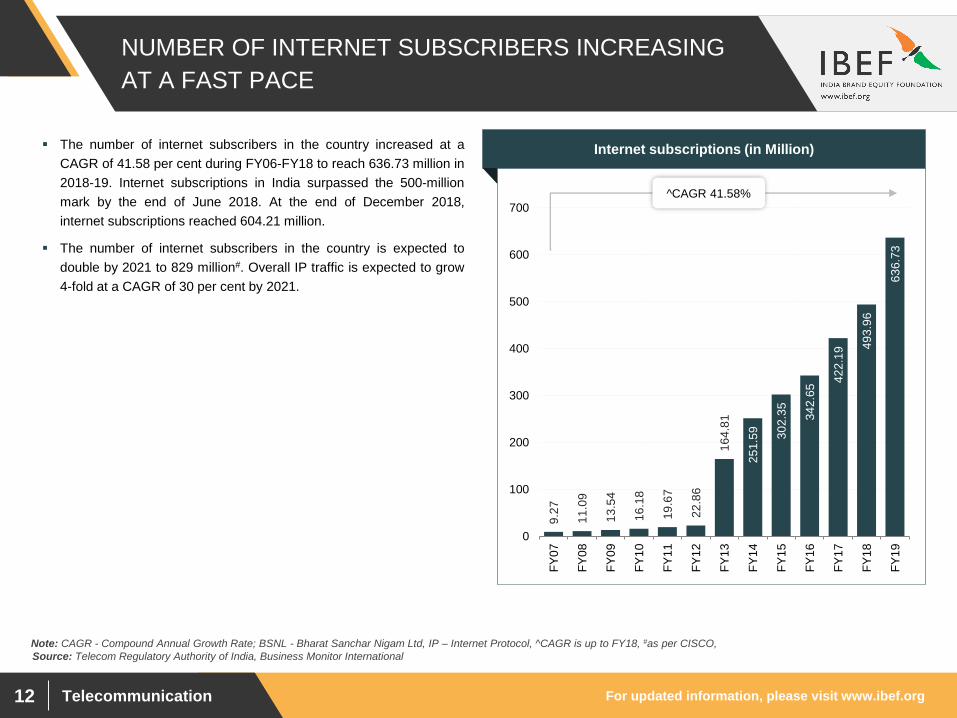
The number of internet subscribers in the country increased at a
CAGR of 41.58 per cent during FY06-FY18 to reach 636.73 million in
2018-19. Internet subscriptions in India surpassed the 500-million
mark by the end of June 2018. At the end of December 2018,
internet subscriptions reached 604.21 million.
The number of internet subscribers in the country is expected to
double by 2021 to 829 million#. Overall IP traffic is expected to grow
4-fold at a CAGR of 30 per cent by 2021.
Visakhapatnam port traffic (million tonnes)Internet subscriptions (in Million)
^CAGR 41.58%
Note: CAGR - Compound Annual Growth Rate; BSNL - Bharat Sanchar Nigam Ltd, IP – Internet Protocol, ^CAGR is up to FY18, #as per CISCO,

For updated information, please visit www.ibef.orgTelecommunication13
4,2
06
,41
5
5,4
30
,04
6
6,5
21
,89
3
8,0
67
,63
3
10
,41
8,0
76
12
,54
9,8
91
14
,25
3,2
56
15
,85
0,5
60
0
2,000,000
4,000,000
6,000,000
8,000,000
10,000,000
12,000,000
14,000,000
16,000,000
18,000,000
Q1
FY
18
Q2
FY
18
Q3
FY
18
Q4
FY
18
Q1
FY
19
Q2
FY
19
Q3
FY
19
Q4
FY
19
EXPONENTIAL GROWTH IN DATA CONSUMPTION
Source: Telecom Regulatory Authority of India, Lok Sabha
Visakhapatnam port traffic (million tonnes)Total Wireless Data Usage (in Terabytes)
Note: CAGR - Compound Annual Growth Rate
India holds the distinction of being the largest consumer of mobile
data globally.
Data consumption in the country has witnessed exponential growth
over the course of the past few years.
Total wireless data usage in India grew 119.00 per cent year-on-year
to 1,58,50,560 terabytes between January-March 2019.
For updated information, please visit www.ibef.orgTelecommunication14
SURGING TELECOM REVENUES
32
.05
33
.02
33
.32
37
.64 4
1.6
9
39
.14
38
.79 41
.69
40
.29
40
.93
39
.49
33
.97
0
5
10
15
20
25
30
35
40
45
FY
08
FY
09
FY
10
FY
11
FY
12
FY
13
FY
14
FY
15
FY
16
FY
17
FY
18
FY
19
Source: Telecom Regulatory Authority of India’s Performance Indicator Report, TechSci Research , Crisil
Note: CAGR - Compound Annual Growth Rate, FY – Indian Financial Year (April – March)
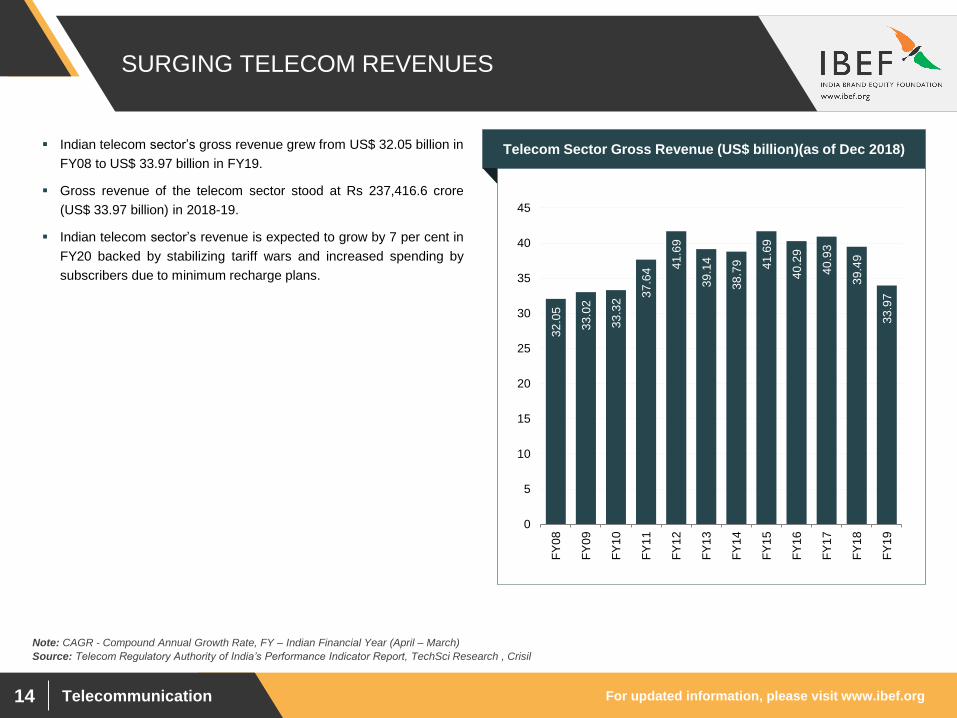
Indian telecom sector’s gross revenue grew from US$ 32.05 billion in
FY08 to US$ 33.97 billion in FY19.
Gross revenue of the telecom sector stood at Rs 237,416.6 crore
(US$ 33.97 billion) in 2018-19.
Indian telecom sector’s revenue is expected to grow by 7 per cent in
FY20 backed by stabilizing tariff wars and increased spending by
subscribers due to minimum recharge plans.
Visakhapatnam port traffic (million tonnes)Telecom Sector Gross Revenue (US$ billion)(as of Dec 2018)

For updated information, please visit www.ibef.orgTelecommunication15
EMERGENCE OF TOWER INDUSTRY
Source: TechSci Research
A surge in the subscriber base has necessitated network expansion covering a wider area, thereby creating a need for significant investment in
telecom infrastructure
To curb costs and focus on core operations, telecom companies have been segregating their tower assets into separate companies. For example:
Reliance Communications has decided to finalise a deal to sell its stake in Reliance Infratel. The value of the deal is around US$3.68 billion
Creating separate tower companies has helped telecom companies lower operating cost and improve capital structure; this has also provided an
additional revenue stream
Inspired by the success seen by Indian players in towers business, most of the operators around the world are replicating the model
Rising
competition
Higher
operating
cost and
debt burden
Focus on
tower
sharing to
reduce
costs
Segregation
of towers
into
separate
companies
Emergence of Tower Industry

Telecommunication
RECENT TRENDS
AND STRATEGIES
For updated information, please visit www.ibef.orgTelecommunication17
NOTABLE TRENDS IN THE INDIAN TELECOM SECTOR
… (1/2)
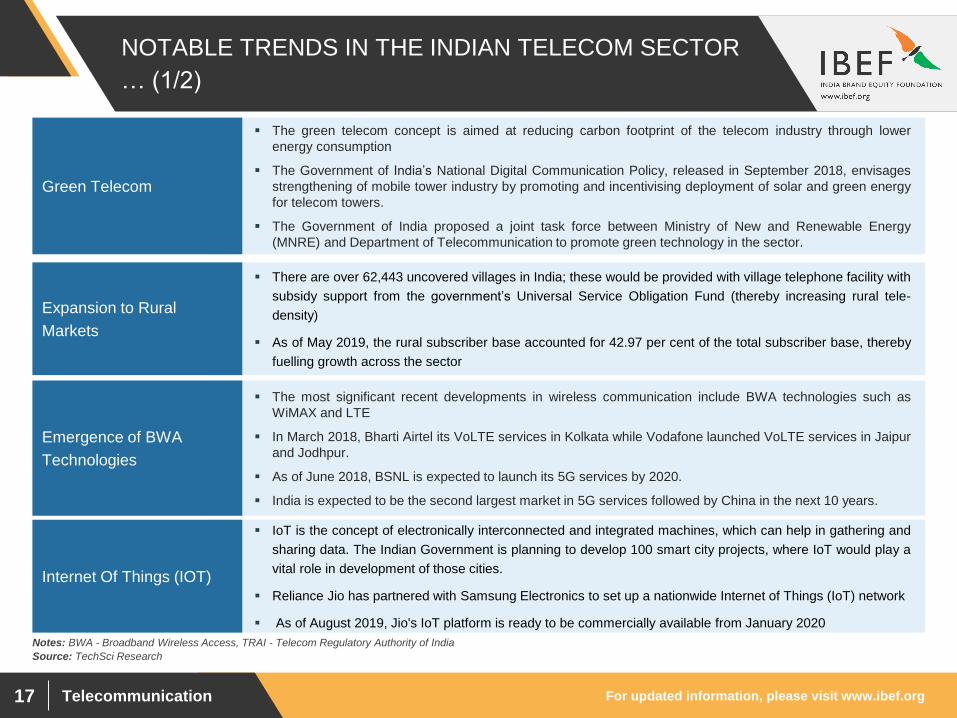
The green telecom concept is aimed at reducing carbon footprint of the telecom industry through lower
energy consumption
The Government of India’s National Digital Communication Policy, released in September 2018, envisages
strengthening of mobile tower industry by promoting and incentivising deployment of solar and green energy
for telecom towers.
The Government of India proposed a joint task force between Ministry of New and Renewable Energy
(MNRE) and Department of Telecommunication to promote green technology in the sector.
Green Telecom
Source: TechSci Research
There are over 62,443 uncovered villages in India; these would be provided with village telephone facility with
subsidy support from the government’s Universal Service Obligation Fund (thereby increasing rural tele-
density)
As of May 2019, the rural subscriber base accounted for 42.97 per cent of the total subscriber base, thereby
fuelling growth across the sector
Expansion to Rural
Markets
The most significant recent developments in wireless communication include BWA technologies such as
WiMAX and LTE
In March 2018, Bharti Airtel its VoLTE services in Kolkata while Vodafone launched VoLTE services in Jaipur
and Jodhpur.
As of June 2018, BSNL is expected to launch its 5G services by 2020.
India is expected to be the second largest market in 5G services followed by China in the next 10 years.
Emergence of BWA
Technologies
IoT is the concept of electronically interconnected and integrated machines, which can help in gathering and
sharing data. The Indian Government is planning to develop 100 smart city projects, where IoT would play a
vital role in development of those cities.
Reliance Jio has partnered with Samsung Electronics to set up a nationwide Internet of Things (IoT) network
As of August 2019, Jio's IoT platform is ready to be commercially available from January 2020
Internet Of Things (IOT)
Notes: BWA - Broadband Wireless Access, TRAI - Telecom Regulatory Authority of India

For updated information, please visit www.ibef.orgTelecommunication18
NOTABLE TRENDS IN THE INDIAN TELECOM SECTOR
… (2/2)
Vodafone India and Idea have merged into Vodafone idea. Vodafone Idea is unifying assets and aims to
complete network integration by June 2020.
Airtel’s acquisition of Tata Teleservices’ mobile business was given approval by Competition Commission of
India (CCI) in November 2017. As of December 2018, the deal was cleared by the National Company Law
Tribunal (NCLT).
Consolidation
Source: ’Searching for New Frontiers of growth: Indian Banks’- PwC, TechSci Research , Reserve Bank of India
In 2017, Vodafone disclosed its plans to invest US$1,310 million to upgrade and expand Vodafone India
network coverage and US$ 655 million to upgrade its technology centre
The new National Digital Communications Policy 2018 has envisaged attracting investments worth US$ 100
billion in the telecommunications sector by 2022.
Rising investments
As part of the recent outsourcing trend, operators have outsourced functions such as network maintenance,
IT operations and customer service
Outsourcing non-core
activities
The number of mobile wallet transaction increased 5 per cent month-on-month to 325.28 million in July 2018.
In March 2017, the government set a target of achieving 25 billion digital transactions for banks with the help
of PoS machines, transactions enabled and merchants, which have been added in firms
As of August 2019, more than 503 banks have been permitted to provide mobile banking services in India.
Mobile banking
Notes: FKM – Fibre Kilometre
Reliance Jio Infocomm is going to expand its optical fibre network to over 1,100 cities under its JioGigaFiber
brand. In August 2019, commercially launched Jio GigaFiber as wired broadband service.
In January 2019, Himachal Futuristic Communications Ltd (HFCL) decided to expand its optical fibre cable
(OFC) manufacturing capacity to 10.5 million fkm from 7 million fkm.
Investments in optical
fibre network

For updated information, please visit www.ibef.orgTelecommunication19
Players differentiate themselves by providing different services to customers.
Bharti Airtel has already partnered with Amazon Prime and Hotstar and is expected to tie up with Netflix to
offer free subscription to Netflix’s content on its mobile customers.
Differentiation
Players are using innovative marketing strategies to succeed in this sector. For example,
• Vodafone Idea launched #StrongerEveryHour with aim to highlight the improved network of Vodafone
SuperNet 4G - India’s Data Strong Network.
• Airtel launched new ad campaign ‘Sab Kuch Try Karo, Fir Sahi Chuno’
Marketing strategy
STRATEGIES ADOPTED
Source: Company websites, TechSci Research
Notes: CDMA – Code Division Multiple Access, GSM - Global System for Mobile Communication
Players have reduced the number of plans on offer and now offer a limited number of simple tariff plans
along with marquee plans.
This has simplified choosing plans for customers and customers can choose the best deals for themselves.
Reduced number of
plans
Players price their products very carefully due to the price sensitive nature of customers and high
competition in the sector.Pricing strategy

For updated information, please visit www.ibef.orgTelecommunication20
KEY COMPANIES IN THE MARKET
Company Ownership Presence
Mahanagar Telephone Nigam Ltd (MTNL)Government (56.3 per cent), Life
Insurance Corporation (18.8 per cent)
Fixed-line and mobile telephony (in
Delhi and Mumbai), data and Internet
Bharat Sanchar Nigam Ltd (BSNL) Government
(100 per cent)
Fixed-line and mobile telephony (GSM
– outside Delhi and Mumbai), data and
Internet in 22 circles
Bharti Airtel
Bharti Group (45.48 per cent), Pastel
Ltd (14.79 per cent), Indian Continent
Investment (6.65 per cent),
Broadband and mobile (GSM) in
22 circles
Vodafone Idea LimitedAditya Birla Group and Vodafone
Group partnership
Broadband and mobile (GSM) in
22 circles
Reliance Jio Infocomm Reliance Industries Limited. Broadband and mobile
Source: Companies’ websites, Moneycontrol

Telecommunication
GROWTH DRIVERS

For updated information, please visit www.ibef.orgTelecommunication22
SECTOR BENEFITS FROM RISING INCOME, GROWING
YOUNG POPULATION
Note: FDI - Foreign Direct Investment, MOU - Minutes of Use per month and per subscriber, M&A - Mergers and Acquisitions
Growing demand
Inviting Resulting in
Growing demand Policy supportIncreasing
investments
Higher real
income and
changing lifestyles
Growing young
population
Relaxed
FDI Norms
Higher FDI inflows
Increasing M and
A activity
Increasing MOU
and data usage
Encourages
firms to expand
to rural areas
Reduction in
license fee
For updated information, please visit www.ibef.orgTelecommunication23
RISING INCOME AND GROWING RURAL MARKET
FUELS DEMAND FOR TELECOM SERVICES
1,4
81
.56
1,4
85
.60
1,6
10
.36
1,6
38
.76
1,7
49
.16
1,9
82
.70
2,1
34
.75
2,3
34
.14
2,5
38
.82
2,7
62
.31
3,0
06
.54
3,2
73
.85
0
500
1,000
1,500
2,000
2,500
3,000
3,500
201
2
201
3
201
4
201
5
201
6
201
7
201
8
201
9
202
0
202
1
202
2
202
3
Source: IMF World Economic Outlook Database April 2018
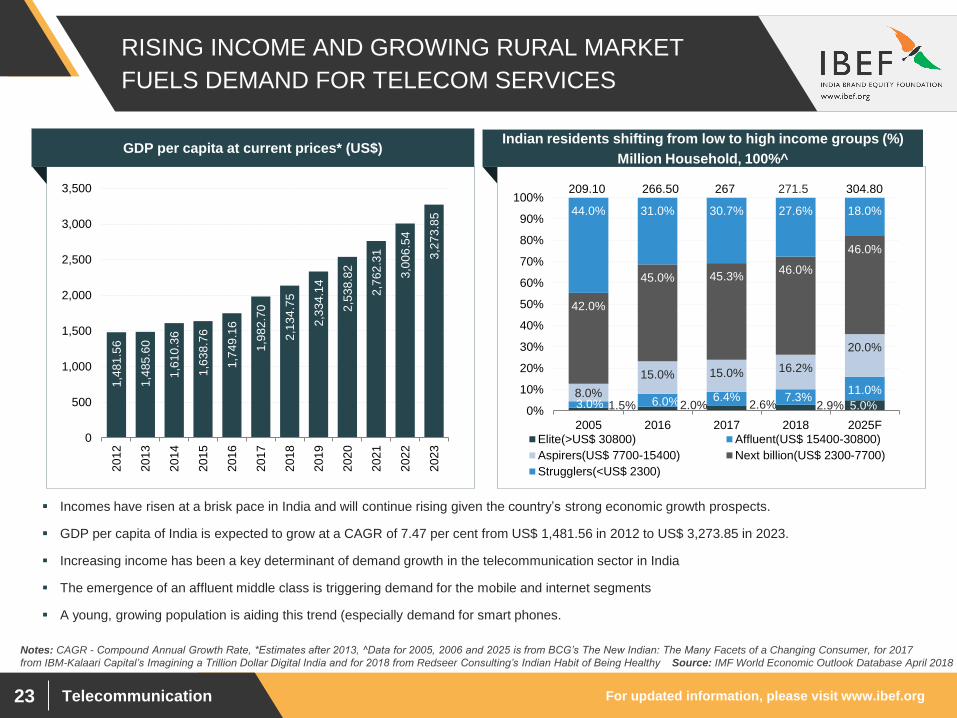
Incomes have risen at a brisk pace in India and will continue rising given the country’s strong economic growth prospects.
GDP per capita of India is expected to grow at a CAGR of 7.47 per cent from US$ 1,481.56 in 2012 to US$ 3,273.85 in 2023.
Increasing income has been a key determinant of demand growth in the telecommunication sector in India
The emergence of an affluent middle class is triggering demand for the mobile and internet segments
A young, growing population is aiding this trend (especially demand for smart phones.
GDP per capita at current prices* (US$)
Notes: CAGR - Compound Annual Growth Rate, *Estimates after 2013, ^Data for 2005, 2006 and 2025 is from BCG’s The New Indian: The Many Facets of a Changing Consumer, for 2017
from IBM-Kalaari Capital’s Imagining a Trillion Dollar Digital India and for 2018 from Redseer Consulting’s Indian Habit of Being Healthy
1.5% 2.0% 2.6% 2.9% 5.0%3.0% 6.0% 6.4% 7.3%11.0%8.0%
15.0% 15.0% 16.2%
20.0%
42.0%
45.0% 45.3%46.0%
46.0%
44.0% 31.0% 30.7% 27.6% 18.0%
0%
10%
20%
30%
40%
50%
60%
70%
80%
90%
100%
2005 2016 2017 2018 2025F
Elite(>US$ 30800) Affluent(US$ 15400-30800)
Aspirers(US$ 7700-15400) Next billion(US$ 2300-7700)
Strugglers(<US$ 2300)
209.10 266.50 304.80267 271.5
Indian residents shifting from low to high income groups (%)
Million Household, 100%^

For updated information, please visit www.ibef.orgTelecommunication24
STRONG POLICY SUPPORT CRUCIAL TO THE
SECTOR’S DEVELOPMENT … (1/3)
In August 2017, TRAI directed operators to have a call-drop rate of not greater than 2 per cent.
The policy measures of TRAI have had positive impact. Call-drops in the country have decreased from 0.94
per cent in 2016 to 0.52 per cent in March 2018.
To compensate the
consumers in case of
call drop
Source: TRAI, TechSci Research
In 2015, Telecom Regulatory Authority of India made regulations to amend the Standards of quality of
wireline (telephone service) and cellular mobile telephone services. These regulations has been laid down to
ensure better and effective compliance with the quality of service regulations and to protect the interest of the
customers
Standards of quality
wireline and wireless
services
FDI cap in the telecom sector has been increased to 100 per cent from 74 per cent; out of 100 per cent, 49
per cent will be done through automatic route and the rest will be done through the FIPB approval route
FDI of up to 100 per cent is permitted for infrastructure providers offering dark fibre, electronic mail and voice
Relaxed
FDI norms
Notes: FDI - Foreign Direct Investment, FIPB - Foreign Investment Promotion Boar
In May 2017, Microsoft India signed a Memorandum of Understanding with the Telecom Sector Skill Council
(TSSC) to encourage skill development through “Project Sangam”.
In a major push for Prime Minister Narendra Modi's 'Skill India' mission, Microsoft's Indian-born CEO Satya
Nadella launched a Cloud hosted platform named as "Project Sangam" to help the government not only train
but also assist people get jobs via professional networking website LinkedIn, which was acquired by the
company last year.
Skill Development

For updated information, please visit www.ibef.orgTelecommunication25
In February 2018, TRAI passed the Telecommunication Tariff (63rd amendment) order, according to which,
telecom firms are free to give promotional offers to customers if the offers are transparent, non-predatory and
non-discriminatory.
STRONG POLICY SUPPORT CRUCIAL TO THE
SECTOR’S DEVELOPMENT … (2/3)
Telecommunication
Tariff Order
Source: TRAI, TechSci Research
The Department of Information Technology intends to set up over 1 million internet-enabled common service
centres across India as per the National e-Governance Plan
On 8th August 2016, the Telecom Regulatory Authority of India (TRAI) made the 10th amendment to the
TCPR (Telecom Consumers Protection Regulations) permitting telecom companies to offer data packs
having maximum validity of 365 days
Set up internet
connections
In January 2015, the Government of India recommended reduction in license fees of telecom operators by 6
per cent, telecom operators currently pay 8 per cent of adjusted gross revenue as licence fee
The issuance of several international and national long-distance licenses has created opportunities and
attracted new companies into the market
Reduction in license
fees
Notes: USOF - Universal Service Obligation Fund; OFC - Optical Fibre Cable, WiMAX - Worldwide Interoperability for Microwave Access Telecommunications
The Government of India has announced the Phased Manufacturing Programme (PMP) to promote domestic
production of mobile handsets. This initiative will help in building a robust indigenous mobile manufacturing
ecosystem in India and incentivise large scale manufacturing.
Make in India
For updated information, please visit www.ibef.orgTelecommunication26
STRONG POLICY SUPPORT CRUCIAL TO THE
SECTOR’S DEVELOPMENT … (3/3)
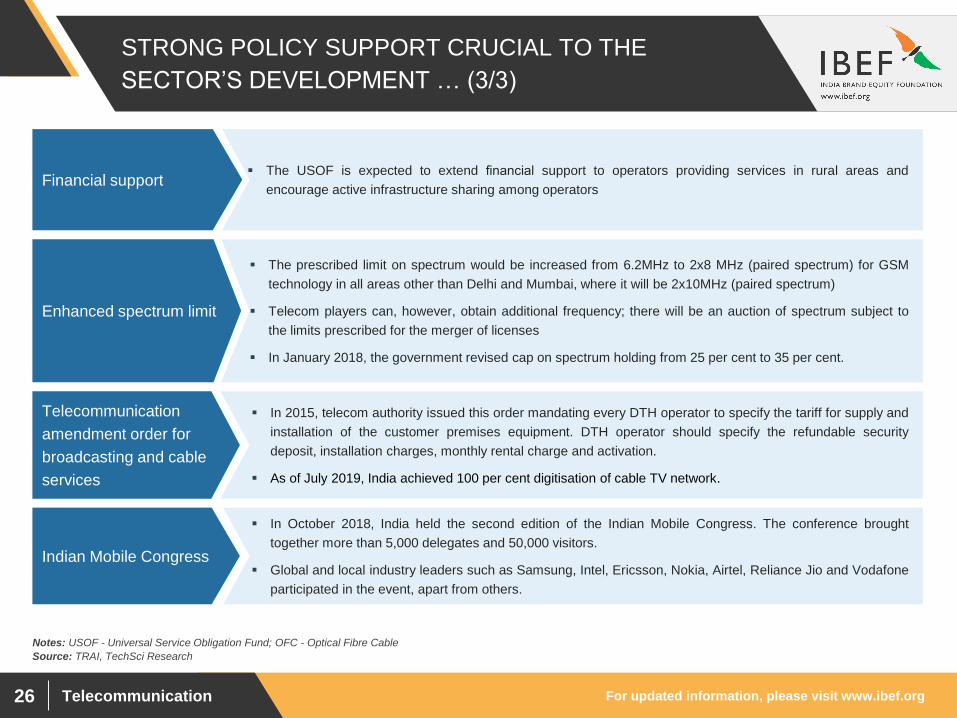
The USOF is expected to extend financial support to operators providing services in rural areas and
encourage active infrastructure sharing among operatorsFinancial support
Source: TRAI, TechSci Research
The prescribed limit on spectrum would be increased from 6.2MHz to 2x8 MHz (paired spectrum) for GSM
technology in all areas other than Delhi and Mumbai, where it will be 2x10MHz (paired spectrum)
Telecom players can, however, obtain additional frequency; there will be an auction of spectrum subject to
the limits prescribed for the merger of licenses
In January 2018, the government revised cap on spectrum holding from 25 per cent to 35 per cent.
Enhanced spectrum limit
In 2015, telecom authority issued this order mandating every DTH operator to specify the tariff for supply and
installation of the customer premises equipment. DTH operator should specify the refundable security
deposit, installation charges, monthly rental charge and activation.
As of July 2019, India achieved 100 per cent digitisation of cable TV network.
Telecommunication
amendment order for
broadcasting and cable
services
Notes: USOF - Universal Service Obligation Fund; OFC - Optical Fibre Cable
In October 2018, India held the second edition of the Indian Mobile Congress. The conference brought
together more than 5,000 delegates and 50,000 visitors.
Global and local industry leaders such as Samsung, Intel, Ericsson, Nokia, Airtel, Reliance Jio and Vodafone
participated in the event, apart from others.
Indian Mobile Congress
For updated information, please visit www.ibef.orgTelecommunication27
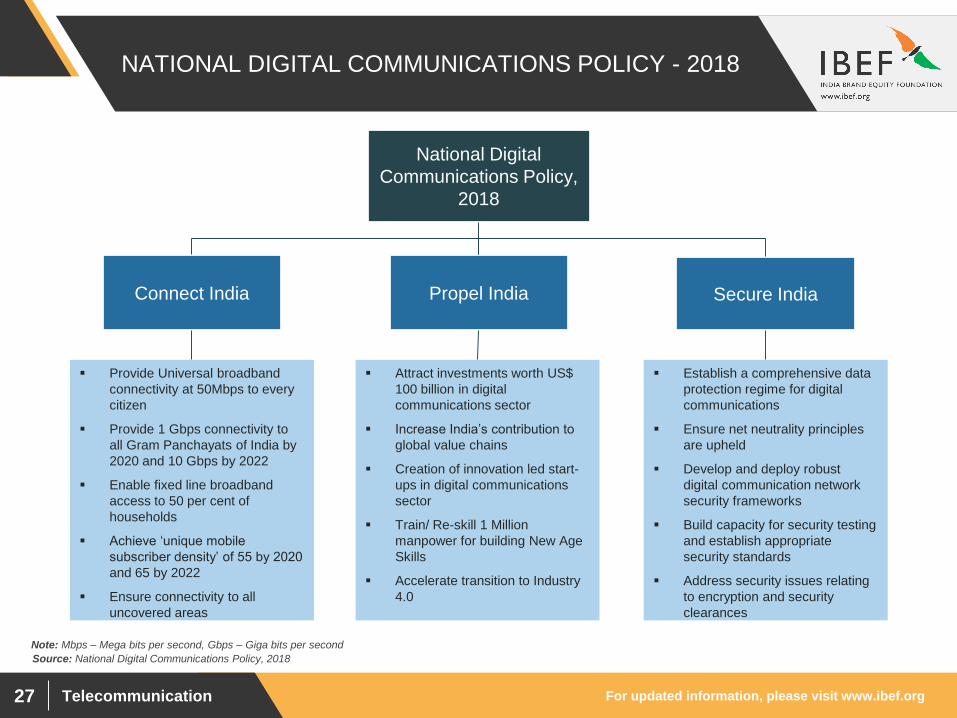
NATIONAL DIGITAL COMMUNICATIONS POLICY - 2018
Source: National Digital Communications Policy, 2018
Note: Mbps – Mega bits per second, Gbps – Giga bits per second
National Digital
Communications Policy,
2018
Connect India Propel India Secure India
Provide Universal broadband
connectivity at 50Mbps to every
citizen
Provide 1 Gbps connectivity to
all Gram Panchayats of India by
2020 and 10 Gbps by 2022
Enable fixed line broadband
access to 50 per cent of
households
Achieve ‘unique mobile
subscriber density’ of 55 by 2020
and 65 by 2022
Ensure connectivity to all
uncovered areas
Attract investments worth US$
100 billion in digital
communications sector
Increase India’s contribution to
global value chains
Creation of innovation led start-
ups in digital communications
sector
Train/ Re-skill 1 Million
manpower for building New Age
Skills
Accelerate transition to Industry
4.0
Establish a comprehensive data
protection regime for digital
communications
Ensure net neutrality principles
are upheld
Develop and deploy robust
digital communication network
security frameworks
Build capacity for security testing
and establish appropriate
security standards
Address security issues relating
to encryption and security
clearances
For updated information, please visit www.ibef.orgTelecommunication28
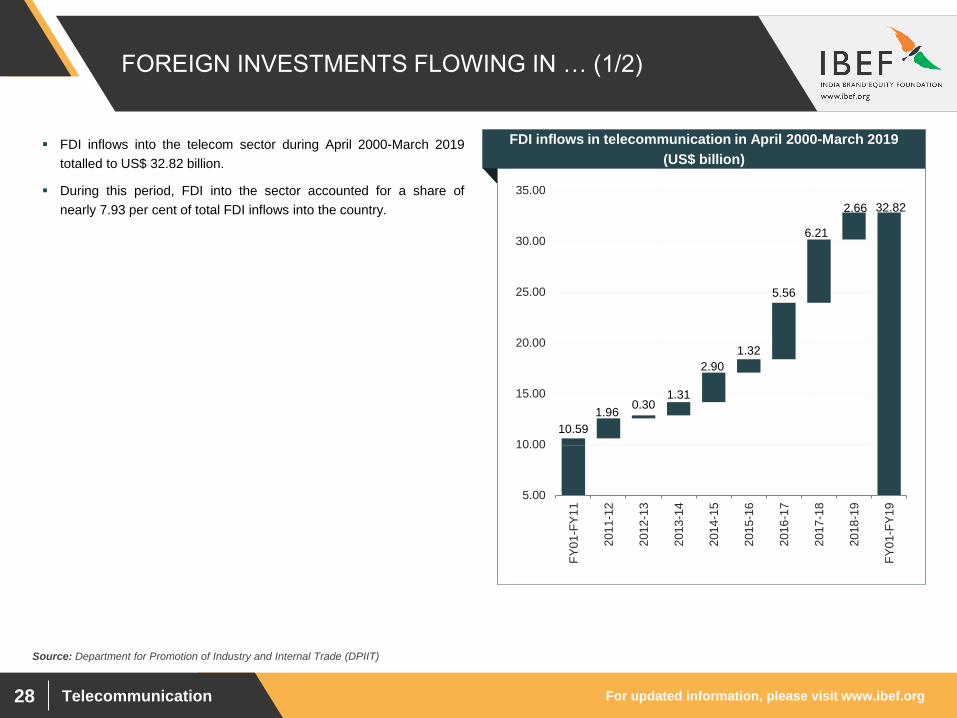
FOREIGN INVESTMENTS FLOWING IN … (1/2)
Source: Department for Promotion of Industry and Internal Trade (DPIIT)
FDI inflows into the telecom sector during April 2000-March 2019
totalled to US$ 32.82 billion.
During this period, FDI into the sector accounted for a share of
nearly 7.93 per cent of total FDI inflows into the country.
Visakhapatnam port traffic (million tonnes)FDI inflows in telecommunication in April 2000-March 2019
(US$ billion)
1.960.30
1.31
2.90
1.32
5.56
6.21
2.66
10.59
32.82
5.00
10.00
15.00
20.00
25.00
30.00
35.00
FY
01-F
Y1
1
201
1-1
2
201
2-1
3
201
3-1
4
201
4-1
5
201
5-1
6
201
6-1
7
201
7-1
8
201
8-1
9
FY
01-F
Y1
9

For updated information, please visit www.ibef.orgTelecommunication29
FOREIGN INVESTMENTS FLOWING IN … (2/2)
Source: Thomson Banker, Deal Tracker, Grant Thornton, TechSci Research
Vodafone India and Idea Cellular have merged into ‘Vodafone Idea’ to become India’s largest telecom company, as of September 2018.
Target Acquirer Acquisition price (US$ million) Division acquired
Bharti Airtel Singtel (as of February 2019) 367.15Increase in stake to 48.90 per
cent
Bharti Airtel Singtel (2018) 411.02Increase in stake to 48.90 per
cent
Ascend Telecom
Infrastructure Pvt. Ltd.IDFC Alternatives (2017) 54.29 33 per cent stake
Telenor Bharti Airtel (2017) N/A Infrastructure and Contracts
Bharti Airtel's operations in
Burkina Faso and Sierra Leone Orange SA (2016) 900 100 per cent stake
MTS Reliance Communication (2015) 736.98 8 – 10 per cent stake
Augere Wireless Bharti Airtel (2015) 21.3 100 per cent stake
Bharti Airtel SingTel(2013) 302Increases stakes to 32.34 per
cent
Bharti Airtel Qatar Foundation Endowment(2014) 1,260 PE deal – 5 per cent stake
Vodafone India LtdVodafone International Holdings
(2014)1,641 Increases stakes to 100 per cent
Ascend Telecom Ascend Telecom Infrastructure Pvt Ltd 54.29 33 per cent stake
Foreign investment in India
Notes: M&A - Merger and Acquisition, PE - Private Equity

Telecommunication
OPPORTUNITIES
For updated information, please visit www.ibef.orgTelecommunication31
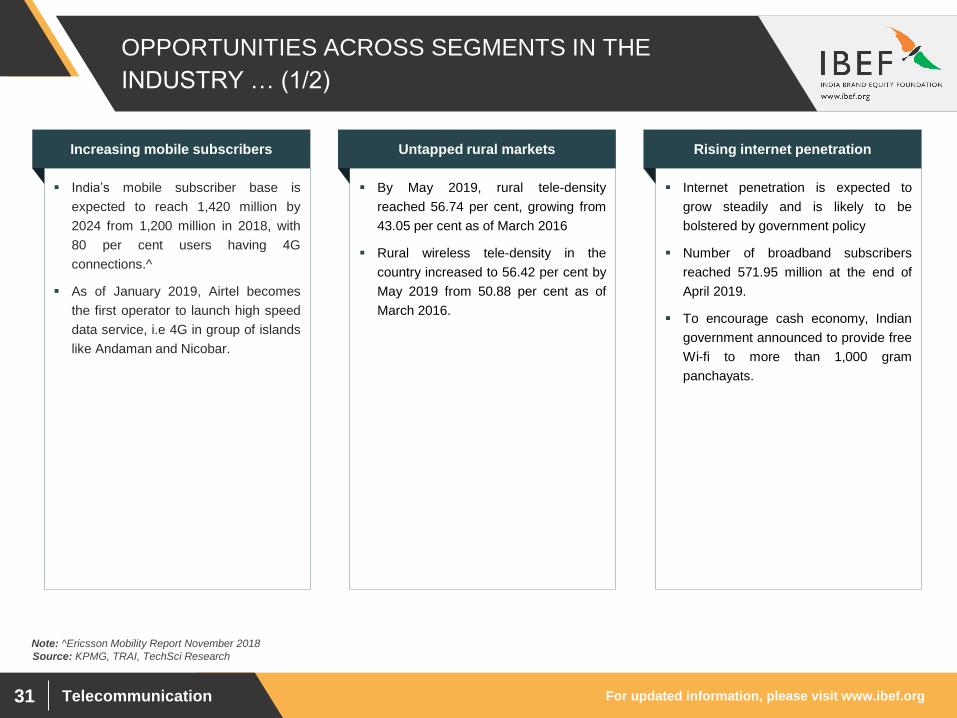
OPPORTUNITIES ACROSS SEGMENTS IN THE
INDUSTRY … (1/2)
India’s mobile subscriber base is
expected to reach 1,420 million by
2024 from 1,200 million in 2018, with
80 per cent users having 4G
connections.^
As of January 2019, Airtel becomes
the first operator to launch high speed
data service, i.e 4G in group of islands
like Andaman and Nicobar.
Increasing mobile subscribers
By May 2019, rural tele-density
reached 56.74 per cent, growing from
43.05 per cent as of March 2016
Rural wireless tele-density in the
country increased to 56.42 per cent by
May 2019 from 50.88 per cent as of
March 2016.
Untapped rural markets
Internet penetration is expected to
grow steadily and is likely to be
bolstered by government policy
Number of broadband subscribers
reached 571.95 million at the end of
April 2019.
To encourage cash economy, Indian
government announced to provide free
Wi-fi to more than 1,000 gram
panchayats.
Rising internet penetration
Source: KPMG, TRAI, TechSci Research
Note: ^Ericsson Mobility Report November 2018

For updated information, please visit www.ibef.orgTelecommunication32
OPPORTUNITIES ACROSS SEGMENTS IN THE
INDUSTRY … (2/2)
TRAI has made several
recommendations for the
development of telecom
infrastructure, including tax
benefits and recognising
telecom infrastructure as
essential infrastructure
Development of telecom
infrastructure
The Indian Mobile Value-
Added Services (MVAS)
industry is expected to row
at a CAGR of 18.3 per cent
during the forecast period
2015–2020 and reach US$
23.8 billion by 2020.
Growth in MVAS and cloud
computing
Telecom equipment market
is expected to reach US$ 30
billion by 2020.
In October 2018, telecom
equipment producers
committed over Rs 4,000
crore (US$ 554 million)
worth of investments at the
Indian Mobile Congress.
Further, in October 2018,
Swedish communications
major Ericsson commenced
exports of 5G-ready
telecom equipment from the
country.
Telecom equipment market
In order to overcome the
cash related problems being
faced by people, due to
demonetisation, Paytm
launched a service through
which consumers and
merchants can pay and
receive money instantly,
without an internet
connection
This has enabled non-
smartphone users to go
cashless.
Value of Unified Payments
Interface (UPI) transactions
grew to more than Rs 82
crore (US$ 11.73 million) in
July 2019.
Growing Cashless
Transactions
Source: Press Information Bureau, Government of India, TechSci Research
Notes: VAS - Value-Added Services, NTP - National Telecom Policy, * - as per IDC, ^ - as per Electronics Industry Associations

For updated information, please visit www.ibef.orgTelecommunication33
MOBILE APPLICATION MARKET: FAST GROWING
SEGMENT
6.5
1
12
.07
18
.11
37
.20
0.00
5.00
10.00
15.00
20.00
25.00
30.00
35.00
40.00
201
6
201
7
201
8F
202
2F
Source: Gartner, Deloitte, Assorted News Articles, App Annie, TechSci Research
In 2017, India surpassed USA to become the second largest market
in terms of number of app downloads.
App downloads in the country increased from 6.51 billion in 2016 to
12.07 billion in 2017.
Moreover, during the first quarter of 2018, India became the world’s
fastest-growing market for mobile applications. The country
remained as the world’s fastest growing market for Google Play
downloads in the second and third quarter of 2018.
App downloads in India are expected to increase to 18.11 billion in
2018F and 37.21 billion in 2022F.
The segment’s growth is expected to be driven by increasing mobile
connections and availability of low-range smartphones
Over 100 million apps are downloaded every month across different
platforms such as iOS, Blackberry, Nokia and Android
As of January 2019, India has witnessed a 165 per cent growth in
app downloads in the past two years.
4.8 billion downloads of mobile applications was registered in India in
three months of 2019 at the end of March 2019.
Visakhapatnam port traffic (million tonnes)App downloads^ in India (in billions)
Notes: F – Forecast, *As per latest data available, ^Combined iOS App Store, Google Play and third-party android
Telecommunication
KEY INDUSTRY
ORGANISATIONS
For updated information, please visit www.ibef.orgTelecommunication35
INDUSTRY ORGANISATIONS
Address: B-601, Gauri Sadan 5, Hailey Road, New Delhi – 110 001,
India
Tel: 91 11 23358585
Fax: 91 11 23327397
Website: http://www.auspi.in/
Association of Unified Telecom Service Providers of India
(AUSPI)
Address: 601, Nirmal Tower, 26, Barakhamba Road, Connaught Place,
New Delhi – 110 001, India
Tel.: 91 11 43565353 / 43575353
Fax: 91 11 43515353
E-mail: [email protected]
Website: www.acto.in
Association of Competitive Telecom Operators (ACTO)
Address: F-36, Basement, East of Kailash, New Delhi – 110 065, India
Tel: 91 11 46570328
E-mail: [email protected]
Website: www.iamai.in
Internet and Mobile Association of India (IAMAI)
Address: 14, Bhai Vir Singh Marg, Sector 4, Gole Market, New Delhi –
110001, India
Tel: 91 11 2334 9275
E-mail: [email protected]
Website: www.coai.com
Cellular Operators Association of India

Telecommunication
USEFUL
INFORMATION
For updated information, please visit www.ibef.orgTelecommunication37
GLOSSARY
BWA: Broadband Wireless Access
CAGR: Compound Annual growth rate
DoT: Department of Telecommunication
FDI: Foreign Direct Investment
FTTH: Fibre To The Home
FY: Indian Financial Year (April to March)
IMF: International Monetary Fund
INR: Indian Rupee
IPTV: Internet Protocol Television
M&A: Mergers and Acquisitions
MoU: Minutes of Use per month and per subscriber
MPEG: Moving Picture Experts Group
OFC: Optical Fibre Cable
TRAI: Telecom Regulatory Authority of India
USOF: Universal Service Obligation Fund
US$: US Dollar
VAS: Value-Added Services
WiMAX: Worldwide Interoperability for Microwave access telecommunications
Wherever applicable, numbers have been rounded off to the nearest whole number

For updated information, please visit www.ibef.orgTelecommunication38
EXCHANGE RATES
Exchange Rates (Fiscal Year) Exchange Rates (Calendar Year)
Year INR INR Equivalent of one US$
2004–05 44.95
2005–06 44.28
2006–07 45.29
2007–08 40.24
2008–09 45.91
2009–10 47.42
2010–11 45.58
2011–12 47.95
2012–13 54.45
2013–14 60.50
2014-15 61.15
2015-16 65.46
2016-17 67.09
2017-18 64.45
2018-19 69.89
Year INR Equivalent of one US$
2005 44.11
2006 45.33
2007 41.29
2008 43.42
2009 48.35
2010 45.74
2011 46.67
2012 53.49
2013 58.63
2014 61.03
2015 64.15
2016 67.21
2017 65.12
2018 68.36
Source: Reserve Bank of India, Average for the year

For updated information, please visit www.ibef.orgTelecommunication39
DISCLAIMER
India Brand Equity Foundation (IBEF) engaged TechSci Research to prepare this presentation and the same has been prepared by TechSci
Research in consultation with IBEF.
All rights reserved. All copyright in this presentation and related works is solely and exclusively owned by IBEF. The same may not be reproduced,
wholly or in part in any material form (including photocopying or storing it in any medium by electronic means and whether or not transiently or
incidentally to some other use of this presentation), modified or in any manner communicated to any third party except with the written approval
of IBEF.
This presentation is for information purposes only. While due care has been taken during the compilation of this presentation to ensure that the
information is accurate to the best of TechSci Research and IBEF’s knowledge and belief, the content is not to be construed in any manner
whatsoever as a substitute for professional advice.
TechSci Research and IBEF neither recommend nor endorse any specific products or services that may have been mentioned in this presentation
and nor do they assume any liability or responsibility for the outcome of decisions taken as a result of any reliance placed on this presentation.
Neither TechSci Research nor IBEF shall be liable for any direct or indirect damages that may arise due to any act or omission on the part of the user
due to any reliance placed or guidance taken from any portion of this presentation.