telangana state at a...
TRANSCRIPT

1
Sl. No.
Item Page Nos.
I Administrative Setup 1-3
II Demography 4-15
III State Economy 16
IV Rainfall 17
V Agriculture 17-20
VI Land Holdings 21
VII Forest 21
VIII Source wise Irrigation 22
IX Animal Husbandry 23
X Live-Stock 23-24
XI Fisheries 24
XII Energy 25
XIII Education 26-32
XIV Medical 33-34
XV Transport 35-36
TELANGANA STATE AT A GLANCE
Sl. No.
Item Page Nos.
XVI Communication 37
XVII Banking 38
XVIII Industries 38
XIX Economic Census 39
XX Self Help Groups 40
XXI Prison Particulars 40
XXII Minerals 41-42
XXIII Agriculture Market Committees
43
XXIV Tourism 43
XXV Women & Child Welfare
44
XXVI Rural Water Supply & Sanitation
44
XXVII Bifurcation Particu-lars of Khammam District
46

1
Telangana State at a Glance
Sl. No.
Item Unit
1 Geographical Area
a) All India Sq.Kms. 32,87,469
b) State Sq.Kms. 1,14,840
c) State Rank No. 12th
2 Districts
a) All India Nos. 640
b) State Nos. 10
3 Revenue Divisions in the State Nos. 42
4 Urban Local Bodies Nos. 68
a) Municipal Corporations Nos. 6
b) Municipalities Nos. 37
c) Nagara Panchayaths Nos. 25
5 Zilla Praja Parishads Nos. 9
6 Mandal Praja Parishads Nos. 438
7 Gram Panchayaths Nos. 8691
8 Revenue Mandals Nos. 459

2
Sl. No.
Item Unit
% Distribution over
State All India
9 Revenue Villages Nos. 10,437 100.00
Inhabited Villages Nos. 9,834 94.22
Un-inhabited Villages Nos. 603 5.78
10 Population - Group-wise Distribution of Villages
Villages
< 200 Population Nos. 346 3.51 0.98
200 to 499 Nos. 870 8.85 4.76
500 to 999 Nos. 1,733 17.63 12.39
1000 to 1999 Nos. 3,029 30.80 23.70
2000 to 4999 Nos. 3,104 31.56 34.63
5000 to 9999 Nos. 630 6.41 14.86
>10000 Nos. 122 1.24 8.68
Total Nos. 9,834 100.00 100.00

3
11. PUBLIC REPRESENTATIVES
Sl. No.
Item No.
a Member of Parliament (Rajya Sabha)
7
b Member of Parliament (Lok Sabha)
17
c Members of Legislative Council (MLCs)
30+3* = 33
d Members of Legislative Assembly (MLAs)
119+1* = 120
e Zilla Parishad Territorial Constituency Members (ZPTCs)
438
f Mandal Parishad Presidents (MPPs)
438
g Mandal Parishad Territorial Constituency Members (MPTCs)
6456
h Sarpanchas 8691
* Nominated

4
12. HOUSEHOLDS (HHS)
Sl. No.
Item Unit
% Distribution over
State All
India
Households (HHs)
a) All India - Total Nos. 24,94,54,252
Rural Nos. 16,85,65,486 67.57
Urban Nos. 8,08,88,766 32.43
b) State - Total Nos. 83,57,826
Rural Nos. 52,23,243 62.50
Urban Nos. 31,34,583 37.50
HHs Decadal Growth Rate (2001-11)
% 28.10 22.40
HHs having tap water from treated sources
Lakh Nos.
41.56 49.72 32.0
HHs having Latrines within Premises
Lakh Nos.
44.16 52.84 46.9
Household Size
a) All India Nos. 4.85
b) State Nos. 4.21

5
Sl. No.
Item Unit
% Over Total
State All
India
A Total Population (as per 2011 Census)
a) All India - Total Nos. 1,21,05,69,573
Male Nos. 62,31,21,843 51.47
Female Nos. 58,74,47,730 48.53
b) State - Total Nos. 3,51,93,978
Male Nos. 1,77,04,078 50.30
Female Nos. 1,74,89,900 49.70
c) State Rank No. 12th
Rural Population Nos. 2,15,85,313 61.33 68.85
Urban Population Nos. 1,36,08,665 38.67 31.15
B Density of Population (Per Sq. Km.)
a) All India Nos. 382
b) State Nos. 307
Highest-> Hyderabad Nos. 18,172
Lowest -> Adilabad Nos. 170
13. TOTAL POPULATION

6
Sl.
No. Item Unit
C Decadal Growth Rate (2001-11)
a) All India % 17.69
b) State % 13.58
Highest —> Rangareddy % 48.16
Lowest —> Hyderabad % 2.97
D Sex Ratio (Female Per 1000 Males)
a) All India Nos. 943
b) State Nos. 988
Sl. No.
Item Unit
% Distribution over
State All India
E Literacy - Total Lakh Nos. 207.84 66.46 73.00
Male Literacy Lakh Nos. 117.49
Female Literacy Lakh Nos. 90.35
Rural Literacy Rate % 57.30 67.80
Urban Literacy Rate % 81.10 84.10

7
Sl. No.
Item Unit
% Distribution over
State All India
F Age Group-wise Distribution of Population: All
0-4 Years Lakh Nos. 26.88 7.64 9.32
5-14 Years Lakh Nos. 56.98 19.03 10.48
15-19 Years Lakh Nos. 35.15 9.99 9.95
20-24 Years Lakh Nos. 33.30 9.46 9.20
25-29 Years Lakh Nos. 33.13 9.41 8.38
30-34 Years Lakh Nos. 27.54 7.83 7.32
35-39 Years Lakh Nos. 26.58 7.55 7.03
40-49 Years Lakh Nos. 39.45 11.21 11.13
50-59 Years Lakh Nos. 25.41 7.22 7.29
60 + Years Lakh Nos. 32.70 9.29 8.58
Age not stated Lakh Nos. 4.82 1.37 0.37
Total Lakh Nos. 351.94 100.00 100.00

8
Sl. No.
Item Unit
% Distribution over
State All
India
14 RURAL POPULATION
Male Lakh Nos. 107.97 50.02
Female Lakh Nos. 107.88 49.98
Total Lakh Nos. 215.85 100.00
Decadal Growth Rate % 2.13 12.30
Sex Ratio - Rural
a) All India Nos. 949
b) State Nos. 999
15 URBAN POPULATION
Male Lakh Nos. 69.07 50.75
Female Lakh Nos. 67.02 49.25
Total Lakh Nos. 136.09 100.00
Decadal Growth Rate (2001-2011)
% 38.12 31.80
Sex Ratio - Urban
a) All India Nos. 929
b) State Nos. 970

9
Sl. No.
Item Unit
% Distribu-tion over
State All
India
A Total Population (as per 2011 Census)
a) All India - Total Nos. 20,13,78,086 16.6
Male Nos. 10,35,35,165
Female Nos. 9,78,42,921
b) State - Total Nos. 54,32,680 15.44
Male Nos. 27,04,932
Female Nos. 27,27,748
B Sex Ratio
a) All India Nos. 945
b) State Nos. 1008
Rural Population Nos. 40,96,123 61.33
Urban Population Nos. 13,36,557 38.67
Highest -> Karimnagar % 18.80
Lowest -> Hyderabad % 6.30
16. SCHEDULED CASTES POPULATION

10
Sl.
No. Item Unit
% Distribution over
State All India
C Age Group-wise Population Scheduled Castes
0-4 Years Lakh Nos. 4.00 7.37 9.92
5-14 Years Lakh Nos. 10.69 19.67 22.85
15-19 Years Lakh Nos. 5.74 10.57 10.38
20-24 Years Lakh Nos. 5.37 9.88 9.35
25-29 Years Lakh Nos. 4.99 9.19 8.33
30-34 Years Lakh Nos. 4.04 7.44 7.04
35-39 Years Lakh Nos. 4.03 7.42 6.84
40-49 Years Lakh Nos. 5.97 11.00 10.50
50-59 Years Lakh Nos. 3.85 7.09 6.62
60 + Years Lakh Nos. 4.98 9.16 7.81
Age not stated Lakh Nos. 0.66 1.21 0.36
Total Lakh Nos. 54.32 100.00 100.00

11
Sl. No.
Item Unit
% Distribution over
State All
India
A A) Total Population (as per 2011 Census)
a) All India - Total Nos. 10,42,81,034 8.6
Male Nos. 5,24,09,823
Female Nos. 5,18,71,211
b) State - Total Nos. 32,86,928 9.34
Male Nos. 16,59,963
Female Nos. 16,26,965
B Sex Ratio
a) All India Nos. 990
b) State Nos. 980
Rural Population Nos. 29,39,027 89.42
Urban Population Nos. 3,47,901 10.58
Highest->Khammam % 27.40
Lowest ->Hyderabad % 1.20
17. SCHEDULED TRIBES POPULATION

12
Sl.
No. Item Unit
% Distribution over
State All India
C Age Group-wise Population Scheduled Tribes
0-4 Years Lakh Nos. 2.92 8.87 11.04
5-14 Years Lakh Nos. 7.80 23.72 24.37
15-19 Years Lakh Nos. 3.42 10.40 10.08
20-24 Years Lakh Nos. 3.02 9.19 8.98
25-29 Years Lakh Nos. 2.98 9.06 8.02
30-34 Years Lakh Nos. 2.44 7.42 6.87
35-39 Years Lakh Nos. 2.27 6.92 6.57
40-49 Years Lakh Nos. 3.20 9.73 10.46
50-59 Years Lakh Nos. 1.95 5.94 6.46
60 + Years Lakh Nos. 2.49 7.59 6.88
Age not stated Lakh Nos. 0.38 1.16 0.27
Total Lakh Nos. 32.87 100.00 100.00

13
18. CHILD POPULATION (0-6 years) - ALL
Sl. No.
Item Unit
% Distribution over Total Population
State All India
A Child Population (0-6 years) - ALL
Lakh Nos. 39.2 11.14 13.60
Male Lakh Nos. 20.28
Female Lakh Nos. 18.92
B Sex Ratio
a) All India Nos. 919
b) State Nos. 933
SC Child Population Lakh Nos. 5.88 15.00 17.75
ST Child Population Lakh Nos. 4.34 11.07 10.18

14
19.GREATER HYDERABAD MUNICIPAL CORPORATION (GHMC)
Sl. No.
Item Unit % Distribution
over GHMC Population
A Population Lakh Nos. 77.49
Male Lakh Nos. 39.85
Female Lakh Nos. 37.64
B Sex Ratio Nos. 945
C Literacy Lakh Nos. 57.36 82.92
Male Literacy Lakh Nos. 30.64 86.16
Female Literacy Lakh Nos. 26.72 79.51
D 0-6 Years Lakh Nos. 8.31
Male Lakh Nos. 4.28
Female Lakh Nos. 4.03
E Child Sex Ratio Nos. 943

15
20. WORK PARTICIPATION
Sl. No.
Item Unit
% Over Total Population
State All
India
A Total Workers Lakh Nos. 164.53 46.75 39.8
% to Total Population
Rural Lakh Nos. 114.39 69.53
Urban Lakh Nos. 50.14 30.47
Total Lakh Nos. 164.53 100.00
B Main Workers Lakh Nos. 138.06 83.91
C Marginal Workers Lakh Nos. 26.47 16.09
Total Lakh Nos. 164.53 100.00
16
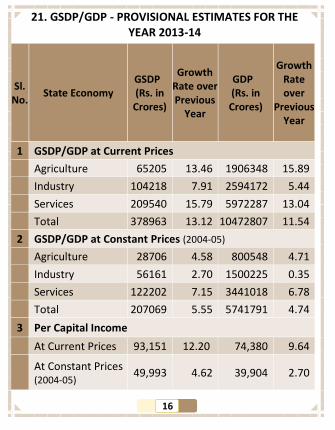
Sl. No.
State Economy GSDP (Rs. in Crores)
Growth Rate over Previous
Year
GDP (Rs. in Crores)
Growth Rate over
Previous Year
1 GSDP/GDP at Current Prices
Agriculture 65205 13.46 1906348 15.89
Industry 104218 7.91 2594172 5.44
Services 209540 15.79 5972287 13.04
Total 378963 13.12 10472807 11.54
2 GSDP/GDP at Constant Prices (2004-05)
Agriculture 28706 4.58 800548 4.71
Industry 56161 2.70 1500225 0.35
Services 122202 7.15 3441018 6.78
Total 207069 5.55 5741791 4.74
3 Per Capital Income
At Current Prices 93,151 12.20 74,380 9.64
At Constant Prices (2004-05)
49,993 4.62 39,904 2.70
21. GSDP/GDP - PROVISIONAL ESTIMATES FOR THE YEAR 2013-14

17
22. ANNUAL RAINFALL : 2013-14 Sl.
No. Item Unit %
Normal Rainfall mm 906.6
Actual Rainfall mm 1,212.2
% Deviation 33.71
23. AGRICULTURE : 2013-14
A LAND UTILISATION PARTICULARS
a) Forest Area ‘000 Hect. 2742 23.9
b) Barren and Uncultivable Land ‘000 Hect. 615 5.4
c) Land Put to Non Agr. Uses ‘000 Hect. 895 7.8
d) Culturable Waste ‘000 Hect. 178 1.6
e) Permanent Pastures & other Grazing Lands
‘000 Hect. 302 2.6
f) Land Under Misc. Tree Crops & Groves not incl.in Net Area Sown
‘000 Hect. 114 1.0
g) Other Fallow Lands ‘000 Hect. 717 6.2
h) Current fallow Lands ‘000 Hect. 960 8.3
i) Net Area Sown ‘000 Hect. 4961 43.2
Total Geographical area ‘000 Hect. 11484 100.00
j) Area Sown More Than Once ‘000 Hect. 1327 11.6
Total Cropped Area ‘000 Hect. 6288 54.7
18
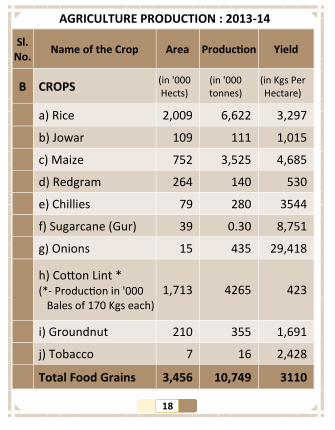
Sl. No.
Name of the Crop Area Production Yield
B CROPS (in '000 Hects)
(in '000 tonnes)
(in Kgs Per Hectare)
a) Rice 2,009 6,622 3,297
b) Jowar 109 111 1,015
c) Maize 752 3,525 4,685
d) Redgram 264 140 530
e) Chillies 79 280 3544
f) Sugarcane (Gur) 39 0.30 8,751
g) Onions 15 435 29,418
h) Cotton Lint * (*- Production in '000 Bales of 170 Kgs each)
1,713 4265 423
i) Groundnut 210 355 1,691
j) Tobacco 7 16 2,428
Total Food Grains 3,456 10,749 3110
AGRICULTURE PRODUCTION : 2013-14

19
Sl. No.
Source Area
(in Hectares)
Production (in Metric Tonnes)
a Fruits 4,26,099 46,74,208
b Vegetables 3,47,293 49,99,519
c Flowers 8,405 42,774
d Plantation Crops 24,288 1,90,336
e Spices 2,71,347 13,27,937
f Medicinal & Aromatic Plants
8,070 21,616
Total 10,85,502 112,56,389
24. AREA AND PRODUCTION OF HORTICULTURE CROPS: 2013-14

20
25. WORLD AGRICULTURAL CENSUS, 2010-11
Sl. No.
Item Unit % over State
A Operational Holdings
a) Scheduled Castes Lakh Nos. 7.44 13.40
b) Scheduled Tribes Lakh Nos. 6.72 12.10
c) Other Social Groups Lakh Nos. 41.38 74.50
e) Institutional Nos. 800 N
Total Lakh Nos. 55.54 100.00
B Area Operated
a) Scheduled Castes Lakh Hect. 5.88 9.48
b) Scheduled Tribes Lakh Hect. 7.71 12.44
c) Others Lakh Hect. 48.28 77.91
d) Institutional Lakh Hect. 0.10 0.17
Total Lakh Hect. 61.97 100.00
N : Negligible

21
Sl. No.
Category No. of
Holdings (in Lakhs)
%
Area Operated
(in Lakh Hect.)
%
1 MARGINAL ( < 1 Hect.)
34.41 61.96 15.67 25.28
2 SMALL ( 1 - 2 Hect.)
13.27 23.90 18.69 30.17
3 SEMI-MEDIUM ( 2 - 4 Hect.)
6.03 10.86 15.85 25.58
4 MEDIUM ( 4 - 10 Hect.)
1.67 3.00 9.27 14.96
5 LARGE ( > 10 Hect.)
0.16 0.28 2.49 4.01
Total 55.54 100.0 61.97 100.00
26. CATEGORY WISE LAND HOLDINGS AND AREA OPERATED
27. FOREST AREA : 2013-14
Unit Area
a Reserved Sq.Kms. 21,024.05
b Protected Sq.Kms. 7,468.48
c Unclassified Sq.Kms. 749.55
Total Forest Area Sq.Kms. 29,242.08

22
Sl. No.
Source Area in Lakh Hec-
tares % over Total
Irrigated Area
a Canals 2.90 12.67
b Tanks 2.30 10.05
c Ground Water 17.12 74.79
d Others 0.57 2.49
Total 22.89 100.00
Micro Irrigation
a Area Under Drip 3.56 74.17
b Area Under Sprinklers
1.24 25.83
Total 4.80 100.00
28. SOURCE WISE IRRIGATED AREA : 2013-14

23
29. ANIMAL HUSBANDRY, 2013-14
Sl. No.
Item Unit
a Veterinary Polyclinics Nos. 8
b Veterinary Hospitals Nos. 101
c Veterinary Dispensaries Nos. 917
d Rural Livestock Units including Mobile Veterinary Clinics
Nos. 1,105
e Artificial Insemination Centres Nos. 3,624
f Area Brought under Fodder Development
Lakh Acres
4.27
Sl. No.
Name of the Product Unit Production
1 Milk In ‘000 Tonnes 3,924
2 Eggs In Lakh Nos. 1,00,606
3 Meat In ‘000 Tonnes 446
4 Chicken In ‘000 Tonnes 216
30. PRODUCTION OF LIVESTOCK : 2013-14
24
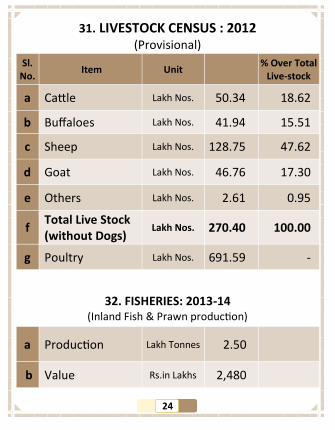
31. LIVESTOCK CENSUS : 2012 (Provisional)
Sl. No.
Item Unit % Over Total
Live-stock
a Cattle Lakh Nos. 50.34 18.62
b Buffaloes Lakh Nos. 41.94 15.51
c Sheep Lakh Nos. 128.75 47.62
d Goat Lakh Nos. 46.76 17.30
e Others Lakh Nos. 2.61 0.95
f Total Live Stock (without Dogs)
Lakh Nos. 270.40 100.00
g Poultry Lakh Nos. 691.59 -
32. FISHERIES: 2013-14 (Inland Fish & Prawn production)
a Production Lakh Tonnes 2.50
b Value Rs.in Lakhs 2,480

25
33. ENERGY : 2013-14
Sl.
No. Item Unit
1 Electricity Consumption
a Domestic Connections Lakh Nos. 80.42
b Industrial & Other Connections Lakh Nos. 19.86
c Agriculture Connections Lakh Nos. 18.96
2 Total Low Tension Lakh KWHs 179.56
3 Total High Tension Lakh KWHs 51.65
4 Per Capita Consumption
(Domestic) KWHs 197
5 Per Capita Consumption
(Agriculture) KWHs 245
6 Per Capita Consumption
(Industrial including cottage & HT) KWHs 344

26
34. EDUCATION : 2013-14
Sl. No.
Item Unit Institu-
tions Enrollment
1 RECOGNISED INSTITUTIONS
a Primary Schools (I-V) Nos. 25,331 24,03,000
b Primary with Upper Primary (I-VII/VIII)
Nos. 6,883 10,35,000
c Primary with Upper Primary, Secondary & Higher Secondary Schools (I-XII)
Nos. 123 88,000
d Upper Primary with Secondary & Higher Secondary Schools (VI-XII)
Nos. 202 58,000
e Primary with Upper Primary & Secondary Schools (I-X)
Nos. 817 3,23,000
f Upper Primary with Secondary Schools (VI-X)
Nos. 9,937 22,71,000

27
Sl. No.
Item Unit Institu-tions
Enrolment
g Deaf & Dumb Schools Nos. 9 907
h Mentally Retarded Nos. 2 362
i Oriental Schools (Hindi Maha Vidyalaya & Sanskrit Patashalas)
Nos. 5 581
j Blind Schools Nos. 16 1028
Total Nos. 43,325 61,80,878
Sl.
No. Item Unit Hostels Students
2 Hostels
a SC Welfare Hostels Nos. 801 69,093
b ST Welfare Hostels Nos. 214 44,404
c BC Welfare Hostels Nos. 741 57,384
d Ashram Schools Nos. 281 82,155

28
Sl. No.
Item Cate-gory
Unit Enrol-ment
3 Gross Enrolment Ratio
a Class I-V (All) (I -V enrolment/Child Population of 6-10 years)*100
All % 104.93
SC % 117.33
ST % 125.18
b Class VI-VIII (VI -VIII enrolment/Child Population of 11-13 years)*100
All % 83.78
SC % 93.02
ST % 83.20
c Class IX-X (IX –X enrolment/Child Population of 11-13 years)*100
All % 72.20
SC % 79.53
ST % 63.12
4 Drop Out Rate
a Class I-V (All) % 22.32
b Class I-VIII (All) % 32.56
c Class I-X (All) % 38.21

29
Sl. No.
Item Unit
5 TEACHER PUPIL RATIO (INCLUDING VIDYA VOLUNTEERS)
a Primary Schools (I-V) Nos. 29
b Primary with Upper Primary Schools (I-VII/VIII)
Nos. 24
c Primary with Upper Primary, Secondary & Higher Secondary Schools (I-XII)
Nos. 39
d Upper Primary with Secondary & Higher Secondary Schools (VI-XII)
Nos. 31
e Primary with Upper Primary & Secondary Schools (I-X)
Nos. 39
f Upper Primary with Secondary Schools (VI-X)
Nos. 24

30
Sl.
No. Item Unit Institutions Enrolment
6 Junior Colleges Nos. 3,007 4,15,026
7 Degree Colleges Nos. 171 1,47,564
8 PROFESSIONAL COLLEGES : 2013-14
a Medical Colleges Nos. 20 2,850
b Dental Colleges Nos. 11 920
c Engineering Colleges Nos. 350 1,71,679
d Pharmacy Colleges Nos. 166 17,760
e Polytechnics Nos. 180 45,250
f M.B.A. Colleges Nos. 444 49,560
g M.C.A. Colleges Nos. 120 8,216
h B.Ed. Colleges Nos. 260 26,779

31
Sl. No.
Item Unit Institu-
tions Enrol-ment
i ITI Institutions Nos. 60
j Ayurveda Colleges Nos. 5 250
k Homeopathy Colleges Nos. 2 110
L Naturopathy Colleges Nos. 1 30
m Unani Colleges Nos. 1 75
n Nursing Colleges Nos. 77 4,080
O Physiotherapy Colleges Nos. 17 800
p B.Sc.(MLT) Colleges Nos. 22 825
q DIET (Dist.Institute of Nos. 10 2,800
MLT: Medical Lab Technician

32
UNIVERSITIES IN TELANGANA STATE : 2013-14 Sl.
No. Universities
1 Prof. Jayashankar Agricultural University
2 Osmania University, Hyderabad
3 Kakatiya University, Warangal
4 Satavahana University, Karimnagar
5 Palamuru University, Mahabubnagar
6 Mahatma Gandhi University, Nalgonda
7 Telangana University, Nizamabad
8 Potti Sriramulu Telugu University, Hyderabad
9 B.R.Ambedkar Open University, Hyderabad
10 JNTU, Hyderabad
11 Rajiv Gandhi University of Knowledge Technologies, Hyd
12 JNTU Fine Arts University, Hyderabad
CENTRAL/CENTRALLY FUNDED/DEEMED UNIVERSITIES Sl.
No. Universities
1 University of Hyderabad
2 Indian Institute of Information Technology, Hyd.
3 Geetham University, Hyderabad
4 Nizam Institute of Medical Sciences, Hyderabad
5 National Institute of Technology, Warangal

33
35. MEDICAL FACILITIES
Sl.
No. Item Unit
1 ALLOPATHIC : 2012-13
a General Hospitals Nos. 86
b Allied Hospitals Nos. 94
c Hospitals for Special treatment Nos. 26
d Beds Nos. 20,450
e Govt. Doctors (Including Contract) Nos. 4,713
f Primary Health Centres Nos. 613
g Dispensaries Nos. 75
h Doctors Per Lakh Population Nos. 13
i Beds Per Lakh Population Nos. 58

34
Sl.
No. Item Unit
2 AYURVEDA: 2013-14
a Hospitals Nos. 4
b Dispensaries Nos. 460
3 HOMEOPATHY : 2013-14
a Hospitals Nos. 3
b Dispensaries Nos. 201
4 NATUROPATHY : 2013-14
a Hospitals Nos. 1
b Dispensaries Nos. 28
5 UNANI : 2013-14
a Hospitals Nos. 3
b Dispensaries Nos. 187

35
36. TRANSPORT : 2013-14
Sl.
No. Item Unit
% over
State
1 VEHICLES
a Two Wheelers Nos. 52,84,224 76.00
b Four Wheelers
(Cars & Jeeps) Nos. 8,42,062 12.70
c Goods Vehicles Nos. 3,20,836 4.66
d Auto Rickshaws Nos. 2,67,070 3.80
e Tractors/Trailers
(Comm. & Agri.) Nos. 1,06,824 1.50
f Others Nos. 31,784 0.50
g Contract Carriages Nos. 23,914 0.34
h Taxi Cabs Nos. 60,384 0.30
i Stage Carriages Nos. 15,936 0.20
Total Vehicles Nos. 6,951,109 100.00

36
Sl.
No. Item Unit
ROAD LENGTH : 2012-13
1 R & B Roads - Total Kms. 27,474
a National Highways Kms. 2,741
b State Highways Kms. 3,446
c Major Dist. Roads Kms. 12,440
d Rural Roads Kms. 8,847
National Highways: 14 NHs using a length Crossing the State
Kms. 2,423
Panchayat Raj Roads - Total Kms. 64,046
a CC +BT Roads Kms. 20,282
b WBM Roads Kms. 14,146
c Gravel Roads Kms. 14,734
d Earthen Roads Kms. 14,884
RAILWAY ROUTE Kms. 1,753.001

37
37. COMMUNICATIONS : 2013-14
Sl.
No. Item Unit
1 Post Offices
a Mukya Dak Ghar Nos. 1
b Head Post Offices Nos. 36
c Sub Post Offices Nos. 822
d Branch Post Offices Nos. 4,973
2 TELECOMMUNICATIONS: 2013-14
a Telephone exchanges Nos. 1,756
b Telephone Connections
(including WLL & Cell Phones) Nos. 7,10,106
c Public Call Offices Nos. 15,240

38
38. BANKING MARCH-2014
Sl.
No. Item Unit
1 Bank Branches Nos. 4,088
2 Deposits Rs. in Millions 28,05,535
3 Credits Rs. in Millions 30,44,645
4 Credit Deposit Ratio % 108.52
39. INDUSTRIES : 2013-14
Factories Nos. Investment (Rs. in Crores)
Employees
1 Large 536 22,379.49 98,903
2 MSME 36,993 20,561.28 5,20,996
Total 37,529 42,940.77 6,19,899

39
40. ECONOMIC CENSUS, 2012-13 (Provisional)
Sl. No.
Item Unit (%)
to Total
1 Enterprises - Total Lakh Nos. 20.86 100.00
Rural Lakh Nos. 11.81 56.6
Urban Lakh Nos. 9.05 43.4
2 Persons Employed - Total Lakh Nos. 56.12 100.00
Rural Lakh Nos. 23.50 41.9
Urban Lakh Nos. 32.62 58.1
3 Handicrafts/ Handloom Establishments
Nos. 46,041
40
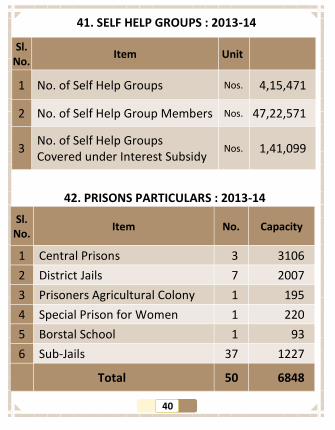
Sl. No.
Item Unit
1 No. of Self Help Groups Nos. 4,15,471
2 No. of Self Help Group Members Nos. 47,22,571
3 No. of Self Help Groups Covered under Interest Subsidy
Nos. 1,41,099
41. SELF HELP GROUPS : 2013-14
Sl. No.
Item Capacity No.
1 Central Prisons 3106 3
2 District Jails 2007 7
3 Prisoners Agricultural Colony 195 1
4 Special Prison for Women 220 1
5 Borstal School 1 93
6 Sub-Jails 37 1227
Total 50 6848
42. PRISONS PARTICULARS : 2013-14

41
Sl. No.
Mineral Unit Quantity Mineral Value
Rs. in Lakhs
FUEL MINERALS
Coal ‘000 Tonnes 50471.035 673838.79
METALLIC MINERALS
Iron Ore ‘000 Tonnes 42.287 174.07
Manganese Ore Tonnes 13684 197.73
NON-METALLIC MINERALS
Barytes Tonnes 14491 133.46
Dolomite Tonnes 586163 1901.34
Feldspar Tonnes 642549 1914.02
Fire Clay Tonnes 34 0.08
Laterite Tonnes 1767789 2042.50
Lime Stone ‘000 Tonnes 26368 34523.30
Quartz Tonnes 485982 978.43
Stowing Sand Tonnes 3488786 2441.10
W. Shale Tonnes 50600 27.15
White Clay Tonnes 81039 60.45
Major Mineral
Total 718232.43
43. PRODUCTION OF PRINCIPAL MAJOR MINERALS: 2013-14

42
Sl. No.
Mineral Unit Quantity Mineral Value
Rs. In Lakhs
B. Granite Cubic Meters 273965 105523.32
C. Granite Cubic Meters 1064082 258055.85
Gravel/ Earth Cubic Meters 23695846 61459.92
Fuller’s Earth Tonnes 407506 3170.89
L. Stone Slabs Square Meters 2583429 10051.35
Mosaic Chips Tonnes 17450 99.57
Road Metal Cubic Meters 25837530 167540.88
Ordinary Sand Cubic Meters 2800411 9922.14
615823.90 Minor Mineral Total
Grand Total
(Major + Minor) 1334056.33
PRODUCTION OF PRINCIPAL MINOR MINERALS:2013-14

43
44. AGRICULTURAL MARKET COMMITTEES
Sl.
No. Item Nos.
1 Functional Markets 64
2 Seasonal Markets 16
3 Cattle Markets 19
4 Check Posts 264
5 Rythu Bazars 30
6 Fair Price Shops 17,163
45. TOURISM : 2013-14
Sl. No.
Item Unit
a Tourist Arrivals Lakh Nos. 542.38
b Domestic Lakh Nos. 540.84
c Foreign Lakh Nos. 1.54

44
Sl. No.
Name of the Institution Unit
1 Anganwadi Centres Nos. 36031
2 Children Home for Girls Nos. 35
3 Institution for Women Nos. 13
4 Service Homes Nos. 2
5 State Home Nos. 2
6 Rescue Home No. 1
7 Home for the Aged No. 1
8 Home for the Collegiate Girls Nos. 2
9 Working Womens Hostels Nos. 5
10 Anganwadi Teachers Nos. 34196
46. Women and Child Welfare : 2014
Sl. No.
Item Unit
1 Hand Pumps Nos. 158496
2 Piped Water Supply Schemes(PWSS)
Nos. 30509
3 Comprehensive Piped Water Supply Schemes (CPWSS)
Nos. 147
4 Individual Sanitary Latrines Nos. 1739469
47.Rural Water Supply Schemes & Sanitation:2014

45
Sl. No.
Item Unit Quantity
1 Fire Stations Nos. 109
2 Job Cards issued under MGNREGS
Nos. 55,81,326
Total Rural Urban
3 a) Birth Rate
State Nos. 17.4 17.7 16.7
India Nos. 21.4 22.9 17.3
b) Death Rate
State Nos. 7.3 8.3 5.0
India Nos. 7.0 7.5 5.6
c)Infant Mortality Rate
State Nos. 39 44 29
India Nos. 40 44 27
d) Maternal Mortality Rate
Nos. 110
48. MISCELLANEOUS

46
Sl. No.
Name of the Mandal
No. of Revenue Villages
No. of Habitations
No. of GPs
1 Velairpad 21 65 9
2 Kukunoor 20 64 11
3 V.R.Puram 62 73 11
4 Chintoor 89 125 15
5 Kunavaram 56 81 16
6 Bhadrachalam * 70 126 21
7 Burgampahad * 6 14 4
Total 324 548 87
Note: * - Partial
49. Number of Revenue Villages/Habitations/GPs of Khammam Dist. Transferred to Andhra Pradesh State
Before Bifurcation
No. of Mandals
No. of Revenue Villages
No. of Habitations
No. of GPs
46 1242 3321 758
After Bifurcation
41 918 2723 671
STATEMENT SHOWING THE MANDALS, GPS & HABITATIONS OF KHAMMAM DISTRICT

47
Sl. No.
District Households Population
1 Mahaboobnagar 9.67 42.84
2 Rangareddy 16.56 61.37
3 Hyderabad 9.77 37.94
4 Medak 8.52 30.93
5 Nizamabad 6.97 24.67
6 Adilabad 8.17 28.25
7 Karimnagar 12.02 38.38
8 Warangal 10.91 36.47
9 Khammam 8.31 26.23
10 Nalgonda 11.03 35.95
Total 101.93 363.03
Average Household Size No: 3.56
Intensive Hosehold Survey (HIS) - 2014 (Samagra Kutumba Survey)