tegemeo institute of agricultural policy and development
TRANSCRIPT
�
Working Paper No 27/2006
Enhancing Access and Utilization of Quality Seed for
improved Food Security in Kenya
By
Miltone W. Ayieko and David L. Tschirley
Tegemeo Institute of Agricultural Policy and Development, Egerton University
P.O. Box 20498 Nairobi.
Tel: (020) 2717818
Email: [email protected] or [email protected]
This study is a collaboration between Tegemeo Institute/Egerton University and the Department of
Agricultural Economics at Michigan State University under the Tegemeo Agricultural Monitoring and
Policy Analysis (TAMPA) Project. Financial support for this project has been provided by the Kenyan
Mission of the United States Agency for International Development (USAID).
Egerton University
Tegemeo Institute of Agricultural
Policy and Development
2
Acknowledgement
The authors wish to thank each and every person who contributed to the various aspects
towards the preparation of this report, including the provision of crucial data and information.
In particular, the authors wish to convey special thanks to the seed companies, KEPHIS,
KARI, STAK, various seed companies and Ministry of Agriculture staff. We also wish to
acknowledge the various NGOs and donors who participated in the interviews, including
ADRA, CRS, Vegcare, CRSP, World vision, Plan International AGMARK, SACRED Africa,
and the numerous groups of farmers who provided us with data and experiences relevant to
this study. Data collection and analysis was carried out in collaboration with Mary
Kwamboka Bundi and Abel Momanyi and they are truly acknowledged

3
Abstract
Increasing agricultural productivity is central to accelerating economic growth and improving
the wellbeing of both rural and urban people in Kenya. In deed, the Kenya’s Strategy for
Revitalization of Agriculture (SRA) stresses the need to improve access to quality inputs and
financial services. Seed is among the most important productive resources that greatly affect
productivity. The challenge in Kenya today is to develop seed production and delivery
systems that encourage wider use of quality seed throughout the marketing chain. While both
the informal and informal seed systems exist in Kenya, evidence shows that vast majority of
farmers rely on the informal seed system for seed and planting material for most agricultural
commodities, and often continue to recycle seed that has been exhausted through generations
of cultivation. The result has been persistently low yields.
The overall objective of the study is to enhance seed access and utilization in Kenya. The
specific objectives were thus to: (1) assess the structure of the seed system in Kenya and
estimate the magnitude of the informal seed source; (2) assess the role of the informal seed
systems in improved seed access and utilization and how they can be integrated into the
formal seed programs; and, (3) review the seed industry regulatory and legislative framework
and propose policy options to improve availability, access and utilization of improved seed.
Data for the study is drawn from the Tegemeo Rural household panel data, the stockist
interviews and discussions with key stakeholders.
Findings of the study indicate that the informal seed system is an important source of seed for
farmers. The study identifies some successful approaches to seed access among farmers,
including positive selection, contract farming, community-based and marker-led approaches
to seed access and utilization. The study also analyses the returns to use of improved seed for
a number of crops and its implication on seed use. The seed industry and regulatory
framework is reviewed to examine bottlenecks facing private sector investment in seed
production and distribution. Policies options to establish a seed market with an effective
demand large enough to induce the needed investment and create the competition required to
establish a viable and efficient seed industry are explored.
4
Table of Contents
Page
Acknowledgement ....................................................................................................................2
Abstract.....................................................................................................................................3
Table of Contents .....................................................................................................................4
List of Tables ............................................................................................................................5
ACRONYMS............................................................................................................................6
1.0 Introduction........................................................................................................................7
1.1 Background Information..................................................................................................7
1.2 Research Questions:.........................................................................................................8
1.3 Objectives of the study.....................................................................................................9
1.4 Data and Methods ............................................................................................................9
1.5 Organization of the Paper ..............................................................................................10
2.0 Structure of the Seed Industry in Kenya .......................................................................11
2.1 The Kenya Seed System ................................................................................................11
2.2 Seed Sources for Farmers ..............................................................................................13
2.3 Seed Channels used by Farmers in Kenya.....................................................................13
2.4 Adoption of Improved Seed in Kenya ...........................................................................17
2.4.1 Factors affecting access and use of improved seed ................................................17
2.4.2 Seed Adoption.........................................................................................................22
2.5 Returns to improved seed use in Kenya.........................................................................25
3.0 Seed Access and Utilization in Kenya: working innovations?.....................................28
3.1 Horticultural crops .........................................................................................................28
3.1.1 Positive Selection in Irish Potato ............................................................................29
3.1.2 Seed access through contract farming.....................................................................32
3.2 Grains and Pulses...........................................................................................................34
3.2.1 Community-Based Seed programs .........................................................................35
3.2.2 Market-led approaches to seed access ....................................................................38
3.3 Seed access and Food Security ......................................................................................41
3.3.1 Seed Relief ..............................................................................................................42
3.3.2 Seed Vouchers and Fairs.........................................................................................43
4.0 Key Policy Lessons...........................................................................................................44
5
List of Tables
Page
Table 1: Proportion of seed made available from different sources in Kenya.......................12
Table 2: Alternative Measures of Importance of Seed Channels in Kenya.............................14
Table 3: Value share of seed sources used by farmers in Kenya, 2004...................................14
Table 4: Value shares of seed channels in Kenya by crop category........................................15
Table 5: Value shares of seed channels, by agro-regional zone in Kenya...............................16
Table 6: Value share of seed channels by household income quintiles in Kenya ...................17
Table 7: Seed demand and supply situation for selected crops in Kenya (2005) ....................18
Table 8: Distances to agricultural inputs stockists...................................................................19
Table 9: Farmers using improved maize seed in Kenya by farm size in 2004 ........................20
Table 10: Summary results on factors associated with use of purchased seed in Kenya .......24
Table 11: Regression results on returns to use of formal and informal seed in Kenya ..........26
Table 12: Seed Sources for selected Horticultural Crops ........................................................30
Table 13: Comparison of Positive Selection to other seed types.............................................32
Table 14: Type of Seed for Grains, pulses and other crops with Food Security Agenda........34
Table 15: Technology Adoption and Agricultural Input Use by Beneficiary Group ..............39
Table 16: Fertilizer and Hybrid Maize Seed Adoption and Use in Western Kenya................41
6
ACRONYMS
ADC Agricultural Development Corporation
ADRA Adventist Development and Relief Agency
AGMARK Agricultural Marketing Trust of Kenya
ALRMP Arid Lands Resource Management Programme
ARZ Agro-regional Zone
ASAL Arid and Semi Arid Lands
CB Cereal Bank
CBSP Community Based Seed Production
CIMMYT International Maize and Wheat Improvement Centre
CIP International Potato Centre
COMESA Common Market for Eastern and Southern Africa
CRS Catholic Relief Services
EAC East African Community
EUREPGAP European Retail Producer Group-Good Agricultural practices
FAO United Nations’ Food and Agriculture Organization
GOK Government of Kenya
GTZ German Technical Cooperation
HCDA Horticultural Crop Development Authority
ICRISAT International Crops Research Institute for Semi Arid Tropics
IFAD International Fund for Agricultural Development
ISTA International Seed Testing Association
KARI Kenya Agricultural Research Institute
KSC Kenya Seed Company Limited
KSU KARI Seed Unit
KENFAP Kenya National Federation of Agricultural Producers
KEPHIS Kenya Plant Health Inspectorate Services
MOA Ministry of Agriculture
NGO Non-Governmental Organization
NMK Njaa Marufuku Kenya
OPV Open Pollinated Variety
QDS Quality Declared Seed
SANSOR South Africa National Seed Organization
SRA Strategy for Revitalization of Agriculture
STAK Seed Trade Association of Kenya
SVT Seed Variety Trials
TRIPS Trade-Related Aspects of Intellectual Property
UPOV Union for the Protection of New Varieties
WTO World Trade Organization
7
1.0 Introduction
1.1 Background Information
Seed and planting materials are no doubt the most important inputs in agricultural production.
However much a farmer puts to use other productive inputs (land, fertilizer, labor etc), seed
still determines whether an output will be realized or not. The government of Kenya has been
pursuing strategies aimed at increasing agricultural productivity as this has been seen to be
central to accelerating economic growth and improving the wellbeing of both rural and urban
people in Kenya. Seed has been recognized as a core component to realizing this strategy.
Compared to other agricultural inputs, seed has been shown to have the greatest potential to
increase on-farm productivity and enhance food security (Muyanga et al, 2005). Improved
seed thus plays pivotal role in increasing agricultural productivity and thereby reduces
production costs inherent in our production systems
Two seed systems exist in Kenya, the formal and informal seed systems. While the formal
seed system is an important source of high quality certified seed, it is not able to meet the
farmers’ demand. Majority of farmers therefore rely on the informal seed system for seed
and planting material for most agricultural commodities, and often recycle seed that has been
exhausted through generations of cultivation. The result has been persistently low yields. The
challenge in the Kenyan agriculture today is to develop seed production and delivery systems
that encourage wider use of quality seed throughout the marketing chain. In deed, one of the
six fast-track activities for Kenya’s Strategy for Revitalization of Agriculture (SRA) is to
improve access to quality inputs and financial services (Republic of Kenya, 2004).
A well-functioning seed system is one that uses the appropriate combination of formal,
informal, market and non-market channels to efficiently meet farmers’ demands for quality
seeds. While the seed industry in Kenya is better developed compared to other countries
within the region, high cost of seed relative to other purchased inputs, coupled with the
inability of the formal seed system to meet the demand by farmers have been cited as
bottlenecks to the seed industry (Nyoro and Ariga, 2004). Moreover, local and international
seed companies find it unprofitable to make the investment required to provide the quantity,
quality and variety of seed needed to support an expanding agricultural base.
8
In addition, poor legislative and regulatory framework in the seed industry has adversely
affected access to improved seed and planting materials by farmers. Since the liberalization
of the seed industry in 1996, private sector participation has increased, with a number of
private seed companies being registered to produce seed, thus reducing the monopoly that the
Kenya Seed Company has enjoyed for a long time. While it was widely expected that this
would lead to improved accessibility to quality seed and hence increased efficiency,
agricultural productivity has generally been low and shown declining trends. In addition,
mechanisms to protect farmers from malpractices by the seed producers and traders have not
been adequately put in place. Farmers, therefore have no fallback position when faces with
seed crisis. Poor accessibility to information regarding demand, supply and general
performance in seed the market, were also among other constraints identified (Kamau, 2002).
The Kenya Plant Health Inspectorate Services (KEPHIS), which is charged with the
regulation of the seed industry, has also been viewed by key stakeholders to impede the
release of improved varieties from breeding programs to seed producers and eventually to
farmers. This has often worked against private sector investment in the seed sector. A study
by Tegemeo in 2002 showed that the regulatory environment and restrictions in the maize
seed industry was prominent and breeders lacked incentives from seed industry for
investment.
This study takes a look at the seed industry in Kenya with a view to understanding the
approaches that have been used to access seed by farmers in the face of an ineffective formal
seed system. The study proposes policies to help establish a seed market with an effective
demand large enough to induce the needed investment and create the competition required to
establish a viable and efficient seed industry.
1.2 Research Questions:
The study seeks to answer the following questions:
1) What proportion of farmers use improved seed for key commodities groups, and what
constraints face improved seed access and utilization in Kenya?
9
2) What seed distribution systems are working in Kenya, and why are working? What is
the role of community-based seed systems in seed production and distribution?
Specifically, how can the informal seed systems be integrated into the formal seed
system in order to enhance the availability of improved seed at the farm level?
3) What are the seed cost buildups for various commodity groups in Kenya? And, how
can the industry attract additional private investment to infuse competition that
ultimately creates conditions for reduction in seed prices?
4) What should the role of KEPHIS be in the seed industry so as to encourage private-
public sector partnership in seed development, production and distribution?
1.3 Objectives of the study
The overall objective of the study is to enhance seed access and utilization in Kenya. The
specific objectives are thus:
1) To assess the structure of the seed system in Kenya and estimate the magnitude of the
informal seed source;
2) To assess the role of the informal seed systems in improved seed access and
utilization and how they can be integrated into the formal seed programs;
3) To review the seed industry regulatory and legislative framework and propose policy
options to improve availability, access and utilization of improved seed
1.4 Data and Methods
Data for the study consisted of the Tegemeo Rural Household data, the stockist interviews
and discussions with key stakeholders including farmers. Key stakeholders were interviewed
using an interview checklist. Focused group discussions were carried out with community
organizations involved in seed and plant material production. Methods included descriptive
and econometric analysis, and sub sector methods to analyze performance of and constraints
facing the Kenya seed industry.
10
1.5 Organization of the Paper
The working paper is organized into four sections. Section 1 (the present section) has
presented an overview of the seed sector in Kenya, and addresses the pertinent issues in
Kenya’s seed sector. The section has discussed the two seed systems prevalent and their
importance and laid out key research questions, objectives, data and methods adopted in the
rest of the paper. Section 2 provides an assessment of the Kenyan seed industry structure, and
provides alternative measures to the important seed sources for farmers. The section also
discusses the improved seed adoption, and examines factors that affect the adoption. The
section concludes with an analysis of the returns to improves seed, to establish how profitable
it is to use improved seed for various crops.
Section 3 turns the focus to the theme of this paper, namely, examining what is working in
the seed industry with regard to access and utilization. The section provide examples of
initiatives that farmers use to access fairly clean seeds and planting materials for different
groups of commodities, and also some food security-related initiatives to seed access. Section
4, the final section, looks at key policy implications and lessons for the Kenyan seed sector.

11
2.0 Structure of the Seed Industry in Kenya
Seed industry in Kenya, like any other economy, is divided into the formal and informal
systems1. The two systems vary in their magnitude and importance depending on the
commodities they support. Evidence shows that commodities that have been supported by
massive research efforts tend to have more formal than informal seed system, while those
regarded as orphan crops have more informal than formal seed system. This section takes a
closer examination of the seed system in Kenya to assess their importance in seed access.
2.1 The Kenya Seed System
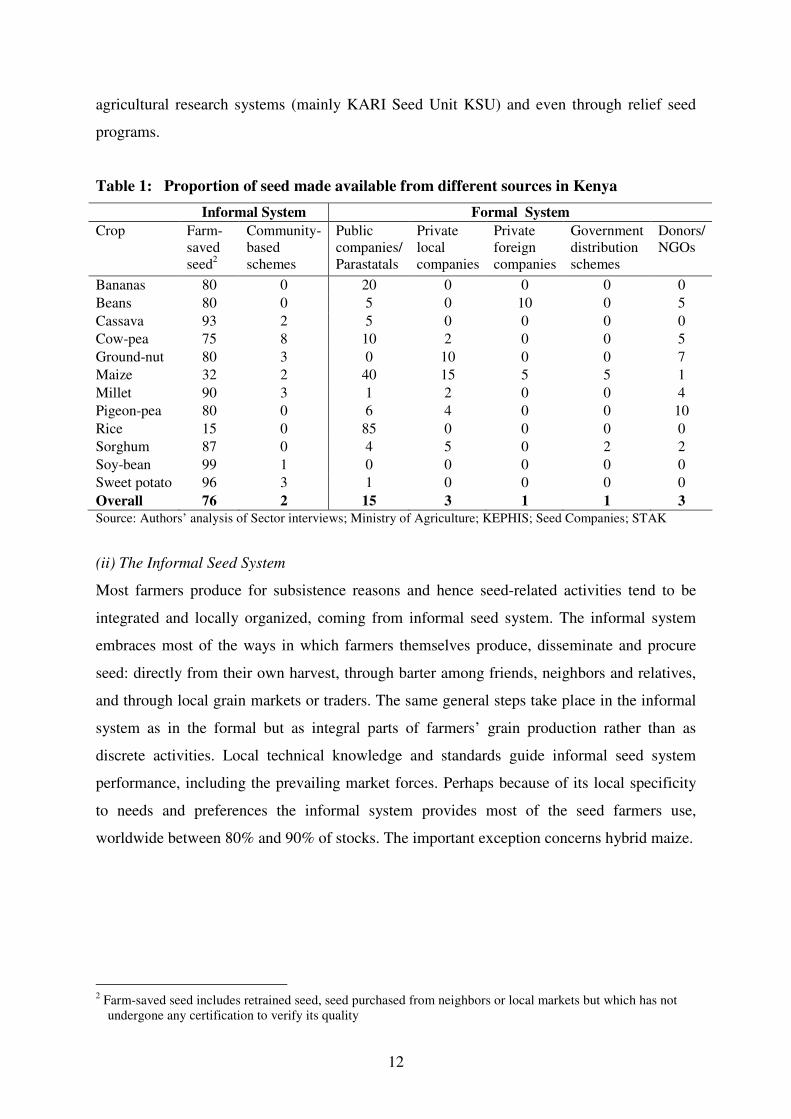
Table 1 below shows the proportion of seed that passes through the formal and informal
systems for selected commodities. Approximately four-fifths (78%) of all seed used in Kenya
comes from the informal sector. Despite this, the importance of the informal seed system has
been largely underplayed and unappreciated as a distinct and expanding presence. With the
exception of maize and rice, seed for other commodities are mainly sourced from the
informal sector. For maize, about 40% of the seed comes from public seed companies, while
another 20% coming from the private seed companies. For rice about 80% of the seed is
sourced from the public seed sector. Notably, maize has been supported by massive national
research network both locally and internationally. For most other commodities, informal seed
system, especially farm-saved seed is the key source for seed.
(i) The Formal Seed System
The formal seed sector in Kenya comprises of both the public and private sector agencies and
characterized by a clear chain of activities starting with plant breeding, variety release and
certification, seed multiplication, production, distribution and marketing system. The Formal
seed system is especially important in crop production for commercial purposes (for example
export or further food processing). Currently, the formal seed sector comprises of 5 public
(including 4 KARI seed units) and 50 registered private seed companies. The formal system
is governed by strict regulations in order to maintain variety identity and purity as well as to
guarantee physical, physiological and sanitary quality. Seed produced through this system is
distributed through officially-recognized seed outlets, which must obtain registration and
certification from KEPHIS. Some of the formal seed is distributed through the national
1 The “informal system is sometimes also referred to as ‘local’, ‘farmer’, or ‘traditional’ seed systems.
12
agricultural research systems (mainly KARI Seed Unit KSU) and even through relief seed
programs.
Table 1: Proportion of seed made available from different sources in Kenya
Informal System Formal System
Crop Farm-
saved
seed2
Community-
based
schemes
Public
companies/
Parastatals
Private
local
companies
Private
foreign
companies
Government
distribution
schemes
Donors/
NGOs
Bananas 80 0 20 0 0 0 0
Beans 80 0 5 0 10 0 5
Cassava 93 2 5 0 0 0 0
Cow-pea 75 8 10 2 0 0 5
Ground-nut 80 3 0 10 0 0 7
Maize 32 2 40 15 5 5 1
Millet 90 3 1 2 0 0 4
Pigeon-pea 80 0 6 4 0 0 10
Rice 15 0 85 0 0 0 0
Sorghum 87 0 4 5 0 2 2
Soy-bean 99 1 0 0 0 0 0
Sweet potato 96 3 1 0 0 0 0
Overall 76 2 15 3 1 1 3
Source: Authors’ analysis of Sector interviews; Ministry of Agriculture; KEPHIS; Seed Companies; STAK
(ii) The Informal Seed System
Most farmers produce for subsistence reasons and hence seed-related activities tend to be
integrated and locally organized, coming from informal seed system. The informal system
embraces most of the ways in which farmers themselves produce, disseminate and procure
seed: directly from their own harvest, through barter among friends, neighbors and relatives,
and through local grain markets or traders. The same general steps take place in the informal
system as in the formal but as integral parts of farmers’ grain production rather than as
discrete activities. Local technical knowledge and standards guide informal seed system
performance, including the prevailing market forces. Perhaps because of its local specificity
to needs and preferences the informal system provides most of the seed farmers use,
worldwide between 80% and 90% of stocks. The important exception concerns hybrid maize.
2 Farm-saved seed includes retrained seed, seed purchased from neighbors or local markets but which has not
undergone any certification to verify its quality

13
2.2 Seed Sources for Farmers
Two seed sources exist, namely, informal and formal seed sources. The informal seed sources
include retained seed and purchases made through informal markets, including the local
markets and neighbors. Seed purchased from these sources mainly comprises the local
varieties and their quality has not been verified. Formal seed purchases, on the other hand, are
those made from the stockists and outlets through which certified seed are sold.
2.3 Seed Channels used by Farmers in Kenya
An assessment of the important seed sources for farmers is critical for policy purposes.
Different approaches can be used to do this. One approach is to look at the proportion of
farmers using a particular seed source. Alternatively, one can compare the value shares of the
seed passing through various seed sources. In both approaches, seed types are categorized
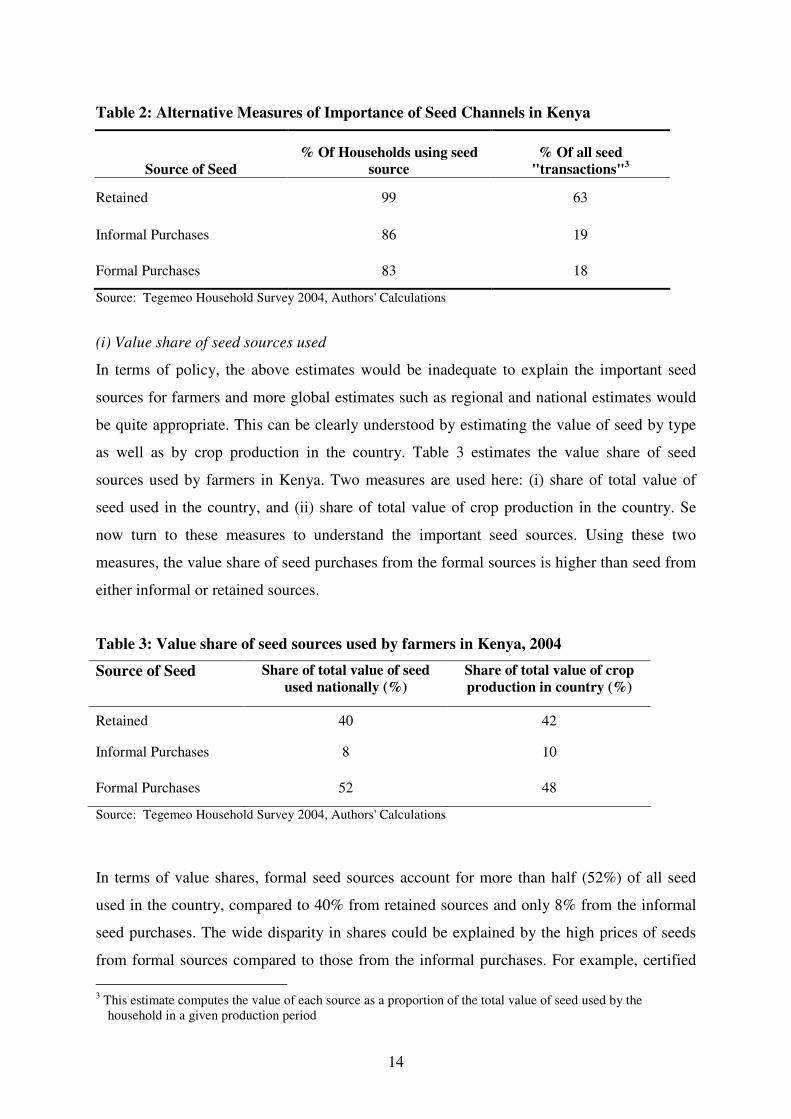
into retained seed, informal seed purchases and formal seed purchases. Table 2 shows the
alternatives measures of importance of the various types of seed used by farmers in Kenya.
From the Table, it is evident that households tend to use all the three types of seeds. Almost
Nearly all households (99%) use retained seed while 86% and 83% use seed from informal
and formal purchases, respectively. This classification includes all crops that a household
plants during a production period. It however fall short of explaining the importance of a seed
source since it does not attempt to estimate the quantities of seed that farmers acquire from
each source, nor does it give the value of the seed and therefore may be misleading.
A realistic way of gauging the importance of the type of seed used by farmers is to estimate
the proportion of all seed transactions made by the farmer. According to this classification,
the most frequently used source of seed by farmers is the retained seed, accounting for nearly
two-thirds (63%) of seed transactions made by farmers. Informal and formal seed purchases
account for 19% and 18% respectively. Thus, the most frequent source of seed used by
households in the country is retained production, while formal sector seed purchases are least
frequent. This may to some extent explain the low yields experienced in the country. This
classification, however, still does not clearly show the real importance of seed source, since it
is estimated at household level.
14
Table 2: Alternative Measures of Importance of Seed Channels in Kenya
Source of Seed
% Of Households using seed
source
% Of all seed
"transactions"3
Retained 99 63
Informal Purchases 86 19
Formal Purchases 83 18
Source: Tegemeo Household Survey 2004, Authors' Calculations
(i) Value share of seed sources used
In terms of policy, the above estimates would be inadequate to explain the important seed
sources for farmers and more global estimates such as regional and national estimates would
be quite appropriate. This can be clearly understood by estimating the value of seed by type
as well as by crop production in the country. Table 3 estimates the value share of seed
sources used by farmers in Kenya. Two measures are used here: (i) share of total value of
seed used in the country, and (ii) share of total value of crop production in the country. Se
now turn to these measures to understand the important seed sources. Using these two
measures, the value share of seed purchases from the formal sources is higher than seed from
either informal or retained sources.
Table 3: Value share of seed sources used by farmers in Kenya, 2004
Source of Seed Share of total value of seed
used nationally (%)
Share of total value of crop
production in country (%)
Retained 40 42
Informal Purchases 8 10
Formal Purchases 52 48
Source: Tegemeo Household Survey 2004, Authors' Calculations
In terms of value shares, formal seed sources account for more than half (52%) of all seed
used in the country, compared to 40% from retained sources and only 8% from the informal
seed purchases. The wide disparity in shares could be explained by the high prices of seeds
from formal sources compared to those from the informal purchases. For example, certified
3 This estimate computes the value of each source as a proportion of the total value of seed used by the
household in a given production period

15
seed maize retails at Ksh 120 (could be as high as Ksh 175 for imported seed) a kilo, while
seed maize purchased from informal sources is sold at Ksh 25 for the same quantity.
The same pattern is exhibited when we consider the seed source by value of crop production.
Most of the crop production (48%), by value, is derived from using formal seed sources,
compared to informal seed purchases (10%) or retained seed (42%). This may imply that
farmers producing for commercial purposes would tend to use the formal seed sources for
maximum benefits while those producing for subsistence purposes would tend to rely on seed
from retained production or informal sources.
(ii) Value share of seed source by commodity group
The information presented so far has considered all crops in all regions of the country. This
tends to mask a lot of information, since there are differences in crops and regions in terms of
seed sources and use. Table 4 breaks the value share of seed used by crop type. The crops are
grouped into cereals and pulses, tubers, vegetables and non-tree fruits, tree crops and fodder.
Table 4: Value shares of seed channels in Kenya by crop category
Crop category Retained Seed Informal Purchases Formal Purchases
------ % Of Total Value of Seed ------
Cereals and Pulses 34 14 52
Of which: Maize 10 3 87
others 58 24 17
Tubers 84 16 0
Vegetables & non-tree fruits 43 34 22
Industrial Crops 1 0 99
Tree Crops 93 7 0
Fodder 98 1 1
Overall 40 8 52 Source: Tegemeo Household Survey 2004, Authors' Calculations
The formal seed source is dominated by cereals and pulses and the industrial crops. Among
the cereals and pulses, more than half (52%) of the seed by value is from formal seed
purchases, while another one-third (34%) of the seed is farm-retained. But even among the
cereals and pulses, maize dominates the formal seed purchases (87%) of seed used for cereal
and pulses production. Other cereals and pulses are mainly from farm-saved seed (58%).
Vegetables and other non-tree fruits are also mainly grown from retained seed sources (43%)
and informal sources (34%), while the tree fruits are mainly produced from retained
seedlings.

16
Industrial crops (sugarcane, tea, coffee) are predominantly grown from formal seed sources
while tubers are mainly grown from farmer-saved (84%) and informal seed sources (16%). A
unique feature for industrial crops is that they tend to be supported by well-established
research system and output markets. The respective sub-sectors provide inputs including
seeds and planting materials to their farmers, often on credit, to be recovered when the
farmers deliver the produce to them. This helps the farmers to get around the constraints to
using high quality seed posed by lack of finances. The organizations also provide extension
services to the farmers thereby promoting good use of the inputs.
(iii) Value share of seed source by agro-regional region
Finally, Table 6 takes a look at the share values for the various seed channels in Kenya in
2004 categorized by the agro-regional zone. In terms of value, formal seed sources are
important for all agro-regional zones, except in the Eastern and Coastal Lowlands. Over 40%
of all seed purchases from the formal channels are for maize in the high potential maize zone.
But retained seed use is spread over wider geographical area and more crops. Four-fifths of
all seed used in Eastern Lowlands by value is retained seed. This may be attributed to the fact
that the Eastern and Coastal lowlands are generally arid and semi arid areas.
Table 5: Value shares of seed channels, by agro-regional zone in Kenya
Zone Retained Seed Informal Purchases Formal Purchases
----- % Of value in the region -----
Central Highlands 49 10 41
High Potential Maize Zone 31 7 61
Eastern Lowlands 80 11 9
Western Lowlands 45 7 48
Western Transitional 11 4 85
Western Highlands 35 6 60
Coastal Lowlands 55 26 19
Source: Tegemeo Household Survey 2004, Authors' Calculations
(iv) Value share of seed source by household income
Income is hypothesized to influence the use of formal or informal seed systems (Table 6).
There is evidence that in terms of income quintiles, both the formal and informal seed
channels are important. In terms of overall value seed shares, more than half (52%) all seed
used by households while retained seed is valued at 40%. Higher income households’ seed

17
value is 5 to 6 times that of lower income households, meaning higher income households are
able to access quality seed more than the lower income households.
Table 6: Value share of seed channels by household income quintiles in Kenya
Income
Quintile
Retained
Seed
Seed purchases from
informal sector
Seed purchases
from formal sector
Mean total value
of seed used (Ksh)
---- % of seed value for each quintile -----
1 (Lowest) 35 12 53 5,136
2 44 10 46 7,864
3 48 10 42 11,717
4 41 8 51 15,165
5 (Highest) 36 7 57 29,976
Overall 40 8 52 Source: Tegemeo Household Survey 2004, Authors' calculations
From the above, the basic patterns in seed access show that that the seed sector in Kenya is
highly diversified and that nearly all households rely on all the three types of seed. Retained
seed is important across all income levels. Also among households, high shares of seed are
retained as compared to what is purchased. This has implication on the productivity of the
crops, since recycling of seed leads to reduction in seed vitality and hence yields. With the
exception of vegetables and non-tree fruits, the share of purchased seed form the informal
sector among households is low. The formal sector seems to primarily serve the higher
income households and is heavily focused on maize, especially in the high potential zone.
2.4 Adoption of Improved Seed in Kenya
We now turn the discussion to adoption of seed, and investigate key factors that affect
household adoption of improved seed. An understanding of this helps in charting out policy
options that can lead to access and high adoption of improved seed thereby resulting in
increased productivity. We first take a look at the factors affecting access to the seed and then
discuss the level of adoption of improved seed.
2.4.1 Factors affecting access and use of improved seed
A number of factors can explain the patterns of seed adoption in Kenya. Some of these are
system related while others are farmer-based or economic in nature. Discussed below are
some key factors that influence the type of seed farmers use.

18
(i) Input supply systems
While there exists effective demand for productivity-enhancing inputs by farmers, this is
often not matched with an effective input supply system that makes the inputs available when
and where they are needed and affordably.
Table 7 shows the seed demand and supply situation in Kenya in 2005. Maize seed is the
most produced and traded seed in Kenya. On average 25,000 mt of seed maize is produced
annually. Apart from maize, beans, sorghum, rice, cowpea and pigeon pea are other important
crops. Free seed is normally distributed to smallholder farmers as an emergency response
following disasters such as drought or hunger, and therefore is not an annual event. The crops
normally included in the relief seed program are maize, beans and sorghum. Inadequate
formal seed supply systems dampen, or even preclude the diffusion of new crop varieties.
Table 7: Seed demand and supply situation for selected crops in Kenya (2005)
Crop Acreage
planted (ha)
Total seed
demand (mt)
Formal seed
supply (mt)
Proportion of formal:
total seed (%)
Beans 1,034,477 62,069 1,030 2%
Cow-pea 72,654 2,034 565 28%
Maize 1,760,618 44,015 27,500 62%
Millet 92,430 739 175 24%
Pigeon-pea 180,240 5,047 19 0%
Rice 15,940 1,275 300 24%
Sorghum 122,368 1,224 433 35%
Source: Authors’ analysis of Sector interviews; Ministry of Agriculture; KEPHIS; Seed Companies
(ii) Lack of credit
At the retail and wholesale levels, stockists lack the credit facilities to assist in making the
inputs available. They therefore order less stock which make their operational costs are high.
These costs are often passed on to the farmer resulting in higher input costs. In semi-arid
areas, there is even more tendency for farmers to recycle their seed, since most varieties are
open pollinated (OPVs) that still perform relatively well after several generations unlike
hybrids.
19
(iii) Distance to stockist
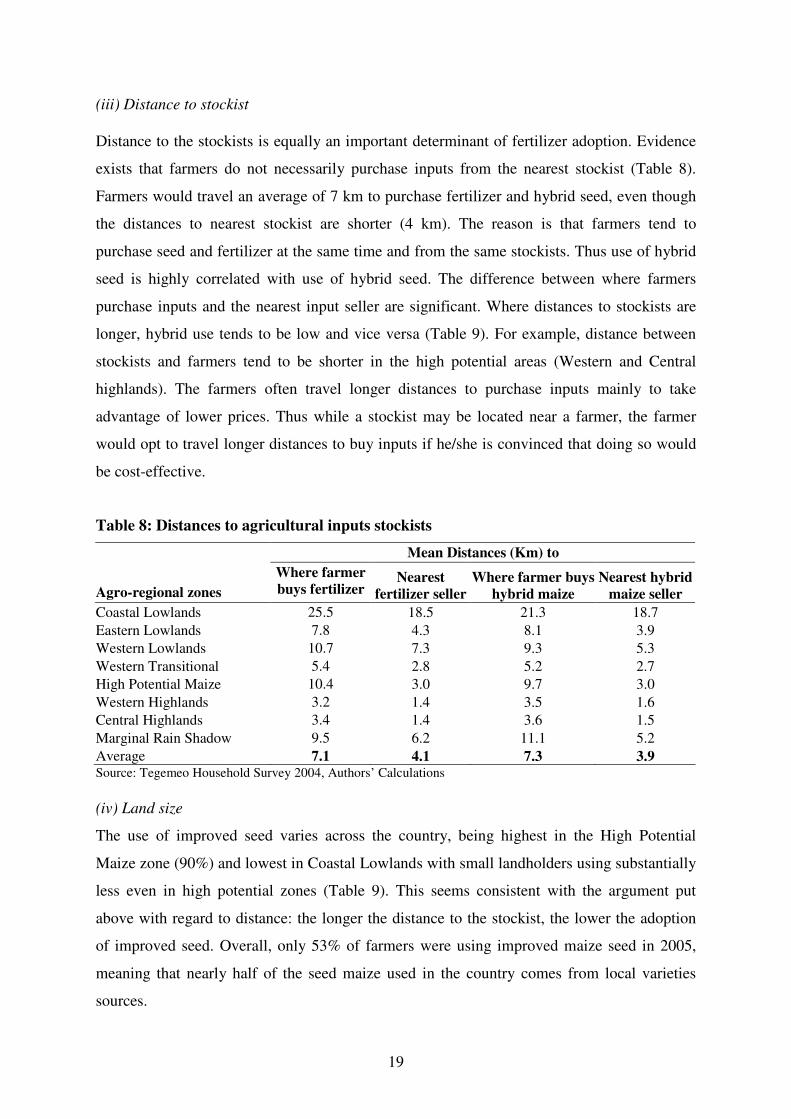
Distance to the stockists is equally an important determinant of fertilizer adoption. Evidence
exists that farmers do not necessarily purchase inputs from the nearest stockist (Table 8).
Farmers would travel an average of 7 km to purchase fertilizer and hybrid seed, even though
the distances to nearest stockist are shorter (4 km). The reason is that farmers tend to
purchase seed and fertilizer at the same time and from the same stockists. Thus use of hybrid
seed is highly correlated with use of hybrid seed. The difference between where farmers
purchase inputs and the nearest input seller are significant. Where distances to stockists are
longer, hybrid use tends to be low and vice versa (Table 9). For example, distance between
stockists and farmers tend to be shorter in the high potential areas (Western and Central
highlands). The farmers often travel longer distances to purchase inputs mainly to take
advantage of lower prices. Thus while a stockist may be located near a farmer, the farmer
would opt to travel longer distances to buy inputs if he/she is convinced that doing so would
be cost-effective.
Table 8: Distances to agricultural inputs stockists
Mean Distances (Km) to
Agro-regional zones
Where farmer
buys fertilizer Nearest
fertilizer seller
Where farmer buys
hybrid maize
Nearest hybrid
maize seller
Coastal Lowlands 25.5 18.5 21.3 18.7
Eastern Lowlands 7.8 4.3 8.1 3.9
Western Lowlands 10.7 7.3 9.3 5.3
Western Transitional 5.4 2.8 5.2 2.7
High Potential Maize 10.4 3.0 9.7 3.0
Western Highlands 3.2 1.4 3.5 1.6
Central Highlands 3.4 1.4 3.6 1.5
Marginal Rain Shadow 9.5 6.2 11.1 5.2
Average 7.1 4.1 7.3 3.9 Source: Tegemeo Household Survey 2004, Authors’ Calculations
(iv) Land size
The use of improved seed varies across the country, being highest in the High Potential
Maize zone (90%) and lowest in Coastal Lowlands with small landholders using substantially
less even in high potential zones (Table 9). This seems consistent with the argument put
above with regard to distance: the longer the distance to the stockist, the lower the adoption
of improved seed. Overall, only 53% of farmers were using improved maize seed in 2005,
meaning that nearly half of the seed maize used in the country comes from local varieties
sources.
20
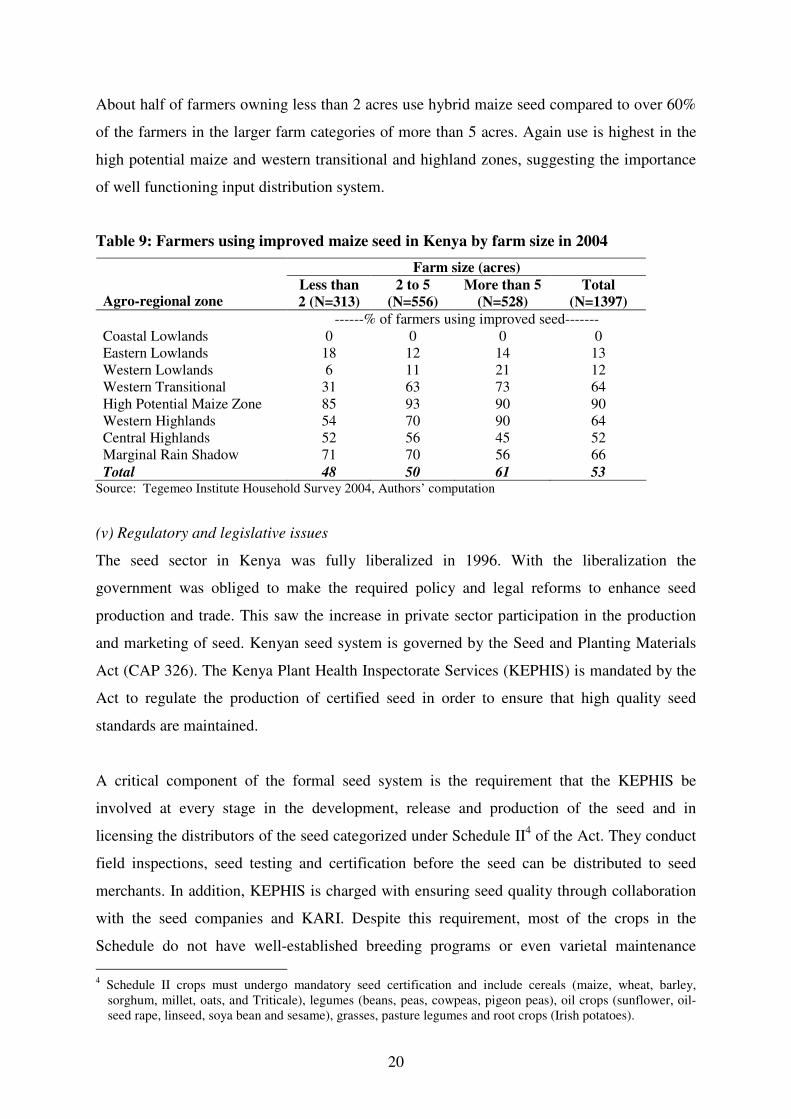
About half of farmers owning less than 2 acres use hybrid maize seed compared to over 60%
of the farmers in the larger farm categories of more than 5 acres. Again use is highest in the
high potential maize and western transitional and highland zones, suggesting the importance
of well functioning input distribution system.
Table 9: Farmers using improved maize seed in Kenya by farm size in 2004
Farm size (acres)
Agro-regional zone Less than
2 (N=313)
2 to 5
(N=556)
More than 5
(N=528)
Total
(N=1397)
------% of farmers using improved seed-------
Coastal Lowlands 0 0 0 0
Eastern Lowlands 18 12 14 13
Western Lowlands 6 11 21 12
Western Transitional 31 63 73 64
High Potential Maize Zone 85 93 90 90
Western Highlands 54 70 90 64
Central Highlands 52 56 45 52
Marginal Rain Shadow 71 70 56 66
Total 48 50 61 53 Source: Tegemeo Institute Household Survey 2004, Authors’ computation
(v) Regulatory and legislative issues
The seed sector in Kenya was fully liberalized in 1996. With the liberalization the
government was obliged to make the required policy and legal reforms to enhance seed
production and trade. This saw the increase in private sector participation in the production
and marketing of seed. Kenyan seed system is governed by the Seed and Planting Materials
Act (CAP 326). The Kenya Plant Health Inspectorate Services (KEPHIS) is mandated by the
Act to regulate the production of certified seed in order to ensure that high quality seed
standards are maintained.
A critical component of the formal seed system is the requirement that the KEPHIS be
involved at every stage in the development, release and production of the seed and in
licensing the distributors of the seed categorized under Schedule II4 of the Act. They conduct
field inspections, seed testing and certification before the seed can be distributed to seed
merchants. In addition, KEPHIS is charged with ensuring seed quality through collaboration
with the seed companies and KARI. Despite this requirement, most of the crops in the
Schedule do not have well-established breeding programs or even varietal maintenance
4 Schedule II crops must undergo mandatory seed certification and include cereals (maize, wheat, barley,
sorghum, millet, oats, and Triticale), legumes (beans, peas, cowpeas, pigeon peas), oil crops (sunflower, oil-
seed rape, linseed, soya bean and sesame), grasses, pasture legumes and root crops (Irish potatoes).
21
programs. As a result, a large share of the seed used in Kenya is technically “illegal” since it
has not been certified. Yet, the informal system is much wider and important to just be
branded illegal. Clearly, such a situation is not conducive to improving seed quality for all
Kenyans; a necessary condition for developing more formalized approaches to providing
improved seed to farmers has as a necessary condition that the broad informal system in
Kenya have a legally recognized space in which to operate.
With regard to international trade, KEPHIS also ensures that imported planting material is
disease-free and adaptable to the country’s agro-climatic conditions. As a result, all imported
seed and planting material must be accompanied by a phytosanitary certificate and an
international orange certificate of the International Seed Testing Association (ISTA), and
must meet the Kenyan quarantine requirements as set out in the Plant Protection Act (Cap
324). However, there are complaints that seed importations are subjected to looser regulations
than the local seed. Some seeds imported into the country and already in the market are of
questionable quality, yet the development and release of new varieties takes too long.
According to the Seed and Plant Varieties Act (Cap 326), Regulation 10(1)) ‘Only cultivars
officially released by the Minister (for Agriculture) and advanced breeder’s lines which have
potential for release shall be eligible for certification.’ Currently, only the first part of the
section is operational; advanced breeder’s lines are not being certified or released. This tends
to give undue advantage to seed importers, who will then take a shorter time to have their
seed certified.
The essence of the liberalization was twofold: (i) to encourage local and foreign investment
in the seed sector on a level ground thereby not discriminating in any way and stimulate
growth in Breeding, production and marketing; and (ii) encourage self-regulation i.e.
investing in trust with the Private sector. These measures would impact directly in making
new technologies accessible to farmers resulting in increased productivity, a path to a green
revolution and eradication of poverty. Additionally, the government of Kenya is signatory to
various International Trade Agreements like the World Trade Organization (WTO), Trade-
Related Aspects of Intellectual Property (TRIPS), regional treaties such as the Common
Market for Eastern And Central Africa (COMESA) and the East African Community (EAC)
as well as International protocol agreements like Union for the Protection of new Varieties
(UPOV) and the Cartagena Protocol. Despite these provisions, the seed sector still is
overregulated.

22
Over regulation in the sector does not affect only the informal system; the formal private
sector has complained of the way KEPHIS has adopted an attitude of ‘policing’ the industry
and exercising regulatory monopoly powers over the private sector rather than providing
services, co-ordination and leadership in the seed industry. They specifically suggest that
over-regulation is hindering production and release of new certified seed varieties, especially
by local breeders
2.4.2 Seed Adoption
Table 10 shows summary results of three linear probability regressions (Logit model)
attempting to explain the factors associated with the adoption of formal seed – purchased
hybrids or OPVs5. Full results including all coefficient estimates and significance levels are
presented in Annex 1. Data for the analysis was obtained from the Tegemeo 2004 household
survey. Industrial crops were dropped from the analysis because the use of improved seeds in
these crops is associated with the vertically integrated organization of the crops’ supply
chains, and thus holds less policy interest for this paper. For all other crops, we first ran the
regression on all crops in all fields, then ran separate regressions for maize, non-maize cereals
and pulses (not reported in summary table), and vegetables. In all cases, we controlled for
agro-regional zone. Also in the overall regression we additionally controlled for crop type,
while in the non-maize cereals and pulses and the vegetable regressions we controlled for
specific crops within those groups.
Form the table it is generally observed that, with the exception of education of the household
head and regional indicator variables, results for maize and vegetables are quite similar,
suggesting that the same set of factors drive the adoption of hybrids and purchased OPVs
across these crops. Because hybrid use is so low among non-maize cereals and pulses (less
than 2%), results for that regression (in Annex 1) are less comparable. Female headed
households are less likely to use formal seed, especially on maize. This result persists despite
controlling for other variables (see below) that could be correlated with female headedness,
such as household assets, education of the household head, and household size. We therefore
consider this a strong result. Education of the household head has significant positive effects
for maize. Household-head’s education does not seem to affect adoption of formal vegetable
5 Note that about 93% of all purchased seed is of hybrids – purchases of OPVs are relatively rare – so that this
analysis primarily reflects the factors associated with purchase of hybrid seed.
23
seed or cereals other than maize. These results seem to be consistent with other finding in
Africa that returns to education are much lower in agriculture than in non-farm enterprise
(Michaelowa 2000; Joliffe 1998; Joliffe 2004).
Results on total household land area are positive and very strong in all regressions. Land
area’s effect is especially strong on non-maize cereals and pulses (see Annex 1) and
vegetables. Use of fertilizer is clearly associated with use of hybrid seed in maize, and those
with more years of using fertilizer are consistently more likely to use hybrid seed than those
with less. In vegetables, it appears that having some experience helps, but having more
experience does not help any more. Surprisingly, we find little effect of distance to a
motorable road (or other variables measuring distance to transport and economic
infrastructure). In the “all crops” regression, the 20% of households most distant from such a
road are somewhat less likely to use formal seed, but otherwise no consistent pattern is found.
Results on household assets suggest that the most asset poor households are least likely to use
improved seed; yet for each individual crop group, households with the most assets are not
much more likely than others (except the very poorest) to use such seed.
Regional variables show that, controlling for all other variables (including crop) farmers in
the Eastern Lowlands are always the least likely to use improved seed, while those in the
High Potential Maize zone are, with the exception of vegetables, always the most likely to
use such seed. Results for Western Lowlands are quite variable:- they are less likely than
farmers in the Coastal Lowlands (the omitted dummy) to use improved maize seed, but are
the most likely to use formal vegetable seed.

24
Table 10: Summary results on factors associated with use of purchased seed in Kenya
Variable All Crops Maize Vegetables
Household is female-headed Female-headed households are 25% less
likely to adopt
Female-headed households are 24%
less likely to adopt
Female-headed households are 14%
less likely to adopt
Education of household head
Some education increases adoption, but
more does not continue to increase it
(those with no formal schooling adopt
less, otherwise no effect)
Some education increases adoption,
and more (past 8 yrs) increases it
more
No apparent effect
Size of land holdings Steady increase in adoption as total land
holding size increases
Steady increase in adoption as total
land holding size increases
Steady increase in adoption as total
land holding size increases
Household size Steady increase in adoption as total
household size increases
Steady increase in adoption as total
household size increases
Only the largest 20% of households
show higher adoption rates
Years using fertilizer
Those with some experience, even
small, are more likely to adopt than
those with none (those with none are
less likely to adopt)
Steady increase in adoption as
experience with fertilizer increases
Those with some experience, even
small, are more likely to adopt than
those with none (those with none are
less likely to adopt)
Distance to motorable road (km) The most distant 20% are less likely to
adopt; otherwise no apparent effect Inconsistent pattern No apparent effect
Value of household assets Steady increase in adoption as total
value of household assets increases
Some increase in adoption as total
value of household assets increases
The 20% of households with the
lowest value of assets is less likely to
adopt; otherwise no effect
Crop type
Maize and vegetables most associated
with adoption; non-maize cereals and
pulses least associated ---------- ----------
Type of vegetable ---------- ----------
Carrot, French bean, cabbage among
most likely to use; onion and
cucumber among least likely
Regional variables Eastern Lowlands much less likely to
adopt; HPMZ much more likely.
Eastern & Western Lowlands much
less likely to adopt; HPMZ much
more likely.
Eastern Lowlands and Central
Highlands much less likely to adopt;
Western Lowlands much more likely.
25
2.5 Returns to improved seed use in Kenya
In previous sections, we examined the structure of the seed sector in Kenya, and analyzed
who tends to use the various seed channels – retained, purchased informal, and purchased
formal. The question that begs answer is whether it pays for a Kenyan farmer to spend cash
income for formal or informal seed, rather than retaining it on the farm. In this section, we
present an analysis of the returns to use of formal seed.
We used a linear regression approach to examine this question, the results of which are
displayed in Table 11. We ran separate linear regressions for 13 crops that had sufficient
observations in the 2004 Tegemeo Household Survey dataset to give robust results. The data
points used in each regression were each planting of the given crop on a specific field; for
example, if one household planted one crop on each of two fields, plus two other crops each
on one field, we would use four data points from that household in the analysis (assuming
each crop was among those we chose for the analysis).
Each regression controlled for the size of the field, the amount of fertilizer used (with manure
and inorganic fertilizers separated), whether a field was prepared manually, with oxen, or
with a tractor, the number of additional crops on the field, agro-regional zone, and a series of
household variables: household size, whether it is headed by a female, education of the
household head, years of experience planting hybrids, and the value of assets. Here we report
only the focus of interest in this analysis: whether it pays for a household to purchase
informal or formal seed, rather than retaining seed from its own production. In interpreting
the results, any return above Ksh 1 indicates that, on average for that crop, households
increase net earnings if they purchase formal or informal seed, rather than using retained
production.6
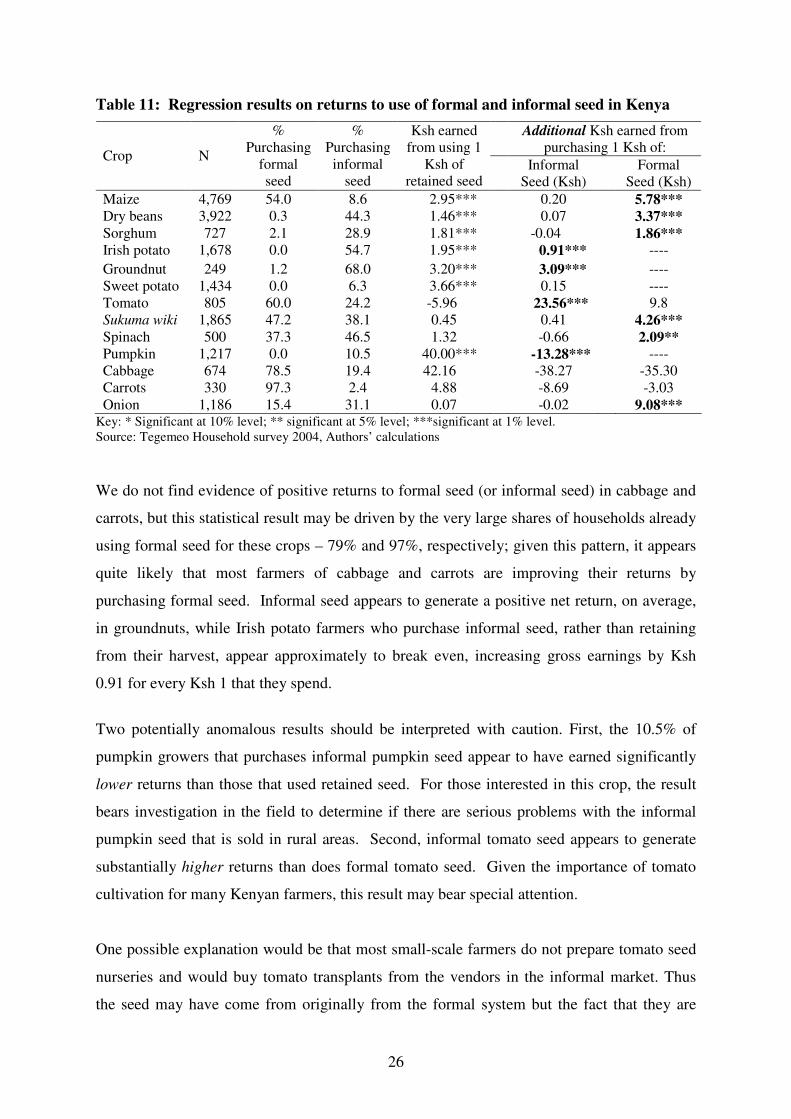
Overall, results suggest that purchasing formally certified seed in Kenya – rather than
retaining seed or purchasing informal seed -- pays off in terms of net returns to the cropping
activity. In six of the nine crops for which we had sufficient observations on purchases of
formal seed, returns to this seed were positive, larger than Ksh 1 (so that net earnings rose for
the average farmer), and statistically significant.
6 The regression results should not be interpreted as the marginal product of each type of seed in each crop,
because we have not estimated fully specified production functions. However, the large sample size and the
ability to control for many relevant variables means that the results should provide a solid basis for assessing
whether and to what extent it pays for farmers to invest in formal seed in the country.
26
Table 11: Regression results on returns to use of formal and informal seed in Kenya
Additional Ksh earned from
purchasing 1 Ksh of: Crop N
%
Purchasing
formal
seed
%
Purchasing
informal
seed
Ksh earned
from using 1
Ksh of
retained seed
Informal
Seed (Ksh)
Formal
Seed (Ksh)
Maize 4,769 54.0 8.6 2.95*** 0.20 5.78***
Dry beans 3,922 0.3 44.3 1.46*** 0.07 3.37***
Sorghum 727 2.1 28.9 1.81*** -0.04 1.86***
Irish potato 1,678 0.0 54.7 1.95*** 0.91*** ----
Groundnut 249 1.2 68.0 3.20*** 3.09*** ----
Sweet potato 1,434 0.0 6.3 3.66*** 0.15 ----
Tomato 805 60.0 24.2 -5.96 23.56*** 9.8
Sukuma wiki 1,865 47.2 38.1 0.45 0.41 4.26***
Spinach 500 37.3 46.5 1.32 -0.66 2.09**
Pumpkin 1,217 0.0 10.5 40.00*** -13.28*** ----
Cabbage 674 78.5 19.4 42.16 -38.27 -35.30
Carrots 330 97.3 2.4 4.88 -8.69 -3.03
Onion 1,186 15.4 31.1 0.07 -0.02 9.08*** Key: * Significant at 10% level; ** significant at 5% level; ***significant at 1% level.
Source: Tegemeo Household survey 2004, Authors’ calculations
We do not find evidence of positive returns to formal seed (or informal seed) in cabbage and
carrots, but this statistical result may be driven by the very large shares of households already
using formal seed for these crops – 79% and 97%, respectively; given this pattern, it appears
quite likely that most farmers of cabbage and carrots are improving their returns by
purchasing formal seed. Informal seed appears to generate a positive net return, on average,
in groundnuts, while Irish potato farmers who purchase informal seed, rather than retaining
from their harvest, appear approximately to break even, increasing gross earnings by Ksh
0.91 for every Ksh 1 that they spend.
Two potentially anomalous results should be interpreted with caution. First, the 10.5% of
pumpkin growers that purchases informal pumpkin seed appear to have earned significantly
lower returns than those that used retained seed. For those interested in this crop, the result
bears investigation in the field to determine if there are serious problems with the informal
pumpkin seed that is sold in rural areas. Second, informal tomato seed appears to generate
substantially higher returns than does formal tomato seed. Given the importance of tomato
cultivation for many Kenyan farmers, this result may bear special attention.
One possible explanation would be that most small-scale farmers do not prepare tomato seed
nurseries and would buy tomato transplants from the vendors in the informal market. Thus
the seed may have come from originally from the formal system but the fact that they are

27
transplant makes it difficult to discern whether they are formal or not. The question then is:
are there highly effective programs in place for producing and trading informal tomato seed?
Note that about a quarter of all tomato growers purchased informal seed, and we find no
statistical outliers in the data, so that these results appear to be reasonably robust in a
statistical sense; further investigation would be needed to confirm that these results indicate
actual superiority of informal tomato seed.

28
3.0 Seed Access and Utilization in Kenya: working innovations?
A key question that ought to e answered with regard to seed access and utilization is, what
seed system is working for the various commodity groups and why are they working. The
answer to this question holds key to the enhanced use of improved seed. This section
describes some cases of seed distribution systems. The commodities are categorized into four
groups: horticultural crops, grains and pulses, commercial/industrial crops, and fruit trees.
3.1 Horticultural crops
Horticulture in Kenya has been cited by various studies as a success story (Minot et al, 2002,
Nyoro et al, 2004). The sub-sector is important both for foreign exchange as well as domestic
consumption. In 2005, it was ranked the highest foreign exchange earner, bringing to the
economy some Ksh 45 billion in foreign exchange, and Ksh 44.3 million from internal trade
(GoK, 2005). More than 400,000 hectares was put to horticultural production in 2005. For the
commodities destined for export market, the stringent market conditions require the use of
high quality seed and other agronomic practices. Farmers producing for the European market,
for example are required to adhere to the EUREPGAP conditions.
Seed system for horticultural crops is heavily oriented towards the formal seed purchases.
The crops are high-value in nature and therefore, farmers who grow them tend to do so for
commercial purposes. Commercial farmers normally use improved seed, while a large
proportion of those producing for subsistence use seed from local sources, often retained.
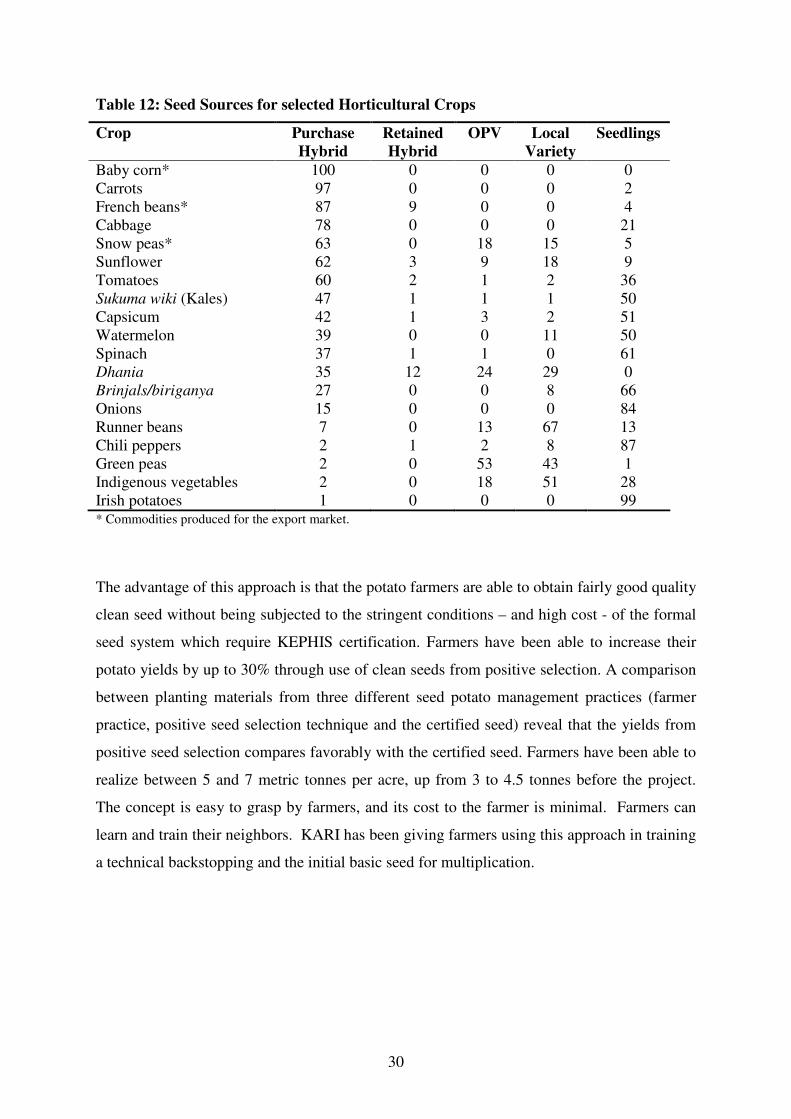
Most of the horticultural crops produced for local market are produced using local varieties
which are not certified, while those commodities destined for the export market (baby corn,
French beans, snow peas) tend to be grown using mostly certified seed (Table 12). In many of
the cases, marketer (exporter) supplies the farmers with seed and specifies the importer’s
requirements of the eventual produce. For these crops, the exporters dictate the varieties to be
grown and even the source of seed. Where necessary, the exporters import the seeds on
behalf of the farmers.
A number of techniques for seed production and distribution exist for horticultural crops. In
this section we discuss two of the techniques, one for the Irish potatoes and the other for
horticultural crops that destined for export.
29
3.1.1 Positive Selection in Irish Potato
Irish potato is one of the main staple foods in Kenya today, especially in urban centres, and
plays an important role in food security. There are about 500,000 potato farmers spread out in
various parts of Kenya. In 2005, a total 0f 120,000 hectares were put under Irish potato
production, mainly in Central, Rift Valley and Eastern provinces. The total production during
the year averaged 1 million metric tonnes between 2004 and 2005.
Despite importance of Irish potato industry in Kenya, the crop faces a number of key
challenges. There is inadequate supply of certified seed, to the extent that farmers almost
solely rely on informal seed sources (farm-saved, local markets or neighbors) for their
planting material (Table 12). In addition, the cost of certified seed and other productive inputs
is out of reach of most small-scale farmers7. The Kenya Agricultural Research Institute
(KARI) Potato Research Centre, Tigoni, produces basic seed for multiplication in high
altitude farms. However, only 1% of the farmers can access this planting material, since the
seed distribution network is collapsed in the early 1990s. Because of the high demand for the
certified seed and its unavailability, most farmers resort to the informal system for planting
material which include farmer-saved seed, exchange with neighbors and purchase of seed
from unlicensed growers and seed suppliers mainly in their immediate localities (Ogolla, et
al, 2002; Ayieko et al, 2005). This system exacerbates the use of poor quality seed and often
that leads to spread of seed-borne disease.
To address the formal seed constraints in Irish potato production, a number of institutions
have come together through private-public partnerships to assist farmers to access fairly clean
planting material as a means to enhance potato production. One such initiative is a concept
known as positive seed selection approach (See Box 1). In the approach, farmers are trained
to identify and differentiate healthy plants to be earmarked for seed development while the
crop is still in the field. These healthy plants are pegged for observation. As the crop
matures, any selected plant that show slight signs of disease is unpegged. The remaining
pegged plants are harvested first, to be used for seed, before the rest of the crop is harvested.
7 A 50kg bag of seed potato is sold for Ksh 1, 900 and a farmer needs 14 to 15 bags per acre
30
Table 12: Seed Sources for selected Horticultural Crops
* Commodities produced for the export market.
The advantage of this approach is that the potato farmers are able to obtain fairly good quality
clean seed without being subjected to the stringent conditions – and high cost - of the formal
seed system which require KEPHIS certification. Farmers have been able to increase their
potato yields by up to 30% through use of clean seeds from positive selection. A comparison
between planting materials from three different seed potato management practices (farmer
practice, positive seed selection technique and the certified seed) reveal that the yields from
positive seed selection compares favorably with the certified seed. Farmers have been able to
realize between 5 and 7 metric tonnes per acre, up from 3 to 4.5 tonnes before the project.
The concept is easy to grasp by farmers, and its cost to the farmer is minimal. Farmers can
learn and train their neighbors. KARI has been giving farmers using this approach in training
a technical backstopping and the initial basic seed for multiplication.
Crop Purchase
Hybrid
Retained
Hybrid
OPV Local
Variety
Seedlings
Baby corn* 100 0 0 0 0
Carrots 97 0 0 0 2
French beans* 87 9 0 0 4
Cabbage 78 0 0 0 21
Snow peas* 63 0 18 15 5
Sunflower 62 3 9 18 9
Tomatoes 60 2 1 2 36
Sukuma wiki (Kales) 47 1 1 1 50
Capsicum 42 1 3 2 51
Watermelon 39 0 0 11 50
Spinach 37 1 1 0 61
Dhania 35 12 24 29 0
Brinjals/biriganya 27 0 0 8 66
Onions 15 0 0 0 84
Runner beans 7 0 13 67 13
Chili peppers 2 1 2 8 87
Green peas 2 0 53 43 1
Indigenous vegetables 2 0 18 51 28
Irish potatoes 1 0 0 0 99

31
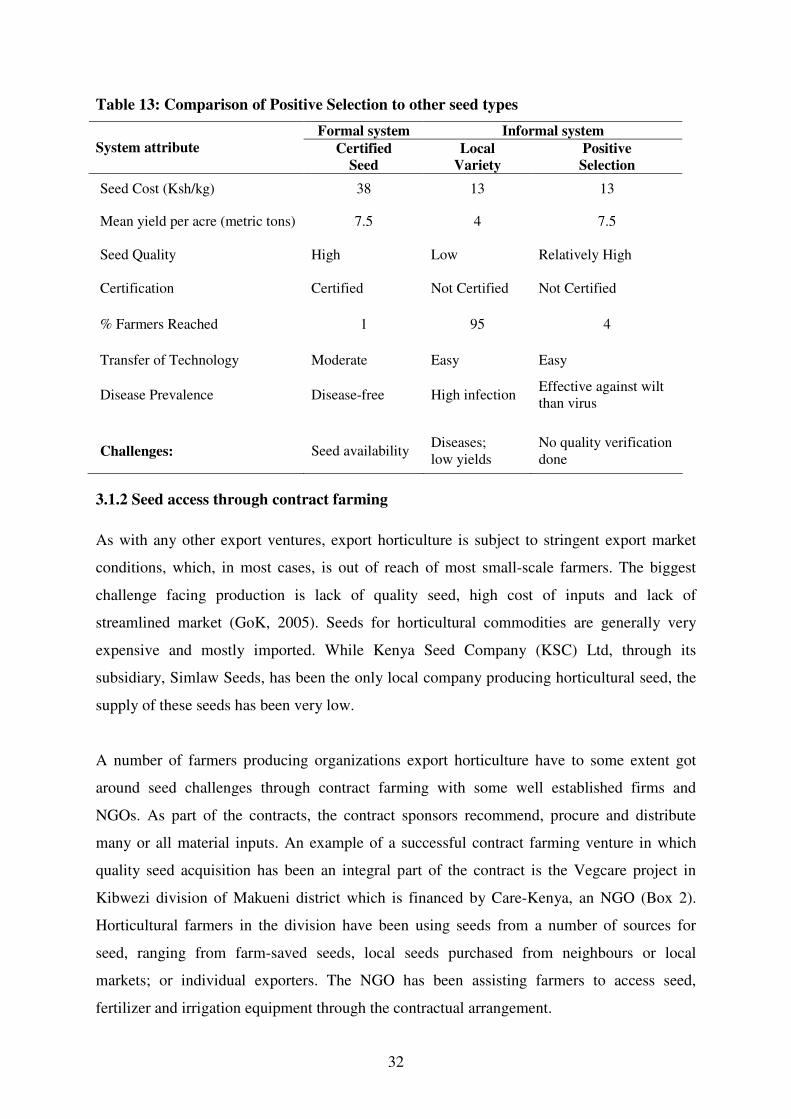
Positive selection approach stands out as a viable means to make seed available to most
potato farmers. Table 13 provides certain attributes of three techniques to potato seed access,
namely, the positive selection, the formal seed system, and the local seed system of making
seed available to farmers. By comparison, certified seed is three times as expensive as the
positive and local seed systems. In addition, quality of seed from positive selection, though
not certified, is quite high. Yet yields compare favorably to those obtained by using the
certified seed (between 5 to 7 metric tonnes), but almost twice yields obtained from local
varieties. Positive selection technique is also easily transferable since it is done on farmer’s
fields. In terms of farmer reach, the positive selection, within the shorter time it has been in
existence, has reached about 20,000 farmers, about four times those reached by the formal
seed system.
Box 1
Positive seed selection in Irish potatoes
The production of disease-free seed tubers of high-yielding varieties is recognized as an
important aspect in improving yields and controlling seed-borne diseases in farmers’
fields. After years of problems with seed potato, an initiative involving KARI-, Midlands
Limited (a private Irish potato seed producing company) and a joint venture by KARI,
CIP, GTZ, MoA and two farmer groups in Ol-jororok (Ol Marei and Eol-Enkitok) has
brought hope of farmers accessing quality seed. The initiative, dubbed the Positive
Selection Approach. The aim of this initiative is to facilitate access to cheap and clean
planting materials to farmers within their localities. Through support from these
organizations, farmers get basic seed from KARI for multiplication and selection.
The farmer groups employ the positive seed selection technique to come up with clean
and high-yielding planting materials. The farmers are trained to identify disease-free
plants during active vegetative growth phase, and mark them in the field for further
selection. During harvest, tubers from the marked healthy plants are first harvested
before the rest of the crop is harvested. Seed tubers for the next crop season are obtained
only from these plants. To be selected as seed for the next season, the marked plant must
be disease free, and must have more than four tubers. These tubers are then considered
as clean seed for use, and can be circulated among the group members. The technique,
first tested in Bomet district to demonstrate on-farm improvement of seed tuber quality,
has resulted in improved yields to farmers. To date, the approach has made available to
more than 20,000 small-scale farmers, but the approach has the potential to reach up to
some 100,000 farmers.
32
Table 13: Comparison of Positive Selection to other seed types
Formal system Informal system
System attribute Certified
Seed
Local
Variety
Positive
Selection
Seed Cost (Ksh/kg) 38 13 13
Mean yield per acre (metric tons) 7.5 4 7.5
Seed Quality High Low Relatively High
Certification Certified Not Certified Not Certified
% Farmers Reached 1 95 4
Transfer of Technology Moderate Easy Easy
Disease Prevalence Disease-free High infection Effective against wilt
than virus
Challenges: Seed availability Diseases;
low yields
No quality verification
done
3.1.2 Seed access through contract farming
As with any other export ventures, export horticulture is subject to stringent export market
conditions, which, in most cases, is out of reach of most small-scale farmers. The biggest
challenge facing production is lack of quality seed, high cost of inputs and lack of
streamlined market (GoK, 2005). Seeds for horticultural commodities are generally very
expensive and mostly imported. While Kenya Seed Company (KSC) Ltd, through its
subsidiary, Simlaw Seeds, has been the only local company producing horticultural seed, the
supply of these seeds has been very low.
A number of farmers producing organizations export horticulture have to some extent got
around seed challenges through contract farming with some well established firms and
NGOs. As part of the contracts, the contract sponsors recommend, procure and distribute
many or all material inputs. An example of a successful contract farming venture in which
quality seed acquisition has been an integral part of the contract is the Vegcare project in
Kibwezi division of Makueni district which is financed by Care-Kenya, an NGO (Box 2).
Horticultural farmers in the division have been using seeds from a number of sources for
seed, ranging from farm-saved seeds, local seeds purchased from neighbours or local
markets; or individual exporters. The NGO has been assisting farmers to access seed,
fertilizer and irrigation equipment through the contractual arrangement.
33
A number of challenges face this approach to promoting agricultural production. First, the
program targets poor farmers, who are the most vulnerable of the society. However, these
farmers also tend to be the most inefficient producers. To address this challenge, the company
has since shifted focus from poor farmers to working with those farmers who are willing and
able to produce. Secondly, the contractual arrangement suffers from spot buyers, and this
hamper s input loan recovery. Also, group dynamics are essential to the success of the
project. Where a group disintegrates, the company finds it difficult to recover its loans. Third,
is the problem of credit recovery. Because the company has been working with poor farmers,
the program has suffered from poor recovery of input credit to the farmers. In addition, there
have been problems with ownership of program facilities such as irrigation equipment, was
crucial. Also, the farmer groups had no binding contract with the program and could choose
to market their produce elsewhere. As a result, there have been cases of contract violation,
arising from non-production.
Box 2
Contract Farming as a means to accessing quality seed
Vegcare Horticulture Company Ltd, whose key shareholders are CARE-Kenya (an NGO) and
Vegpro Kenya Ltd (Horticulture Exporters), was set up with a mission of making the markets
work for the smallholder horticulture farmers. The company promotes a rural agribusiness support
program that targets the poor. To date, the company has contracted about 250 farmers from
Makindu, Kibwezi and Mtito Andei divisions of Makueni district to produce Asian vegetables
(Okra, chilies, Karella, brinjals, Ravaya) gourds and baby corn for export, mainly to the United
Kingdom (UK). The company provides the farmers with access to export market at annual
contracted volumes and prices. In addition, the company assists farmers to access affordable
credit facilities for horticulture production.
As part of the contract, the company offers training and extension services to contracted
horticulture smallholders. After training, farmer groups were given irrigation equipments, seeds,
fertilizers and chemicals. The company secures seed from various sources and distributes the
same to farmers. Most of the seed is imported and issued to farmers in form of credit. Before
inputs are issued, a thorough assessment of potential farmers is done to ascertain that the farmers
have the capacity to utilize the inputs productively. The company assists farmers to bulk seeds
that are not readily available in the market.

34
3.2 Grains and Pulses
Grains and pulses are very important in Kenya’s food security agenda. These crops tend to be
low-value, and are cultivated by almost all households in most parts of the country.
Compared to other commodities, these crops have a generally well established seed system
throughout the country. Despite this, evidence shows that the seed distribution system for
most of these crops is heavily dependent on local varieties, a large proportion of which is
retained. Table 14 shows the types of seed for crops that have food security agenda, which
include the grains, pulses and a number of tubers. It is evident from the table that most of
maize planted in the country is hybrid (46%). Nearly one-third (30%) of the seed maize is
local variety. Most of seed wheat is however retained hybrid. Other crops that are important
in the food security agenda tend to be purchased from local varieties (e.g. sorghum, millet,
cassava, beans cowpeas). For example, about 70% of sorghum, 67% of millet and 81% of
bulrush millet are local varieties. This trend suggests the importance of informal seed system
in addressing seed and food security in the country.
Table 14: Type of Seed for Grains, pulses and other crops with Food Security Agenda
Crop Purchased
Hybrid
Retained
Hybrid
Open Pollinated
Varieties
Local
Varieties
Maize 46 5 8 39
Wheat 30 42 11 16
Oats 29 9 18 41
Rice 10 5 55 30
Bulrush millet 6 0 13 81
Soya beans 4 0 46 50
Sorghum 2 0 29 69
Millet 1 0 32 67
Groundnuts 1 0 68 31
Beans 0 0 44 55
Cowpeas 0 0 33 55
Source: Tegemeo Household Survey, 2004, Authors’ Calculations
A number of models have been used to distribute seed in this category of crops. These
include the formal seed system, community-based seed multiplication, relief seed, and seed
vouchers and fairs. The formal seed system for grains and pulses has been through seed
companies distributing the seed to stockists from where the farmers can purchase the seed.
However, because of the inadequacies in the formal seed system to meet the demands for
farmers for quality seed, a number of models have emerged to fill the gap. These models are
supported by development agencies such as NGOs. Their strength is in the fact that they work

35
very closely with the farmers, and tend to be localized. They also tend not to be subject to the
stringent conditions imposed by the KEPHIS. In this section we discuss, some of the more
successful approaches to seed production and delivery among farmers. These include the
Community-based approaches, the seed vouchers and fairs.
3.2.1 Community-Based Seed programs
Farming communities, especially those in the marginal areas, face problems with seed access
and often resort to using local seeds especially for cereals and pulses. In many parts of the
country, farmers face challenges with access to good quality seed which is affordable and meets their
prevailing weather conditions. As a result the productivity has been low. The constraints for these
farmers are wide-ranging and include persistent drought, high cost of inputs, and unavailability of the
inputs. Several reasons have been cited for their use of use local seed, including: the high cost
of seed, long distances to stockists, unreliable rainfall, the striga weed, and lack of
knowledge on advanced technology. Lack of information on type of seed suitable for
particular regions has often brought confusion among farmers and crop failure. In some areas
of the country, there have been as many as four to five seasons’ total crop failure, meaning
that every time a farmer invests in purchased input (including seed), the result is sunken
costs. This often discourages the farmers from purchasing the inputs.
A number of community-based approaches have been used in seed multiplication as a means
to preserve seed and ensure availability to farmers. Most of the community-based approaches
are embedded in the food security programs. The objective of these approaches is to help
farmers preserve the local germplasm and ensure they have seed to rely on for crop
production. The initiatives to bulk seed have been implemented through farmer groups with
the support of the Ministry of Agriculture. Farmer groups are supplied with starter seed to
multiply and distribute to other farmers. Seeds given to farmers include maize (mainly the
composites), beans (Katumani Beans varieties 1 up to 9), sorghum, and millet.
These Community-based initiatives to bulk seed have received support of the donor agencies.
Churches and NGOs have embarked on assisting the rural folk to address their food security
problem through encouraging seed multiplication, to address the lack of improved seed. For
example IFAD is promoting horticultural production and utilization of traditional food crops
in Eastern province. Njaa Marufuku Kenya (NMK), a United Nations’ Food and Agriculture

36
Organization’s (FAO) programme to kick hunger out of Kenya, has given grants to a number
of groups for purposes of seed bulking. In Machakos district, Winrock International trained
and supported groups in seed bulking. Through this initiative, the groups are able to bulk
seed, and in collaboration with KARI Seed Unit – Katumani, which is being distributed
through a stockist in Machakos town.
CARE Kenya has also been working with various communities to help alleviate poverty and
improve food security within the households by supporting the acquisition, and bulking of
cereals, pulses (green grams, beans, cowpeas) and horticultural (okra, onions, tomatoes,
mangoes, chilies) seeds. CARE facilitates groups of poor farmers in areas of their
intervention to acquire seed. CARE acquires the seeds from seed companies on behalf of the
farmers at cost. Whenever farmers are given the seed on credit, they are required to return
double the quantities given at harvest. This kind of intervention has enabled farmers to
acquire and use improved seed thus improving production on their farms. These initiatives
have led to increase in improved seed use among farmers in the marginal areas.
In Homa Bay, Mbita and Kitui districts for example, the Catholic Diocese through its
subsidiary the Catholic Relief Services (CRS) working with KARI and CIMMYT have
embarked on efforts encourage to community seed multiplication, by promoting the bulking
of groundnuts, cassava, sweet potatoes, sorghum and maize. The Adventist Development
Relief Agency (ADRA), also works with organized farmer associations to improve their food
security situation in assisting poor farmers in drought-prone areas to access seed. The farmers
are given different agriculture skills to enable them boost their agricultural production (seed
multiplication, tree production). To ensure seed accessibility to farmers, ADRA assists the
farmer associations to build seed stores, and in collaboration with KARI-Katumani, distribute
clean seed to the groups for multiplication.
The strength of community approach to seed bulking lies in the fact that the communities
understand their constraints. They therefore come together to address their own problem. The
groups are able to preserve the local germplasm. However, problems of group dynamics may
hinder the thriving of the groups. It is worth noting that many of the groups come together
because of the funding they are likely to get from the donors to support the project. Once the
donors pull out, and no funding is trickling in, most groups also collapse. It is therefore
imperative to mould the groups around business models so that they can be self-sustaining.

37
The main challenge to community-based approaches to seed production is that the production
systems are not recognized by Kenya Plant Health Inspectorate Services (KEPHIS). Most of
these groups cannot meet KEPHIS conditions of keeping the required isolation distances,
especially maize seed. The groups cannot meet the licensing fees of a seed merchant if they
want to be registered as seed merchants. And, even in situations where they are able to meet
these requirements, there have been delays by KEPHIS in seed inspections. The seed
therefore ends up not being certified, and so cannot be traded as commercial seed.
Sometimes, the groups lose all seed to drought and have to replenish the seed, which often
takes time. Box 3 provides examples of some successful community-based approaches to
assist farmers to access good quality seed.
Box 3
Examples of Community Seed Multiplication Initiatives
Tuangaze Kyawango Women group (Machakos), made up of 25 farmers, began initially as a
Women’s Merry-go-round, to assist its members acquire household items. With time, the group
identified the need to address their perennial problem of lack of quality seed. With the assistance of
the Ministry of Agriculture’s Extension Staff, they received training in seed bulking. They also got
support from IFAD and germplasm from KARI seed unit. The group has been bulking beans,
cowpeas, cassava, sweet potatoes, and sorghum. The group has been able to meet their need for
quality seed for these commodities and even sell to their neighbors.
Wendano Kwa Muonga (Machakos) is a farmers group with 40 members. It started as an
agricultural group leasing renting land and producing horticultural crops. The groups got training
from Ministry of Agriculture extension staff on crop husbandry and seed production. It has been
bulking cassava, beans, cowpeas, sorghum, millet, sweet potatoes, green grams and pigeon peas.
The bulking takes place in the selected farmers’ field, but the group does the operations. The
members are then provided with the seed. Through this, the farmers are able to get the right seeds.
Because of the success realized, the group has built a seed bank to store the bulked seed. They also
intend to establish an irrigation system to ensure they are able to bulk seed even during drought.
TATRO Central Women Group, (Siaya) was established with the objective of improving women’s
conditions by involving them in agricultural development and small agribusinesses. The aim for the
group is to first meet their own seed supply needs and then sell the surplus to other farmers. The
group has been collaborating with CIMMYT and KARI to produce Open Pollinated Maize varieties,
which are stress-tolerant and can be recycled. The group is also participating in the Rockefeller
Foundations’ Seed Variety Trials, which promotes crop diversification, seed production and
marketing. In 2005, the group produced 4.5 tonnes of seed maize and 2 tonnes of beans, and
benefited nearly 1000 small-scale farmers from the area. The group, and similar ones, could benefit
from a community seed storage bank, which allows participants to deposit and withdraw seed as
needed.
38
The community-based approaches often suffer from bad weather conditions and non-
supportive government policies. Due to poor weather conditions in some parts of the country
for the last four seasons, seed production and multiplication activities have been severely
affected, to a point that most of the groups have lost the basic seed and need replenishment
from companies and supporting organizations. Government policy that put very stringent
conditions that must be met to produce seed, especially seed maize have also hampered
efforts by communities trying to produce their own affordable seeds.
In addition, most of the groups lack sufficient technical know-how and equipment to enable
them carry out their seed production activities effectively; they need constant extension to
equip them with the necessary skills. With the ill-facilitated extension service, acquisition of
these skills is not possible. Moreover, there is lack of markets for seeds produced by the
community-based initiatives, since the groups must obtain merchant’s licenses to be able to
market their seeds outside their localities. Also, farmer communities are not well sensitized
on the role of such community seed producers, from whom they can acquire clean quality
seed that is disease free to plant in their farms.
Drought and high poverty levels have also contributed to the non-sustainability of these
groups because some group members end up consuming the seeds. In the end such efforts
might not meet the objectives of self-sustainability in clean, quality seed.
3.2.2 Market-led approaches to seed access
In a liberalized economy, agricultural inputs are a private good. If the private sector functions
effectively and efficiently, it should respond to the demand for inputs from all users,
including smallholders. And, if inputs are easily accessible and affordable to farmers, their
utilization increases with the resultant increase in farm productivity and household incomes.
Therefore, fostering sustainable commercial linkages between input supply firms and rural
enterprises in the distribution chain will increase the flow of inputs, and associated product
knowledge, into rural areas and farming communities. Easier access will, in turn, result in
increased uptake and use of inputs by smallholder farmers leading to increased productivity
and rural incomes.

39
Besides the commercial availability of inputs, however, there are other important constraints
hampering demand for inputs by smallholders. These include: poverty; weak purchasing
power among smallholders; ineffective rural savings and credit services to respond to the
cash constraints; poor access to information and technologies; poor output prices; and poor
market information and market access. These constraints place impediment to investments in
productivity enhancing inputs.
Some interventions have recognized that the best way to increase utilization of productivity-
enhancing inputs, seed included, is to approach it from the market perspective. Rockefeller
Foundation, for example, has been funding interventions in Western Kenya that aim at
empowering farmers through markets to get out of their poverty traps by adopting high-
yielding technologies. The interventions target cereals and pulses and are formulated around
the Theory of Change (ToC), which postulates that better access to markets for both the
inputs and outputs leads to increased input use and adoption of improved technology. The
interventions have four components, namely, cereal banking, agricultural input delivery
system, market information and technology transfer through Seed Variety Trials (SVT). The
Theory hypothesizes that the sum of all the interventions together should be greater than the
sum of the impact of the individual interventions. Table 15 presents results of use of hybrid
maize seed and fertilizers by beneficiary group to determine whether there are inherent
differences between the groups in their usage of productivity-enhancing technologies.
Table 15: Technology Adoption and Agricultural Input Use by Beneficiary Group
Variable
Cereal Bank
Members
(N=390)
Spillover
Group
(N=1183)
Control
Group
(N=106)
Total Sample
(N=1682)
Level of Adoption
Use of Hybrid Maize (%) 57.4 50.0 49.5 51.7
Use of Fertilizer (%) 84.9 76.2 77.1 78.2
Household Characteristics
% Net Sellers 33.3 25.4 23.6 27.1
% below poverty line 69 82 86 79
Source: Rockefeller Foundation Western Kenya Baseline Survey 2005, Author’s Calculations

40
The beneficiary groups are categorized into direct beneficiaries (cereal bank members),
indirect beneficiaries (those who benefit from intervention spillovers) and non-beneficiaries
(control group). There exists a wide dispersion in technology usage among beneficiary
groups. Cereal bank members tend to use hybrid seeds (57.4%) and fertilizer (84.9%) than
either of the other two beneficiary categories, thus confirming the Theory of Change
hypothesis. Among the beneficiary groups, the CB members have lower incidences of
poverty (69%) compared to the control (82% and 86% respectively). Also CB members tend
to be net maize sellers (33%) compared to the other beneficiary groups.
The Rockefeller Foundation’s intervention targets not only farmers but also the input
stockists. This is as a realization that rural stockists face challenges such as lack of the
required capital to meet the input requirements of the producers, lack of knowledge on inputs
and business skills. The intervention is to provide training to stockists as well as a credit
guarantee system between the commercial manufacturer of agricultural inputs and the input
stockists. The intervention through the Agricultural Marketing Trust of Kenya (AGMARK), a
local NGO, provides commercial linkages between private sector input suppliers and
stockists to facilitate the input flow to the rural areas. The aim is to ensure continuous flow of
inputs and bring the inputs within the farmers’ reach. AGMARK also facilitates credit
guarantee scheme, the objective of which is to improve agricultural productivity and incomes
of smallholder farmers in Western Kenya. The underlying hypothesis is that if inputs are
more accessible to stockists, this leads to increased purchase and use by smallholder farmers.
A significant impact of the AGMARK intervention has been increased fertilizer and hybrid
seed adoption among farmers (Table 16). Fertilizer adoption rate is higher among households
who purchased inputs from credit guarantee-affiliated stockists (91%) than those who
purchased inputs from non-affiliated stockists (69%). Similarly, adoption of hybrid maize is
higher among farmers purchasing seed from AGMARK-affiliated stockists (73%) compared
to those sourcing seed from the non-affiliated stockists (48%). Mean fertilizer application
rates on maize fields (both basal and top-dressing fertilizers) are also relatively higher among
farmers purchasing inputs from the credit guarantee-affiliated stockists (76 kg per acre) than
for the non-affiliated stockists (66 kg per acre). These trends could be attributed to the advice
and input demonstration services offered by the stockists, backed up with the credit extension
to the farmers.
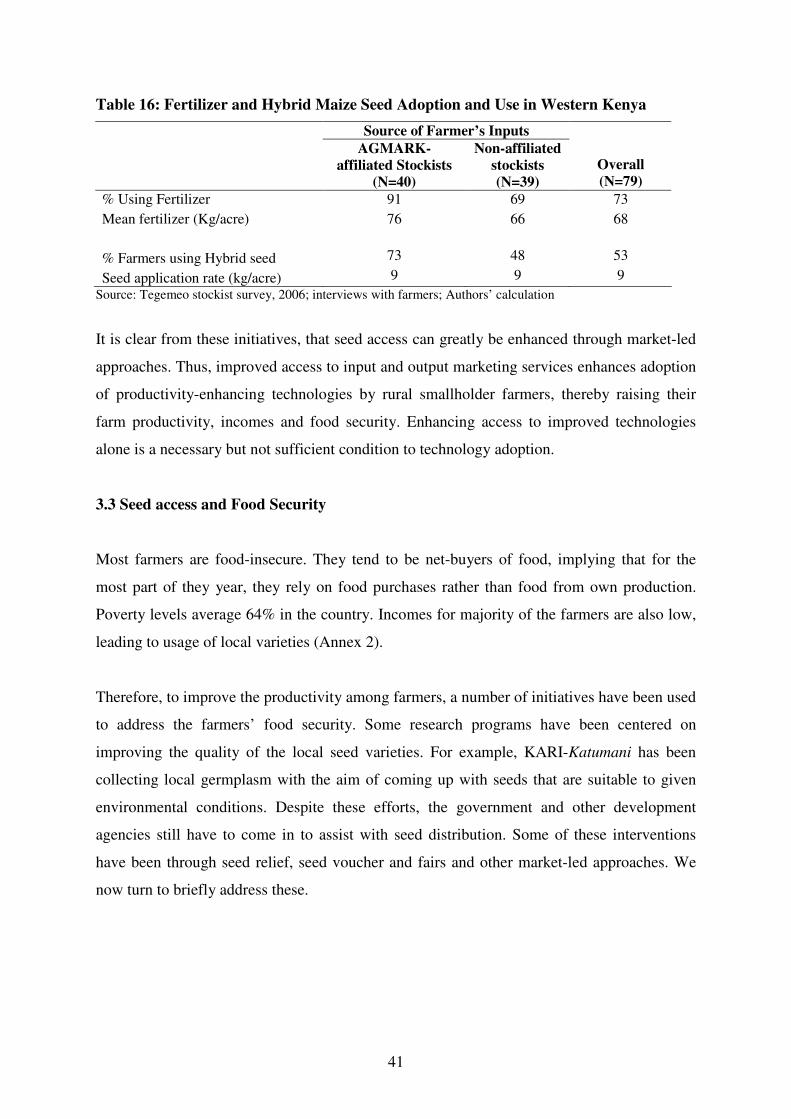
41
Table 16: Fertilizer and Hybrid Maize Seed Adoption and Use in Western Kenya
Source of Farmer’s Inputs
AGMARK-
affiliated Stockists
(N=40)
Non-affiliated
stockists
(N=39)
Overall
(N=79)
% Using Fertilizer 91 69 73
Mean fertilizer (Kg/acre) 76 66 68
% Farmers using Hybrid seed 73 48 53
Seed application rate (kg/acre) 9 9 9
Source: Tegemeo stockist survey, 2006; interviews with farmers; Authors’ calculation
It is clear from these initiatives, that seed access can greatly be enhanced through market-led
approaches. Thus, improved access to input and output marketing services enhances adoption
of productivity-enhancing technologies by rural smallholder farmers, thereby raising their
farm productivity, incomes and food security. Enhancing access to improved technologies
alone is a necessary but not sufficient condition to technology adoption.
3.3 Seed access and Food Security
Most farmers are food-insecure. They tend to be net-buyers of food, implying that for the
most part of they year, they rely on food purchases rather than food from own production.
Poverty levels average 64% in the country. Incomes for majority of the farmers are also low,
leading to usage of local varieties (Annex 2).
Therefore, to improve the productivity among farmers, a number of initiatives have been used
to address the farmers’ food security. Some research programs have been centered on
improving the quality of the local seed varieties. For example, KARI-Katumani has been
collecting local germplasm with the aim of coming up with seeds that are suitable to given
environmental conditions. Despite these efforts, the government and other development
agencies still have to come in to assist with seed distribution. Some of these interventions
have been through seed relief, seed voucher and fairs and other market-led approaches. We
now turn to briefly address these.
42
3.3.1 Seed Relief
Drought has been a persistent problem in Kenya and the incidences seem to increase in
frequency. When drought occurs, farmers experience crop failure leading to famine. The
response by government and the donor community has been to supply those affected by
drought with food relief. This is often followed by distribution of relief seed, to help renew
the crops lost during drought. Government relief seed is channelled through the Arid Lands
Resource Management Programme (ALRMP), which then uses other agencies such as the
Ministry of Agriculture staff, Catholic Relief Services and Anglican Churches of Kenya to
distribute the seed to farmers.
Evidence shows that in some of the affected districts, up to 10% of seed used by farmers are
relief seed. The seed relief distribution targets all farmers vulnerable to seed deficiencies.
Each farmer ends up getting a smaller quantity of seed (often not exceeding 2kg) that does
not meet the household’s seed demand. Farmers have either to either buy more or use their
local variety. This is therefore viewed as an ineffective way to tackle the seed problem.
However, if the quantity of seed relief is sizeable, this may dampen the private sector
initiatives to promote seed trade in the regions, and goes against the spirit of liberalized
market. A further constraint to this initiative is that government often brings seeds not
suitable to the conditions of the affected districts leading further to crop failures. Also, the
timing of seed distribution is questionable as it is often distributed late after the rainy season
has set in. Also the method of seed distribution is critical. The approach to seed relief should
target average farmers than all the farmers. This way, they can get more seed, be more
productive and then be able to feed the very poor farmers. The assumption here is that
extremely poor farmers are not very good farmers.
While drought is a calamity that may strike anytime, these initiatives are not sustainable. The
government needs to have strategies that are sustainable. One such strategy is to promote the
drought tolerant crops e.g., sorghum, millet, cassava, and sweet potatoes. A further way to
minimize seed shortages during drought is to encourage development of small irrigation
schemes along the numerous streams where farmers can bulk seed and then sell to other
farmers. Seed relief rarely takes cognizance of the extent of seed insecurity. Rather, the
decision to distribute relief food is guided by the preceding food aid and interventions

43
3.3.2 Seed Vouchers and Fairs
Natural disasters often result in food crisis among farmers. The disasters come in different
forms but include drought and unusual rainfall patterns, poor harvests, and continuous decline
in economic conditions. In many cases, governments and development agencies respond to
these calamities through the free distribution of seeds and tools, as an approach to agricultural
recovery. The underlying concept behind the seed relief is that farmer seed quality is poor,
and the prevailing system insists on seed certification. This is not normally the case.
Seed fairs are markets organized to empower the disaster-affected households to access seed
through exchange vouchers (Bramel & Remington, 2005). The seed voucher and fairs address
the problem of lack of household access of seed following a disaster and, in doing so,
challenges the assumption that seed is unavailable in a community during emergency. It is a
concept whereby farmers within a specific locality bring their own seeds to sell to other
farmers. The objective of seed vouchers and fairs is to enhance food security and access to
seeds of preferred crops as well as to provide seed security to insecure families.
Seed fairs are organized by NGOs. In Kenya, the Catholic Relief Services (CRS) and World
Vision have held seed fairs in various parts of the country. In the Seed fairs, farmers are
brought together to trade their local seed varieties with other farmers within the localities.
The seeds are traded through seed vouchers given to farmers by the facilitating agency. Once
transaction has been done, the traders then redeem the vouchers from the concerned agency.
The framework involves first identifying the disaster-affected families, often in collaboration
with the government officials. Once identified, the families are given a set of small-
denomination vouchers to be exchanged for seed at specially organized seed fairs. The
concerned agency also informs prospective seed sellers of the date, location and modalities of
the seed fair. On the fair date, a fairs committee recommends sale price for different crops,
registers the seed sellers, and redeems vouchers exchanged for seed at the end of the fair.
The advantage of the Seed vouchers and fairs is that it strengthens the farmer seed
procurement systems. It is cost-efficient and has a multiplier effect in the community. Also, it
allows commercial sector participation and provides an opportunity to promote improved
varieties for farmer evaluation. However, the framework assumes that seed is available from
farmer seed systems and is of good quality, but that there is problem of access.

44
4.0 Key Policy Lessons
The study has shown that the seed sector is highly diversified and farmers use both formal
and informal seed systems to access seed. While the informal seed system is important in
terms of volume of seed used, the formal seed system is important in terms of value of seed
purchased. Both community-based and market-led approaches are used to avail seed to
farmers and encourage utilization of improved seeds. Market-led approaches aim at
enhancing competitiveness and flow of seed from the seed companies and other producers to
the farmers. It has been generally shown that the formal seed system, comprising public and
private seed companies, has been unable to meet demand for improved seeds, making farmers
look for alternative sources of seed. And where formal seed is available, the cost has been
prohibitive to most small-scale farmers. The community-based approaches therefore enhance
access to seed where the formal seed system has not been effective in supplying the seed to
farmers. These approaches operate with the backing of various international organizations,
public and private research institutions and NGOs, a perfect example of private-public
partnership
A key implication emanating from the community-based and market-led approaches is that
Public-Civil society-Private sector partnerships are essential ingredient to the development
and uptake of technology. This has been shown by the involvement of the government, the
civil society (NGOs), the research institutions and donor communities in the production and
distribution of seed among the farmers. To be effective, however, the partnerships must take
cognizance of the farmer conditions and integrate this into the research agenda. For example,
research institutions should work with the community-based groups to produce varieties that
are suitable to the farmer conditions. Efforts should be made to strengthen collaboration
among the MOA, KARI and NGOs so that their initiatives to support farmers are harnessed
and used effectively. This will enhance the uptake of the technology. Also, government seed
relief programs should focus on commodities that can thrive well in the affected areas, rather
than promote maize as the staple food.
Second, it has been shown that farmers would be willing to use improved seed for those
commodities that have markets, implying that markets are important for uptake of
technology. As the Theory of Change has shown, a well-functioning output market will
provide incentives for the farmer to demand productivity-enhancing inputs. Therefore, there
45
is need to support and strengthen the working of output markets, as a way of enhancing
access and utilization of the improved seed. Seed companies, farmers and stakeholders should
work together to organize field demonstrations and establish trial plots for the various seeds.
Also input suppliers should be supported to take their inputs near farmers to enhance access.
Third, there is need to tackle the key factors influencing seed uptake, both from the demand
and supply perspective. This includes making seed available and affordable to the farmers
and strengthening extension services for farmers. The study has shown that those who use
improved seed are likely to get extra income compared to those using the seed from informal
sources improved seed. There is also need for better understanding the seed security of target
seed systems before employing such approaches as the seed fairs.
Fourth, there is no doubt that the informal seed systems will continue to play important role
in seed access and utilization in Kenya in the foreseeable future. Yet the regulations do not
seem to recognize its role in the seed system. There is therefore need to provide for the
informal seed system in the law. As long as the communities produce seed and sell within
their localities, KEPHIS conditions should be relaxed to allow faster multiplication of seeds
and improve on-farm use of improved seeds. This could be achieved through the introduction
of Quality Declared Seed (QDS), which provides for different seed quality levels to meet the
farmers’ needs (see Kavoi, et al, 2004 for a detailed discussion of this approach).
Fifth, the role of KEPHIS should be reviewed in light of the liberalized seed sector. It is felt
that the seed industry should move towards self-regulation by strengthening the roles of
lobby groups, such as Seed Trade Association of Kenya (STAK) and the Kenya Federation of
Agricultural Producers (KENFAP). STAK, for example should be recognized with the seed
laws and strengthened to champion the course of seed traders. This happens for example in
South Africa, where South Africa National Seed Organization (SANSOR), does the
registration and certification of seed on behalf of the government. Under the new
arrangement, KEPHIS would only come in at the most necessary stages of germination and
purity tests. This move is crucial as the country moves towards the regional integration. There
is also need to strengthen the farmer associations to be able to champion the interests of the
farmers.

46
Sixth, to enhance competition in the seed industry, and enhance availability, access and
utilization of improved seed by farmers, the government should ensure a level playing ground
for local and foreign seed companies. There should be proper implementation of regulations
governing the seed industry. Also there is need to review the seed regulations to ensure the
provisions are enforceable and duly enforced. The Seeds and Plant Varieties Act (Cap 326)
needs to be amended to allow for the enforcement of the various seed committees and
tribunals. Equally, the role of KEPHIS needs to be revisited to allow for the seed industry to
thrive. As it is currently, its role stifles the growth of the seed industry. KEPHIS also needs to
build capacity to cope with the demand for its services.
47
References
Ayieko M, Tschirley D & Mathenge M (2005) “Fresh Fruit and Vegetable consumption
patterns and supply chain systems in urban Kenya: Implications for policy and investment
priorities” Egerton University Tegemeo Institute WPS 16/2005
Bramel, P. J. & Remington, T (2006) CRS Seed Vouchers and Fairs: A meta-analysis of their
use in Zimbabwe, Ethiopia and Gambia. Nairobi: Catholic Relief Services
Eilitta, M. 2006. Achieving an African Green Revolution: A vision for sustainable
agricultural growth in Africa. Abuja, Nigeria: Background Paper Prepared for the African
Fertilizer Summit, June 9-13.
FAO (2004). ‘Towards effective and sustainable seed relief services’ FAO Plant Production
and Protection Paper 181
GoK (2004). The status of maize seed industry in Kenya: A value chain analysis, MoA,
Nairobi, Kenya
GoK (2006) “Horticulture division Annual Report, 2005”, Ministry of Agriculture
Jolliffe, Dean (1998). “Skills, Schooling, and Household Income in Ghana”. The World
Bank Economic Review, Vol. 12, No. 1: 81-104.
Jolliffe, Dean (2004). “The impact of education in rural Ghana: examining household labor
allocation and returns on and off the farm”. Journal of Development Economics, Vol. 73:
287– 314.
Kamau, M. (2002). “An overview of the Kenyan Seed Industry in a Liberalized Environment:
A case of Maize Seed.” Paper presented in A Stakeholder Consultation Meeting, Norfolk Hotel,
Nairobi, 20th August, 2002
48
Kavoi M M &Tschirley D L (2004) Improving Kenya's Domestic Horticultural Production
and Marketing System: Current Competitiveness, Forces of Change, and Challenges for the
future Volume I: Horticultural Production. Egerton University Tegemeo Institute WPS
08A/2004
Michaelowa, K (2000). “Returns to Education in Low Income Countries: Evidence for
Africa”. Paper presented at the annual meeting of the Committee on Developing Countries of
the German Economic Association. Hamburg.
Muyanga, M, Ayieko M W, and Gem A K (2005). ‘Analysis of Agricultural Productivity in
Kenya’ A World Bank Agricultural Policy Review Technical Background Paper, May 2005
Nyongesa M, Kinyae PM, Gildemacher P, Wakahiu M, Walingo A, Maingi G, and Kabira JN
(2005). ‘Promotion of Potato Research-Farmer Partnerships’ KARI-Tigoni
Nyoro J M, and Ariga J M (2004). ‘Preparation of an Inventory of Research work undertaken
in Agricultural/Rural Sector in Kenya’, Paper for the World Bank, July 2004.
Ogolla J.B., Ayieko M.W., Orawo A.O and Kimani F.W (2002) “Factors that influence the
Seed Potato demand at the Farm Level: The case of Potato production in Nakuru district,
Kenya.” Background paper for ECAPAPA’s Agricultural Input Studies
Remington T, Maroko J, Walsh S, Omanga, P & Charles E (2002). ‘Getting off the Seeds-
and-Tools,Treadmill with CRS Seed Vouchers and Fairs.’ Disasters, 2002, 26(4): 316-328
Republic of Kenya (2004) Strategy for Revitalizing Agriculture 2004 – 2014. MOA and
MOLFD, March 2004
Tegemeo Institute. 2006 a. Evaluation of CNFA/AGMARK Kenya programs in western
Kenya. Nairobi, Kenya.
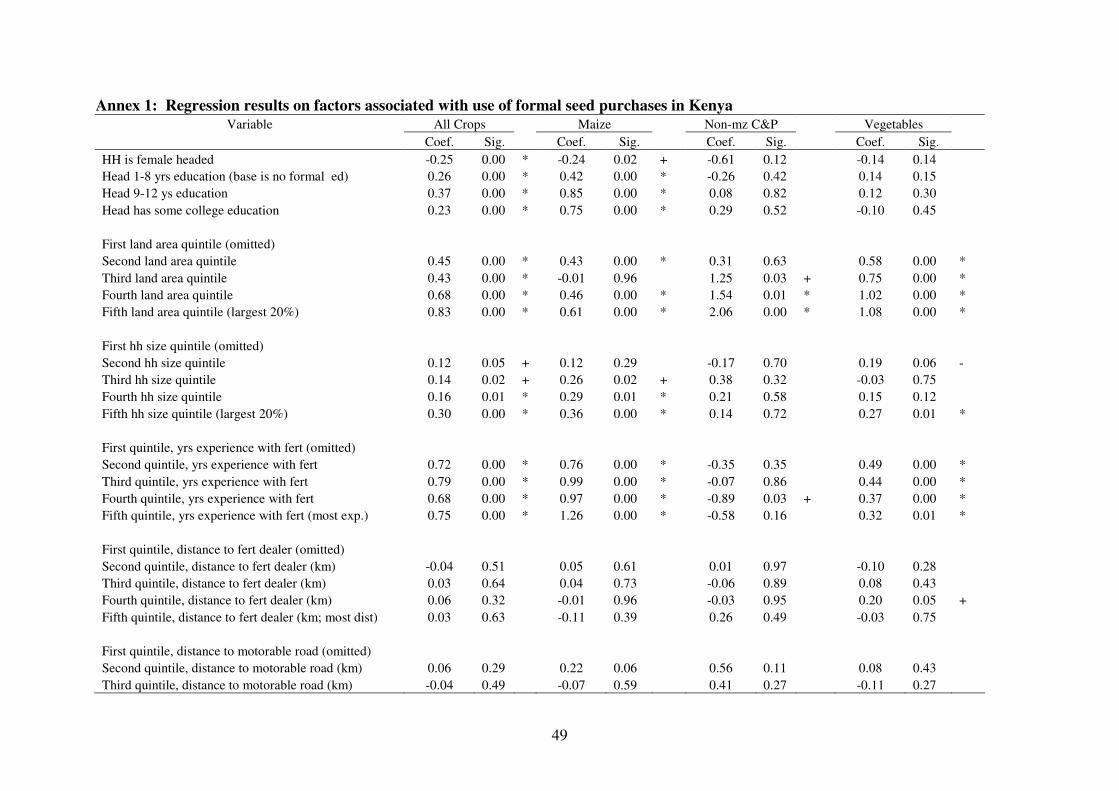
49
Annex 1: Regression results on factors associated with use of formal seed purchases in Kenya
Variable All Crops Maize Non-mz C&P Vegetables
Coef. Sig. Coef. Sig. Coef. Sig. Coef. Sig.
HH is female headed -0.25 0.00 * -0.24 0.02 + -0.61 0.12 -0.14 0.14
Head 1-8 yrs education (base is no formal ed) 0.26 0.00 * 0.42 0.00 * -0.26 0.42 0.14 0.15
Head 9-12 ys education 0.37 0.00 * 0.85 0.00 * 0.08 0.82 0.12 0.30
Head has some college education 0.23 0.00 * 0.75 0.00 * 0.29 0.52 -0.10 0.45
First land area quintile (omitted)
Second land area quintile 0.45 0.00 * 0.43 0.00 * 0.31 0.63 0.58 0.00 *
Third land area quintile 0.43 0.00 * -0.01 0.96 1.25 0.03 + 0.75 0.00 *
Fourth land area quintile 0.68 0.00 * 0.46 0.00 * 1.54 0.01 * 1.02 0.00 *
Fifth land area quintile (largest 20%) 0.83 0.00 * 0.61 0.00 * 2.06 0.00 * 1.08 0.00 *
First hh size quintile (omitted)
Second hh size quintile 0.12 0.05 + 0.12 0.29 -0.17 0.70 0.19 0.06 -
Third hh size quintile 0.14 0.02 + 0.26 0.02 + 0.38 0.32 -0.03 0.75
Fourth hh size quintile 0.16 0.01 * 0.29 0.01 * 0.21 0.58 0.15 0.12
Fifth hh size quintile (largest 20%) 0.30 0.00 * 0.36 0.00 * 0.14 0.72 0.27 0.01 *
First quintile, yrs experience with fert (omitted)
Second quintile, yrs experience with fert 0.72 0.00 * 0.76 0.00 * -0.35 0.35 0.49 0.00 *
Third quintile, yrs experience with fert 0.79 0.00 * 0.99 0.00 * -0.07 0.86 0.44 0.00 *
Fourth quintile, yrs experience with fert 0.68 0.00 * 0.97 0.00 * -0.89 0.03 + 0.37 0.00 *
Fifth quintile, yrs experience with fert (most exp.) 0.75 0.00 * 1.26 0.00 * -0.58 0.16 0.32 0.01 *
First quintile, distance to fert dealer (omitted)
Second quintile, distance to fert dealer (km) -0.04 0.51 0.05 0.61 0.01 0.97 -0.10 0.28
Third quintile, distance to fert dealer (km) 0.03 0.64 0.04 0.73 -0.06 0.89 0.08 0.43
Fourth quintile, distance to fert dealer (km) 0.06 0.32 -0.01 0.96 -0.03 0.95 0.20 0.05 +
Fifth quintile, distance to fert dealer (km; most dist) 0.03 0.63 -0.11 0.39 0.26 0.49 -0.03 0.75
First quintile, distance to motorable road (omitted)
Second quintile, distance to motorable road (km) 0.06 0.29 0.22 0.06 0.56 0.11 0.08 0.43
Third quintile, distance to motorable road (km) -0.04 0.49 -0.07 0.59 0.41 0.27 -0.11 0.27

50
Variable All Crops Maize Non-mz C&P Vegetables
Coef. Sig. Coef. Sig. Coef. Sig. Coef. Sig.
Fourth quintile, distance to motorable road (km) 0.01 0.84 0.18 0.12 0.55 0.11 -0.14 0.14
Fifth quintile, dist. to motorable road (km; most dist.) -0.14 0.04 + -0.22 0.10 0.04 0.92 -0.07 0.52
First quintile, value of hh assets (omitted)
Second quintile, value of hh assets (Ksh) 0.23 0.00 * 0.50 0.00 * 0.24 0.58 0.21 0.05 +
Third quintile, value of hh assets (Ksh) 0.27 0.00 * 0.45 0.00 * 0.26 0.56 0.16 0.13
Fourth quintile, value of hh assets (Ksh) 0.42 0.00 * 0.73 0.00 * 0.18 0.69 0.40 0.00 *
Fifth quintile, value of hh assets (highest value) 0.43 0.00 * 0.56 0.00 * 0.32 0.47 0.23 0.04 +
Coastal Lowlands (omitted)
Eastern Lowlands -1.26 0.00 * -1.66 0.00 * -1.50 0.06 - -0.65 0.00 *
Western Lowlands 0.14 0.22 -0.83 0.00 * 1.22 0.03 + 0.73 0.00 *
Western Transitional 0.09 0.48 0.12 0.41 -1.02 0.36 0.10 0.49
High Potential Maize Zone 0.45 0.00 * 1.60 0.00 * 1.24 0.02 + -0.12 0.30
Western Highlands 0.21 0.11 .122 0.41 -1.03 0.36 0.10 0.49
Central Highlands 0.14 0.25 0.16 0.17 0.49 0.41 -0.32 0.01 *
Marginal Rain Shadow 0.42 0.00 * 0.46 0.03 + 1.90 0.00 * -0.09 0.67
Tubers (omitted from overall regression)
Maize 6.04 0.00 *
Other cereals and pulses 1.59 0.00 *
Vegetables 4.30 0.00 *
Fodder 2.19 0.00 *
Fruit trees 2.18 0.00 *
Flowers 3.67 0.00 *
Wheat 3.16 0.00 *
Sunflower 5.75 0.00 *
Other vegetables (omitted from vegetable regression)
Carrots 8.62 0.00 *
French beans 6.91 0.00 *
Cabbage 6.20 0.00 *
Snowpea 5.60 0.00 *
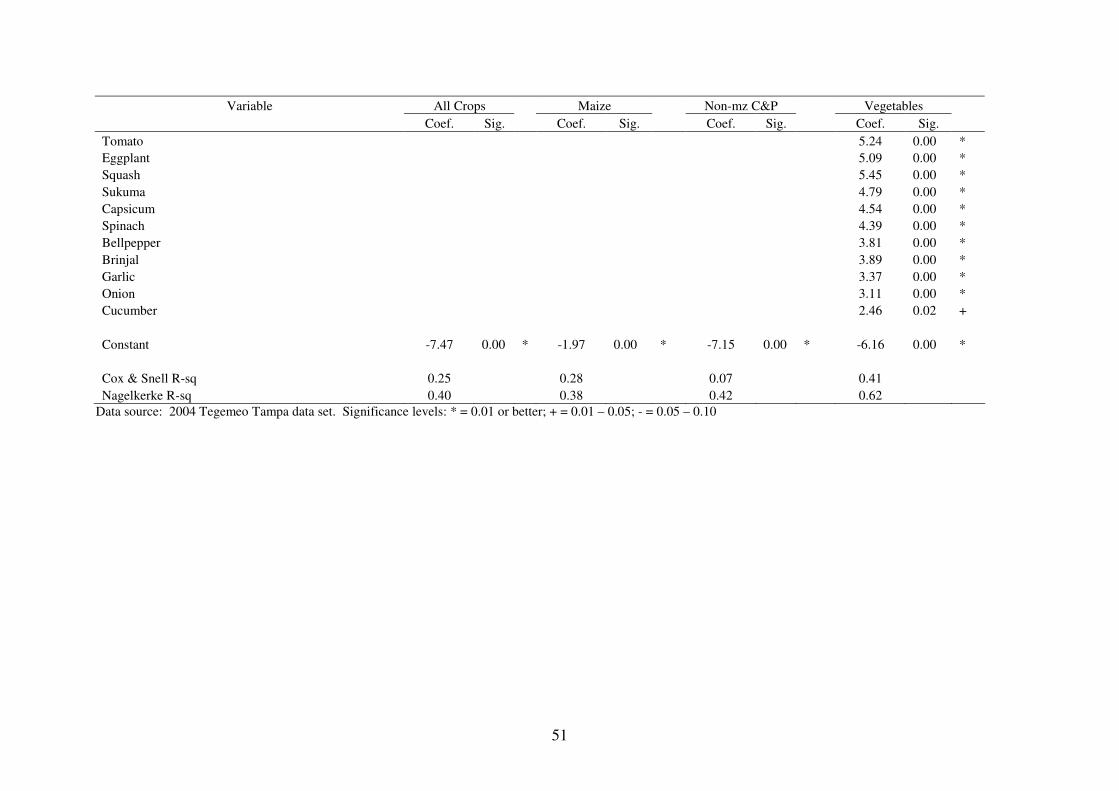
51
Variable All Crops Maize Non-mz C&P Vegetables
Coef. Sig. Coef. Sig. Coef. Sig. Coef. Sig.
Tomato 5.24 0.00 *
Eggplant 5.09 0.00 *
Squash 5.45 0.00 *
Sukuma 4.79 0.00 *
Capsicum 4.54 0.00 *
Spinach 4.39 0.00 *
Bellpepper 3.81 0.00 *
Brinjal 3.89 0.00 *
Garlic 3.37 0.00 *
Onion 3.11 0.00 *
Cucumber 2.46 0.02 +
Constant -7.47 0.00 * -1.97 0.00 * -7.15 0.00 * -6.16 0.00 *
Cox & Snell R-sq 0.25 0.28 0.07 0.41
Nagelkerke R-sq 0.40 0.38 0.42 0.62
Data source: 2004 Tegemeo Tampa data set. Significance levels: * = 0.01 or better; + = 0.01 – 0.05; - = 0.05 – 0.10

52
Annex 2: Composition of Household Income, by Agro-Regional Zone
Agro-Regional Zone
Household Characteristic
Coastal
Lowland
Eastern
Lowland
Western
Lowland
Western
Transitional
High Potential
Maize
Western
Highland
Central
Highland Overall
Total Income (Ksh) 160,837 174,770 92,187 120,775 212,083 105,922 176,318 160,554
Net crop income (Ksh) 32,355 36,316 22,800 53,563 79,058 41,765 67,560 54,383
Net livestock income (Ksh) 12,291 15,235 10,685 19,148 49,948 21,138 28,670 28,028
Total Off-Farm Income (Ksh) 116,190 123,219 58,702 48,064 83,077 43,018 80,087 78,143
Business Income (Ksh) 75,089 48,647 19,412 20,396 41,473 13,718 30,519 33,844
Salaries & Remittances (Ksh) 41,101 74,572 39,290 27,667 41,604 29,300 49,569 44,299
Mean value of assets (Ksh) 156,859 157,233 105,598 70,981 341,594 71,638 255,267 164,357
Proportion of households with:
Business Income (%) 73 59 73 55 49 53 47 56
Salaried Income (%) 62 70 66 50 48 74 62 62
HH below Poverty (%) 73 59 73 55 49 53 47 64