tees valley job vacancies - educationvillage.org.uk valley job vacancies... · figure 2: change in...
TRANSCRIPT
Page 1 of 42
Tees Valley Job Vacancies
January – December 2017
Contents Page
1. Introduction 2
2. Key Findings 3
3. Vacancy Summary by Geography 5
4. Occupational Groups 10
5. Detailed Occupations 14
6. Average Wage 16
7. Top Employers 18
8. Job Vacancies by Key Sector 19
9. Education 26
10. Top Skills 28
11. Conclusions 31
12. Appendix A – Sector Definitions 32
13. Appendix B – Detailed Occupation Changes by Local Authority
33
June 2018
Tees Valley Job Vacancies January – December 2017
Page 2 of 42
1. Introduction
This report is an update on the characteristics of job vacancies within Tees
Valley covering the period January 2017 – December 2017 (inclusive). Tees
Valley covers the five local authority districts of Darlington, Hartlepool,
Middlesbrough, Redcar and Cleveland and Stockton-on-Tees.
The data used is drawn from the commercial ‘Labour Insight Jobs (Burning
Glass Technologies) product. This searches the internet for job adverts.
Consequently only jobs advertised via the internet will be included in this report.
Occupations are defined by the 2010 Standard Occupational Classification
(SOC) system. TVCA Key Sectors definitions based on the 2007 Standard
Industrial Classification (SIC) system can be found in Appendix A.
Numbers are not comparable with previous reports due to revisions in the
methodology used by Labour Insight to classify vacancies.
The level of representation of job vacancies advertised on the web is open to
question as there may be variations in mode of recruitment by sector and size of
business.
An increase in job vacancies may be an indication of new job creation,
skills shortage vacancies or high staff turnover.
Tees Valley Job Vacancies January – December 2017
Page 3 of 42
2. Key Findings
There were 32,803 job vacancies advertised online in Tees Valley between
January and December 2017.
16,750 Tees Valley residents were unemployed1 in 2017 with 2 jobs
advertised for every unemployed person, this compares to 12 jobs per
unemployed person nationally.
There has been a 4% rise in job vacancies when compared to 2016 (1,403
extra vacancies), in comparison to an 11% increase nationally and a 13%
increase across the North of England2.
The largest number of job vacancies in Tees Valley in 2017 were for Caring
Personal Service occupations with 3,518 job vacancies, followed by
Science, Research, Engineering and Technology Professionals3 with
3,255 vacancies, then Health Professionals with 3,166 vacancies.
The largest rise when compared to 2016 is for Science, Research,
Engineering and Technology professionals, with a 26% increase and
vacancies increasing from 2,591 in 2016 to 3,255 in 2017 (an extra 664
vacancies).
This is followed by a 23% rise in vacancies for Business, Media and Public
Service Professionals with vacancies increasing from 1,612 in 2016 to
1,983 in 2017 (371 extra vacancies).
The average advertised wage in Tees Valley remains competitive at £28,800
compared to a national wage of £35,300. The Tees Valley average has risen
by 4.7% over the last year compared to a 1.7% fall in the average advertised
wage nationally.
The National Health Service advertised the highest number of vacancies in
2017 with 2,258 vacancies.
Out of the 19,117 vacancies which could be allocated to an industry sector,
the Health and Social Care sector shows the highest proportion of
vacancies with 30% of all vacancies (5,816 vacancies) followed by Public
Admin, Defence and Education with 23% (4,492 vacancies).
This large percentage of job vacancies available for public sector jobs
reflects the larger than average public sector employment within Tees
Valley, with latest figures from ONS showing that 25% of all employment
within Tees Valley is public sector, compared to 21% nationally.
1 Unemployed – an average of those claiming either Job Seekers Allowance or Universal Credit and available to work between January – December 2017
2 The North region includes the North East, North West and Yorkshire and Humber.
3 This occupational group includes IT and Telecommunication professionals.
Tees Valley Job Vacancies January – December 2017
Page 4 of 42
Job vacancies advertised in the Tees Valley in 2017 required lower level
skills4 than those advertised nationally, with 36% requiring a Level 2
qualification, compared to 22% nationally and 37% requiring a Level 5 or
above qualification compared to 56% nationally.
However Tees Valley appear to be closing the gap when compared to 2016
with a 28% fall in vacancies requiring a Level 2 qualification (6% fall
nationally) and a 20% rise in vacancies requiring a Level 5 or above
qualification (11% increase nationally).
4 Level 2 qualifications include GCSEs, BTEC First/Diplomas, Traineeships and Intermediate Apprenticeships. Level
5 or above qualifications include Foundation, Bachelor, Honours, Master and Postgraduate Degrees, HND’s and Higher/Degree Apprenticeships.
Tees Valley Job Vacancies January – December 2017
Page 5 of 42
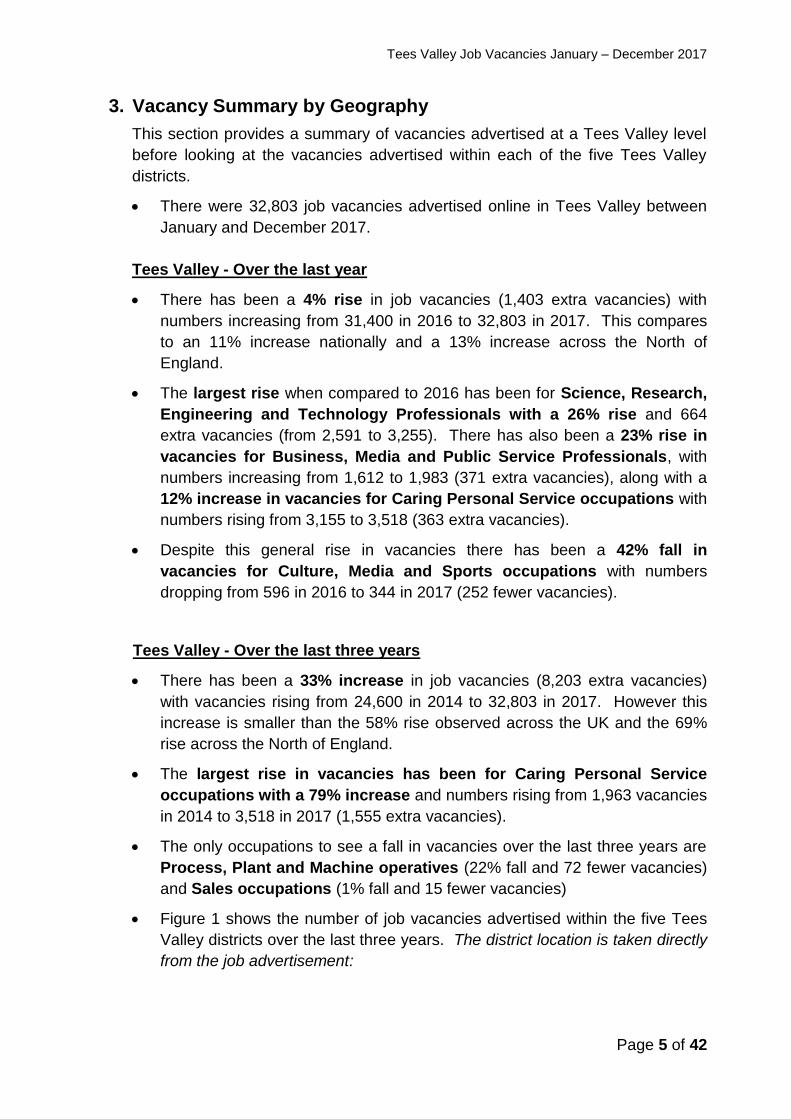
3. Vacancy Summary by Geography
This section provides a summary of vacancies advertised at a Tees Valley level
before looking at the vacancies advertised within each of the five Tees Valley
districts.
There were 32,803 job vacancies advertised online in Tees Valley between
January and December 2017.
Tees Valley - Over the last year
There has been a 4% rise in job vacancies (1,403 extra vacancies) with
numbers increasing from 31,400 in 2016 to 32,803 in 2017. This compares
to an 11% increase nationally and a 13% increase across the North of
England.
The largest rise when compared to 2016 has been for Science, Research,
Engineering and Technology Professionals with a 26% rise and 664
extra vacancies (from 2,591 to 3,255). There has also been a 23% rise in
vacancies for Business, Media and Public Service Professionals, with
numbers increasing from 1,612 to 1,983 (371 extra vacancies), along with a
12% increase in vacancies for Caring Personal Service occupations with
numbers rising from 3,155 to 3,518 (363 extra vacancies).
Despite this general rise in vacancies there has been a 42% fall in
vacancies for Culture, Media and Sports occupations with numbers
dropping from 596 in 2016 to 344 in 2017 (252 fewer vacancies).
Tees Valley - Over the last three years
There has been a 33% increase in job vacancies (8,203 extra vacancies)
with vacancies rising from 24,600 in 2014 to 32,803 in 2017. However this
increase is smaller than the 58% rise observed across the UK and the 69%
rise across the North of England.
The largest rise in vacancies has been for Caring Personal Service
occupations with a 79% increase and numbers rising from 1,963 vacancies
in 2014 to 3,518 in 2017 (1,555 extra vacancies).
The only occupations to see a fall in vacancies over the last three years are
Process, Plant and Machine operatives (22% fall and 72 fewer vacancies)
and Sales occupations (1% fall and 15 fewer vacancies)
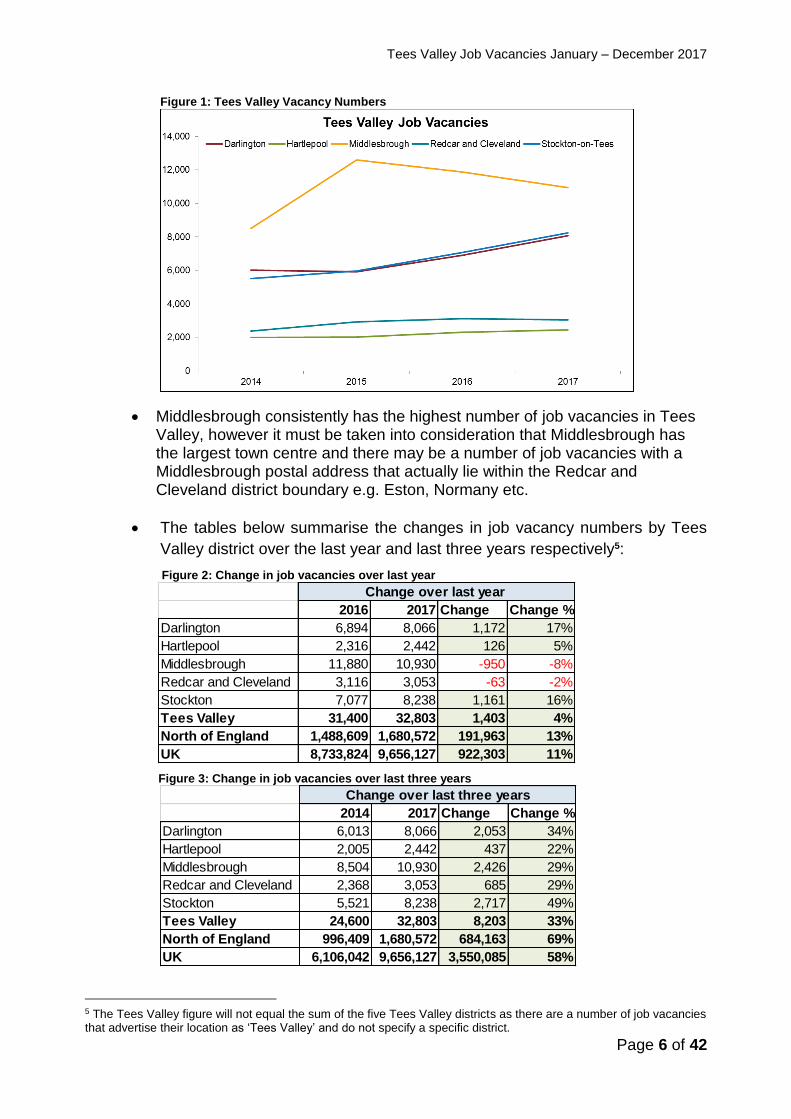
Figure 1 shows the number of job vacancies advertised within the five Tees
Valley districts over the last three years. The district location is taken directly
from the job advertisement:
Tees Valley Job Vacancies January – December 2017
Page 6 of 42
Figure 1: Tees Valley Vacancy Numbers
Middlesbrough consistently has the highest number of job vacancies in Tees Valley, however it must be taken into consideration that Middlesbrough has the largest town centre and there may be a number of job vacancies with a Middlesbrough postal address that actually lie within the Redcar and Cleveland district boundary e.g. Eston, Normany etc.
The tables below summarise the changes in job vacancy numbers by Tees
Valley district over the last year and last three years respectively5:
Figure 2: Change in job vacancies over last year
Figure 3: Change in job vacancies over last three years
5 The Tees Valley figure will not equal the sum of the five Tees Valley districts as there are a number of job vacancies that advertise their location as ‘Tees Valley’ and do not specify a specific district.
2016 2017 Change Change %
Darlington 6,894 8,066 1,172 17%
Hartlepool 2,316 2,442 126 5%
Middlesbrough 11,880 10,930 -950 -8%
Redcar and Cleveland 3,116 3,053 -63 -2%
Stockton 7,077 8,238 1,161 16%
Tees Valley 31,400 32,803 1,403 4%
North of England 1,488,609 1,680,572 191,963 13%
UK 8,733,824 9,656,127 922,303 11%
Change over last year
2014 2017 Change Change %
Darlington 6,013 8,066 2,053 34%
Hartlepool 2,005 2,442 437 22%
Middlesbrough 8,504 10,930 2,426 29%
Redcar and Cleveland 2,368 3,053 685 29%
Stockton 5,521 8,238 2,717 49%
Tees Valley 24,600 32,803 8,203 33%
North of England 996,409 1,680,572 684,163 69%
UK 6,106,042 9,656,127 3,550,085 58%
Change over last three years
Tees Valley Job Vacancies January – December 2017
Page 7 of 42
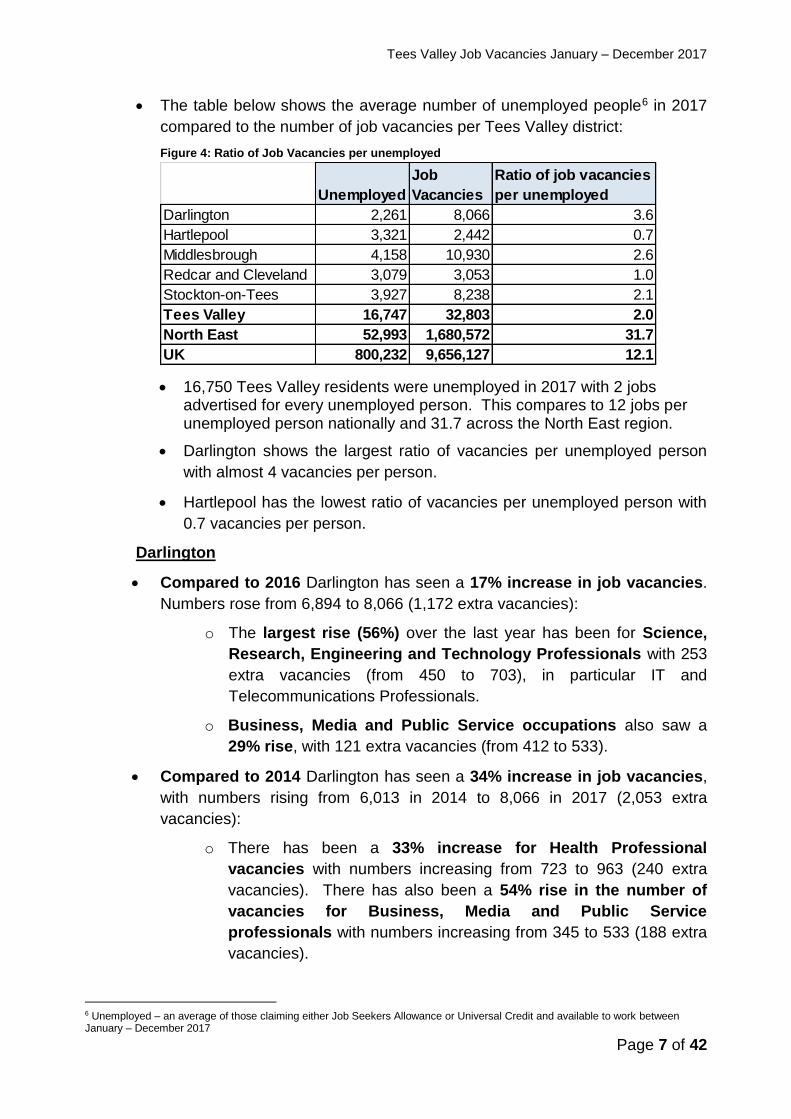
The table below shows the average number of unemployed people6 in 2017
compared to the number of job vacancies per Tees Valley district:
Figure 4: Ratio of Job Vacancies per unemployed
16,750 Tees Valley residents were unemployed in 2017 with 2 jobs advertised for every unemployed person. This compares to 12 jobs per unemployed person nationally and 31.7 across the North East region.
Darlington shows the largest ratio of vacancies per unemployed person
with almost 4 vacancies per person.
Hartlepool has the lowest ratio of vacancies per unemployed person with
0.7 vacancies per person.
Darlington
Compared to 2016 Darlington has seen a 17% increase in job vacancies.
Numbers rose from 6,894 to 8,066 (1,172 extra vacancies):
o The largest rise (56%) over the last year has been for Science,
Research, Engineering and Technology Professionals with 253
extra vacancies (from 450 to 703), in particular IT and
Telecommunications Professionals.
o Business, Media and Public Service occupations also saw a
29% rise, with 121 extra vacancies (from 412 to 533).
Compared to 2014 Darlington has seen a 34% increase in job vacancies,
with numbers rising from 6,013 in 2014 to 8,066 in 2017 (2,053 extra
vacancies):
o There has been a 33% increase for Health Professional
vacancies with numbers increasing from 723 to 963 (240 extra
vacancies). There has also been a 54% rise in the number of
vacancies for Business, Media and Public Service
professionals with numbers increasing from 345 to 533 (188 extra
vacancies).
6 Unemployed – an average of those claiming either Job Seekers Allowance or Universal Credit and available to work between January – December 2017
Unemployed
Job
Vacancies
Ratio of job vacancies
per unemployed
Darlington 2,261 8,066 3.6
Hartlepool 3,321 2,442 0.7
Middlesbrough 4,158 10,930 2.6
Redcar and Cleveland 3,079 3,053 1.0
Stockton-on-Tees 3,927 8,238 2.1
Tees Valley 16,747 32,803 2.0
North East 52,993 1,680,572 31.7
UK 800,232 9,656,127 12.1
Tees Valley Job Vacancies January – December 2017
Page 8 of 42
Hartlepool
Hartlepool consistently has the lowest number of job vacancies advertised
in Tees Valley.
Compared to 2016 a 5% increase has been seen with vacancies rising from
2,316 in 2016 to 2,442 in 2017 (126 extra vacancies):
o There has been a 40% increase in vacancies for Transport and Mobile
Machine Drivers and Operators with vacancies rising from 50 to 70 (20
extra vacancies).
o There has also been a 21% increase in vacancies for Corporate
Managers and Directors, with numbers rising from 107 to 129 (22 extra
vacancies.
Compared to 2014 Hartlepool has seen a 22% rise in vacancies, with
numbers rising from 2,005 in 2014 to 2,442 in 2017 (437 extra vacancies):
o There has been a 38% rise in Caring Personal Service occupations,
with numbers rising from 204 to 282 (78 extra vacancies), followed by
a 52% rise in vacancies for Corporate Managers and Directors, with
numbers rising from 85 to 129 (44 extra vacancies).
Middlesbrough
Middlesbrough consistently has the highest number of job vacancies in Tees Valley however as mentioned on page 6 it must be taken into consideration that Middlesbrough has the largest town centre and there may be a number of job vacancies with a Middlesbrough postal address that actually lie within the Redcar and Cleveland district boundary e.g. Eston, Normany etc.
Compared to 2016 Middlesbrough has seen an 8% drop in vacancies, one
of only two Tees Valley districts to see a drop in vacancies. Numbers fell
from 11,880 in 2016 to 10,930 in 2017 (950 fewer vacancies):
o In particular there has been a 37% drop in vacancies for Sales
occupations with vacancies falling from 1,005 to 632 (373 fewer
vacancies). There has also been a 39% drop in vacancies for
Customer Service occupations with numbers falling from 369 to 226
(143 fewer vacancies).
However compared to 2014 Middlesbrough has seen a 29% increase in job
vacancies, with numbers increasing from 8,504 in 2014 to 10,930 in 2017
(2,426 extra vacancies):
o There has been a 66% increase in vacancies for Caring Personal
Service occupations, with numbers rising from 610 to 1,014 (404 extra
vacancies). This is followed by a 33% rise in vacancies for Science,
Research, Engineering and Technology Professionals, with numbers
rising from 778 to 1,036 (258 extra vacancies).
Tees Valley Job Vacancies January – December 2017
Page 9 of 42
Redcar and Cleveland
Compared to 2016 Redcar and Cleveland has seen a 2% drop in vacancies,
one of only two Tees Valley districts to see a fall. Numbers fell from 3,116 in
2016 to 3,053 in 2017 (63 fewer vacancies).
o There has been a 22% drop in vacancies for Teaching and
Educational Professionals, with numbers falling from 422 to 331 (91
fewer vacancies).
o There has also been an 18% fall in vacancies for Caring Personal
Service occupations with numbers falling from 429 to 353 (76 fewer
vacancies).
However compared to 2014 Redcar and Cleveland has seen a 29%
increase in job vacancies, with numbers rising from 2,368 in 2014 to 3,053 in
2017 (685 extra vacancies).
o In particular there has been a 49% increase in vacancies for Caring
Personal Service occupations, with numbers rising from 237 to 353
(116 extra vacancies).
o There has also been a 53% increase in vacancies for Teaching and
Educational Professionals with numbers rising from 216 to 331 (115
extra vacancies).
Stockton-on-Tees
Compared to 2016 Stockton-on-Tees has seen a 16% rise in job vacancies.
Numbers increased from 7,077 in 2016 to 8,238 in 2017 (1,161 extra
vacancies):
o There has been a 44% increase in vacancies for Science, Research,
Engineering and Technology Professionals, with numbers
increasing from 659 to 948 (289 extra vacancies).
o This is followed by a 26% increase in Administrative occupations
with vacancies rising from 485 to 613 (128 extra vacancies).
Compared to 2014, Stockton has experienced the largest increase in
vacancies across Tees Valley with a 49% rise and numbers increasing from
5,521 in 2014 to 8,238 in 2017 (2,717 extra vacancies).
o There has been a 45% rise in vacancies for Science, Research,
Engineering and Technology Professionals, with numbers
increasing from 656 to 948 (292 extra vacancies).
o This is followed by a 63% rise in vacancies for Caring Personal
Service occupations, with numbers rising from 434 to 709 (275 extra
vacancies).
For a detailed analysis of occupation changes by district please see Appendix B.
Tees Valley Job Vacancies January – December 2017
Page 10 of 42
4. Occupational Groups
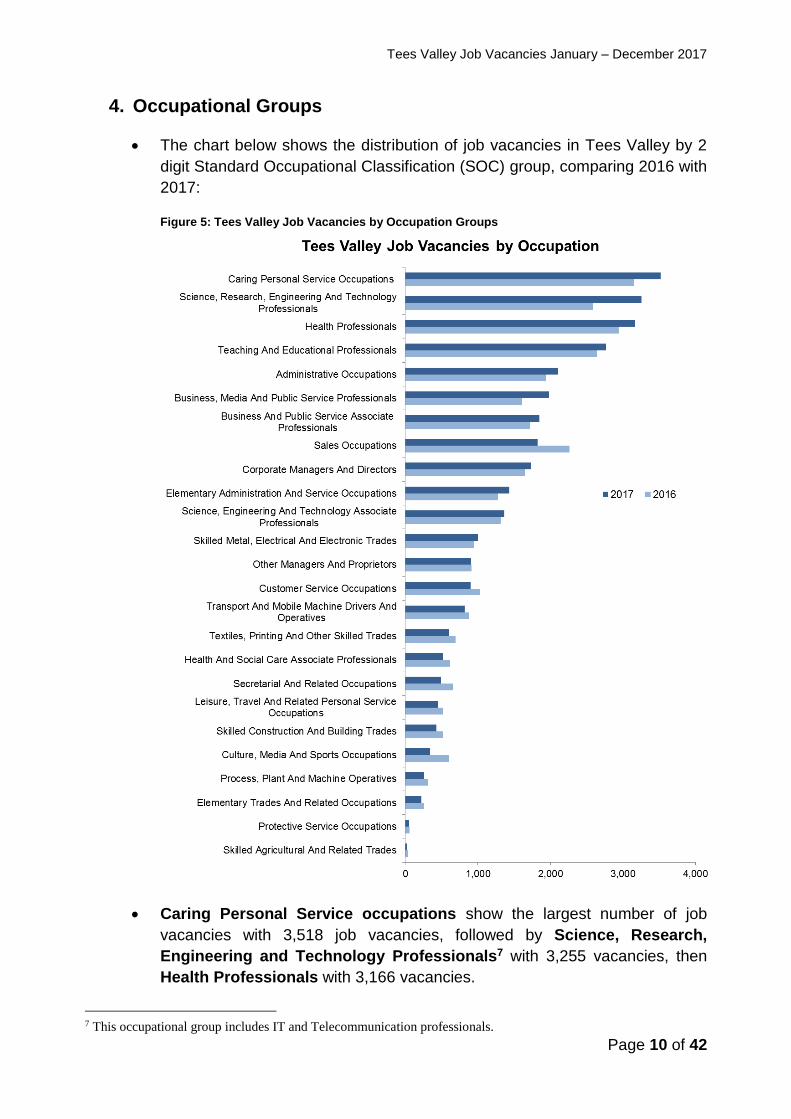
The chart below shows the distribution of job vacancies in Tees Valley by 2
digit Standard Occupational Classification (SOC) group, comparing 2016 with
2017:
Figure 5: Tees Valley Job Vacancies by Occupation Groups
Caring Personal Service occupations show the largest number of job
vacancies with 3,518 job vacancies, followed by Science, Research,
Engineering and Technology Professionals7 with 3,255 vacancies, then
Health Professionals with 3,166 vacancies.
7 This occupational group includes IT and Telecommunication professionals.
Tees Valley Job Vacancies January – December 2017
Page 11 of 42
The largest rise when compared to 2016 is for Science, Research,
Engineering and Technology professionals, with a 26% increase and
vacancies increasing from 2,591 in 2016 to 3,255 in 2017 (an extra 664
vacancies). This is followed by a 23% rise in vacancies for Business, Media
and Public Service Professionals with vacancies increasing from 1,612 in
2016 to 1,983 in 2017 (371 extra vacancies).
Culture, Media and Sports occupations have seen a 42% fall in job
vacancies compared to 2016, with vacancies dropping from 596 to 344 (252
fewer vacancies). There has also been a 19% fall in vacancies for Sales
occupations with vacancies dropping from 2,261 in 2016 to 1,821 in 2017
(440 fewer vacancies).
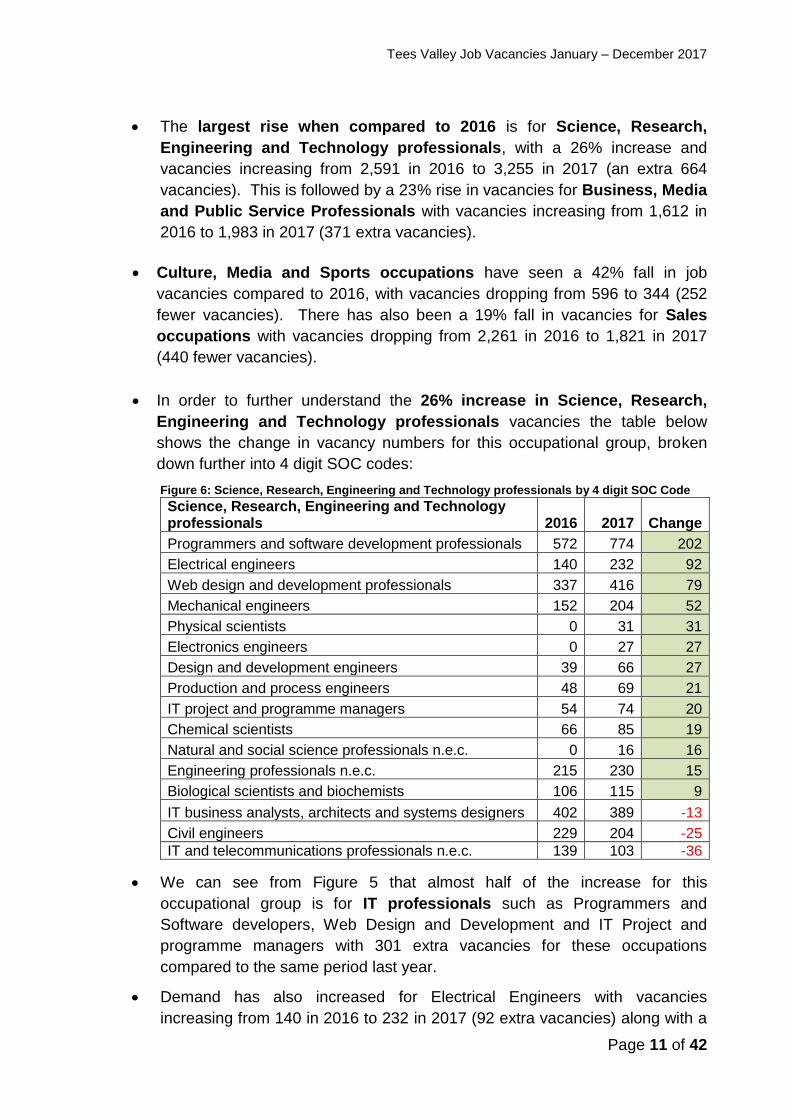
In order to further understand the 26% increase in Science, Research,
Engineering and Technology professionals vacancies the table below
shows the change in vacancy numbers for this occupational group, broken
down further into 4 digit SOC codes:
Figure 6: Science, Research, Engineering and Technology professionals by 4 digit SOC Code Science, Research, Engineering and Technology professionals 2016 2017 Change
Programmers and software development professionals 572 774 202
Electrical engineers 140 232 92
Web design and development professionals 337 416 79
Mechanical engineers 152 204 52
Physical scientists 0 31 31
Electronics engineers 0 27 27
Design and development engineers 39 66 27
Production and process engineers 48 69 21
IT project and programme managers 54 74 20
Chemical scientists 66 85 19
Natural and social science professionals n.e.c. 0 16 16
Engineering professionals n.e.c. 215 230 15
Biological scientists and biochemists 106 115 9
IT business analysts, architects and systems designers 402 389 -13
Civil engineers 229 204 -25
IT and telecommunications professionals n.e.c. 139 103 -36
We can see from Figure 5 that almost half of the increase for this
occupational group is for IT professionals such as Programmers and
Software developers, Web Design and Development and IT Project and
programme managers with 301 extra vacancies for these occupations
compared to the same period last year.
Demand has also increased for Electrical Engineers with vacancies
increasing from 140 in 2016 to 232 in 2017 (92 extra vacancies) along with a
Tees Valley Job Vacancies January – December 2017
Page 12 of 42
number of other types of engineer including Mechanical, Electrical, Design
and Development and Production and Process.
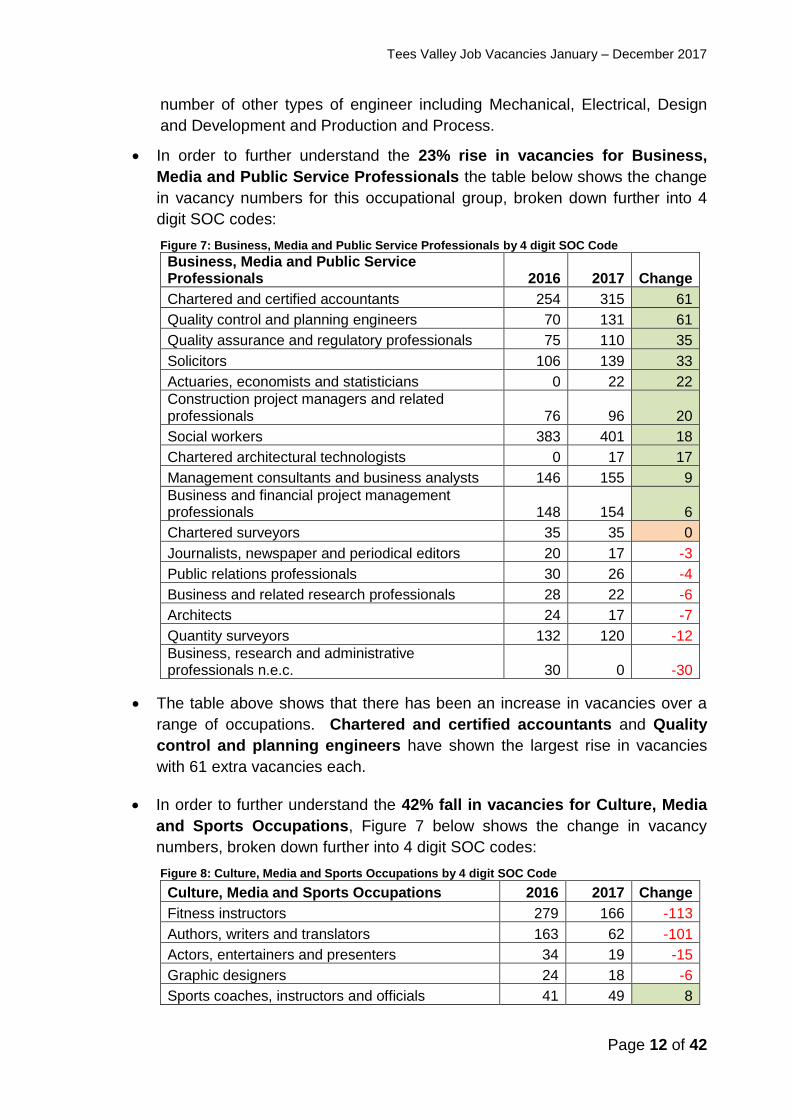
In order to further understand the 23% rise in vacancies for Business,
Media and Public Service Professionals the table below shows the change
in vacancy numbers for this occupational group, broken down further into 4
digit SOC codes:
Figure 7: Business, Media and Public Service Professionals by 4 digit SOC Code
Business, Media and Public Service Professionals 2016 2017 Change
Chartered and certified accountants 254 315 61
Quality control and planning engineers 70 131 61
Quality assurance and regulatory professionals 75 110 35
Solicitors 106 139 33
Actuaries, economists and statisticians 0 22 22
Construction project managers and related professionals 76 96 20
Social workers 383 401 18
Chartered architectural technologists 0 17 17
Management consultants and business analysts 146 155 9
Business and financial project management professionals 148 154 6
Chartered surveyors 35 35 0
Journalists, newspaper and periodical editors 20 17 -3
Public relations professionals 30 26 -4
Business and related research professionals 28 22 -6
Architects 24 17 -7
Quantity surveyors 132 120 -12
Business, research and administrative professionals n.e.c. 30 0 -30
The table above shows that there has been an increase in vacancies over a
range of occupations. Chartered and certified accountants and Quality
control and planning engineers have shown the largest rise in vacancies
with 61 extra vacancies each.
In order to further understand the 42% fall in vacancies for Culture, Media
and Sports Occupations, Figure 7 below shows the change in vacancy
numbers, broken down further into 4 digit SOC codes:
Figure 8: Culture, Media and Sports Occupations by 4 digit SOC Code Culture, Media and Sports Occupations 2016 2017 Change
Fitness instructors 279 166 -113
Authors, writers and translators 163 62 -101
Actors, entertainers and presenters 34 19 -15
Graphic designers 24 18 -6
Sports coaches, instructors and officials 41 49 8
Tees Valley Job Vacancies January – December 2017
Page 13 of 42
We can see from Figure 7 that there has been a 41% fall in vacancies for
fitness instructors with vacancies dropping from 279 in 2016 to 166 in 2017
(113 fewer vacancies). There has also been a 62% drop in vacancies for
Authors, writers and translators with vacancies falling from 163 to 62 (101
fewer vacancies).
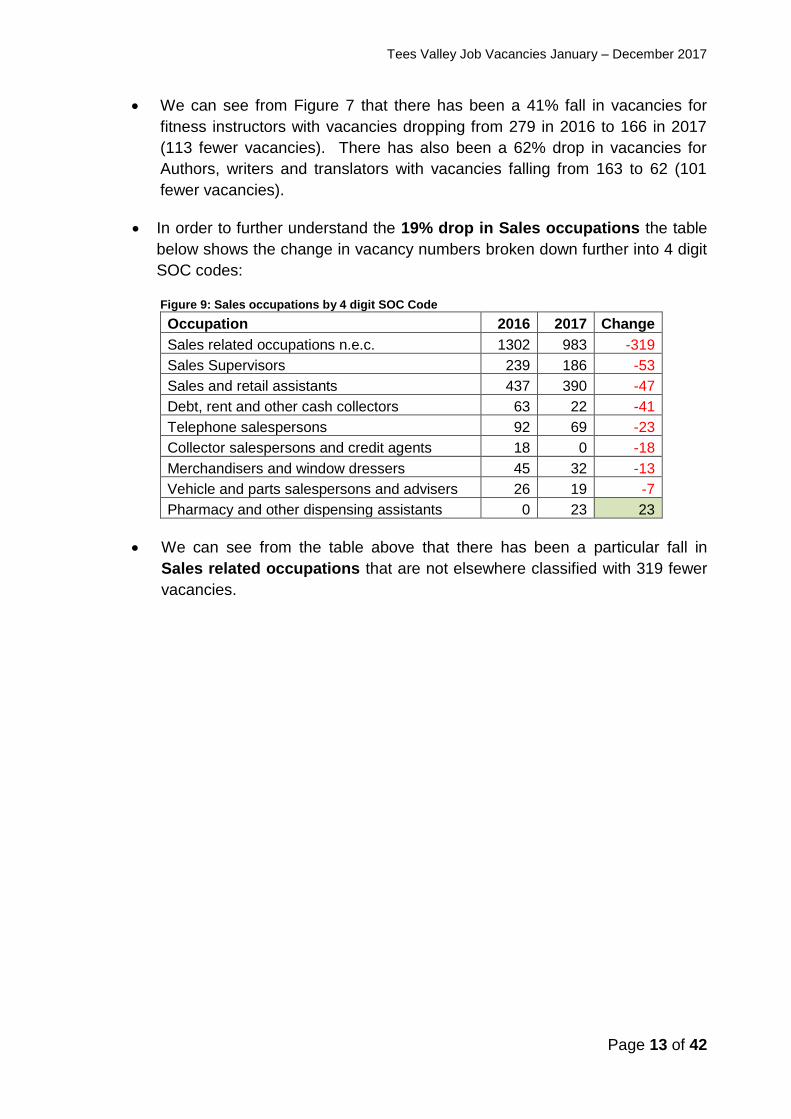
In order to further understand the 19% drop in Sales occupations the table
below shows the change in vacancy numbers broken down further into 4 digit
SOC codes:
Figure 9: Sales occupations by 4 digit SOC Code Occupation 2016 2017 Change
Sales related occupations n.e.c. 1302 983 -319
Sales Supervisors 239 186 -53
Sales and retail assistants 437 390 -47
Debt, rent and other cash collectors 63 22 -41
Telephone salespersons 92 69 -23
Collector salespersons and credit agents 18 0 -18
Merchandisers and window dressers 45 32 -13
Vehicle and parts salespersons and advisers 26 19 -7
Pharmacy and other dispensing assistants 0 23 23
We can see from the table above that there has been a particular fall in
Sales related occupations that are not elsewhere classified with 319 fewer
vacancies.
Tees Valley Job Vacancies January – December 2017
Page 14 of 42
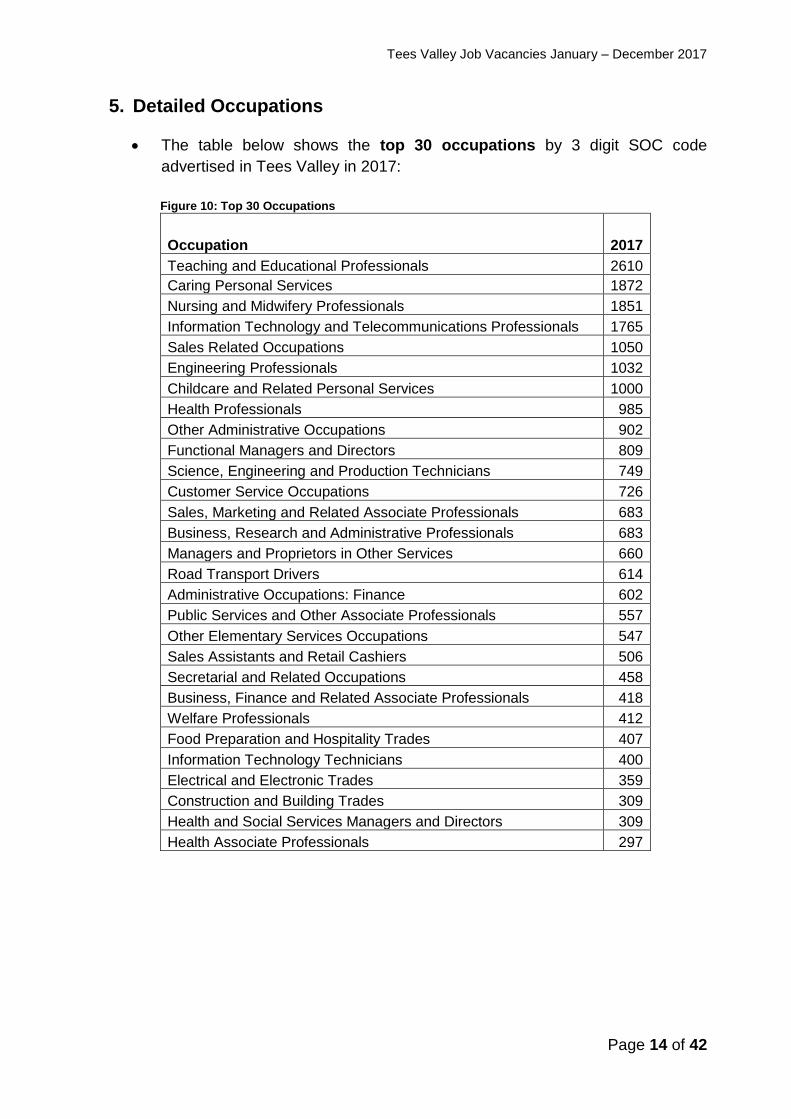
5. Detailed Occupations
The table below shows the top 30 occupations by 3 digit SOC code
advertised in Tees Valley in 2017:
Figure 10: Top 30 Occupations
Occupation 2017
Teaching and Educational Professionals 2610
Caring Personal Services 1872
Nursing and Midwifery Professionals 1851
Information Technology and Telecommunications Professionals 1765
Sales Related Occupations 1050
Engineering Professionals 1032
Childcare and Related Personal Services 1000
Health Professionals 985
Other Administrative Occupations 902
Functional Managers and Directors 809
Science, Engineering and Production Technicians 749
Customer Service Occupations 726
Sales, Marketing and Related Associate Professionals 683
Business, Research and Administrative Professionals 683
Managers and Proprietors in Other Services 660
Road Transport Drivers 614
Administrative Occupations: Finance 602
Public Services and Other Associate Professionals 557
Other Elementary Services Occupations 547
Sales Assistants and Retail Cashiers 506
Secretarial and Related Occupations 458
Business, Finance and Related Associate Professionals 418
Welfare Professionals 412
Food Preparation and Hospitality Trades 407
Information Technology Technicians 400
Electrical and Electronic Trades 359
Construction and Building Trades 309
Health and Social Services Managers and Directors 309
Health Associate Professionals 297
Tees Valley Job Vacancies January – December 2017
Page 15 of 42
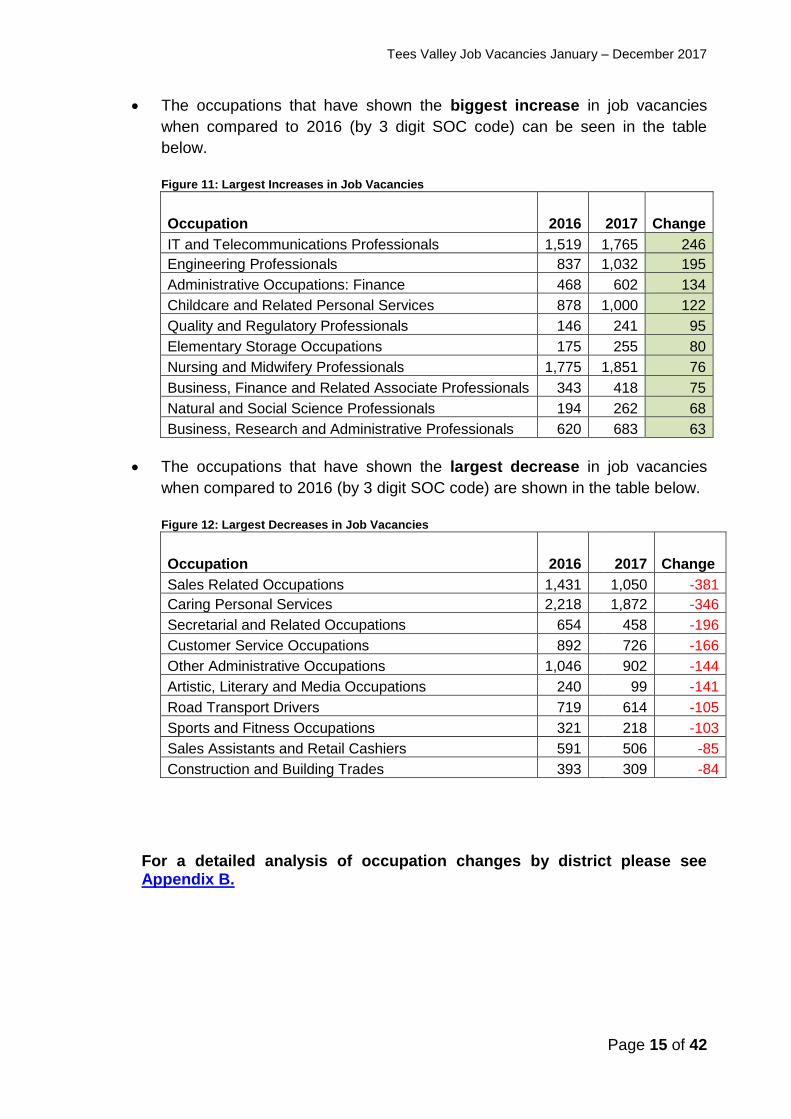
The occupations that have shown the biggest increase in job vacancies
when compared to 2016 (by 3 digit SOC code) can be seen in the table
below.
Figure 11: Largest Increases in Job Vacancies
Occupation 2016 2017 Change
IT and Telecommunications Professionals 1,519 1,765 246
Engineering Professionals 837 1,032 195
Administrative Occupations: Finance 468 602 134
Childcare and Related Personal Services 878 1,000 122
Quality and Regulatory Professionals 146 241 95
Elementary Storage Occupations 175 255 80
Nursing and Midwifery Professionals 1,775 1,851 76
Business, Finance and Related Associate Professionals 343 418 75
Natural and Social Science Professionals 194 262 68
Business, Research and Administrative Professionals 620 683 63
The occupations that have shown the largest decrease in job vacancies
when compared to 2016 (by 3 digit SOC code) are shown in the table below.
Figure 12: Largest Decreases in Job Vacancies
Occupation 2016
2017 Change
Sales Related Occupations 1,431 1,050 -381
Caring Personal Services 2,218 1,872 -346
Secretarial and Related Occupations 654 458 -196
Customer Service Occupations 892 726 -166
Other Administrative Occupations 1,046 902 -144
Artistic, Literary and Media Occupations 240 99 -141
Road Transport Drivers 719 614 -105
Sports and Fitness Occupations 321 218 -103
Sales Assistants and Retail Cashiers 591 506 -85
Construction and Building Trades 393 309 -84
For a detailed analysis of occupation changes by district please see Appendix B.
Tees Valley Job Vacancies January – December 2017
Page 16 of 42
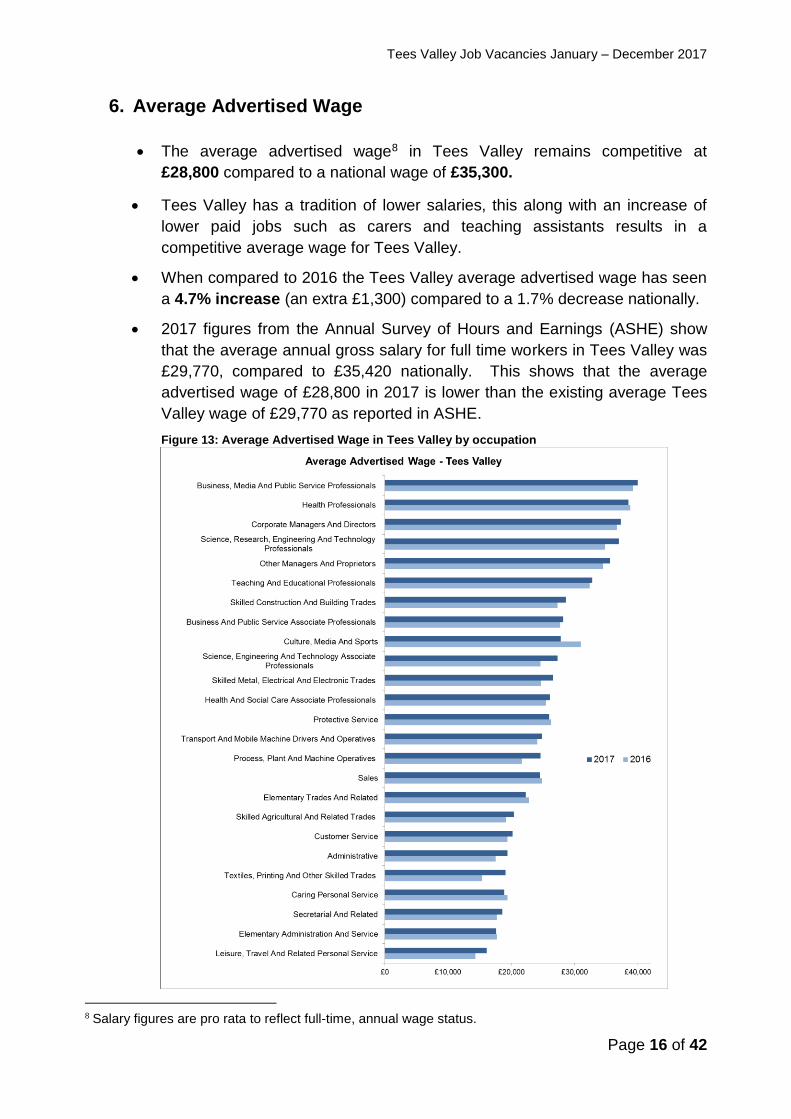
6. Average Advertised Wage
The average advertised wage8 in Tees Valley remains competitive at
£28,800 compared to a national wage of £35,300.
Tees Valley has a tradition of lower salaries, this along with an increase of
lower paid jobs such as carers and teaching assistants results in a
competitive average wage for Tees Valley.
When compared to 2016 the Tees Valley average advertised wage has seen
a 4.7% increase (an extra £1,300) compared to a 1.7% decrease nationally.
2017 figures from the Annual Survey of Hours and Earnings (ASHE) show
that the average annual gross salary for full time workers in Tees Valley was
£29,770, compared to £35,420 nationally. This shows that the average
advertised wage of £28,800 in 2017 is lower than the existing average Tees
Valley wage of £29,770 as reported in ASHE.
Figure 13: Average Advertised Wage in Tees Valley by occupation
8 Salary figures are pro rata to reflect full-time, annual wage status.

Tees Valley Job Vacancies January – December 2017
Page 17 of 42
Business, Media and Public Service Professionals had the highest
average advertised wage in Tees Valley in 2017 at £40,000, followed by
Health Professionals at £38,500.
Textiles, Printing and Other Skilled Trades have seen the most significant
rise in average advertised wage when compared to 2016, rising 24% from
£15,400 to £19,100 (a £3,700 increase).
However there has been an 10% fall in the average advertised wage of
Culture, Media and Sports occupations with the average wage decreasing
from £31,000 in 2016 to £27,800 in 2017 (a £3,200 drop).
Tees Valley Job Vacancies January – December 2017
Page 18 of 42
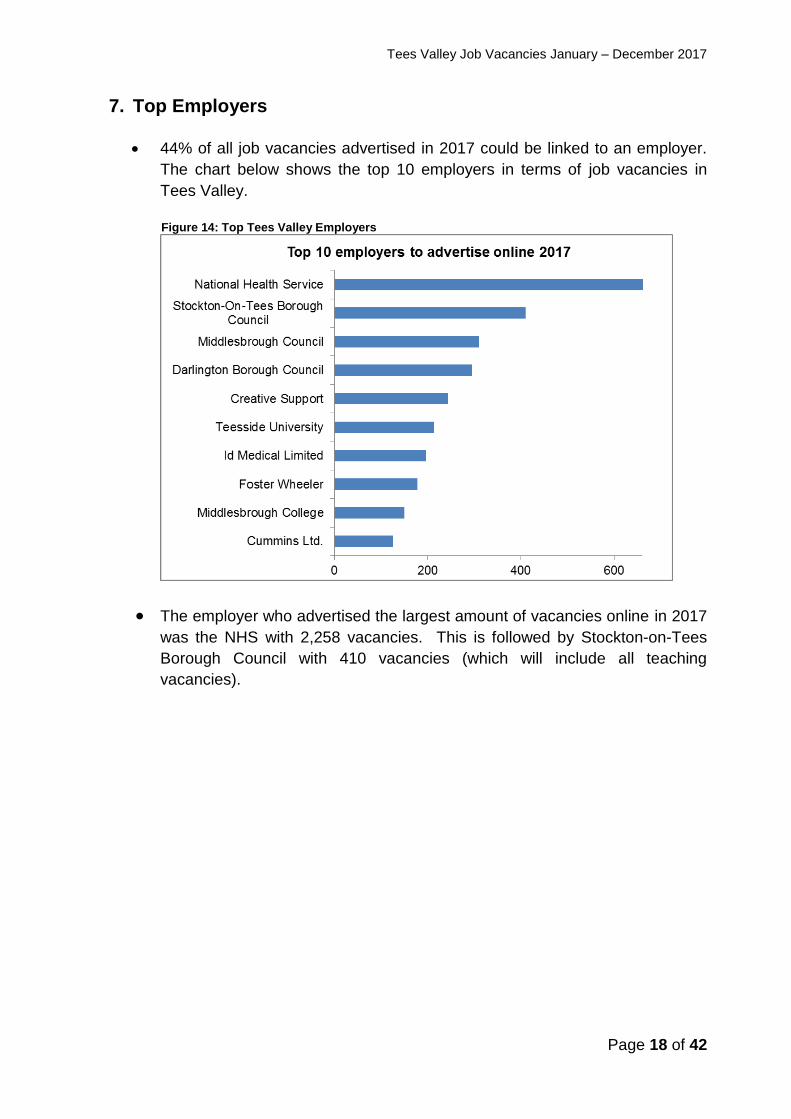
7. Top Employers 44% of all job vacancies advertised in 2017 could be linked to an employer.
The chart below shows the top 10 employers in terms of job vacancies in
Tees Valley.
Figure 14: Top Tees Valley Employers
The employer who advertised the largest amount of vacancies online in 2017
was the NHS with 2,258 vacancies. This is followed by Stockton-on-Tees
Borough Council with 410 vacancies (which will include all teaching
vacancies).
Tees Valley Job Vacancies January – December 2017
Page 19 of 42
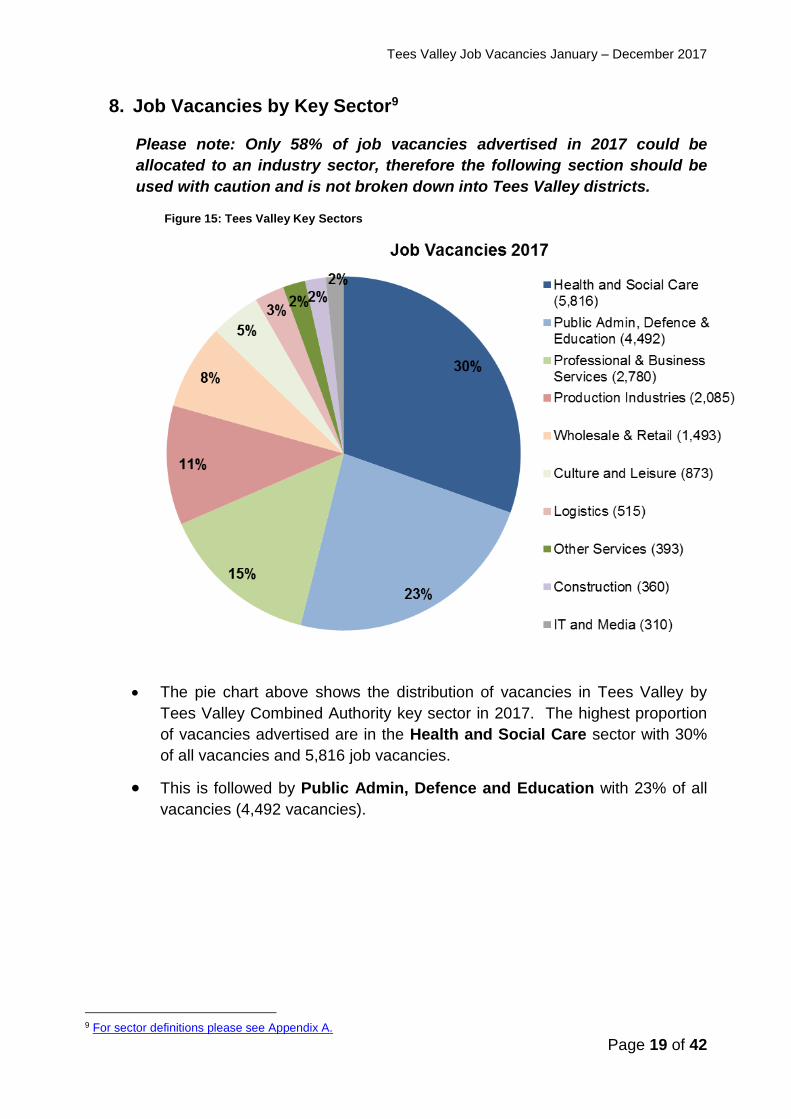
8. Job Vacancies by Key Sector9
Please note: Only 58% of job vacancies advertised in 2017 could be
allocated to an industry sector, therefore the following section should be
used with caution and is not broken down into Tees Valley districts.
Figure 15: Tees Valley Key Sectors
The pie chart above shows the distribution of vacancies in Tees Valley by
Tees Valley Combined Authority key sector in 2017. The highest proportion
of vacancies advertised are in the Health and Social Care sector with 30%
of all vacancies and 5,816 job vacancies.
This is followed by Public Admin, Defence and Education with 23% of all
vacancies (4,492 vacancies).
9 For sector definitions please see Appendix A.
Tees Valley Job Vacancies January – December 2017
Page 20 of 42
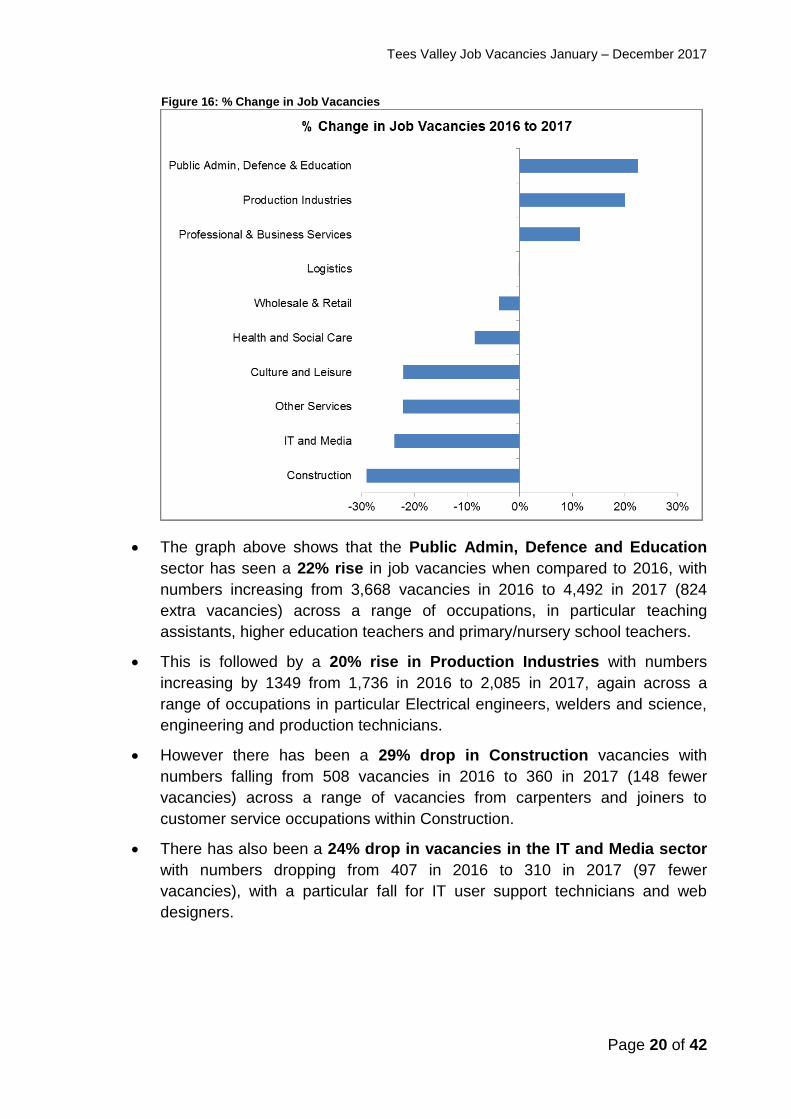
Figure 16: % Change in Job Vacancies
The graph above shows that the Public Admin, Defence and Education
sector has seen a 22% rise in job vacancies when compared to 2016, with
numbers increasing from 3,668 vacancies in 2016 to 4,492 in 2017 (824
extra vacancies) across a range of occupations, in particular teaching
assistants, higher education teachers and primary/nursery school teachers.
This is followed by a 20% rise in Production Industries with numbers
increasing by 1349 from 1,736 in 2016 to 2,085 in 2017, again across a
range of occupations in particular Electrical engineers, welders and science,
engineering and production technicians.
However there has been a 29% drop in Construction vacancies with
numbers falling from 508 vacancies in 2016 to 360 in 2017 (148 fewer
vacancies) across a range of vacancies from carpenters and joiners to
customer service occupations within Construction.
There has also been a 24% drop in vacancies in the IT and Media sector
with numbers dropping from 407 in 2016 to 310 in 2017 (97 fewer
vacancies), with a particular fall for IT user support technicians and web
designers.
Tees Valley Job Vacancies January – December 2017
Page 21 of 42
a) Construction
The Construction sector accounted for 2% of all vacancies advertised in Tees
Valley in 2017 with 360 vacancies. The number of vacancies has fallen by
29% when compared to 2016, with numbers dropping from 508 to 360 (148
fewer vacancies.
63% of job vacancies in Construction could be linked to an employer name.
The top five employers to advertise Construction vacancies in Tees Valley
in 2017 were:
o Huntsman Ltd (45 vacancies);
o Carillion PLC (18 vacancies);
o Acute Group Ltd (7 vacancies);
o Taylor Wimpey (7 vacancies); and
o Blackmore Design & Shopfitting Ltd (6 vacancies).
The average salary for the 360 Construction jobs advertised in 2017 was
£27,900 a £2,800 increase compared to £25,100 for 2016.
b) Culture and Leisure
The Culture and Leisure sector accounted for 5% of all jobs advertised in
Tees Valley in 2017 with 873 vacancies. However there has been a 22% fall
in vacancies compared to 2016 with numbers falling from 1,121 in 2016 to
873 in 2017 (248 fewer vacancies) with a particular 30% drop in vacancies
for Kitchen and Catering assistants and a 24% drop in vacancies for Chefs.
66% of job vacancies in Culture and Leisure could be linked to an employer
name. The top five employers to advertise vacancies in Tees Valley in
2017 were:
o Pizza Hut (51 vacancies);
o Stonegate Pub Company (49 vacancies);
o Mecca Bingo Ltd (34 vacancies);
o Cairn Group Hotel (32 vacancies); and
o Cielo Ltd (31 vacancies).
The average salary for the 873 Culture and Leisure jobs advertised in 2017
was £20,000 a £500 drop from the £20,500 average salary for 2016.
Tees Valley Job Vacancies January – December 2017
Page 22 of 42
c) Health and Social Care
Health and Social Care is the largest sector for job vacancies in Tees Valley
accounting for 30% of all vacancies advertised in 2017, with 5,816 vacancies.
However there has been a 9% fall in the number of vacancies advertised
compared to 2016 with numbers falling from 6,359 to 5,816 (543 fewer
vacancies) across a range of occupations, in particular carers, dentists and
physiotherapists.
66% of job vacancies in Health and Social Care could be linked to an
employer name. The top five employers to advertise Health and Social
Care vacancies in Tees Valley in 2017 were:
o National Health Service (2,258 vacancies);
o Creative Support (244 vacancies);
o Barchester Healthcare (53 vacancies);
o The Sanctuary Group (53 vacancies); and
o HC-One (52 vacancies).
The average salary for the 5,816 Health and Social Care jobs advertised in
2017 was £31,300, a £3,000 increase from the £30,300 average salary for
2016.
d) IT, and Media
The IT and Media sector accounted for just 2% of all jobs advertised in Tees
Valley in 2017 with 310 vacancies. This sector has seen a 24% fall in
vacancies when compared to 2016 with numbers dropping from 407 in 2016
to 310 in 2017 (97 fewer vacancies) and a particular fall for IT user support
technicians and web designers.
92% of job vacancies in IT and Media could be linked to an employer name.
The top five employers to advertise vacancies in Tees Valley in 2017 were:
o Virgin Media (25 vacancies);
o EE Ltd (23 vacancies),
o British Telecom (16 vacancies);
o IRIS Software (12 vacancies); and
o Newsquest Ltd (12 vacancies).
The average salary for the 310 IT and Media jobs advertised in 2017 was
£25,000 a £4,100 rise from the £20,900 average salary for 2016. This wage
reflects the entry and lower level IT vacancies advertised for various call
centres across Tees Valley.
Tees Valley Job Vacancies January – December 2017
Page 23 of 42
e) Logistics
The Logistics sector accounted for 3% of all job vacancies advertised in Tees
Valley in 2017 with 515 vacancies. There has been no change in vacancies
compared to 2016, with numbers remaining at 515.
39% of job vacancies in Logistics could be linked to an employer name. The
top five employers to advertise Logistics vacancies in Tees Valley in 2017
were:
o Royal Mail (41 vacancies);
o PD Ports Group (19 vacancies);
o DHL Express (16 vacancies);
o XPO Logistics Ltd (9 vacancies); and
o HGVTC Ltd (5 vacancies).
The average salary for the 515 Logistics jobs advertised in 2017 was
£22,600, a £100 drop from the £22,700 average salary for 2016.
f) Production Industries
Production Industries accounted for 11% of all job vacancies advertised in
Tees Valley in 2017 with 2,085 vacancies. This sector has seen the second
largest rise in vacancies compared to 2016, with a 20% rise and numbers
increasing from 1,736 to 2,085 (349 extra vacancies) across a range of
occupations, in particular electrical engineers, welders and science,
engineering and production technicians.
41% of job vacancies in Production Industries could be linked to an employer
name. The top five employers to advertise vacancies in Tees Valley in 2017
were:
o Foster Wheeler (164 vacancies);
o Cummins Ltd (126 vacancies);
o Castleview Ltd (41 vacancies);
o Johnson Matthey PLC (28 vacancies); and
o NRG Ltd (17 vacancies).
The average salary for the 2,085 Production Industries jobs advertised in
2017 was £30,500, a £400 decrease from the £30,100 average salary for
2016.
Tees Valley Job Vacancies January – December 2017
Page 24 of 42
g) Professional and Business Services
The Professional and Business Services sector accounted for 15% of all job
vacancies advertised in Tees Valley in 2017 with 2,780 vacancies. There
has been a 12% increase in vacancies when compared to 2016 with 287
extra vacancies across a range of occupations from solicitors to HR officers
and marketing and sales directors.
72% of job vacancies in Professional and Business services could be linked
to an employer name. The top five employers to advertise vacancies in
2017 were:
o AMEC (98 vacancies);
o G4S Cash Solutions (65 vacancies);
o Amey UK (64 vacancies);
o D A Languages Ltd (45 vacancies); and
o Cairn Corporation Ltd (40 vacancies).
The average salary for the 2,780 Professional and Business Services jobs
advertised in 2017 was £25,800, a £1,000 increase compared to the £24,800
average salary for 2016.
h) Public Admin, Defence and Education
The Public Admin, Defence and Education sector is the second largest sector
with 23% of all job vacancies advertised in Tees Valley in 2017 with 4,492
vacancies. There has been a 22% increase in vacancies compared to 2016,
with numbers rising from 3,668 to 4,492 (824 extra vacancies). In particular,
there has been an 34% rise in vacancies for teaching assistants with
numbers rising from 415 in 2016 to 558 in 2017 (143 extra vacancies), along
with a 58% increase in vacancies for higher education teachers with numbers
rising from 109 in 2016 to 172 in 2017 (63 extra vacancies) and a 7%
increase in primary and nursery teachers.
53% of job vacancies in Public Admin, Defence and Education could be
linked to an employer name. The top five employers to advertise
vacancies in 2017 were:
o Stockton-on-Tees Borough Council (386 vacancies);
o Middlesbrough Council (291 vacancies);
o Darlington Borough Council (269 vacancies);
o Teesside University (213 vacancies); and
o Middlesbrough College (151 vacancies).
Tees Valley Job Vacancies January – December 2017
Page 25 of 42
The average salary for the 4,492 Public Admin, Defence and Education jobs
advertised in 2017 was £28,700, a £300 drop compared to the £28,400
average salary for 2016.
i) Wholesale and Retail
The Wholesale and Retail sector accounted for 8% of all job vacancies
advertised in Tees Valley in 2017 with 1,493 vacancies. There has been a
4% fall in vacancies compared to 2016, with numbers dropping from 1,185 to
1,553 (60 fewer vacancies) across a range of sectors including sales reps,
sales executives, sales supervisors and managers and directors.
67% of job vacancies in Wholesale and Retail could be linked to an employer
name. The top five employers to advertise vacancies in 2017 were:
o Tesco Plc (62 vacancies);
o Alliance Boots (54 vacancies);
o Martin McColl (30 vacancies);
o Travis Perkins (30 vacancies); and
o Argos (27 vacancies)
The average salary for the 1,493 Wholesale and Retail jobs advertised in
2017 was £23,200, a £700 rise from the £22,500 average salary for 2016.
j) Other Services10
The Other Services sector accounted for 2% of all job vacancies advertised
in Tees Valley in 2017 with 393 vacancies. However there has been a 22%
decrease in vacancies when compared to 2016 with numbers falling from
505 to 393 (112 fewer vacancies), across a range of occupations including
beauticians and fitness instructors.
72% of job vacancies in Other Services could be linked to an employer
name. The top five employers to advertise vacancies in 2017 were:
o Imperial Workforce Ltd (35 vacancies);
o The Bannatyne Group (27 vacancies);
o TTR Leisure (16 vacancies);
o United Response (7 vacancies) and
o Lifestyle Fitness Ltd (7 vacancies).
The average salary for the 393 Other Services jobs advertised in 2017 was
£20,900, a £2,200 increase from the £18,700 average salary for 2016.
10 Other Services includes Hairdressing, funeral activities, physical well-being organisations such as gyms, repair of goods, and charities amongst others.
Tees Valley Job Vacancies January – December 2017
Page 26 of 42
9. Education Only 20% of Tees Valley job vacancies advertised in 2017 included details about
required education levels, therefore please use the following section with caution.
Qualification levels include:
Figure 17: Qualification Levels
Level Description
Level 2 GCSE’s, BTEC First/Diplomas, Traineeships and Intermediate
Apprenticeships
Level 3 A Levels, BTEC National Diplomas, Advanced Apprenticeships
Level 4 Certificate/Diploma of Higher Education, HNC, Higher Apprenticeships
Level 5 Foundation Degrees, HND’s, Diploma of Higher Education, Higher
Apprenticeships
Level 6 Bachelor/Honours Degree, Degree Apprenticeships
Level 7 Masters Degree and Postgraduate Certificates, Degree Apprenticeships
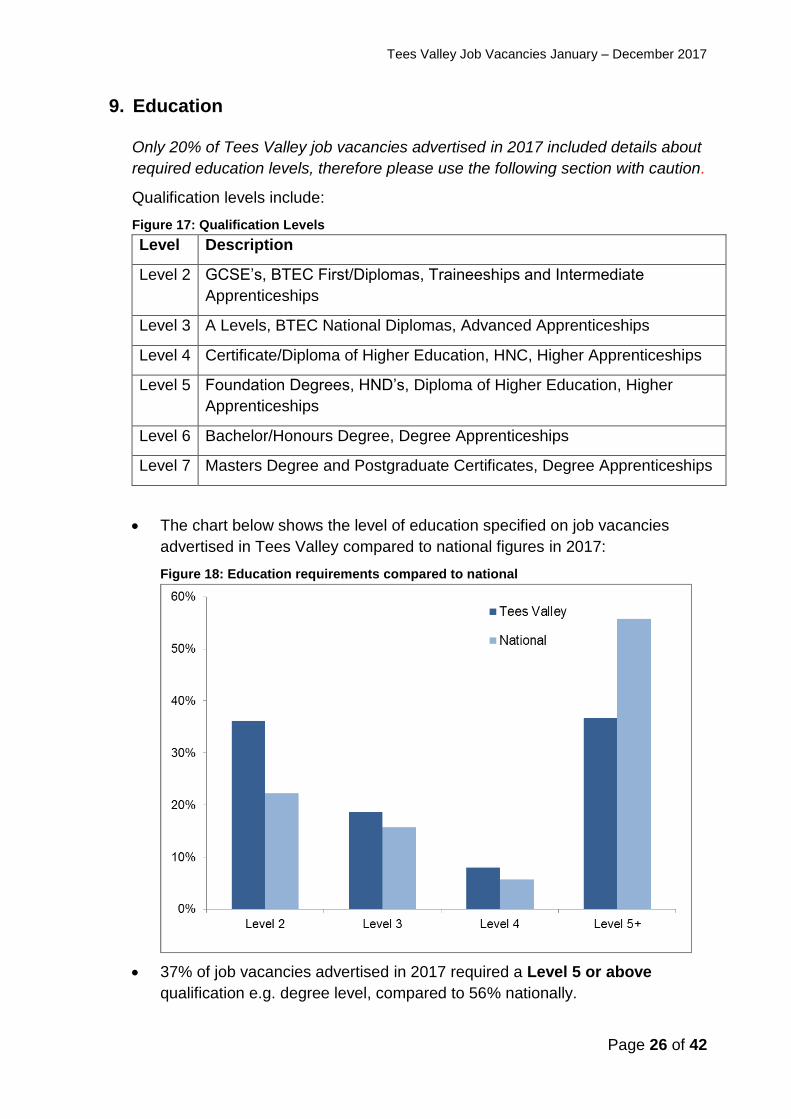
The chart below shows the level of education specified on job vacancies
advertised in Tees Valley compared to national figures in 2017:
Figure 18: Education requirements compared to national
37% of job vacancies advertised in 2017 required a Level 5 or above
qualification e.g. degree level, compared to 56% nationally.
Tees Valley Job Vacancies January – December 2017
Page 27 of 42
36% of job vacancies required a Level 2 qualification e.g. GCSE’s,
compared to 22% nationally.
19% of vacancies required a Level 3 qualification e.g. A Level, compared to
16% nationally.
8% of vacancies required a Level 4 qualification e.g. HNC, Diploma,
compared to 6% nationally.
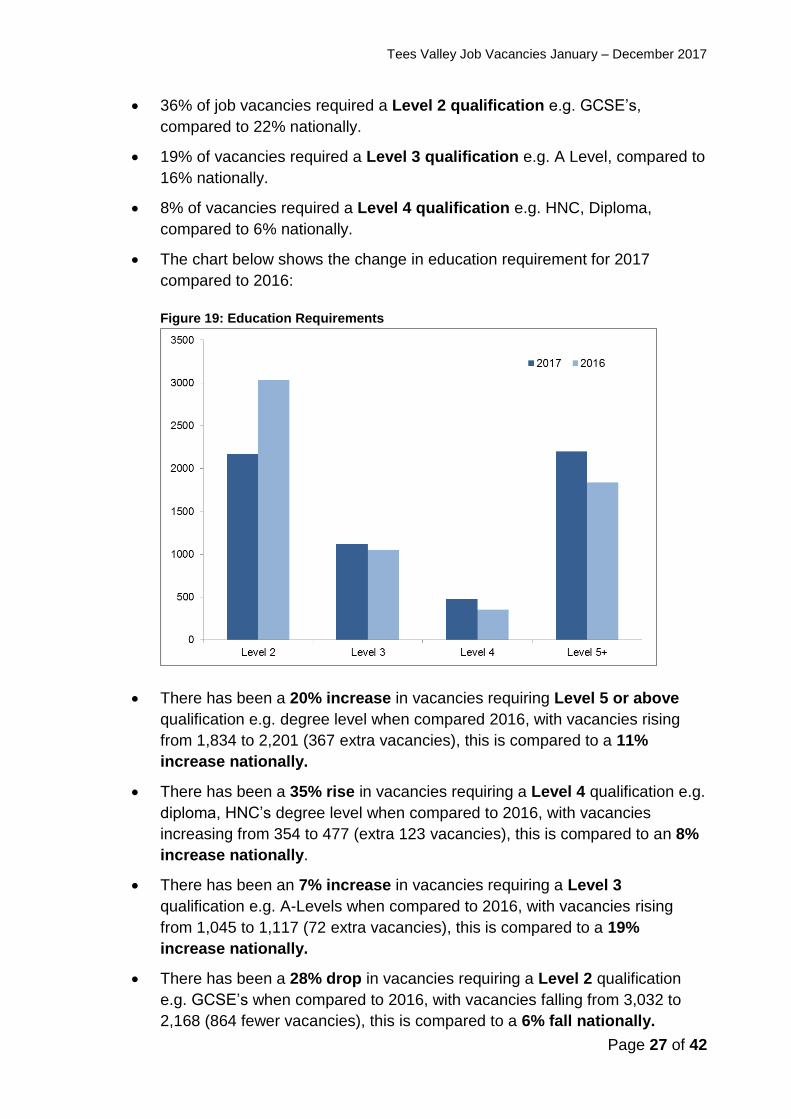
The chart below shows the change in education requirement for 2017
compared to 2016:
Figure 19: Education Requirements
There has been a 20% increase in vacancies requiring Level 5 or above
qualification e.g. degree level when compared 2016, with vacancies rising
from 1,834 to 2,201 (367 extra vacancies), this is compared to a 11%
increase nationally.
There has been a 35% rise in vacancies requiring a Level 4 qualification e.g.
diploma, HNC’s degree level when compared to 2016, with vacancies
increasing from 354 to 477 (extra 123 vacancies), this is compared to an 8%
increase nationally.
There has been an 7% increase in vacancies requiring a Level 3
qualification e.g. A-Levels when compared to 2016, with vacancies rising
from 1,045 to 1,117 (72 extra vacancies), this is compared to a 19%
increase nationally.
There has been a 28% drop in vacancies requiring a Level 2 qualification
e.g. GCSE’s when compared to 2016, with vacancies falling from 3,032 to
2,168 (864 fewer vacancies), this is compared to a 6% fall nationally.
Tees Valley Job Vacancies January – December 2017
Page 28 of 42
10. Top Skills
Labour Insight groups skills into three groups;
o Baseline Skills such as communication and problem solving;
o Specialist Skills such as teaching and repair; and
o Computer Skills such as Microsoft Excel and JavaScript.
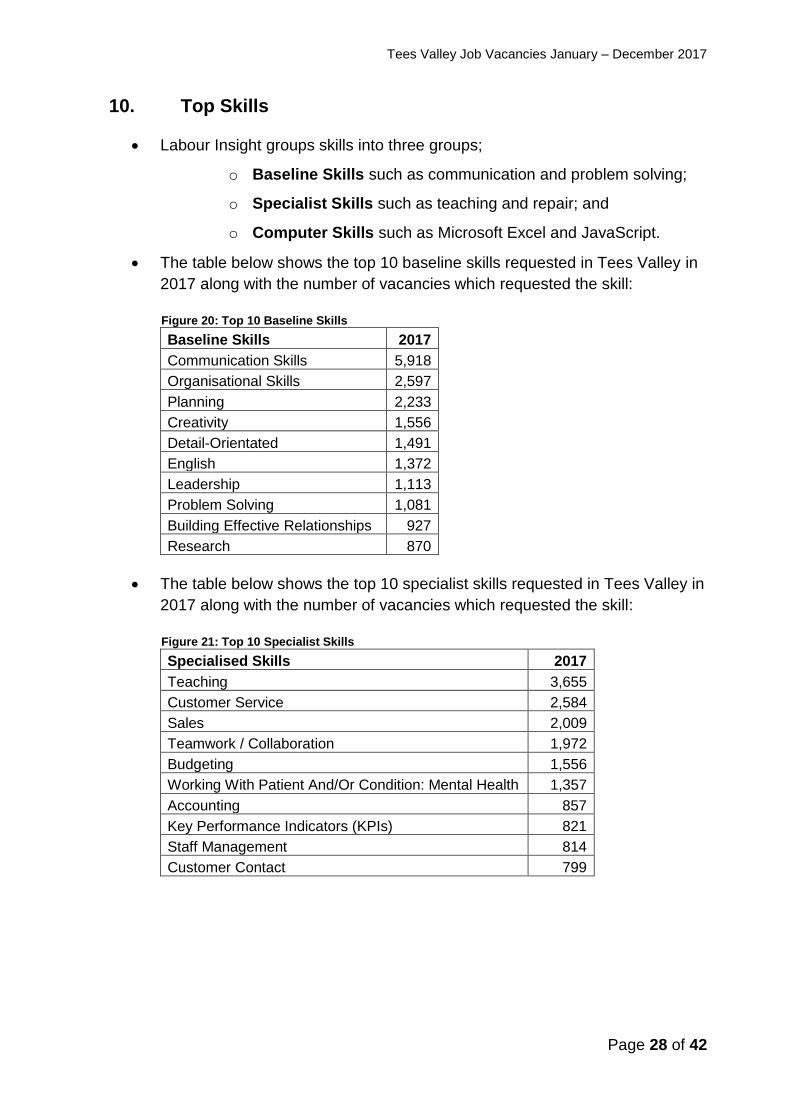
The table below shows the top 10 baseline skills requested in Tees Valley in
2017 along with the number of vacancies which requested the skill:
Figure 20: Top 10 Baseline Skills Baseline Skills 2017
Communication Skills 5,918
Organisational Skills 2,597
Planning 2,233
Creativity 1,556
Detail-Orientated 1,491
English 1,372
Leadership 1,113
Problem Solving 1,081
Building Effective Relationships 927
Research 870
The table below shows the top 10 specialist skills requested in Tees Valley in
2017 along with the number of vacancies which requested the skill:
Figure 21: Top 10 Specialist Skills Specialised Skills 2017
Teaching 3,655
Customer Service 2,584
Sales 2,009
Teamwork / Collaboration 1,972
Budgeting 1,556
Working With Patient And/Or Condition: Mental Health 1,357
Accounting 857
Key Performance Indicators (KPIs) 821
Staff Management 814
Customer Contact 799
Tees Valley Job Vacancies January – December 2017
Page 29 of 42
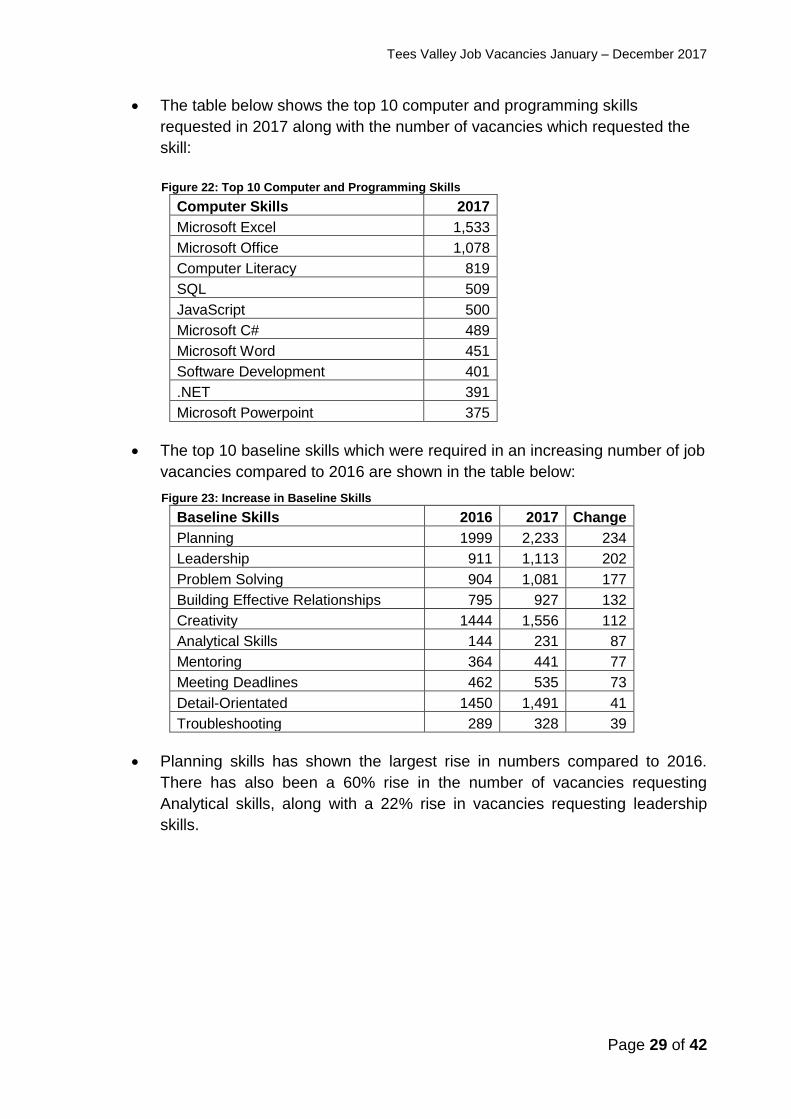
The table below shows the top 10 computer and programming skills
requested in 2017 along with the number of vacancies which requested the
skill:
Figure 22: Top 10 Computer and Programming Skills
Computer Skills 2017
Microsoft Excel 1,533
Microsoft Office 1,078
Computer Literacy 819
SQL 509
JavaScript 500
Microsoft C# 489
Microsoft Word 451
Software Development 401
.NET 391
Microsoft Powerpoint 375
The top 10 baseline skills which were required in an increasing number of job
vacancies compared to 2016 are shown in the table below:
Figure 23: Increase in Baseline Skills Baseline Skills 2016 2017 Change
Planning 1999 2,233 234
Leadership 911 1,113 202
Problem Solving 904 1,081 177
Building Effective Relationships 795 927 132
Creativity 1444 1,556 112
Analytical Skills 144 231 87
Mentoring 364 441 77
Meeting Deadlines 462 535 73
Detail-Orientated 1450 1,491 41
Troubleshooting 289 328 39
Planning skills has shown the largest rise in numbers compared to 2016.
There has also been a 60% rise in the number of vacancies requesting
Analytical skills, along with a 22% rise in vacancies requesting leadership
skills.
Tees Valley Job Vacancies January – December 2017
Page 30 of 42
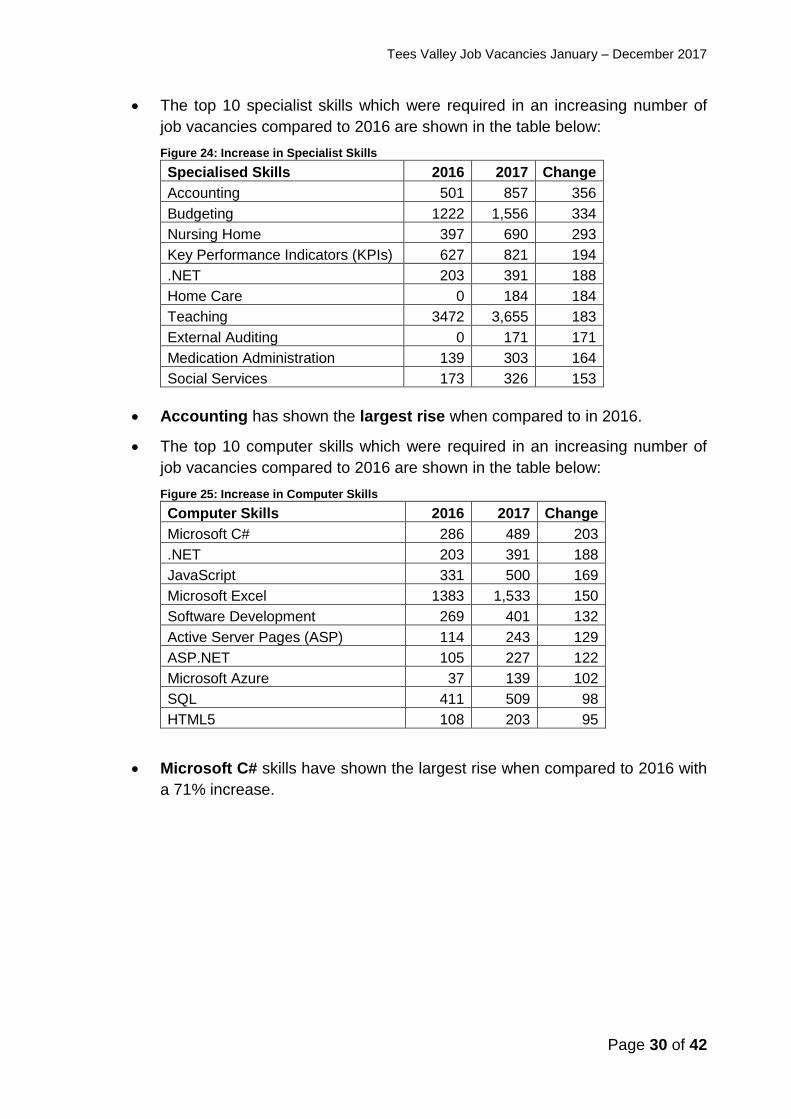
The top 10 specialist skills which were required in an increasing number of
job vacancies compared to 2016 are shown in the table below:
Figure 24: Increase in Specialist Skills
Specialised Skills 2016 2017 Change
Accounting 501 857 356
Budgeting 1222 1,556 334
Nursing Home 397 690 293
Key Performance Indicators (KPIs) 627 821 194
.NET 203 391 188
Home Care 0 184 184
Teaching 3472 3,655 183
External Auditing 0 171 171
Medication Administration 139 303 164
Social Services 173 326 153
Accounting has shown the largest rise when compared to in 2016.
The top 10 computer skills which were required in an increasing number of
job vacancies compared to 2016 are shown in the table below:
Figure 25: Increase in Computer Skills
Computer Skills 2016 2017 Change
Microsoft C# 286 489 203
.NET 203 391 188
JavaScript 331 500 169
Microsoft Excel 1383 1,533 150
Software Development 269 401 132
Active Server Pages (ASP) 114 243 129
ASP.NET 105 227 122
Microsoft Azure 37 139 102
SQL 411 509 98
HTML5 108 203 95
Microsoft C# skills have shown the largest rise when compared to 2016 with
a 71% increase.
Tees Valley Job Vacancies January – December 2017
31
11. Conclusions
This report has summarised the characteristics of online job vacancies within
Tees Valley as analysed by the Labour Insight system between January and
December 2017. There has been a 4% rise in online job vacancies when
compared to 2016 with vacancies increasing from 31,400 to 32,803 (1,403 extra
vacancies). This compares to an 11% increase nationally and a 13% increase
across the North of England.
There were 2 jobs advertised for every unemployed person in Tees Valley in
2017, this compares to 12 jobs per unemployed person nationally.
Job vacancy number in the public sector remain high with the proportion of job
vacancies highest in the Health and Social Care sector (30%), followed by
Public admin, defence and education with 23%.
Job vacancies were highest for Caring Personal Service occupations with
3,518 job vacancies, followed by Science, Research, Engineering and
Technology Professionals with 3,255 vacancies, then Health Professionals
with 3,166 vacancies.
The large percentage of job vacancies available in the public sector reflects the
latest figures from ONS showing that 25% of all employment within Tees Valley is
public sector, compared to 21% nationally.
The largest rise when compared to 2016 has been for Science, Research,
Engineering and Technology professionals with a 26% increase and 664
extra vacancies (from 2,591 to 3,255), in particular IT Professionals and
Engineers.
There has also been a notable 23% rise in vacancies for Business, Media
and Public Service Professionals with vacancies increasing from 1,612 in 2016
to 1,983 in 2017 (371 extra vacancies).
The average advertised wage in Tees Valley remains competitive at £28,800
compared to a national wage of £35,300 and reflects the high number of lower
paid jobs such as carers and teaching assistants. The Tees Valley average has
risen by 4.7% over the last year compared to a 1.7% fall nationally.
Job vacancies advertised in the Tees Valley in 2017 required lower level skills
than those advertised nationally, with 36% requiring a Level 2 qualification,
compared to 22% nationally and 37% requiring a Level 5 or above qualification
compared to 56% nationally.
However Tees Valley appear to be closing the gap when compared to 2016 with
a 28% fall in vacancies requiring a Level 2 qualification (6% fall nationally) and a
20% rise in vacancies requiring a Level 5 or above qualification (11% increase
nationally).
Tees Valley Combined Authority, Economic Strategy and Intelligence June 2018
Tees Valley Job Vacancies January – December 2017
32
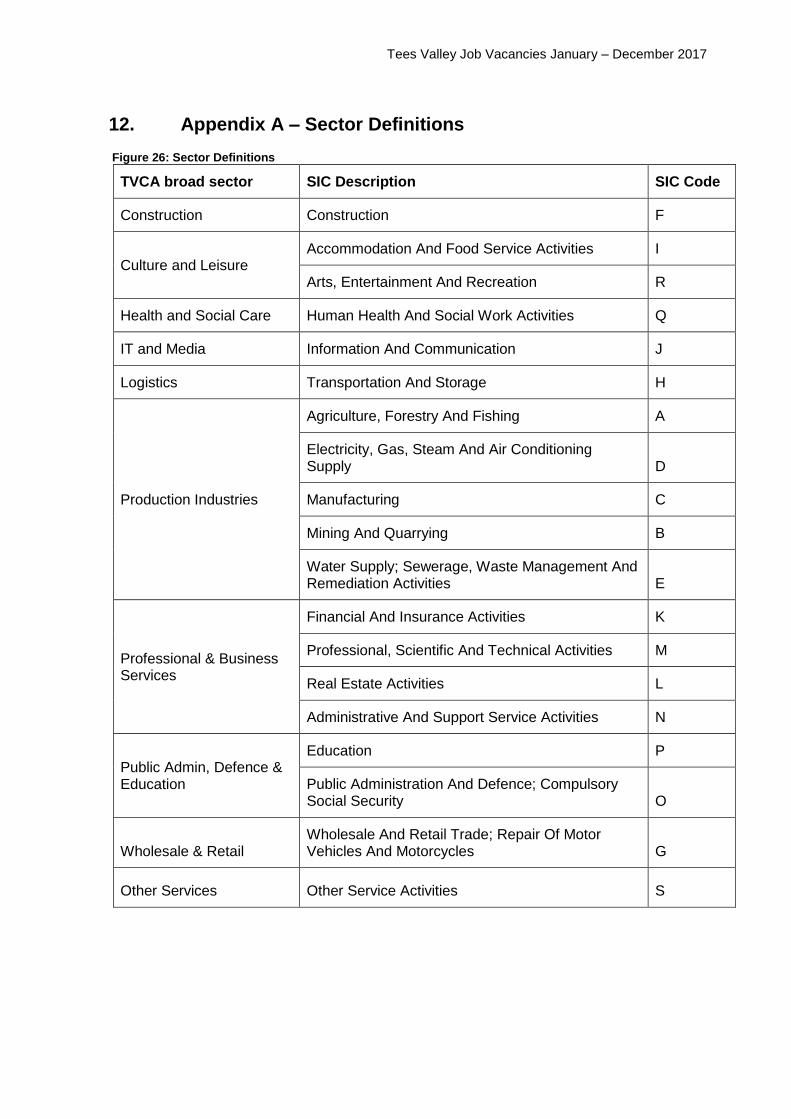
12. Appendix A – Sector Definitions
Figure 26: Sector Definitions
TVCA broad sector SIC Description SIC Code
Construction Construction F
Culture and Leisure Accommodation And Food Service Activities I
Arts, Entertainment And Recreation R
Health and Social Care Human Health And Social Work Activities Q
IT and Media Information And Communication J
Logistics Transportation And Storage H
Production Industries
Agriculture, Forestry And Fishing A
Electricity, Gas, Steam And Air Conditioning Supply D
Manufacturing C
Mining And Quarrying B
Water Supply; Sewerage, Waste Management And Remediation Activities E
Professional & Business Services
Financial And Insurance Activities K
Professional, Scientific And Technical Activities M
Real Estate Activities L
Administrative And Support Service Activities N
Public Admin, Defence & Education
Education P
Public Administration And Defence; Compulsory Social Security O
Wholesale & Retail Wholesale And Retail Trade; Repair Of Motor Vehicles And Motorcycles G
Other Services Other Service Activities S
Tees Valley Job Vacancies January – December 2017
Page 33 of 42
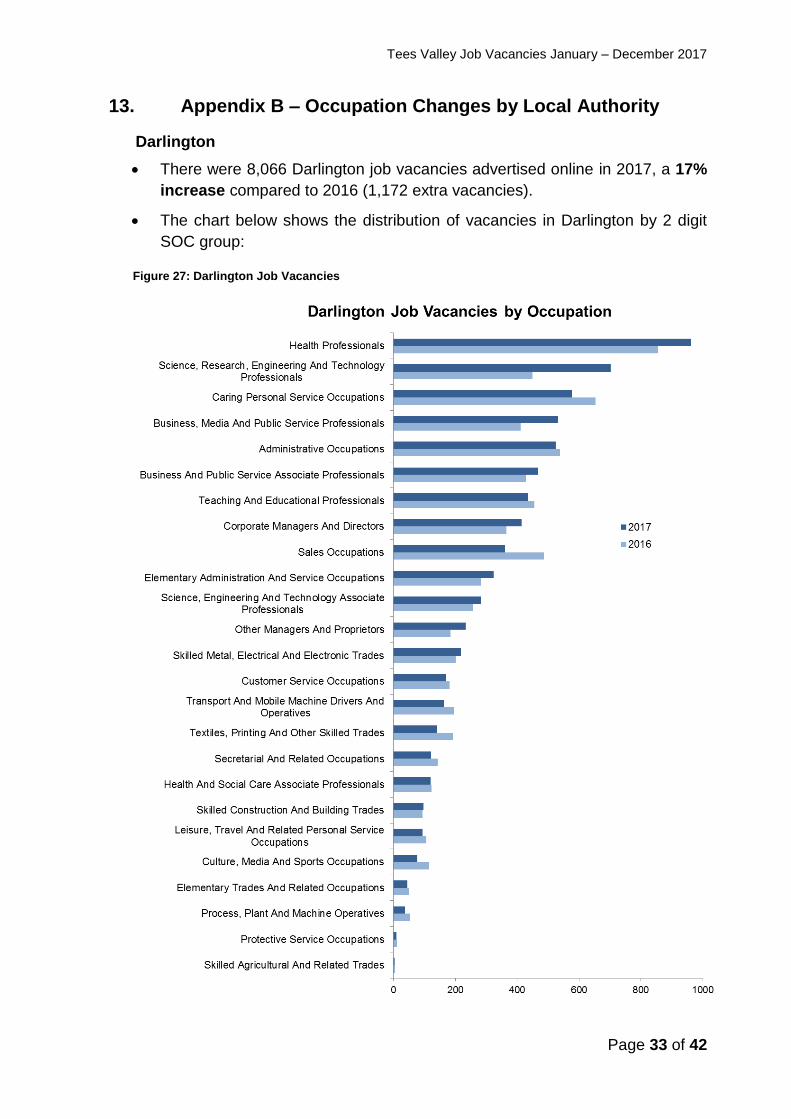
13. Appendix B – Occupation Changes by Local Authority
Darlington
There were 8,066 Darlington job vacancies advertised online in 2017, a 17%
increase compared to 2016 (1,172 extra vacancies).
The chart below shows the distribution of vacancies in Darlington by 2 digit
SOC group:
Figure 27: Darlington Job Vacancies
Tees Valley Job Vacancies January – December 2017
Page 34 of 42
The largest percentage of vacancies (14%) was for Health Professionals
with 963 vacancies, followed by Science, Research, Engineering and
Technology Professionals with 10% of all vacancies (703) vacancies).
The largest rise in job vacancies over the last year has been for Science,
Research, Engineering and Technology Professionals, with a 56% rise
and numbers increasing from 450 to 703 (253 extra vacancies).
There has also been a 29% increase in Business, Media and Public
Service Professionals, with numbers increasing from 412 in 2016 to 533 in
2017 (121 extra vacancies).
There has been 26% drop in vacancies for Sales occupations compared
to 2016, with numbers falling from 486 to 361 (125 fewer vacancies).
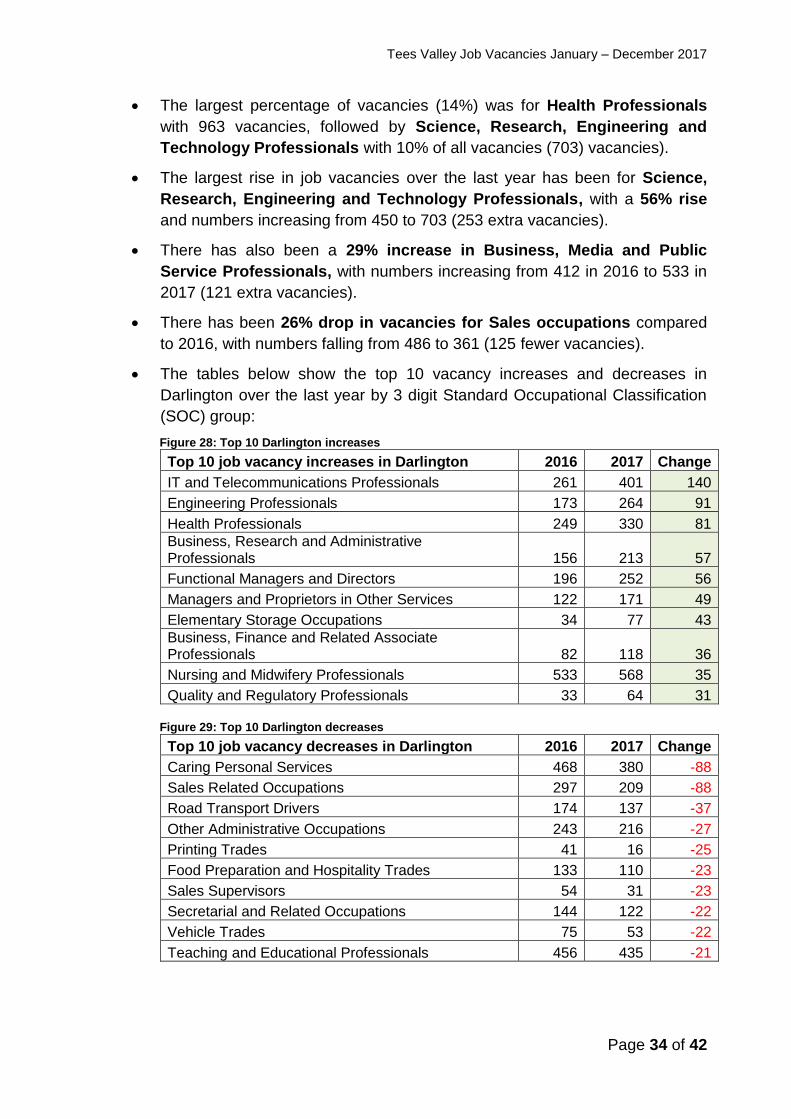
The tables below show the top 10 vacancy increases and decreases in
Darlington over the last year by 3 digit Standard Occupational Classification
(SOC) group:
Figure 28: Top 10 Darlington increases
Top 10 job vacancy increases in Darlington 2016 2017 Change
IT and Telecommunications Professionals 261 401 140
Engineering Professionals 173 264 91
Health Professionals 249 330 81
Business, Research and Administrative Professionals 156 213 57
Functional Managers and Directors 196 252 56
Managers and Proprietors in Other Services 122 171 49
Elementary Storage Occupations 34 77 43
Business, Finance and Related Associate Professionals 82 118 36
Nursing and Midwifery Professionals 533 568 35
Quality and Regulatory Professionals 33 64 31
Figure 29: Top 10 Darlington decreases
Top 10 job vacancy decreases in Darlington 2016 2017 Change
Caring Personal Services 468 380 -88
Sales Related Occupations 297 209 -88
Road Transport Drivers 174 137 -37
Other Administrative Occupations 243 216 -27
Printing Trades 41 16 -25
Food Preparation and Hospitality Trades 133 110 -23
Sales Supervisors 54 31 -23
Secretarial and Related Occupations 144 122 -22
Vehicle Trades 75 53 -22
Teaching and Educational Professionals 456 435 -21
Tees Valley Job Vacancies January – December 2017
Page 35 of 42
Hartlepool
There were 2,442 Hartlepool job vacancies advertised online in 2017, a 5%
increase compared to 2016 (126 extra vacancies). Hartlepool consistently
has the lowest number of job vacancies in Tees Valley.
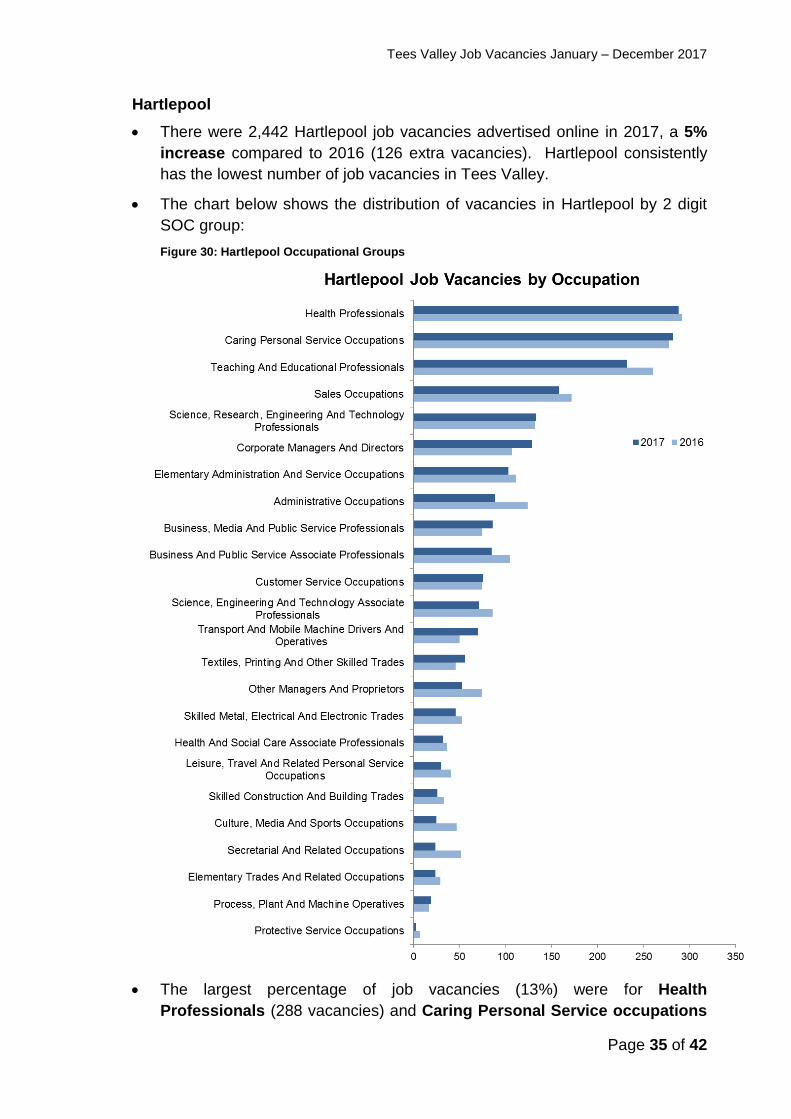
The chart below shows the distribution of vacancies in Hartlepool by 2 digit
SOC group:
Figure 30: Hartlepool Occupational Groups
The largest percentage of job vacancies (13%) were for Health
Professionals (288 vacancies) and Caring Personal Service occupations
Tees Valley Job Vacancies January – December 2017
Page 36 of 42
(278 vacancies), followed by Teaching and Educational Professionals with
11% (232 vacancies).
There has been a 21% rise in vacancies for Corporate Managers and
Directors when compared to 2016, with numbers increasing from 107 to 129
(22 extra vacancies).
There has been a 28% drop in vacancies for Administrative occupations
over the last year, with numbers falling from 124 to 89 (35 fewer vacancies).
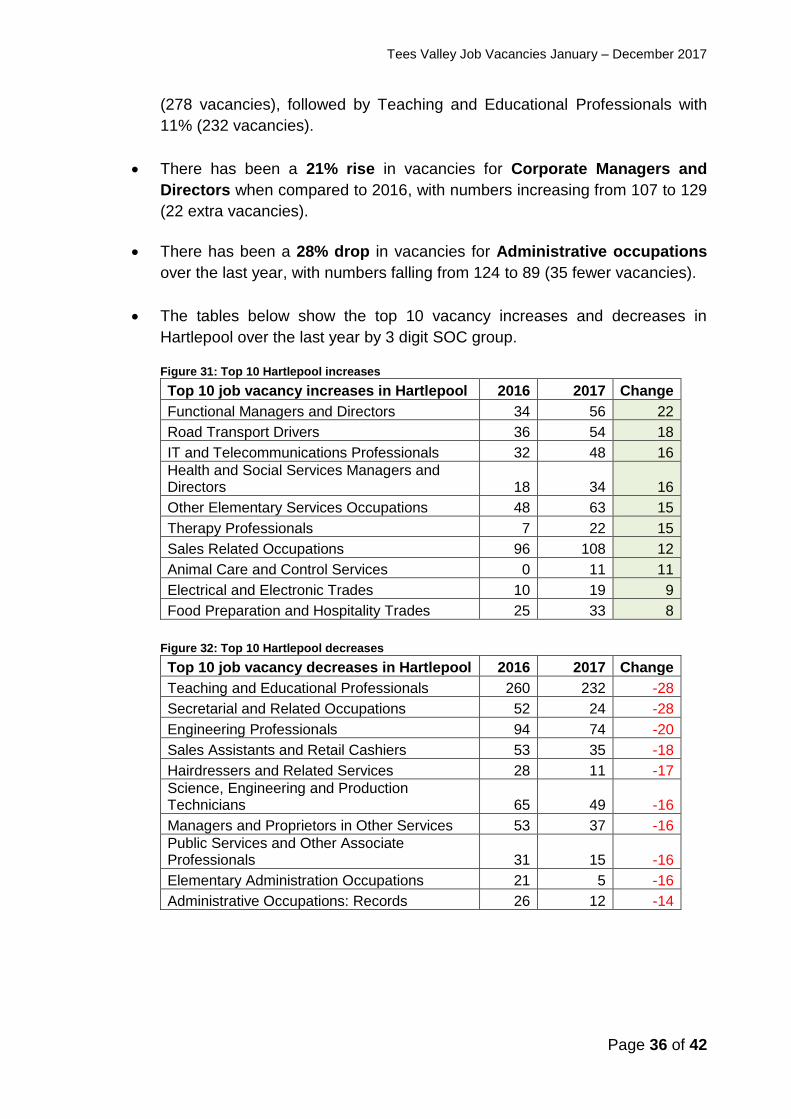
The tables below show the top 10 vacancy increases and decreases in
Hartlepool over the last year by 3 digit SOC group.
Figure 31: Top 10 Hartlepool increases
Top 10 job vacancy increases in Hartlepool 2016 2017 Change
Functional Managers and Directors 34 56 22
Road Transport Drivers 36 54 18
IT and Telecommunications Professionals 32 48 16
Health and Social Services Managers and Directors 18 34 16
Other Elementary Services Occupations 48 63 15
Therapy Professionals 7 22 15
Sales Related Occupations 96 108 12
Animal Care and Control Services 0 11 11
Electrical and Electronic Trades 10 19 9
Food Preparation and Hospitality Trades 25 33 8
Figure 32: Top 10 Hartlepool decreases
Top 10 job vacancy decreases in Hartlepool 2016 2017 Change
Teaching and Educational Professionals 260 232 -28
Secretarial and Related Occupations 52 24 -28
Engineering Professionals 94 74 -20
Sales Assistants and Retail Cashiers 53 35 -18
Hairdressers and Related Services 28 11 -17
Science, Engineering and Production Technicians 65 49 -16
Managers and Proprietors in Other Services 53 37 -16
Public Services and Other Associate Professionals 31 15 -16
Elementary Administration Occupations 21 5 -16
Administrative Occupations: Records 26 12 -14
Tees Valley Job Vacancies January – December 2017
Page 37 of 42
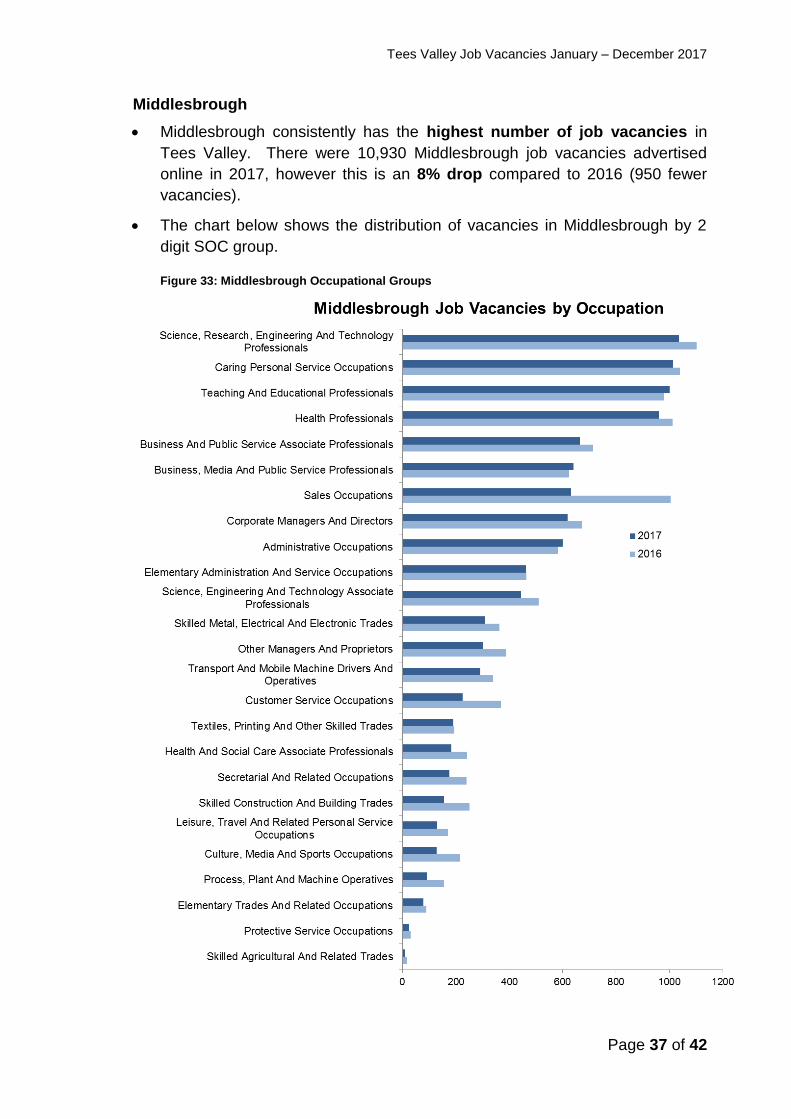
Middlesbrough
Middlesbrough consistently has the highest number of job vacancies in
Tees Valley. There were 10,930 Middlesbrough job vacancies advertised
online in 2017, however this is an 8% drop compared to 2016 (950 fewer
vacancies).
The chart below shows the distribution of vacancies in Middlesbrough by 2
digit SOC group.
Figure 33: Middlesbrough Occupational Groups
Tees Valley Job Vacancies January – December 2017
Page 38 of 42
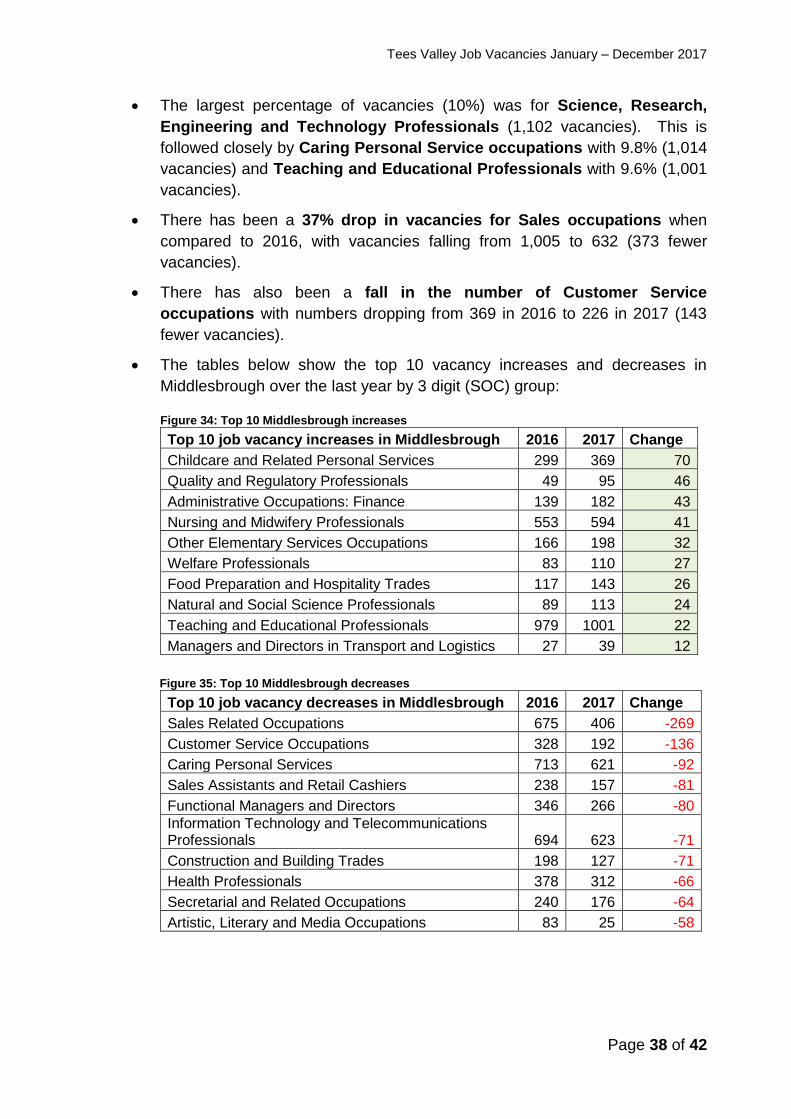
The largest percentage of vacancies (10%) was for Science, Research,
Engineering and Technology Professionals (1,102 vacancies). This is
followed closely by Caring Personal Service occupations with 9.8% (1,014
vacancies) and Teaching and Educational Professionals with 9.6% (1,001
vacancies).
There has been a 37% drop in vacancies for Sales occupations when
compared to 2016, with vacancies falling from 1,005 to 632 (373 fewer
vacancies).
There has also been a fall in the number of Customer Service
occupations with numbers dropping from 369 in 2016 to 226 in 2017 (143
fewer vacancies).
The tables below show the top 10 vacancy increases and decreases in
Middlesbrough over the last year by 3 digit (SOC) group:
Figure 34: Top 10 Middlesbrough increases
Top 10 job vacancy increases in Middlesbrough 2016 2017 Change
Childcare and Related Personal Services 299 369 70
Quality and Regulatory Professionals 49 95 46
Administrative Occupations: Finance 139 182 43
Nursing and Midwifery Professionals 553 594 41
Other Elementary Services Occupations 166 198 32
Welfare Professionals 83 110 27
Food Preparation and Hospitality Trades 117 143 26
Natural and Social Science Professionals 89 113 24
Teaching and Educational Professionals 979 1001 22
Managers and Directors in Transport and Logistics 27 39 12
Figure 35: Top 10 Middlesbrough decreases
Top 10 job vacancy decreases in Middlesbrough 2016 2017 Change
Sales Related Occupations 675 406 -269
Customer Service Occupations 328 192 -136
Caring Personal Services 713 621 -92
Sales Assistants and Retail Cashiers 238 157 -81
Functional Managers and Directors 346 266 -80
Information Technology and Telecommunications Professionals 694 623 -71
Construction and Building Trades 198 127 -71
Health Professionals 378 312 -66
Secretarial and Related Occupations 240 176 -64
Artistic, Literary and Media Occupations 83 25 -58
Tees Valley Job Vacancies January – December 2017
Page 39 of 42
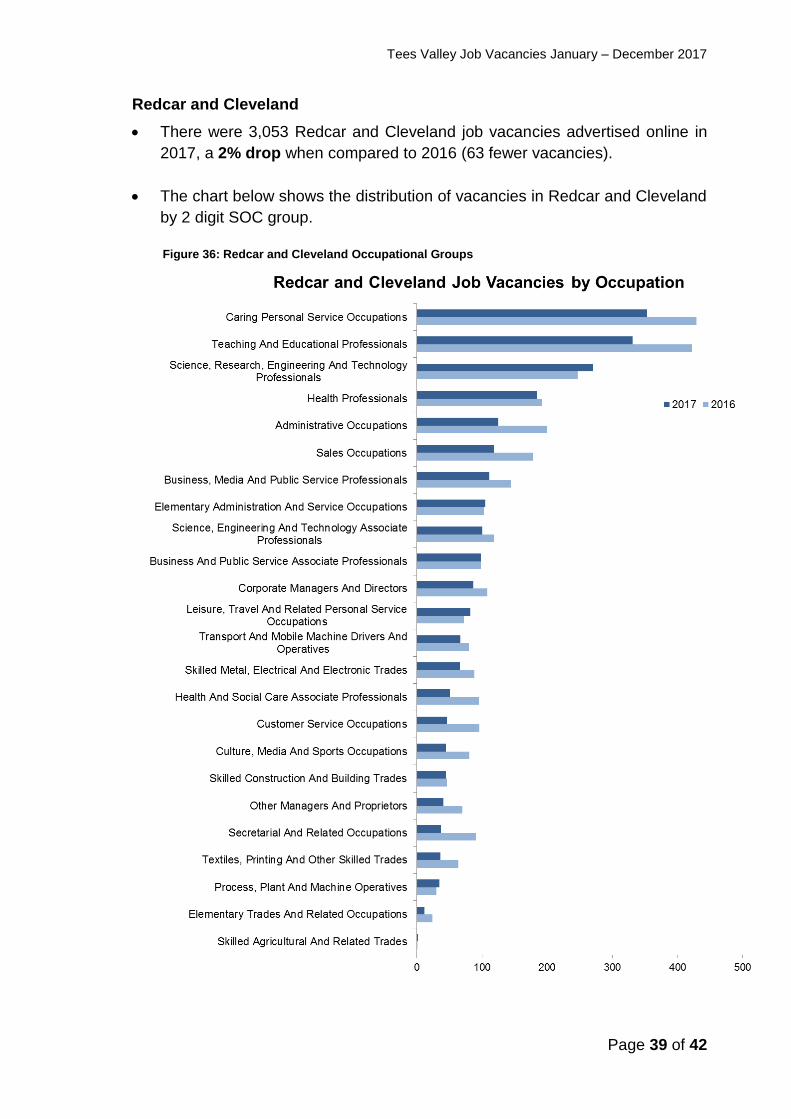
Redcar and Cleveland
There were 3,053 Redcar and Cleveland job vacancies advertised online in
2017, a 2% drop when compared to 2016 (63 fewer vacancies).
The chart below shows the distribution of vacancies in Redcar and Cleveland
by 2 digit SOC group.
Figure 36: Redcar and Cleveland Occupational Groups
Tees Valley Job Vacancies January – December 2017
Page 40 of 42
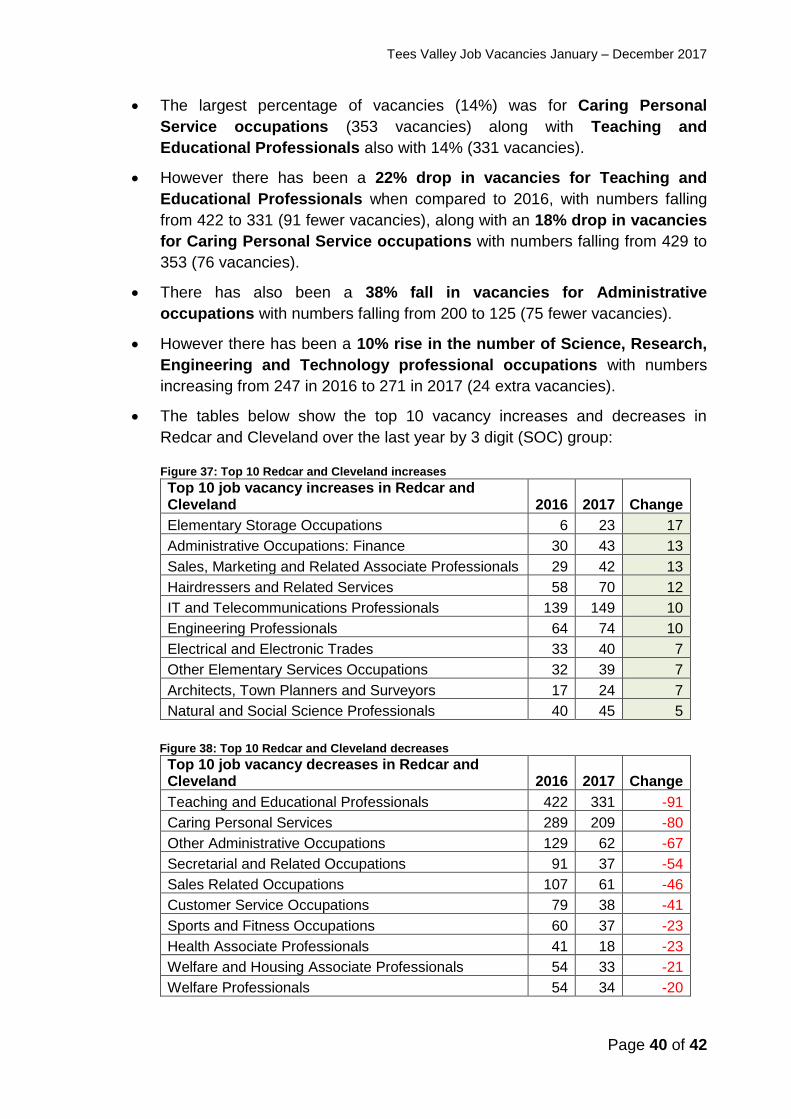
The largest percentage of vacancies (14%) was for Caring Personal
Service occupations (353 vacancies) along with Teaching and
Educational Professionals also with 14% (331 vacancies).
However there has been a 22% drop in vacancies for Teaching and
Educational Professionals when compared to 2016, with numbers falling
from 422 to 331 (91 fewer vacancies), along with an 18% drop in vacancies
for Caring Personal Service occupations with numbers falling from 429 to
353 (76 vacancies).
There has also been a 38% fall in vacancies for Administrative
occupations with numbers falling from 200 to 125 (75 fewer vacancies).
However there has been a 10% rise in the number of Science, Research,
Engineering and Technology professional occupations with numbers
increasing from 247 in 2016 to 271 in 2017 (24 extra vacancies).
The tables below show the top 10 vacancy increases and decreases in
Redcar and Cleveland over the last year by 3 digit (SOC) group:
Figure 37: Top 10 Redcar and Cleveland increases
Top 10 job vacancy increases in Redcar and Cleveland 2016 2017 Change
Elementary Storage Occupations 6 23 17
Administrative Occupations: Finance 30 43 13
Sales, Marketing and Related Associate Professionals 29 42 13
Hairdressers and Related Services 58 70 12
IT and Telecommunications Professionals 139 149 10
Engineering Professionals 64 74 10
Electrical and Electronic Trades 33 40 7
Other Elementary Services Occupations 32 39 7
Architects, Town Planners and Surveyors 17 24 7
Natural and Social Science Professionals 40 45 5
Figure 38: Top 10 Redcar and Cleveland decreases
Top 10 job vacancy decreases in Redcar and Cleveland 2016 2017 Change
Teaching and Educational Professionals 422 331 -91
Caring Personal Services 289 209 -80
Other Administrative Occupations 129 62 -67
Secretarial and Related Occupations 91 37 -54
Sales Related Occupations 107 61 -46
Customer Service Occupations 79 38 -41
Sports and Fitness Occupations 60 37 -23
Health Associate Professionals 41 18 -23
Welfare and Housing Associate Professionals 54 33 -21
Welfare Professionals 54 34 -20
Tees Valley Job Vacancies January – December 2017
Page 41 of 42
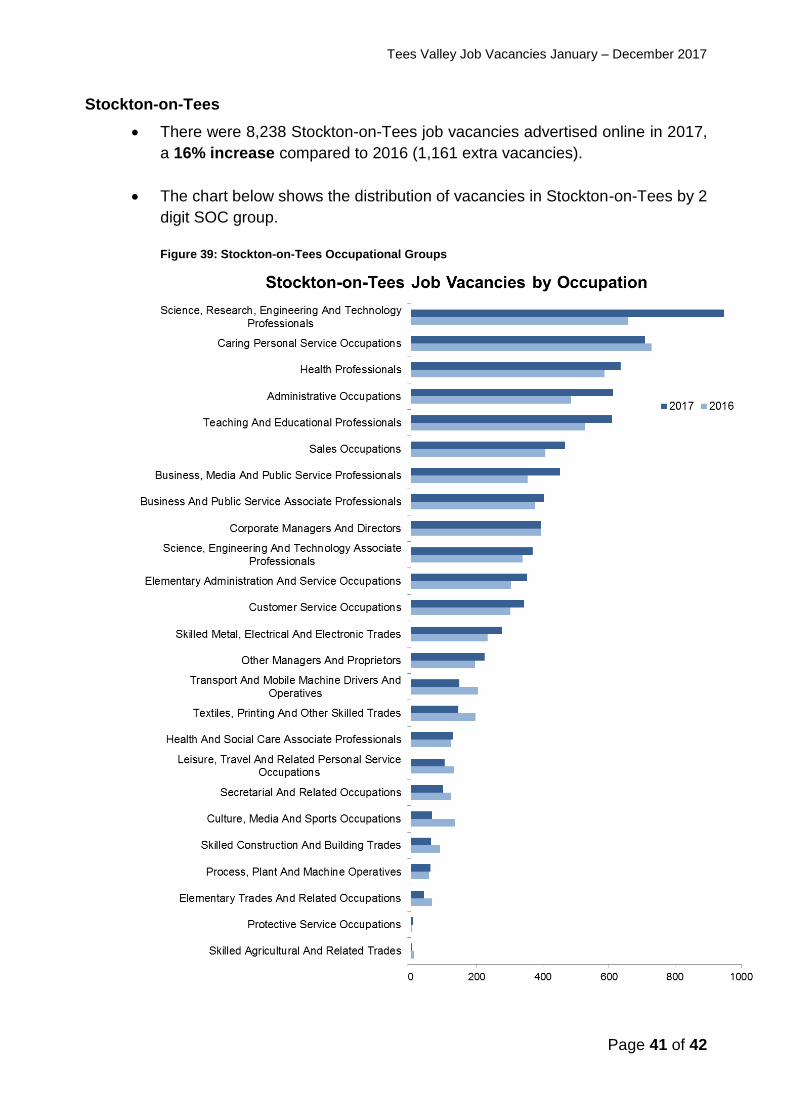
Stockton-on-Tees
There were 8,238 Stockton-on-Tees job vacancies advertised online in 2017,
a 16% increase compared to 2016 (1,161 extra vacancies).
The chart below shows the distribution of vacancies in Stockton-on-Tees by 2
digit SOC group.
Figure 39: Stockton-on-Tees Occupational Groups
Tees Valley Job Vacancies January – December 2017
Page 42 of 42
The largest percentage of vacancies (12%) was for Science, Research,
Engineering and Technology Professionals (948 vacancies). This is
followed by Caring Personal Service occupations with 9% (709
vacancies).
There has been a 44% increase in vacancies for Science, Research,
Engineering and Technology Professionals when compared to 2016, with
numbers increasing from 659 to 948 (289 extra vacancies). This is followed
by a 26% increase in Administrative occupations with vacancies rising
from 485 to 613 (128 extra vacancies).
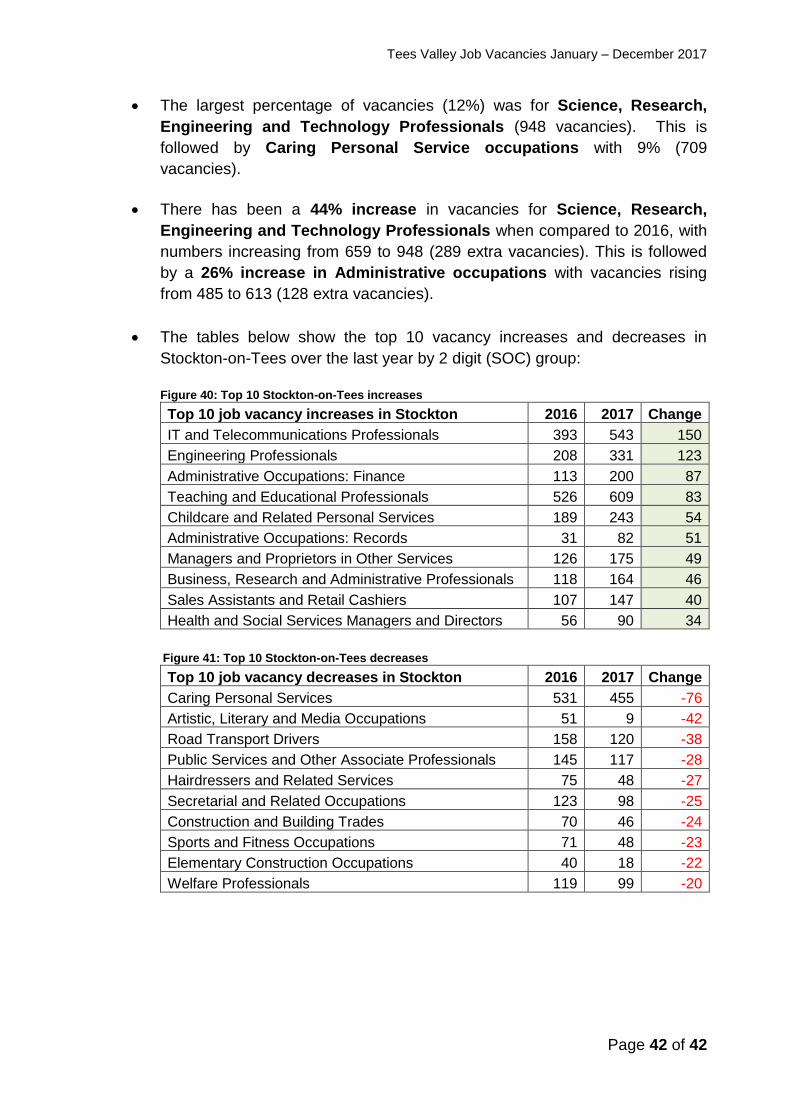
The tables below show the top 10 vacancy increases and decreases in
Stockton-on-Tees over the last year by 2 digit (SOC) group:
Figure 40: Top 10 Stockton-on-Tees increases
Top 10 job vacancy increases in Stockton 2016 2017 Change
IT and Telecommunications Professionals 393 543 150
Engineering Professionals 208 331 123
Administrative Occupations: Finance 113 200 87
Teaching and Educational Professionals 526 609 83
Childcare and Related Personal Services 189 243 54
Administrative Occupations: Records 31 82 51
Managers and Proprietors in Other Services 126 175 49
Business, Research and Administrative Professionals 118 164 46
Sales Assistants and Retail Cashiers 107 147 40
Health and Social Services Managers and Directors 56 90 34
Figure 41: Top 10 Stockton-on-Tees decreases
Top 10 job vacancy decreases in Stockton 2016 2017 Change
Caring Personal Services 531 455 -76
Artistic, Literary and Media Occupations 51 9 -42
Road Transport Drivers 158 120 -38
Public Services and Other Associate Professionals 145 117 -28
Hairdressers and Related Services 75 48 -27
Secretarial and Related Occupations 123 98 -25
Construction and Building Trades 70 46 -24
Sports and Fitness Occupations 71 48 -23
Elementary Construction Occupations 40 18 -22
Welfare Professionals 119 99 -20