teenagers' perception of canton ticino through the ... · teenagers' perception of canton...
TRANSCRIPT
1
Teenagers' perception of Canton Ticino through the official destination website: an eye tracking investigation
Candidate:
Edoardo Cantoni
Master in International Tourism
Supervisor: Dr. Elena Marchiori
Second Reader: Prof. Lorenzo Cantoni
Keywords: Eye-tracking, E-tourism, Teenagers’ Online Behavior, Destination Portals, Website Navigation
2
Table of Contents
1. Introduction ................................................................................................................................................................ ............ 8
1.1 Objectives and Research Questions .................................................................................................. 9
1.2 Research design ..................................................................................................................................... 10
1.3 Thesis outline ......................................................................................................................................... 11
2. Literature Review ................................................................................................................................................................ ... 13
2.1 What is eye tracking? ............................................................................................................................ 13
2.2 A history of eye tracking ........................................................................................................................ 15
2.3 Eye-tracking and web usability .............................................................................................................. 16
2.4 Eye-tracking and e-tourism ................................................................................................................... 17
2.5 Teenagers’ online and consumer behavior ........................................................................................... 19
3. Methodology ........................................................................................................................................................................ 22
3.1 Description of the case study ................................................................................................................ 22
3.2 Structure of the experiment using eye tracking and Pre-Post questionnaire ....................................... 23
3.2.1 Description of Tobii studio software and Eye-Tracker ................................................................... 23
3.2.2 Description of the eye tracking test ............................................................................................... 24
3.2.3 Description of DMO (Ticino Turismo) website ............................................................................... 25
3.3. Description of Phase A) ........................................................................................................................ 27
3.3.1 Description of Phase A1): Aspects of the free navigation that capture teenage users’ attention the most ................................................................................................................................................... 27
3.4 Description of Phase B): Match between self-declared aspects of interest and the actual navigation. ..................................................................................................................................................................... 39
3.4.1 Description of Phase B1): Most Viewed Themes vs Most Cited Attractions .................................. 39
3.4.2 Description of Phase B2): A Comparison between Eye Tracking, Self-Declared Investigation and Web Analytics .......................................................................................................................................... 40
4. Results ................................................................................................................................................................ ......................... 41
4.1 Results Phase A)..................................................................................................................................... 42
4.1.1. Results phase A1): Aspects of the free navigation that capture teenage users’ attention the most ................................................................................................................................................................. 42
4.1.2 Results Phase A2): Aspects of knowledge about Ticino and willingness to visit Ticino pre vs post website navigation .................................................................................................................................. 60
4.2 Results of phase B): Match between self-declared attractions and the actual free navigation. .......... 70
4.2.1 Results of Phase B1): Most Viewed Themes vs Most Cited Attractions ......................................... 70
4.2.2 Results of Phase B2): A comparison among Eye-Tracking data, Self-Declared Investigation and Web Analytics .......................................................................................................................................... 72
5. Conclusions, implications for the DMO and limitations ......................................................................................... 75

3
5.1 Conclusions ............................................................................................................................................ 75
5.2 Implications for the DMO (Ticino Turismo) ........................................................................................... 77
5.3 Limitations/ Further research ................................................................................................................ 78
6. Bibliography ............................................................................................................................................................................. 80
7. Annex ........................................................................................................................................................................................... 83
7.1 Interview with Luca Preto, Online Marketing Manager at Ticino Turismo ........................................... 83
7.2 Questionnaire ........................................................................................................................................ 85
7.3 Heat Maps ............................................................................................................................................. 88

4
List of Figures
Figure 1: Example of a heat map (left) and its related gaze plot (right) on a webpage
Figure 2: Screenshot of the Ticino website homepage, with the sections “Discover, “Explore” and “Plan”
Figure 3: Screenshots of the Ticino website with examples of sections in which images play a dominant role
Figure 4: Screenshots of the Ticino website with examples of clickable buttons embedded into pictures.
Figure 5: Central text AOI.
Figure 6: Central button AOI.
Figure 7: Ticino Logo AOI.
Figure 8: Discover voice AOI.
Figure 9: Discover menu AOI.
Figure 10: Explore voice AOI.
Figure 11: Explore menu AOI.
Figure 12: Plan voice AOI.
Figure 13: Plan menu AOI.
Figure 14: Inspire me AOI.
Figure 15: Examples of heat maps from the website.
Figure 17: Discover menu AOI.
Figure 18: Explore menu AOI.
Figure 19: Plan menu AOI.
Figure 20: Time to first fixation (seconds)
Figure 21 : Total fixation duration (seconds)
Figure 22: Fixation count (count)
Figure 23: Mouse click count (count)
Figure 24: Time to first mouse click (seconds)
Figure 25: Schematic representation of the gaze plot path of participants at aggregate level considering the “time to first fixation” metric.
Figure 26: Most visualized contents by theme
Figure 27: Ranking of most viewed graphic elements
Figure 28: Aspects that characterize Canton Ticino the most (pre-questionnaire)

5
Figure 29: Aspects that characterize Canton Ticino the most (post-questionnaire)
Figure 30: Themes of most cited attractions
Figure 31: Aspects characterize Canton Ticino the most Pre VS Post
Figure 32: Most Cited Attractions vs Most Viewed Contents
Figure 33: http://www.ticino.ch/, 23 participants
Figure 34: http://www.ticino.ch/en/discover.html, 10 participants
Figure 35: http://www.ticino.ch/en/explore.html, 10 participants
Figure 36: http://www.ticino.ch/en/discover/seasons/summer.html, 8 participants
Figure 37: http://www.ticino.ch/en/discover/destinations/lugano.html, 7 participants
Figure 38: http://www.ticino.ch/en/discover/destinations/bellinzona.html, 5 participants
Figure 39 : http://www.ticino.ch/en/discover/destinations/ascona-locarno.html, 5 participants
Figure 40: http://www.ticino.ch/en/explore/shopping.html, 5 participants
Figure 41: http://www.ticino.ch/en/explore/parks-gardens.html, 5 participants
Figure 42: http://www.ticino.ch/en/explore/sports/extreme-sports.html, 5 participants
Figure 43: http://www.ticino.ch/en/plan.html, 4 participants
Figure 44: http://www.ticino.ch/en/commons/details/Verzasca-Valley-Cool-green-water/96073.html, 4 participants
Figure 45: http://www.ticino.ch/it/, 4 participants
Figure 46: http://www.ticino.ch/en/explore/sports/traditional-sports.html, 4 participants
Figure 47: http://www.ticino.ch/en/explore/sports/traditional-sports.html, 4 participants
Figure 48: http://www.ticino.ch/en/explore/nightlife.html, 4 participants
Figure 49: http://www.ticino.ch/en/discover/experiences/nature.html, 3 participants
Figure 50: http://www.ticino.ch/en/discover/seasons/winter.html, 3 participants
Figure 51: http://www.ticino.ch/en/explore/excursions.html, 3 participants
Figure 52: http://www.ticino.ch/en/explore/sports/water-sports.html, 3 participants
Figure 53: http://www.ticino.ch/en/explore/sports/winter-sports.html, 3 participants
Figure 54: http://www.ticino.ch/en/commons/details/Scherrer-Park/4553.html, 3 participants
Figure 55: http://www.ticino.ch/en/plan/accommodation.html, 3 participants
Figure 56: http://www.ticino.ch/en/travel-inspirations/top-10-lugano.html, 3 participants
Figure 57: http://www.ticino.ch/en/travel-inspirations/beaches.html, 3 participants
Figure 58: http://www.ticino.ch/it/discover/experiences/culture, 2 participants

6
Figure 59: http://www.ticino.ch/it/discover/destinations, 2 participants
Figure 60: http://www.ticino.ch/it/discover/seasons, 2 participants
Figure 61: http://www.ticino.ch/it/explore/gastronomy/typical-products, 2 participants
Figure 62: http://www.ticino.ch/it/explore/unesco-world-heritage, 2 participants
Figure 63: http://www.ticino.ch/it/plan/moving-around/railways, 2 participants
Figure 64: http://www.ticino.ch/it/plan/getting-there/by-train, 2 participants

7
List of Tables
Table 1: List of all the considered heat maps
Table 2: Keywords associated to Ticino resulted from the pre-questionnaire
Table 3: Aspects characterize Canton Ticino the most (pre VS post)
Table 4: Ranking of the most selected aspects (pre VS post)
Table 5: Most Cited Attractions vs Most Viewed Contents

8
1. Introduction
Eye tracking is a technique that allows understanding where a person is looking, more precisely to
measure the movements of the eyes with respect to the head (Nielsen and Pernice 2010).
The eye tracking concept evolved over time, going from the first techniques based on direct
observations on eye movements till the most recent ones based on modern eye trackers hardware
and software. Nowadays, thanks to technological advances, the eye tracking technique has been
applied in various fields, and particularly has been proved to be an effective tool in psychology and
marketing research to gain a deeper understanding of users’ behavior and usability investigations
(Gidlöf et al. 2013; Venkatraman et al., 2014).
In recent years, eye tracking has been also applied to tourism research. For example, the eye-
tracking technique has been tested in the hospitality sector to investigate the online decision-
making process of potential clients (Noone & Robson, 2014). Other studies focused the attention
on people’s perception of tourism-related images according to ethnicity (Wang & Sparks, 2014), or
analyzed advertising effectiveness on tourism-related blogs, social networks, and reviews portals
(Méndez, 2015).
Eye-tracking research has been carried out in the field of social media and tourism as well. This
branch of research has attempted to analyze what are the aspects that tend to attract users’
attention the most while are navigating on tourism-related social media pages (Marchiori & Cantoni
2015).
In particular, this branch of research has highlighted the opportunities eye tracking can give to
better understand how people approach online contents and what their navigation patterns are.
Behavioral differences may occur according to several reasons, motivations, type of website, users’
profiles and socio-demographic variables.
In the present work, the eye-tracking technique is applied in the e-tourism field, and specifically to
analyze the website navigation of teenagers.

9
1.1 Objectives and Research Questions
This work aims to focus on a specific segment: teenagers. More specifically, this work wants to
contribute to the understanding of the online behavior of teenagers in tourism-related online
portals, with the use of the eye-tracking technique. In fact, no tourism-related study has yet
investigated behavioral patterns of teenagers on online tourist portals.
This study also wants to contribute to the field of online consumer behavior studies, with a focus on
tourism. Specifically, the present research investigates teenagers and their particular preferences in
terms of tourism-related online contents.
Specifically, the work focuses its attention on Italian teenagers living in a neighboring Italian
province (Como) of the Ticino canton (Switzerland). Their online behavior has been studied through
the free navigation of the official destination portal of Ticino (www.ticino.ch). This particular
segment has been chosen because of both its geographical proximity to the Ticino territory, and of
its market potential. In fact, teenagers from this area can be considered both actual and perspective
tourists.
Moreover, the present study aims to provide insights on a segment (teenagers) of which little
information is known to a DMO (Destination Management Organization). As it has emerged from
an interview with the online marketing manager (see annex 7.1) of the DMO under study, having
insights on this tourist segment may be helpful for the destination. Teenagers in fact are difficult to
track, and, as it has been mentioned before, they may become potential future tourists.
The study has four main research questions:
1) What are the most viewed tourism-related contents on the Ticino destination website
by the teenager segment?
2) Is there any match between what participants look at and what they report to prefer in
terms of tourism-related contents?
3) What is the Italian teenagers’ perception of Ticino: is there any change in the
perception before and after the website navigation?
4) Comparing the results from different sources (eye-tracking data, questionnaires, and
web analytics) can drive to a more precise overview of teenagers’ preferences?

10
1.2 Research design
Data for this research have been collected through a specific experiment, based on a “pre-post”
questionnaire, interspersed with a test where users have been exposed to a free navigation on a
website and their online behaviors tracked using an eye-tracking technique. The session is based on
the free navigation of the official tourism portal of Canton Ticino (www.ticino.ch).
The four research questions will be answered as it follows:
1) The first research question will be answered by analyzing eye-tracking data related to the
free navigation of the destination website.
2) The second research question will be answered by comparing eye tracking data and
questionnaire results.
3) The third research question will be answered by comparing answers to the pre and post
navigation questionnaire.
4) The fourth research question will be answered by comparing data from questionnaires, eye-
tracking sessions, and the official Destination Management Organization (DMO) statistics.
Data from the eye tracking sessions have been collected using Tobii Pro Studio 3.4.5, the eye-
tracking software of the Swedish house Tobii. Data were then exported on excel and analyzed.
Questionnaire results were gathered and then transposed on excel, where they were analyzed. A
consent form have been administrated before the experiment: participants whose age was higher
than 18 years old were asked to fill a consent form allowing the treatment of personal data, while
participants whose age was less than 18 years old were asked to have the consent form signed by
their parents.
11
1.3 Thesis outline
Chapter 1: Introduction
In this part, the thesis’ topic is introduced, together with the objectives of the research and the relative research questions. The research design is then illustrated, explaining how research questions will be answered.
Chapter 2: Literature review
This chapter illustrates the current literature on eye-tracking research, introducing the technique and its application fields, with particular focus on eye-tracking and web usability and eye-tracking and e-tourism. Finally, further stress is posed over the literature on teenagers’ online consumer behavior.
Chapter 3: Methodology
The third chapter illustrates the methodology applied, listing the different phases of the research. The structure of the experiment is also explained.
Chapter 4: Results
In this part, results of the research are explained and interpreted. Results are showed for each phase, following the same scheme adopted in the methodology.
Chapter 5: Conclusions
In the conclusion, research questions are answered and discussed together with the most relevant findings of the research. Then, limitations for the study and future research are then illustrated and implications for the DMO discussed.

12
Note
Part of the issues discussed in chapters 1, 2, 3, 4 and 5 have been presented in the following paper, (co)authored by Edoardo Cantoni:
Cantoni E., Marchiori E. & Cantoni L. (2016). Teenagers’ Destination Website Navigation. A Comparison among Eye-Tracking, Web Analytics and Survey Data. (To be published soon).

13
2. Literature Review
This chapter introduces the topic of the present work within the frame of eye tracking and online
consumer behavior. Specifically, different specific sub themes are here explained: the concept of
eye tracking and its history, eye tracking and e-tourism, eye tracking and web-usability and online
consumer behavior studies.
2.1 What is eye tracking?
Eye tracking has received several definition by different authors. Poole & Ball (2005) defined eye
tracking as “a technique whereby an individual eye’s movements are measured so that the
researcher knows both where a person is looking at in any given time and the sequence in which
the person’s eyes are shifting from one location to another” (p. 211). This definition introduces three
important aspects, the “where”, the “when” and the “how”. Tracking eye movements in fact means
to understand “where” does the eyes move, at the same time “when” does this movements happen
over time, and “how”, analyzing with which sequences of actions.
Nielsen and Pernice (2010) defined eye tracking as a technique that allows understanding where a
person is looking, measuring the movements of the eyes with respect to the head, while Van Gog
and Jarodzka (2013) defined eye-tracking as “[...] tracking the movement of the eye ball(s) and
relating this movement to a stimulus” (p. 143). This rather short definition has although the merit
to introduce the concept of “stimulus”. According to the Oxford Dictionary, a stimulus is “a thing or
event that evokes a specific functional reaction in an organ or tissue” (Definition of stimulus in
English, s.d.). In other words, a stimulus is anything that can influence a reaction of an organ. If we
take into consideration the eye as an organ and its movements as a reaction to a stimulus, it is
possible to understand the concept of “visual stimulus”. A visual stimulus for the eye can be in fact
any object posed in front of it: images, videos, or the reality itself.
Summing up these two definitions it is possible to argue that eye tracking is a technique that allows
researchers to understand where, when and how a person look over a certain visual stimulus.
Nowadays, thanks to technological advances, the eye tracking technique has been applied in various
fields, and particularly has been proved to be an effective tool in psychology and marketing research
14
domain to gain a deeper understanding of users’ behaviour and usability (Gidlöf et al. 2013;
Venkatraman et al., 2014). As presented in chapters 2.3 and 2.4, the eye tracking technique has
been recently applied also in the fields of tourism, usability and webpage analysis.
However, what does an eye tracker measures in practice? Modern eye trackers are able to measure
eye movements in terms of “saccades” and “fixations”. Saccades are “eye movements used to move
the fovea rapidly from one point of interest to another” (Types of eye movement, 2016). These
movements can be either voluntary or involuntary, with an average duration of 20-40 microseconds.
On the other side, a fixation is “the period of time where the eye is kept aligned with the target for
a certain duration, allowing for the image details to be processed” (Types of eye movement, 2016).
Their duration goes from 50 to 600 microseconds. Eye movements are made by an alternation
between saccades and fixations, and the modern eye-trackers are capable to record these
movements, producing various results. Particularly, by registering eye movements on the screen,
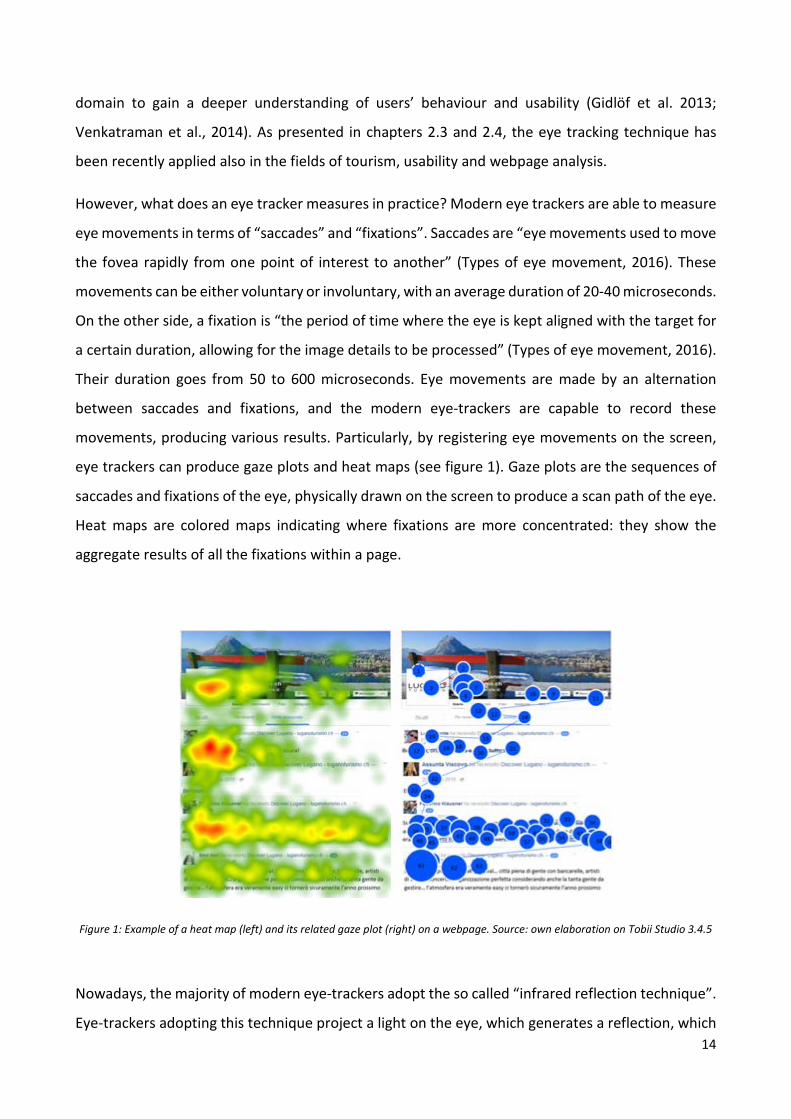
eye trackers can produce gaze plots and heat maps (see figure 1). Gaze plots are the sequences of
saccades and fixations of the eye, physically drawn on the screen to produce a scan path of the eye.
Heat maps are colored maps indicating where fixations are more concentrated: they show the
aggregate results of all the fixations within a page.
Figure 1: Example of a heat map (left) and its related gaze plot (right) on a webpage. Source: own elaboration on Tobii Studio 3.4.5
Nowadays, the majority of modern eye-trackers adopt the so called “infrared reflection technique”.
Eye-trackers adopting this technique project a light on the eye, which generates a reflection, which
15
is in turn captured by sensors within the tracker. The software then process this data, and identifies
eyes’ position of the user and his/her gaze point on the screen.
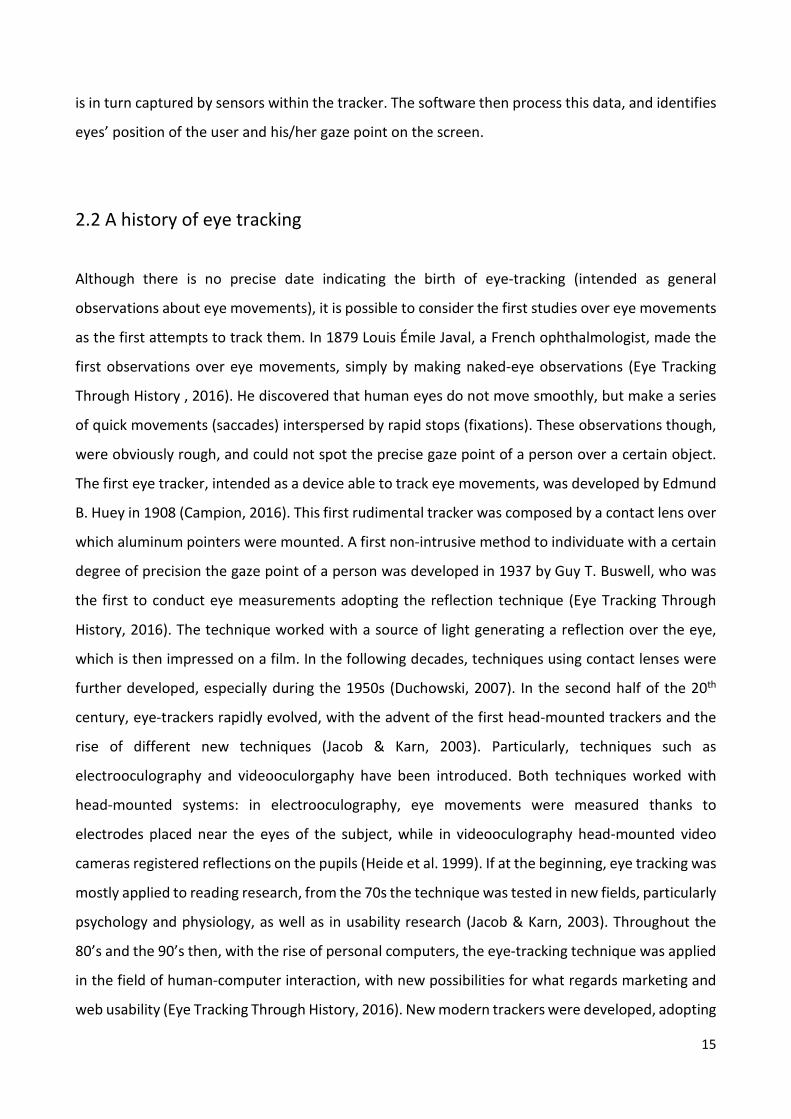
2.2 A history of eye tracking
Although there is no precise date indicating the birth of eye-tracking (intended as general
observations about eye movements), it is possible to consider the first studies over eye movements
as the first attempts to track them. In 1879 Louis Émile Javal, a French ophthalmologist, made the
first observations over eye movements, simply by making naked-eye observations (Eye Tracking
Through History , 2016). He discovered that human eyes do not move smoothly, but make a series
of quick movements (saccades) interspersed by rapid stops (fixations). These observations though,
were obviously rough, and could not spot the precise gaze point of a person over a certain object.
The first eye tracker, intended as a device able to track eye movements, was developed by Edmund
B. Huey in 1908 (Campion, 2016). This first rudimental tracker was composed by a contact lens over
which aluminum pointers were mounted. A first non-intrusive method to individuate with a certain
degree of precision the gaze point of a person was developed in 1937 by Guy T. Buswell, who was
the first to conduct eye measurements adopting the reflection technique (Eye Tracking Through
History, 2016). The technique worked with a source of light generating a reflection over the eye,
which is then impressed on a film. In the following decades, techniques using contact lenses were
further developed, especially during the 1950s (Duchowski, 2007). In the second half of the 20th
century, eye-trackers rapidly evolved, with the advent of the first head-mounted trackers and the
rise of different new techniques (Jacob & Karn, 2003). Particularly, techniques such as
electrooculography and videooculorgaphy have been introduced. Both techniques worked with
head-mounted systems: in electrooculography, eye movements were measured thanks to
electrodes placed near the eyes of the subject, while in videooculography head-mounted video
cameras registered reflections on the pupils (Heide et al. 1999). If at the beginning, eye tracking was
mostly applied to reading research, from the 70s the technique was tested in new fields, particularly
psychology and physiology, as well as in usability research (Jacob & Karn, 2003). Throughout the
80’s and the 90’s then, with the rise of personal computers, the eye-tracking technique was applied
in the field of human-computer interaction, with new possibilities for what regards marketing and
web usability (Eye Tracking Through History, 2016). New modern trackers were developed, adopting

16
the infrared reflection technique (see chapter 2.1). Fields of research expanded further, and
nowadays eye tracking has been extensively used in psychology and marketing (Gidlöf et al. 2013;
Venkatraman et al., 2014).
2.3 Eye-tracking and web usability
Eye tracking has been particularly applied to develop usability studies. Worldwide, usability is
defined by the ISO 9241-11, developed by International Organization for Standardization, as the
“extent to which a product can be used by specified users to achieve specified goals with
effectiveness, efficiency and satisfaction in a specified context of use” (Ergonomic requirements for
office work with visual display terminals (VDTs) — Part 11: Guidance on usability, 2016). In other
words, studying usability means to understand how people interact with an object, analyzing
behaviors and eventual problems in performing a task. Usability studies with eye trackers can be
carried out on websites, smart phones, software and applications. In this field, eye tracking can
contribute to solve usability problems, and in turn, evaluate the uses of a webpage and/or a digital
solution.
Within the usability field, eye tracking has been used to gain a deeper understanding of website
navigation. For example in this direction, a specific research by Pan et al. (2004) has been conducted
to verify if variables such as individual differences, type of website being viewed and webpage order,
were influencing ocular behavior on websites. The study confirmed that gender of users and order
of pages being displayed do influence ocular behavior. Specifically, women showed a duration of
the fixation on a page in avarage shorter compared to men fixation avarage. Pages being displayed
as second (e.g. internal pages) registered shorter mean fixations than the one showed first
(homepages). Mean fixations in homepages and internal pages varied also according to the type of
website (shopping site, news site, etc.). One of the first studies to investigate website navigation
with the use of eye tracking has been carried out by Russel (2005). The study represents one of the
first of its kind to break down sections of webpages into precise areas of interest. Specifically, the
research focuses on e-commerce websites, and demonstrates that what people actually see usefully
supplements what people report to see on a webpage.
Another important web usability study is the one carried out by Wan Adilah Wan et al. (2013), that
analyzed users’ behavior in social networks. The study revealed that on social networks like
17
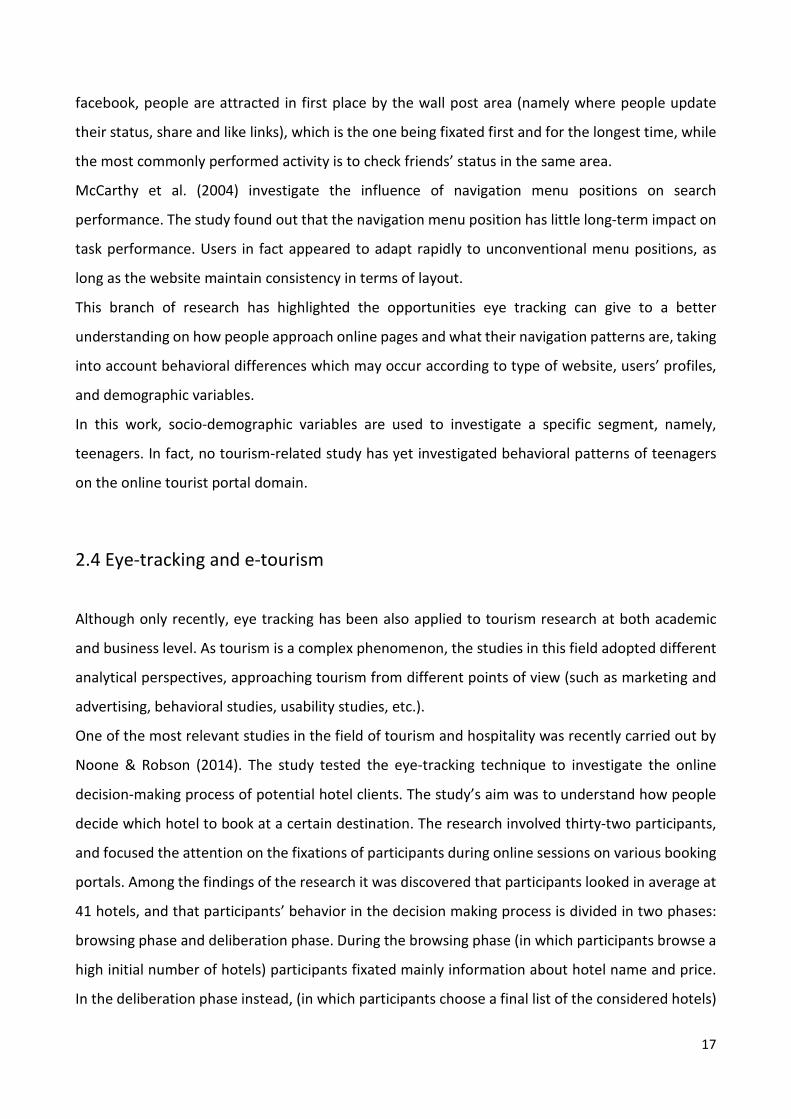
facebook, people are attracted in first place by the wall post area (namely where people update
their status, share and like links), which is the one being fixated first and for the longest time, while
the most commonly performed activity is to check friends’ status in the same area.
McCarthy et al. (2004) investigate the influence of navigation menu positions on search
performance. The study found out that the navigation menu position has little long-term impact on
task performance. Users in fact appeared to adapt rapidly to unconventional menu positions, as
long as the website maintain consistency in terms of layout.
This branch of research has highlighted the opportunities eye tracking can give to a better
understanding on how people approach online pages and what their navigation patterns are, taking
into account behavioral differences which may occur according to type of website, users’ profiles,
and demographic variables.
In this work, socio-demographic variables are used to investigate a specific segment, namely,
teenagers. In fact, no tourism-related study has yet investigated behavioral patterns of teenagers
on the online tourist portal domain.
2.4 Eye-tracking and e-tourism
Although only recently, eye tracking has been also applied to tourism research at both academic
and business level. As tourism is a complex phenomenon, the studies in this field adopted different
analytical perspectives, approaching tourism from different points of view (such as marketing and
advertising, behavioral studies, usability studies, etc.).
One of the most relevant studies in the field of tourism and hospitality was recently carried out by
Noone & Robson (2014). The study tested the eye-tracking technique to investigate the online
decision-making process of potential hotel clients. The study’s aim was to understand how people
decide which hotel to book at a certain destination. The research involved thirty-two participants,
and focused the attention on the fixations of participants during online sessions on various booking
portals. Among the findings of the research it was discovered that participants looked in average at
41 hotels, and that participants’ behavior in the decision making process is divided in two phases:
browsing phase and deliberation phase. During the browsing phase (in which participants browse a
high initial number of hotels) participants fixated mainly information about hotel name and price.
In the deliberation phase instead, (in which participants choose a final list of the considered hotels)

18
participants fixated over more types of information, such as firm-generated images, information
about location, descriptions, and user ratings. The study definitely contributed in the understanding
of online consumer behavior of tourists.
Other studies took into consideration psycho-demographic variables. In this direction, a recent
study by Wang & Sparks (2014) focused the attention on people’s perception of tourism-related
images according to ethnicity. Particularly, the study tested the reaction of Chinese and Australian
participants over two types of tourism-related images: images representing high/low arousal
activities and images representing natural/built environments. Findings suggest that fixations
patterns do vary according to the two groups, with the Australian participants performing more
frequent and longer fixations in general, as well as according to type of image, with Chinese
participants performing lower and shorter fixations over low arousal and natural images.
Eye-tracking research has been carried out in the field of social media and tourism as well. In this
field, an important study by Marchiori & Cantoni (2015) analyzed users’ behavior on tourism-related
social media pages. The aim of the research was to compare self-declared areas of interest within
social media pages with the actual seen areas identified with the eye tracking technique. Results
from the study proved that what people declare to be attracted by might diverge from what people
actually see on a webpage. The authors give an explanation to this apparently contradictory results
by noticing that self-declared areas of interest are normally seen very quickly at the beginning of
the navigation, while areas resulting from the eye-tracking analysis are the outcome of the whole
navigation time. The authors conclude that, therefore, both a self-reported approach and an eye
tracking one should be applied to gain a better understanding of what grabs users’ attention the
most during navigation.
Eye tracking has been also used to analyze the effectiveness of tourism-related images. For example,
a study by Méndez (2015) used the eye-tracking technique to analyze advertising effectiveness on
tourism-related blogs, social networks and reviews portals. Results from the research led to the
conclusion that advertising banners are more effective on social networks, and less in blogs and
review portals, while in general, the majority of users failed to recall the brand advertised in the
banners. Another study by Li et al. (2016) analyzed the advertising effectiveness of tourist images
with embedded text. Among the findings of the study, the most relevant are that in general, images
with embedded text attract participants’ visual attention the most, independently from the
language, but images with text in a known language attract more than the ones in an unknown

19
language. Findings suggest also that images with single messages attracts more participants’ visual
attention than the ones with multiple messages.
The use of the eye tracking technique in tourism field is therefore very recent, and in the last few
years consistently grew, but needs further research to evaluate many aspects that have not been
considered yet. The present work will try to contribute filling the gap, by analyzing the behavior of
teenagers in an online tourism portal.
2.5 Teenagers’ online and consumer behavior
The present work focuses its attention over teenagers and their online behavior. For teenagers we
intend that group aged 13-19. In order to better understand the characteristics of this segment, a
brief description of the main findings about their online behavior is here discussed.
One of the main studies carried out over the teenager segment has been developed by Gidlöf et al.
(2012), analyzing the exposure of Swedish teenagers to online advertising. Particularly, the study
found out that out of all the potential online advertisings to which teenagers were exposed (namely
132 ads), only the 10 percent of it was actually seen, revealing great resistance to this type of
advertising. The research also found that teenagers’ visual attention is significantly influenced by
the size and position of the online ad, whether gender of users did not have any influence.
A recent article by Kaplan (2013) analyzing online purchasing behavior of teenagers, pointed out
that this particular segment has short attentions spans towards online advertisement, and this
because they are many times doing multiple things while navigating online. An effective way to gain
their attention is to adopt a concise and transparent messaging style.
Another study by Loranger & Nielsen (2013) analyzed the online behavior of teenagers and their
performance in achieving tasks. The study found that despite feeling confident while navigating
online, teenagers have a lower success rate (71%) in accomplishing tasks compared to adults (83%).
This because they tend to give up quite fast if they don’t find what they want, showing low levels of
patience and normally are less cautious than adults, often making snap judgements. The study
discovered that teenagers have highest success rate in e-commerce websites (that normally require
little reading), while have more difficulties on government and non-profite ones (usually dense in
terms of information). The study also prooved that teens don’t like to read a lot on webpages, and

20
prefer contents that are illustrated visually; they also dislike dull and boring contents and expect
quickly loading pages.
A study by Khan & Locatis (1998) about information retrieval on the World Wide Web, found that
when it comes to prioritize tasks, experienced high school students are more efficient than novices,
even though their success rate in search process is not higher. In line with these results, Lazonder
et al. (2000) observed that experienced high school students can locate Web sites (in terms of online
navigation) better than inexperienced ones, but at the same time, results show that experienced
students are not better at browsing in websites to find information.
In recent years, teenagers have been also studied as online consumers.
A paper by Hill & Beatty (2011) investigated how teenagers are becoming competent online
consumers, analyzing their shopping and self-efficacy development in the web. Among the main
findings of this study, a significant one is that teenagers learn from the medium they are using, and
the learning improves with age. Furthermore, their online shopping behavior is significantly
influenced by their parents’ online attitudes, and, as adults, they are motivated by hedonic and
utilitarian reasons. The study than demonstrates that these reasons do motivate them, helping
them to become more competent online shoppers.
In the same field, another work by Batat (2008) investigated if the competences of teenagers aged
11-15 in terms of online consumption skills. The study revealed that teenagers seek to become
competent consumers by acquiring goods on the net in new ways, many times without paying
anything (for example by downloading material). In this sense, for teenagers, a competent
consumer is the one that is able to transgress a rule while acquiring goods on the net. Teenagers
are also enthusiast about new technologies, and they are very proud to show to their peers their
achievements. Generally, the study proved that the perception of a good online consumer changes
for teenagers and adults.
A study by Niu (2013), proved that teenagers’ consumer behavior is affected by the behavior of their
peers, especially when it comes to planned purchasings. Moreover, they repute online shopping as
a recreational activity, and while doing it they are influenced by product quality, brand, and fashion.
According to the study, these three factors are the most important to take into consideration in
order to predict teenagers’ consumer behavior.
Reagading consuming trends, a recent research by the Business Insider has reported that the
number of teenagers going online for shopping is quickly increasing (Smith, 2014). The research
revealed that in the US, more and more teenagers are going online to shop, with consistent
21
increases both for boys (86% in 2014 vs 78% in 2012) and for girls (76% in 2014 vs 72% in 2012).
Then, in terms of preferences, boys tend to shop general e-commerce site, with Amazon (34%) and
eBay (8%) representing the most accessed, while girls, tend to shop on more specialized websites.
Kaplan (2013) gives us an overview of the teenagers’ most purchased products. From the study it
has been reported that clothing is the most popular product, followed by electronics and footwear.
22
3. Methodology
In order to solve the above-mentioned research questions, two research phases have been
designed:
o Phase A:
o A1): Aspects of the free navigation that capture teenage users’ attention the most
o A2): Aspects of the knowledge about Ticino and willingness to visit Ticino pre vs
post website navigation
o Phase B:
o B1): Most Viewed Themes vs Most Cited Attractions
o B2): A Comparison between Eye Tracking, Self-Declared Investigation and Web
Analytics
Before describing in details the two phases, the case study is introduced, together with a
description of the eye-tracking test and the DMO website.
3.1 Description of the case study
The research protocol for the present work was developed in early May 2016. The aim of the
research was to develop an eye-tracking test based on the free navigation of the website
www.ticino.ch, the official tourist portal of the destination Canton Ticino (Switzerland). The test was
addressed to a particular group segment: teenagers from Como, a bordering region of Ticino.
This particular segment was chosen for mainly two reasons: teenagers represent both an actual and
a perspective tourist segment for Ticino. They are an actual segment because they might be aware
of the destination for physical proximity reasons, and many of them might have already visited it for
different motives. However, at the same time, they represent a perspective segment for the
destination because they might likely be future excursionists/travelers.
Another reason behind the test was to develop an eye tracking study on the new website of Ticino:
the actual tourist website of Canton Ticino was launched in 2015, and so far, no eye-tracking test
has been carried out on it. Therefore, the test gives a unique opportunity to study participant’s eye

23
movements on the contents displayed on the website, and to gain insights about what does grab
teenagers’ attention during navigation.
The test has been carried out during the first two weeks of June 2016. Besides free navigation, the
tests also included a “pre-post” questionnaire. The participants’ panel was composed by 23 Italian
high school students (aged 17-19), selected among two classes of the same school. The school
(Istituto Caio Plinio II) was based in the center of Como (Lombardy, Italy) one of the most important
town bordering Canton Ticino. A total of 23 tests were therefore conducted and 23 corresponsive
questionnaires administered. The school was involved in the research thanks to the collaboration
between webatelier.net Lab, a research and development laboratory of the Faculty of
Communication Sciences at USI (Università della Svizzera italiana), and Fondazione Cometa, a
private foundation involved in high school education and higher education. A consent form have
been administrated before the experiment: participants whose age was higher than 18 years old
were asked to fill a consent form allowing the treatment of personal data, while participants whose
age was less than 18 years old were asked to have the consent form signed by their parents.
The whole test was based on the concept of free navigation: participants were left free to navigate
the Ticino website starting from the homepage. The website was displayed in Italian to let
participants navigate it in their own language.
3.2 Structure of the experiment using eye tracking and Pre-Post questionnaire
3.2.1 Description of Tobii studio software and Eye-Tracker
Data from free navigation on the Ticino website were collected usin Tobii Studio 3.4.5, the eye-
tracking software of the Swedish house Tobii.
The software offers the possibility to extrapolate data from the participants’ navigation in many
ways. Specifically, the software offers the possibility to produce Heat Maps, Gaze Plots and to
calculate Eye Metrics based on Areas of Interest (AOIs). Heat Maps are colored maps showing where
the participants’ fixations are concentrated, while Gaze Plots are maps showing the scan path of the
eye trough the page. Eye Metrics are calculated out of Areas of Interest, artificial label posed over

24
specific sections of the page. It is possible to calculate a wide range of data about eye movements
according to the specific metrics used.
Eye movements were captured using the Tobii tracker X2-60, a portable eye-tracker working with
the “infrared reflection” technique. The infrared reflection technique works as it follows: micro
projectors create a near-infrared reflection light on the eye, then sensors within the tracker capture
this light, lastly, the software uses image-processing algorithms to calculate the eyes’ position with
respect to the screen, individuating the exact gaze point of the user on the screen (What Is Eye
Tracking?, 2016).
3.2.2 Description of the eye tracking test
Each participant was introduced in a computer room, where a PC was available with the Tobii tracker
mounted below the screen. Before the beginning of the test, a pre questionnaire (on paper) was
administered (see 3.3.1.3 and 7.2). Then, the participant was asked to comfortably seat in front of
the PC, at a distance of approximately 60 centimeters from the screen, and invited to maintain this
position for the entire duration of the test. Once the participant ID was inserted, the eye-calibration
process started. The calibration process allows the tracker to calculate the position of the
participant’s eye with respect to the screen. During calibration, the participant has to follow a red
spot moving over the screen stopping over predefined spots. After the calibration procedure, the
test could start. Before the free navigation on the website, the test started with a couple of further
instructions to be followed by the participant, regarding the typology of test. After the last
instruction was screened, the free navigation could start. A direct link brought the participant to the
homepage, which has been left free to browse the site for a maximum of 5 minutes. Participants
were not informed to have 5 minutes of time to navigate. This in order to let them free to navigate
and in turn see which aspects capture their attention without having a time constrain. After the free
navigation, a post-questionnaire was administered.

25
3.2.3 Description of DMO (Ticino Turismo) website
Ticino Turismo launched its new website in March 2015. The website represents an updated version
of the previous one, with several improvements both in terms of contents and of layout. Contents
are re-ordered in new thematic sections, and the layout has changed in the direction of a more
visual and intuitive navigation.
Particularly, three new sections were created: “Discover”, “Explore” and “Plan” and represent the
main entry points for the navigation (see figure 2). As it emerged from an interview with the online
marketing manager of the Ticino DMO (see 7.1), these new sections were thought to present to
tourist contents from the “general” to the most “particular”. Specifically, the “Discover” section
presents general information about regions, seasons and experiences, the “Explore” section
contains more specific information about sports, excursions, gastronomy and events, while the
“Plan” section contains more practical information about accommodation, how to arrive and getting
around. An additional section is the “Travel Inspirations” section, which contains further travel
proposals. The contents of the website are organized following this theming, which is present as
well on the menu bar, where the three themes are always available for click.
Figure 2: Screenshot of the Ticino website homepage, with the sections “Discover, “Explore” and “Plan”. Source: ticino.ch, 2016
The new structure of the website was also developed taking into consideration the preferences of
five types of “personas”. “Personas” are representative types of web users that access the website,

26
with different needs and tourism preferences. The identified personas are the “day tourist”, the
“weekend tourist”, the “long-distance tourist”, the “tourist behind the wheel” (Ticino New
Experience, 2016). The website highlights features related to these four types of users.
Therefore, compared to the old website (in which contents were organized similarly to a database-
driven big “list”) the new website offers a more intuitive organization, helped by the above-
mentioned theming structure, as well as by images.
Figure 3: Screenshots of the Ticino website with examples of sections in which images play a dominant role. Source: ticino.ch, 2016
The visual impact of the website is therefore dominant, with images meant to play an important
role in guiding the user through the navigation (see figure 3). In most of the cases, a brief text is
included in each image, together with a clickable button that calls the user to take action. For
example, many images embed the buttons “explore” or “discover” (see figure 4).

27
3.3. Description of Phase A)
3.3.1 Description of Phase A1): Aspects of the free navigation that capture teenage users’ attention the most
This phase aims at answering to the research question 1) “What are the most viewed tourism-
related contents on the Ticino destination website by the teenager segment?
In this phase the main AOIs (Areas of Interest) chosen for the analysis and their respective AOI
Metrics will be described. Furthermore, this phase also includes the analysis of heat maps resulting
from the free navigation of users.
3.3.1.1 Creation of AOIs and analysis of AOI Metrics
In this phase, we will identify what are the most important areas of the menu bar guiding users’
navigation through the website. In order to verify what are the most relevant areas, AOIs (Areas of
interest) will be created around them, and their specific AOI Metrics calculated.
Figure 4: Screenshots of the Ticino website with examples of clickable buttons embedded into pictures. Source: ticino.ch, 2016
28
a) Definition of the chosen AOIs
Tobii Studio gives the possibility to create Areas of Interest, denominated “AOIs”. Areas of Interest
are artificial labels that can be created over specific parts of the page that need to be studied. AOI
can be either static or dynamic. Static AOIs maintain a fixed shape while dynamic ones change shape
during the navigation. Thanks to the AOIs, different metrics can be calculated.
For the present analysis, 10 areas of interest were created over 10 respective website areas reputed
as important for the user navigation. The reputed 10 areas of the websites were gathered from a
first screening of the heat map related to the home page, where the menu bar is clearly displayed
(see figure 33 in 7.3). From the analysis, it emerged that users tended to look at certain areas more
than others, and therefore this helped the process of creation of the AOIs.
The identified AOIs were then assigned to all the participants.
The AOIs of each participant have been then assigned to respective AOI Groups. AOI Groups, as their
name suggests, are groups that aggregate data from all the individual AOIs. This means that for
example, the AOI “Discover voice” of participant n°1 has been assigned to the AOI Group “Discover
voice” and this as well for participant n°2, 3, etc... To sum up, all the individual AOIs were assigned
to their respective AOI group. In total, 10 AOI groups were created.
The areas of interest (AOIs) assigned to respective AOI Groups are the following:
- Central text
The “Central text” AOI was created around the main text present at the center of the homepage
(figure 5). This area is one of the most evident parts of the homepage. This text is formed by a big
phrase (in terms of fonts) placed over a secondary smaller phrase.

29
Figure 5: Central text AOI. Source: own elaboration on ticino.ch
The main phrase type generally displayed on the home page varies according to a specific algorithm
based on the IP of the users (e.g. market bases), exposing users at two types of phrases. The first
typology is “Ticino in primavera” (English translation “Ticino in spring”), while the second is “Il tunnel
dei record” (English translation “The records tunnel” (referred to the new Gotthard Tunnel). The
secondary phrase varies according to algorithms too, and may refer to different topics.
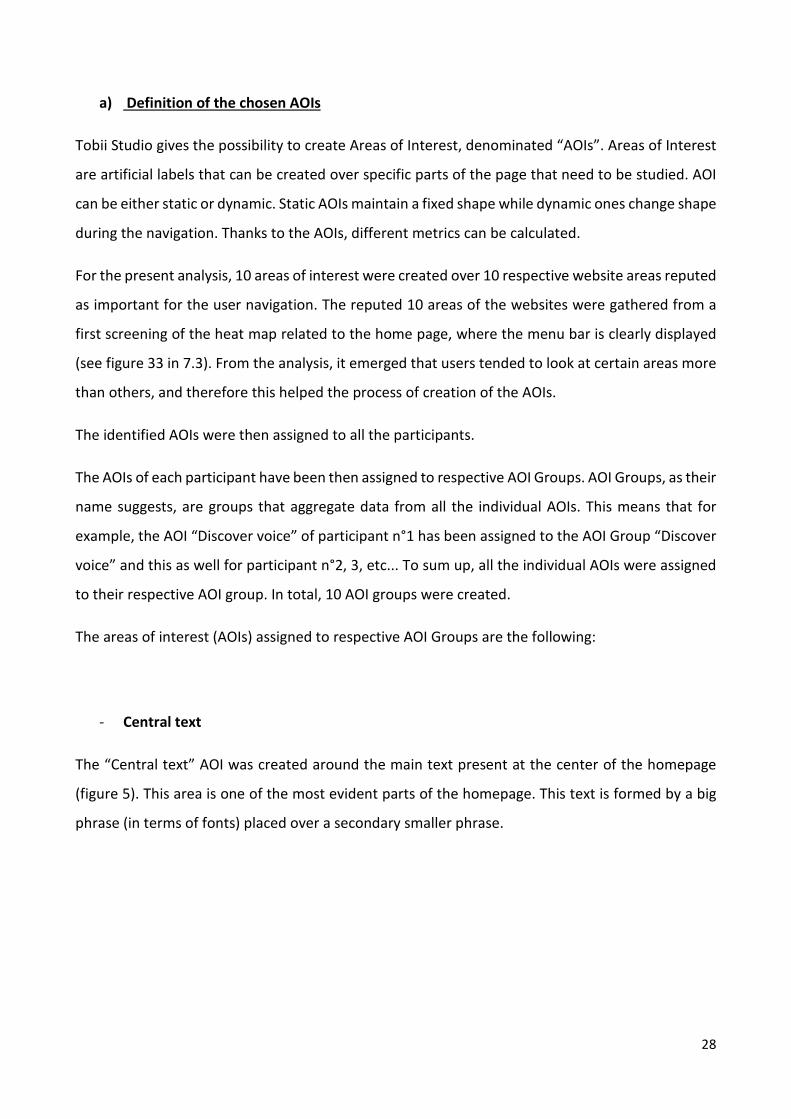
- Central button
The “Central button” AOI was created around the button present at center page, below the “Central
text” AOI (figure 6). This particular button is, together with central text, one of the most important
parts of the homepage. Its scope is to directly invite the user to click on it to discover more about
Ticino.
30
Figure 6: Central button AOI. Source: own elaboration on ticino.ch
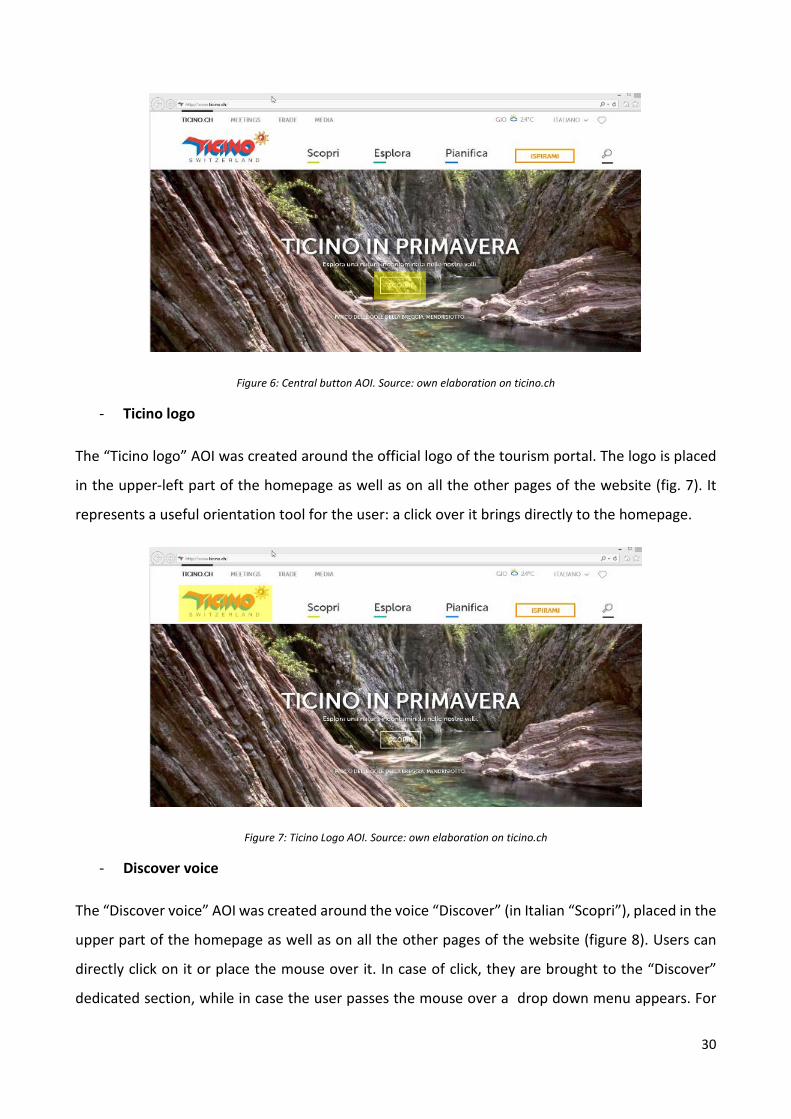
- Ticino logo
The “Ticino logo” AOI was created around the official logo of the tourism portal. The logo is placed
in the upper-left part of the homepage as well as on all the other pages of the website (fig. 7). It
represents a useful orientation tool for the user: a click over it brings directly to the homepage.
Figure 7: Ticino Logo AOI. Source: own elaboration on ticino.ch
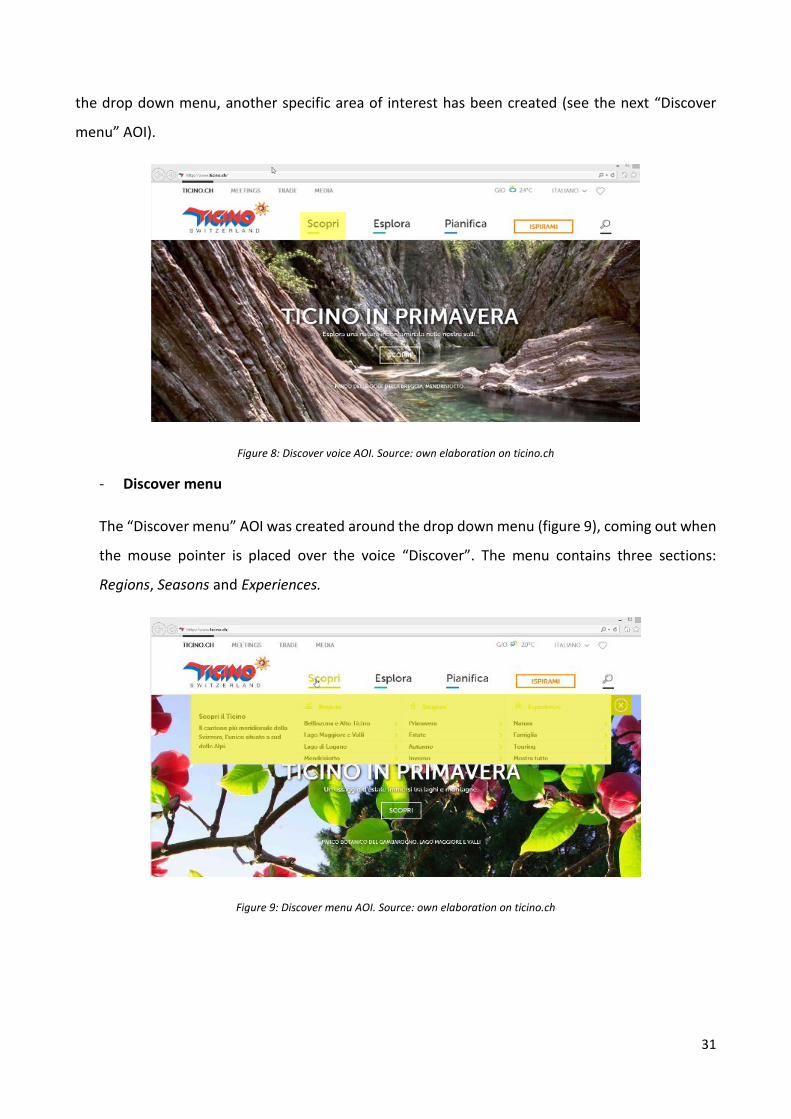
- Discover voice
The “Discover voice” AOI was created around the voice “Discover” (in Italian “Scopri”), placed in the
upper part of the homepage as well as on all the other pages of the website (figure 8). Users can
directly click on it or place the mouse over it. In case of click, they are brought to the “Discover”
dedicated section, while in case the user passes the mouse over a drop down menu appears. For
31
the drop down menu, another specific area of interest has been created (see the next “Discover
menu” AOI).
Figure 8: Discover voice AOI. Source: own elaboration on ticino.ch
- Discover menu
The “Discover menu” AOI was created around the drop down menu (figure 9), coming out when
the mouse pointer is placed over the voice “Discover”. The menu contains three sections:
Regions, Seasons and Experiences.
Figure 9: Discover menu AOI. Source: own elaboration on ticino.ch
32
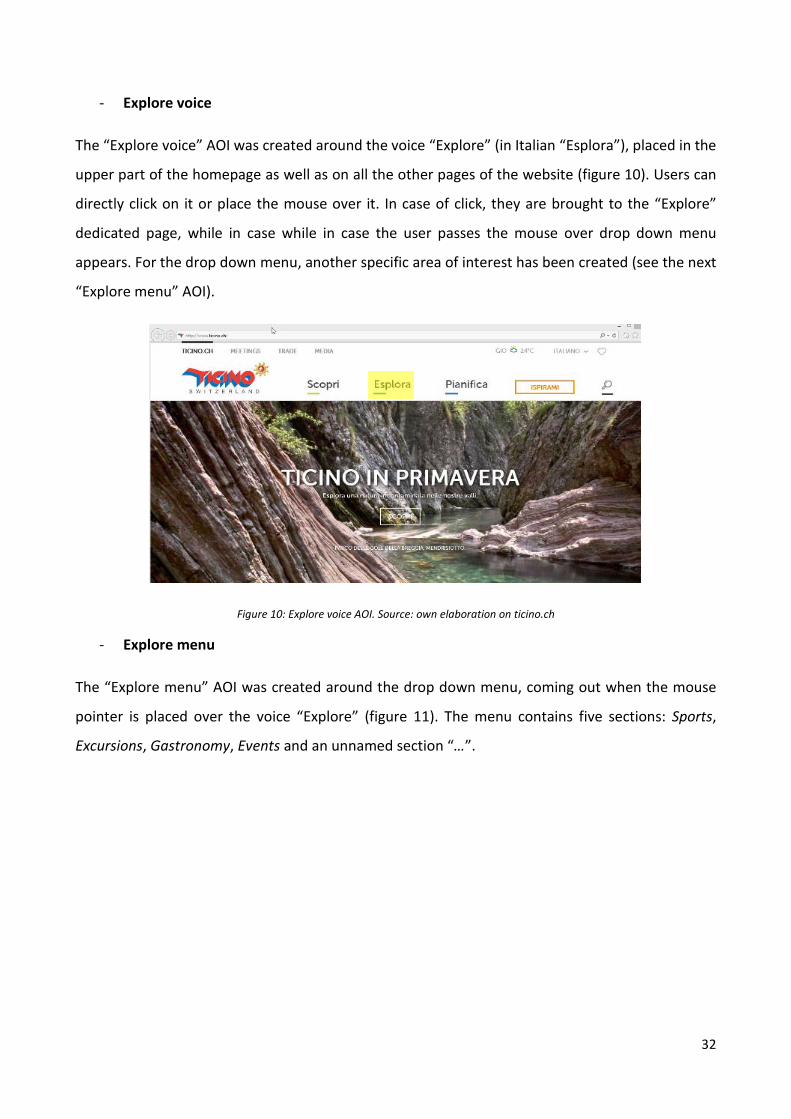
- Explore voice
The “Explore voice” AOI was created around the voice “Explore” (in Italian “Esplora”), placed in the
upper part of the homepage as well as on all the other pages of the website (figure 10). Users can
directly click on it or place the mouse over it. In case of click, they are brought to the “Explore”
dedicated page, while in case while in case the user passes the mouse over drop down menu
appears. For the drop down menu, another specific area of interest has been created (see the next
“Explore menu” AOI).
Figure 10: Explore voice AOI. Source: own elaboration on ticino.ch
- Explore menu
The “Explore menu” AOI was created around the drop down menu, coming out when the mouse
pointer is placed over the voice “Explore” (figure 11). The menu contains five sections: Sports,
Excursions, Gastronomy, Events and an unnamed section “…”.

33
Figure 11: Explore menu AOI. Source: own elaboration on ticino.ch
- Plan voice
The “Plan voice” AOI was created around the voice “Plan” (in Italian “Pianifica”), placed in the upper
part of the homepage as well as on all the other pages of the website (figure 12). Users can directly
click on it or place the mouse over it. In case of click, they are brought to the “Plan” dedicated page,
while in case the user passes the mouse over a drop down menu appears. For the drop down menu,
another specific area of interest has been created (see the next “Plan menu” AOI).
Figure 12: Plan voice AOI. Source: own elaboration on ticino.ch

34
- Plan menu
The “Plan menu” AOI was created around the drop down menu (figure 13), coming out when the
mouse pointer is placed over the voice “Plan”. The menu contains four sections: How to get there,
Getting around, Accommodation and an unnamed section “…”.
Figure 13: Plan menu AOI. Source: own elaboration on ticino.ch
- Inspire me button
The “Inspire me button” AOI was created around the voice “Inspire me” (in Italian “Ispirami”), placed
in the upper part of the homepage as well as on all the other pages of the website (figure 14). A click
over this voice brings users to the page “Travel-inspirations” where different
Figure 14: Inspire me AOI. Source: own elaboration on ticino.ch

35
b) AOI Metrics
The aforementioned AOIs have been defined in order to calculate four main AOI Metrics. Metrics
are statistics about eye movements that can be extrapolated from the chosen AOIs. For the present
study, the considered metrics per AOI are the following:
- Time to First Fixation
In the Tobii Studio User's Manual (2016), this metric is defined as “The time from the start of the
media display until the test participant fixates on the AOI or AOI group for the first time (seconds)”.
That is, with this metric, it is possible to see which of the AOI has been fixated first, which last and
in what order.
- Total Fixation Duration
This particular metric is defined as the “Duration of all fixations within an AOI, or within all AOI
belonging to an AOI group (seconds)” (Tobii Studio User's Manual, 2016). This metrics indicates the
total sum of the duration of all fixations within the AOIs, indicating for example, which AOI has been
fixated for the longest time and which for the shortest.
- Fixation Count
This metric measures the “Number of times the participant fixates on an AOI or an AOI Group
(count)” (Tobii Studio User's Manual, 2016). With this metric it is possible to see which AOIs received
the biggest number of fixations and which the least, ranking them accordingly.
- Mouse Click Count
This metric measures the “Number of times the participant left-clicks with the mouse on an AOI or
an AOI group (count)” (Tobii Studio User's Manual, 2016). Thanks to this metric, it is possible to see
which AOI received more clicks and which less, making possible to rank AOIs according to number
of clicks.

36
3.3.1.2 Heat maps analysis
In the present work, heat maps will be analyzed and studied to figure out what are the parts of the
webpages that grabbed users’ attention the most. Heat maps represent a powerful tools that allows
us to have an immediate perception of what are the most viewed parts of a visual stimulus (in this
case a webpage). Specifically, heat maps show, thanks to a scale of colors going from green (low
number of fixations) to red (high number of fixations), what are the most viewed parts of a webpage
(see figure 15).
Figure 15: Examples of heat maps from the website. Source: own elaboration on Tobii Studio 3.4.5
For the present work, the analysis has been carried out by studying heat maps generated by users
at full navigation time. In other words, the displayed heat maps show the aggregate visualizations
of all the participants until they have left the page, with no time restriction.
Heat maps were studied for two reasons:
a) To produce a ranking of the most visualized contents according to themes: what are the
themes (ex. “Events Concerts”, “Shopping”, etc.) receiving most visualizations?
b) To produce a ranking of the most visualized graphic elements: which graphic elements
receiving most visualizations (ex. “Pictures”, “Text”, etc.)?
Specifically, the heat map analysis was carried out in the following way:

37
1) Heat maps were ranked according to the number of participants visiting each page. For
example, the heat map related to the homepage has been ranked first, being visited by all
the 23 participants, while the heat map for the page “Explore” has been visited by 10
participants, and ranked second, and so on.
2) Heat maps for each page were analysed identifying areas where fixations were concentrated
the most, namely those areas where the colours resulted more intense towards yellow/red,
defined as “Heat-Areas”.
3) The specific content of each Heat-Area was then identified and assigned to a macro-theme
(ex: “Sport/Outdoor Activities”, “Events/Concerts”, “Shopping”, etc.). Macro-themes
emerged after a saturation process, listing all the single contents and then assigning them to
their respective macro-themes.
4) Then, Heat-Areas were also used to identify the typology of graphic elements, such as
pictures or text, in which the contents were embedded. As for macro themes, graphic
elements emerged after a saturation process. A final ranking of most viewed graphic
elements was produced.
5) A final ranking of most viewed contents according to themes and of most viewed graphic
element were produced.
The frequency of contents that received more attention was made taking into consideration the
number of participants who visualized each page. For example, for a page visualized by ten
participants, if the content “Lugano” has been significantly fixated (intense colour of the heat-area),
we considered it visualized by all ten participants, counting ten visualizations. Then, if in the same
page the content “Lugano” was present one more time in another type of content (e.g. a text on a
picture), the content “Lugano” gained ten more visualizations, bringing the total count to twenty,
meaning that the person was exposed twice to that specific content. Therefore, the ranking of all
the macro themes was made by summing all the visualizations per specific content. The same
reasoning was made for graphic elements. For example, in a page visualized by five participants, if
the graphic element “Picture” was significantly fixated, it is considered visualized by 5 participants,
counting five visualizations. Then, if within the page the same graphic elements was present twice,
the element “Picture” gained five more visualizations, bringing the total count to ten. As for the

38
macro themes, the ranking of the graphic elements was mad by summing all the visualizations per
specific graphic element.
It is important to notice that heat maps were valid for a limited amount of pages, and therefore only
certain pages were analyzable. In fact, some pages could not be taken into consideration for the
analysis due to technical problems of the eye-tracking platforms due mainly to the low page loading,
and the presence of animation of the contents that reshaped the design of a page which in turn
provide not accurate heat maps. These factors have made it impossible for those pages to study the
aggregate results coming from different participants.
3.3.1.3 Description of Phase A2): Aspects of the knowledge about Ticino and willingness to visit Ticino pre vs post website navigation
In this phase, results coming from the pre-post questionnaire will be showed. The pre-questionnaire
was administered before the website navigation, the post-questionnaire right after. The
confrontation will be done in order to verify if the free navigation has changed participants’
perception of the destination (Ticino), aiming to respond research question 3) “What is the Italian
teenagers’ perception of Ticino: is there any change in the perception before and after the website
navigation?”
The pre-questionnaire administrated before the users’ exposure to the free navigation was
constituted by five main questions with the goal to investigate the users’ knowledge about Ticino,
represented by the questions:
o Have you ever visited Ticino?
o Can you tell me three things that come to your mind when thinking about Ticino?
o On a five-point Likert scale, what is your level of knowledge of Ticino?
o Which of the following aspects characterize Canton Ticino the most?
And the willingness to visit Ticino, represented by the question:
o On a scale going from 1 (very little) to 5 (very much), how much are you willing to visit
(again or for the first time) Canton Ticino”
39
The post-questionnaire asked users to self-report the attractions which impressed them the most
from their free navigation, allowing to confront the eye-tracking and their declaration:
o Which attractions impressed you the most?
The same question on which aspects characterize Ticino the most has been re-asked in the post
questionnaire in order to confront which aspects tend to chance or fixed in the users’ perception
after the exposure to the website:
o Which of the following aspects characterize Canton Ticino the most?
The same question on willingness to visit Ticino has been also re-asked in the post questionnaire in order to confront the presence of any increase or decrease factor in relation to the exposure to the website:
o On a scale going from 1 (very little) to 5 (very much), how much are you willing to visit
(again or for the first time) Canton Ticino?
Moreover, a confrontation of the answers from people who visited Ticino and who have not were
also confronted.
3.4 Description of Phase B): Match between self-declared aspects of interest and the actual navigation.
3.4.1 Description of Phase B1): Most Viewed Themes vs Most Cited Attractions
In this phase, results coming from the questionnaire will be confronted with the actual navigation
of users. Specifically, the themes of the most cited tourist attractions (resulting from the question
“which attractions impressed you the most?”) will be confronted with the most visualized themes
during navigation, in order to verify any match/mismatch between what users see and what they
declare to prefer.

40
3.4.2 Description of Phase B2): A Comparison between Eye Tracking, Self-Declared Investigation and Web Analytics
In this phase, data from eye-tracking sessions, questionnaires and DMO web analytics (cordially
provided by Ticino Turismo) will be confronted. Specifically, the comparison will be carried out
confronting the following aspects:
1) Most Viewed contents according to Themes (during free navigation)
2) Most Cited Attractions according to Themes (in the questionnaire)
3) Most Viewed Webpages according to Themes (according to the official DMO data)
The comparison will be carried out on the “Theme” level: the final ranking will compare the rankings
of themes for all the three aspects.
The comparison will be carried out in order to test if a multi-source approach, with data coming
from eye tracking sessions, questionnaires and web analytics, might be useful to understand
teenagers’ online tourism preferences, in terms of most favorite themes.

41
4. Results
In this section, results coming from the free navigation, questionnaires, and DMO data are showed
and discussed. The structure in which results are showed reflects the description of the phases A)
and B) showed in chapters 3.3 and 3.4 respectively.
42
4.1 Results Phase A)
4.1.1. Results phase A1): Aspects of the free navigation that capture teenage users’ attention the most
In this phase, results from the free navigation on the DMO website are explained in terms of AOI
Metrics and Heat Maps.
4.1.1.1 AOI Metrics results
As it has been mentioned in chapter 3, AOIs (Areas of Interest) were created in order to calculate
AOI metrics. Metrics have been calculated for the AOI Groups across all the media, therefore the
results for each metric represent mean values.
Four different metrics are taken into consideration: Time to First Fixation, Total Fixation Duration,
Fixation Count, Mouse Click Count.
These metrics have been calculated for ten areas of interest: Ticino Logo, Explore Voice, Explore
Menu, Discover voice, Discover Menu, Plan voice, Plan Menu, Inspire Me Voice, Central Button,
Central Text. Figures 16, 17, 18 and 19 illustrate the considered AOIs.

43
Figure 16: Resume of the considered AOIs. Source: own elaboration on ticino.ch
Figure 17: Discover menu AOI. Source: own elaboration on ticino.ch
Figure 18: Explore menu AOI. Source: own elaboration on ticino.ch
Central Text
Central Button
Ticino Logo Discover Voice
Explore Voice
Plan Voice
Inspire me Voice
Explore Menu
Discover Menu

44
Figure 19: Plan menu AOI. Source: own elaboration on ticino.ch
1) Time to first fixation: time before the first fixation on an AOI.
Results from this metric indicate that lowest time to first fixation belongs to the “Central Text” AOI,
2.7 seconds. This indicate that this AOI is the one that in average has been fixated first during
navigation, or, in other words, the first AOI to receive participants’ attention. If AOIs are ranked
according to time before fixation (from lower to higher), the order is the following: Central Text (1),
Central Button (2), Discover Voice (3), Explore Voice (4), Ticino Logo (5), Plan Voice (6), Inspire Me
Voice (7), Discover Menu (8), Explore Menu (9), Plan Menu (10) (see figure 20).
Figure 20: Time to first fixation (seconds)
0
20
40
60
80
100
120
140
2.7 4.3 6.5 8.419.4
33.3 35.1 39.458.6
122.6
Plan Menu
45
If we quickly look at the structure of the page, we can interpret these results in the following way:
participants normally looked firstly at center page, where “Central Text” is, than looked below at
the “Central Button”. Then, either in the homepage or during navigation, they switched their
attention to the menu bar looking at the different voices, following the order “Discover Voice”
“Explore Voice” “Ticino Logo” “Plan Voice” “Inspire Me Voice”. After all the voices were
fixated, the attention switched to the drop-down menus, in the order “Discover Menu” “Explore
Menu””Plan Menu”.
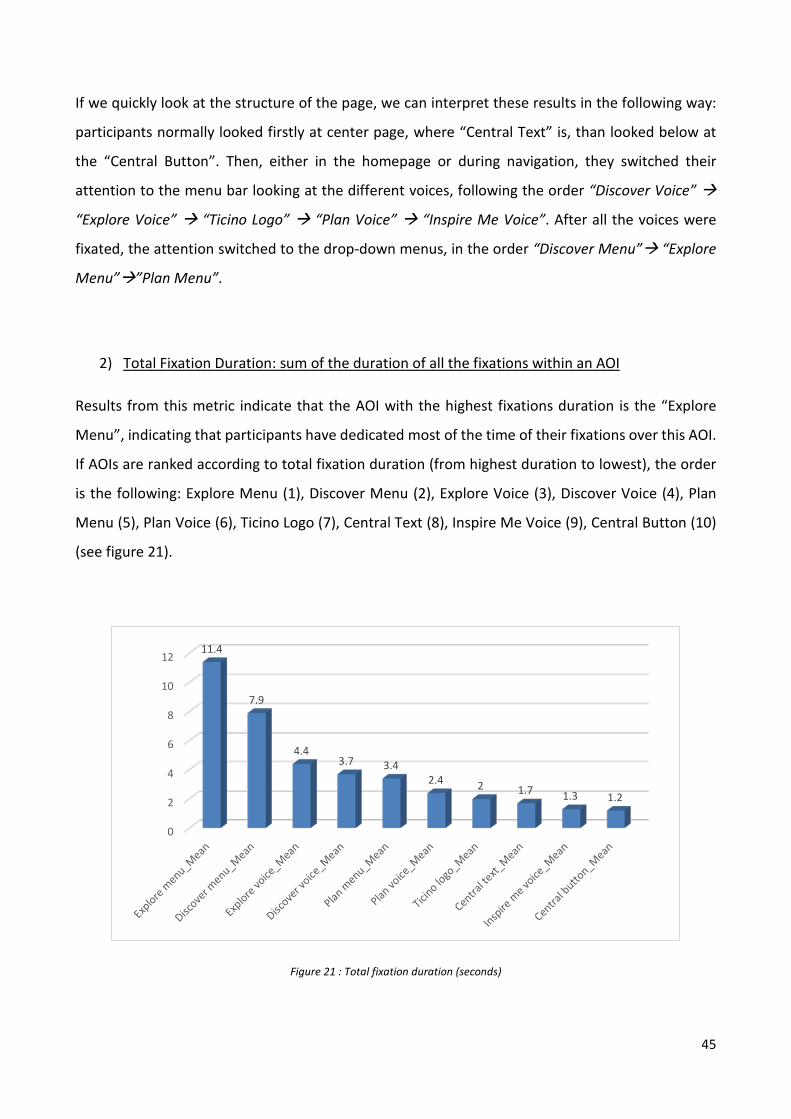
2) Total Fixation Duration: sum of the duration of all the fixations within an AOI
Results from this metric indicate that the AOI with the highest fixations duration is the “Explore
Menu”, indicating that participants have dedicated most of the time of their fixations over this AOI.
If AOIs are ranked according to total fixation duration (from highest duration to lowest), the order
is the following: Explore Menu (1), Discover Menu (2), Explore Voice (3), Discover Voice (4), Plan
Menu (5), Plan Voice (6), Ticino Logo (7), Central Text (8), Inspire Me Voice (9), Central Button (10)
(see figure 21).
Figure 21 : Total fixation duration (seconds)
0
2
4
6
8
10
1211.4
7.9
4.43.7 3.4
2.4 2 1.7 1.3 1.2

46
By looking at the page interface, it is possible to interpret results in the following way: participants
spent the biggest amount of time looking at the Explore Menu, which is the richest drop-down menu
in terms of number of listed sub-contents (23 clickable options), while the second AOI in the ranking
is the Discover Menu. While the Discover Menu encloses contents related to general information
about regions, seasons and experiences, the Explore Menu presents, on a more detailed level,
contents related to sports and excursions, gastronomy, events and other various activities. This
means that users spent more time looking for precise information about the attractions at the
destination (as the ones listed in the Explore Menu) rather than more general ones (present in the
Discover Menu). Then, in the ranking, we find the Explore Voice (3) followed by the Discover Voice
(4). These two voices represent the access to the respective drop-down-menus (Explore Menu and
Discover Menu) and their position in the ranking directly reflects the importance of the two drop
down menus. Their position is in fact specular with respect to their correspondent drop-down
menus (with the Explore Menu being the first among menus and the Explore Voice the first among
voices, as well as the Discover menu being second among menus and Discover voice the second
among voices). Then, we find the Plan Menu (5) and the Plan Voice (6), whose position, again,
appear to reflect the same correlation existing between the aforementioned menus/voices. The fact
that these two AOIs received total low fixation durations suggest that users were not focused in
planning a trip, but just into navigating the website to gain information about the destination. This
might be connected with the scenario provided which asked users to freely navigate the website,
and not strictly plan a trip to Ticino. Finally, Ticino Logo (7), Central text (8), Inspire Me Voice (9) and
Central Button (10) complete the ranking. These last AOI are static, with no drop-down menus that
may influence their fixations duration, and therefore probably because of these reason registered
lower total fixation durations.
Lastly, it is interesting to notice that the “Inspire Me” voice registered lower total fixation durations
than Central text, an AOI present only in the homepage, revealing the very low relevance of such a
voice in the user’s eyes.
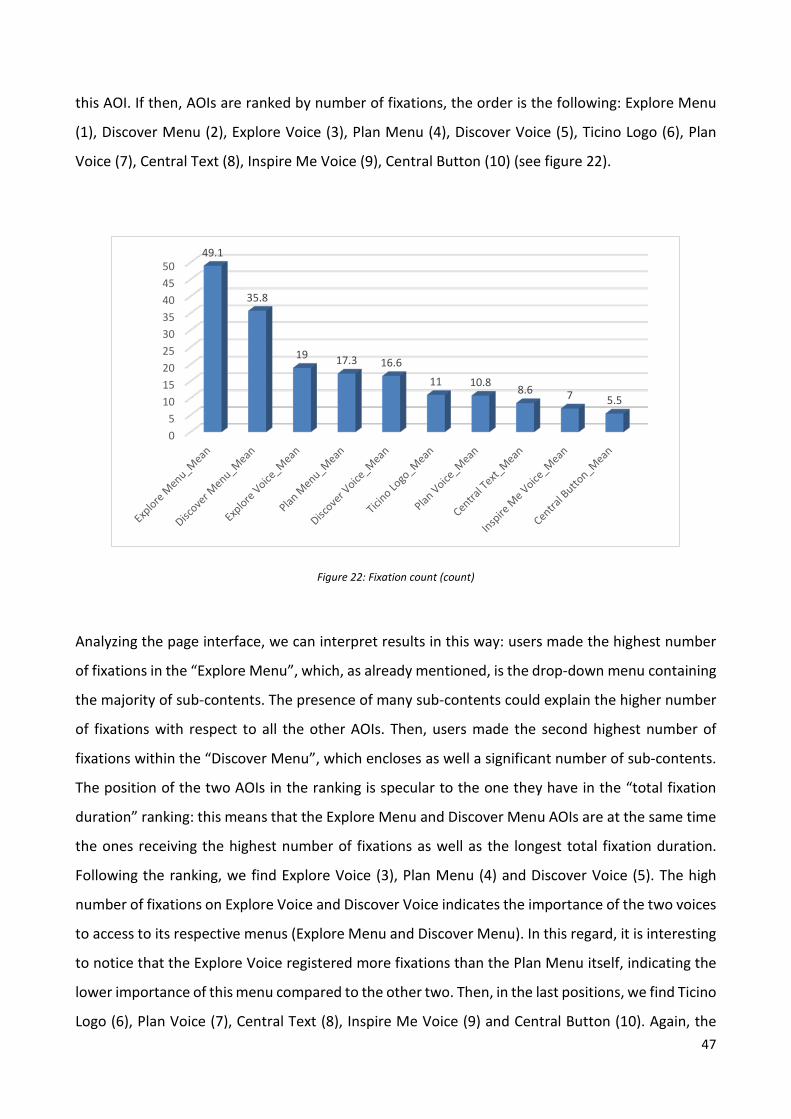
3) Fixation Count: how many times participants fixates an AOI
Results from this metric indicate that the AOI receiving most fixations is the “Explore Menu” (49.1
fixations in average), which means that participants made the highest number of fixations within
47
this AOI. If then, AOIs are ranked by number of fixations, the order is the following: Explore Menu
(1), Discover Menu (2), Explore Voice (3), Plan Menu (4), Discover Voice (5), Ticino Logo (6), Plan
Voice (7), Central Text (8), Inspire Me Voice (9), Central Button (10) (see figure 22).
Figure 22: Fixation count (count)
Analyzing the page interface, we can interpret results in this way: users made the highest number
of fixations in the “Explore Menu”, which, as already mentioned, is the drop-down menu containing
the majority of sub-contents. The presence of many sub-contents could explain the higher number
of fixations with respect to all the other AOIs. Then, users made the second highest number of
fixations within the “Discover Menu”, which encloses as well a significant number of sub-contents.
The position of the two AOIs in the ranking is specular to the one they have in the “total fixation
duration” ranking: this means that the Explore Menu and Discover Menu AOIs are at the same time
the ones receiving the highest number of fixations as well as the longest total fixation duration.
Following the ranking, we find Explore Voice (3), Plan Menu (4) and Discover Voice (5). The high
number of fixations on Explore Voice and Discover Voice indicates the importance of the two voices
to access to its respective menus (Explore Menu and Discover Menu). In this regard, it is interesting
to notice that the Explore Voice registered more fixations than the Plan Menu itself, indicating the
lower importance of this menu compared to the other two. Then, in the last positions, we find Ticino
Logo (6), Plan Voice (7), Central Text (8), Inspire Me Voice (9) and Central Button (10). Again, the
05
101520253035404550
49.1
35.8
19 17.3 16.6
11 10.8 8.6 7 5.5

48
Plan Voice registered lower number of fixations than its respective menu, while the rest of the AOIs
received less fixations because of their static nature.
4) Mouse Click Count: how many times participants clicked on an AOI
Results from this metric indicate that the AOI receiving most clicks is the “Explore Menu”. If we rank
AOIs according to number of clicks (from highest to lowest), the order is the following: Explore Menu
(1), Plan Menu (2), Explore Voice (3), Discover Menu (4), Plan Voice (5), Discover Voice (6), Ticino
Logo (7), Central Button (8), Inspire Me Voice (9), Central Text (10) (see figure 23).
Figure 23: Mouse click count (count)
Considering the page interface, we can interpret results in the following way: the “Explore Menu”
received the highest number of clicks (2.4), probably because it is the richest menu in terms of
clickable sub-contents. In second position, we find both the “Plan Menu”, the second richest menu
in terms of sub-contents, and the “Explore Voice” with an average of 2.2 clicks each. It is interesting
to notice that the Explore Voice has been clicked almost as much as the Explore Menu. Then, in
order, we find the Discover Menu (2.1 clicks), the Plan Voice (2 clicks) and the Discover Voice (1.6
clicks). The Discover Menu has been clicked more than his respective Discover Voice probably
0
0.5
1
1.5
2
2.52.4
2.2 2.2 2.1 2
1.6 1.5
1.1 1
0

49
because of its many sub-contents. Considering the last AOIs in the ranking, Ticino Logo (1.5 clicks),
Central Button (1.1 clicks), Inspire Me Voice (1 click) and Central Text (0 clicks), some further
considerations can be done. The Inspire Me voice, which is always present during navigation, has
been clicked (in average) less than the Central Button, which is present only in the homepage, and
this is a further indication of the low importance given by participants to this particular AOI. Finally,
the Central Text AOI received no clicks because it was no clickable.
5) Time to First Mouse Click: how much time does it take before participant clicks on an AOI
Results from this metric indicate that the AOI being clicked first is “Central Button” (32.8 seconds in
average). If AOIs are ranked according to the time to first mouse click, the order is the following:
Central Button (1), Discover Voice (2), Inspire Me Voice (3), Explore Voice (4), Explore Menu (5),
Discover Menu (6), Plan Menu (7), Plan Voice (8), Ticino Logo (9) (see table 5).
Figure 24: Time to first mouse click (seconds)
The “Central Text” AOI has not been considered because it was not clickable, and therefore it is not
present in the ranking. If we closely look at the page interface, it is possible to make the following
0
20
40
60
80
100
120
140
160
180
32.8
86.1 89.2 93.7102.5 107
139.8
162 168.8

50
considerations: the “Central Button” AOI has been clicked first probably because of its inviting
central position in the page. Then, we find “Discover Voice”, “Inspire Me Voice” and “Explore Voice”,
indicating that usually, voices has been clicked first than menus. In the ranking then, we find
“Explore Menu” and “Discover Menu” related to their respective voices, and then “Plan Menu”,
“Plan Voice” and “Ticino Logo”.
Discussion
In order to recap, here is a list with the first AOIs in the ranking for each metric:
- Lowest time to first fixation: “Central Text”
- Highest fixations duration: “Explore Menu”
- Highest fixations count: “Explore Menu”
- Highest number of clicks: “Explore Menu”
- Lowest time to first click: “Central Button”
These data suggest that for participants, the most important AOI is the “Explore Menu”, in terms of
number of fixations and clicks, as well as time spent on it (fixations duration). Reasons for this are
that it is the richest menu in terms of sub-contents (23 topics are listed), and (with respect to the
other menus) the one containing the one giving access to specific information about activities,
attractions and events.
Taking into consideration the time to first fixation metric, the lowest time belongs, not surprisingly,
to the central text in the middle of the homepage. This probably happened because of its very
evident position in the center of the page.

51
Figure 25: Schematic representation of the gaze plot path of participants at aggregate level considering the “time to first fixation” metric. Source: own elaboration on ticino.ch
Then, considering the order in which areas of the homepage/menu were seen, it is possible to draw
a scheme representing the eye behavior of the participant through the homepage and the menu
bar in the first seconds of navigation. The scheme (see figure 25) illustrates the gaze plot path of the
participants (at aggregate level), considering sequentially the following AOIs: “Discover
Voice”“Explore Voice”Ticino Logo”“Plan Voice”“Inspire Me Voice”.
Then, the central button, positioned directly below the central text, registered lowest time to first
click. This result can be explained because of its central position and call-to-action appeal: the
button, strategically positioned at center page, invites the user to click with the text “discover”.
Overall, a recurrent aspect among metrics is that, across the rankings, normally, “Voices” AOIs
follow “Menus” AOIs and the other way round: in other words, the position of voices within the
rankings is consequent to the importance of their respective menus and vice versa. For example, in
the “Total Fixation Duration” metric, the Explore Menu and the Discover Menu (1st and 2nd positions
in the ranking) are followed by the Explore Voice and Discover Voice (3rd and 4th positions). Or again,
in the “Fixation Count” metric, the Explore Menu and the Discover Menu (1st and 2nd positions) are
followed by the Explore Voice and the Discover Voice (3rd and 5th). This because the menus are richer
in terms of contents compared to voices, and therefore require both more time and higher number

52
of fixations in order to be explored. However, as anticipated before, it is also possible the other way
round, and so “Menus” can follow “Voices”. This is true, for example, for the “Time to First Fixation”
metric, where the “Discover Voice” and the “Explore Voice” (3rd and 4th positions), are followed by
the “Discover Menu” and Explore Menu (8th and 9th). This happens because voices normally require
less time to be visualized compared to drop-down menus.
Different position of AOIs in the rankings according to metrics may make us wonder about their
overall importance towards the users. In fact, according to the used metrics AOIs may seem relevant
or either irrelevant. For example, in “Time to First Mouse Click” metric, the “Explore Menu” AOI is
ranked 5th, but in the “Fixation Count” metric the same AOI is ranked 1st. So, how is it possible to
understand their relevance? The only way to determine their importance is to verify if their ranking
in a metric reflects the objectives the website developers set for that specific AOI: did the developers
want the user to click on a “Voice” just once and then navigate through “Menus”? Or did they want
the users to access menus only in case they are lost?
4.1.1.2 Heat maps results In the following section, the results of the aggregate heat maps for all the participants shown. Before
showing the results about the most viewed “Themes” and “Graphic elements”, a list of all the
considered heat maps is reported. The considered heat maps are ranked according to number of
participants viewing page. Table 1 lists all the visualized pages according to the above mentioned
ranking.
Table 1: List of all the considered heat maps
Ranking Page name Page url Participants
viewing
page
1st Homepage http://www.ticino.ch/ 23
2nd Discover Ticino http://www.ticino.ch/it/discover.html 10
10 Explore Ticino http://www.ticino.ch/it/explore.html
3rd Summer in Ticino http://www.ticino.ch/it/discover/seasons/summer.html 8
4th Lake Lugano http://www.ticino.ch/it/discover/destinations/lugano.html
7
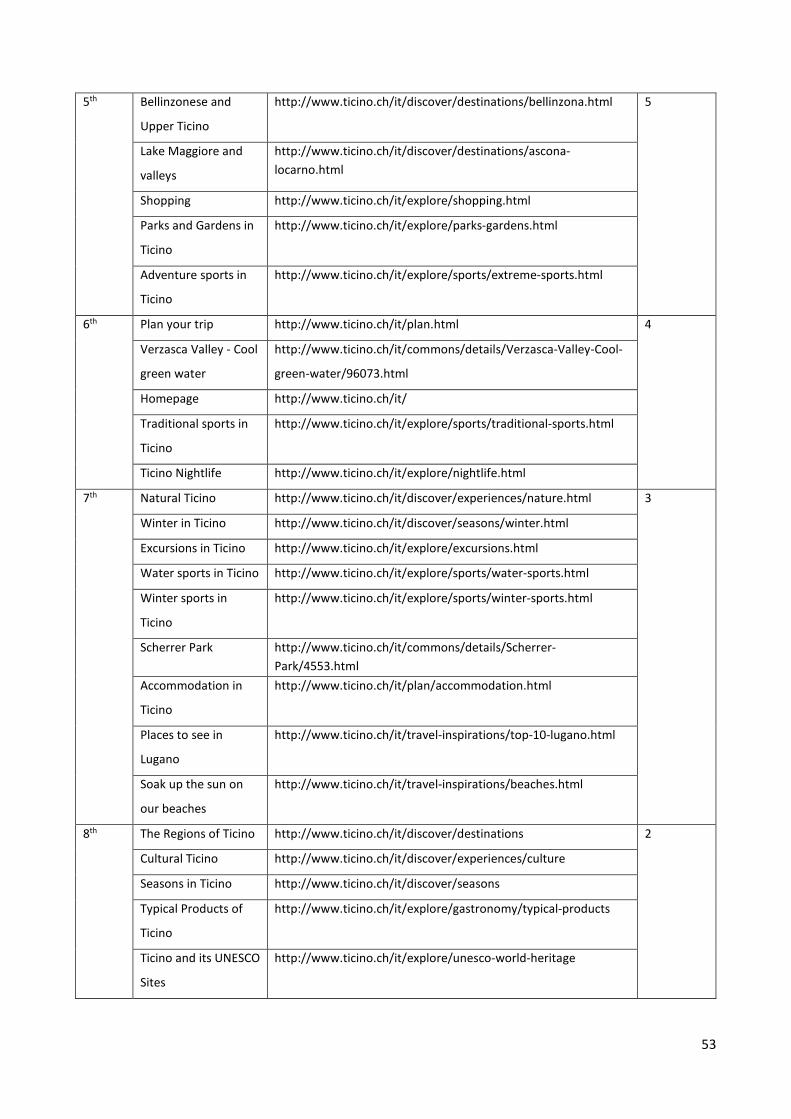
53
5th Bellinzonese and
Upper Ticino
http://www.ticino.ch/it/discover/destinations/bellinzona.html 5
Lake Maggiore and
valleys
http://www.ticino.ch/it/discover/destinations/ascona-locarno.html
Shopping http://www.ticino.ch/it/explore/shopping.html
Parks and Gardens in
Ticino
http://www.ticino.ch/it/explore/parks-gardens.html
Adventure sports in
Ticino
http://www.ticino.ch/it/explore/sports/extreme-sports.html
6th Plan your trip http://www.ticino.ch/it/plan.html 4
Verzasca Valley - Cool
green water
http://www.ticino.ch/it/commons/details/Verzasca-Valley-Cool-
green-water/96073.html
Homepage http://www.ticino.ch/it/
Traditional sports in
Ticino
http://www.ticino.ch/it/explore/sports/traditional-sports.html
Ticino Nightlife http://www.ticino.ch/it/explore/nightlife.html
7th Natural Ticino http://www.ticino.ch/it/discover/experiences/nature.html 3
Winter in Ticino http://www.ticino.ch/it/discover/seasons/winter.html
Excursions in Ticino http://www.ticino.ch/it/explore/excursions.html
Water sports in Ticino http://www.ticino.ch/it/explore/sports/water-sports.html
Winter sports in
Ticino
http://www.ticino.ch/it/explore/sports/winter-sports.html
Scherrer Park http://www.ticino.ch/it/commons/details/Scherrer-Park/4553.html
Accommodation in
Ticino
http://www.ticino.ch/it/plan/accommodation.html
Places to see in
Lugano
http://www.ticino.ch/it/travel-inspirations/top-10-lugano.html
Soak up the sun on
our beaches
http://www.ticino.ch/it/travel-inspirations/beaches.html
8th The Regions of Ticino http://www.ticino.ch/it/discover/destinations 2
Cultural Ticino http://www.ticino.ch/it/discover/experiences/culture
Seasons in Ticino http://www.ticino.ch/it/discover/seasons
Typical Products of
Ticino
http://www.ticino.ch/it/explore/gastronomy/typical-products
Ticino and its UNESCO
Sites
http://www.ticino.ch/it/explore/unesco-world-heritage

54
Splash & Spa Tamaro http://www.ticino.ch/it/commons/details/Acquaparco-Splash-e-
Spa-Tamaro
Moving By Train http://www.ticino.ch/it/plan/moving-around/railways
http://www.ticino.ch/it/plan/getting-there/by-train
9th Top 10 Bellinzona http://www.ticino.ch/it/travel-inspirations/top-10-
bellinzona.html
1
Daily meeting
package
www.ticino.ch/it/plan/accommodation/hotels/special-
offers/offers/details/
Via Nassa, the heart
of shopping
http://www.ticino.ch/it/commons/details/Via-Nassa-the-heart-
of-shopping/1151.html
"Goldeneye" Bungee
Jumping
http://www.ticino.ch/it/commons/details/-Goldeneye-Bungee-
Jumping/77102.html
FoxTown Factory
Stores
http://www.ticino.ch/it/commons/details/FoxTown-Factory-
Stores/87292.html
Canyoning http://www.ticino.ch/it/commons/details/Canyoning/73492.html
Cardada Cimetta http://www.ticino.ch/it/commons/details/Cardada-
Cimetta/131122.html
Conca Bella hotel http://www.ticino.ch/it/hotels/details/Conca-Bella/13765.html
Chestnut Festival http://www.ticino.ch/it/events/details/Festa-delle-
Castagne/114310.html
Market of Bellinzona http://www.ticino.ch/it/commons/details/Il-mercato-di-
Bellinzona/2895.html
Lac Lugano Arte e
Cultura
http://www.ticino.ch/it/commons/details/LAC-Lugano-Arte-e-
Cultura/104428.html
La Spada nella Rocca,
Bellinzona (Medieval
performance)
http://www.ticino.ch/it/commons/details/La-Spada-nella-Rocca-
Bellinzona-Rievocazione-medievale-/62696.html
Lido Ascona http://www.ticino.ch/it/commons/details/Lido-
Ascona/85776.html
Lido Locarno http://www.ticino.ch/it/commons/details/Lido-
Locarno/1494.html
Miami Lounge Lugano http://www.ticino.ch/it/commons/details/Miami-Lounge-
Lugano/137435.html
Monster Roller Bosco
Gurin
http://www.ticino.ch/it/commons/details/Monster-Roller-Bosco-
Gurin/12918.html
Monte Brè http://www.ticino.ch/it/commons/details/Monte-
Br%C3%A8/133918.html

55
Monte San Giorgio, a
sea of memories
http://www.ticino.ch/it/commons/details/Monte-San-Giorgio-
un-mare-di-ricordi/73495.html
Monte San Salvatore http://www.ticino.ch/it/commons/details/Monte-San-
Salvatore/133920.html
Parco Ciani, Lugano http://www.ticino.ch/it/commons/details/Parco-Ciani-
Lugano/85874.html
Parco delle Camelie,
Locarno
http://www.ticino.ch/it/commons/details/Parco-delle-Camelie-
Locarno/84276.html
Breggia Gorge Park http://www.ticino.ch/it/commons/details/Parco-delle-Gole-
della-Breggia/52602.html
San Grato Park -
Carona
http://www.ticino.ch/it/commons/details/Parco-San-Grato-
Carona/94113.html
Track for sledges in
Nara
http://www.ticino.ch/it/commons/details/Pista-per-slitte-dell-
Nara/88843.html
Park Adula Project http://www.ticino.ch/it/commons/details/Progetto-Parc-
Adula/121436.html
Ritom-Piora region http://www.ticino.ch/it/commons/details/Regione-Ritom-
Piora/133936.html
Navigation Company
of Lake Lugano
http://www.ticino.ch/it/commons/details/Societ%C3%A0-
Navigazione-del-Lago-di-Lugano/45595.html
Vanilla Club http://www.ticino.ch/it/commons/details/Vanilla-
Club/137000.html
Mendrisiotto Region http://www.ticino.ch/it/discover/destinations/mendrisio.html
Travel Experiences http://www.ticino.ch/it/discover/experiences.html
Ticino for Families http://www.ticino.ch/it/discover/experiences/family.html
Gran Tour in ticino http://www.ticino.ch/it/discover/experiences/touring.html
Autumn in Ticino http://www.ticino.ch/it/discover/seasons/autumn.html
Locarno-Centovalli-
Val Cannobina-
Brissago-Locarno
http://www.ticino.ch/it/tours/details/Locarno-Centovalli-Val-
Cannobina-Brissago-Locarno/105684.html
Restaurants in Ticino http://www.ticino.ch/it/explore/gastronomy/restaurants.html
Wines and Wine
Cellars in Ticino
http://www.ticino.ch/it/explore/gastronomy/wine-cellars.html
Markets and Crafts http://www.ticino.ch/it/explore/markets.html
Arriving by Car http://www.ticino.ch/it/plan/getting-here/by-car.html
Ristorante Tentazioni http://www.ticino.ch/it/restaurants/details/Ristorante-
Tentazioni/134951.html
Five Star Ticino http://www.ticino.ch/it/travel-inspirations/five-stars.html

56
Savour the Tastes of
Ticino
http://www.ticino.ch/it/travel-inspirations/food-experience.html
It’s More Fun
Together
http://www.ticino.ch/it/travel-inspirations/groups.html
Ticino Never Sleeps http://www.ticino.ch/it/travel-inspirations/nightlife.html
Discover the Parks
and Gardens of Ticino
http://www.ticino.ch/it/travel-inspirations/parks-gardens.html
Pure Adrenaline http://www.ticino.ch/it/travel-inspirations/pure-adventure.html
Romantic Gateway in
Ticino
http://www.ticino.ch/it/travel-inspirations/romantic-
holidays.html
Pamper Yourself http://www.ticino.ch/it/travel-inspirations/wellness.html
Explore the World of
Ticino Wines
http://www.ticino.ch/it/travel-inspirations/wine-tasting.html
Fun Admist Snow-
Capped Peaks and
Sun-Kissed Palm
Trees
http://www.ticino.ch/it/travel-inspirations/winter-walks.html
The areas where participants focused their attention, denominated as Heat-Areas, were visually
identified and categorized according to Theme Typology and Graphic Element Typology, as
described in chapter 3.3.1.3. In the following pages, the results coming from Heat-Areas are showed.
4.1.1.2.1 Theme Typology Results
Heat-Areas are here analyzed in terms of Theme Typology. After the saturation process, in which
contents of Heat-Areas were listed and assigned to themes, nineteen typologies of Themes
emerged:
1. Nature: any content related to nature
2. Lugano and Lake: any content related to Lugano region and its Lake
3. Sports/Outdoor Activities: any content related to sports and outdoor activities
4. Attractions: any content related to a specific site attraction
5. Shopping: any content related to shopping

57
6. Seasons: any contents referring to a specific season
7. Beaches/pools: any content related to beaches and pools
8. Culture/Museums: any content related to culture and museums
9. Nightlife: any content related to nightlife
10. Events/Concerts: any content related to events and concerts
11. Other: any other content
12. Gastronomy: any content related to gastronomy
13. Lake Maggiore: any content related to the Lake Maggiore
14. Locarno: any content related to Locarno destination
15. Ascona: any content related to Ascona destination
16. Transports: any content related to transports
17. Accommodation: any content related to accommodation
18. Mendrisiotto: any content related to the Mendrisiotto region
19. Bellinzona: any content related to Bellinzona region
The themes receiving more attention are, respectively: Nature (100 visualized contents),
Sports/Outdoor Activities (47 vis.), Lugano and the Lake (39 vis.), Shopping (29 vis.), Site Attractions
(28 vis.), Beaches/pools (27 vis.), Seasons (22 vis.), Nightlife (21 vis.), Culture/Museums (19 vis.),
Events/Concerts (18 vis.), Other (18 vis.), Gastronomy (15 vis.), Lake Maggiore (10 vis.), Locarno (10
vis.), Transports (9 vis.), Ascona (7 vis.), Accommodation (4 vis.), Mendrisiotto (3 vis.), Bellinzona (1
vis.). The ranking of most visualized contents by theme is shown in figure 26.

58
Figure 26: Most visualized contents by theme
Discussion
The abovementioned results allow us to answer the first research question, namely: “what are the
most visualized tourism-related contents on the Ticino destination website?”
Results suggest that contents related to the theme “Nature” are the most visualized across the
website. All the other themes are received significantly lower number of visualizations. This seems
to indicate a strong propensity of teenagers to be attract towards this specific theme. Anyway, a
quite relevant number of visualizations was registered by contents related to the theme
“Sports/Outdoor Activities”, “Lugano and the Lake”, in second and third position respectively. These
two themes, apart from “Nature”, are the only ones that stands out in the ranking of most visualized
themes.
0
10
20
30
40
50
60
70
80
90
100100
4739
29 28 2722 21 19 18 18 15
10 10 9 7 4 3 1

59
4.1.1.2.2 Graphic Element Typology
Heat-areas are here analyzed in terms of graphic element. After the saturation process, six
typologies of graphic elements emerged:
- Picture with text: a picture with embedded text
- Central text: the main text string normally present at the center of each page
- Text: a text string present within the page
- Picture: a picture within the page
- Google Maps tool: an interactive map within the page
- Google Street View tool: an interactive panoramic view tool within the page
Considering the ranking of the typology of elements visualized, the elements that were viewed more
are, in order: Picture with text (258), Text (86), Central text (66), Picture (54), Google maps tool (12),
Google street view tool (5). The ranking is graphically displayed in figure 27.
Figure 27: Ranking of most viewed graphic elements
0
50
100
150
200
250
300
Picture withtext
Text Central text Picture Google mapstool
Google streetview tool
258
8666
54
12 5
60
Discussion
These results suggest that pictures with text are the most attracting elements in the webpage, with
a significant lead over the others. In this case, participants were attracted by an element that can
be considered of strategic importance within the website: in fact, the majority of pages include it
and many times navigation is encouraged and helped by those images. Then, areas which contain
only textual information represent the second receiving more attention. This result can be explained
due to the fact that in the majority of pages the text areas generally are displayed to
complete/integrate the presence of images, and are mostly used to provide brief descriptions of the
attractions and activities displayed. Then, the third place in the ranking is occupied by the central
text, and this is probably due to its prominent position, normally at the top of the each page. Pictures
without text received as well a good level of attention, considering that they are less numerous than
pictures with text. The Google maps and the Google street view tools, even if present in one page
only, have been significantly visualized by participants. This indicate that they might be useful
instruments to be further implemented.
4.1.1.2.3 Most Viewed Contents by Themes vs Most Viewed Elements
As a last point, an interesting comparison between visualized contents and elements can be made.
As reported before, the most viewed contents are the ones related to the Theme “Nature”, and the
most viewed graphic elements are “Picture with text”. Therefore, it is possible to argue that the best
option to grab teenagers’ attention on the website is to display nature-related contents embedded
into pictures with text. This might be an indication for the implementation of a teenager section
within a destination’s website.
4.1.2 Results Phase A2): Aspects of knowledge about Ticino and willingness to visit Ticino pre vs post website navigation
In this phase, the results coming from the pre-post questionnaire are displayed. The first section will
be dedicated to pre-questionnaire results, the second to post-questionnaire results, and the third
to the confrontation between the two.
61
4.1.2.1 Pre-post questionnaire results
The Pre-post questionnaire was administered to 23 participants, 13 of which were female and 10
male. Participants’ age goes from 17 to 19, with an average age of 17.6 years.
4.1.2.1.1 Pre-questionnaire results
• Questions: Have you ever heard of Canton Ticino? Have you ever visited it?
Almost all the participants have heard about Canton Ticino (22 out of 23), which is not a surprising
result, giving that respondents live in a neighboring region of Canton Ticino, while only 15 out of 23
have visited it.
• Question: On a five-point Likert scale, what is your level of knowledge of Ticino?
On a 5 point Likert scale, 13 out of 23 have indicated a medium-low level of knowledge of the
destination (2), while 6 indicated 1, 3 indicated 3 and only one expressed 5 (= high level of
knowledge about Ticino). Therefore, the self-reported average expressed level knowledge of the
destination resulted in average 2, corresponding to a medium-low knowledge of Ticino. A possible
explanation of the relatively low level of knowledge might be the young age of respondents.
Teenagers in fact many times do not have full independence, both economically and in terms of
mobility, and may not have travelled much outside the borders.
• Can you tell me three things that come to your mind when thinking about Ticino?
As a first open question, participants were asked to indicate three things that come to mind when
thinking about Ticino. The most mentioned keywords are: “Switzerland” (11), “Lugano” (6), “Fox
Town” (4), “Lake” (3), “Chiasso” (2), “Duane” (2) and “Watches” (2). Other mentioned words are:
“Bellinzona”, “Mendrisio”, “Italy”, “Discotheque”, “Casino”, “Chocolate”, “Cheese”, “Traditional
clothes”, “Nature”, “Mountain”, “Sport”, “Swimming pool”, “Water pool”, “Cycling”, “German”,
“Italian”, “Banks”, “Paying Less”, “Ticino River”. Responses were grouped and classified according
to macro topics, showed in table 2.

62
Table 2: Keywords associated to Ticino resulted from the pre questionnaire
Topic Wider
Context
Destination
Ticino
Attractions Products Nature Sport Language Money Other
Words Switzerland
(11), Duane
(2), Italy (1)
Lugano (6),
Chiasso (2),
Bellinzona
(1),
Mendrisio
(1)
Fox Town
(4),
Discotheque
(1), Casino
(1)
Watches
(2),
Chocolate
(1),
Cheese
(1),
Traditional
clothes (1)
Lake (3),
Mountain
(1),
Nature
(1)
Sport (1),
Swimming
pool (1),
Water
polo (1)
German
(1), Italian
(1)
Banks
(1),
Paying
less (1)
Ticino
River
(1)
Total 14 10 6 5 5 3 2 2 1
As the table suggests, the majority of words (14) refer to the “wider context” of Switzerland,
associating Ticino to the country to which it belongs. Then, city names related to the “destination
Ticino” represent the second biggest group (10), followed by words related to specific “attractions”
(6), typical Swiss “products” (5), words connected to “nature” (5), “sport” (3), spoken “language” (2)
and “money” (2). By quickly looking at the table, it is quite evident that the majority of words
associated to Ticino are quite generic and stereotypical, associating the destination to generic
names of places and products, with very scarce reference to the actual names of attractions.
• On a five-point Likert scale, how much did you like it?
Taking into consideration participants who visited Ticino, respondents indicated in average 3.07,
indicating an almost positive satisfaction about their experience.
• If you have visited it, how many times?
Concerning aspects about visits in Canton Ticino, the majority of respondents (9 out of 15) visited it
overall more than five times, 3 participants three times and other 3 participants two times.
• If you have visited it, how many times in the last year?
In average, during the last year participants have visited Ticino 2.4 times.
• If you have visited it, were you alone or with others?

63
All of the participants declared to have been accompanied by others during their visits, in most of
the cases by parents (10 out of 15), followed by family and friends (4 out of 15) and friends (1 out
of 15).
• If you have visited it, have you ever stayed overnight?
Regarding overnight stays, only 1 out of 15 respondents declared to have spent at least a night at
the destination, suggesting how the segment considered is mainly interested in short daily
excursions.
• What are the reasons you visited Canton Ticino?
About the reasons mentioned for the visits, more than a half of respondents indicated “shopping”
(8 out of 15), followed by “nature” (4 out of 15), while the other responses are quite heterogeneous.
If we compare this answer with the overnight stays, we can see how Ticino is not seen has a
destination in which to spend holidays, but it is rather a one-day trip/excursion destination, with
shopping as one of the main purpose of the visit.
• On a scale going from 1 (very little) to 5 (very much), how much are you willing to visit (again
or for the first time) Canton Ticino?
For what regards the willingness to visit Ticino, almost half of the participants (11 out of 23)
indicated 3 with a total mean willingness score across participants of 2.91. If we compare the mean
willingness to visit of participants who have visited to the one of those who have not, only a slight
difference can be found: participants who visited indicated in average 2.93, while the ones who did
not indicated in average 2.87. Overall, this result suggests how for the considered segment the
destination under study appeared to be not very attractive.
• Which of the following aspects characterize Canton Ticino the most?
Participants were then asked to indicate what aspects characterize Canton Ticino the most, having
the possibility to select among nine options (see figure 28). Each participant could freely select one
or more options. Results show that according to respondents the most characteristic aspect is
“Nature” (21 selections), followed by “Cities/Villages” (12), “Sport” (7), “Amusements” (4), “Culture
and traditions” (3), “Hospitality of local people” (2), “Don’t know” and “Other” (1) and no mentions
for Gastronomy. Almost no difference in terms of answers exists between participants who visited

64
the destination and participants who did not. Anyways, results show a mismatch between what
respondents who visited the destination described as reasons for their past visits and what they
actually perceive of the destination. In fact, despite the main reason to visit was mentioned as
“shopping”, they still believe Ticino has a lot to offer from a naturalistic point of view.
Figure 28: Aspects that characterize Canton Ticino the most (pre-questionnaire)
4.1.2.1.2 Post-questionnaire results
• Which of the following aspects characterize Canton Ticino the most?
In the follow-up questionnaire administrated after the free navigation, participants were asked
again to indicate what aspects characterize Canton Ticino the most, having the possibility to select
among the same nine options showed in the pre-questionnaire. According to respondents the most
characteristic aspects are “Nature” (22 selections), “Sport” (14), “Amusements” (13),
“Cities/Villages” (11), “Culture and Traditions” (6), “Gastronomy” (4), “Hospitality of local people”
(3) and “Don’t know” and “Other” (0). Figure 29 illustrates graphically the abovementioned results.
21
12
7
43
21 1
00
5
10
15
20
25

65
Figure 29: Aspects that characterize Canton Ticino the most (post-questionnaire)
• On a scale going from 1 (very little) to 5 (very much), how much are you willing to visit (again or for the first time) Canton Ticino?
Then, for what regards the post willingness to visit Ticino, results show that, more than a half of the
participant indicated 4, with a total mean willingness to visit across all the participant of 3.95.
• Which attractions impressed you the most?
In this open question, people were asked to indicate the attractions that impressed them the most
during navigation. Names of attractions were then classified according to themes. A total of fifty-
three names of attractions were cited (see figure 30). The most cited names of attractions are
“Lugano”, “Lake Lugano” and “Lake Maggiore” (4), “Bellinzona” (3), “Bunjee Jumping”, “Lidos”,
“Splash and Spa”, “Foxtown”, “Verzasca Valley”, “Castles of Bellinzona” and “Music festival” (2). All
the other attractions were cited only once.
However, the classification of the attractions according to themes allowed to obtain a map of the
most significant ones. Particularly, the identified themes are 14, listed in figure 30. The two most
important themes resulted are “Sport/Outdoor Activities” and “Lugano and the lake” (8 attractions
each), followed by “Events/Concerts” and “Beaches and Pools” (6 attractions each). These four
themes enclose more than a half of the cited attractions (28 over 53). Other relevant themes are
22
1413
11
64
3
0 00
5
10
15
20
25

66
“Nature”, “Shopping” and “Lake Maggiore” (4 attractions each). Figure 30 illustrates the most cited
attractions according to themes.
Figure 30: Themes of most cited attractions
These results suggest that teenagers were impressed the most by attractions associated to an active
and participative lifestyle (related to sports, events and water activities), but on another side they
don’t either hide their appeal for more classic attractions like cities, lakes or shopping spots.
4.1.2.1.3 Pre-questionnaire vs Post-questionnaire results
By comparing the pre-questionnaire results and the post-questionnaire ones, some interesting facts
can be reported.
• Which of the following aspects characterize Canton Ticino the most? Pre VS Post
After the navigation, participants seem to be more aware of aspects regarding Ticino, and this is
evident in the increasing number of selected aspects in the post-questionnaire (73 vs the previous
51). In general, the aspects that gained more selections are “Amusements” (+9), Sports (+7)
Gastronomy (+4) and “Culture and Traditions” (+3). Table 3 and figure 31 illustrate schematically
the abovementioned results.
0
1
2
3
4
5
6
7
8

67
Table 3: Aspects characterize Canton Ticino the most Pre VS Post
Which of the following aspects characterize Canton Ticino the most?
Nature Sport Cities/Villages Gastronomy Culture
and
Traditions
Amusements Hospitality
of local
people
Other Don't
know
Pre 21 7 12 0 3 4 2 1 1
Post 22 14 11 4 6 13 3 0 0
Position
gained
+1 +7 -1 +4 +3 +9 +1 No No
Figure 31: Aspects characterize Canton Ticino the most Pre VS Post
In the post questionnaire “Nature” remains the most selected one (22 selections), while, “Sport”
gains the second position (14), followed by “Amusements” (13). “Cities/Villages” dropped from
second to fourth place (11 selections). Table 4 illustrates the rankings of most selected aspects (pre
vs post).
21
7
12
03 4
2 1 1
22
1411
46
13
30 0
0
5
10
15
20
25
Pre Post

68
Table 4: Ranking of the most selected aspects (pre VS post)
Ranking of the most selected aspects Pre VS Post
Pre Nature Cities/Villages Sport Amusements Culture
and
Traditions
Hospitality
of local
people
Don’t
know &
Other
Gastronomy
Post Nature Sport Amusements Cities/Villages Culture
and
Traditions
Gastronomy Hospitality
of local
people
Don’t know
& Other
Ranking 1st 2nd 3rd 4th 5th 6th 7th 8th
• On a scale going from 1 (very little) to 5 (very much), how much are you willing to visit (again or for the first time) Canton Ticino?
The comparison of the mean values of willingness to visit coming from pre and post questionnaires,
show that after the navigation, willingness to visit increased by 1.4 points (from 2.91 to 3.95).
Then, comparing the mean willingness to visit of participants who have visited the destination and
the one of those who have not, a little difference can be found: participants who visited indicated
in average 4.06 (vs 2.93 in the pre questionnaire), while the ones who did not indicated in average
of 3.75 (vs 2.87 in the pre questionnaire).
To summary, these results suggest that:
1) After the website navigation, willingness to visit across all the participants significantly
increased (from 2.91 to 3.95), indicating a positive impact of the website on participants’
attitude towards the destination.
2) The mean willingness to visit of participants who visited already the destination increased
more (increase of 1.13 points, from 2.93 to 4.06) than the one of participants who did not
visited it (increase of 0.88 points, from 2.87 to 3.75). This may indicate that, after the
navigation, participant who visited already the destination were more stimulated in their
curiosity towards the destination, which in turn, influenced their willingness to visit.

69
Discussion
The abovementioned results allowed us to answer the third research question: “what is the Italian
teenagers’ perception of Ticino? Is there any change in the perception before and after the website
navigation?”
From the pre questionnaire results, we discover that almost all the respondents have heard about
Ticino, and that the large majority of them has visited it. Even though, teenagers possess a medium-
low level of knowledge of the destination, and when thinking about Ticino, they associate it with
generic names of destinations and stereotypical aspects. In general, teenagers showed a quite high
willingness to visit the destination, with slight differences among who visited it and who don’t.
Among the ones who visited it, their level of satisfaction about the visit was quite high. For the ones
who visited Ticino, the main reason was referred to be shopping. Despite that, they still believe that
Ticino is strongly characterized by the presence of nature. For what regards travelling habits then,
they always travelled with others, particularly with parents, and rarely stop for an overnight stay,
making Ticino a one-day trip destination.
After navigation, in the post-questionnaire results, the perception of teenagers appeared to change
for the following aspects: despite confirming nature as one of the main aspects that characterize
Ticino, they showed to be more aware about amusements possibilities, sports, culture and
traditions and gastronomy. When asked to mention their favorite attractions, teenagers mostly
indicate the ones related to an active and participative lifestyle, mostly connected with sports,
events and water activities, and this without forgetting cities and shopping. In general, after
navigation the declared willingness to visit the destination increased consistently, particularly for
the ones who have already visited it.

70
4.2 Results of phase B): Match between self-declared attractions and the actual free navigation.
4.2.1 Results of Phase B1): Most Viewed Themes vs Most Cited Attractions
By confronting the most cited attractions according to themes with the most viewed contents
according to themes, it is possible to understand if there is any mismatch between what users see
and what they declare to prefer.
Table 5: Most Cited Attractions vs Most Viewed Contents
Most cited attractions (Self-reported Attractions)
Most viewed contents (Eye-Tracking data)
Sports/Outdoor Activities 1st Lugano and Lake 1st
Nature 1st
Sports/Outdoor Activities 2nd Events/Concerts 2nd Beaches/pools 2nd
Lugano and Lake 3d
Shopping 4th
Nature 3rd Shopping 3rd Lake Maggiore 3rd
Site Attractions 5th
Beaches/pools 6th
Seasons 7th
Nightlife 4th Site Attractions 4th
Nightlife 8th
Culture/Museums 9th
Locarno 5th Events/Concerts 10th
As mentioned in chapter 4.1.1.2.1, from the eye-tracking analysis emerged that participants viewed
mainly contents related to the theme “Nature” during their navigation (100 visualizations), while
(see table 5), after navigation participants cited mostly attractions related to the theme
“Sports/Outdoor Activities”, and “Lugano and the Lake” (8 cited attractions each, occupying the first
place in the ranking of the most cited attractions).
The second most cited attraction was related to “Events/Concerts” and “Beaches and Pools” (6
attractions each). During navigation instead, contents related to this two themes were not ranked
in a very high position in terms of visualized contents (respectively 27 and 18 contents, occupying
6th and 10th place in the ranking of most visualized contents).

71
At the third place in the ranking of the most cited attractions there are the ones related to the
themes “Nature”, “Shopping” and “Lake Maggiore” (4 attractions each). As mentioned before,
during navigation contents related to “Nature” were the most visualized (100 visualizations) while
“Shopping” occupies a quite high position (29 visualizations, occupying 4th place), and “Lake
Maggiore” a quite low one (only 10 contents visualized, occupying 13th place).
In the fourth position among the most cited attractions there are the ones related to the themes
“Nightlife” and “Site Attractions”. During navigation, contents related to “Nightlife” were visualized
21 times (occupying 8th position) while contents related to “Site Attractions” were visualized 28
times (occupying 5th position). All the other cited attractions were cited only once, all occupying the
fifth position. Figure 32 shows graphically the abovementioned results.
Figure 32: Most Cited Attractions vs Most Viewed Contents
Discussion
The abovementioned results allowed us to answer the second research question, namely: “Is there
any match between what participants look at and what they report to prefer in terms of tourism-
related contents?
4 8 8 4 3 6 3 16
1 4 1 1 3
100
4739
29 28 2722 21 19 18 18 15
10 10 9 7 4 3 10
20
40
60
80
100
120
Most cited attractions Most viewed attractions
72
Results suggest that what participants looked at during navigation does not reflect exactly what they
cited as preferred attractions. For example, even if participants viewed mainly contents related to
nature, they cited more attractions related to sport/outdoor and to the destination Lugano.
However, even if not in the first position, among the most viewed themes we find as well
sport/outdoor (2nd place) and Lugano and the Lake (3rd place), meaning that in both rankings these
themes are significant.
Attractions related to events and concerts are also cited often, but find little correspondence with
the number of visualizations (only 18), meaning that, despite the little number of visualized
contents, teenagers were impressed by this type of attractions. This is the same case for the beaches
and pools, which in the ranking of the most cited attractions are second, but recorded a relatively
low number of visualizations during navigation.
Therefore, it is possible to argue that, as confirmed also by previous studies, the eye-tracking
technique represents a valid aid in identifying the most relevant contents within a page, but this
does not automatically mean that what users look more is what they like the most.
4.2.2 Results of Phase B2): A comparison among Eye-Tracking data, Self-Declared Investigation and Web Analytics
The pesent section reports the results from a comparison between eye-tracking data (coming from
free navigation), self-declared investigation (post-questionnaire results) and web analytics (Google
analytics data provided by the DMO).
Table 6 reports the themes emerged from the top 10 web pages of the official DMO website
(www.ticino.ch), filtered for the 18-24 segment and for specific province, and the top themes
emerged from the eye-tracking and self-declared investigation.
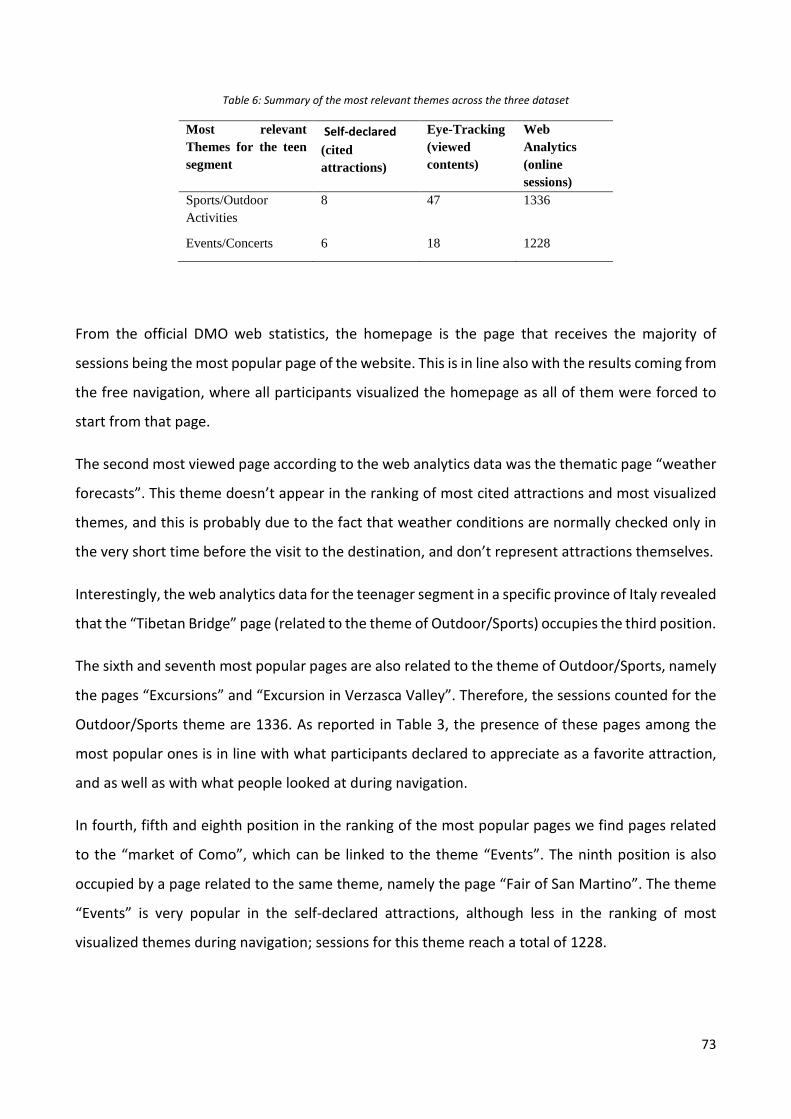
73
Table 6: Summary of the most relevant themes across the three dataset
Most relevant Themes for the teen segment
Self-declared (cited attractions)
Eye-Tracking (viewed contents)
Web Analytics (online sessions)
Sports/Outdoor Activities
8
47 1336
Events/Concerts 6 18 1228
From the official DMO web statistics, the homepage is the page that receives the majority of
sessions being the most popular page of the website. This is in line also with the results coming from
the free navigation, where all participants visualized the homepage as all of them were forced to
start from that page.
The second most viewed page according to the web analytics data was the thematic page “weather
forecasts”. This theme doesn’t appear in the ranking of most cited attractions and most visualized
themes, and this is probably due to the fact that weather conditions are normally checked only in
the very short time before the visit to the destination, and don’t represent attractions themselves.
Interestingly, the web analytics data for the teenager segment in a specific province of Italy revealed
that the “Tibetan Bridge” page (related to the theme of Outdoor/Sports) occupies the third position.
The sixth and seventh most popular pages are also related to the theme of Outdoor/Sports, namely
the pages “Excursions” and “Excursion in Verzasca Valley”. Therefore, the sessions counted for the
Outdoor/Sports theme are 1336. As reported in Table 3, the presence of these pages among the
most popular ones is in line with what participants declared to appreciate as a favorite attraction,
and as well as with what people looked at during navigation.
In fourth, fifth and eighth position in the ranking of the most popular pages we find pages related
to the “market of Como”, which can be linked to the theme “Events”. The ninth position is also
occupied by a page related to the same theme, namely the page “Fair of San Martino”. The theme
“Events” is very popular in the self-declared attractions, although less in the ranking of most
visualized themes during navigation; sessions for this theme reach a total of 1228.
74
Discussion
The abovementioned results allowed us to answer to the fourth research question, namely: “Is it
possible to compare results from different sources (eye-tracking data, questionnaires, and web
analytics) to obtain a more precise overview of teenagers’ preferences?”
If results coming from eye-tracking data, questionnaires and web analytics are compared, it is
possible to identify two main types of preferred attractions themes: Sports/Outdoor Activities and
Events/Concerts. These themes revealed to be the only ones appearing in the results of all the three
approaches, while other themes were less or more relevant according to each research approach
adopted.
Relating these results with the specific segment under study, it is possible to state that (Italian cross-
border) teenagers visiting the destination website are attracted the most by sports/outdoor
activities and events, which, as mentioned before are the common top themes emerging from the
three different sources.
These results shows the importance of adopting a multi-source approach: if only one approach is
used, possible biases may occur in identifying teenagers’ online preferences.

75
5. Conclusions, implications for the DMO and limitations
In this section, conclusions are presented, together with the possible implications for the business
(DMO). Additionally, limitations for the study and the related further research are discussed.
5.1 Conclusions
The present work had the aim of investigating teenagers’ online behavior on a tourism destination
portal. The analysis was carried out adopting jointly two techniques: self-reported perceptions
(administration of questionnaires) and eye-tracking sessions. The eye-tracking approach was
adopted in order to produce heat maps and areas of interest indicating the elements of the pages
which attracted users’ attention the most, over which data were calculated and interpreted. The
questionnaire was administered to investigate participants’ perception of the destination, as well
as comparing their perception before and after the website navigation.
Results from the heat maps analysis allowed us to answer the first research question: “what are the
most visualized tourism-related contents on the Ticino destination website?” Results indicated that
participants mostly looked at contents related to nature, followed by sports/outdoor activities and
Lugano and its lake. At the same time, the most viewed graphic elements were pictures with text,
suggesting that the best solution for grabbing teenagers’ attention might be to display nature-
related, sport/outdoor-related and Lugano-related themes into pictures with text.
For what regards website navigation, AOIs metrics showed the use of the menu bar, and indicated
that when using the menu bar, teenagers mostly navigate through the menu “Explore” the richest
area in terms of clickable contents.
The questionnaire then helped us to answer research question number three: “What is the Italian
teenagers’ perception of Ticino? Is there any change in the perception before and after the website
navigation?”
Pre-questionnaire results indicate that teenagers possess a general knowledge of Ticino, and they
tend to associate it with generic stereotypical aspects. Despite that, their willingness to visit again
the destination was proved to be quite high. Visits were made mostly for shopping, and satisfaction

76
about the visit was quite high. Teenagers also believe that nature is one of the aspects that
characterize the most the destination, and view Ticino as a one-day-trip destination.
The destination website played a significant role in influencing teenagers’ perception of the
destination. In fact, after the website navigation, teenagers were generally more knowledgeable
about aspects that characterize the destination. Particularly, they seemed to be more aware of
amusements opportunities, sports, culture, traditions, and gastronomy. Attractions that teenagers
declared to prefer are the ones that imply an active and participative lifestyle (such as sports and
events) as well as more classic ones related to cities and shopping. The website highly influenced
participants’ willingness to visit, raising it particularly for those who have already visited the
destination.
In the confrontation phase, we answered the second research question: “Is there any match
between what participants look at and what they report to prefer in terms of tourism-related
contents?” In this phase, users’ navigation on the website was confronted with their favorite self-
declared attractions. Results show a certain degree of discrepancy between what users see during
navigation and what they declare to prefer in terms of themes. Specifically, even if during navigation
participants visualized mainly contents related to nature, after navigation they cited mostly
attractions related to sport/outdoor activities and to the destination Lugano. This means that what
users visualize the most does not always indicate their preferences.
Finally, a confrontation between eye-tracking data, questionnaires, and web analytics was carried
out in order to answer the fourth research question: “Is it possible to compare results from different
sources (eye-tracking data, questionnaires, and web analytics) to obtain a more precise overview of
teenagers’ preferences?” By comparing results from the three sources, two themes appeared as the
most relevant ones for all the three sources: sports/outdoor activities and events/concerts. These
themes are therefore the most relevant for the considered segment (teenagers form Como area)
while navigating online. This suggests that a multi-source approach might be important to identify
teenagers’ online preferences, being as well a useful tool to avoid possible biases that may result if
only a single source is adopted.

77
5.2 Implications for the DMO (Ticino Turismo)
Results from the present research might be useful for the Ticino DMO in many ways.
First, results from the study gave some useful insights for what regards the navigation of users
through the menu bar and homepage.
Particularly, the research proved that, starting from the homepage, users follow the viewing
pattern: Central Text -> Central Button -> Discover Voice -> Explore Voice -> Ticino Logo -> Plan Voice
-> Inspire Me Voice -> Discover Menu -> Explore Menu -> Plan Menu. This revealed the most
attention-grabbing areas of the menu in the first seconds of navigation. The DMO should consider
this result and verify whether this pattern was expected and convenient for navigation.
For what regards the actual navigation of users, the most important area of the menu revealed to
be the drop down menu “Explore”. Navigation of users was guided by this area, as it proved to be
at the same time the most fixated (both in terms of number of fixations and of time spent on it) and
clicked. As mentioned in chapter two, this area was the most appealing for teenagers due to the
high concentration of specific themes available for click. The other menu “Discover” was used less,
as it contains more general information about the destination. This proved that Italian teenagers
were more focused in looking for more precise information on the website, either because they
became more and more knowledgeable during navigation or because they knew already some
specific attractions. On one hand, the DMO should take into consideration these results including in
this menu the most relevant information for the segment, and on the other, it should consider that
Italian teenagers look more for specific topics rather than general information.
Second, given the actual structure of the website and its contents, the themes that attracted
teenagers’ attention the most during navigation, were Nature, Sports/Outdoor Activities and
Lugano. Despite that (as it has been already mentioned in chapter .. and ..), what teenagers look on
the website does not always reflects their preferences. Therefore, a comparison between different
sources (heat maps, questionnaires and web analytics) has been carried out in order to have a more
precise picture of their preferences. From the comparison, two major themes emerged:
Sports/Outdoor Activities and Events. Given these results, for an eventual implementation of a
teenager section on the website, or simply to higher the appeal towards this segment, the DMO
should include contents related to these two themes within the website.

78
Third, the eye-tracking analysis allowed to identify the most visualized graphic elements of the
website, and, from the results, it was discovered that pictures with text are the most attention-
grabbing elements. Therefore, for the hypothetic implementation of a teenager section of the
website, or simply to enhance the website appeal towards this segment, the DMO should embed
targeted contents (related to Sports/Outdoor Activities and Events) within this type of elements.
Fourth, questionnaire results suggest that teenagers from Como perceive Ticino as a day trip
destination, with “nature” as one of the main charactering aspects and “shopping” as one of the
main reasons to visit. The DMO should take into consideration this perception, either reinforcing or
changing it according to its strategic objectives.
5.3 Limitations/ Further research
The present research presents some limitations addressed here below.
The study revealed certain correspondences in terms of participants’ preferred themes, but some
results may seem contradictory. For example, even if participants mostly looked at themes related
to the theme “nature”, the majority of self-declared attractions belong to the theme
“sports/outdoor”, indicating that what users look at does not always reflect their preferences.
Alternatively, this might suggest that when teenagers look at nature-related contents, they mostly
think of it as a possible context in which to play sport, hence Nature and Sports/Outdoor Activities
might fail in their interpretation/perception. The favorite attractions declared in the questionnaire
might be connected with previous experiences and/or knowledge teenagers got before through
different sources, hence not fully in line with what they were able to cover in a five-minute free
navigation experience. Given these results, future research should better investigate preferences of
users, developing a framework to understand how to interpret results coming from different
approaches (actual navigation vs. self-declared aspects). For example, in order to understand the
degree of influence of personal preferences/previous experiences on favorite attractions, it might
be useful to integrate the questionnaire with questions related to the travel attitudes of
participants, asking questions such as “are you sportive?” or “do you like culture?” etc..
Another limitation comes from the DMO analytics data about online sessions. These data comes
from teenagers of a specific city in Italy (Como): teenagers from other regions may have different

79
preferences, thus making difficult to generalize results for the teenager segment in general.
Therefore, future research should also consider to enlarge the sample to other regions, as well as
consider to specify the nature of the online user, being it a local or a tourist. Additionally, data about
a specific segment offered by Google Analytics are just a proxy based on those users the system was
able to connect to specific demographic info.
The present research is also influenced by the typology of task that was given to participants. In fact,
in our case users were let free to navigate the website, with no precise task. Results from the test
might change if a precise task such as “plan a holiday” or “look for events” would have been asked
to participants. Future research should therefore develop different scenarios with different tasks,
in order to deepen the understanding of teenagers’ online behavior when it comes to look for
information on a DMO website.
Another possible bias in the interpretation of results regards the “exposure” of participants to
themes. In the present research, it is not always obvious to state that participants were “exposed”
to certain themes, because in the end they were the ones who decided what to look at/search over
the website. In fact, users which are strictly “exposed” are the ones that, for example, are exposed
to a video or an advertisement, more than the ones that navigate a website. This make the
interpretation of the results tricky, as it is only possible to compare what participants looked for
within the website with what they declare to prefer after navigation. Further research might
therefore consider to develop tests that expose users to predefined pages, images or videos, and
then to ask for their preferences, in order to see which themes attracted them the most among the
ones to whom they were exposed.
Lastly, future research might be conducted to investigate the degree of influence of navigation on
the memory of participants, asking for example if they still remember attractions, themes, or
activities displayed within the website after a certain period of time. On another side, the influence
of navigation could be addressed directly on the possible actions undertaken by participants in the
period after navigation, asking them if they generated word of mouth or if they visited the
destination. This research might help to assess the impact of website navigation on memory and
intention to visit.

80
6. Bibliography
Batat, W. (2008). How competent are teenagers aged 11-15 in using new technologies within their consumption experience? An exploratory research on consumer behaviour. The 7th International Congress Marketing Trends. Venice: International Marketing Trends Conference.
Campion, M. (2016, September 21). The History of Eye Tracking Studies & Technology. Retrieved from looktracker.com: https://www.looktracker.com/blog/eye-tracking-technology/the-history-of-eye-tracking-studies-and-technology/
Cantoni, E., Marchiori, E., & Cantoni, L. (2016). Teenagers’ Destination Website Navigation. A Comparison among Eye-Tracking, Web Analytics and Survey Data.
Definition of stimulus in English. (n.d.). Retrieved from oxforddictionaries.com: http://www.oxforddictionaries.com/definition/english/stimulus
Duchowski, A. (2007). Eye Tracking Methodology Theory and Practice. Springer-Verlag London.
Ergonomic requirements for office work with visual display terminals (VDTs) — Part 11: Guidance on usability. (2016, 08 31). Retrieved from www.iso.org: https://www.iso.org/obp/ui/#iso:std:iso:9241:-11:ed-1:v1:en
Eye Tracking Through History . (2016, September 21). Retrieved from http://eyesee-research.com: http://eyesee-research.com/news/eye-ttacking-through-history/
Gidlöf, K., Holmberg, N., & Sandberg, H. (2012). The use of eye-tracking and retrospective interviews to study teenagers’ exposure to online advertising. Visual Communication, 329-345.
Gidlöf, K., Wallin, A., Dewhurst, R., & Holmqvist, K. (2013). Using Eye Tracking to Trace a Cognitive Process: Gaze Behaviour During Decision Making in a Natural Environment. Journal of Eye Movement Research.
Heide, W., Koenig, E., Trillenberg, P., Kömpf, D., & Zee, D. S. (1999). Electrooculography: technical standards and applications. In G. Deuschl, & A. Eisen, Recommendations for the Practice of Clinical Neurophysiology: Guidelines of the International Federation of Clinical Physiology (EEG Suppl. 52) (pp. 223-240). Elsevier Science B.V.
Hill, W., & Beatty, S. (2011). A model of adolescents' online consumer self-efficacy (OCSE). Journal of Business Research, 1025–1033.
Jacob, R. J., & Karn, K. S. (2003). Eye Tracking in Human-Computer Interaction and Usability Research: Ready to Deliver the Promises. In R. Radach, J. Hyona, & H. Deubel, The Mind's Eye: Cognitive and Applied Aspects of Eye Movement Research. North Holland.
Kaplan, M. (2013, June 20). Teenage Online Shopping Trends. Retrieved from practicalecommerce: http://www.practicalecommerce.com/articles/4073-Teenage-Online-Shopping-Trends

81
Khan, K., & Locatis, C. (1998). Searching through Cyberspace: The Effects of Link Display and Link Density on Information Retrieval from Hypertext on the World Wide Web. Journal of the American Society for Information Science (1986-1998), 176-182.
Lazonder, A. W., Biemans, H. J., & Wopereis, I. G. (2000). Differences between Novice and Experienced Users in Searching Information on the World Wide Web. Journal of the American Society for Information Science, 576-581.
Li, Q., Huang, Z., & Christianson, K. (2016). Visual attention toward tourism photographs with text: An eye-tracking study. Tourism Management, 243–258.
Loranger, H., & Nielsen, J. (2013, February 4). Teenage Usability: Designing Teen-Targeted Websites. Retrieved from nngroup: https://www.nngroup.com/articles/usability-of-websites-for-teenagers/
Marchiori, E., & Cantoni, L. (2015). Studying Online Contents Navigation: a Comparison between Eye-Tracking Technique and Self-Reported Investigation. In I. Tussyadiah, & A. Inversini, Information and Communication Technologies in Tourism 2015 (pp. 349-359). Springer International Publishing.
McCarthy , J. D., Sasse, M. A., & Riegelsberger , J. (2004). Could I have the Menu Please? An Eye Tracking Study of Design Conventions. In E. O'Neill, P. Palanque, & P. Johnson, People and Computers XVII — Designing for Society (pp. 401-414). Springer London.
Méndez, J. H. (2015). Travel 2.0 tools: User behavior analysis and modelling. Special emphasis on advertising effectiveness through the eye-tracking methodology. University of Granada.
Nielsen, J., & Pernice, K. (2010). Eyetracking web usability. Pearson Education.
Niu, H.-J. (2013). Cyber peers’ influence for adolescent consumer in decision-making styles and online purchasing behavior. Journal of Applied Social Psychology, 1228–1237.
Noone, B., & Robson, S. K. (2014). Using Eye Tracking to Obtain a Deeper Understanding of What Drives Online Hotel Choice. Cornell University.
Pan, B., Granka, L. A., Hembrooke, H. A., Feusner, M. K., Gay, G. K., & Newman, J. K. (2004). The Determinants of Web Page Viewing Behavior: An Eye-Tracking Study. Proceedings of the 2004 symposium on Eye tracking research & applications (pp. pp. 147-154). ACM.
Poole, A., & Ball , L. J. (2005). Eye Tracking in Human-Computer Interaction and Usability Research: Current Status and Future. In C. Gahoui, Encyclopedia of Human-Computer Interaction.
Russel, M. (2005, February 13). Using Eye-Tracking Data to Understand First Impressions of a Website. Retrieved from http://usabilitynews.org/: http://usabilitynews.org/using-eye-tracking-data-to-understand-first-impressions-of-a-website/
Smith, C. (2014, July 15). These Are Teens' Favorite E-Commerce Sites. Retrieved from businessinsider.com: http://www.businessinsider.com/teens-shopping-online-is-on-the-rise-here-are-their-favorite-e-commerce-sites-2014-6?IR=T
Sparks, B., & Wang, Y. (2014). An Eye-Tracking Study of Tourism Photo Stimuli: Image Characteristics and Ethnicity. Journal of Travel Research, 1-15.

82
Ticino New Experience. (2016, 9 20). Retrieved from newexperience.ticino: http://newexperience.ticino.ch/en/index.html
Tobii Studio User's Manual. (2016). Tobii AB.
Types of eye movement. (2016, September 21). Retrieved from tobiipro.com: http://www.tobiipro.com/learn-and-support/learn/eye-tracking-essentials/types-of-eye-movements/
Van Gog, T., & Jarodzka, H. (2013). Eye Tracking as a Tool to Study and Enhance Cognitive and Metacognitive Processes in Computer-Based Learning Environments. In R. Azevedo, & V. Aleven, International Handbook of Metacognition and Learning Technologies (pp. 143-156). New York: Springer Science & Business Media.
Venkatraman, V., Payne, J. W., & Huettel, S. A. (2014). An overall probability of winning heuristic for complex risky decisions: Choice and eye fixation evidence. Organizational Behavior and Human Decision Processes.
Wan Adilah Wan, A., Wan Nur Hafizhoh, H., Natrah, A., & Jamaliah, T. (2013). Eye Tracking Analysis of User Behavior in Online Social Networks. In Online Communities and Social Computing (pp. 113-119). Springer Berlin Heidelberg.
Wang, Y., & Sparks, B. (2014). An Eye-Tracking Study of Tourism Photo Stimuli: Image Characteristics and Ethnicity. Journal of Travel Research, 1-15.
What Is Eye Tracking? (2016, 9 20). Retrieved from tobii.com: http://www.tobii.com/tech/technology/what-is-eye-tracking/

83
7. Annex
7.1 Interview with Luca Preto, Online Marketing Manager at Ticino Turismo
1) How did you develop your new website in terms of contents?
We thought to base our website upon who we think are our tourists. In our case, the contents of
the website are addressed mostly to people who know already the destination, which represent
approximately 70% of our visitors. Particularly, for us repeaters tourists are an important segment.
Contents are displayed within three different sections: “Discover”, “Explore” and “Plan”. The
section “Discover” contains more generic information, and is addressed mostly to people that get
in touch for the first time with the destination, such as Americans. The “Explore” section entails
information that is more specific and is addressed for visitors with a certain level of knowledge, as
the Swiss Germans, our main target. Then, the “Plan” section was thought for those who have
already decided to come.
2) What is your online strategy to approach different segments within the website?
We thought that the most efficient way to approach online visitors within the website was to
create different “Personas”. Personas are stereotypical representations of a specific tourist target.
In our case, we have identified four types of personas: the “day tourist”, the “weekend tourist”, the
“long-distance tourist”, and the “tourist behind the wheel”. Our strategy is based on these
personas and is reflected on the website and its contents.
3) So, can say that those personas are your main target audience? And if so, how did you
discover those segments?
Yes, those personas represent our main tourist target audiences. To be precise, our most relevant
target are Swiss German repeaters. We can say that we had already the segments in mind,
because we already know who our tourists are. However, to be more accurate, we gathered data
from hotels and Google Analytics, as well as doing workshops with stakeholders and tourists, to
have a better understanding of our guests.
4) What do you know about teenager segment, and more specifically, teenager segment from
bordering regions? Do you think that having information about this segment could be
useful for you?

84
Actually we know very few, and this because teenagers are not included in our “Personas”, as they
represent a very small part of our tourists. We have very few data about them, mostly because it is
difficult to trace them. We know that there are many day tourists coming from Como, and that
part of them are teenagers, but they leave little trace in the statistic. Even though, having insights
on their preferences could be very interesting for us, especially because they might be future day
tourists. They may not have a high purchasing power right now, but in the near future yes.
5) Do you think that having information about how users navigate your website might be
useful for you?
Yes, this might be very useful for us because we have not yet run any usability test on our new
website. Having insights from you about navigation of users can help us to further improve our
website.
Note: After the interview, part of the results of the research were illustrated to the online manager,
who showed appreciation and interest for the results, particularly about how users navigate the
menu bar and over teenagers most viewed contents.

85
7.2 Questionnaire

86
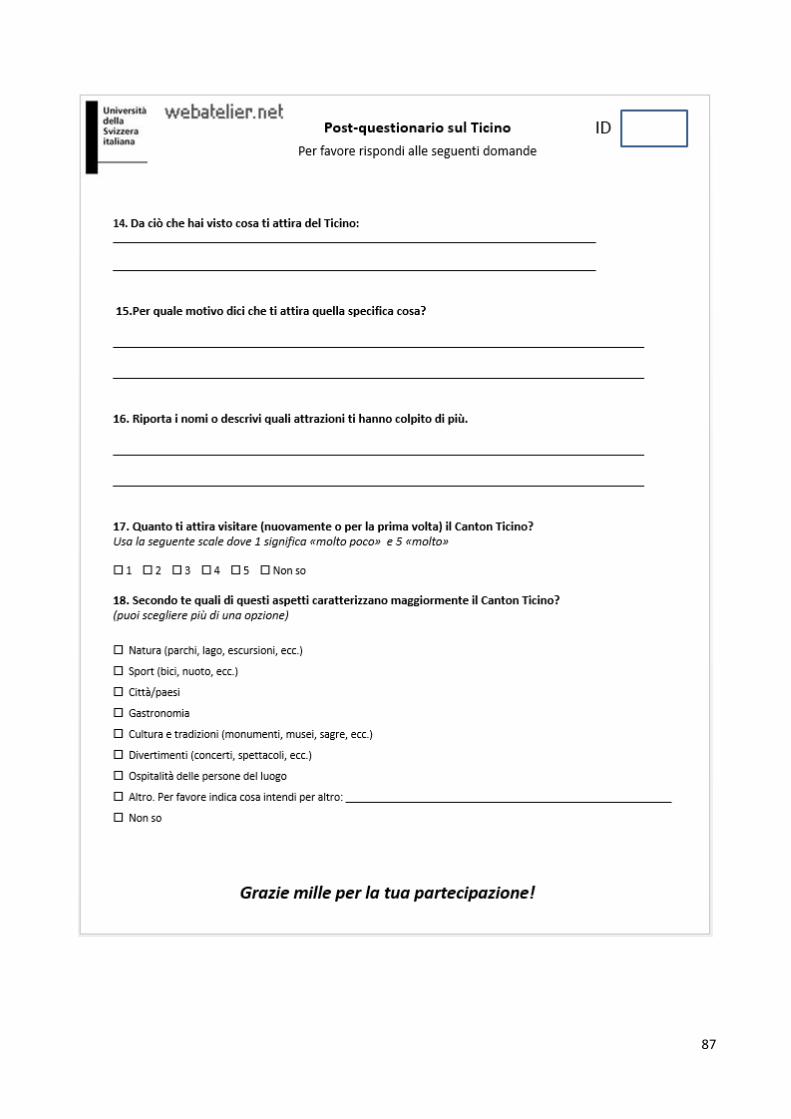
87

88
7.3 Heat Maps
Figure 33: http://www.ticino.ch/, 23 participants Figure 34:
http://www.ticino.ch/en/discover.html, 10 participants

89
Figure 35: http://www.ticino.ch/en/explore.html, 10 participants
Figure 16: http://www.ticino.ch/en/discover/seasons/summer.html, 8 participants
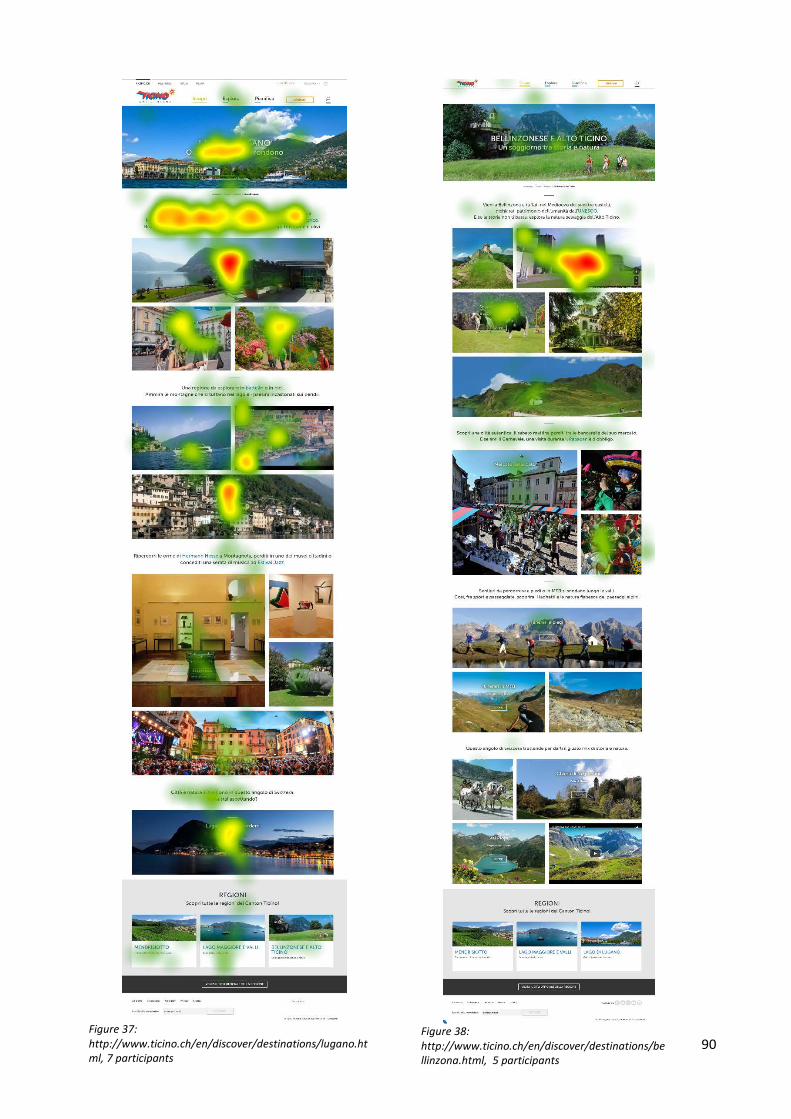
90
Figure 37: http://www.ticino.ch/en/discover/destinations/lugano.html, 7 participants
Figure 38: http://www.ticino.ch/en/discover/destinations/bellinzona.html, 5 participants

91
Figure 39 : http://www.ticino.ch/en/discover/destinations/ascona-locarno.html, 5 participants
Figure 40: http://www.ticino.ch/en/explore/shopping.html, 5 participants

92
Figure 41: http://www.ticino.ch/en/explore/parks-gardens.html, 5 participants
Figure 42: http://www.ticino.ch/en/explore/sports/extreme-sports.html, 5 participants
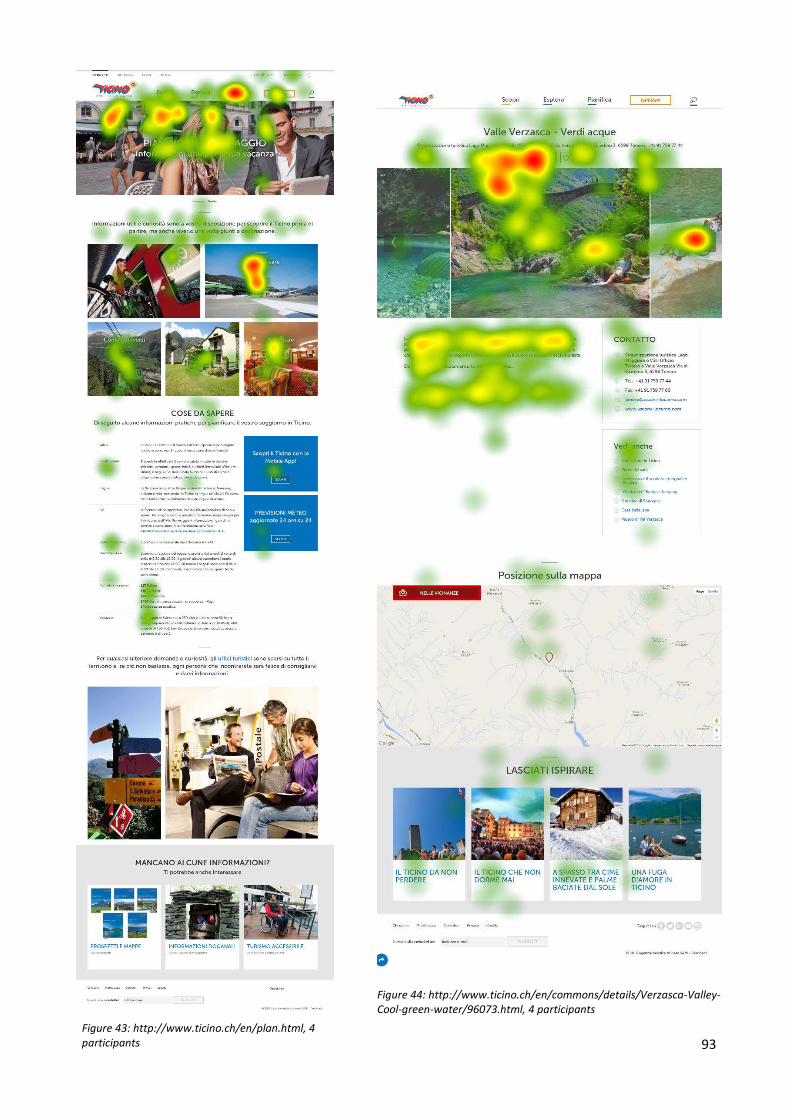
93
Figure 43: http://www.ticino.ch/en/plan.html, 4 participants
Figure 44: http://www.ticino.ch/en/commons/details/Verzasca-Valley-Cool-green-water/96073.html, 4 participants

94
Figure 45: http://www.ticino.ch/it/, 4 participants Figure 46: http://www.ticino.ch/en/explore/sports/traditional-sports.html, 4 participants
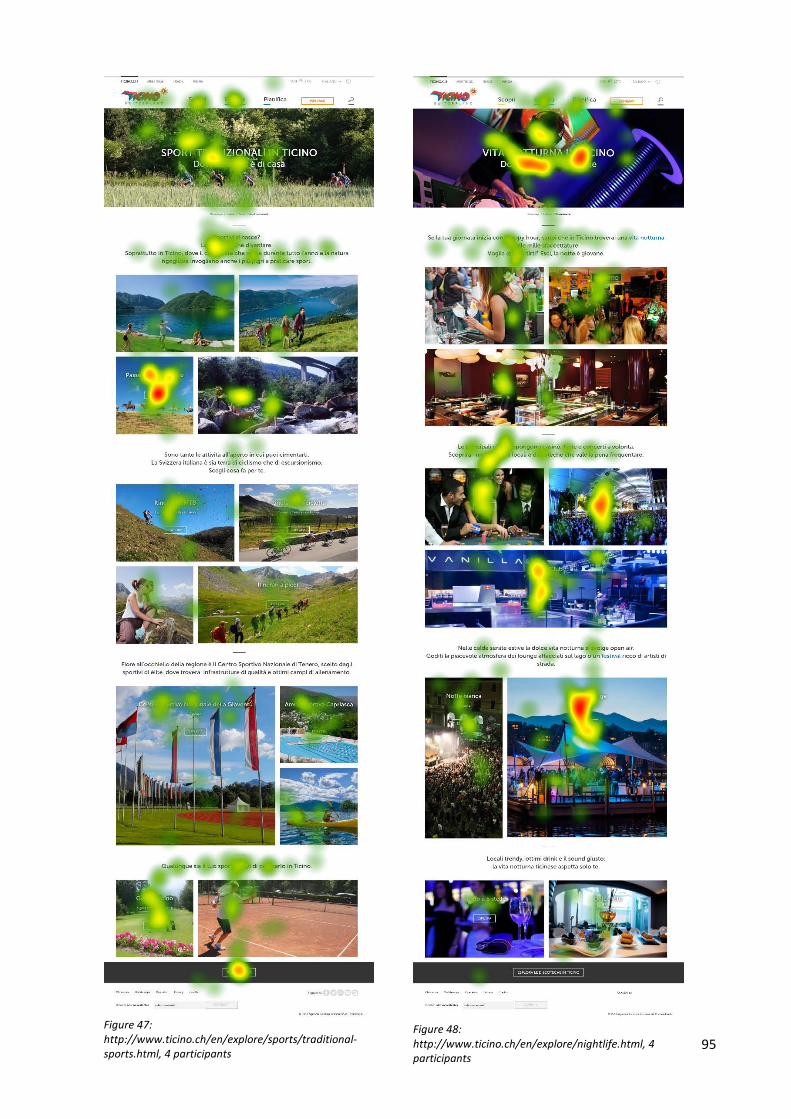
95
Figure 47: http://www.ticino.ch/en/explore/sports/traditional-sports.html, 4 participants
Figure 48: http://www.ticino.ch/en/explore/nightlife.html, 4 participants

96
Figure 49: http://www.ticino.ch/en/discover/experiences/nature.html, 3 participants
Figure 50: http://www.ticino.ch/en/discover/seasons/winter.html, 3 participants

97
Figure 51: http://www.ticino.ch/en/explore/excursions.html, 3 participants
Figure 52: http://www.ticino.ch/en/explore/sports/water-sports.html, 3 participants
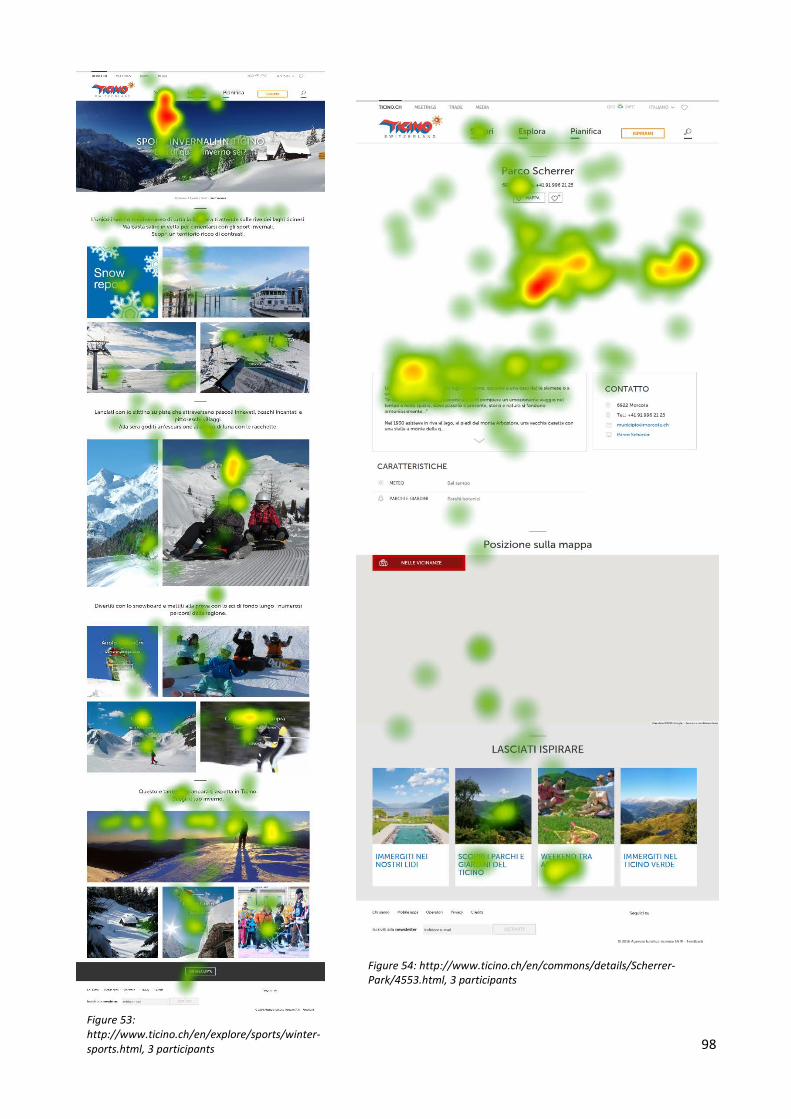
98
Figure 53: http://www.ticino.ch/en/explore/sports/winter-sports.html, 3 participants
Figure 54: http://www.ticino.ch/en/commons/details/Scherrer-Park/4553.html, 3 participants
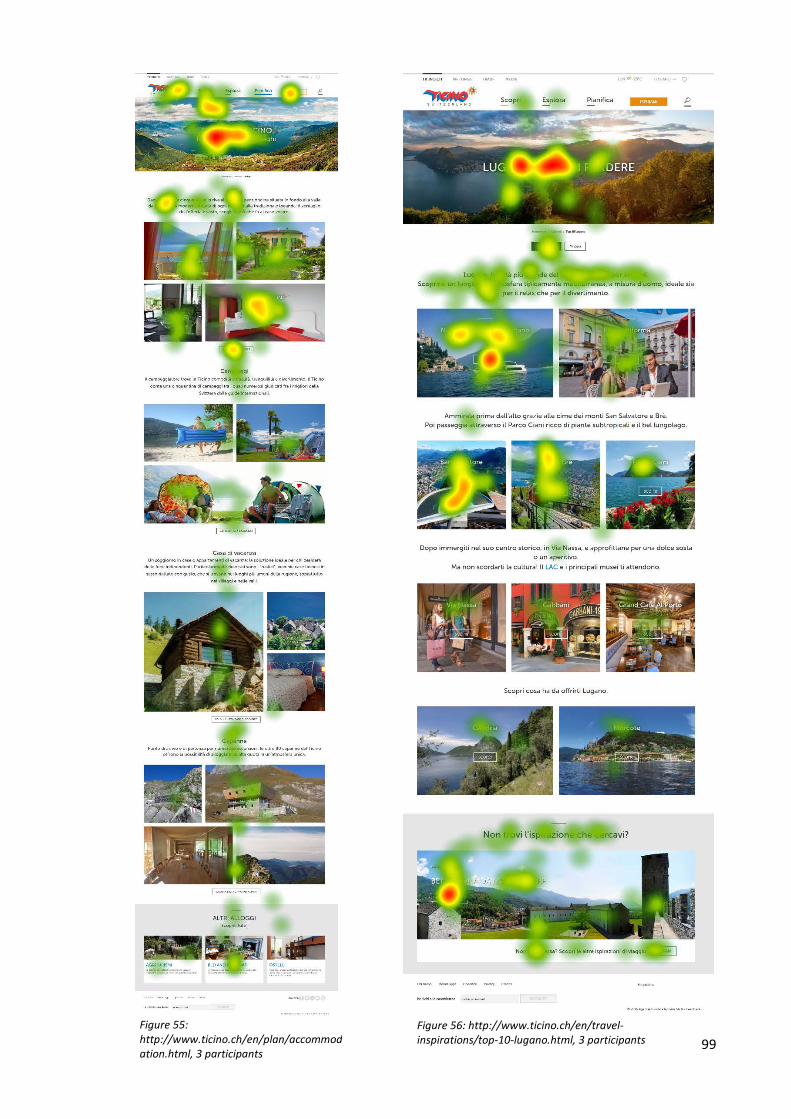
99
Figure 55: http://www.ticino.ch/en/plan/accommodation.html, 3 participants
Figure 56: http://www.ticino.ch/en/travel-inspirations/top-10-lugano.html, 3 participants

100
Figure 57: http://www.ticino.ch/en/travel-inspirations/beaches.html, 3 participants
Figure 58: http://www.ticino.ch/it/discover/experiences/culture, 2 participants
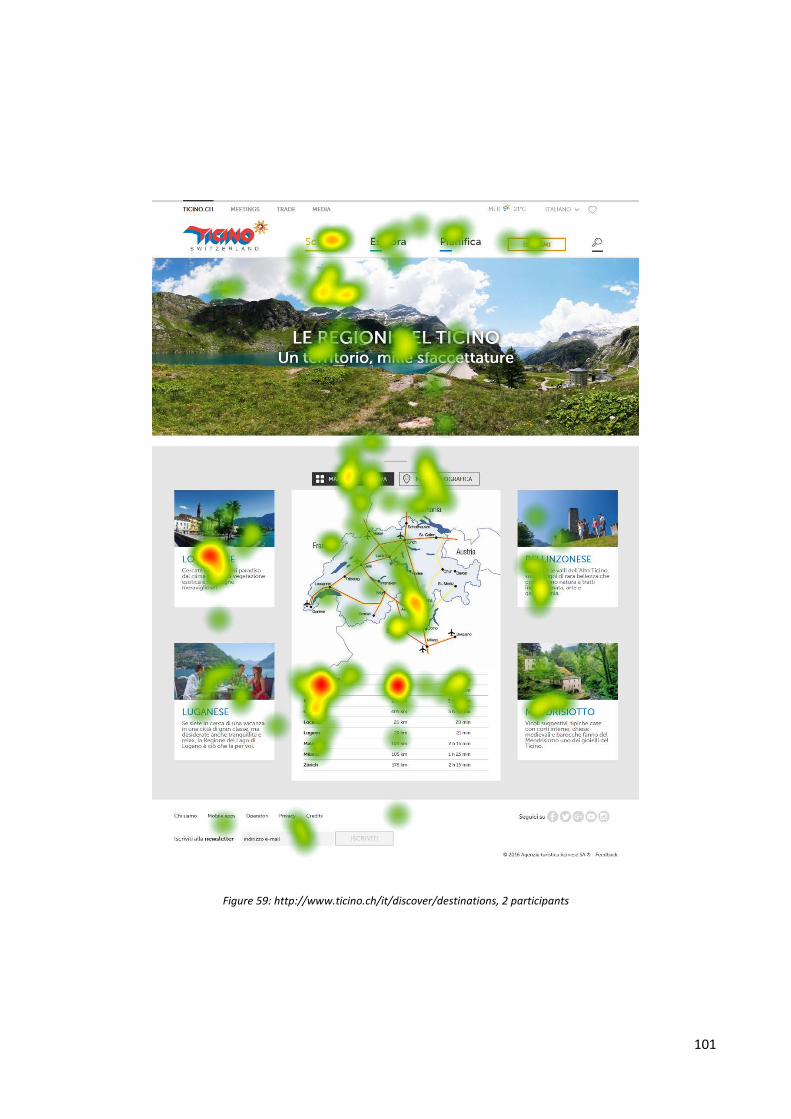
101
Figure 59: http://www.ticino.ch/it/discover/destinations, 2 participants
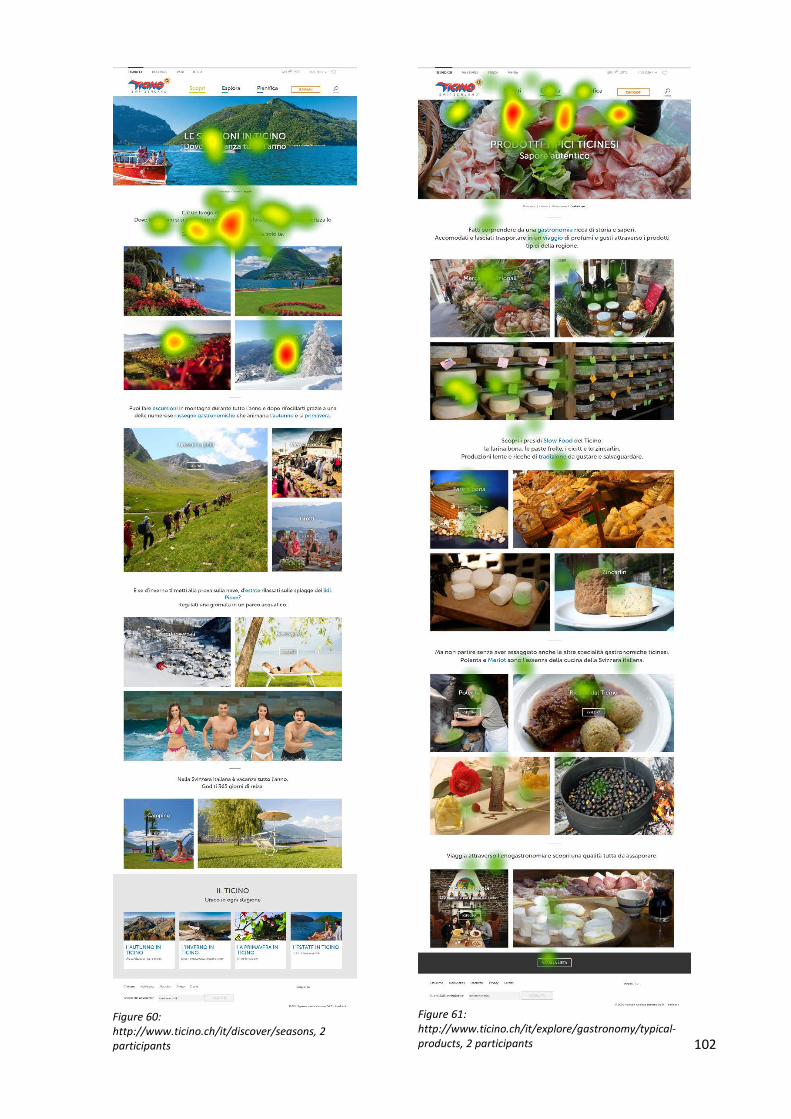
102
Figure 60: http://www.ticino.ch/it/discover/seasons, 2 participants
Figure 61: http://www.ticino.ch/it/explore/gastronomy/typical-products, 2 participants
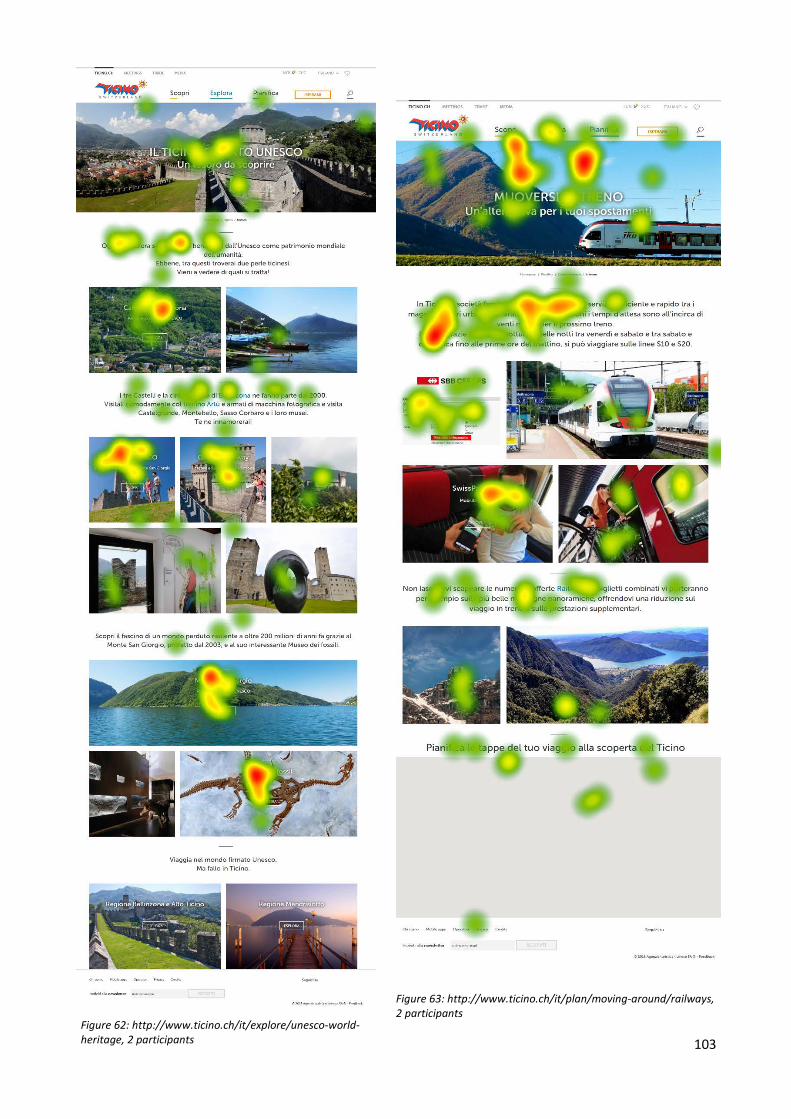
103
Figure 62: http://www.ticino.ch/it/explore/unesco-world-heritage, 2 participants
Figure 63: http://www.ticino.ch/it/plan/moving-around/railways, 2 participants

104
Figure 64: http://www.ticino.ch/it/plan/getting-there/by-train, 2 participants