teekay tankers q1-2016 earnings presentation
TRANSCRIPT

TEEKAY TANKERS FIRST QUARTER 2016 EARNINGS PRESENTATION May 19, 2016

Forward Looking Statements
This release contains forward-looking statements (as defined in Section 21E of the Securities Exchange Act of 1934, as
amended) which reflect management’s current views with respect to certain future events and performance, including
statements regarding: expected higher revenue days in the second quarter of 2016 as the Company’s owned fleet returns
to near full utilization; the impact of the tanker market on the Company’s earnings, free cash flow, net asset value, balance
sheet leverage and future dividends; crude oil and refined product tanker market fundamentals, including the balance of
supply and demand in the tanker market, the amount of new orders for tankers and the estimated growth in the world
tanker fleet, new trade routes, estimated growth in global oil demand and supply, crude oil tanker demand and OPEC crude
oil supply; tanker fleet utilization and spot tanker rates; the effect of changes in oil prices, including the potential impact on
oil stockpiling, refinery throughput and bunker fuel prices. The following factors are among those that could cause actual
results to differ materially from the forward-looking statements, which involve risks and uncertainties, and that should be
considered in evaluating any such statement: changes in the production of, or demand for, oil or refined products; changes
in trading patterns significantly affecting overall vessel tonnage requirements; greater or less than anticipated levels of
tanker newbuilding orders and deliveries and greater or less than anticipated rates of tanker scrapping; changes in global
oil prices; changes in applicable industry laws and regulations and the timing of implementation of new laws and
regulations; the number of off-hire days relating to the Company’s fleet; increased costs; and other factors discussed in
Teekay Tankers’ filings from time to time with the United States Securities and Exchange Commission, including its Report
on Form 20-F for the fiscal year ended December 31, 2015. The Company expressly disclaims any obligation or
undertaking to release publicly any updates or revisions to any forward-looking statements contained herein to reflect any
change in the Company’s expectations with respect thereto or any change in events, conditions or circumstances on which
any such statement is based.
2
3 3
Recent Highlights
• Q1-16 Financial Results
○ Generated adjusted net income1 of
$46.0 million, or $0.29 per share,
versus adjusted net income of $39.0
million, or $0.34 per share in Q1-15
○ Generated free cash flow1 of $66.2
million, or $0.42 per share, versus
$53.0 million, or $0.46 per share in
Q1-15
○ Dividend of $0.09 per share for Q1-16
• Decreased net debt2 by ~$50 million
during Q1-16
• Positive tanker market fundamentals
expected to remain in place through
2016
(1) See the Q1-16 earnings release for explanations and reconciliation of these non-
GAAP financial measures to the most directly comparable financial measures
under GAAP.
(2) Net debt is a non-GAAP financial measure and represents current and long-term
debt less cash and cash equivalents and, if applicable, restricted cash.

Q1-16 Tanker Earnings Remained Strong
Q1-16 earnings were negatively impacted by a number of factors:
• Mild winter weather in the Northern Hemisphere
• Heavier than normal refinery maintenance
• Atlantic oil supply disruptions impacting mid-size tankers more than VLCCs.
However, earnings down y-o-y due to seasonal factors
4
0
10
20
30
40
50
60
‘000 U
SD
/ d
ay
Q1 Crude Tanker Earnings Suezmax AframaxSuezmax 10-yr avg. Aframax 10-yr avg.
77
78
79
80
81
82
mb
/d
Global Refinery Throughput (2016)
Source: IEA
Underlying oil supply / demand fundamentals remain supportive for crude tankers
Source: 90% Clarksons

Tanker Supply / Demand Outlook Unchanged
• Tanker fleet growth set to accelerate
o Suezmax deliveries weighted more towards 2017
• Lack of access to capital is limiting new
tanker orders
o Only 1.1 mdwt ordered in 2016 YTD
o Lower fleet growth expected in 2018
High OPEC supply and rising oil demand to support rates through 2016
5
• Rising oil consumption and stockpiling in
India / China driving tanker demand
• OPEC crude oil production reached a
seven-year high in Apr-16
• US seaborne imports increasing as
domestic production declines
91
92
93
94
95
96
97
98
Mb
/d
Global Crude Supply & Demand
Oil Demand Oil Supply
-4%
-2%
0%
2%
4%
6%
8%
-30
-20
-10
0
10
20
30
40
50
60
% F
leet
Gro
wth
To
tal D
WT
Tanker Fleet Growth
Scrapping Forecast Scrapping Forecast Deliveries
Deliveries Fleet Growth (%)

Financial Highlights – Adjusted Net Income Q1-2016 vs. Q4-2015
6
Increase to Adjusted Net Income Decrease to Adjusted Net Income
48.5 46
13.8
8.5
0.5
3.5
2.7
1.9 1.0
Q4-15 AdjustedNet Income
Decrease inSpot Rates
Increase inRevenue Days
EmploymentChanges and
OtherRevenues*
Decrease inVessel Opex
Decrease in TCHire Expense
Increase inDepreciation &Amortization
Other** Q1-16 AdjustedNet Income
$ M
illio
ns
Changes in Expenses Changes in Revenues
* Includes changes offhire bunker expenses and ship-to-ship operations.
** Includes changes to equity income, interest expense and G&A expenses.

Financial Highlights • Rewarding shareholders through variable cash dividend
o Q1-16 dividend of $0.09 per share equating to 30% of adjusted net income
• Generating strong cash flows with low break-even of ~$10,000 per day
• Focus remains on total shareholder return through dividend payments and balance sheet
de-levering
7
FCF and Dividend Yield1,3
60%4
53%
44%
72%
41%
39%
30%
40%
50%
60%
70%
80%
Q4-2013 Q4-2014 Q1-2016 Q4-2016
Financial Leverage3
Aframax Equivalent TCE2
$25,000
$30,000
$35,000
0%
10%
20%
30%
40%
50%
60%
70%
10,000 15,000 20,000 25,000 30,000 35,000
% Y
ield
Aframax Equivalent TCE2
FCF Yield
Dividend Yield
(1) Based on estimated results for 12 months ending March 31, 2017 assuming current fleet and a share price of $4.00 per share
(2) Aframax equivalent TCE: Suezmax = 1.30x, LR2 = 1.00x, MR = 0.70x
(3) Based on an assumed 30% dividend payout
(4) Pro-forma to include Q1-15 vessel acquisitions that were committed for in Q4-14

Q2-16 Spot Earnings Update
• Rates 2016 to-date have remained robust, albeit lower than 2015 highs
• Strong demand fundamentals to be supportive of tanker rates through 2016
8
$39,400
$30,700
$24,900
$35,800
$27,500
$23,700
$-
$10,000
$20,000
$30,000
$40,000
$50,000
Suezmax Aframax RSA LR2
Q1-15 Actual Q1-16 Actual
$38,800
$33,800
$29,000
$33,700
$24,100 $22,600
$-
$10,000
$20,000
$30,000
$40,000
$50,000
Suezmax Aframax RSA LR2
Q2-15 Actual Q2-16 to-date
Suezmax Aframax LR2
Q2-16 spot ship
days 1,704 1,213 728
Q2-16 % booked
to-date 59% 57% 52%

APPENDIX
9
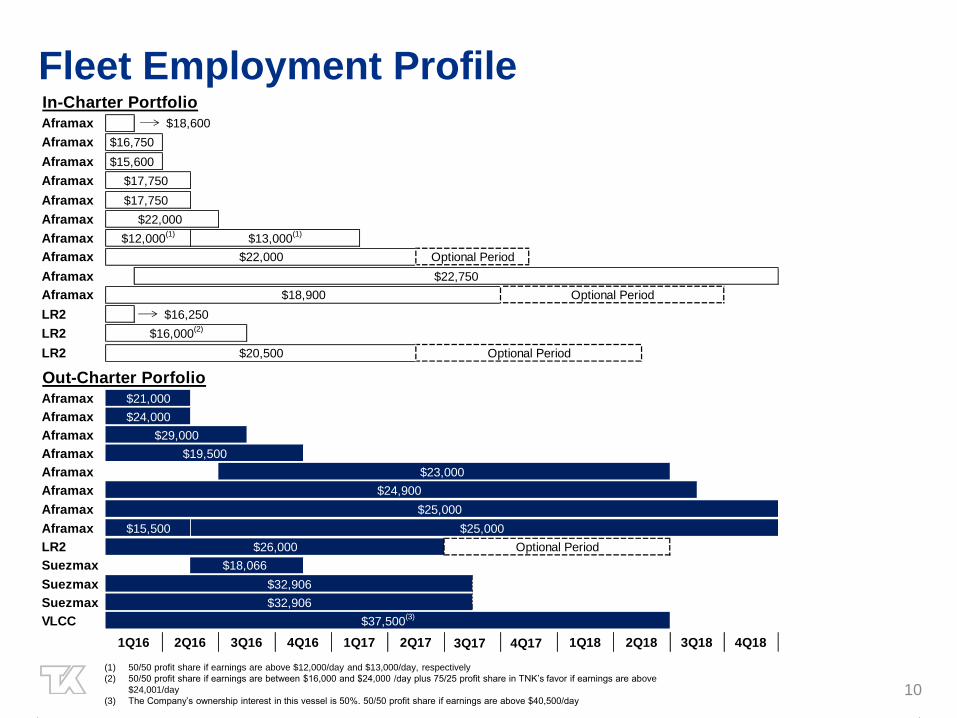
Fleet Employment Profile
10
In-Charter Portfolio
Aframax
Aframax
Aframax
Aframax
Aframax
Aframax
Aframax
Aframax
Aframax
Aframax
LR2
LR2
LR2
Out-Charter Porfolio
Aframax
Aframax
Aframax
Aframax
Aframax
Aframax
Aframax
Aframax
LR2
Suezmax
Suezmax
Suezmax
VLCC
1Q16 2Q16 3Q16 4Q16 1Q17 2Q17 3Q17 4Q17 1Q18 2Q18 3Q18 4Q18
$23,000
$24,000
$29,000
$19,500
$24,900
$37,500(3)
Optional Period
$18,066
$25,000
$22,000
$18,900
$16,000(2)
$20,500
$21,000
Optional Period
Optional Period
$15,500
$26,000
$32,906
$32,906
$25,000
$18,600
$17,750
$16,250
$22,750
$16,750
$15,600
$17,750
$22,000
Optional Period
$13,000(1)
$12,000(1)
(1) 50/50 profit share if earnings are above $12,000/day and $13,000/day, respectively
(2) 50/50 profit share if earnings are between $16,000 and $24,000 /day plus 75/25 profit share in TNK’s favor if earnings are above
$24,001/day
(3) The Company’s ownership interest in this vessel is 50%. 50/50 profit share if earnings are above $40,500/day

Drydock & Offhire Schedule
11
Teekay Tankers
Segment
Vessels
Total
Off-hire
Days
Vessels
Total
Off-hire
Days
Vessels
Total
Off-hire
Days
Vessels
Total
Off-hire
Days
Vessels
Total
Off-hire
Days
Spot Tanker - 50 1 25 1 14 - - 2 89
Fixed-Rate Tanker 1 95 - 68 - - - - 1 163
1 145 1 93 1 14 - - 3 252
Note:
(1) In the case that a vessel drydock & offhire straddles between quarters, the drydock & offhire has been allocated to the quarter in which majority of drydock days occur.
(2) Only owned vessels were accounted for in this schedule. In addition, for the three months ended March 31, 2016, there were 30 offhire days for in-chartered vessels.
March 31, 2016 (A) June 30, 2016 (E) September 30, 2016 (E) December 31, 2016 (E) Total 2016
(3) For the three months ended March 31, 2016, 7 vessels contributed to 50 off-hire days in the spot tanker segment and 1 vessel contributed to 4 off-hire days in the fixed-rate tanker
segment.

Q1-16 vs. Q4-15 Results
12
($’000’s, except share and per share data)
Q1-16 Adjusted
(unaudited)(1)
Q4-15 Adjusted
(unaudited)(1) Comments Net revenues 152,127 157,907 Decrease is primarily due to lower average realized Q1-16 spot TCE rates,
decrease in full service lightering and lightering support net voyage
revenues in Q1-16, which are partially offset by fewer net offhire days in
Q1-16 resulting from a heavier drydocking schedule in the prior quarter.
Vessel operating expenses (45,073) (48,558) Decrease is primarily due to timing and scope of repairs and maintenance
activities in Q1-16 and timing of pre-delivery costs incurred in Q4-15
resulting from the acquisition of the 12 Suezmax vessels and the timing of
transitional costs related to various vessels being transitioned from
external to in-house technical management.
Time charter hire expense (20,716) (23,403) Decrease is primarily due to the redeliveries of various in-chartered
vessels to their owners in Q1-16.
Depreciation and amortization (27,067) (25,130) Increase is primarily due to a full quarter of drydock amortization costs
related to various vessels which completed their drydock in the prior
quarter.
General and administrative expenses (5,433) (6,217) Decrease is primarily due to higher Q4-15 administrative costs for
transactions and financings.
Income from operations 53,838 54,599
Net interest expense and realized loss on derivative instruments (9,340) (10,002) Decrease is primarily due to lower average debt balances in Q1-16.
Equity income 3,943 5,606 Decrease is primarily due to an decrease in the equity income from High Q
JV resulting from a profit sharing component of a time charter contract
recognized in Q4-15 and an decrease in the equity income from TIL
resulting from the sale of vessels in Q1-16 and lower average spot rates
earned in Q1-16.
Other expense (2,483) (1,661) Other expense consists mainly of freight tax expenses. Increase due to
an increase in freight tax accrual made due to an increase in Suezmax
tankers activities with China during Q1-16.
Adjusted net income attributable to shareholders of Teekay Tankers 45,958 48,542
Adjusted net income per share 0.29 0.31
(1) Adjusted net income attributable to the shareholders of Teekay Tankers is a non-GAAP financial measure. Q4-15 period excludes the results of Entities under Common Control.
Please refer to Appendix A to the Earnings Release.

13
Income Statement Item Q2-16 Outlook
(expected changes from Q1-16)
Net revenues
Decrease of approximately 200 net spot revenue days in TNK, mainly due to redeliveries of six in-chartered
vessels in Q2-16 and later half of Q1-16.
Approximately 60% of Q2-16 spot revenue days for Aframaxes and Suezmaxes fixed at $24,100/day and
$33,700/day, respectively, compared to $27,500/day and $35,800/day, respectively, in Q1-16.
Vessel operating expenses
$1.5m increase primarily due to higher number of operations in ship-to-ship support services in Q2-16, timing of
planned activities and transitional costs in Q2-16 for vessels that are expected to be brought in house for technical
management.
Time charter hire expense $5.3m decrease from the redeliveries of various in-chartered vessels.
Depreciation and amortization Expected to be consistent with Q1-16.
General and administrative expenses $0.5m decrease from accelerated stock-based compensation that is recognized annually in Q1 of each year.
Net interest expense and realized loss on derivative instruments $0.7m decrease from non-capitalized loan costs that were incurred in Q1-16.
Equity income $0.9m decrease due to the impact of lower forecasted average spot TCE rates on the income from our
conventional tanker franchise and from TIL.
Q2-16 Outlook

14