teekay offshore partners q3-2016 earnings presentation
TRANSCRIPT
TEEKAY OFFSHORE
PARTNERS Q3-2016
EARNINGS
PRESENTATIONNovember 3, 2016
Forward Looking Statements
This presentation contains forward-looking statements (as defined in Section 21E of the Securities Exchange Act of 1934,
as amended) which reflect management’s current views with respect to certain future events and performance, including:
the Partnership’s expectations for its fourth quarter 2016 distributable cash flow; the timing of start-up and the voyage
requirements of the new CoA; the effect of the new CoA on the Partnership’s future cash flows, including the Partnership’s
fleet utilization; the fundamentals in the shuttle tanker market; and the Partnership’s timing of delivery and costs of various
newbuildings and conversion projects, including potential delays and additional costs on the Petrojarl I FPSO and the
outcome of associated discussions with the charterer, shipyard and lenders. The following factors are among those that
could cause actual results to differ materially from the forward-looking statements, which involve risks and uncertainties,
and that should be considered in evaluating any such statement: timing of the start-up of the CoA contract to service the
Glen Lyon FPSO unit in the North Sea; vessel operations and oil production volumes; significant changes in oil prices;
variations in expected levels of field maintenance; increased operating expenses; different-than-expected levels of oil
production in the North Sea, Brazil and East Coast of Canada offshore fields; potential early termination of contracts;
shipyard delivery or vessel conversion and upgrade delays and cost overruns; changes in exploration, production and
storage of offshore oil and gas, either generally or in particular regions that would impact expected future growth; delays in
the commencement of charter contracts; the inability of the Partnership to negotiate acceptable terms with the charterer,
shipyard and lenders related to the delay of the Petrojarl I FPSO; and other factors discussed in Teekay Offshore’s filings
from time to time with the SEC, including its Report on Form 20-F for the fiscal year ended December 31, 2015. The
Partnership expressly disclaims any obligation or undertaking to release publicly any updates or revisions to any forward-
looking statements contained herein to reflect any change in the Partnership’s expectations with respect thereto or any
change in events, conditions or circumstances on which any such statement is based.
2
33
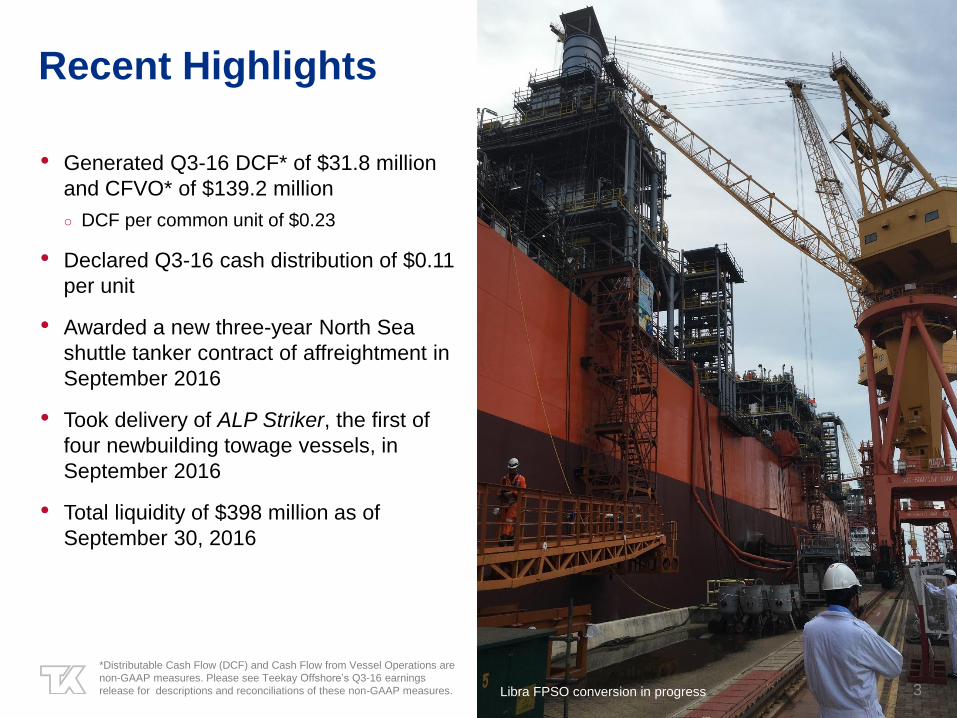
Recent Highlights
• Generated Q3-16 DCF* of $31.8 million
and CFVO* of $139.2 million
○ DCF per common unit of $0.23
• Declared Q3-16 cash distribution of $0.11
per unit
• Awarded a new three-year North Sea
shuttle tanker contract of affreightment in
September 2016
• Took delivery of ALP Striker, the first of
four newbuilding towage vessels, in
September 2016
• Total liquidity of $398 million as of
September 30, 2016
*Distributable Cash Flow (DCF) and Cash Flow from Vessel Operations are
non-GAAP measures. Please see Teekay Offshore’s Q3-16 earnings
release for descriptions and reconciliations of these non-GAAP measures. Libra FPSO conversion in progress
44
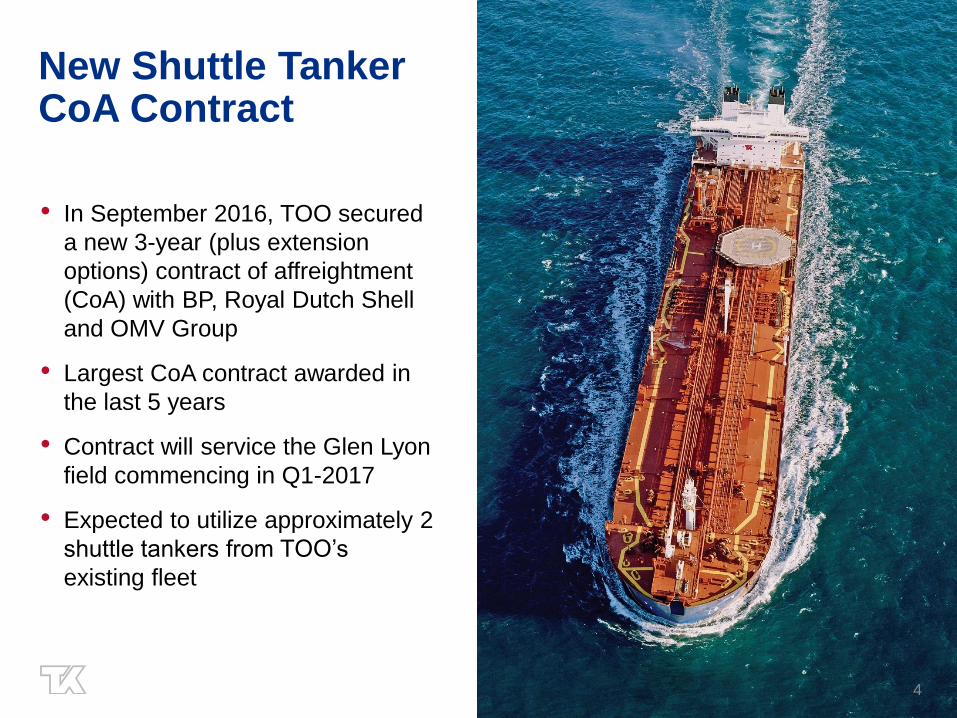
New Shuttle Tanker CoA Contract
• In September 2016, TOO secured
a new 3-year (plus extension
options) contract of affreightment
(CoA) with BP, Royal Dutch Shell
and OMV Group
• Largest CoA contract awarded in
the last 5 years
• Contract will service the Glen Lyon
field commencing in Q1-2017
• Expected to utilize approximately 2
shuttle tankers from TOO’s
existing fleet
5
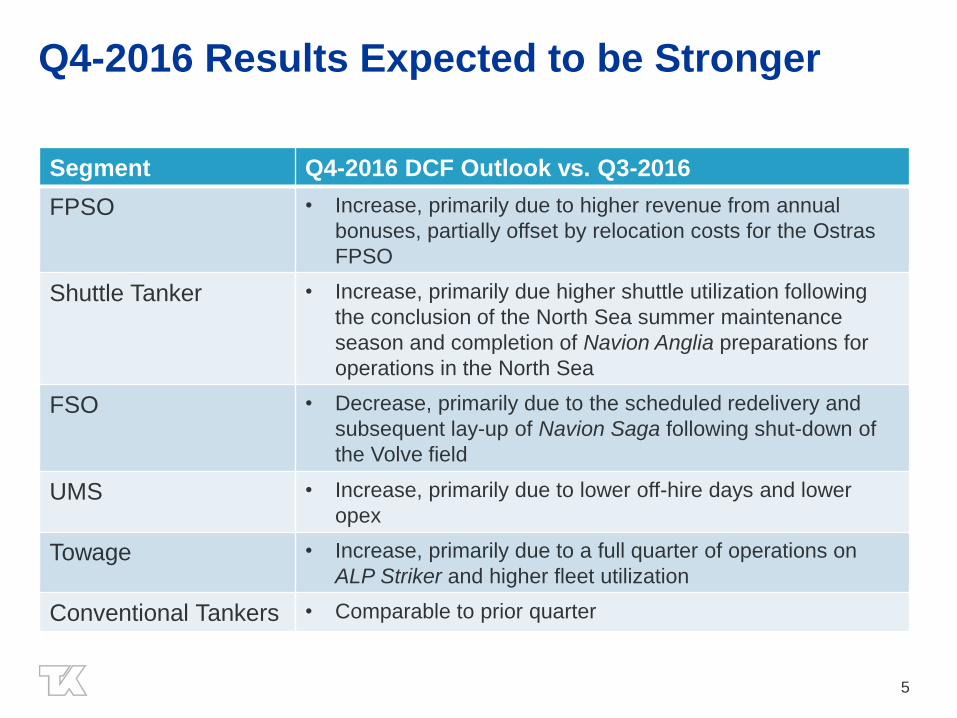
Q4-2016 Results Expected to be Stronger
Segment Q4-2016 DCF Outlook vs. Q3-2016
FPSO • Increase, primarily due to higher revenue from annual
bonuses, partially offset by relocation costs for the Ostras
FPSO
Shuttle Tanker • Increase, primarily due higher shuttle utilization following
the conclusion of the North Sea summer maintenance
season and completion of Navion Anglia preparations for
operations in the North Sea
FSO • Decrease, primarily due to the scheduled redelivery and
subsequent lay-up of Navion Saga following shut-down of
the Volve field
UMS • Increase, primarily due to lower off-hire days and lower
opex
Towage • Increase, primarily due to a full quarter of operations on
ALP Striker and higher fleet utilization
Conventional Tankers • Comparable to prior quarter
6
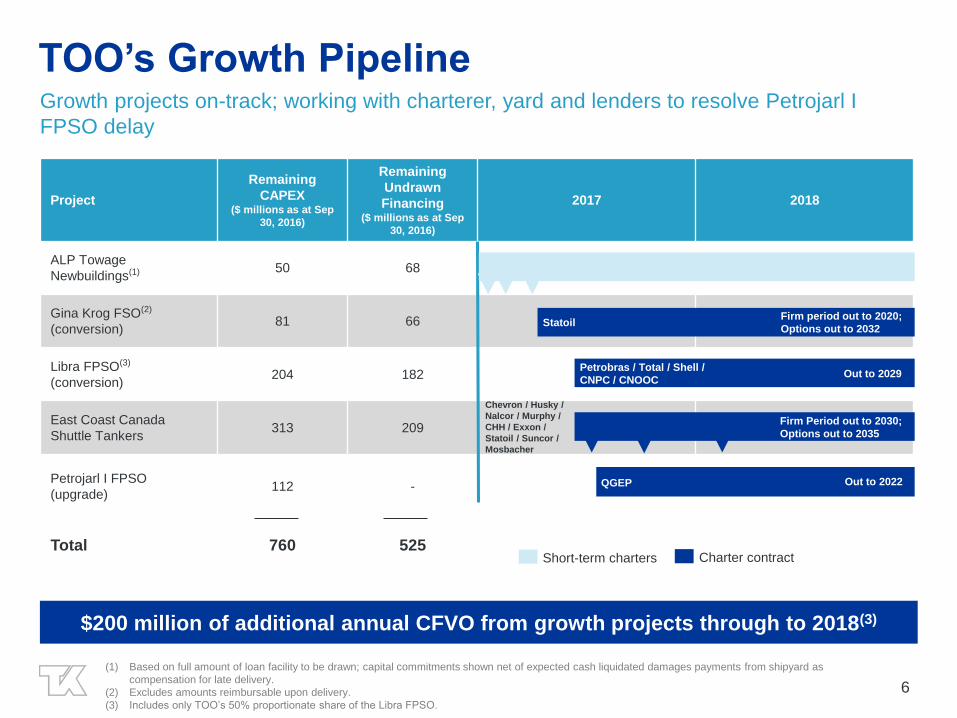
TOO’s Growth PipelineGrowth projects on-track; working with charterer, yard and lenders to resolve Petrojarl I
FPSO delay
Project
Remaining
CAPEX ($ millions as at Sep
30, 2016)
Remaining
Undrawn
Financing($ millions as at Sep
30, 2016)
2017 2018
ALP Towage
Newbuildings(1) 50 68
Gina Krog FSO(2)
(conversion)81 66
Libra FPSO(3)
(conversion)204 182
East Coast Canada
Shuttle Tankers313 209
Petrojarl I FPSO
(upgrade)112 -
Total 760 525
$200 million of additional annual CFVO from growth projects through to 2018(3)
Petrobras / Total / Shell /
CNPC / CNOOCOut to 2029
Charter contract
StatoilFirm period out to 2020;
Options out to 2032
Chevron / Husky /
Nalcor / Murphy /
CHH / Exxon /
Statoil / Suncor /
Mosbacher
Firm Period out to 2030;
Options out to 2035
Short-term charters
QGEP Out to 2022
(1) Based on full amount of loan facility to be drawn; capital commitments shown net of expected cash liquidated damages payments from shipyard as
compensation for late delivery.
(2) Excludes amounts reimbursable upon delivery.
(3) Includes only TOO’s 50% proportionate share of the Libra FPSO.
Appendix
8
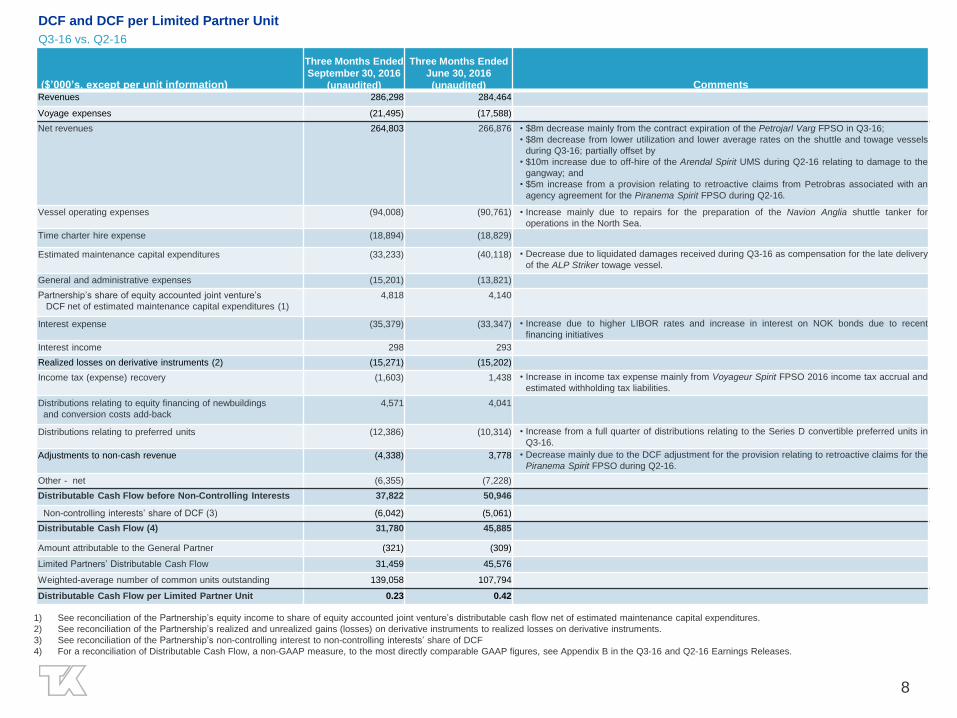
DCF and DCF per Limited Partner Unit
Q3-16 vs. Q2-16
($’000’s, except per unit information)
Three Months Ended
September 30, 2016
(unaudited)
Three Months Ended
June 30, 2016
(unaudited) CommentsRevenues 286,298 284,464
Voyage expenses (21,495) (17,588)
Net revenues 264,803 266,876 • $8m decrease mainly from the contract expiration of the Petrojarl Varg FPSO in Q3-16;
• $8m decrease from lower utilization and lower average rates on the shuttle and towage vessels
during Q3-16; partially offset by
• $10m increase due to off-hire of the Arendal Spirit UMS during Q2-16 relating to damage to the
gangway; and
• $5m increase from a provision relating to retroactive claims from Petrobras associated with an
agency agreement for the Piranema Spirit FPSO during Q2-16.
Vessel operating expenses (94,008) (90,761) • Increase mainly due to repairs for the preparation of the Navion Anglia shuttle tanker for
operations in the North Sea.
Time charter hire expense (18,894) (18,829)
Estimated maintenance capital expenditures (33,233) (40,118) • Decrease due to liquidated damages received during Q3-16 as compensation for the late delivery
of the ALP Striker towage vessel.
General and administrative expenses (15,201) (13,821)
Partnership’s share of equity accounted joint venture’s
DCF net of estimated maintenance capital expenditures (1)
4,818 4,140
Interest expense (35,379) (33,347) • Increase due to higher LIBOR rates and increase in interest on NOK bonds due to recent
financing initiatives
Interest income 298 293
Realized losses on derivative instruments (2) (15,271) (15,202)
Income tax (expense) recovery (1,603) 1,438 • Increase in income tax expense mainly from Voyageur Spirit FPSO 2016 income tax accrual and
estimated withholding tax liabilities.
Distributions relating to equity financing of newbuildings
and conversion costs add-back
4,571 4,041
Distributions relating to preferred units (12,386) (10,314) • Increase from a full quarter of distributions relating to the Series D convertible preferred units in
Q3-16.
Adjustments to non-cash revenue (4,338) 3,778 • Decrease mainly due to the DCF adjustment for the provision relating to retroactive claims for the
Piranema Spirit FPSO during Q2-16.
Other - net (6,355) (7,228)
Distributable Cash Flow before Non-Controlling Interests 37,822 50,946
Non-controlling interests’ share of DCF (3) (6,042) (5,061)
Distributable Cash Flow (4) 31,780 45,885
Amount attributable to the General Partner (321) (309)
Limited Partners’ Distributable Cash Flow 31,459 45,576
Weighted-average number of common units outstanding 139,058 107,794
Distributable Cash Flow per Limited Partner Unit 0.23 0.42
1) See reconciliation of the Partnership’s equity income to share of equity accounted joint venture’s distributable cash flow net of estimated maintenance capital expenditures.
2) See reconciliation of the Partnership’s realized and unrealized gains (losses) on derivative instruments to realized losses on derivative instruments.
3) See reconciliation of the Partnership’s non-controlling interest to non-controlling interests’ share of DCF
4) For a reconciliation of Distributable Cash Flow, a non-GAAP measure, to the most directly comparable GAAP figures, see Appendix B in the Q3-16 and Q2-16 Earnings Releases.
9
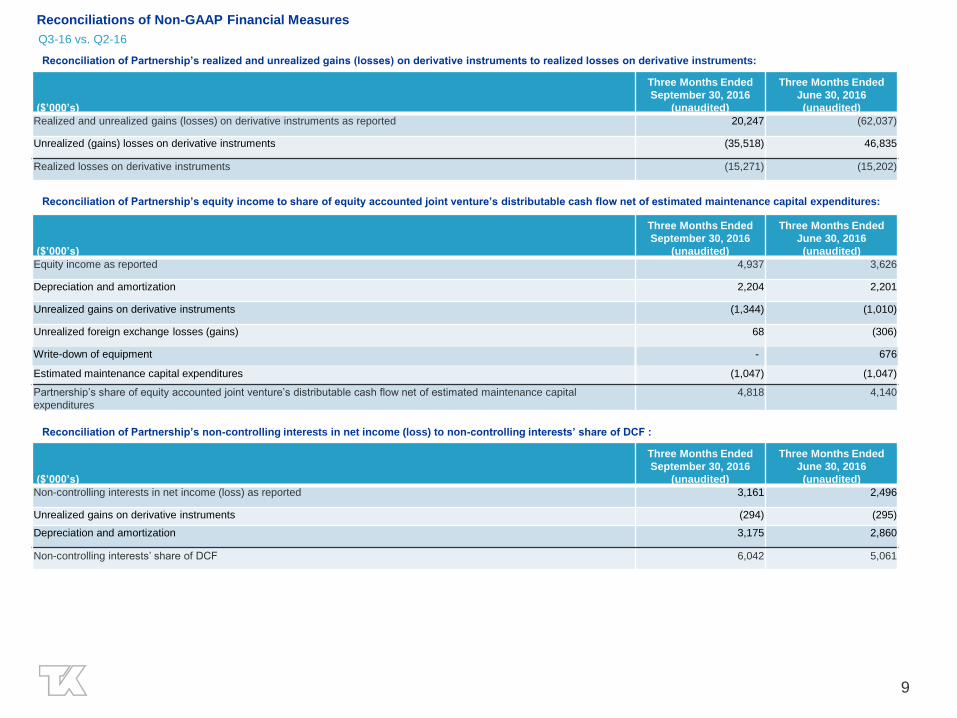
Reconciliations of Non-GAAP Financial Measures
Q3-16 vs. Q2-16
($’000’s)
Three Months Ended
September 30, 2016
(unaudited)
Three Months Ended
June 30, 2016
(unaudited)
Equity income as reported 4,937 3,626
Depreciation and amortization 2,204 2,201
Unrealized gains on derivative instruments (1,344) (1,010)
Unrealized foreign exchange losses (gains) 68 (306)
Write-down of equipment - 676
Estimated maintenance capital expenditures (1,047) (1,047)
Partnership’s share of equity accounted joint venture’s distributable cash flow net of estimated maintenance capital
expenditures
4,818 4,140
Reconciliation of Partnership’s equity income to share of equity accounted joint venture’s distributable cash flow net of estimated maintenance capital expenditures:
Reconciliation of Partnership’s realized and unrealized gains (losses) on derivative instruments to realized losses on derivative instruments:
($’000’s)
Three Months Ended
September 30, 2016
(unaudited)
Three Months Ended
June 30, 2016
(unaudited)
Realized and unrealized gains (losses) on derivative instruments as reported 20,247 (62,037)
Unrealized (gains) losses on derivative instruments (35,518) 46,835
Realized losses on derivative instruments (15,271) (15,202)
Reconciliation of Partnership’s non-controlling interests in net income (loss) to non-controlling interests’ share of DCF :
($’000’s)
Three Months Ended
September 30, 2016
(unaudited)
Three Months Ended
June 30, 2016
(unaudited)
Non-controlling interests in net income (loss) as reported 3,161 2,496
Unrealized gains on derivative instruments (294) (295)
Depreciation and amortization 3,175 2,860
Non-controlling interests’ share of DCF 6,042 5,061
10
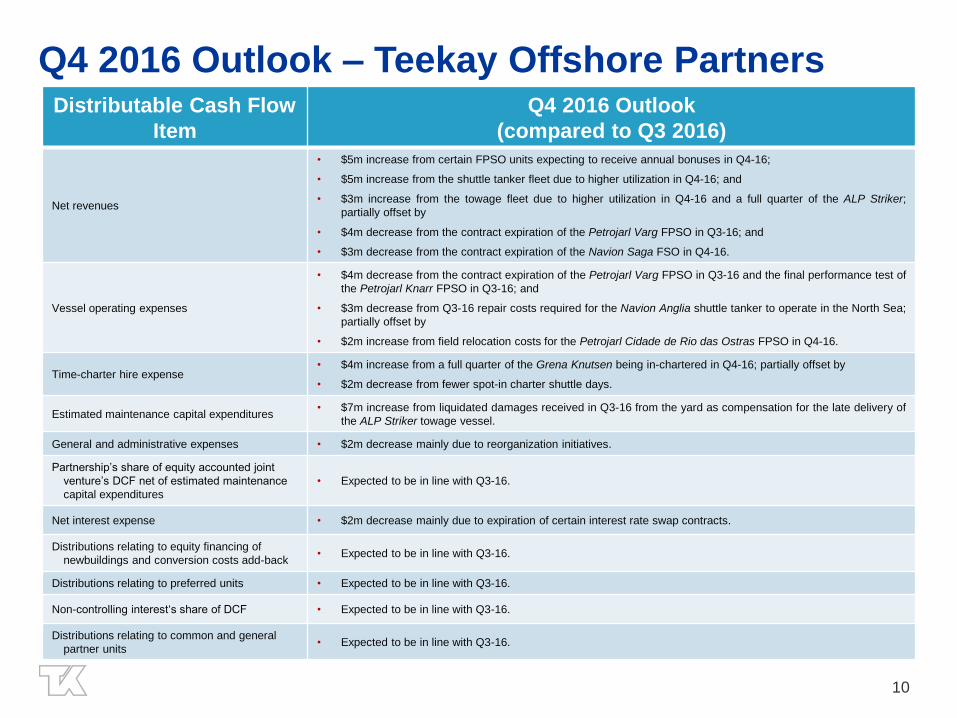
Q4 2016 Outlook – Teekay Offshore PartnersDistributable Cash Flow
Item
Q4 2016 Outlook
(compared to Q3 2016)
Net revenues
• $5m increase from certain FPSO units expecting to receive annual bonuses in Q4-16;
• $5m increase from the shuttle tanker fleet due to higher utilization in Q4-16; and
• $3m increase from the towage fleet due to higher utilization in Q4-16 and a full quarter of the ALP Striker;
partially offset by
• $4m decrease from the contract expiration of the Petrojarl Varg FPSO in Q3-16; and
• $3m decrease from the contract expiration of the Navion Saga FSO in Q4-16.
Vessel operating expenses
• $4m decrease from the contract expiration of the Petrojarl Varg FPSO in Q3-16 and the final performance test of
the Petrojarl Knarr FPSO in Q3-16; and
• $3m decrease from Q3-16 repair costs required for the Navion Anglia shuttle tanker to operate in the North Sea;
partially offset by
• $2m increase from field relocation costs for the Petrojarl Cidade de Rio das Ostras FPSO in Q4-16.
Time-charter hire expense• $4m increase from a full quarter of the Grena Knutsen being in-chartered in Q4-16; partially offset by
• $2m decrease from fewer spot-in charter shuttle days.
Estimated maintenance capital expenditures• $7m increase from liquidated damages received in Q3-16 from the yard as compensation for the late delivery of
the ALP Striker towage vessel.
General and administrative expenses • $2m decrease mainly due to reorganization initiatives.
Partnership’s share of equity accounted joint
venture’s DCF net of estimated maintenance
capital expenditures
• Expected to be in line with Q3-16.
Net interest expense • $2m decrease mainly due to expiration of certain interest rate swap contracts.
Distributions relating to equity financing of
newbuildings and conversion costs add-back • Expected to be in line with Q3-16.
Distributions relating to preferred units • Expected to be in line with Q3-16.
Non-controlling interest‘s share of DCF • Expected to be in line with Q3-16.
Distributions relating to common and general
partner units• Expected to be in line with Q3-16.
11
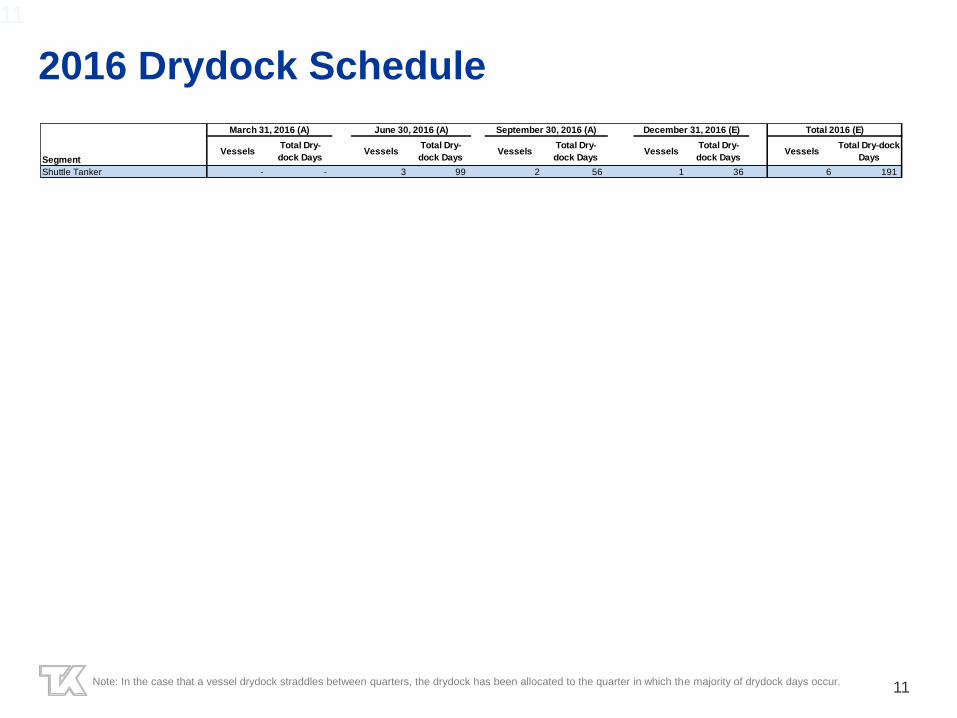
2016 Drydock Schedule
11
Note: In the case that a vessel drydock straddles between quarters, the drydock has been allocated to the quarter in which the majority of drydock days occur.
SegmentVessels
Total Dry-
dock DaysVessels
Total Dry-
dock DaysVessels
Total Dry-
dock DaysVessels
Total Dry-
dock DaysVessels
Total Dry-dock
Days
Shuttle Tanker - - 3 99 2 56 1 36 6 191
March 31, 2016 (A) June 30, 2016 (A) September 30, 2016 (A) December 31, 2016 (E) Total 2016 (E)