teekay lng partners q1-2016 earnings presentation
TRANSCRIPT
TEEKAY LNG PARTNERS Q1-2016 EARNINGS PRESENTATION May 20, 2016
2
Forward Looking Statement
This presentation contains forward-looking statements (as defined in Section 21E of the Securities Exchange Act of 1934,
as amended) which reflect management’s current views with respect to certain future events and performance, including
statements regarding: expected profitability of existing growth projects; the timing of newbuilding vessel deliveries and
project start-up and the commencement of related contracts; the stability and growth of the Partnership’s business and
future cash flows, including the cash flow impact relating to the two MEGI LNG carrier newbuildings commencing charters
to Cheniere during 2016; the percentage of the Partnership’s LNG fleet that is subject to fixed-rate charters in 2016;
fundamentals in the liquefied gas industry; the impact of the long-term plant financing for the Yamal LNG Project on the
financing of the Partnership’s ARC7 Ice-Class LNG carrier newbuildings; the financing of the Partnership’s remaining
newbuildings; and the charter payment deferral on the Partnership’s two 52 percent-owned LNG carriers on charter to the
Yemen LNG project. The following factors are among those that could cause actual results to differ materially from the
forward-looking statements, which involve risks and uncertainties, and that should be considered in evaluating any such
statement: potential shipyard and project construction delays, newbuilding specification changes or cost overruns;
changes in production of LNG or LPG, either generally or in particular regions; changes in trading patterns or timing of
start-up of new LNG liquefaction and regasification projects significantly affecting overall vessel tonnage requirements;
changes in applicable industry laws and regulations and the timing of implementation of new laws and regulations; the
potential for early termination of long-term contracts of existing vessels in the Teekay LNG fleet; the inability of charterers
to make future charter payments; the inability of the Partnership to renew or replace long-term contracts on existing
vessels; factors affecting the outcome of the Partnership’s dispute over the Magellan Spirit; the Partnership’s and the
Partnership’s joint ventures’ ability to raise financing for its existing newbuildings and projects; factors affecting the
resumption of the LNG plant in Yemen; the inability of the Partnership to collect the deferred charter payments from the
Yemen LNG project; and other factors discussed in Teekay LNG Partners’ filings from time to time with the SEC, including
its Report on Form 20-F for the fiscal year ended December 31, 2015. The Partnership expressly disclaims any obligation
to release publicly any updates or revisions to any forward-looking statements contained herein to reflect any change in
the Partnership’s expectations with respect thereto or any change in events, conditions or circumstances on which any
such statement is based.
3
Recent Highlights
1 Distributable cash flow (DCF) is a non-GAAP measure used by certain investors to
measure the financial performance of Teekay LNG and other master limited partnerships. 2 Cash flow from vessel operations (CFVO) is a non-GAAP financial measure used by certain
investors to measure the financial performance of shipping companies.
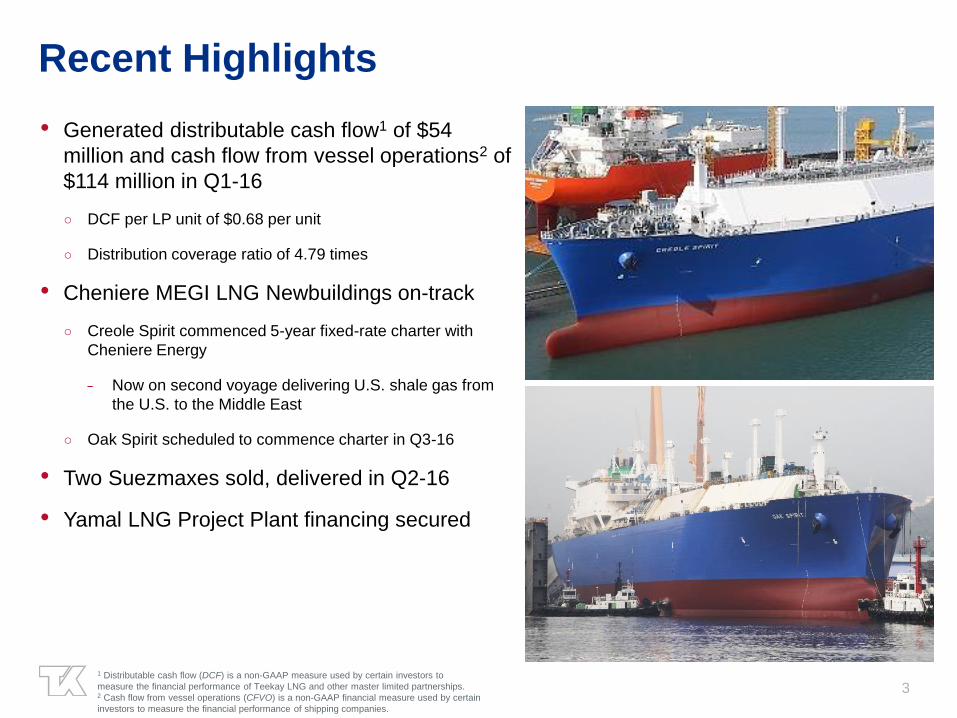
• Generated distributable cash flow1 of $54
million and cash flow from vessel operations2 of
$114 million in Q1-16
○ DCF per LP unit of $0.68 per unit
○ Distribution coverage ratio of 4.79 times
• Cheniere MEGI LNG Newbuildings on-track
○ Creole Spirit commenced 5-year fixed-rate charter with
Cheniere Energy
− Now on second voyage delivering U.S. shale gas from
the U.S. to the Middle East
○ Oak Spirit scheduled to commence charter in Q3-16
• Two Suezmaxes sold, delivered in Q2-16
• Yamal LNG Project Plant financing secured
4
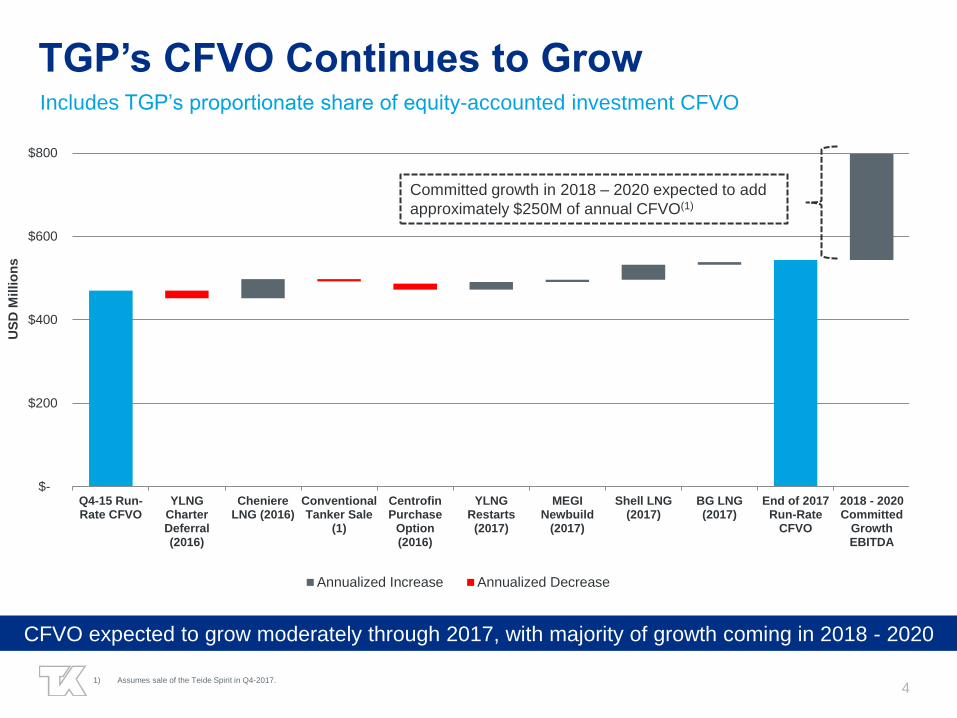
TGP’s CFVO Continues to Grow
$-
$200
$400
$600
$800
Q4-15 Run-Rate CFVO
YLNGCharterDeferral(2016)
CheniereLNG (2016)
ConventionalTanker Sale
(1)
CentrofinPurchase
Option(2016)
YLNGRestarts
(2017)
MEGINewbuild
(2017)
Shell LNG(2017)
BG LNG(2017)
End of 2017Run-Rate
CFVO
2018 - 2020Committed
GrowthEBITDA
US
D M
illio
ns
Annualized Increase Annualized Decrease
Includes TGP’s proportionate share of equity-accounted investment CFVO
Committed growth in 2018 – 2020 expected to add
approximately $250M of annual CFVO(1)
1) Assumes sale of the Teide Spirit in Q4-2017.
CFVO expected to grow moderately through 2017, with majority of growth coming in 2018 - 2020
5
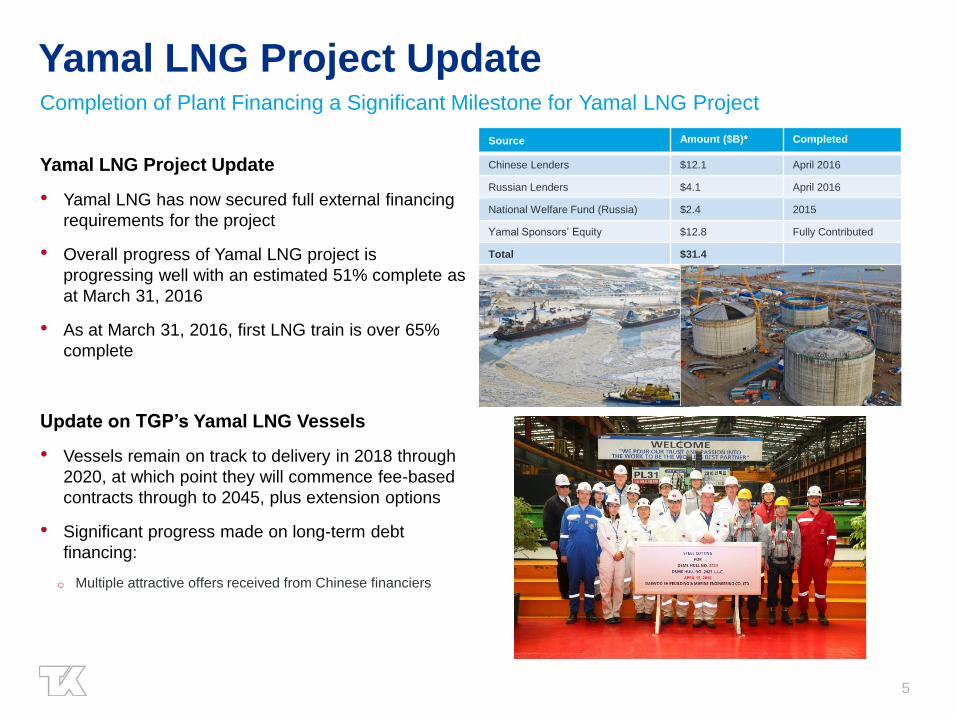
Yamal LNG Project Update Completion of Plant Financing a Significant Milestone for Yamal LNG Project
Yamal LNG Project Update
• Yamal LNG has now secured full external financing
requirements for the project
• Overall progress of Yamal LNG project is
progressing well with an estimated 51% complete as
at March 31, 2016
• As at March 31, 2016, first LNG train is over 65%
complete
Update on TGP’s Yamal LNG Vessels
• Vessels remain on track to delivery in 2018 through
2020, at which point they will commence fee-based
contracts through to 2045, plus extension options
• Significant progress made on long-term debt
financing:
o Multiple attractive offers received from Chinese financiers
Source Amount ($B)* Completed
Chinese Lenders $12.1 April 2016
Russian Lenders $4.1 April 2016
National Welfare Fund (Russia) $2.4 2015
Yamal Sponsors’ Equity $12.8 Fully Contributed
Total $31.4
6
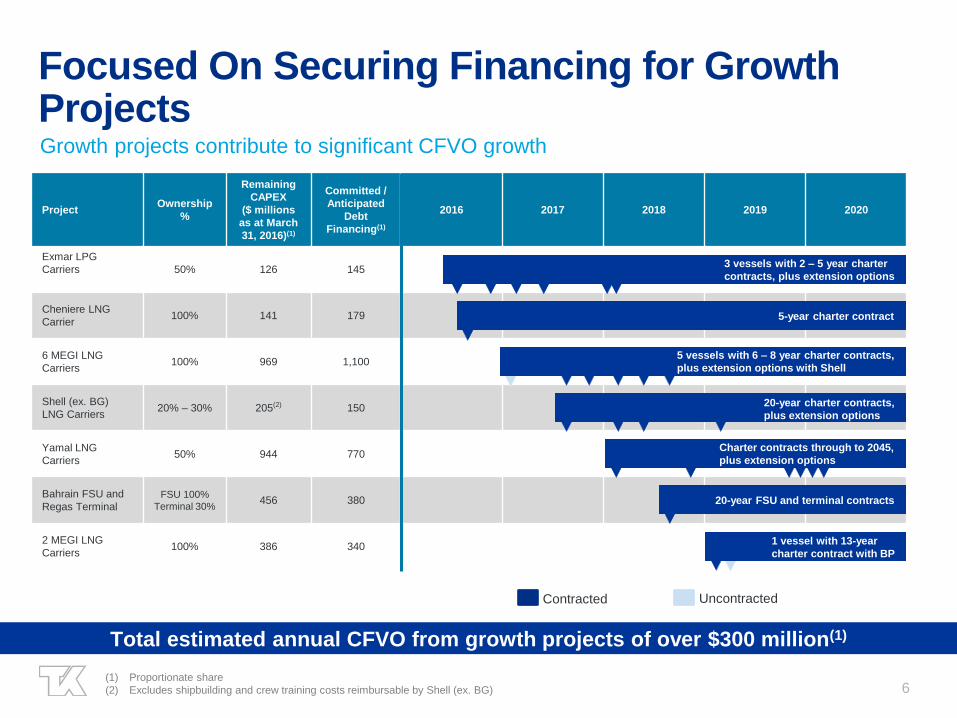
Focused On Securing Financing for Growth Projects Growth projects contribute to significant CFVO growth
Project Ownership
%
Remaining
CAPEX
($ millions
as at March
31, 2016)(1)
Committed /
Anticipated
Debt
Financing(1)
2016 2017 2018 2019 2020
Exmar LPG
Carriers
50% 126 145
Cheniere LNG
Carrier 100% 141 179
6 MEGI LNG
Carriers 100% 969 1,100
Shell (ex. BG)
LNG Carriers 20% – 30% 205(2) 150
Yamal LNG
Carriers 50% 944 770
Bahrain FSU and
Regas Terminal FSU 100%
Terminal 30% 456 380
2 MEGI LNG
Carriers 100% 386 340
Total estimated annual CFVO from growth projects of over $300 million(1)
(1) Proportionate share
(2) Excludes shipbuilding and crew training costs reimbursable by Shell (ex. BG)
3 vessels with 2 – 5 year charter
contracts, plus extension options
5-year charter contract
20-year charter contracts,
plus extension options
20-year FSU and terminal contracts
Charter contracts through to 2045,
plus extension options
Uncontracted Contracted
5 vessels with 6 – 8 year charter contracts,
plus extension options with Shell
1 vessel with 13-year
charter contract with BP
7
Appendix
8
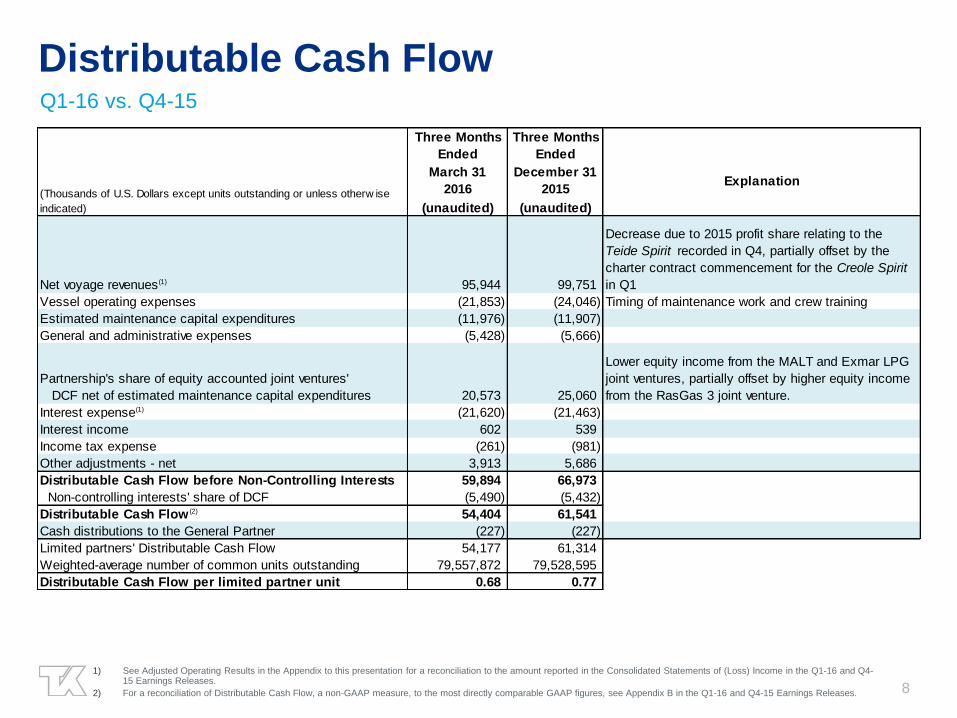
Distributable Cash Flow Q1-16 vs. Q4-15
1) See Adjusted Operating Results in the Appendix to this presentation for a reconciliation to the amount reported in the Consolidated Statements of (Loss) Income in the Q1-16 and Q4-15 Earnings Releases.
2) For a reconciliation of Distributable Cash Flow, a non-GAAP measure, to the most directly comparable GAAP figures, see Appendix B in the Q1-16 and Q4-15 Earnings Releases.
Three Months Three Months
Ended Ended
March 31
2016
December 31
2015Explanation
(unaudited) (unaudited)
Net voyage revenues(1) 95,944 99,751
Decrease due to 2015 profit share relating to the
Teide Spirit recorded in Q4, partially offset by the
charter contract commencement for the Creole Spirit
in Q1
Vessel operating expenses (21,853) (24,046) Timing of maintenance work and crew training
Estimated maintenance capital expenditures (11,976) (11,907)
General and administrative expenses (5,428) (5,666)
Partnership's share of equity accounted joint ventures'
DCF net of estimated maintenance capital expenditures 20,573 25,060
Lower equity income from the MALT and Exmar LPG
joint ventures, partially offset by higher equity income
from the RasGas 3 joint venture.
Interest expense(1) (21,620) (21,463)
Interest income 602 539
Income tax expense (261) (981)
Other adjustments - net 3,913 5,686
Distributable Cash Flow before Non-Controlling Interests 59,894 66,973
Non-controlling interests' share of DCF (5,490) (5,432)
Distributable Cash Flow (2) 54,404 61,541
Cash distributions to the General Partner (227) (227)
Limited partners' Distributable Cash Flow 54,177 61,314
Weighted-average number of common units outstanding 79,557,872 79,528,595
Distributable Cash Flow per limited partner unit 0.68 0.77
(Thousands of U.S. Dollars except units outstanding or unless otherw ise
indicated)
9
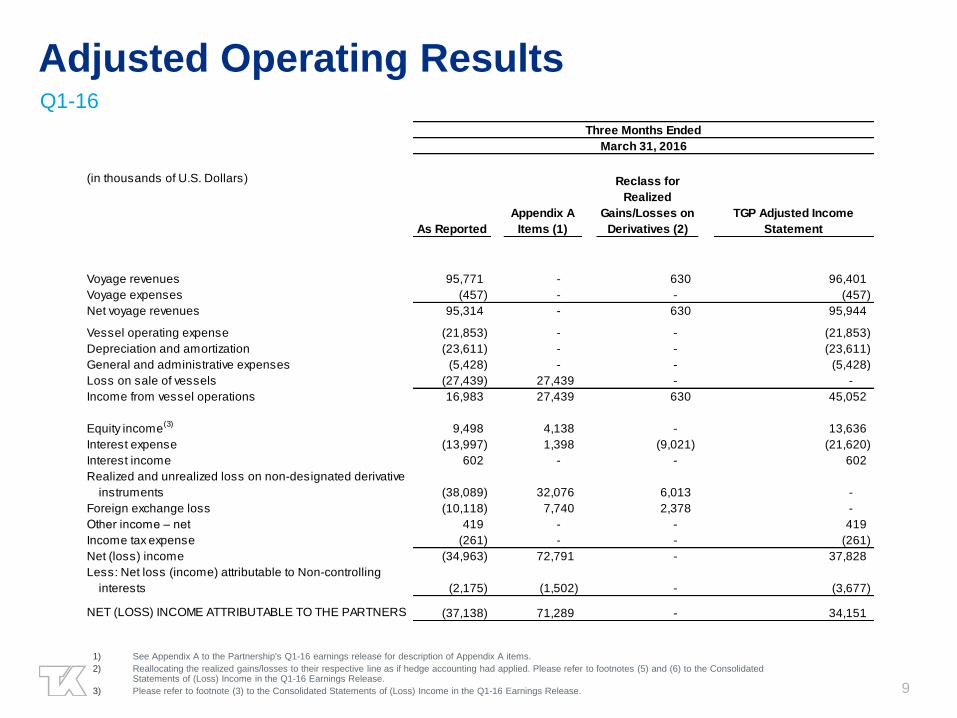
Adjusted Operating Results Q1-16
1) See Appendix A to the Partnership's Q1-16 earnings release for description of Appendix A items.
2) Reallocating the realized gains/losses to their respective line as if hedge accounting had applied. Please refer to footnotes (5) and (6) to the Consolidated Statements of (Loss) Income in the Q1-16 Earnings Release.
3) Please refer to footnote (3) to the Consolidated Statements of (Loss) Income in the Q1-16 Earnings Release.
(in thousands of U.S. Dollars)
Voyage revenues 95,771 - 630 96,401
Voyage expenses (457) - - (457)
Net voyage revenues 95,314 - 630 95,944
Vessel operating expense (21,853) - - (21,853)
Depreciation and amortization (23,611) - - (23,611)
General and administrative expenses (5,428) - - (5,428)
Loss on sale of vessels (27,439) 27,439 - -
Income from vessel operations 16,983 27,439 630 45,052
Equity income(3)
9,498 4,138 - 13,636
Interest expense (13,997) 1,398 (9,021) (21,620)
Interest income 602 - - 602
Realized and unrealized loss on non-designated derivative
instruments (38,089) 32,076 6,013 -
Foreign exchange loss (10,118) 7,740 2,378 -
Other income – net 419 - - 419
Income tax expense (261) - - (261)
Net (loss) income (34,963) 72,791 - 37,828
Less: Net loss (income) attributable to Non-controlling
interests (2,175) (1,502) - (3,677)
NET (LOSS) INCOME ATTRIBUTABLE TO THE PARTNERS (37,138) 71,289 - 34,151
Three Months Ended
March 31, 2016
As Reported
Appendix A
Items (1)
Reclass for
Realized
Gains/Losses on
Derivatives (2)
TGP Adjusted Income
Statement
10
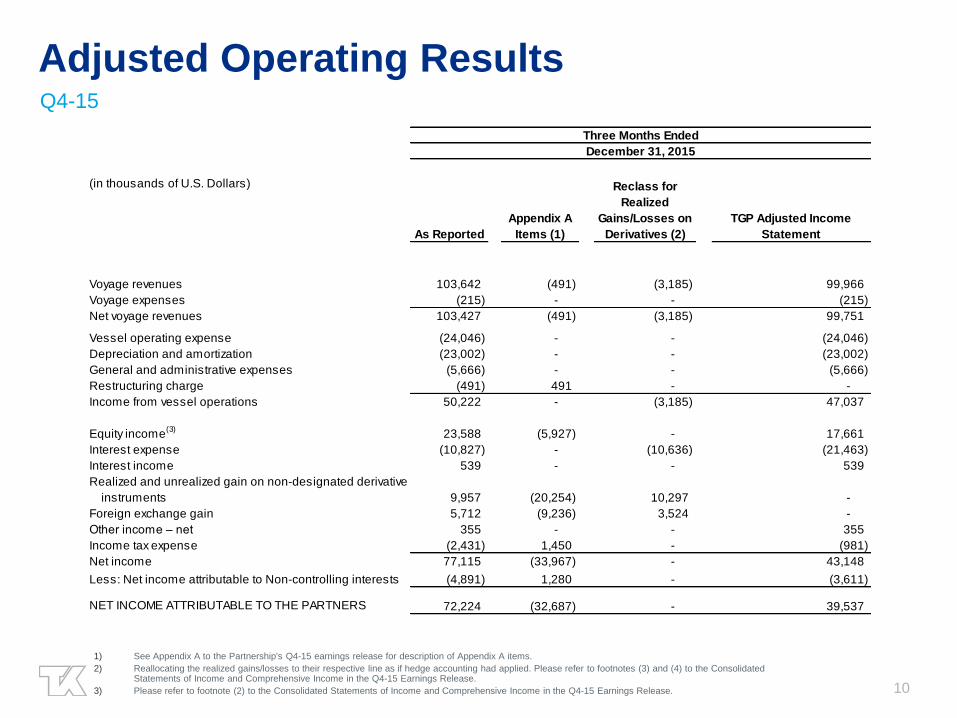
Adjusted Operating Results Q4-15
1) See Appendix A to the Partnership's Q4-15 earnings release for description of Appendix A items.
2) Reallocating the realized gains/losses to their respective line as if hedge accounting had applied. Please refer to footnotes (3) and (4) to the Consolidated Statements of Income and Comprehensive Income in the Q4-15 Earnings Release.
3) Please refer to footnote (2) to the Consolidated Statements of Income and Comprehensive Income in the Q4-15 Earnings Release.
(in thousands of U.S. Dollars)
Voyage revenues 103,642 (491) (3,185) 99,966
Voyage expenses (215) - - (215)
Net voyage revenues 103,427 (491) (3,185) 99,751
Vessel operating expense (24,046) - - (24,046)
Depreciation and amortization (23,002) - - (23,002)
General and administrative expenses (5,666) - - (5,666)
Restructuring charge (491) 491 - -
Income from vessel operations 50,222 - (3,185) 47,037
Equity income(3)
23,588 (5,927) - 17,661
Interest expense (10,827) - (10,636) (21,463)
Interest income 539 - - 539
Realized and unrealized gain on non-designated derivative
instruments 9,957 (20,254) 10,297 -
Foreign exchange gain 5,712 (9,236) 3,524 -
Other income – net 355 - - 355
Income tax expense (2,431) 1,450 - (981)
Net income 77,115 (33,967) - 43,148
Less: Net income attributable to Non-controlling interests (4,891) 1,280 - (3,611)
NET INCOME ATTRIBUTABLE TO THE PARTNERS 72,224 (32,687) - 39,537
Three Months Ended
December 31, 2015
As Reported
Appendix A
Items (1)
Reclass for
Realized
Gains/Losses on
Derivatives (2)
TGP Adjusted Income
Statement
11
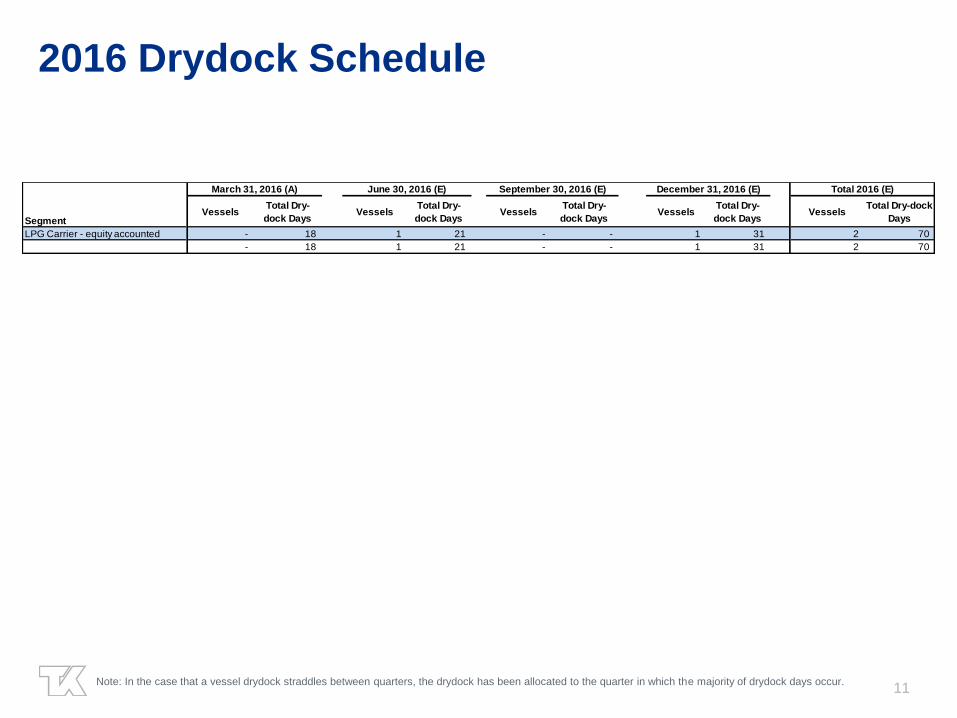
2016 Drydock Schedule
Note: In the case that a vessel drydock straddles between quarters, the drydock has been allocated to the quarter in which the majority of drydock days occur.
SegmentVessels
Total Dry-
dock DaysVessels
Total Dry-
dock DaysVessels
Total Dry-
dock DaysVessels
Total Dry-
dock DaysVessels
Total Dry-dock
Days
LPG Carrier - equity accounted - 18 1 21 - - 1 31 2 70
- 18 1 21 - - 1 31 2 70
March 31, 2016 (A) June 30, 2016 (E) September 30, 2016 (E) December 31, 2016 (E) Total 2016 (E)
12