t.e.e.g.s transportation, emergency, and environmental gis services matt smith project manager...
TRANSCRIPT

T.E.E.G.STransportation, Emergency, and
Environmental GIS ServicesMatt SmithProject Manager
Lauren BenderGIS Analyst
Amanda MageraGIS Analyst
Aaron GoreGIS Analyst
Rank-Ordering Proactive Tree Maintenance for Emergency Response
Routing for the City of Austin Urban Forestry Program
Austin Parks and Recreation Department
The City of Austin Parks and Recreation Department wishes to be proactive and not reactive in the identification and subsequent removal of potential tree hazards from the city of Austin’s roadways. The identification and removal of potential tree hazards will help optimize the cities tree removal services and clear potential hazards for emergency service vehicles.

Purpose
Generate a comprehensive tree hazard inventory
A ranking system will be used to highlight areas with the greatest threat potential in order to prioritize preventative tree maintenance
T.E.E.G.S. will accomplish this by utilizing a GIS to analyze the existing tree shade index and identifying areas of high tree density which intersect or overlay with emergency service routes
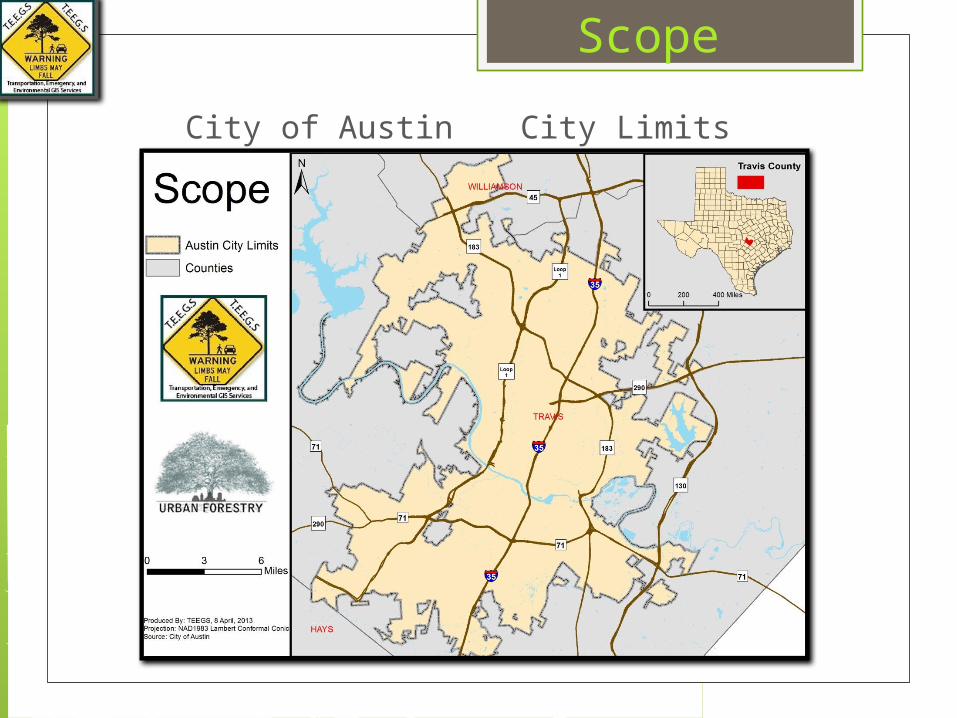
Scope
City of Austin City Limits

Data
Data Created by TEEGS
Layer Source
Emergency Service Locations (Points of Origin) Google Earth
Destination Points Google Earth
Top 150 Population Points Census Bureau Census Blocks
Road Network City of Austin Streets Layer
Street Polygons City of Austin Streets Layer
Street Analysis City of Austin Streets Layer and Street Polygon Layer
Data Obtained by TEEGS
Layer Source
Streets City of Austin
Hospitals City of Austin
Parks and Hydrology City of Austin
Tree Canopy Cover Urban Forestry Program
Austin City Limits CAPCOG
Travis County CAPCOG
Census Blocks Census Bureau

Methodology Identify APD, AFD, EMS, and
Schools Google: “what’s here” Project latitude and longitude coordinates
Create Emergency Services Layer Merge APD, AFD, and EMS 67 total
Identify Population Points Census Blocks with 2.5 miles of city limits Block Centroid Top 150 points within City Limits (top 1%)
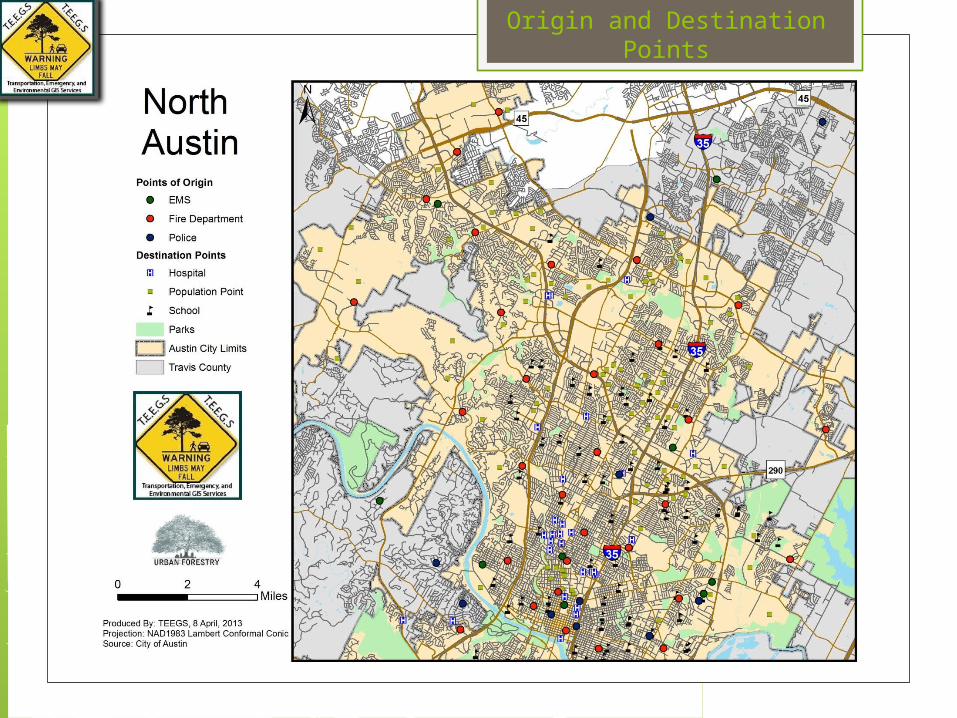
Origin and DestinationPoints

Origin and DestinationPoints
Methodology
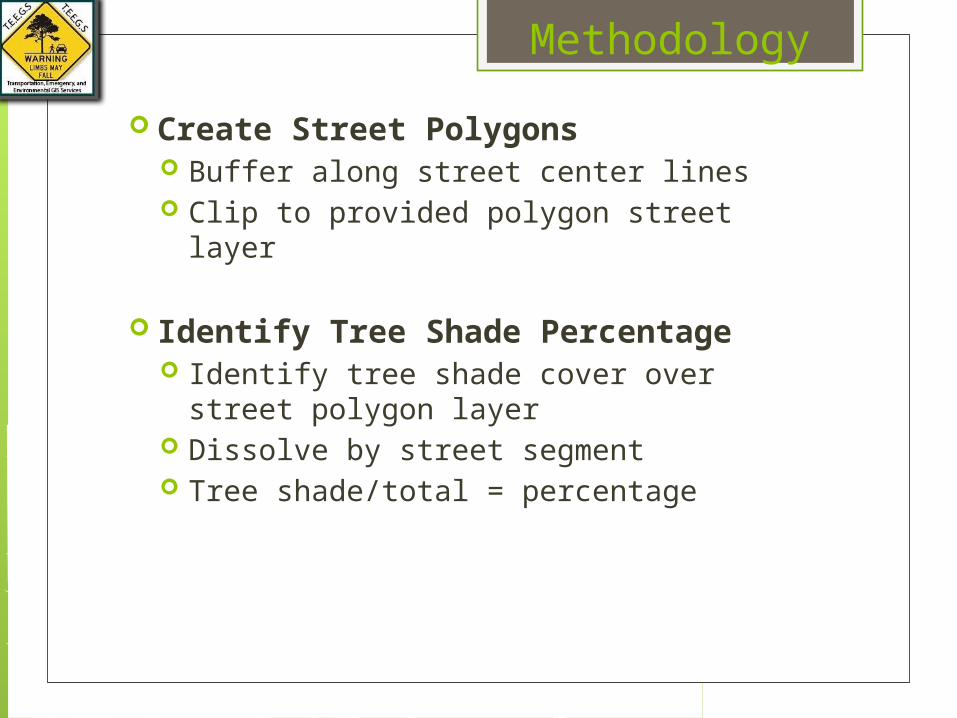
Create Street Polygons Buffer along street center lines Clip to provided polygon street layer
Identify Tree Shade Percentage Identify tree shade cover over street
polygon layer Dissolve by street segment Tree shade/total = percentage
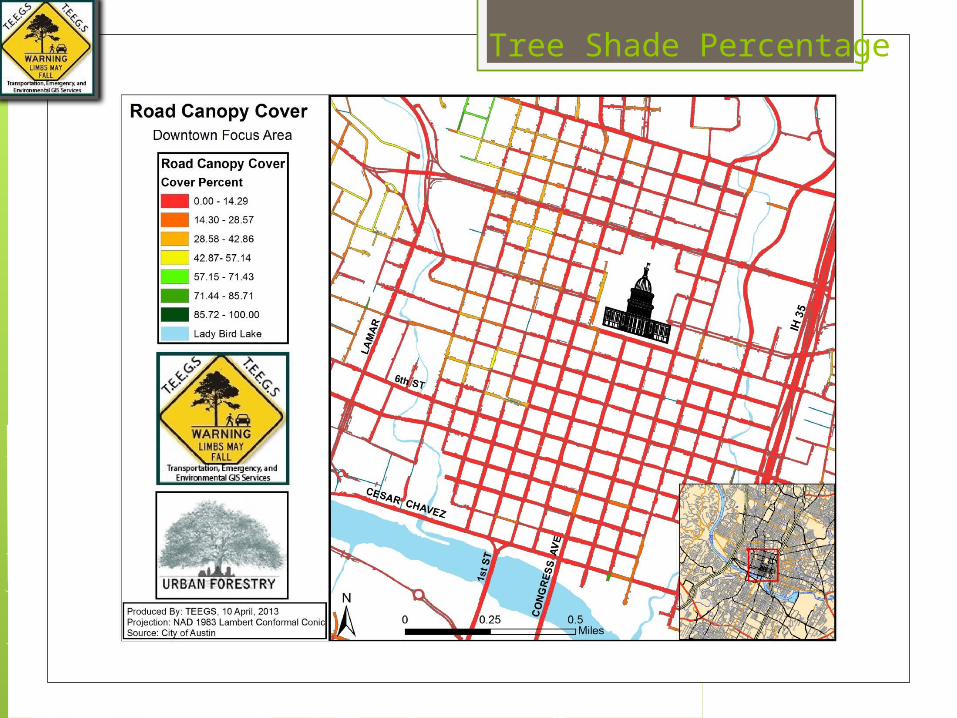
Tree Shade Percentage

Tree Shade Percentage

Methodology
Create Destination Layer Merge population points, schools, and hospitals
Schools were used as a secondary population measure
Create Emergency Service Route Frequency Layer Point to Point route (model) Turn into feature Merge all routes Run frequency by segment Join to streets layer
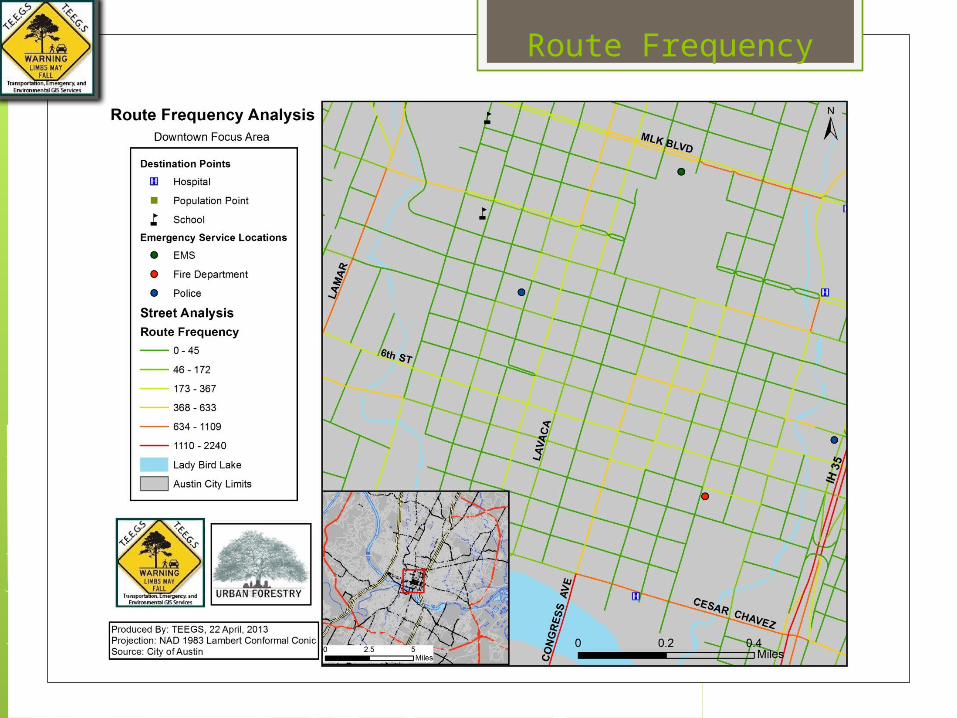
Route Frequency

Route Frequency

Methodology Create Final Ranking Analysis Layer
Join tree shade layer to road network with Emergency Services Frequency
Multiply frequency by canopy cover percentage
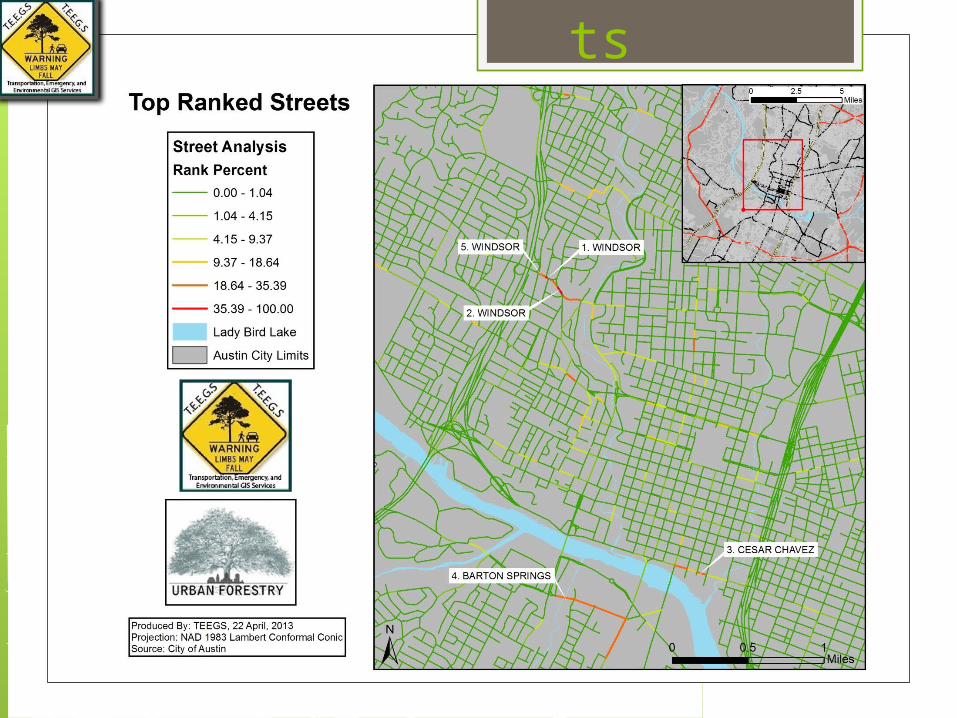
Rank by output Top 5 segments labeled as most critical
Create Relative Ranking Multiplied the frequency and the canopy
cover Divided that by the highest final score Then multiplied by 100

Results

Results

Results After completing our analysis we were returned with
very interesting results.
Many road segments returned very little or no Relative
Rank.
Our findings were largely concentrated in 3 particular
areas in Austin. These areas included;
1. The Shoal Creek Area
This area is located in the area around Shoal Creek between
Enfield and 24th Street.
It contains 7 of our top 25 road segments, as well as 5 of
our top 7.
Windsor Road is the most critical part of this area; this road
contains the 1st, 2nd, and 5th highest ranked segments in
Austin.

Results
Results2. Barton Springs and South 1st Street
This area is located just east of S. Lamar
Boulevard and continues uninterrupted on
Barton Springs until it’s intersection with
South 1st Street, continuing south from here
until the Texas School for the Deaf.
This area includes the 4th highest ranked
road segment in Austin, as well as 3
additional road segments all returning a
relative rank of at least 22.
Results

Results
3. Downtown and the University of Texas
The area of Cesar Chavez located between
Congress and Trinity contains our 3rd highest
ranked road segment. In addition to this it has 3
highly ranked segments on Cesar Chavez as well as
Congress.
Further north of here on Guadalupe (the Drag)
there is another concentration of highly ranked
road segments.

Results

Implications
City of Austin Urban Forestry Program will be able to identify which road segments pose the greatest threat to the smooth operation of emergency service responses
The city can create a schedule of tree maintenance

Implications
The ranking system created through this project can be used to prioritize streets for clearing in order to allow emergency services to perform rescue services in the aftermath of a large storm
The Route Frequency data can also be used with updated tree shade data to update the ranking systems

Implications Other cities can use this project as a
model for similar studies in their own community.
A similar ranking system can help other cities to mitigate the hazards associated with a green city
A similar project may also be a way to support a plan for more tree planting in the city
Questions