teck chair in exploration geophysics - university of · pdf filecontact: bernd milkereit...
TRANSCRIPT
Contact: Bernd Milkereit Phone: 416-978-2466 Email: [email protected]
Teck Chair in Exploration Geophysics
Annual Activity Report 2014/2015
2
Direction of Research Seismic imaging of high impedance mineral and gas hydrate deposits Applying conventional seismic exploration techniques to image gas hydrate accumulations or deep mineral deposits poses a problem: seismic wave scattering caused by strong local contrasts in physical rock properties. Massive sulfides exhibit variable compressional and shear wave velocities but density contrasts often exceed 50%. Gas hydrate accumulations are characterized by high compressional and shear wave contrasts (up to 100%), highly variable attenuation (Q-factor) and no significant density contrasts. Modeling studies of such local high impedance (velocity-density product) contrasts require accurate 3D geological/petrophysical models consistent with all available borehole geophysical, geological and structural data. When strong local contrasts in physical rock properties are present, seismic waves are scattered by the inhomogeneities. Two effects can be observed: the attenuation of the transmitted (direct) wave, the excitation of seismic coda (due to P-S wave conversion). Robust modeling capabilities of strong seismic impedance contrasts are important for a better understanding of wave propagation effects in small scale structures. 3D elastic/visco-elastic modeling of high impedance exploration targets (massive sulfides and gas hydrates) revealed that local high impedance exploration targets (massive sulfides and gas hydrates) revealed that local high impedance contrasts lead to strong and complex scattering responses, often dominated by converted shear waves. In addition, amplitude focusing caused by the shape of the deposit (scale factors) will lead to pronounced amplitude versus offset/azimuth trends. Thus seismic data acquisition geometries and source frequencies must be carefully selected in order to observe characteristic amplitude and phase variations. If observed, the scattering response may serve as a diagnostic tool to classify the composition of the seismic exploration target. The 3D earth/exploration models are based on full waveform sonic and density logs, VSP, 2D/3D seismic data and extensive drill hole data bases from some of the largest massive sulfide and gas hydrate deposits on earth (the Red Dog Zn-Pb deposit in Alaska, Ni-Cu deposits at Thompson and Sudbury, Uranium deposits in the Athabasca Basin, gold deposits in Abitibi (Quebec), and gas hydrate accumulations in the Mackenzie Delta (NWT).
3
Collaborative Research Projects
Acknowledgement – Research Supports In 2013-2014, research grants were provided by NSERC (Natural Sciences and Engineering Research Council of Canada), CEMI (Center for Excellence in Mining Innovation) for evaluation of geophysical monitoring tools and techniques in deep mines (the SUMIT ORF project).
Rock Mass Characterization and Monitoring (SUMIT: Smart Underground Monitoring and Integrated Technologies for Deep Mining Project) A collaborative ORF proposal (SUMIT) was submitted by Laurentian University, University of Toronto and Queen’s University for the integration of novel technology into the mineral resource extraction process. The SUMIT project develops data collection, information and energy management strategies, control systems and smart engineering techniques to assist in reducing risks at deep underground mines.
These collaborative interdisciplinary research teams are addressing many of the barriers currently delaying the establishment of new mines and the deepening of existing mines. These outstanding teams are helping to develop new ways to mitigate and manage risks, accelerate mine development and reduce energy consumption by: capturing and sharing data in innovative ways from underground environments to optimize deep underground mine design and construction techniques and also developing communications hardware/software, data storage, security and sharing control systems and related technologies.
The NSERC-CRD “Integrated multi-parameter footprints of ore systems: The
next generation of ore deposit models” will provide the experimental and computational framework for advances in exploration geophysics and petrophysical studies of large Copper, Uranium and Gold deposits in Canada (a 5 year project: 2013-2018).
Mineral exploration in Canada is increasingly focused on concealed and
deeply buried targets, requiring more effective tools to detect large-scale ore-forming systems and to vector from their most distal margins to their high-grade cores. This network has been formed to aid the mining industry in discovering the next generation of mineral deposits. The network includes 42 researchers from 24 universities across Canada and 45 industry collaborators from 27 mining, mineral exploration, and mineral exploration service companies, with initial funding of ~$13m cash and in-kind support from the Canada Mining Innovation Council and the Collaborative Research and Development Program of the Natural Sciences and Engineering Research

4
Council of Canada. Phase I of the first project will establish the linkages between different kinds of geological, mineralogical, geochemical, and geophysical data at three of Canada's most important ore deposit types to discover new combinations of measurable parameters that define the footprints of ore systems.
Locations:
We combine the development of new geophysical exploration technology/methodology with the drilling projects conducted by industry (mineral exploration in Canada) or International Continental Drilling Projects ICDP) (gas hydrates, impact craters and hydrothermal systems). Ongoing research projects focus on unique pressure-temperature conditions related to meteorite impacts (Bosumtwi, Ghana; Chicxulub, Mexico; Sudbury & Wanapitei, Canada; Monturaqui, Chile), the physical properties of permafrost and gas hydrates (Mackenzie Delta, Canada) and 3D seismic research projects for deep mineral exploration (Ontario, Quebec, New Brunswick, Alaska, Ireland and Athabasca Basin) (Figure 1).
L
M
NO
P

5
Figure 1: Location map of past, current and future scientific drilling projects, seismic and borehole geophysical studies conducted between 2003 and 2015.
Location Project
A Malik, NWT, Canada Permafrost & Gashydrate studies 3D seismic imaging
B Athabasca Basin, Canada Borehole Geophysics MacArthur River Mines
C Chicxulub, Mexico Hydrothermal System Meteorite Impact
D Monturaqui Impact Crater, Chile Geophysics and Geology
E Bosumtwi, Ghana Scientific Drilling Hydrothermal System Meteorite Impact
F Bathurst Mining Camp, NB, Canada Physical Rock Properties of Massive Sulfides
G Sudbury, Ontario, Canada Meteorite Impact Physical Rock Properties Borehole Geophysics
H Outokumpo, Finland Physical Rock Properties Scientific Drilling
I Val d’Or, Quebec, Canada 3D Seismic Imaging, borehole geophysics
J Thompson, Manitoba Petrophysics 3D Seismic Drilling
K Mjoeinir Meteorite Impact, Barent Sea, Norway Scientific Drilling
L Perth, Western Australia Groundwater exploration
M Alaska, USA Physical rock properties; Seismic Imaging for Mineral exploration
N Ireland Physical rock properties; Seismic Imaging for Mineral exploration
O Athabasca Basin Borehole Geophysics. Vertical seismic profiling (VSP) Mineral Exploration. 3D-3C Seismic Imaging
P Malartic Quebec 3D Borehole DC/IP Imaging

6
Current Research Projects
Simulation of Seismic Wave Propagation in a Deep Mine (Saleh et al., 2015) Understanding the propagation of seismic waves in deep mines in a presence of very strong elastic contrasts, such as topography, tunnels and ore-bodies is still a challenge. For engineering purposes, amplitudes and travel times of seismic events are critical parameters that have to be determined at various locations in a mine. These parameters are useful in preparing risk maps or to better understand the process of spatial and temporal stress distributions in a mine. Simple constant velocity models used for mine monitoring, cannot explain the observed complexities in scattered seismic waves. In hard-rock environments modeling of elastic seismic wavefield require detailed 3D petrophysical, infrastructure and topographical data to simulate the propagation of seismic wave with a frequencies up to few kilohertz. In this study, the effects of strong elastic contrasts on the propagation of seismic waves will be illustrated using 2D/3D finite difference method.
Figure 2: Geological 3D used mine model including ore bodies (yellow and grey), tunnels (brown) and stopes (red). Black cubes show 3D distribution of 3C geophones at the mine.
7
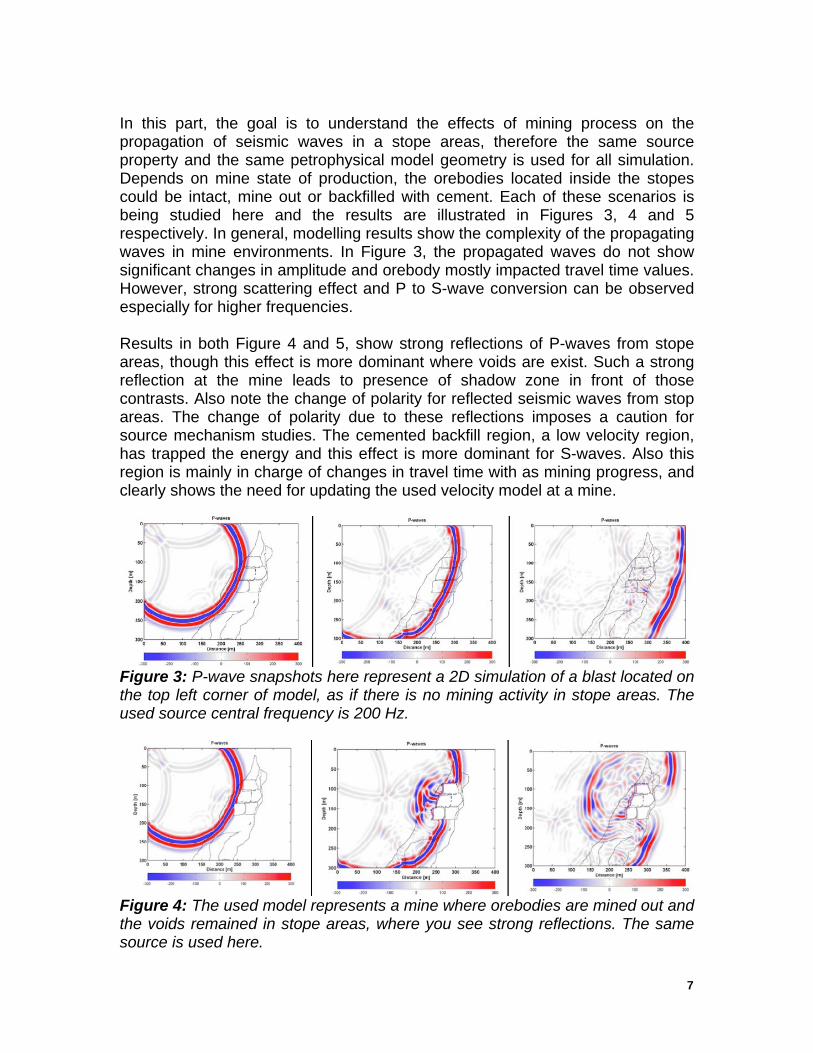
In this part, the goal is to understand the effects of mining process on the propagation of seismic waves in a stope areas, therefore the same source property and the same petrophysical model geometry is used for all simulation. Depends on mine state of production, the orebodies located inside the stopes could be intact, mine out or backfilled with cement. Each of these scenarios is being studied here and the results are illustrated in Figures 3, 4 and 5 respectively. In general, modelling results show the complexity of the propagating waves in mine environments. In Figure 3, the propagated waves do not show significant changes in amplitude and orebody mostly impacted travel time values. However, strong scattering effect and P to S-wave conversion can be observed especially for higher frequencies. Results in both Figure 4 and 5, show strong reflections of P-waves from stope areas, though this effect is more dominant where voids are exist. Such a strong reflection at the mine leads to presence of shadow zone in front of those contrasts. Also note the change of polarity for reflected seismic waves from stop areas. The change of polarity due to these reflections imposes a caution for source mechanism studies. The cemented backfill region, a low velocity region, has trapped the energy and this effect is more dominant for S-waves. Also this region is mainly in charge of changes in travel time with as mining progress, and clearly shows the need for updating the used velocity model at a mine.
Figure 3: P-wave snapshots here represent a 2D simulation of a blast located on the top left corner of model, as if there is no mining activity in stope areas. The used source central frequency is 200 Hz.
Figure 4: The used model represents a mine where orebodies are mined out and the voids remained in stope areas, where you see strong reflections. The same source is used here.

8
Figure 5: Snapshots represent a mine model after orebodies are mined out and voids cemented backfilled. Backfilled areas are very low velocity contrast, which results in strong reflection and significant travel time changes.

9
Towards Modelling Elastic and Viscoelastic Seismic Wave Propagation in Boreholes (Wang et al., 2014) We are studying elastic seismic wave propagation in shallow marine and fluid-filled borehole settings. Body waves and Stoneley waves are controlled by strong contrasts in physical properties - in particular, the S wave velocities in elastic formation. In addition, location of sensors within the fluid layer, at the interface or within the elastic formation controls measured amplitude and phase of the seismic wave field. To study these effects, we propagate the wave field using Finite Difference (FD) methods. Using divergent and curl operations on the displacement wave field, we can separate and identify Stoneley wave, P and S wave arrivals. In water-filled boreholes strong parameter contrasts exist between the fluid and elastic formations. For sensors placed in the water column we obtain weak S wave and Stoneley wave’s velocity is around 1780 m/s in hard formations and 611 m/s in soft. FD snapshots Fig 6 show div and curl components at around 400 ms. Since S wave velocity in formation is larger than P wave velocity in water, Pseudo-Rayleigh and head P waves are received when geophones are placed on the boundary, as indicated in Fig 6(a). The wavelengths of P head wave and P body wave indicates strong velocity constraints for water and sediments. At nearly the same time, Stoneley wave departs from the S wave, exhibiting high amplitude which is very clearly in Fig 6(b).
Figure 6: Two snapshots of a wave propagating in a “hard” elastic formation. (a) shows divergent of displacement data and (b) shows curl of displacement data.
10
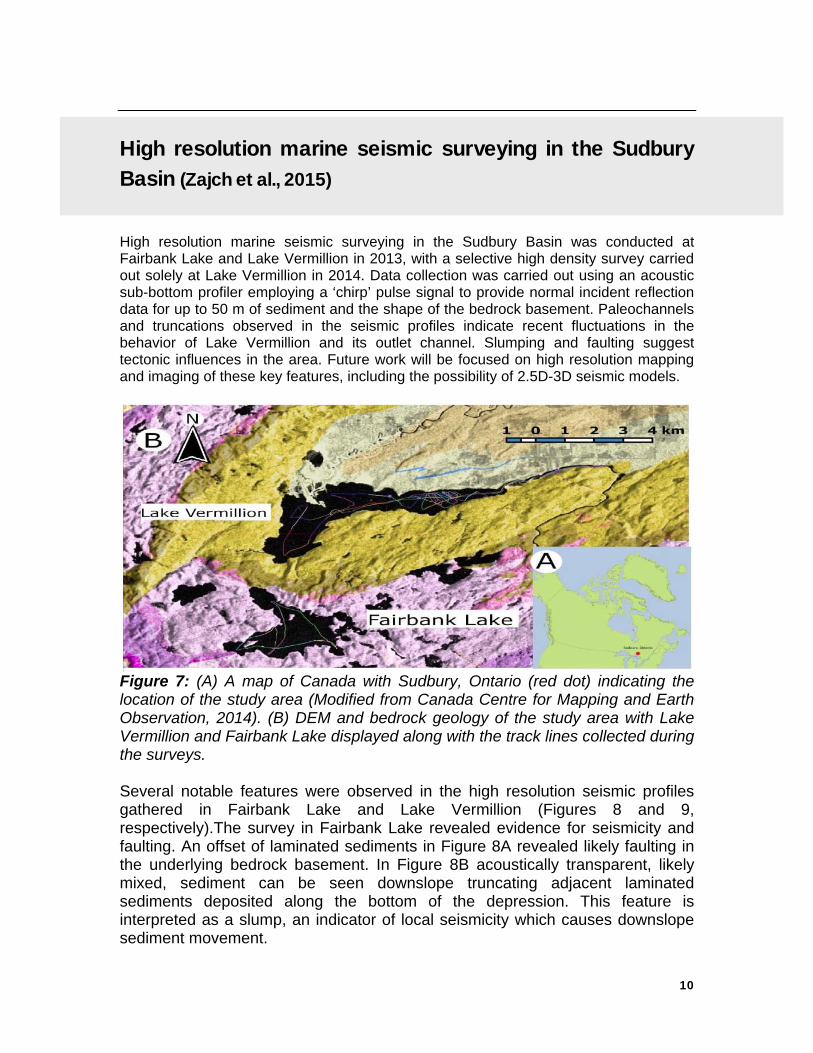
High resolution marine seismic surveying in the Sudbury Basin (Zajch et al., 2015) High resolution marine seismic surveying in the Sudbury Basin was conducted at Fairbank Lake and Lake Vermillion in 2013, with a selective high density survey carried out solely at Lake Vermillion in 2014. Data collection was carried out using an acoustic sub-bottom profiler employing a ‘chirp’ pulse signal to provide normal incident reflection data for up to 50 m of sediment and the shape of the bedrock basement. Paleochannels and truncations observed in the seismic profiles indicate recent fluctuations in the behavior of Lake Vermillion and its outlet channel. Slumping and faulting suggest tectonic influences in the area. Future work will be focused on high resolution mapping and imaging of these key features, including the possibility of 2.5D-3D seismic models.
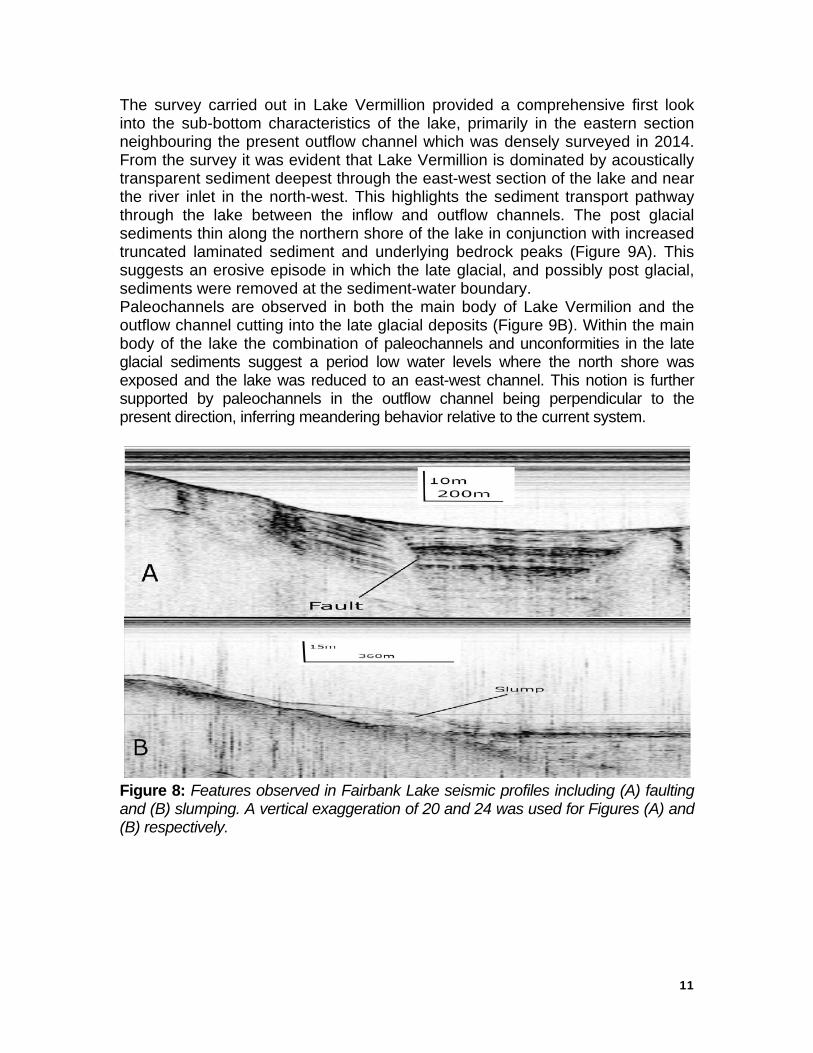
Figure 7: (A) A map of Canada with Sudbury, Ontario (red dot) indicating the location of the study area (Modified from Canada Centre for Mapping and Earth Observation, 2014). (B) DEM and bedrock geology of the study area with Lake Vermillion and Fairbank Lake displayed along with the track lines collected during the surveys. Several notable features were observed in the high resolution seismic profiles gathered in Fairbank Lake and Lake Vermillion (Figures 8 and 9, respectively).The survey in Fairbank Lake revealed evidence for seismicity and faulting. An offset of laminated sediments in Figure 8A revealed likely faulting in the underlying bedrock basement. In Figure 8B acoustically transparent, likely mixed, sediment can be seen downslope truncating adjacent laminated sediments deposited along the bottom of the depression. This feature is interpreted as a slump, an indicator of local seismicity which causes downslope sediment movement.
11
The survey carried out in Lake Vermillion provided a comprehensive first look into the sub-bottom characteristics of the lake, primarily in the eastern section neighbouring the present outflow channel which was densely surveyed in 2014. From the survey it was evident that Lake Vermillion is dominated by acoustically transparent sediment deepest through the east-west section of the lake and near the river inlet in the north-west. This highlights the sediment transport pathway through the lake between the inflow and outflow channels. The post glacial sediments thin along the northern shore of the lake in conjunction with increased truncated laminated sediment and underlying bedrock peaks (Figure 9A). This suggests an erosive episode in which the late glacial, and possibly post glacial, sediments were removed at the sediment-water boundary. Paleochannels are observed in both the main body of Lake Vermilion and the outflow channel cutting into the late glacial deposits (Figure 9B). Within the main body of the lake the combination of paleochannels and unconformities in the late glacial sediments suggest a period low water levels where the north shore was exposed and the lake was reduced to an east-west channel. This notion is further supported by paleochannels in the outflow channel being perpendicular to the present direction, inferring meandering behavior relative to the current system.
Figure 8: Features observed in Fairbank Lake seismic profiles including (A) faulting and (B) slumping. A vertical exaggeration of 20 and 24 was used for Figures (A) and (B) respectively.

12
Figure 9: Notable features observed in Lake Vermillion seismic sections. (A) Bedrock overlain by thick laminated sediments truncated at the water-sediment boundary with possible faults indicated. (B) Paleochannels cutting in late glacial sediments in the outlet channel. A vertical exaggeration of 25 and 100 was used for Figures (A) and (B) respectively.
Organizing 4D seismic data from an active mine site (Zhang and Milkereit, 2015) The physical parameters of most rocks depend on stress conditions. For an active deep mine, the changing of the stress field is dominantly controlled by: tectonic forces, production blasting, excavation and backfill. Monitoring the variability of P- and S- wave velocities is a suitable way to monitor these stress changes. Sensors and events are distributed in the three-dimensional volume of the mine. We propose a new method to better organize the seismic data in both space and time. Specifically, we extract common-source gathers (CSG), common-receiver gathers (CRG), common mid-point gathers (CMG), common offset gathers (COG) and common azimuth gathers (CAG) from several years of production blast recordings. Instead of common event/source gathers (CSG), we evaluate CRG and CMG because the number of events is much larger than the number of receivers. The 3D sorting algorithm for the seismic database is tested using a synthetic production blast sequence and receiver geometry. For data processing, we use a homogeneous background velocity model, a layered velocity model and a tilted layered velocity model in conjunction with the 3D special receiver distribution. The seismic data recorded from all production blasts at the same receiver show

13
excellent coherency. The CSG, CRG, COG, CMG and CAG are extracted for further computation or processing, such as seismic inversion and tomography. Introduction We are currently working on a deep mine monitoring project, which collects 3D seismic data. Seismic monitoring of microseismic events and production blasts is used to observe stress and strain in the mine. Figure 11 shows the mine model with dipping ore bodies and a 3D distribution of seismic sensors. However, microseismic and production blasts are often difficult to analyze in a noisy environment. The number of blast events is much larger than the number of receivers in our data. If the blasts are located near each other, common receivers will record similar traces and these traces could show apparent consistency. Instead of using low signal/noise ratio single event/source gathers, we investigate alternative binning and sorting strategies, including CRG, COG, CMG and CAG (Figure 10).
Figure 10: Cartoons of various source-receiver acquisition geometries suitable of analyzing seismic data in 3D earth models.
Figure 11: Acquisition geometry for selected receiver (yellow) and production blast sequence (events 1-50)

14
Figure 12: Synthetic CRG for dipping layered earth model and productive blast sequence with events 1-50. Synthetic CRG for dipping layered earth model with tilted, layered travel time correction applied. We use a new sorting algorithm to extract blasts for a 3D seismic distribution in order to better organize the large seismic database. Based on the location relationship between sources/events and receivers, we can create CSG, CRG, CMG, COG and CAG sections. We have then verified that the CRG from a number of blasts is aligned after application of the linear move out (Fig 12). The CRG of microseismic events and blasts sequences are suitable for processing and interpretation of large data volume and for monitoring seismic data at an active mine site. For monitoring purposes, common source/event gathers are often noisy. Therefore, CRG, CMG, COG and CAG offer a new approach to harvest a large microseismic/blast database. These gathers will be useful for time lapse 4D seismic monitoring and wave field processing such as reverse time migration and monitoring variation of P- and S- waves velocities and attenuation.
Seismic signal enhancement using 2D fast discrete curvelet transform – an application to VSP and common-shot gathers from a hardrock environment (Shi and Milkereit, 2015a) Obtaining seismic images with good quality in hardrock environments has been challenging. This condition applies to many mineral explorations using seismic methods including our study area where the data quality is strongly affected by soft, near-surface materials and a reflector with low contrast in rock physical properties. Until recently, no effective processing has been applied to the seismic data for improving signal-to-noise ratio (SNR) other than f-x deconvolution. Multiresolution analyses, requiring little in-situ rock physical information, are widely used as SNR improvement methods for pre-and post-stacked seismic traces. The directionally-representative nature of the curvelet transform makes itself an effective multiresolution method for seismic processing. We applied a denoising sequence using the fast discrete curvelet transform (FDCT) on two seismic data sets: a vertical seismic profiling (VSP) survey and a 3D shot record. The results show significant improvement on the SNR of the data.

15
By applying the hard threshold condition on the transformed curvelet coefficients, the image can be restored by inverse curvelet transform. The example of the curvelet denoised seismic image within the block from the VSP data is displayed in Figure 13b. Figure 13c shows the difference between the original and denoised images. The obvious improvement of the seismic image can be noticed. By inspecting the difference of the denoising, the lack of coherent features denotes that the curvelet denoising process brought little harm to the useful signal.
Figure 13: a) Zoom-in of the near-offset VSP data mark in the block in Figure 2a. b) Curvelet denoised VSP data in the same area in a). c) Differences between the original and the denoised images. The nature of optimally representing straight-line singularities makes the curvelet transform an acceptable tool on denoising process of seismic data. Our applications on the VSP and 3D shot-record examples shows promising improvement to the SNR. By inspecting Figure 13b, it is apparent that the denoising process is harmless to useful signals. Further study can focus on optimizing the thresholding methods for this specific problem. Moreover, the denoising sequence can be applied to the pre-migrated or pre-stacked data to avoid the effects of processing artifacts.

16
The Velocity – Density Relationship Revisited (Milkereit and Wu, 2015) With the goal of finding other possible or better relationships between density and the elastic moduli, a database of density, P-wave velocity, S-wave velocity, bulk modulus, shear modulus, Young’s modulus, and Poisson’s ratio was compiled based on a multitude of lab samples. The database, is comprised of isotropic, non-porous metamorphic rock. Multi-parameter cross plots of the various elastic parameters have been analyzed in order to find a suitable parameter combination that reduces high density outliers. Birch’s seismic parameter, along with the bulk modulus, shows promise in providing a link between observed compressional and shear wave velocities and rock densities, including massive sulfides and Fe-oxides. Introduction Identifying rock composition and properties is imperative in a variety of fields including geotechnical engineering, mining, and petroleum exploration, in order to accurately make any petrophysical calculations. Density is, in particular, an important parameter that allows us to differentiate between lithologies and estimate or calculate other petrophysical properties. It is well established that compressional and shear wave velocities of common crystalline rocks increase with increasing densities (i.e. the Birch and Nafe-Drake relationships). Conventional empirical relations do not take into account S-wave velocity. Physical properties of Fe-oxides and massive sulfides, however, differ significantly from the empirical velocity-density relationships. Currently, acquiring in-situ density data is challenging and problematic, and therefore, developing an approximation for density based on seismic wave velocity and elastic moduli would be beneficial. Results
Two-parameter cross plot of the extensive petrophysical data base show little or no correlation between density and elastic moduli. The density-incompressibility cross plot is shown in Figures 14. Also, as expected, the P-wave velocity to S-wave velocity ratios shows no correlation with density.
Then, multi-parameter cross plots of the various elastic parameters have been analyzed in order to find a suitable parameter combination that reduces high density outliers. It appears that Birch’s seismic parameter, along with the bulk modulus, shows promise in providing a link between observed compressional and shear wave velocities and rock densities, including massive sulfides and Fe-oxides. .Figure 15 shows the perspective view of the petrophysical data base in d-k-sp space. In d-k-sp space, the petrophysical data – including the high density “outliers” - project onto a simple surface. This 3-parameter relationship allows us to obtain elastic moduli

17
(incompressibility and shear modulus) from seismic data (compressional and shear wave velocities).
Figure 14: Cross plot of the incompressibility (k) – density data for more than 1000 lab measurements. Note the wide scatter of the k-d values and the lack of simple correlation between k and d for large density values. Colors refer to different physical rock property data sets.
18
Figure 15: Three-parameter cross plot of density (d), incompressibility (k) and seismic parameters (sp). In the d-k-sp space, all physical rock property data project onto a simple surface that includes the high density vales. The proposed 3-parameter correlation (d-k-sp) has far reaching implications for geotechnical applications because borehole seismic data acquisition techniques (full wave sonic logging, & VSPs) can be used to determine elastic moduli.
Migration-induced noise reduction using fast discrete curvelet transform (Shi and Milkereit, 2015b) Seismic data are unavoidably contaminated with noise. The issue becomes worse for applications in mineral explorations in hardrock environments where the complex near- and sub-surface conditions result in variable signal amplitudes and attenuations. Meanwhile, the quality of processing is usually uncontrollable, consequently, yielding remnant local noisy events as singularities on stacked seismic images. These singularities perform as backscattering sources during the migration process to create artificial features interfering with interpretation. No post-migration processing technique has yet demonstrated effectiveness to reduce this artificial noise. This problem can be solved by the curvelet transform for the efficiency of representing directional features on seismic images. We investigate the elimination of the migration-induced noise using a 2D fast discrete curvelet transform (FDCT) threshold applied to a synthetic Stolt time-migrated impulse response. The result shows a significant removal of migration-induced noise. This improvement is also applied to a 3D post-stack time-migrated (PoSTM) seismic cube, resulting in an enhancement of the original signal and a suppression of the induced noise. Next, a curvelet denoising sequence is applied to the PoSTM seismic data from the Athabasca Basin. One example stacked profile is shown in Figure 16. The processing steps involve: 1) taking the forward curvelet transform 2) applying the threshold and 3) taking the inverse curvelet transform suggests that the Frequency Wrapping implementation is more practical for seismic SNR enhancement. We select this method from the Curvelab software package. The CMP profile is decomposed into the curvelet domain as curvelet coefficients (Figure 3). At this stage, to avoid bias of unexpected features, we apply the same hard threshold on each scale that rejects curvelet coefficients smaller than the threshold value. A significant improvement of coherency of the profile is noticeable. By inspecting the difference between the original and denoised images, we find that the process not only removes the random noise but also reduces “swinging arcs” generated from backscattering of migration.

19
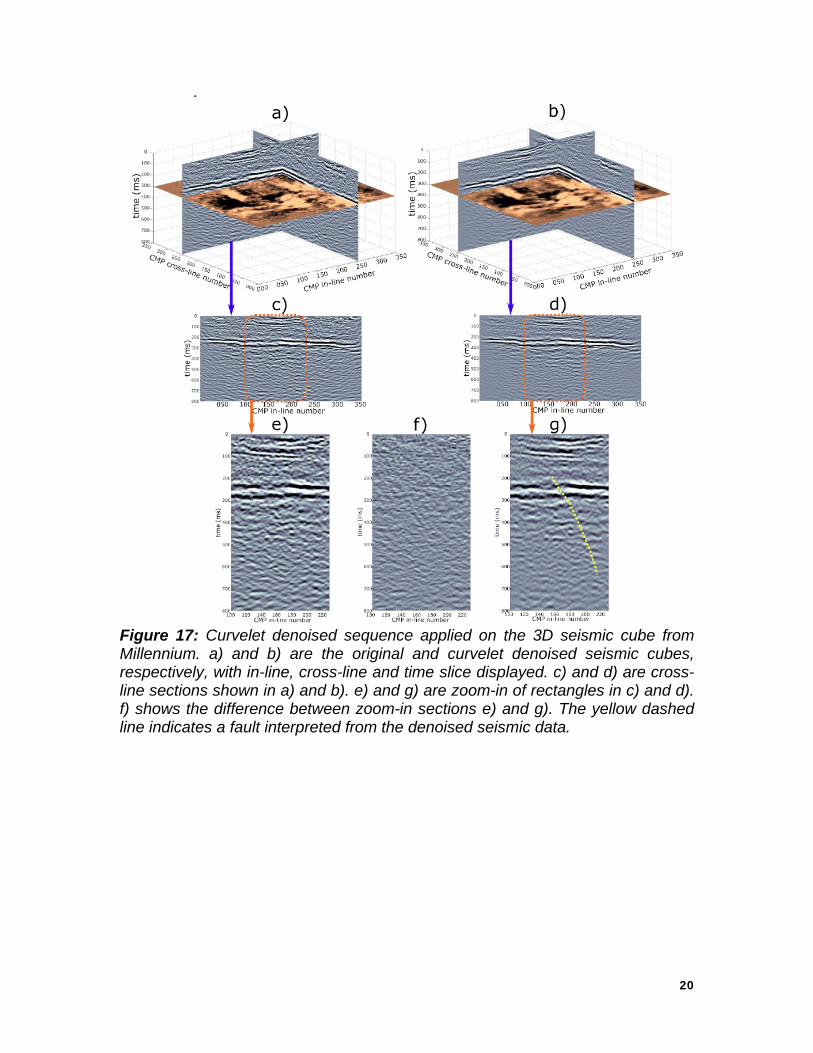
The same denoising process is applied to the 3D PoSTM seismic cube (Figure 16). The original cube shows intensive contamination of the migration “swinging arcs”, which affects the interpretation of the data significantly. The curvelet denoising process not only enhances the coherence on the vertical in-line and cross-line profiles but also reduces noisy points on the time slices (FDCT has not been performed in the horizontal direction). By comparing the zoom-in of cross-line sections, the effect of the removal of migration-induced noises is noticeable. The sub-unconformity structure with low physical contrast faintly emerges on the curvelet denoised 3D cube, and the fault displacement becomes visible down to approximately 600ms (Fig.17). We investigated the effectiveness of the curvelet transform on denoising of the post-migrated cube from the Millennium seismic exploration project in the Athabasca Basin. The result shows a significant improvement of the data SNR, especially in the reduction of migration-induced noise.
Figure 16: A comparison of a) original PoSTM profile extracted from 3D Millennium seismic survey and b) curvelet denoised image. A difference between a) and b) is shown in c).
20
Figure 17: Curvelet denoised sequence applied on the 3D seismic cube from Millennium. a) and b) are the original and curvelet denoised seismic cubes, respectively, with in-line, cross-line and time slice displayed. c) and d) are cross-line sections shown in a) and b). e) and g) are zoom-in of rectangles in c) and d). f) shows the difference between zoom-in sections e) and g). The yellow dashed line indicates a fault interpreted from the denoised seismic data.
21
Elastic and viscoelastic modeling of seismic waves in the Athabasca Basin, Canada. (Shi and Milkereit, 2015) Seismic data quality is controlled by either the variable p-wave reflectivity or the strong attenuation conditions for the uranium exploration in the Athabasca Basin, northern Saskatchewan, Canada. This study re-evaluates these conditions through the analysis of synthetic data generated from elastic and viscoelastic seismic wave simulations. The 2D model considering in-situ heterogeneity conditions is created based on geophysical logs. The calculation of p-p and p-s reflectivity using the Zoeppritz equation, based on borehole p-wave velocity measurements and s-wave velocity estimations, implies a potential phase changing p-wave amplitude versus offset (AVO) response. The seismic wavefield simulation is recorded both horizontally on the surface and vertically in a borehole. The synthetic data reveals the effect of widespread alterations above the basement unconformity on seismic data quality, and suggests the necessity of further improvements on the processing and interpretation of future seismic work. The viscoelastic model is using various Q factors for the evaluation of attenuation effects caused by the local complex geology. The comparison of the field VSP data and the synthetic seismic record with different Q values indicates a very strong attenuating condition in the Athabasca Basin. Little is known about the shear wave velocities and its contrasts across the basement unconformity in the Athabasca Basin. We obtained shear wave velocity from analysis of borehole geophysical data from the McArthur River area. The density, compressional, and shear wave velocity data form the basis for comprehensive elastic and viscoelastic seismic wave modeling studies. The porosity of the Athabasca Group sandstone is derived from both the density and resistivity logs (Figure 18). Above the alteration zone at 320 m depth, the porosity of the Athabasca sandstone can be as high as 0.3, which suggests a high attenuation condition. The viscoelastic model can be produced by introducing an absorption mechanism into the simulation process, causing velocity dispersions and attenuations of the wavefield energy. The attenuation quality factor, Q, is defined by the reciprocal of seismic energy loss per cycle exploration because Q values for common geologic materials are large (>100); however, strong attenuations (low Q values) may enable measurements of dispersions. Figure 19 shows p-wave arrivals of a near-offset field VSP survey and synthetic VSP data from the same model with different Q values (6, 20 and 60). The apparent attenuation extent of the field VSP data tends to fall in between Q=6

22
and Q=20 synthetic examples, which suggests an extremely low Q condition in the Athabasca sandstone formation. The strong attenuation condition lowers the signal-to-noise ratio of the original field record, but may cause measureable body wave dispersion, which will allow the analysis of Q factors providing new potential attribute anomalies for inversion. The modeling study will be used to guide processing of multicomponent converted s-waves of the seismic data in the Athabasca Basin. S-wave velocity measurements in the future may offer better results for both modeling and inversion procedures.
Figure 18: The p-wave velocity log (left), estimated s-wave velocity (middle) and derived porosity logs (right) from a borehole near McArthur River mine. The data is filtered. The s-wave velocity is estimated using Greenberg-Castagna (1992) method assuming a brine saturated sand-clay mixture model. Note the rapid velocity increase and porosity decrease at 320 m depth indicate a strong silicificate alteration below.

23
Figure 19: Comparisons of p-wave first breaks of simulated VSP surveys with different Q values (right) and the field VSP record (left) from a borehole in McArthur River. The left example is extracted from the raw data using a sparse geophone spacing.
24
Staff and Students Faculty: Bernd Milkereit, Teck Chair in Exploration Geophysics
(since August 2001) Graduate Students (PhD)
Ramin Saleh (2011 – present), Co-superviser Q. Liu Ken Nurse (2011 – present) Maria Tibbo (2013-present), Co-superviser P.Young Dong Shi (2014-present)
Graduate Students (MSc) Jianing Zhang (2014-present) Na Wang (2014-present) Andrew Zajch (2014-present) Summer Research Assistants: 2014: Maria Wu, Andrew Zajch, Omolola Agonga
2015: Maria Wu, Erica Veglio, Anisa Kassam, Alex Carey Recent Graduations Ph.D. Completed
Leonardo Trivino (co-supervised with B.Mohanty) Study of Blast-induce Damage in Rock with Potential Application to Open Pit and Underground Mines (2012)
M. Sc. Completed Guo,K., (2013-2014) Towards 3D Direct Current Resistivity and Induced
Polarization Imaging, Department of Earth Sciences, University of Toronto, September 2014.
Dong Shi.,(2013-2014) Seismic Exploration of Uranium deposits in the Athabasca Basin, Saskatchewan – A modelling study, Department of Earth Sciences, University of Toronto, September 2014
Sara Nicholson, (co-supervised with C.Bank) Near Surface Geophysical Imaging, Deep River, Department of Earth Sciences, University of Toronto, September 2014.
Laura Quigley (2011- 2013), Seismic Imaging of Shallow Carbonate and Shale hosted massive sulphide deposit; a feasibility study. Department of Earth Sciences, University of Toronto, September 2013.
Lin Zheng (2012-2013), Co-supervised (Q. Liu), Mapping Peak Particle Velocities and Accelerations for Surface Mining Models base upon Spectral-elements methods. Department of Physics, University of Toronto, September 2013.
Undergraduate Thesis Lavender Zhang (Eng. Sci)
Gas Hydrate Concentration Revisited: How much is really there? (April 2012)

25
Publications (2013 – 2015) For earlier publications, please see previous Annual Reports archived at the “Exploration Geophysics” website. Scientific Journals and Books: Qian,W. and Milkereit,B., “Innovations in Cross-Hole DCIP Tomography,” First Break, in review, 2015. Zheng, L., Zhao,Q., Milkereit,B., Grasselli,G., and Liu,Q., Spectral-element Simulations of Elastic Wave Propagation in Exploration and Geotechnical Applications, Earthquake Science, doi 10.1007/s11589-014-0069-9, 2014 Bongajum,E., Milkereit,B., and Huang, J., Building 3D stochastic exploration models from borehole geophysical and petrophysical data: A Case Study. Canadian Journal of Exploration Geophysics, 38, 40-50, 2013. Conferences Proceedings/Expanded Abstracts: Shi, D. and Milkereit, B. Migration-induced noise reduction using fast discrete curvelet transform. Expanded Abstract. 4p. SEG 2015 Annual Convention, 2015b. Saleh,R., Milkereit,B., and Liu,Q., “Simulation of Seismic Wave Propagation in a Deep Mine”, Department of Earth Sciences, University of Toronto, GeoConvention 2015, Geo Sciences, Calgary, AB, May 4-8, 2015. Wang,N., Shi,D., and Milkereit, B., “Towards Modelling Elastic and Viscoelastic Seismic Wave Propagation in Boreholes”, Department of Earth Sciences, University of Toronto, GeoConvention 2015, Geo Sciences, Calgary, AB, May 4-8, 2015 Shi,D and Milkereit,B., “Seismic Signal Enhancement using 2D Fast Discrete Curvelet Transform- An Application to VSP and Common-Shot Gathers from a Hardrock Environment”, Department of Earth Sciences, University of Toronto, GeoConvention 2015, Geo Sciences, Calgary, AB, May 4-8, 2015a. Zajch, A., Milkereit,B., and Eyles,N., “High Resolution Marine Seismic Surveying in the Sudbuy Basin”, Department of Earth Sciences, University of Toronto, GeoConvention 2015, Geo Sciences, Calgary, AB, May 4-8, 2015 Zhang,J. and Milkereit,B., “Organizing 4D Seismic Data from an Active Mine Site”,
26
Department of Earth Sciences, University of Toronto, GeoConvention 2015, GeoScience, Calgary, AB, May 4-8, 2015 Wu, M. and Milkereit,B., “The Velocity-Density Relationship Revisited”, 3rd International Workshop on Rock Physics, Perth, Western Australia, April 13th -17th, 2015. Shi, D., Milkereit,B., and Sun,F., “Elastic and Viscoelastic Modeling of Seismic Waves in the Athabasca Basin, Canada. Expanded Abstract. 4p. SEG 2014 Annual Convention, 2014. Wu, M. and Milkereit, B., "Hardrock Elastic Physical Properties: Birch’s Seismic Parameter Revisited", American Geophysical Union, annual meeting, 2014. Saleh, R., Chen, H., Milkereit, B. and Liu, Q., "Simulation Of Broadband Seismic Wave Propagation In A Deep Mine in Sudbury Ontario Canada", American Geophysical Union, annual meeting, 2014. Tibbo, M. , Young, P., Schmitt, D., and Milkereit, B., "Geophysical Properties of Hard Rock for Investigation of Stress Fields in Deep Mines", American Geophysical Union, annual meeting, 2014. Sun, L.F and Milkereit,B., Investigating Reservoir Charactersitics by Mapping P-wave velocity dispersion. EAGE, Amsterdam, 4p,2014. Guo, K., Qian, W., and Milkereit, B., Geometry factor for near Surface Borehole Resistivity Surveys: a Key to accurate imaging and monitoring, Geoconvention, Calgary, 4p, 2014 Saleh,R., and Milkereit,B., A Modelling Study of Broadband Seismic Wave Propagation in a Deep Mine, EAGE conference, Amsterdam, 2014,2p. Milkereit,B., Saleh,R., Huang,J., and Valley,B., In-Mine Seismic Imaging Revisited, Invited Workshop Contribution, EAGE, Amsterdam, 2014, 2p. Villero, D., Porter, J., Nurse, K and Milkereit.B., H/V Ratio Charateristics for 3-Component Sensors. American Geophysical Union annual meeting, 2013. Saleh, R., Zheng, L., Liu, Q and Milkereit, B., Effect of Strong Elastic Contracts on the Propagation of Seismic Wave in Hard-Rock Environments American Geophysical Union annual meeting, 2013. Sun, L.F., Campbell, A. and Milkereit, B. Continuous mapping of P-wave velocity dispersion: a useful tool for reservoir characteristic. 75th EAGE Conference and Exhibition, London, 4p, 2013.

27
Saleh, R and Milkereit, B., The effects of source frequency variation on the Propagation of Seismic Waves in the Presence of Strong Elastic Property Contrast, geoConvention, Calgary, 4p, 2013.
Zheng, L., Zhao, Q., Liu, Q., Milkereit.B., Spectral-element Simulations of Elastic Wave Propagation in Exploration and Geotechnical Applications, Integration, geoConvention, 4p 2013 Quigley, L. and Milkereit, B. Investigation of Seismic Imaging Capabilities for small, shallow carbonate-hosted massive sulfide deposits, GeoConvention 2013, 4p. Quigley, L., and Milkereit, B. Seismic Imaging of Shallow sediment-hosted massive sulfide deposits, SGA Conference, Uppsala, 3p, 2013.

28
Other Activities (2014/2015)
2014-2015 Final Stops of the Lecture Tour
Date Universities or Institutions Included City
Apr. 28, 2014 CSEG Luncheon, Telus Convention Center Calgary, AB
May 1, 2014 Colorado School of Mines Golden, CO, USA
Jun. 26, 2014 China University of Petroleum (CUP) Beijing, China

29
Figure 20: Dong Shi, Na Wang, Ramin Saleh, Andrew Zajch, Jianing Zhang at the 2015 Geoconvention in Calgary (bottom) and the Lake Louise Fieldtrip (top).
Field & Conferences

30
Figure 21: Fieldwork, Surface Geophysics at Nash Creek (New Brunswick): Kun Guo & Bernd Milkereit wrapped in mosquito nets.