technopolis q4 2013 presentation
DESCRIPTION
Technopolis Plc's Q4 2013 results. Published on 14.2.2014TRANSCRIPT

Full Year Results for 2013
February 14, 2014

A Year of Transformation
• Market cap from EUR 285 million to EUR 462 million
• Total shareholder return approximately 30%
• Investments of roughly EUR 500 million, including
organic growth projects
• Four acquisitions and two new countries
• Revenue growth 17.7% and EBITDA growth 15%
2
Key Figures
3
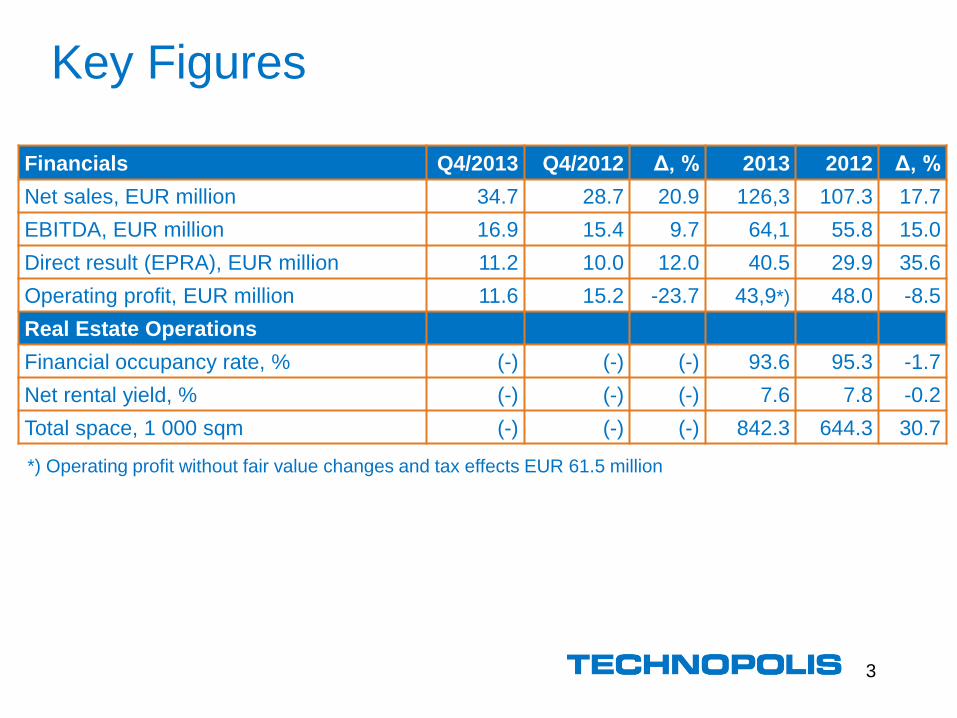
Financials Q4/2013 Q4/2012 Δ, % 2013 2012 Δ, %
Net sales, EUR million 34.7 28.7 20.9 126,3 107.3 17.7
EBITDA, EUR million 16.9 15.4 9.7 64,1 55.8 15.0
Direct result (EPRA), EUR million 11.2 10.0 12.0 40.5 29.9 35.6
Operating profit, EUR million 11.6 15.2 -23.7 43,9*) 48.0 -8.5
Real Estate Operations
Financial occupancy rate, % (-) (-) (-) 93.6 95.3 -1.7
Net rental yield, % (-) (-) (-) 7.6 7.8 -0.2
Total space, 1 000 sqm (-) (-) (-) 842.3 644.3 30.7
*) Operating profit without fair value changes and tax effects EUR 61.5 million
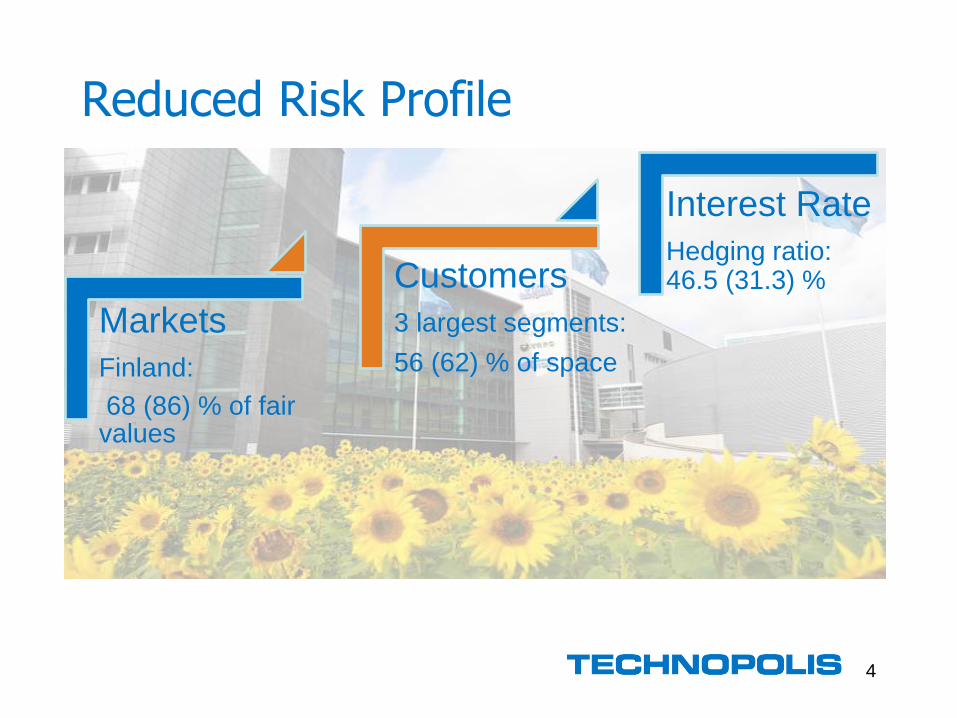
Reduced Risk Profile
Markets
Finland:
68 (86) % of fair values
Customers
3 largest segments:
56 (62) % of space
Interest Rate
Hedging ratio: 46.5 (31.3) %
4
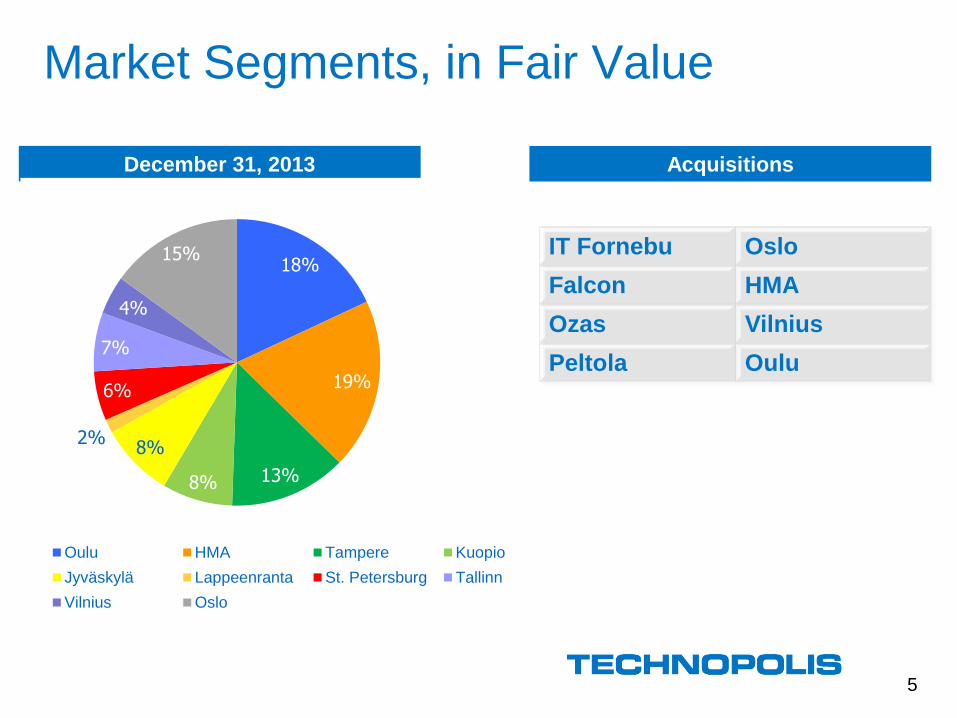
Market Segments, in Fair Value
5
December 31, 2013
18%
19%
13% 8%
8% 2%
6%
7%
4%
15%
Oulu HMA Tampere Kuopio
Jyväskylä Lappeenranta St. Petersburg Tallinn
Vilnius Oslo
Acquisitions
IT Fornebu Oslo
Falcon HMA
Ozas Vilnius
Peltola Oulu
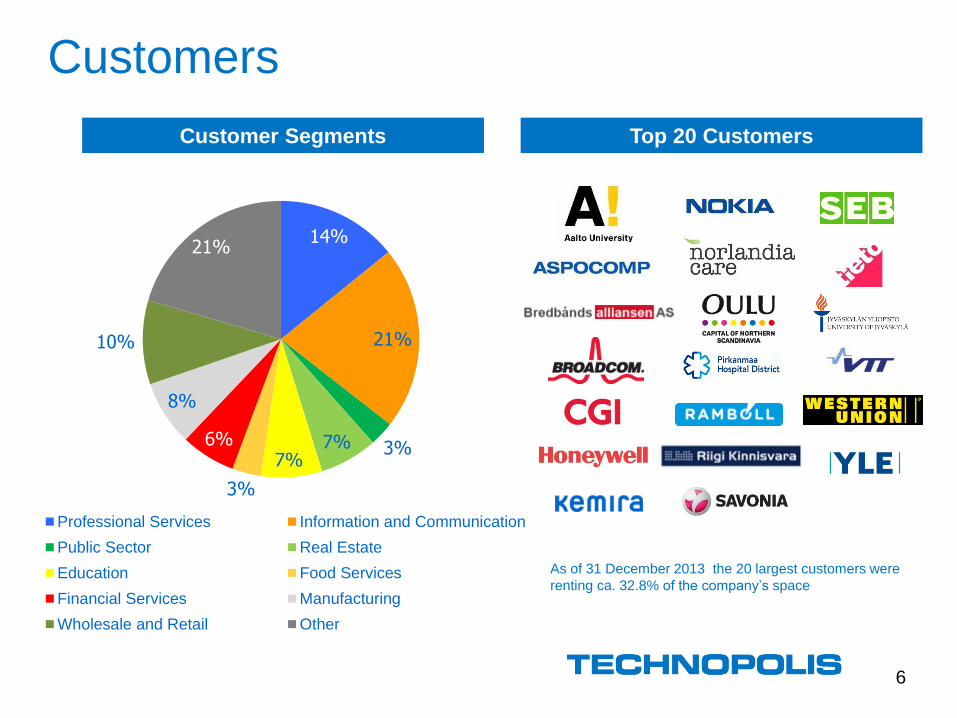
14%
21%
3% 7% 7%
3%
6%
8%
10%
21%
Professional Services Information and Communication
Public Sector Real Estate
Education Food Services
Financial Services Manufacturing
Wholesale and Retail Other
Customers
6
Top 20 Customers Customer Segments
As of 31 December 2013 the 20 largest customers were
renting ca. 32.8% of the company’s space
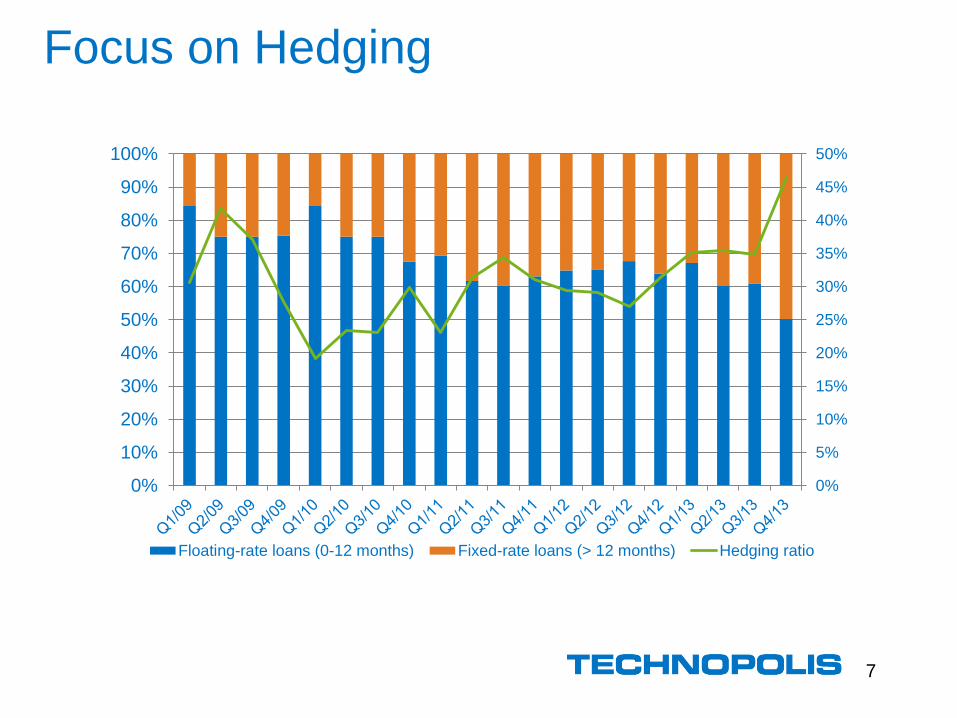
Focus on Hedging
7
0%
5%
10%
15%
20%
25%
30%
35%
40%
45%
50%
0%
10%
20%
30%
40%
50%
60%
70%
80%
90%
100%
Floating-rate loans (0-12 months) Fixed-rate loans (> 12 months) Hedging ratio
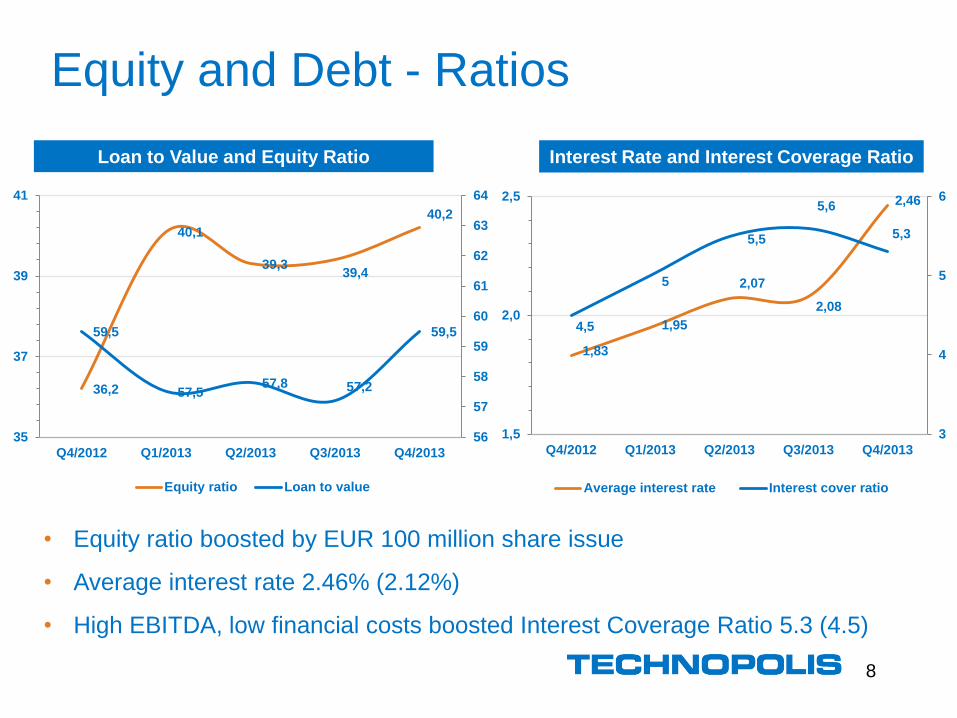
Equity and Debt - Ratios
8
Loan to Value and Equity Ratio Interest Rate and Interest Coverage Ratio
• Equity ratio boosted by EUR 100 million share issue
• Average interest rate 2.46% (2.12%)
• High EBITDA, low financial costs boosted Interest Coverage Ratio 5.3 (4.5)
36,2
40,1
39,3 39,4
40,2
59,5
57,5 57,8 57,2
59,5
56
57
58
59
60
61
62
63
64
35
37
39
41
Q4/2012 Q1/2013 Q2/2013 Q3/2013 Q4/2013
Equity ratio Loan to value
1,83
1,95
2,07
2,08
2,46
4,5
5
5,5
5,6
5,3
3
4
5
6
1,5
2,0
2,5
Q4/2012 Q1/2013 Q2/2013 Q3/2013 Q4/2013
Average interest rate Interest cover ratio

Looking Ahead
• 2014 growth guidance y/y:
– Net sales 27%-32%
– EBITDA 35%-40%
• International investments in 2013 will bring
international revenues close to our strategic target
• 2014 will be a year of managing growth
• Focus on integration, occupancy & profitability
• The company’s solvency and liquidity will be solid
9
Appendices: Additional Data
10

Strategic Financial Targets 2014 - 2016
11
* Excluding fair value changes (formula specified)
The Board of Directors reviewed the targets April 15, 2013
• Net sales and EBITDA growth 15% on average per annum
• Net sales outside Finland over EUR 50 million by 2016
• At least 6% return on capital employed* per annum
• Equity ratio over 35% over the cycle
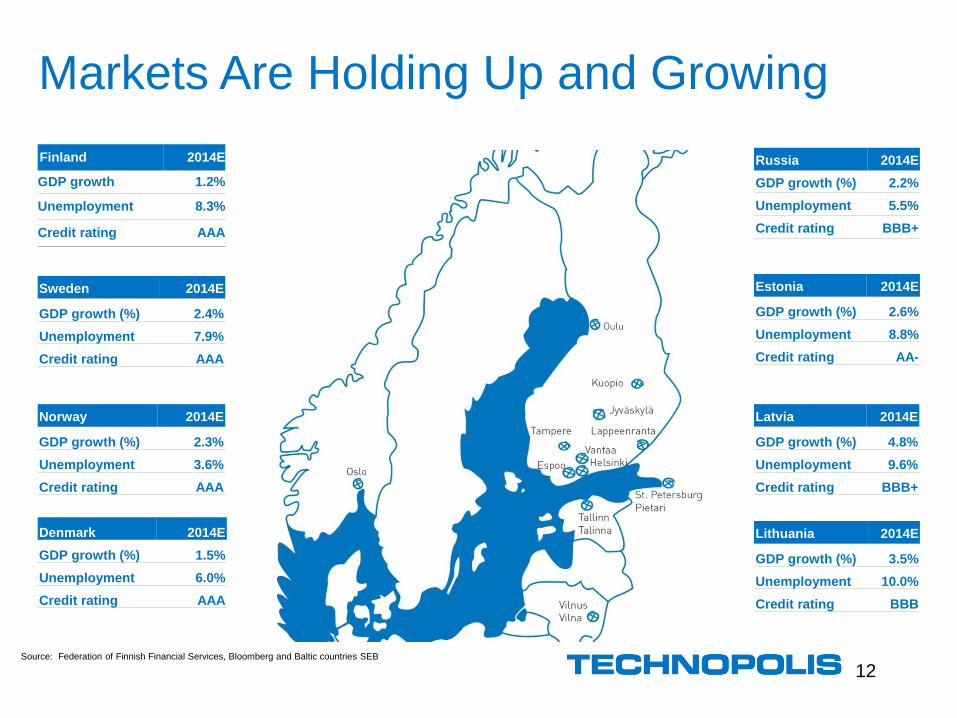
Markets Are Holding Up and Growing
Source: Federation of Finnish Financial Services, Bloomberg and Baltic countries SEB
Finland 2014E
GDP growth 1.2%
Unemployment 8.3%
Credit rating AAA
Sweden 2014E
GDP growth (%) 2.4%
Unemployment 7.9%
Credit rating AAA
Denmark 2014E
GDP growth (%) 1.5%
Unemployment 6.0%
Credit rating AAA
Estonia 2014E
GDP growth (%) 2.6%
Unemployment 8.8%
Credit rating AA-
Russia 2014E
GDP growth (%) 2.2%
Unemployment 5.5%
Credit rating BBB+
Latvia 2014E
GDP growth (%) 4.8%
Unemployment 9.6%
Credit rating BBB+
Lithuania 2014E
GDP growth (%) 3.5%
Unemployment 10.0%
Credit rating BBB
Norway 2014E
GDP growth (%) 2.3%
Unemployment 3.6%
Credit rating AAA
12

13
Location: Oulu, Finland
The fifth largest city in Finland
Approximately 190,000 inhabitants
Capital and business center of Northern
Finland
Peltola Acquisition
Peltola
EUR 31.7 million
Rentable space 37,600 sqm
Market yield 8.5%
Stabilized yield 11.2%
Occupancy 78.8% Modern, flexible, good location
Up & coming life sciences sector
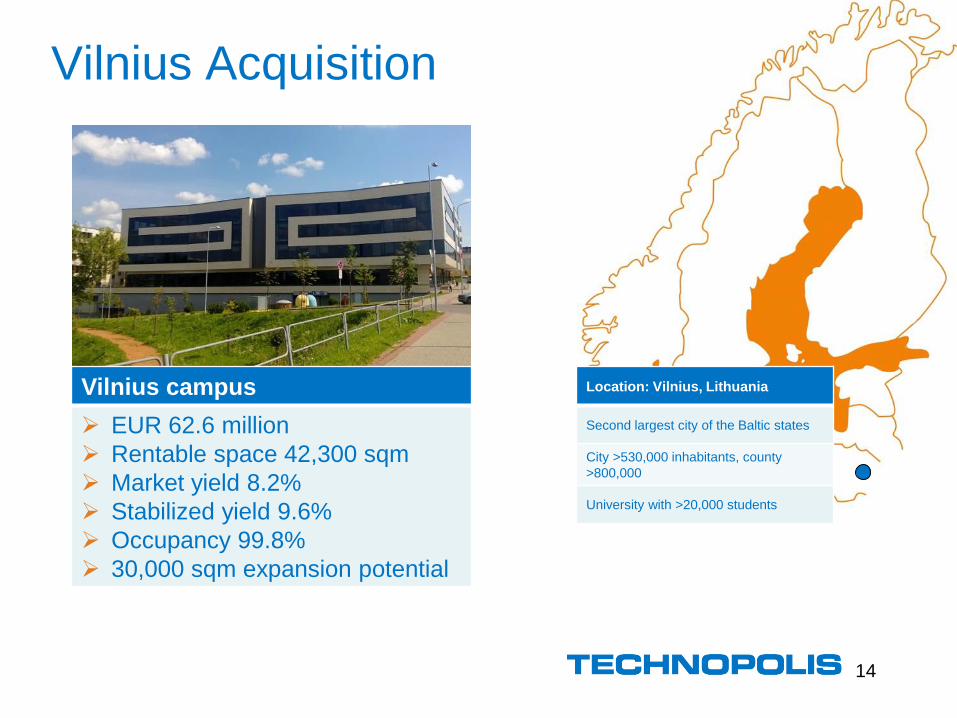
Vilnius Acquisition
14
Location: Vilnius, Lithuania
Second largest city of the Baltic states
City >530,000 inhabitants, county
>800,000
University with >20,000 students
Vilnius campus
EUR 62.6 million
Rentable space 42,300 sqm
Market yield 8.2%
Stabilized yield 9.6%
Occupancy 99.8%
30,000 sqm expansion potential
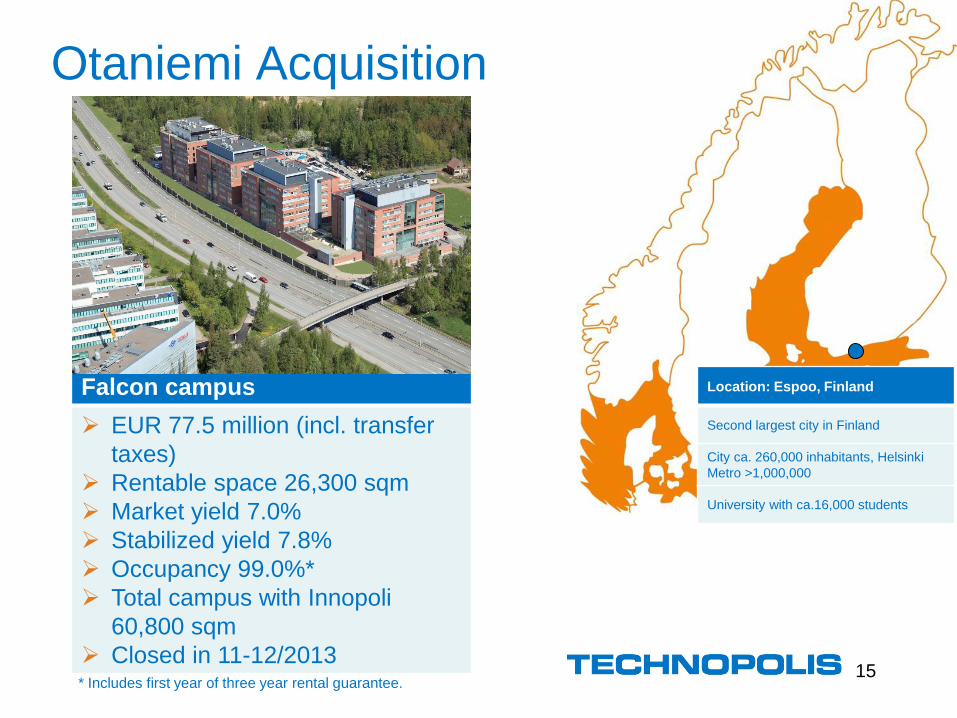
Otaniemi Acquisition
15
Location: Espoo, Finland
Second largest city in Finland
City ca. 260,000 inhabitants, Helsinki
Metro >1,000,000
University with ca.16,000 students
Falcon campus
EUR 77.5 million (incl. transfer
taxes)
Rentable space 26,300 sqm
Market yield 7.0%
Stabilized yield 7.8%
Occupancy 99.0%*
Total campus with Innopoli
60,800 sqm
Closed in 11-12/2013 * Includes first year of three year rental guarantee.

Oslo Acquisition
16
Location: Oslo, Norway
Largest city in Norway
City ca. 630,000 inhabitants, metro
>1,500,000
Universities with >70,000 students
Fornebu campus
EUR 217 million*)
Rentable space 70,500 sqm
Market yield 6.4%
Stabilized yield 7.7%
Occupancy 92.3%
15,000-25,000 sqm expansion
potential
Closed on 11 December, 2013 *) of which 51% is Technopolis’ investment, decline of EUR 3
million to originally released amount due to weakening of NOK
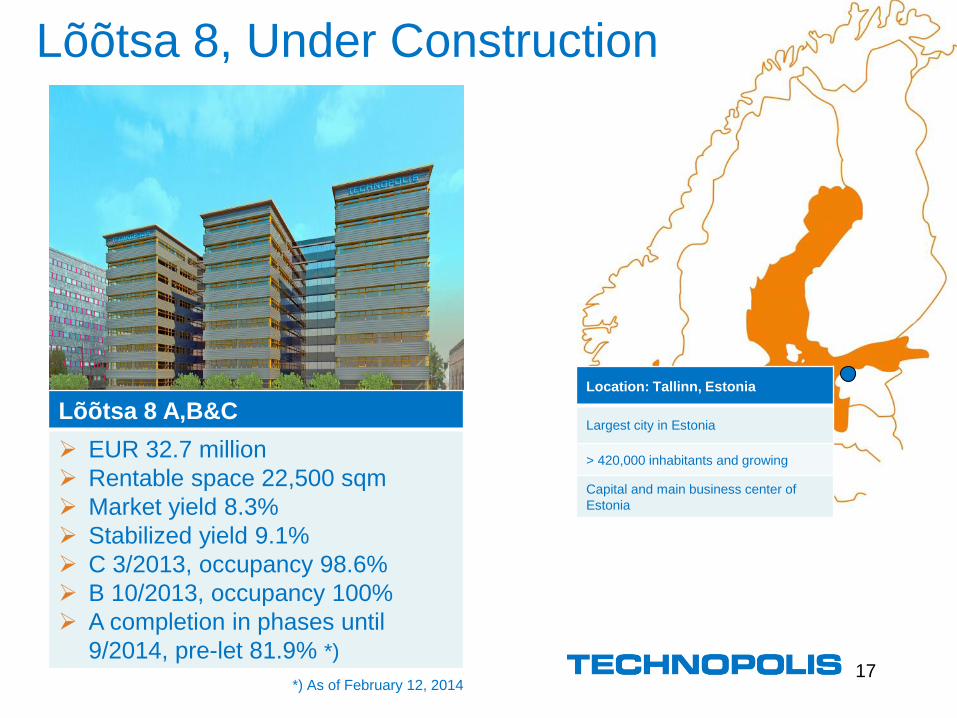
17
Location: Tallinn, Estonia
Largest city in Estonia
> 420,000 inhabitants and growing
Capital and main business center of
Estonia
Lõõtsa 8 A,B&C
EUR 32.7 million
Rentable space 22,500 sqm
Market yield 8.3%
Stabilized yield 9.1%
C 3/2013, occupancy 98.6%
B 10/2013, occupancy 100% A completion in phases until
9/2014, pre-let 81.9% *)
Lõõtsa 8, Under Construction
*) As of February 12, 2014
18
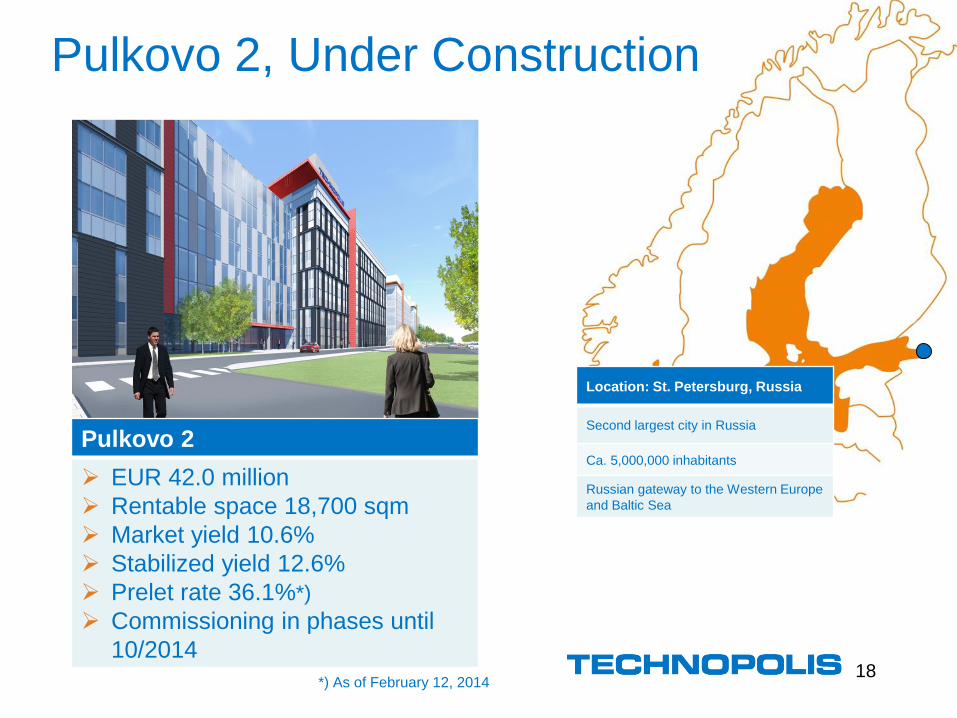
Pulkovo 2
EUR 42.0 million
Rentable space 18,700 sqm
Market yield 10.6%
Stabilized yield 12.6%
Prelet rate 36.1%*)
Commissioning in phases until
10/2014
Location: St. Petersburg, Russia
Second largest city in Russia
Ca. 5,000,000 inhabitants
Russian gateway to the Western Europe
and Baltic Sea
Pulkovo 2, Under Construction
*) As of February 12, 2014
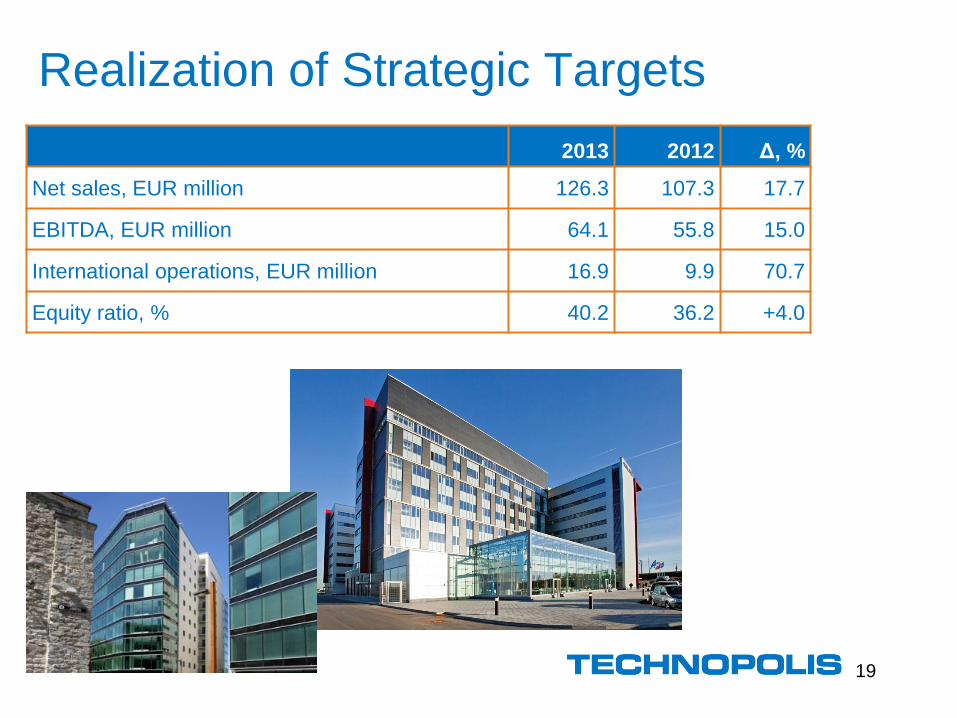
Realization of Strategic Targets
19
2013 2012 Δ, %
Net sales, EUR million 126.3 107.3 17.7
EBITDA, EUR million 64.1 55.8 15.0
International operations, EUR million 16.9 9.9 70.7
Equity ratio, % 40.2 36.2 +4.0
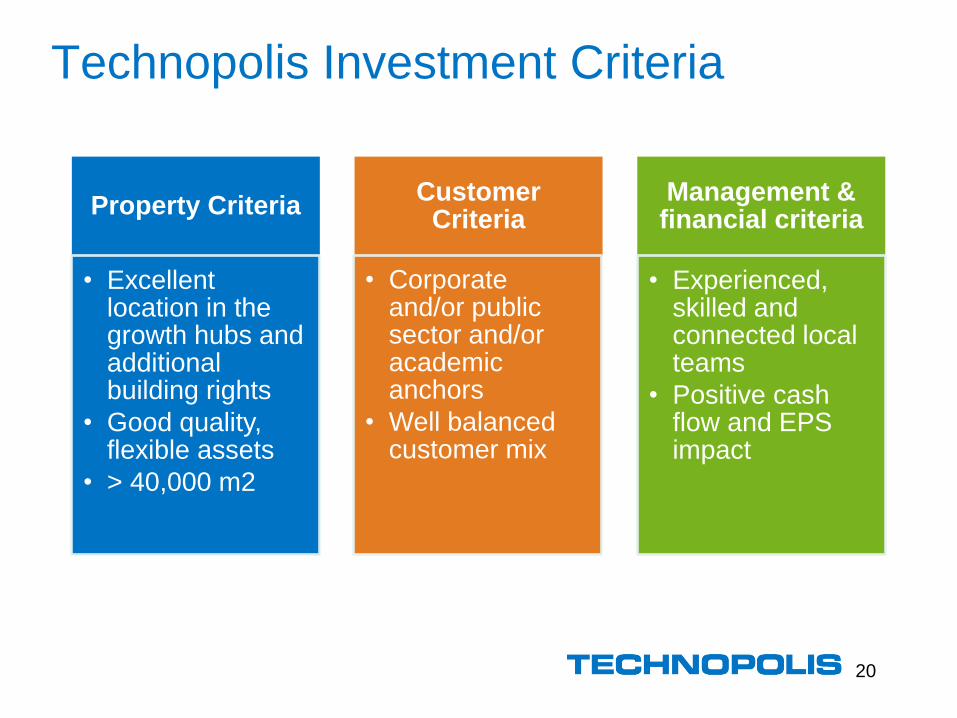
Technopolis Investment Criteria
20
Property Criteria
• Excellent location in the growth hubs and additional building rights
• Good quality, flexible assets
• > 40,000 m2
Customer Criteria
• Corporate and/or public sector and/or academic anchors
• Well balanced customer mix
Management & financial criteria
• Experienced, skilled and connected local teams
• Positive cash flow and EPS impact
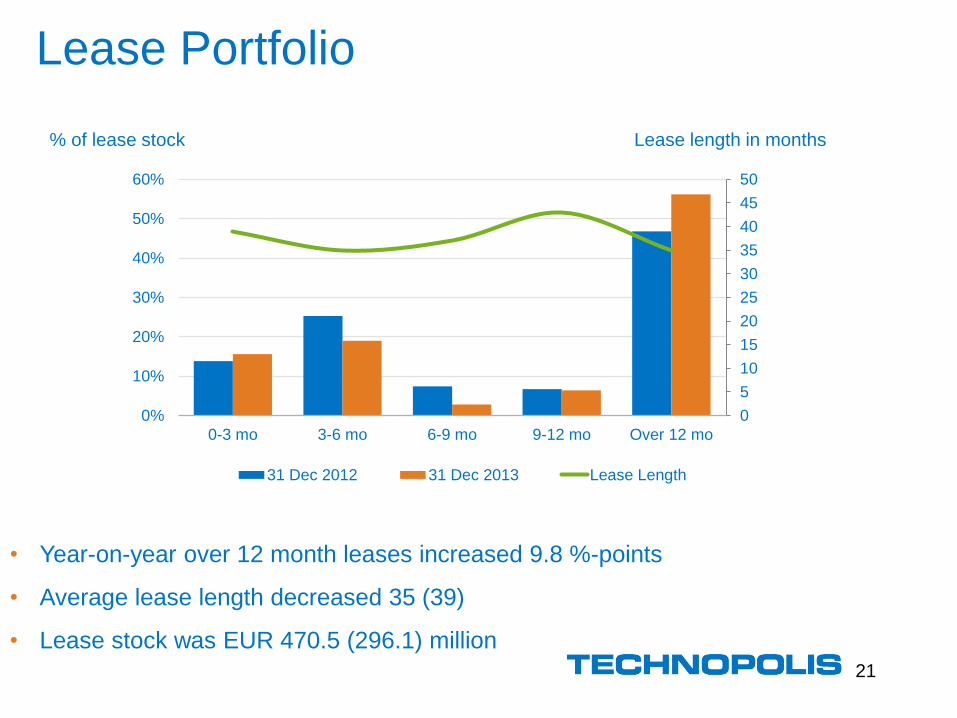
Lease Portfolio
• Year-on-year over 12 month leases increased 9.8 %-points
• Average lease length decreased 35 (39)
• Lease stock was EUR 470.5 (296.1) million
21
% of lease stock Lease length in months
0
5
10
15
20
25
30
35
40
45
50
0%
10%
20%
30%
40%
50%
60%
0-3 mo 3-6 mo 6-9 mo 9-12 mo Over 12 mo
31 Dec 2012 31 Dec 2013 Lease Length
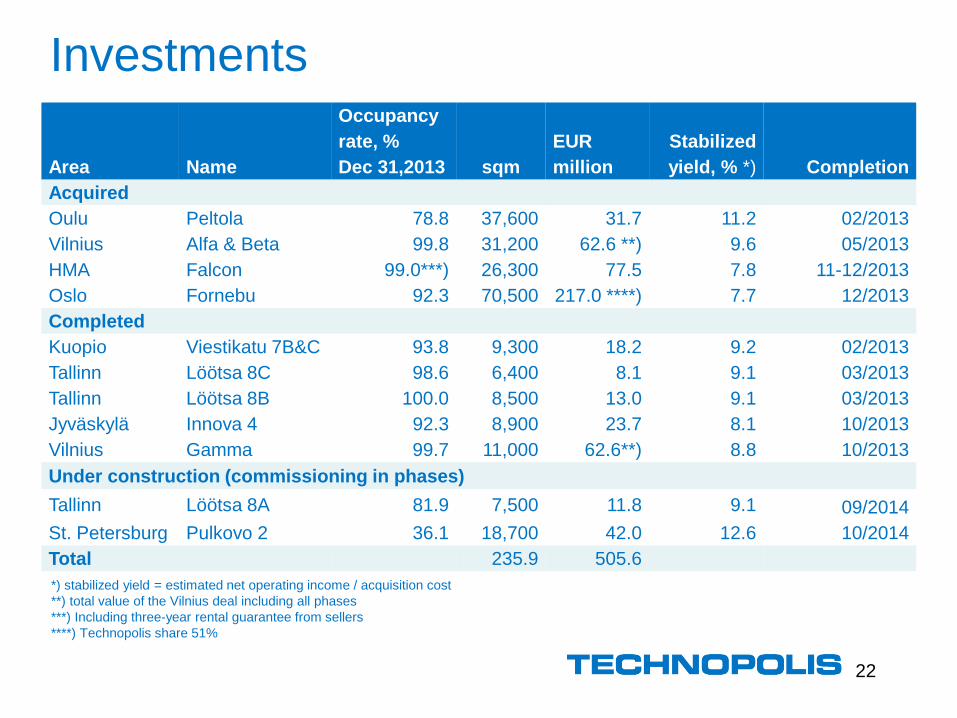
Investments
22
Area Name
Occupancy
rate, %
Dec 31,2013 sqm
EUR
million
Stabilized
yield, % *) Completion
Acquired
Oulu Peltola 78.8 37,600 31.7 11.2 02/2013
Vilnius Alfa & Beta 99.8 31,200 62.6 **) 9.6 05/2013
HMA Falcon 99.0***) 26,300 77.5 7.8 11-12/2013
Oslo Fornebu 92.3 70,500 217.0 ****) 7.7 12/2013
Completed
Kuopio Viestikatu 7B&C 93.8 9,300 18.2 9.2 02/2013
Tallinn Löötsa 8C 98.6 6,400 8.1 9.1 03/2013
Tallinn Löötsa 8B 100.0 8,500 13.0 9.1 03/2013
Jyväskylä Innova 4 92.3 8,900 23.7 8.1 10/2013
Vilnius Gamma 99.7 11,000 62.6**) 8.8 10/2013
Under construction (commissioning in phases)
Tallinn Löötsa 8A 81.9 7,500 11.8 9.1 09/2014
St. Petersburg Pulkovo 2 36.1 18,700 42.0 12.6 10/2014
Total 235.9 505.6
*) stabilized yield = estimated net operating income / acquisition cost
**) total value of the Vilnius deal including all phases
***) Including three-year rental guarantee from sellers
****) Technopolis share 51%

20%
25%
21%
2%
32%
Loans without Covenants or Bank Guarantees
Loans with Covenants (equity ratio)
Loans Requiring Bank Guarantees with Covenants
Loans Requiring Bank Guarantees without Covenants
Loans with Covenants
Breakdown of Debts and Covenants
23
89,4%
3,9% 6,4%
0,2%
Bank Loan Leasing Debt
Commercial Paper Credit Limit + others
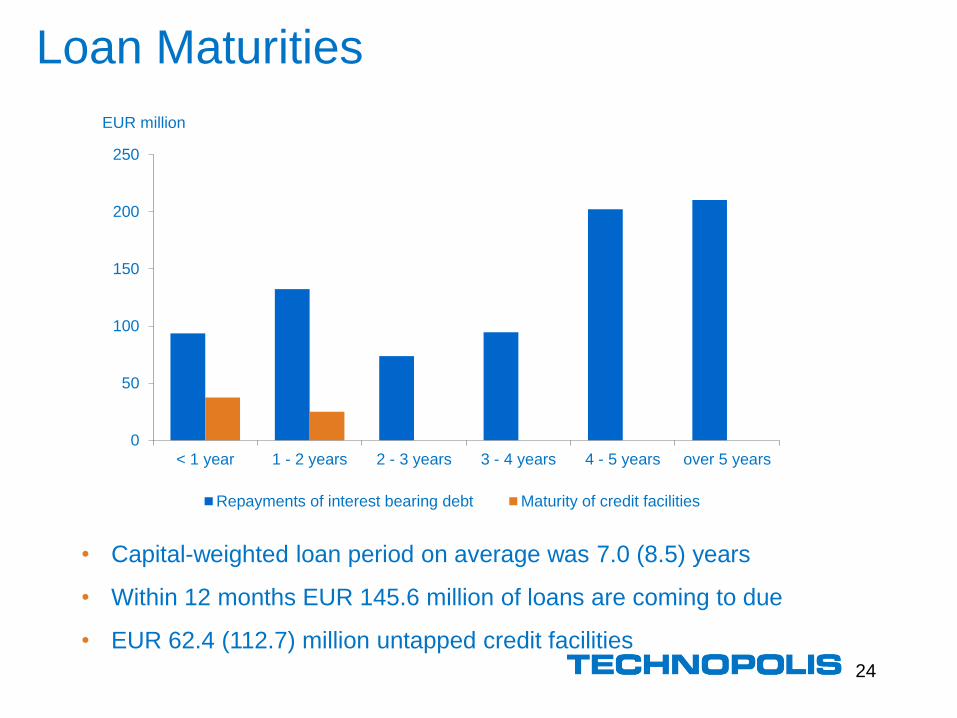
Loan Maturities
24
• Capital-weighted loan period on average was 7.0 (8.5) years
• Within 12 months EUR 145.6 million of loans are coming to due
• EUR 62.4 (112.7) million untapped credit facilities
0
50
100
150
200
250
< 1 year 1 - 2 years 2 - 3 years 3 - 4 years 4 - 5 years over 5 years
EUR million
Repayments of interest bearing debt Maturity of credit facilities

Sustainability
25
Action 2011
(base year)
2012 2013
Energy kWh/gross sqm 245.6 240.7 236.5
Water m3/FTE 1.27 1.21 1.20
CO2e kg/gross sqm 85.2 43.0 41.9
Reporting Environmental
Sustainability Report GRI, C level
Improved GRI +
EPRA
Green Office 1 9 10
LEED 4 14 16
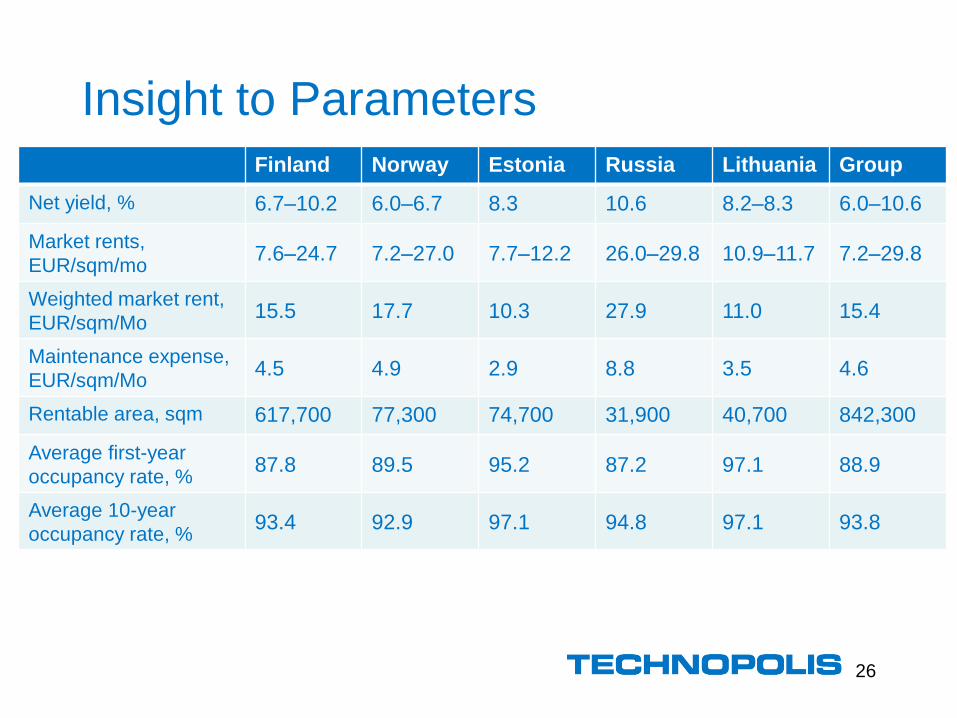
Insight to Parameters
26
Finland Norway Estonia Russia Lithuania Group
Net yield, % 6.7–10.2 6.0–6.7 8.3 10.6 8.2–8.3 6.0–10.6
Market rents,
EUR/sqm/mo 7.6–24.7 7.2–27.0 7.7–12.2 26.0–29.8 10.9–11.7 7.2–29.8
Weighted market rent,
EUR/sqm/Mo 15.5 17.7 10.3 27.9 11.0 15.4
Maintenance expense,
EUR/sqm/Mo 4.5 4.9 2.9 8.8 3.5 4.6
Rentable area, sqm 617,700 77,300 74,700 31,900 40,700 842,300
Average first-year
occupancy rate, % 87.8 89.5 95.2 87.2 97.1 88.9
Average 10-year
occupancy rate, % 93.4 92.9 97.1 94.8 97.1 93.8

Shareholders
27
Major shareholders January 31, 2014 # of shares % of shares
Varma Mutual Pension Insurance Company 25,448,192 23.95
Ilmarinen Mutual Pension Insurance Company 11,089,647 10.44
City of Oulu 3,511,211 3.30
OP-Pohjola Group 1,952,140 1.84
Laakkonen Mikko 1,226,184 1.15
The Finnish Cultural Foundation 1,188,042 1.12
City of Tampere 1,160,577 1.09
Odin Finland 1,119,944 1.05
Jyrki Hallikainen 998,236 0.94
Mutual Fund Evli Finnish Equity 881,666 0.86
10 largest shareholders, total 48,575,839 45.71
Foreign shareholders, total 33,586,735 31.6
Others, total 486,904 22.69
Total amount of shares 106,268,407 100