technopedia webinar - agenda
TRANSCRIPT

A webinar by:
Technopedia: Grid Enhancing Technologies
29 June 2021

A webinar by:
• Switch off the mic & camera
• During the panel discussion, write your question to
the chat
• The webinar is recorded
• All the materials will be shared via the event website
Ground rules

3
Technopedia webinar - agenda29 June 2021 - 11.00-13.00
What? When? Who?
Welcome & Introduction 11.00-11.05 Norela Constantinescu/Lorant Dekany
(ENTSO-E)
ENTSO-E Technopedia: The Assets, the
Flexibility and the Digital technologies
11.05-11.20 Bartosz Rusek, Christos Dikeakos, Karel
Vinkler (ENTSO-E RDI Committee)
Use cases from the Technopedia
- HVDC
- FACTS
- DLR
- Superconductors
11.20-11.55
Jochen Kreusel (ABB Hitachi)
Susanne Nies (SmartWires)
Rena Kuwahata (Ampacimon)
John Fitzgerald (Supernode)
Competitiveness Progress Report 11.55-12.10 Mark van Stiphout (DG ENER)
Grid optimization & timely solutions 12.10-12.20 Ivan Pineda (WindEurope)
Panel discussion – trends of the grid
enhancing technologies
12.20-12.45 Susanne Nies (CurrENT), Jochen Kreusel
(T&D Europe), Mark van Stiphout (DG
ENER), Ivan Pineda (WindEurope), Uros
Salobir (ENTSO-E) Christos Dikeakos
(ENTSO-E)
What’s next for the Technopedia? 12.45-12.55 Uros Salobir (ENTSO-E RDI Committee)
Conclusions 12.55-13.00 Norela Constantinescu (ENTSO-E)

ENTSO-E Technopedia:The Assets, the Flexibility and the Digital technologies
Bartosz RusekConvener of Working Group ‘Assets & Technologies’ENTSO-E
Christos DikeakosConvener of Working Group ‘Flexibility & Markets’ENTSO-E
Karel VinklerConvener of Working Group ‘Digitalization & Communication’ENTSO-E

5
Technopedia
Assets
34 Factsheets
Flexibility
23 Factsheets
Digital
8 Factsheets
Factsheets provide:
▪ General description
▪ Info on advantages & field of application
▪ Technology Readiness Level (TRL)
▪ Current fields of research
▪ Selected best practices
A new tool to guide through innovative & state-of-the-art technologies related to
the world of TSOs

6
Technopedia
The Report:- Static document
- Graphically enhanced
The Tool:- Regularly updated
- Easy to search
https://www.entsoe.eu/Technopedia/

7
Technopedia
Assets
34 Factsheets

8
Technopedia
Flexibility
23 Factsheets

9
Technopedia
Digital
8 Factsheets
5G Digital Cellular
Networks
Artificial
Intelligence
Distributed Ledger
Technology/Blockchain
Digital TwinCloud and Edge
ComputingInternet of Things
Satellite
Applications
Software-defined
Security To be continued…

Use cases from Technopedia #1:High-voltage Direct Current (HVDC)
Jochen KreuselGlobal Head of Market InnovationHitachi ABB Power Grids

11
A short introduction to HVDC1 transmission
A technology with a long track-record and permanent evolution
AC
1 HVDC: high voltage direct current 2 Source: Hitachi ABB Power Grids
high voltage direct current
power transmission
DCAC
AC grid AC gridHVDC
converter station
HVDC
converter station
Advantages• Low losses (direct current)• Small footprint• No limitations in length• Cables can be used over long distances as there is no reactive power
consumption
Current source converters (CSC, LCC), …12.000 MW• Available since 1954• Line-commutated thyristor valves• Overhead lines or mass-impregnated cables• Minimum short circuit capacity > 2x converter rating• Bulk power long distance transmission,
coupling of asynchronous power systems
Voltage source converters (VSC), …3.000 MW• Available since 1997• Self-commutated IGBT valves• Extruded cables or overhead lines• No minimum short circuit capacity, black start capability• Multiple areas of application
0
500
1000
1500
2000
2500
3000
3500
4000
12000
6000
8000
…
1970 1975 1980 1985 1990 1995 2000 2005 2010 2015 2020
CSC MW
CSC kV
VSC MW
VSC kV
Development of HVDC technologies2

12
Why are we talking about HVDC today?
HVDC uses cases in the past and in future
HVDC in an evolving environment
Primarily regionally balanced power systems
Long-distance transmission was more the exception than the rule
Few special challenges• Connecting remote power generation
• Supplying remote loads
• Subsea cables
• Asynchronous systems
Local concentration of generation
Long-distance transmission
Strongly varying load-flow situations active control
Offshore power• Need for cables
• Need for redundant structures(a grid instead of individual lines)
Power systems in the past Power systems in the future
HVDC advantageous but requires further development.
HVDC was proven, for project-based, independent niche applications.

13
Vision for the future of HVDC/potential fields of development
The building blocks of an evolved HVDC eco-system
HVDC in an evolving environment
Higher VSC1 ratings
Large-scale DC overlay grid concepts, including• Multi-terminal capability and interoperability• Control and protection schemes
DC gas insulated switchgear and substation
HVDC circuit-breakers
HVDC cables and lines• Mass impregnated (MI)
• XLPE (cross-linked Polyethylene)
• Gas insulated lines (GIL) for DC
• Hybrid AC/DC overhead lines
1 VSC: Voltage source converter
Source: Workstream for the development of multi-vendor HVDC systems and other power electronics interfaced devices.ENTSO-E, T&D Europe, WindEurope, June 2021

Use cases from Technopedia #2:Flexible Alternating Current Transmission Systems (FACTS)
Susanne NiesGeneral Manager - GermanySmart Wires

15
Short introduction of the technology
FACTS devices and the case of the mSSSC
Where does modular SSSC sit?
• FACTS devices improve the security and flexibility
of the existing transmission system
• FACTS devices are typically categorized into shunt-
connected devices, series-connected devices or
combinations of the two.
• Shunt-connected devices are typically used for
voltage-regulation
• Series-connected devices are typically used for
power flow control
• Shunt/Series combinations include the Unified
Power Flow Controller (UPFC)
• Smart Wires existing products are series-
connected devices that use power electronics for
control and protection

16
Modular Static Synchronous Series Compensators
Origin of Smart Valve
Smart Wires existing products are series-connected devices that use power electronics for control and protection
• The SmartValve uses a modular single-phase Static
Synchronous Series Compensator (SSSC) that employs
VSC technology
• SSSCs were first operated on the grid for power flow
control applications in 1998 at American Electric
Power (AEP) as part of a UPFC installation
• In 2001, another installation was completed within
New York Power Authority (NYPA)’s system. The NYPA
VSCs are still in operation.
• The power electronics in the SmartValve uses
Insulated-Gate Bipolar Transistors (IGBTs) that have
been widely used for utility-scale VSCs, including
STATCOMs and HVDC systems SSSC Schematic

17
Use case of the technology -1- Grids Run at 20-40% Utilisation in average
Before Smart Wires
Smart Wires modular technology balances flows on the grid to maximize transfer capacity
After Smart Wires
+ 500 MW

18
Use case of the technology -2- Large scale deployment in the UK 2021
Slide 18
INSTALLS QUICKLY
COST-COMPETITIVE
FLEXIBLE
Provides more than £387 M in cost savings compared to new circuits or PSTs while delivering the same system benefits
Deploys in less than 12 months with minimal site disruption or outages
Can easily be expanded or relocated if network conditions change
I can see a world very soon where power grids everywhere become more intelligent, digital and controllable. NGET will be a leader in this transition and it’s inevitable that technology like Smart Wires will be a big part of this future. ,,
,,
David Wright, Director of Transmission & Chief Engineer
Circuit Voltage Solution
Penwortham –Washway Farm –
Kirkby 1
275kV 2 valves per phase
Penwortham –Washway Farm –
Kirkby 2
275kV 5 valves per phase
Lackby – Norton 400kV 2 valves per phase
Harker - Fourstones 275kV 2 valves per phase
Harker – Stella West 275kV 5 valves per phase

19
• Smart Wires is working with TSOs across Europe to free up capacity on their existing grids
• Interest by DSOs in several countries
• Technology has been deployed in Ireland, UK, France, Greece and Bulgaria.
• We see combined benefits with other innovative Grid technologies such as DLR, superconductors
• We are working currently with a number of system operators collaboratively on:
Increasing available interconnection capacity
Phase Oscillation dampening
Piloting mobile technology
Phase balancing
Curative (post N-1) response
System Separation avoidance
European PresenceVision for the future of the technology/potential fields of development
Massive deployment of technology with extended services

Use cases from Technopedia #3:Dynamic Line Rating (DLR)
Rena KuwahataBusiness Developer for Power Grid Optimization ServicesAmpacimon

21
Short introduction of the technology
What is Dynamic Line Rating?
Overhead power line
monitoring system
Increases visibility of
asset condition
Enables the safe use of extra line capacity
Thermal limits
▪ Maximum Conductor Temperature
▪ Maximum Sag
Rating (maximum load current)
Static based on fixed/seasonal, conservative ambient conditions, no field information
Dynamic based on variable, real-time ambient conditions, with fieldinformation
Heat-balance equation
IEEE 738 or CIGRE TB207
Line Capacity is limited by sag and conductor temperature
sensitive to weather: wind speed and air temperature have most impact
Clearance
Sag
Suspension
Section
Span
Dead-end
Earth
wireDead-
end
Clearance

22
Use case of the technology – 1.
Saved 500 kEUR
redispatch
costs in a day
50% increase
in hosting
capacity
Saved 247
kEUR in 4 hours
• Congestion management costs range from 20-500EUR/MWh
• Expensive measures used to address moderate (~10%) overloads.
Reduce congestion management costs
•Generally high loaded line carrying volatile infeed from renewables.
•If forecast is wrong, it can very quickly deviate from expected loading.
•This needs remedial actions (actions to avoid (N-1) security issues).
Accelerate renewables integration
•Short-term solution to boost market coupling capacity.
•Small capacity increase in high price split reap enormous returns in short time frame.
•Cross border capacity benefits all citizens.
Increase cross-border trade capacity
①
②
③

23
Use case of the technology – 2.
②
③
•Increasing need for remedial actions to prevent overloading of lines (congestion) in day-ahead and intraday timeframes like topology change, PST tapping, redispatch, curtailment, load shedding.
•DLR alleviates congestion thereby reducing this need.
Reduce the need for remedial actions
•Making full use of ambient cooling effect, transmission lines can be used to transport energy more efficiently
•Maximum sag and conductor temperature for safetynever exceeded
Economic dispatch cost reduction
•Visibility of real-time and forecast line capacity and flow allows grid operator to manage more precisely overload risks.
•Data statistics-based decisions can be made to inform asset management like outage planning and maintenance intervals.
Improve controllability of risk
•Increase in line capacity and visibility of use can be combined with power flow control.
•Such grid operation-based solutions to tackle increased power flows can be counter-balanced with investment projects.
•This gives flexibility in investment portfolio management.
Defer grid investment
No need to
reschedule
maintenance outage
10-20% increase in
acceptable infeed
Alerted overload risk in
recent heat waves
Up to 15% saving on
new CAPEX projects
⑦
④
⑤
⑥
24
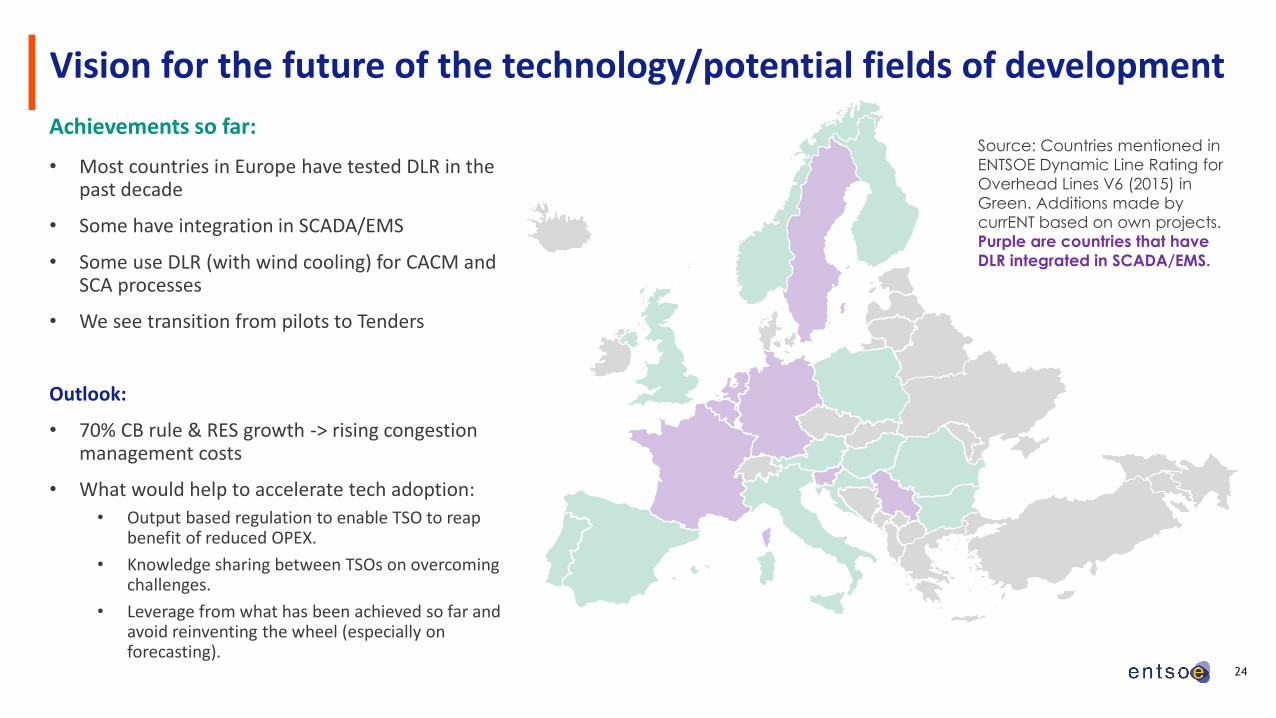
Vision for the future of the technology/potential fields of development
Source: Countries mentioned in
ENTSOE Dynamic Line Rating for
Overhead Lines V6 (2015) in
Green. Additions made by
currENT based on own projects.
Purple are countries that have
DLR integrated in SCADA/EMS.
Achievements so far:
• Most countries in Europe have tested DLR in the past decade
• Some have integration in SCADA/EMS
• Some use DLR (with wind cooling) for CACM and SCA processes
• We see transition from pilots to Tenders
Outlook:
• 70% CB rule & RES growth -> rising congestion management costs
• What would help to accelerate tech adoption:
• Output based regulation to enable TSO to reap benefit of reduced OPEX.
• Knowledge sharing between TSOs on overcoming challenges.
• Leverage from what has been achieved so far and avoid reinventing the wheel (especially on forecasting).

Use cases from Technopedia #4:Superconductors
John FitzgeraldChief Executive OfficerSuperNode

26
What is Superconductivity and what does it offer?
Superconductivity is a phenomenon that occurs in some materials that, when cooled below a certain temperature, display unique characteristics.
A state of Superconductivity is reached when a material is cooled to below its ‘critical temperature’.
Zero Electrical Resistance - When a superconducting material is cooled below its critical temperature, its electrical resistance reduces to zero.
High Power Density – Superconductors can carry significantly higher levels of current and thus are capable of the transmission of higher power levels than copper.
Smaller Right of Way – Superconducting cables have a smaller cross-section and thus the right of way required for their installation is much smaller than comparable copper cables.
Lower Cost – The cost of the individual cables is higher but the cost of a superconducting project can be significantly lower.
27
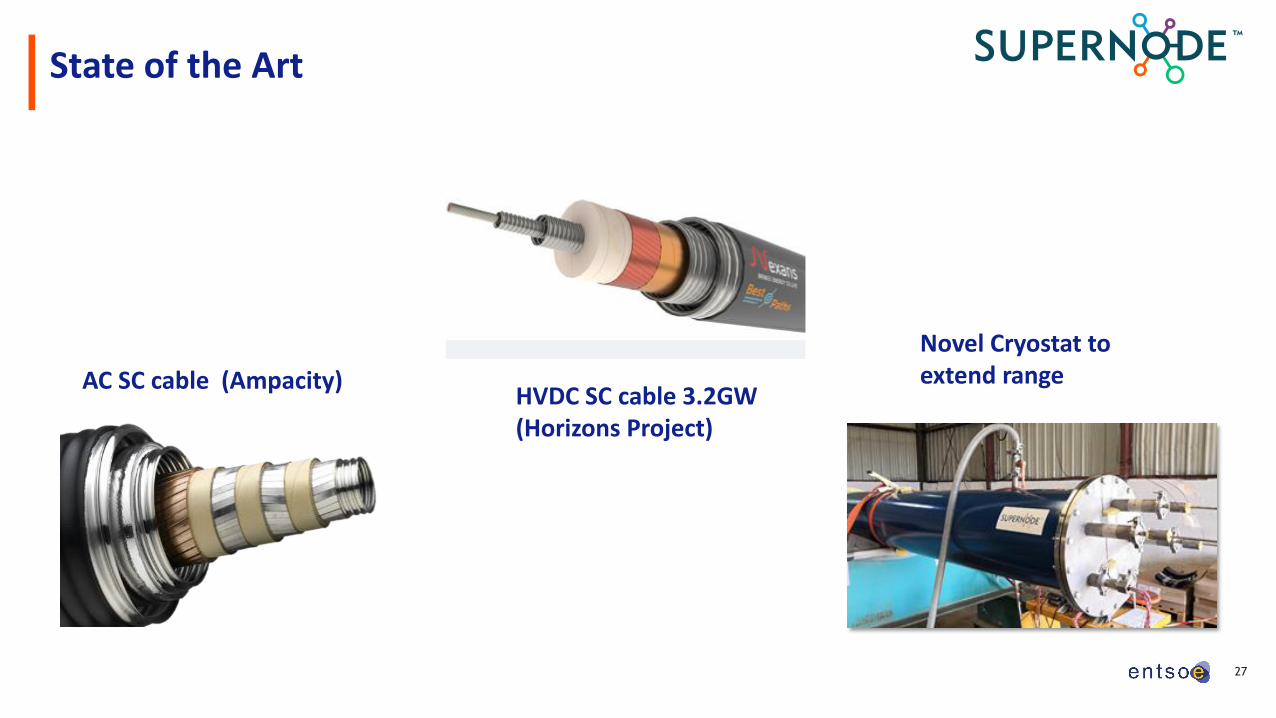
State of the Art
AC SC cable (Ampacity)HVDC SC cable 3.2GW (Horizons Project)
Novel Cryostat to extend range

28
Superconductors in the Grid Today
Ampacity Project, Essen
The Ampacity project was designed to solve an urban density problem, with the substation Dellbruggerequiring more power.
To solve this problem, a new transformer was built out in the suburbs where there was available space and a new HTS line was installed to connect them which is 1km long.
Shingal substation needed a higher capacity but had no room for another transformer.
HTS cables were installed to connect to Heungdeoksubstation with a 1km, 23kV HTS cable.
HTS was found to be 15% cheaper than the alternative method of building 154kV underground cables.
Shingal Project, Seoul

29
Chinese Approach to New Grids
40,000GW.km
Developing UHVDC overhead lines, carrying 10GW+

30
Superconducting Connection Scheme
Facilitating the cost effective integration of increasing offshore wind capacity
Superconducting 2GW MVDC scheme
Conventional 2GW HVDC Scheme525kV HVDC and 100kV HTS MVDC systems compared at 100km cable length.
HTS System comes in over 35% cheaper than HVDC System cost.
Competitiveness of superconductors improves further as capacity increases.
525kV HVDC HTS
Lifecycle cost
Capital cost
Losses
Unavailability

31
Areas for further development
Bringing the most cost competitive solution to the market
Superconducting cable system development & qualification
program
Deployment / Demonstration projects
Industry CollaborationEstablishing a secure and
reliable supply chain

Competitiveness Progress Report
Mark van StiphoutDeputy Head of unitDG ENER

Technopedia Webinar
Competitiveness Progress Report
29.06.21
Mark van Stiphout, ENER.B5

• Legal basis
• Article 35 (m) of the Governance Regulation of the Energy Union and Climate
Action: The State of the Energy Union report shall include the following elements: […] a
progress report on competitiveness;
• Annex to the State of the Energy Union Report.
• Format: main report and underpinning annex with data
1st draft (End June) 2nd Interservice meeting (feedback on draft) ISC Adoption of the report
Background & timeline
SeptemberJulyJune October

1. Introduction
2. Overall competitiveness of the EU clean energy sector
2.1 Boosting competitiveness tools within the EU framework: mechanisms and instruments – new
• Mapping tools (legal, funding, other) based on impact on pre-selected indicators
Examples: Horizon Europe, Batteries Alliance, State-Aid Framework for Energy or R&D&I
Outline of the report (1/2)
Macro-economic analysis Technology analysis – Current
situation and outlook
Value chain analysis of the
energy technology sector
Global market and analysis
Energy intensity, share of RES,
import dependency, industrial
electricity and gas prices
Capacity installed,
generation/production
Turnover Trade (imports, exports)
Turnover of the EU Cost/Levelised Cost of Electricity Gross value added growth Global market leaders vs. EU
market leaders
Gross value added Public R&I funding (EU and MS) Number of companies in the
supply chain
Resource efficiency and
dependence
Employment figures Private R&I funding Employment in value chain
segment
Covid-19 disruption Patenting trends Energy intensity, labour
productivity
Scientific Publications Community production

Offshore wind
Technology Analysis –Current situation and
Outlook
Value chain analysis of the energy technology sector
Global market analysis
Capacity Installed Turnover Trade (imports, exports)
Cost/Levelised Cost of Energy GVA growth Global market leaders vs EU leaders
Public R&I Funding (MS & EU) Number of EU companies Resource efficiency and dependence
Private R&I Funding Employment in selected value chain
Patenting Trends Energy intensity, labour productivity
Level of Scientific Publications Community Production

Onshore wind
Technology Analysis –Current situation and
Outlook
Value chain analysis of the energy technology sector
Global market analysis
Capacity Installed Turnover Trade (imports, exports)
Cost/Levelised Cost of Energy GVA growth Global market leaders vs EU leaders
Public R&I Funding (MS & EU) Number of EU companies Resource efficiency and dependence
Private R&I Funding Employment in selected value chain
Patenting Trends Energy intensity, labour productivity
Level of Scientific Publications Community Production

Solar photovoltaics
Technology Analysis –Current situation and
Outlook
Value chain analysis of the energy technology sector
Global market analysis
Capacity Installed Turnover Trade (imports, exports)
Cost/Levelised Cost of Energy GVA growth Global market leaders vs EU leaders
Public R&I Funding (MS & EU) Number of EU companies Resource efficiency and dependence
Private R&I Funding Employment in selected value chain
Patenting Trends Energy intensity, labour productivity
Level of Scientific Publications Community Production
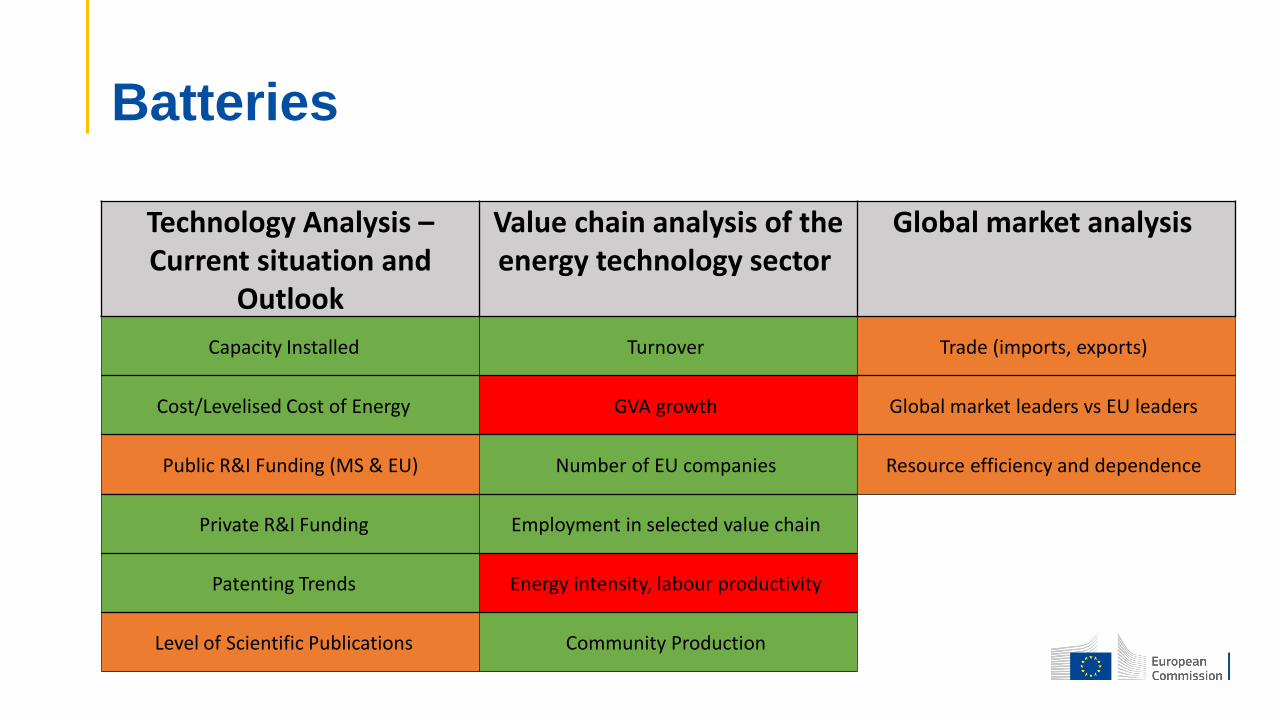
Batteries
Technology Analysis –Current situation and
Outlook
Value chain analysis of the energy technology sector
Global market analysis
Capacity Installed Turnover Trade (imports, exports)
Cost/Levelised Cost of Energy GVA growth Global market leaders vs EU leaders
Public R&I Funding (MS & EU) Number of EU companies Resource efficiency and dependence
Private R&I Funding Employment in selected value chain
Patenting Trends Energy intensity, labour productivity
Level of Scientific Publications Community Production

Electrolysis for production of renewable hydrogen
Technology Analysis –Current situation and
Outlook
Value chain analysis of the energy technology sector
Global market analysis
Capacity Installed Turnover Trade (imports, exports)
Cost/Levelised Cost of Energy GVA growth Global market leaders vs EU leaders
Public R&I Funding (MS & EU) Number of EU companies Resource efficiency and dependence
Private R&I Funding Employment in selected value chain
Patenting Trends Energy intensity, labour productivity
Level of Scientific Publications Community Production

• Focus: smart metering, home energy management systems (HEMS), low-voltage (LV) power
distribution
• Why:
→ “Smart grids” are the electricity network of the energy transition: i) more efficient &
effective operations & maintenance of the grid, ii) integration of distributed renewable energy
into the electricity system, iii) demand-side flexibility (and energy services offered by third
parties).
→ widest possible deployment of smart meters and energy management systems (at grid
and consumer side), smart energy equipment and appliances in an interoperable ecosystem.
→ to be complemented with the digitalisation (or simply automation sometimes) of the
distribution grids, meaning (mostly) the rollout of modernised cabling and sensors, as well as
advanced distribution management systems.
Smart distribution, metering and charging(working title)

Heat pumps
Technology Analysis –Current situation and
Outlook
Value chain analysis of the energy technology sector
Global market analysis
Capacity Installed Turnover Trade (imports, exports)
Cost/Levelised Cost of Energy GVA growth Global market leaders vs EU leaders
Public R&I Funding (MS & EU) Number of EU companies Resource efficiency and dependence
Private R&I Funding Employment in selected value chain
Patenting Trends Energy intensity, labour productivity
Level of Scientific Publications Community Production

Renewable fuels: aviation and shipping
Technology Analysis –Current situation and
Outlook
Value chain analysis of the energy technology sector
Global market analysis
Capacity Installed Turnover Trade (imports, exports)
Cost/Levelised Cost of Energy GVA growth Global market leaders vs EU leaders
Public R&I Funding (MS & EU) Number of EU companies Resource efficiency and dependence
Private R&I Funding Employment in selected value chain
Patenting Trends Energy intensity, labour productivity
Level of Scientific Publications Community Production

Thank you!

2.2 Energy and resource trends
• Primary & final energy intensity, renewable energy share in gross final energy consumption, net import
dependency, industrial electricity and gas prices.
• Share of EU energy sector in EU GDP (turnover), value added of the clean energy sector (incl for RES
and EE), labour productivity (GVA per employee).
2.3 Human capital
• Jobs in clean energy technologies in EU vs RoW
2.4 Research and Innovation trends
• Public R&I spending (absolute and % of GDP)
• Private R&I spending (absolute and % of GDP)
• (High value) patents
The analysis for the above 3 sub-sections will be done at MS level where possible.
Outline of the report (1/4)
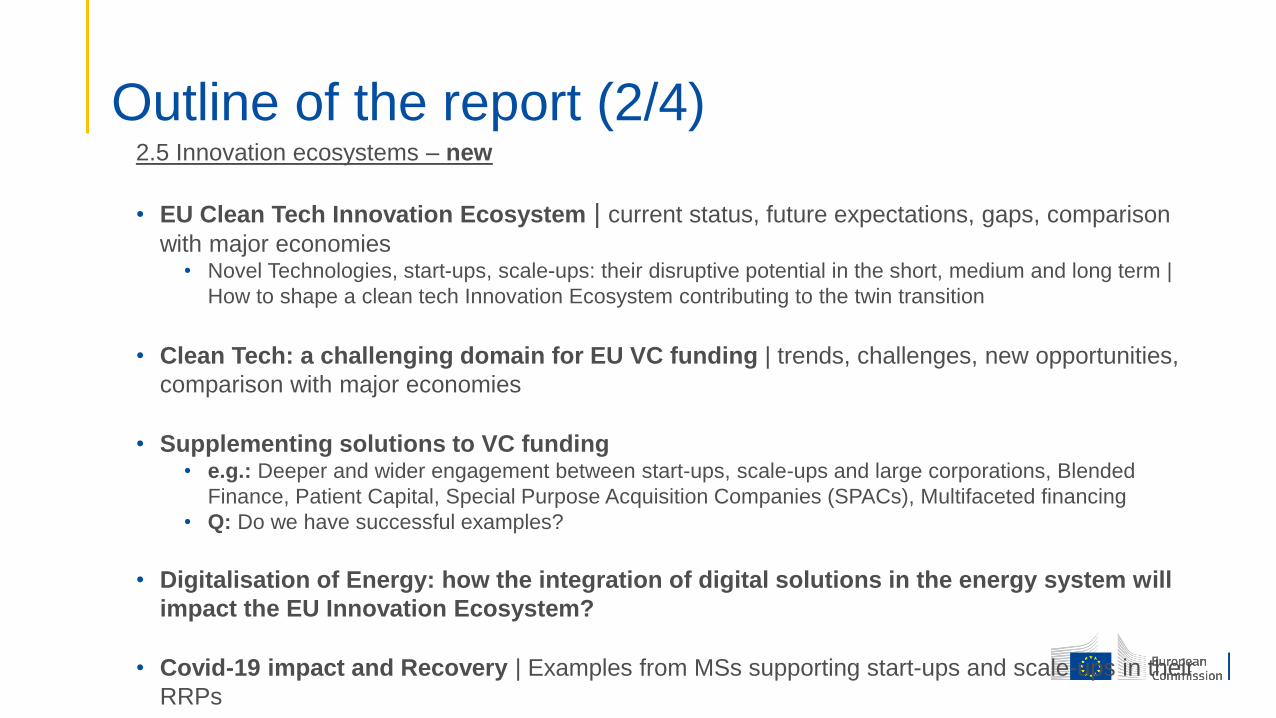
2.5 Innovation ecosystems – new
• EU Clean Tech Innovation Ecosystem | current status, future expectations, gaps, comparison
with major economies • Novel Technologies, start-ups, scale-ups: their disruptive potential in the short, medium and long term |
How to shape a clean tech Innovation Ecosystem contributing to the twin transition
• Clean Tech: a challenging domain for EU VC funding | trends, challenges, new opportunities,
comparison with major economies
• Supplementing solutions to VC funding• e.g.: Deeper and wider engagement between start-ups, scale-ups and large corporations, Blended
Finance, Patient Capital, Special Purpose Acquisition Companies (SPACs), Multifaceted financing
• Q: Do we have successful examples?
• Digitalisation of Energy: how the integration of digital solutions in the energy system will
impact the EU Innovation Ecosystem?
• Covid-19 impact and Recovery | Examples from MSs supporting start-ups and scale-ups in their
RRPs
Outline of the report (2/4)

2.6 Covid-19 impact and recovery – new
• Impact of pandemic on clean energy transition
• How Recovery and Resilience Plans respond to this impact
2.7 Innovative business/cooperation models – new
• Virtual Power Plants (VPPs) and peer-to-peer trading → link with tech section on “Smart distribution,
metering and charging”
• Energy communities
• Integrated service packages
• E.g. Retrofit packages that combine energy-efficient and smart-ready/ demand response-enabled technologies
• Innovative financing models
Outline of the report (3/4)

3. Focus on key clean energy technologies and solutions
1. Wind (offshore and onshore)
2. Solar photovoltaics
3. Batteries
4. Electrolysis technology to produce renewable hydrogen
5. Smart distribution, metering and charging
6. Heat Pumps
7. Renewable fuels: aviation and shipping
Outline of the report (4/4)
Grid optimization & timely solutions
Ivan PinedaDirector for Public AffairsWindEurope

We must maximise assets utilisation: Wide deployment of grid optimisation technologies
Europe needs to more than double its annual grid infrastructure investments to deliver climate neutrality
But lead time tobuild is too long!

German situation today1BillionEur/Year congestion costs!
0 200 400 600 800 1000 1200
0 5,000 10,000 15,000 20,000 25,000 30,000
2013
2014
2015
2016
2017
2018
2019
Cost [mEUR]
GWh
Redispatch and RE curtailment measures
and costs
Redispatch RE curtailment
Redispatch cost Curtailment cost
Source: Monitoring Reports by Bundesnetzargentur
Insufficient grid capacity to
accommodate power flows
from Energy Transition
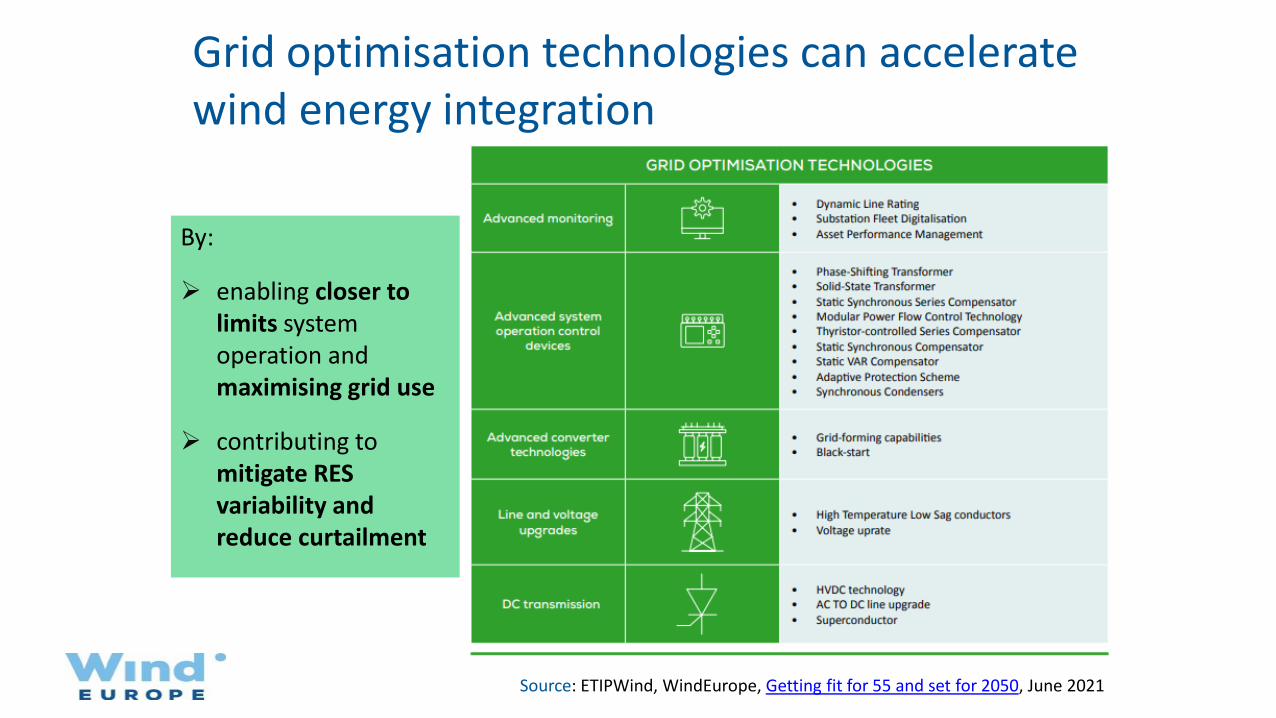
By:
➢ enabling closer to limits system operation and maximising grid use
➢ contributing to mitigate RES variability and reduce curtailment
Grid optimisation technologies can accelerate wind energy integration
Source: ETIPWind, WindEurope, Getting fit for 55 and set for 2050, June 2021

Our recommendations
1. Incentivise TOTEX-saving investments, move away from onlyCAPEX-based ones
▪ Re-visit CBA to factor short and long-term grid optimisation
▪ Include grid optimisation in system planning
2. Align system planning with the EU Green Deal objectives▪ continuous, open, flexible▪ Incentivise grid-optimisation in cross-border infrastructure
planning
3. Apply grid smartness indicators▪ to planning, operation, asset management, and innovation

WindEurope, Rue Belliard 401040 Brussels, Belgium
windeurope.org
THANK YOU
GRID OPTIMISATION TECHNOLOGIES PAPER:https://windeurope.org/wp-content/uploads/files/policy/position-papers/20200922-windeurope-grid-optimisation-technologies-to-build-a-greener-europe.pdf

BACK-UP

Grid optimisation project examples
The technologies are there and proven; still not widely deployed
Dynamic Line RatingElia/Ampacimon, Belgium
Modular power flow control withSmartValve devices
National Grid/Smart Wires project, Great Britain
Hybrid STATCOMTennet/Hitachi ABB project, Germany

RWTH Aachen University/Orsted study
➢ On the further integration of offshore capacities in the North Sea
▪ 3GW more than the current 2030target with network optimizationmeasures
▪ Dynamic Line Rating alone can reducecongestion management costs byreducing redispatch by 6,8TWh/a andrenewables curtailment by 2,5TWh/ain the German grid developmentscenarios
▪ Significant similar conclusions also forPhase-Shifting Transformers and HVDC

Trends of the grid enhancing technologiesPanel discussion
Susanne NiesCurrENT
Jochen KreuselT&D Europe
Mark van StiphoutDG ENER
Uroš SalobirENTSO-E
Christos DikeakosENTSO-E
Ivan PinedaWindEurope

What’s next for the Technopedia?
Uroš SalobirVice-chair of RDI CommitteeENTSO-E

Thank you for joining us!
Visit Technopedia @ https://www.entsoe.eu/Technopedia/
How to improve Technopedia?Send us an email to [email protected] if you miss a technology and the ENTSO-E team will consider the necessary modifications in the tool