technology in schools: evaluation of kentucky’s student technology...
TRANSCRIPT

Technology in Schools: Evaluation of Kentucky’s Student Technology Leadership Program (STLPTM)
The ATEC at CNAC, 4825 Mark Center Drive, Alexandria, VA 22311
Policy and Planning Series #104 July 2002
Apriel K. Hodari • Jennie W. Wenger Produced by The CNA Corporation A partner of the Appalachian Technology in Education Consortium

The Appalachian Technology in Education Consortium (ATEC) is one of ten regional consortia funded by the U.S. Department of Education to promote effective use of technology in K-12 education. For more information go to www.The-ATEC.org, or contact the authors at [email protected].
Executive Summary
The Kentucky Student Technology Leadership Program (STLP) exists to promote the use of tech-
nology in Kentucky’s classrooms. In general, we find that the program achieves this goal. The pro-
gram also provides additional benefits to students, teacher-coordinators, and schools beyond those
related to technology and learning in the classroom.
We used data from several sources during the course of our analysis of Kentucky’s STLP. First, we
used a national dataset to measure access to and participation in STLP by Kentucky students. We
also interviewed STLP students and coordinators at regional conferences. Finally, we conducted an
online survey of STLP coordinators.
Findings
The students we interviewed were overwhelmingly enthusiastic about the STLP. They reported that
the program has increased their technology-related skills, and has given them valuable practice in
interacting with other students and teachers. STLP provides an opportunity for students to train
other students and teachers in the use of technology.
Coordinators also reported that students learn about technology, and about leadership, through
STLP. In addition, coordinators cited many benefits for themselves; most benefits concerned use of/
comfort with technology. More than one in four coordinators said that the STLP makes it more
likely they will “remain in the school system.” Given the time commitment required to participate in
STLP and the lack of remuneration, this result is remarkable.
It is clear that schools, too, benefit from STLP. STLP groups perform a number of service projects
for schools that may include working on the school’s website or television station. STLP students of-
ten help with the day-to-day computer maintenance in schools, both through staffing help desks and
through less formal arrangements; coordinators indicated that this type of assistance is crucial in
keeping school computers and networks functioning.
1
There is no single model of success in STLP. Flexibility is a key strength of the program; it allows
individual coordinators to tailor the program to their students, school, and community. For exam-
ple, programs meet daily as a class or less often as a club. Some groups produce intra-school media
(TV station, news crew, website), some produce products (clocks, tote bags, mouse pads, magnets),
and some run service desks (for people in the schools and in the surrounding community).
We define “successful” programs by three different metrics (official recognition, level of participa-
tion, and fulfillment of goals). We find successful programs are administered and organized very
much like all other programs. Even the way students join STLP (by simply expressing interest or by
more restrictive criteria) has no influence on success.
In general, we find that this program provides substantial benefits to students who participate, co-
ordinators, and schools. The projects and computer maintenance undertaken by STLP students
certainly provide substantial spillover benefits to other students in schools with STLPs. Addition-
ally, many of the teachers who serve as STLP coordinators state that the program increases the
chance they will remain
Recommendations
Based on the variety of successful programs, we recommend the following. Although coordinators
should retain control over most aspects of the program, access could be improved without compro-
mising quality if all programs were open to all interested students. We also recommend surveying
students to learn more about what students gain from STLP, as well as surveying non-participating
schools to learn about reasons for not participating.

Introduction
The Kentucky Student Technology Leadership Program (STLP) exists to promote the use of tech-
nology in Kentucky classrooms. In addition, the program places strong emphasis on fostering part-
nerships between students of various ages and technology skills, providing leadership opportuni-
ties, and developing activities that benefit the entire school and community. The Kentucky Division
of School Instructional Technology asked CNA to evaluate Kentucky’s STLPs. This evaluation in-
cluded several phases. We began with initial empirical analyses of which schools offer STLPs and
which students are enrolled in such programs. Next, we conducted site visits to two regional STLP
conferences in December 2001 (Regions 1 and 2). At these conferences, we interviewed numerous
students and STLP coordinators. We made an additional visit to the statewide Kentucky Teaching
and Learning Conference in March 2002. Finally, we fielded an electronic survey to STLP coordi-
nators in April 2002. This report details our findings from these visits, interviews, and surveys.
STLP Overview
The STLP is project driven and has relatively few guidelines in terms of structure, time commit-
ment, and so on. The program exists in elementary, middle, and high schools across the State of
Kentucky. About 60 percent of Kentucky schools have STLPs; the programs are most likely to exist
in middle and high schools, medium-sized schools, and schools in districts/regions where other
STLPs exist. STLPs serve as many as 28,000 students in Kentucky schools, over 4 percent of all Ken-
tucky public school students. Elementary school programs tend to be larger than programs in mid-
dle or high schools; girls are actually over-represented in elementary programs but under-
represented in middle and high school programs. Minority students are slightly over-represented
in elementary school programs, and are under-represented in middle and high school programs,
but to a lesser extent than are girls.1
1. See J. Wenger, Empirical Analysis of STLP Schools, September 2001, A Report to the Kentucky Division of School Instructional Technology (2001) for details on the number of programs and a characterization of which types of schools are most likely to have programs, as well as details by region. This report compares schools with STLP pro-grams to all Kentucky schools using the Common Core Data. See J. Wenger, Empirical Analysis of STLP Schools—Further Analysis: What Types of Students are Served by STLP Programs? A Report to Kentucky Division of School Instruc-tional Technology (2001) for details on representation of girls/minority students/total number of students in STLP programs. These numbers are estimated from data on a sub-sample of STLP programs.
3
Data Sources
To evaluate the STLP, we collected data from three different sources. First, we interviewed stu-
dents and coordinators at two STLP conferences. Then, we visited the statewide Kentucky Teach-
ing and Learning Conference. Finally, we surveyed STLP coordinators.
Specifics about each data collection source are given in this section. We discuss the general out-
come of these activities in the RESULTS section. Our data analysis methods are reviewed in appendix
A.
Interviews
We interviewed 36 students and 4 STLP coordinators at the regional meetings in Bowling Green
and Murray in December 2001. We asked a number of questions from the first draft of our elec-
tronic survey, but also allowed both students and coordinators to express their general views about
the STLP.
We selected students for the focus groups by choosing a random sub-sample of the school groups
attending the conferences.2 Thus, the focus groups are representative of students attending the
regional conferences, but they may not be representative of STLP students as a whole.
On average, each group had 6 students. There was wide variation in the number of students in
each group, with 1 individual interview and 1 group of 11 students. This variation resulted primar-
ily from the voluntary nature of the focus-group recruitment. The students we interviewed ranged
from 5th graders to high school seniors, in a fairly even distribution. The focus group interviews
lasted from 30 to 45 minutes. A text copy of the protocol is included in Appendix B.
We also interviewed coordinators who had breaks in their schedule; like the students, the coordina-
tors were a random group of those attending the regional conferences but may not represent all
STLP coordinators.
4
2. We requested that students meet with us in small groups; some were unable to do so because of scheduling.
Surveys
We conducted a web-based survey of all STLP coordinators during April and May of 2002. We re-
ceived responses from 339 individuals. We estimate that there are over 900 STLPs in Kentucky to-
day.3 Therefore, the response rate to our survey was approximately thirty-five percent.
This estimate allows us to re-calculate the total number of Kentucky students served by STLP com-
pared to our initial estimate. The average programs involved 27 students. Therefore, using our sur-
vey data, we estimate that the program serves about 26,000 students.4
The survey included information on several facets of STLPs and coordinators.5 We asked about
background and experience of coordinators, computer access, how STLPs are formed and how of-
ten they meet, how much time coordinators spend on the program, coordinators’ vision of the pro-
gram and their role, and how the presence of STLP affects computer maintenance. Also, we asked
open-ended questions about additional benefits and drawbacks to the program.
Conference Visits
Along with interviewing coordinators at the regional conferences, we were able to see projects pre-
sented by various STLP groups and to have short conversations with a number of STLP students.
The Kentucky Teaching and Learning Conference included a number of displays and projects by
STLP groups from across the state; at this conference, too, we talked with individual students. In
addition, we toured several schools in Louisville during the KTLC conference; in two of the
schools, we spoke with STLP students and coordinators.
Results
In this section, we discuss the results of our surveys and interviews. We begin by providing back-
ground information on STLP coordinators and STLP students. We discuss several aspects of how
STLPs operate; we focus on how programs are formed, how often they meet, what types of projects
students complete, and benefits/drawbacks of the programs expressed by coordinators.
5
3. For details on sampling methods and response rate, see appendix A. 4. This figure matches up well with our earlier approximation of 22,000-28,800 students; see Empirical Analysis of STLP Schools. This also suggests that our sub-sample of those who answered the survey is fairly representative of all STLPs, at least in terms of program size. 5. The full survey is shown in appendix D.

STLP Coordinators
First, we focus on the coordinators. In both interviews and survey responses, we collected data on
the types of positions and experience coordinators have within the school system. We also examine
data on the coordinators’ access to technical assistance and professional development, as well as
their retention in the program.
Types of Positions and Experience. We gave respondents several opportunities to describe their posi-
tions and experiences. STLP coordinators are most often teachers, but they may also hold various
other positions within the school community. Of the survey respondents, 60 percent are teachers.
(Table 1 summarizes our data on STLP coordinators.) Any adult associated with the school may
serve as STLp coordinator. Judging from interviews, conversations with STLP participants, and re-
sponses to other open-ended questions on the survey, the other 40 percent are most likely made up
of media specialists, technology coordinators, and perhaps some administrators. The coordinators
are overwhelmingly female: 67 percent of teacher-coordinators and 91 percent of non-teacher co-
ordinators are women. Ninety-seven percent of the sample participants identified themselves as
white.
We also asked about years of experience. Among STLP coordinators who are teachers, the average
has 12 years of experience but about half of the teachers have fewer than 9 years of experience.
Non-teacher coordinators actually have more experience, with an average of 17 years. Table 1 indi-
cates that, on average, teachers have taught in the current schools for 8 years. In fact, about 40 per-
cent have never taught anywhere else.
This distribution of experience is somewhat different from that of all teachers in the U.S. and all
teachers in Kentucky.6 Specifically, STLP coordinators are more likely to have less than 10 years of
experience (and less likely to have over 20 years of experience) than all teachers in the U.S. or in
Kentucky. We also compare class sizes. According to STLP teachers, the median class size is 24 stu-
dents; this matches the average class size reported for all Kentucky schools (NCES 2002).
Roles of STLP Coordinators. We asked coordinators an open-ended question about their perceptions
of their role as coordinator. The answers indicate that STLP coordinators generally see their role as
that of “facilitator” or “guide,” rather than as a more traditional teacher. Some did use the verb “to
6
6. Digest of Education Statistics, 2001 (National Center for Education Statistics) lists percentage of teachers by ex-perience level for the U.S. and each state for 1993-94, the most recent year for which these data are available.

teach” in the open-ended description of their role, but most talked about mentoring, coordinating,
planning, and coaching. Their vision includes a central role for students—whom they see as pass-
ing knowledge on to their peers, and even to other teachers. The coordinators view their role as
facilitating the students’ exploration of technology. The following quotes are representative of an-
swers to this question.
To lead and guide the students so they can improve their technology skills, serve the school community, and pursue any interests or projects they’d like to explore. To expose the students to many forms of technology in our school, to encourage them to expose other students, and to encourage them to use many other forms of technology outside the school environment in a safe and responsible way. As the STLP Coordinator, I perceive my role as facilitator of learning. I am there to introduce new ideas and expand on previous technology skills. Guide, mentor, facilitator I perceive myself as an advisor to the group, assisting with obtaining informa-tion to help the students gain technical skills.
We asked about time spent administering the program and time spent with students. The typical
coordinator reports spending one to two hours per week on bureaucratic details of the STLP.
Roughly 25 percent spend an hour or less per week; 11 percent spend four to eight hours, and less
than 4 percent of those answering this question spend more than eight hours per week on the bu-
reaucratic details of the program. Thus, for most coordinators, the paperwork does not appear to
be overly onerous. The median teacher also reports spending two to four hours per week mentor-
ing students. Nearly one-third of coordinators spend fewer than two hours per week on mentoring;
another third spend a day or more per week mentoring STLP students. Not surprisingly, the
amount of time spent mentoring varies with the way the STLP is structured. For example, those
who teach STLP as a class generally report mentoring each day, whereas the vast majority of those
who meet once per week or less report spending fewer than four hours per week on mentoring.
Access to Technical Assistance and Professional Development. STLP coordinators report that they have ac-
cess to technical help and professional development: 92 percent report having a trained School
Technology Coordinator (STC), 96 percent report having professional development (PD) in tech-
nology available, and 95 percent report taking part in professional development. (Those in Re-
gions 2 & 7 are disproportionately likely to report not having a School Technology Coordinator;
this difference is statistically significant.) 7
7
7. This difference is statistically significant at 0.5 percent, meaning there is less than a one-in-two hundred chance that the result is random in nature.
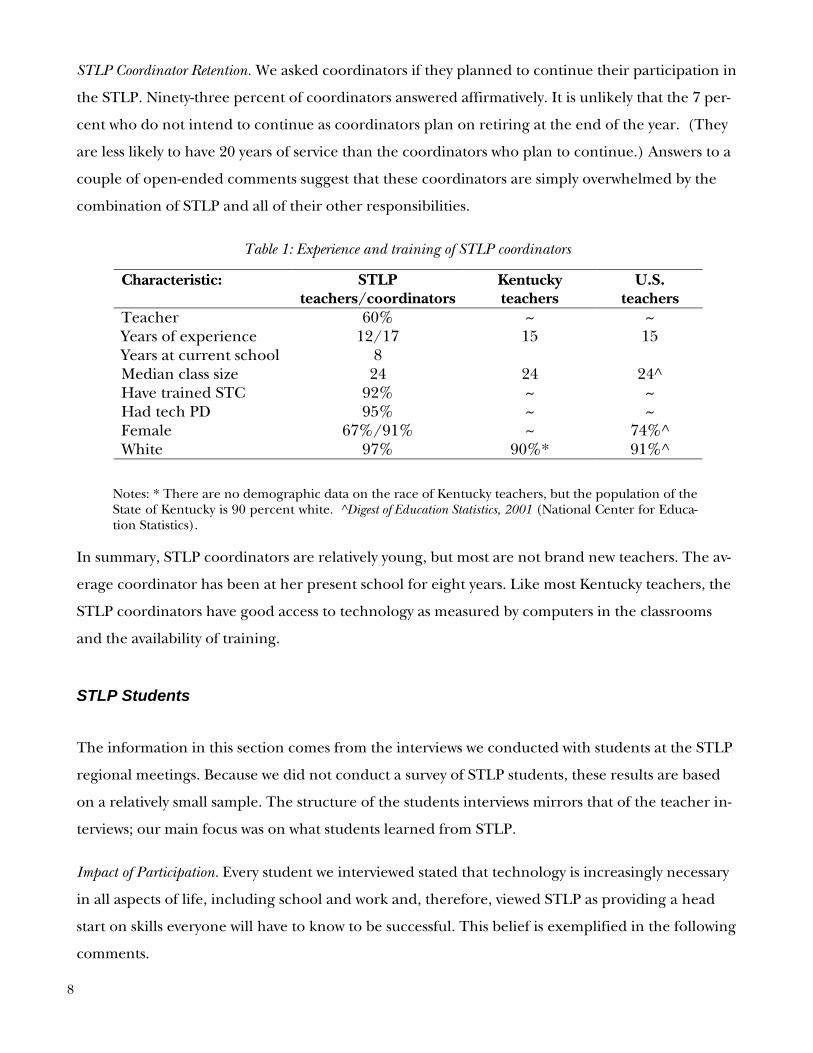
STLP Coordinator Retention. We asked coordinators if they planned to continue their participation in
the STLP. Ninety-three percent of coordinators answered affirmatively. It is unlikely that the 7 per-
cent who do not intend to continue as coordinators plan on retiring at the end of the year. (They
are less likely to have 20 years of service than the coordinators who plan to continue.) Answers to a
couple of open-ended comments suggest that these coordinators are simply overwhelmed by the
combination of STLP and all of their other responsibilities.
Table 1: Experience and training of STLP coordinators
Notes: * There are no demographic data on the race of Kentucky teachers, but the population of the State of Kentucky is 90 percent white. ^Digest of Education Statistics, 2001 (National Center for Educa-tion Statistics).
In summary, STLP coordinators are relatively young, but most are not brand new teachers. The av-
erage coordinator has been at her present school for eight years. Like most Kentucky teachers, the
STLP coordinators have good access to technology as measured by computers in the classrooms
and the availability of training.
STLP Students
The information in this section comes from the interviews we conducted with students at the STLP
regional meetings. Because we did not conduct a survey of STLP students, these results are based
on a relatively small sample. The structure of the students interviews mirrors that of the teacher in-
terviews; our main focus was on what students learned from STLP.
Impact of Participation. Every student we interviewed stated that technology is increasingly necessary
in all aspects of life, including school and work and, therefore, viewed STLP as providing a head
start on skills everyone will have to know to be successful. This belief is exemplified in the following
comments.
Characteristic: STLP teachers/coordinators
Kentucky teachers
U.S. teachers
Teacher 60% ~ ~ Years of experience 12/17 15 15 Years at current school 8 Median class size 24 24 24^ Have trained STC 92% ~ ~ Had tech PD 95% ~ ~ Female 67%/91% ~ 74%^ White 97% 90%* 91%^
8
[STLP] has made me get friendlier with computers. STLP, to me, represents more than the STLP program. I think technology will be a part of my life.
Students cited many examples of professions in which they will be able to use the skills they are
learning in STLP, including teacher, marine pilot, artist, and orthodontist. They even talked about
changing their aspirations to more technology-intensive fields, based on their STLP experience.
One student mentioned that his focus was changed from what he could get out of working
(becoming a rich man) to what he could offer (skills and help to others).
Learning. We asked students about both the technical and the general skills they learned from
STLP. As expected, many of their experiences combined both kinds of skills, but the main thing
STLP seems to provide is the time and space to increase knowledge or interest the students already
had. In some cases, they did learn things that were wholly new, including things that they were sur-
prised that they could learn, but this was more often the case with younger students.
Another key aspect of the learning that takes place in STLP is the fact that it is informal and ex-
ploratory in nature. Students report that they often learn things by trying or from older students
who are around to help out, rather than by more traditional means. This meshes well with coordi-
nators’ self-description of their roles as those of coaches rather than formal teachers. Comments
from the student interviews include the following.
I’ve taught classes at the school about Dreamweaver and ACL. Many people from STLP, mainly have more advance technology skills than I do have helped me, because when I first came to this, I was kind of, computer illit-erate. I had no skills. And know [sic], at least, I know how to do some things, which is really great. So other people have helped me who have been through the program.
Technical. Students come to STLP with a wide variety of technical abilities, and are learning a wide
range of skills. They learn to develop web pages, maintain hardware, use video equipment, create
and edit graphics, and compose digital music. Several of the students talked about learning how to
use particular software packages, such as Power Point and Adobe Photoshop.
General. Students also indicated that they learned many non-technical skills through participation
in STLP. Included among these was the opportunity to teach other students, and even teachers, in
the same informal ways in which they have learned in STLP. Students gain pride and confidence
from these experiences, as these quotations show. 9

10
A lot of times we have teachers asking us how to do things on the computers. Like Pat's science teacher, she's trying to help do graphs with her kids. And I sat down with her one last period and showed how to do it and how she can make different graphs and stuff. You know the teachers look up to us, too and compliment us. You learn more political skills. Because the technology is related to the central [B]oard of [E]ducation so – I never had a connection to the board before. But now I see what goes on – you do them a favor, they do you a favor, type of stuff.
Students also learn how to deal with the pressure of being seen as the expert, as this excerpt illus-
trates:
[Student] Sometimes, it's a whole lot of pressure because when somebody is asking you to do something, you're like, sure I know that. Then they ask you something else and you don't know. You feel like you should know, because with that tech-nology you think that if [pause] what if I didn't pay attention in class. Like, how they think that I'm not a good student because I don't know that or some-thing. It's like a whole lot of pressure to really pay attention and know your stuff.
[Interviewer] So how do you deal with that? [Student] Tell them that you’ll find out and get back to them.
Not only has the student learned that he or she can deal with a high-pressure situation, but also that
it’s acceptable for experts not to know everything all of the time. This is an important lesson, and one
that often makes learning difficult things more accessible to all students, not just the superstars.
Students also reported learning “a lot of skills you can’t learn in the classroom,” such as teamwork,
communication, phone etiquette, and public relations. One student explained the most important
general skill he learned this way.
I have had the ability to practice my organizational skills a little bit more, which, if you ask any of my teachers in any of my classes that I've ever had, [group laugh-ter] I'm sort of lacking in that area.
Clearly, this is something that will serve him well throughout his life.
STLP Operations
One goal of the survey was to learn details about how STLPs operate. We were interested in how STLP
groups formed, what types of projects the groups undertook, and how often they met. We wanted to
learn how these factors varied with the age of students involved, and we wanted to see if “outstanding”
programs operated in fundamentally different ways from other programs. In addition, results from

our interviews with students and coordinators suggested that STLP students make substantial con-
tributions to their schools by helping to resolve technical and computer-related problems. Several
questions on the online survey were designed to quantify the effect of STLP students on their
school technology resources.
Student Recruitment. One question on the survey deals specifically with how coordinators promote
the STLP: (a) talking about STLP with other teachers (84 percent), (b) making school-wide an-
nouncements about STLP (63 percent), and (c) making speeches about STLP (18 percent). (In
each case, the modal response is the use of all three methods; the typical STLP coordinator talks
with teachers, talks with parents, and makes school-wide announcements about STLP.) Among the
other methods listed were a number that capitalized on the use of technology. Examples include
use of a web page for promotion, as well as video and audio projects, and use of the schools’ closed-
circuit television stations.
We also asked the students we interviewed how they got into STLP. For whatever reason, most of
the students we interviewed were selected by some means, most of which seemed to be linked to
good academic performance. As one student said, “if you’re advanced in reading and another sub-
ject, they’ll pull you into [C]onnect … you have two class periods at the end of the day, and you get
to work on this.” One group of students even had an academic requirement to stay in STLP. The
following excerpt from an interview illustrates what they think about this requirement.
[Brook] If you get below a B, you don't -- they will kick you out of [C]onnect and STLP, and put someone else in so it is like a chal-lenge.
[Interviewer] What do you do guys think about that? [Brook and Lana] I think it's fair. [Brook] Everybody is given a fair chance. [Lana] If you don't get a good grade, then that means that you are not doing your work
and that means you're hurting everyone else in your group. So you shouldn't be able to stay on if you're not doing your work.
[Interviewer] Does that feel like a lot of pressure to you? [Brook] No. [Dr. Seuss] Sometimes. [Interviewer] Sometimes?
11
[Dr. Seuss] When your deadline is like two days away and you’re like half way done. You think you are doing good.
[Interviewer] So how do you guys deal with that? [Brook] Stay after school. And then try to keep up with what you're given. [Lana] The next time go a whole lot quicker.
Some of them heard about STLP from older students and friends, and many of them talk to their
friends about joining the program as well. As one student put it, “… I told all my friends, I said,
‘you want to be in STLP, you have to do fun stuff.’ So they really got excited.”
Because one of STLP’s goals is to encourage participation from under-represented groups, we
asked a specific question about how coordinators accomplished this. The vast majority (73 percent)
reported that they “encourage participation from all students equally.” However, 41 percent (and
38 percent of those who report they “encourage participation... equally”) also report that they “talk
to individual under-represented students to encourage their participation and success.” Also,
roughly half the sample (and nearly half of those who “encourage participation from all students
equally”) report that they “divide tasks in such a way that different students are assigned tasks they
are most comfortable carrying out.” Therefore, although there is little evidence of broad-based re-
cruitment of under-represented groups, coordinators seem to do things that they feel will encour-
age individual students.
In response to the question, “I recruit under-represented students by…” 15 percent of respondents
indicated they used alternate method(s) but many were not specific about the method. However,
judging from their open-ended answers to how they promote awareness of STLP, many stated that
they target students by asking current STLP students to recruit friends; some target students by
speaking to teachers, and some even “draft” students initially into the program.
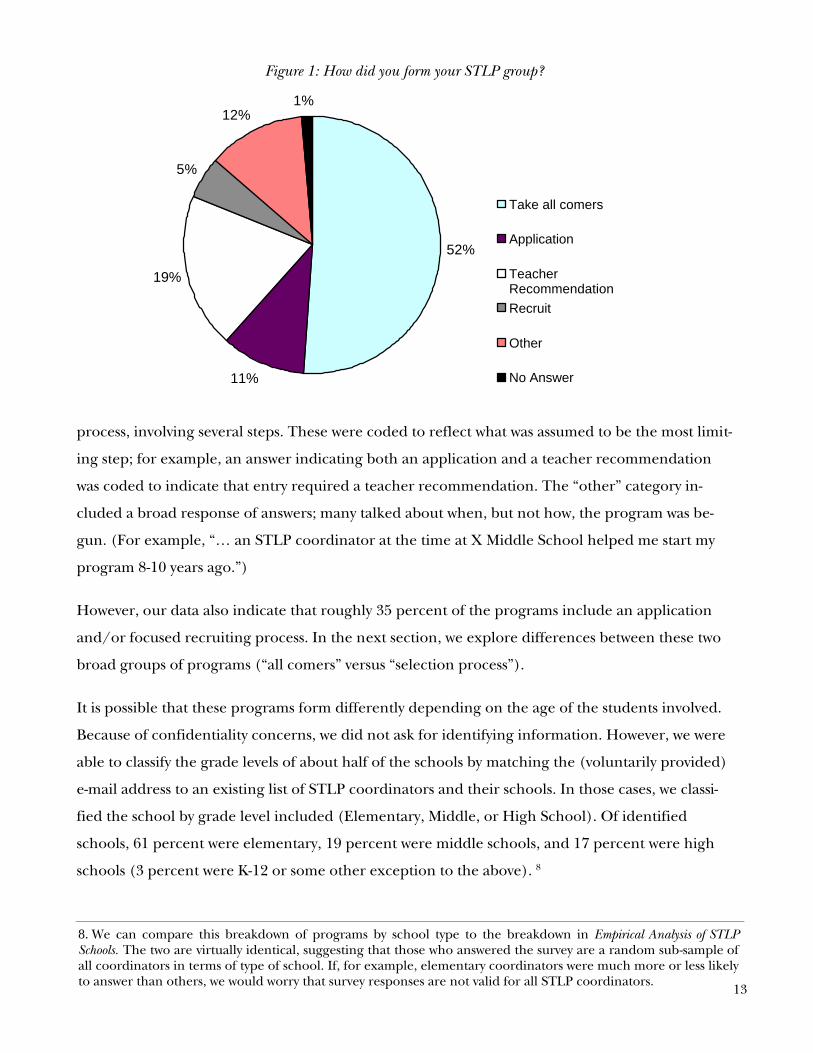
Program Formation. The survey included an open-ended question asking about how the STLP was
formed. We classified the answers into 5 categories: take all comers; application; teacher recom-
mendation; recruitment; other; no answer. The distribution of responses is shown in Figure 1.
Roughly half of the programs accepted all students who showed an interest. Some answers made it
difficult to discern the true process by which students were accepted. However, if the STLP coordi-
nator listed an application but no requirements and did not suggest students were chosen among
applicants, the program was coded as taking all comers. Some answers suggested a complicated
12
8. We can compare this breakdown of programs by school type to the breakdown in Empirical Analysis of STLP Schools. The two are virtually identical, suggesting that those who answered the survey are a random sub-sample of all coordinators in terms of type of school. If, for example, elementary coordinators were much more or less likely to answer than others, we would worry that survey responses are not valid for all STLP coordinators.
process, involving several steps. These were coded to reflect what was assumed to be the most limit-
ing step; for example, an answer indicating both an application and a teacher recommendation
was coded to indicate that entry required a teacher recommendation. The “other” category in-
cluded a broad response of answers; many talked about when, but not how, the program was be-
gun. (For example, “… an STLP coordinator at the time at X Middle School helped me start my
program 8-10 years ago.”)
However, our data also indicate that roughly 35 percent of the programs include an application
and/or focused recruiting process. In the next section, we explore differences between these two
broad groups of programs (“all comers” versus “selection process”).
It is possible that these programs form differently depending on the age of the students involved.
Because of confidentiality concerns, we did not ask for identifying information. However, we were
able to classify the grade levels of about half of the schools by matching the (voluntarily provided)
e-mail address to an existing list of STLP coordinators and their schools. In those cases, we classi-
fied the school by grade level included (Elementary, Middle, or High School). Of identified
schools, 61 percent were elementary, 19 percent were middle schools, and 17 percent were high
schools (3 percent were K-12 or some other exception to the above). 8
13
52%
11%
19%
5%
12%1%
Take all comers
Application
TeacherRecommendationRecruit
Other
No Answer
Figure 1: How did you form your STLP group?
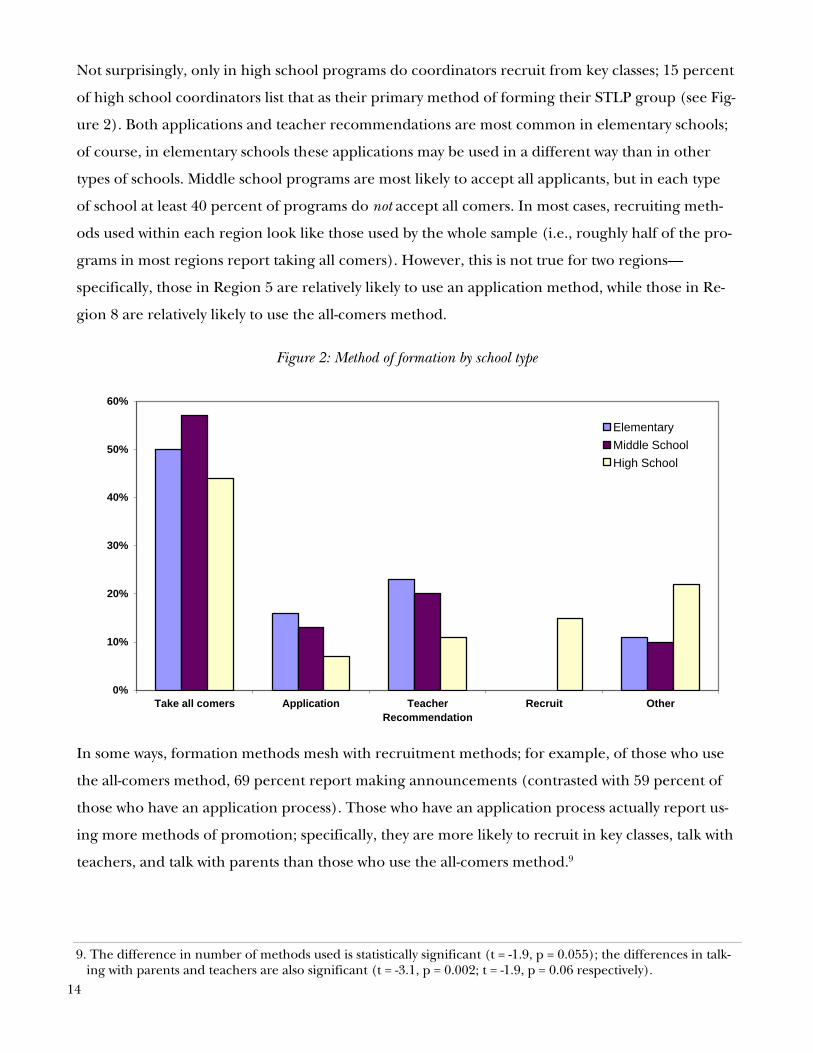
Not surprisingly, only in high school programs do coordinators recruit from key classes; 15 percent
of high school coordinators list that as their primary method of forming their STLP group (see Fig-
ure 2). Both applications and teacher recommendations are most common in elementary schools;
of course, in elementary schools these applications may be used in a different way than in other
types of schools. Middle school programs are most likely to accept all applicants, but in each type
of school at least 40 percent of programs do not accept all comers. In most cases, recruiting meth-
ods used within each region look like those used by the whole sample (i.e., roughly half of the pro-
grams in most regions report taking all comers). However, this is not true for two regions—
specifically, those in Region 5 are relatively likely to use an application method, while those in Re-
gion 8 are relatively likely to use the all-comers method.
Figure 2: Method of formation by school type
In some ways, formation methods mesh with recruitment methods; for example, of those who use
the all-comers method, 69 percent report making announcements (contrasted with 59 percent of
those who have an application process). Those who have an application process actually report us-
ing more methods of promotion; specifically, they are more likely to recruit in key classes, talk with
teachers, and talk with parents than those who use the all-comers method.9
14
9. The difference in number of methods used is statistically significant (t = -1.9, p = 0.055); the differences in talk-ing with parents and teachers are also significant (t = -3.1, p = 0.002; t = -1.9, p = 0.06 respectively).
0%
10%
20%
30%
40%
50%
60%
Take all comers Application TeacherRecommendation
Recruit Other
ElementaryMiddle SchoolHigh School

Meeting Frequency. Another measure of how different programs operate is frequency of meeting. As
shown in Figure 3, programs are most likely to meet once per week (35 percent of coordinators se-
lected this answer). Twenty-one percent meet daily (most because they teach an STLP class), 20
percent meet two to three times per week, and 24 percent meet less than once per week.
Figure 3: Frequency of STLP meeting by school type
Program interference with other activities. During the student interviews, we asked whether participating
in STLP interferes with other activities in which students are interested. The vast majority of them
said that it does not. One student even explained that STLP gives him a boost in other classes, as
illustrated by the following quote.
It usually helps. … Like on projects, it’s a whole lot easier to use Power Point and stuff, and be able to do that during our class time. Plus, since we have it during a period, and it’s one of our regular classes, it doesn’t usually take away from it.
A different group of students did express mild concerns, but indicated that they can usually work
around them, as this quote shows.
[Interviewer] So, other than what you already told me, is there any other effect of being in STLP, like on your other school work? Does it compete with other extra-curricular activities you might want to be in?
[Cat] Sometimes. Sometimes we stay after on Tuesdays, and sometimes
it will get switched because our counselor -- our teacher that helps us do it may have a meeting, that she can't stay. So it will be switched to Monday. And on Monday, we have Girl Scouts and Basketball Practice. And some other programs, so it does conflict a little bit.
15
0%
5%
10%
15%
20%
25%
30%
35%
40%
< Once / Week Once / Week 2-3 / Week Daily OutsideClass
Daily Class
Elementary SchoolMiddle SchoolHigh School
[Interviewer] So do the other teachers or whoever leads those other activities, do they usually un-derstand that? You can usually work that out?
[Cat] The child or the person gets to pick one of the other. Say like, one day they will
go to Girl Scouts and the other day, they will go to STLP and just call friends and see what they missed.
Projects. To get a more complete picture of STLP groups’ activities, we also asked about the length
of the typical STLP project. We find that project length varies. One-quarter of the survey respon-
dents report the average project is long term (taking a month or more); one-quarter report lengths
vary widely because projects tend to be request driven. Thirty-five percent report that projects gen-
erally take a couple of weeks; the remainder report that most projects are quite short term in na-
ture and are generally complete within a week. Project length also varies by school type. No school
type performs primarily short-term (week-long) projects; elementary schools are most likely per-
form projects that last a couple of weeks, while middle schools are most likely to do projects that
take a month or more. High schools are most likely to do request-driven projects, which vary in
length. This suggests that high school projects may largely consist of working at a Help Desk or re-
sponding to specific technology-related requests within the school. (In the next section, we explore
the extent to which STLPs affect the use and maintenance of technology within the schools.)
Students talked about many different kinds of projects during interviews, from making products to
sell (clocks, tote bags, mouse pads, magnets), to creating publicity materials for other service pro-
jects within the school and community, staffing a service desk open to the community, and helping
younger children. One community project involved collecting stories from local veterans, from
which the STLP students made a brochure. In another project, STLP students made booklets and
bookmarks to encourage younger students to read. In another, STLP students helped elementary
school students write letters to Santa.
Service Work. From responses to various survey questions, it is clear that STLP students do a great
deal of service work. Some projects focus on groups outside the school, but most are concerned
with the school’s technology.
We asked a question about the type(s) of service projects STLP groups engage in; 27 percent of co-
ordinators report that their STLP group staffs a computer help desk. (Some of the desks are also
available to help those outside the school, but most are for the school alone.) Over 20 percent re-
port partnership with another organization (outside the school). Forty-one percent report a service
project not included in the list. Of those, many concern maintaining the school’s website, cleaning
16
the school’s computers and printers, and providing video for news programs or movies. A number
of coordinators also list mentoring younger students, training the teachers (and other adults in the
community) in specific uses of technology, and engaging in specific community service projects. A
substantial number are doing projects for older people in the community. Some coordinators also
report projects that involve recycling printer cartridges and/or refurbishing surplus computers for
donation. In addition, 12 percent report that their STLP students have used the skills they have
learned to start or run a small business. This figure does not differ very much by school type. How-
ever, high school STLPs are much more likely to run computer help desks than middle or elemen-
tary school programs (nearly half of high school STLP coordinators report staffing a computer
desk to help those in and/or outside the school; this fits with the finding above that projects taken
on by high school STLPs tend to vary in length).
Even though only 16 percent of elementary coordinators report that their students staff a help
desk, 69 percent state that their STLP students service classroom computers. Of middle and high
school coordinators responding, 72 and 74 percent, respectively, report that STLP students service
their classroom computers. During interviews, a number of students spoke to us about being able
to help other students and teachers with technology problems. One of the coordinators said to us,
As STLP coordinator, and then also School Technology Coordinator, I could not survive without the (STLP) kids. They upgrade the McAfee [virus soft-ware], they troubleshoot for their own teachers, and the teachers know which ones to call on. And I could not keep up with maintenance [without them].
This suggests these students provide a great deal of technical assistance for their schools. Because
of these comments during the initial interviews, we attempted to measure how the presence of the
STLP has changed the level of computer problems experienced by teachers in the classroom. We
asked how likely it is that computers are offline today versus before the STLP, how many times
computer problems caused this particular teacher to change class plans, who fixed the most com-
mon problem, and how long the fix took. The majority of STLP coordinators report that com-
puters are about as likely to be offline as before STLP, but over a quarter report that the computers
are less likely to be offline (11 percent say they are actually more likely to be offline). A typical
STLP coordinator reports that computer problems caused him/her to alter class plans three times.
A few coordinators report intense problems (4 percent report having changed class plans 30 or
more times). Coordinators in Region 1 are more likely than expected to report intense problems;
no coordinator in Regions 6, 7, or 8 reported such problems.
17

We believe this finding indicates that technical competence within schools increases as a result of
STLP. Without increased technical competence, it is likely that the presence of such a program
would increase the number of computer problems simply because it should increase the use the
computers receive (by both coordinators and students). Therefore, the fact that only 11 percent of
coordinators say computers are more likely to be offline than before suggests a positive effect of
STLP on maintenance.
Impact on Computer Maintenance. We also asked who fixed the most common computer prob-
lem. Thirty percent of coordinators report fixing the problem themselves; another 15 percent re-
port that the STLP students fixed the problem. Forty-two percent reported that either the school
technology coordinator (STC) or the district technology coordinator (DTC) fixed the problem.
(Thirteen percent of the problems were resolved by others, including telephone repair people and
software/hardware support people.) Thus, even for the technologically savvy STLP coordinators,
STLP students provide a valuable resource to help keep computers functioning. Perhaps because
they are quite likely to run a help desk, high school STLP students are especially likely to assist with
common problems; among high school coordinators, 28 percent report that the STLP students
fixed the most common problem.
To measure how likely it is that technical problems disturb the use of computers in the classroom,
we also asked how long it took to resolve the most common problem. In many cases, the most com-
mon problem was resolved quickly. Almost half of coordinators report that it took less than one
hour. However, in 30 percent of cases, resolving the problem took more than one day. Quick reso-
lution is related to fixing the problem “locally.” In 54 percent of cases in which the STLP coordina-
tor or STLP students fixed the problem, the problem was solved in less than one hour. In contrast,
when someone outside the classroom fixed the problem, it was solved in less than one hour only 26
percent of the time. Thus, STLP students help to minimize the amount of time the computers are
offline. Taken together with the Help Desk activities of STLP groups, this suggests that these stu-
dents play a substantial role in keeping Kentucky’s classroom computers functioning, especially at
the high school level.
Hacking. One potential concern with giving students access to school computer systems is that it
may cause an increase in hacking and other unauthorized behavior. However, 69 percent of coor-
dinators state that, because of STLP, students are more likely to “understand the ethical/safe use of
computers [i.e., avoid hacking and other potentially harmful behavior].” As another measure of
such problems, we also asked how many incidents of hacking or unauthorized behavior the school
18
had experienced in the past year. Overall, coordinators report very low levels of hacking; the aver-
age is 1.2 incidents per year, but this is driven by a few schools that report many incidents. Sixty-
nine percent of all coordinators report no hacking incidents. Therefore, the average school had no
incidents over the previous year. Hacking is concentrated in high schools; 84 percent of elemen-
tary schools and 56 percent of middle schools report no incidents. In contrast, 68 percent of high
schools report at least one incident, and the median school reports two. Therefore, there are some
problems with unethical behavior but no problems that could be considered systemic. (Also note
that the question did not ask about incidents perpetrated only by STLP students; many of the hack-
ing incidents may have concerned other students.) Therefore, it seems fair to say that STLPs do
not cause pervasive hacking problems. Rather, STLP students make a substantial contribution to
the never-ending job of keeping each school’s computers functioning.
Presence of Technology in Kentucky Classrooms
One of the largest changes in education over the last 20 years is the steady infusion of computer
technology into schools and classrooms. Obviously, the STLP uses computers heavily. For that rea-
son, it is possible that the schools with the best or greatest number of computers are most likely to
have STLPs. To test this, we asked several questions about computer availability and internet access
on the online survey.
The typical STLP coordinator’s classroom contains 7 computers. There is significant variance in
the number of computers in the classrooms; one-quarter of teachers report having 2 or fewer,
while 5 percent report 33 or more. Non-teacher coordinators generally report having more com-
puters; 40 percent report having 25 or more. This suggests that a substantial number of the non-
teacher STLP coordinators run computer labs or have similar jobs, or perhaps simply that their
STLP groups meet in computer labs.
Almost all of the computers used by coordinators are hooked up to the internet; 97 percent report
that they have internet access on their computers. The same percentage report using the internet
for classroom purposes. Therefore, STLP coordinators have very good access to technology com-
pared to all U.S. teachers (see Table 2). However, this does not mean that STLP coordinators have
more or better computers than other Kentucky teachers. In Kentucky, 96 percent of schools and 93
percent of classrooms have internet access; in 87 percent of schools, at least half the teachers use a
19
10. R. A. Skinner, “Tracking tech trends,” Education Week 21(35), 53-67 (2002).
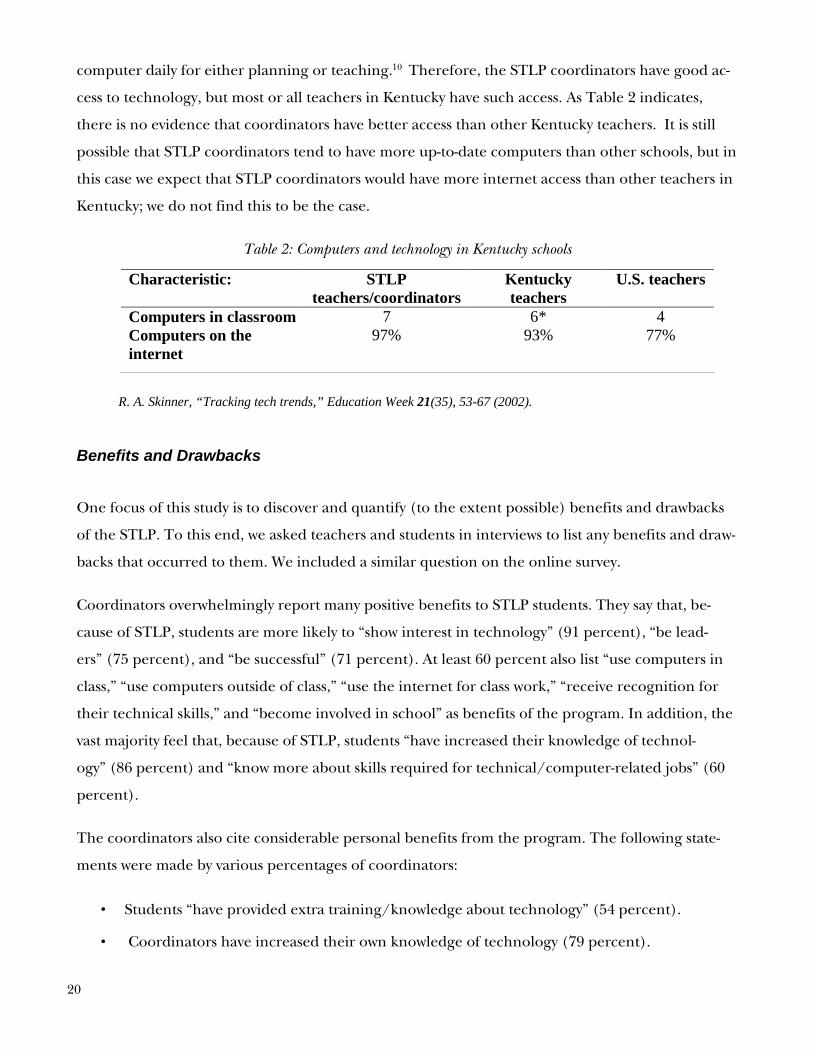
computer daily for either planning or teaching.10 Therefore, the STLP coordinators have good ac-
cess to technology, but most or all teachers in Kentucky have such access. As Table 2 indicates,
there is no evidence that coordinators have better access than other Kentucky teachers. It is still
possible that STLP coordinators tend to have more up-to-date computers than other schools, but in
this case we expect that STLP coordinators would have more internet access than other teachers in
Kentucky; we do not find this to be the case.
Table 2: Computers and technology in Kentucky schools
R. A. Skinner, “Tracking tech trends,” Education Week 21(35), 53-67 (2002).
Benefits and Drawbacks
One focus of this study is to discover and quantify (to the extent possible) benefits and drawbacks
of the STLP. To this end, we asked teachers and students in interviews to list any benefits and draw-
backs that occurred to them. We included a similar question on the online survey.
Coordinators overwhelmingly report many positive benefits to STLP students. They say that, be-
cause of STLP, students are more likely to “show interest in technology” (91 percent), “be lead-
ers” (75 percent), and “be successful” (71 percent). At least 60 percent also list “use computers in
class,” “use computers outside of class,” “use the internet for class work,” “receive recognition for
their technical skills,” and “become involved in school” as benefits of the program. In addition, the
vast majority feel that, because of STLP, students “have increased their knowledge of technol-
ogy” (86 percent) and “know more about skills required for technical/computer-related jobs” (60
percent).
The coordinators also cite considerable personal benefits from the program. The following state-
ments were made by various percentages of coordinators:
• Students “have provided extra training/knowledge about technology” (54 percent).
• Coordinators have increased their own knowledge of technology (79 percent).
Characteristic: STLP teachers/coordinators
Kentucky teachers
U.S. teachers
Computers in classroom 7 6* 4 Computers on the internet
97% 93% 77%
20

• They have learned new things (74 percent).
• They are more likely to use the internet for classroom work (57 percent).
• They are more likely to let the students do more of the work in the classroom (49 percent).
In addition, 28 percent of the coordinators state that, because of STLP, they are more likely to
“remain in the school system.” This is remarkable for a program that requires a fairly significant time
commitment but offers no extra remuneration for the substantial work it entails. When asked for
additional comments on the STLP, many coordinators remarked on general benefits of the pro-
gram.
It gives students experiences they would not have any other way. Leadership for students who are not the most popular. Give students a job and they feel more ownership in the school. It is so exciting to see students become involved in STLP! I wish our admini-stration would let us offer it as a class, not a club. Our students would benefit so much more. Several of our faculty have tried to show the benefit of offering STLP as a course in the form of a HELP DESK, but can’t sway the brass yet. But one thing is for sure, we will not give up, it is too important for our kids!!!!!!! Benefits for the students are too numerous to list. The coordinator receives great professional satisfaction while simultaneously increasing their knowledge of technology.
In terms of drawbacks, a few coordinators mentioned the lack of pay. However, the overwhelming
complaint was a lack of time—sometimes for scheduling meetings, but mostly for more prepara-
tion. Representative examples include the following.
Not enough time to spend with students! Finding time to work with students. It is difficult to run an effective STLP group when you cannot meet with them during the day. Our STLP time is scheduled at band and reading times, which prevents some students who would like to participate from being in STLP. Who has time? This is strickly [sic] volunteer on my part and I also have the Beta Club and Academic Team. Drawbacks—the enormous amount of time it takes to adequately serve the num-ber of students who would like to participate more fully, as teachers are pulled in all directions during ad after school.
21
Not enough time to plan due to regular classroom planning instruction. Scheduling is a difficult problem. Finding the time to work on various activi-ties. The benefits are numerous as indicated above. The drawback is time. I don’t feel I have enough time to run the program to be as successful as it could be. The time involved in providing a well structured and managed program can be significant. Creating lessons to meet the divergent skill levels seen in the stu-dents who participate in the program consumes much of the time I would nor-mally spend implementing repairs of my own throughout our campus. (Teacher of Technology classes)
Despite coordinators’ desire for more time both for planning and meeting, the STLP seems to of-
fer substantial benefits to students, and to coordinators.
STLP Success
To help determine the direction of future STLPs, we next examine the extent to which STLPs are
successful. The definitive measure of success might be a large increase in students’ use of technol-
ogy both inside and outside the classroom. Indeed, coordinators overwhelmingly say that students’
use of technology has increased because of the program. (See Benefits and Drawbacks section
above.) However, we have no quantifiable measure of the increased use of technology. For this rea-
son, we explore three other potential measures of success below.
Recognized Programs
STLP includes recognition of schools that demonstrate achievement of all six STLP goals. Eighteen
percent of the coordinators who responded are in charge of programs that are recognized as
“Gold”; another 6 percent are in charge of recognized “Silver” programs (35 percent of coordina-
tors have applied to become either a Gold or a Silver school). Recognition involves quite a bit of
work for the coordinator and the students; the program must submit an electronic scrapbook illus-
trating all six goals. Gold recognition also requires information on how the program recruits stu-
dents and increases community knowledge about the STLP.11
22
11. As of spring 2002, there were a total of 75 programs recognized as either Gold or Silver. Source: http://www.kde.state.ky.us/oet/customer/stlp/gold02.asp accessed 20 May 2002. This means that coordinators from these recognized schools were somewhat more likely than the average coordinator to complete the survey. Therefore, the results of the survey may be slightly skewed in the direction of recognized schools.
Because of the work involved for the coordinator in attaining recognition, we hesitate to say that
this group includes all the programs meeting STLP’s goals. However, it is certainly a representative
group of the successful programs. Therefore, we compare Gold/Silver (recognized) schools to
other schools on a number of measures. First, recognized schools tend to have programs that meet
often. Twenty-two percent of recognized schools’ programs meet daily as a class, while 44 percent
meet once per week or less. In contrast, 64 percent of unrecognized programs meet once per week
or less. There is no noticeable difference in how recognized versus unrecognized groups are
formed—roughly half of both types of programs accept all comers. Recognized programs have
been established about a year longer than unrecognized programs. Also, recognized programs
tend to be somewhat larger—they have an average of 32 participants, while the unrecognized pro-
grams have an average of 26 participants. The average recognized program actually reports having
fewer computers in the classroom than the average unrecognized program (8 versus 12). There
does seem to be a regional pattern of recognition; schools in Regions 2, 4, and 5 are especially
likely to be recognized, while the opposite is true of Regions 1 and 8.12 Recognized programs are
more likely to form partnerships with other schools for community service work, to form partner-
ships with other organizations, and to perform service projects than unrecognized programs. Rec-
ognized programs are more likely to have started a small business than other STLPs. Recognized
programs are neither more nor less likely to report hacking/unauthorized use incidents than other
schools.
Program Diffusion
Another potential measure of a program’s success is the extent to which pupils participate—the
“diffusion” of the program. Using the numbers of students in the school and in STLP, we calculate
the percentage of the student body taking part in STLP. In the average school, about 4 percent of
the students participate. Six schools report that over one-quarter of the students take part in STLP;
in two schools, all students participate. (Despite the incomplete school type information [see
above], we feel confident that the schools with very high participation percentages tend to be ele-
mentary schools; of the schools we were able to identify, every one in which at least 14 percent of
students participated in STLP was an elementary school.)
To further examine the effects of program size, we look at the largest and smallest quintiles. The
smallest quintile includes all schools with less than or equal to 2 percent of the students in STLP;
12. Empirical Analysis of STLP Schools noted that schools in Regions 2, 3, 4, and 5 were also especially likely to have STLPs. 23

24
the largest quintile includes all programs with greater than 7 percent participation. Table 3 details
some descriptive statistics from these programs.
Table 3: Schools with high and low STLP participation
In general, low-participation programs are more likely to occur in large schools (and in high
schools, which tend to be larger than middle or elementary schools). This is because there is no re-
lationship between the size of an STLP and the number of students in the school. A typical pro-
gram in a large school is almost the same size as a typical program in a small school.
High-participation schools differ in other ways as well; for example, they are more likely to be rec-
ognized. Also, in schools with high levels of participation, students are more likely to use their
STLP skills to start a small business. In many ways, high-participation STLPs “look like” other
STLPs—there is no obvious relationship between how often the group meets and the level of par-
ticipation, or between requiring applications and the level of participation. In fact, the high-
participation programs are more likely to take all comers than the low-participation programs. In
terms of hacking/unethical use of computers, schools with low levels of participation report slightly
higher levels of hacking (although the average school still reports only one case per year).
Other Programs Meeting STLP’s Goals
As mentioned earlier, achieving Gold or Silver recognition requires demonstration of meeting
STLP’s goals, but it is not clear that all unrecognized schools fail to meet the goals. Therefore, we
construct another measure that involves the extent to which each program is meeting the overall
STLP goals. We focus on goals about recruitment and community service.13 We do not suggest that
this measure completely describes a good or successful program, but we view this measure as indi-
13. See http://www.kde.state.ky.us/oet/customer/stlp/good.asp for a list of STLP’s goals.
Characteristic: Low participation High participation All STLPs Number of students 863 380 562 Recognition 22% 34% 24% Meet daily 21% 18% 21% Meet 1x/week or less
61% 57% 59%
Apply to join 32% 31% 35% All comers 51% 60% 51% High school 37% 13% 17% Number of programs
68 67 339
cating that the basic requirements are in place for a successful program. We measure recruitment
by the way the program is formed—only those who indicate that their programs take “all comers”
are considered successful under this measure. Also, because STLPs should reflect the diversity of
the student population, we require that STLP coordinators recruit under-represented students in
some way (this information comes from question 10 on the survey). In addition, STLPs should
make a difference in the school/community, so we require that the STLP engage in some type of
community project (we use questions 14 and 27 to measure this). By these (rather stringent) crite-
ria, 67 schools have “successful” programs (compared to 75 recognized schools and 67 schools with
high levels of students participation). Middle school programs are the least likely to be successful
by these criteria; successful STLPs are clustered in Regions 1 & 8 (and Region 5 schools are under-
represented among successful schools).14 Successful STLPs tend to meet more often than those not
classified as successful; in particular, half of all successful programs meet at least twice per week.
Successful programs tend to be only slightly larger than those not classified as successful; there is
no difference in average school size. Successful programs report slightly lower levels of hacking
than other programs, but the difference is not statistically significant.
Comparing Measures of Success
Comparing how programs do on all three measures of success shows that there is substantial, but
not complete, overlap. Only 32 percent of schools that were identified as meeting program goals
are classified as Gold or Silver. However, the schools that are meeting program goals are more
likely to have high participation, and less likely to have low participation, than the unsuccessful
schools. Overall, 11 programs meet the criteria for all three measures of success.
We would like to know how successful programs compare with less successful programs. We ex-
plored this question in the previous section by comparing program formation, meeting frequency,
program size, and incidents of hacking (as described above). In general, we found that successful
programs do not differ on these measures in any consistent way from less successful programs.
Next, we compare STLP coordinators’ answers to questions about use of technology in the class-
room across these types of schools.
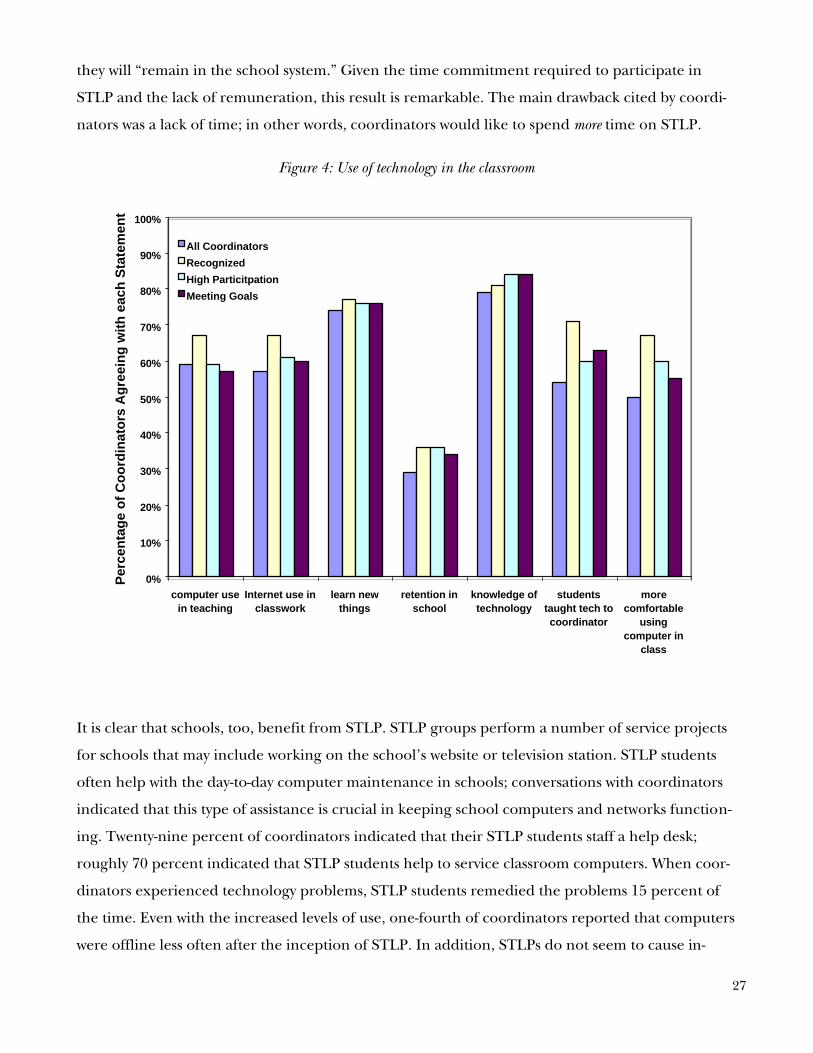
Figure 4 shows that, on most measures, successful programs resemble less successful programs,
whether we define success by Gold/Silver recognition, high levels of participation, or meeting
25
14. Schools in Regions 1 and 8 are less likely than others in the state to participate in STLP (Empirical Analysis of STLP Schools). Schools in Regions 1 and 8 are also less likely than others to be recognized as Gold/Silver schools; one potential explanation for this is that schools in Regions 1 and 8 are less likely to apply for recognition.

26
STLP’s goals. There are some exceptions to this pattern. For example, coordinators in Gold/Silver
schools indicate higher levels of technology use/comfort than all coordinators.15 However, the dif-
ferences between successful programs (by any measure) and less successful programs is generally
quite small by most measures.
Conclusion and Recommendations
Our evaluation of Kentucky’s Student Technology Leadership Program (STLP) includes data and
information collected from a national database, numerous interviews and conversations, and an
online survey of STLP coordinators. The first phase of the evaluation focused on the types of
schools that were most likely to have STLPs, the extent to which various groups of students have ac-
cess to STLP, and the extent to which students in STLP are representative of students in Kentucky’s
public schools. In general, we found that the majority of students, and a slightly larger majority of
under-represented minority students, have access to STLPs. At the elementary level, both girls and
minority students are over-represented in STLPs; the reverse is true at the high school level.
Our interviews and survey data suggest that STLPs are highly successful by most metrics. Students
were overwhelmingly enthusiastic about the program and felt it would help them both by increas-
ing their knowledge about technology and by improving their non-technical skills. For example,
numerous students suggested that the opportunity to teach and train others in technology was very
valuable.
Coordinators, too, cited numerous benefits of STLP for the student participants. They believe that
the program increases students’ interest in and knowledge of technology, and provides leadership
opportunities for students. Several coordinators commented that the program provided opportuni-
ties for students who did not receive similar opportunities in other school programs.
Coordinators also cited many benefits for themselves; most benefits concerned use of/comfort with
technology. Over half of coordinators indicated that STLP participation has changed the way they
teach in the classroom, either through increased use of technology or through an increased will-
ingness to let students do more hands-on work in the classroom. One of the more surprising bene-
fits of the program is that more than one in four coordinators say the STLP makes it more likely
15. These questions ask the coordinator to signify agreement (or disagreement) with statements indicating that the coordinator’s use of technology has increased because of the STLP program. Not all of these differences are statistically significant, but coordinators in schools meeting goals are more likely to agree with each statement than coordinators as a whole.
27
they will “remain in the school system.” Given the time commitment required to participate in
STLP and the lack of remuneration, this result is remarkable. The main drawback cited by coordi-
nators was a lack of time; in other words, coordinators would like to spend more time on STLP.
Figure 4: Use of technology in the classroom
It is clear that schools, too, benefit from STLP. STLP groups perform a number of service projects
for schools that may include working on the school’s website or television station. STLP students
often help with the day-to-day computer maintenance in schools; conversations with coordinators
indicated that this type of assistance is crucial in keeping school computers and networks function-
ing. Twenty-nine percent of coordinators indicated that their STLP students staff a help desk;
roughly 70 percent indicated that STLP students help to service classroom computers. When coor-
dinators experienced technology problems, STLP students remedied the problems 15 percent of
the time. Even with the increased levels of use, one-fourth of coordinators reported that computers
were offline less often after the inception of STLP. In addition, STLPs do not seem to cause in-
0%
10%
20%
30%
40%
50%
60%
70%
80%
90%
100%
computer usein teaching
Internet use inclasswork
learn newthings
retention inschool
knowledge oftechnology
studentstaught tech tocoordinator
morecomfortable
usingcomputer in
class
Per
cen
tag
e o
f C
oo
rdin
ato
rs A
gre
ein
g w
ith
eac
h S
tate
men
t
All Coordinators
Recognized
High Particitpation
Meeting Goals
28
creases in hacking or other unauthorized behavior; in contrast, coordinators indicate that students
learn about responsible computer use through STLP.
STLPs vary on a number of factors. This is not surprising because the programs exist in a variety of
types of schools spanning grade levels from kindergarten through high school. However, some
variation is not related to grade level. For example, STLP groups meet as often as once per day and
as infrequently as less than once per week. Few programs meet daily except those that are a formal
class. High school programs meet more often than those in lower grades; programs are most likely
to meet once per week in elementary and middle schools. Another factor with considerable vari-
ance is the method of formation. Some STLP groups accept all who are interested; others have
various application processes that may include grade requirements and/or teacher recommenda-
tions. Roughly half of all programs (at all grade levels) accept all comers.
We attempted to measure the success of STLPs using several different metrics. First, we looked at
those programs that are officially recognized as Gold or Silver; we refer to these as “recognized”
programs. Second, we looked at programs that include a relatively high proportion of the student
body; we refer to these as “high participation” programs. Third, we used answers to survey ques-
tions to separate programs meeting STLP goals in terms of recruitment, publicity, and vision; we
refer to these as “successful” programs. We were interested in factors that predict success by any of
these metrics. We find very few meaningful patterns; for example, recognized and successful STLPs
meet more often than other programs but this is not true of high-participation programs. There is
no evidence that programs with more rigorous application processes are more successful by any of
the above metrics.
Overall, the STLP is extremely flexible. This is one of the program’s strengths; it allows each coor-
dinator to adapt the program in the way that works best for the individual school/students. For ex-
ample, programs can meet as classes or as clubs, daily or twice monthly. Groups can select projects
that interest them and that are appropriate for their school or community. However, the variation
in how students are admitted into STLPs is problematic because, in many cases, programs that use
restrictive selection criteria are not open to all students. This is in conflict with one of STLP’s cen-
tral goals and, as discussed above, there is no indication that restrictive criteria improve success of
the programs.

29
Our findings suggest several recommendations to further strengthen the Student Technology
Leadership Program:
• Continue to encourage the flexibility on many aspects of STLP; encourage coordinators to
share ideas at conferences.
• Urge or require programs to accept all students who indicate an interest in STLP. This is in
accordance with STLP’s central goals and will not harm the success of the individual pro-
grams.
• Survey a sample of STLP students to learn more about what students gain from the pro-
gram. Survey a sample of non-STLP students to learn why some students do not participate
in STLP.
• Survey teachers/administrators at schools without STLP to learn why some schools have not
adopted the program.

30

18. R. L. H. Freedman, “Constructivist assessment practices,” Annual Meeting of the Association for Educa-tors of Teachers of Science (Minneapolis, MN, 1998); E. W. Taylor, J. Beck and E. Ainsworth, “Publishing qualitative adult education research: A peer review perspective,” Studies in the Education of Adults 33(2), 163-179 (2001).
31
Appendix A: Methodology
Qualitative Data Analysis
We selected the focus groups of students by choosing a random sub-sample of the school groups
attending the conferences. We requested that students meet with us in small groups; some were un-
able to do so because of scheduling conflicts. Thus, the focus groups are representative of students
attending the regional conferences, but they may not be representative of STLP students as a
whole.
We interviewed coordinators who had breaks in their schedule; like the students, the coordinators
were a random group of those attending the regional conferences but may not represent all STLP
coordinators.
We asked each person interviewed to choose a pseudonym; we refer to students and coordinators
only by these pseudonyms throughout the report. We recorded the interviews with a video camera
and an audio tape player. We used the videotapes to resolve unclear sections of the audio tapes.
We analyzed interview data using constant comparative analysis or grounded theory.18 This
method involves looking for emerging themes in qualitative data, which are then used and modi-
fied in the analysis of subsequent sets of data.
We also conducted a number of short, informal conversations with STLP students and coordinators
at the regional meetings and at the Kentucky Teaching and Learning Conference.
Quantitative Data Analysis
We conducted a web-based survey of all STLP coordinators during April and May of 2002. We
posted the survey on a website and contacted coordinators through the STLP listserv. Some schools
have software that prevents networked machines from reaching many websites; this caused prob-
lems for some coordinators. For this reason, we allowed coordinators to print out the survey and
32
return it by mail, or to request a text version that could be filled out and returned by e-mail. At the
end of the period, 339 people had submitted surveys (most were able to use the web-based survey;
only five used alternate methods). It is difficult to calculate the exact response rate to the survey be-
cause there is no single confirmed list of programs/coordinators. During the 1999-2000 school
year, there were about 780 STLPs. The number of programs is growing; over 25 percent of survey
respondents headed a new program. Therefore, we estimate that there are over 900 STLPs in Ken-
tucky today. Therefore, the response rate to our survey was approximately 35 percent.

33
Appendix B: Student Interview Protocols
Because we recognized that there are differences in language skills, perspectives and experiences
between students of different ages, we developed two different versions of the student interview
protocol. One protocol was developed for elementary school students, and the other was devel-
oped for middle and high school students. We have included both protocols here for your review.
Elementary Student Protocol
1. Is the Student Technology Leadership Program (STLP) a big deal to you? a. Yes b. No If you DO think STLP is a big deal, why?
2. Will you use what you learned from STLP when you are older?
a. Yes b. No If you DO think you will use something from STLP later, please tell us what you think you will
use the most?
3. When you sit down to do STLP, how much time IN A SINGLE DAY do you usually spend?
a. ½ hour or less b. About 1 hour c. Between 1 and 2 hours d. About 2 hours e. More than 2 hours
4. When do you usually do STLP?
a. Before school b. During class-time c. After school d. If you do STLP another time, tell us when.
5. How many times EVERY WEEK do you usually do STLP? a. Not every week b. One time every week c. Two times every week d. Three times every week e. If none of these choices seems right, tell us how many times every week you do STLP.
34
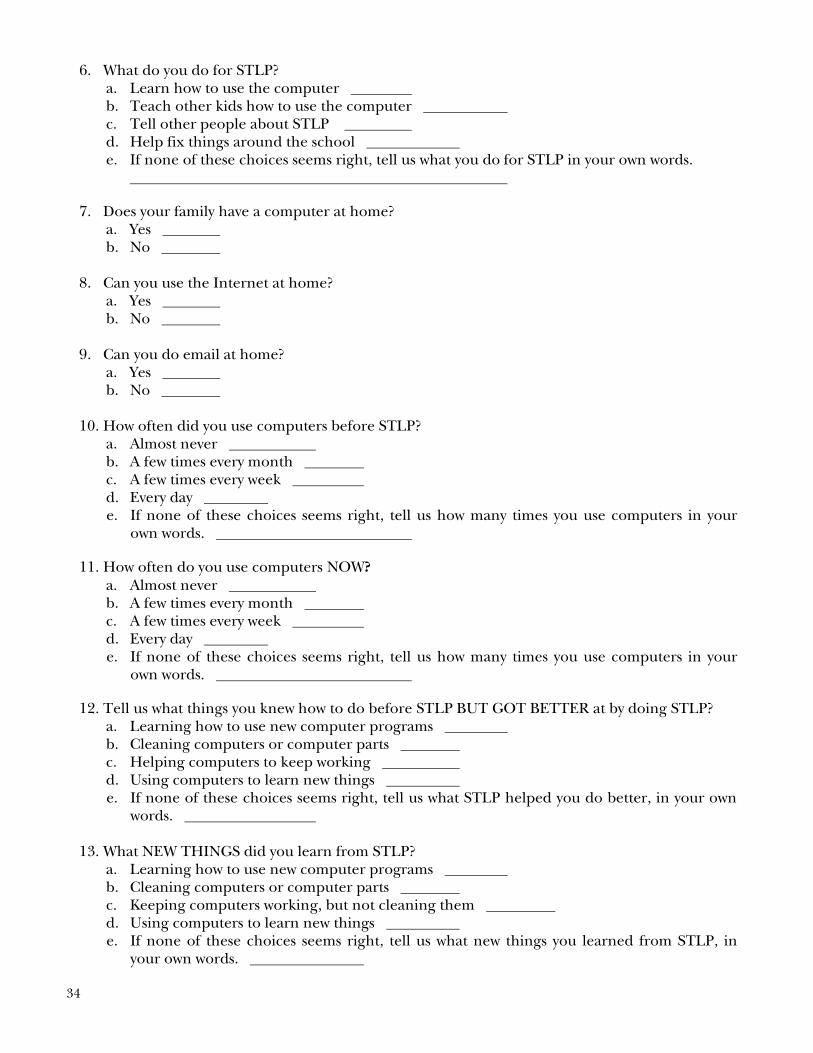
6. What do you do for STLP? a. Learn how to use the computer b. Teach other kids how to use the computer c. Tell other people about STLP d. Help fix things around the school e. If none of these choices seems right, tell us what you do for STLP in your own words.
7. Does your family have a computer at home? a. Yes b. No
8. Can you use the Internet at home?
a. Yes b. No
9. Can you do email at home?
a. Yes b. No
10. How often did you use computers before STLP?
a. Almost never b. A few times every month c. A few times every week d. Every day e. If none of these choices seems right, tell us how many times you use computers in your
own words.
11. How often do you use computers NOW? a. Almost never b. A few times every month c. A few times every week d. Every day e. If none of these choices seems right, tell us how many times you use computers in your
own words.
12. Tell us what things you knew how to do before STLP BUT GOT BETTER at by doing STLP? a. Learning how to use new computer programs b. Cleaning computers or computer parts c. Helping computers to keep working d. Using computers to learn new things e. If none of these choices seems right, tell us what STLP helped you do better, in your own
words.
13. What NEW THINGS did you learn from STLP? a. Learning how to use new computer programs b. Cleaning computers or computer parts c. Keeping computers working, but not cleaning them d. Using computers to learn new things e. If none of these choices seems right, tell us what new things you learned from STLP, in
your own words.

35
14. Which else did STLP teach you? a. How to be a in charge b. How to use computers safely c. How to fix computers d. How to work with other kids e. How to work by yourself f. How to explain or share your what you know g. How adults use computers at work ______________
15. Do you give any speeches about STLP?
a. Yes b. No If you did, what did you talk about? If you haven’t, would you like to and what would you like to say?
16. Have you or would you tell your friends to do STLP? a. Yes b. No Why or why not? If you did, what did you tell them?
17. If you would like to tell us anything else about STLP, please tell us now. Please tell us the following information about yourself.
18. Are you a boy, or a girl? Boy Girl
19. How old are you, in years?
20. Put an “X” on the line after the word(s) that describes you. White Black Hispanic (Mexican, Chicano, Central or South American) Native American Asian or Pacific Islander (Japanese, Chinese, Filipino, Korean, Vietnamese, Hawaiian, Guama-nian, Samoan) Asian Indian Bi-racial or Multi-racial.
21. Put an “X” on the line after the word(s) that describes where you live.
I live in a city. I live near a city. I live in a small town. I live in on a farm.
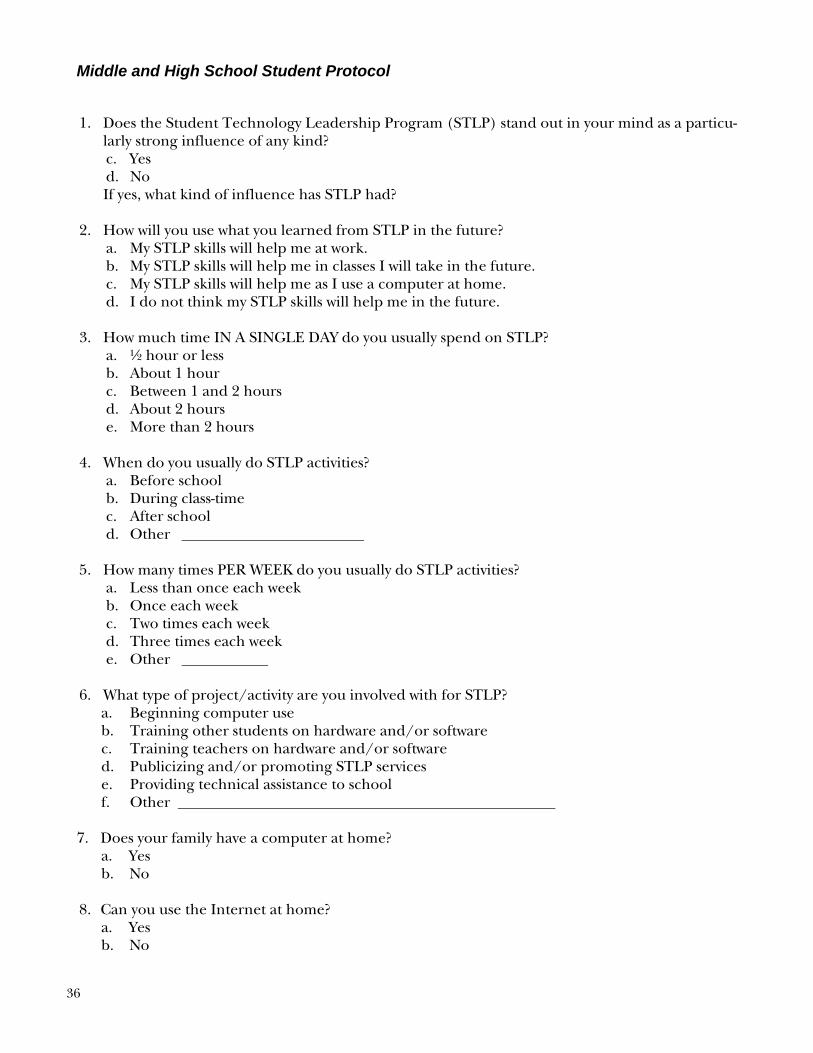
36
Middle and High School Student Protocol
1. Does the Student Technology Leadership Program (STLP) stand out in your mind as a particu-larly strong influence of any kind? c. Yes d. No If yes, what kind of influence has STLP had?
2. How will you use what you learned from STLP in the future?
a. My STLP skills will help me at work. b. My STLP skills will help me in classes I will take in the future. c. My STLP skills will help me as I use a computer at home. d. I do not think my STLP skills will help me in the future.
3. How much time IN A SINGLE DAY do you usually spend on STLP?
a. ½ hour or less b. About 1 hour c. Between 1 and 2 hours d. About 2 hours e. More than 2 hours
4. When do you usually do STLP activities?
a. Before school b. During class-time c. After school d. Other
5. How many times PER WEEK do you usually do STLP activities?
a. Less than once each week b. Once each week c. Two times each week d. Three times each week e. Other
6. What type of project/activity are you involved with for STLP?
a. Beginning computer use b. Training other students on hardware and/or software c. Training teachers on hardware and/or software d. Publicizing and/or promoting STLP services e. Providing technical assistance to school f. Other
7. Does your family have a computer at home?
a. Yes b. No
8. Can you use the Internet at home?
a. Yes b. No

37
9. Can you send and receive email at home? a. Yes b. No
10. How often do you use the computer to do homework?
a. Never b. Once or twice each week, only for certain classes c. Several times each week, for most classes d. Almost every day, for all classes
11. How often did you use computers BEFORE you started participating in the STLP program?
a. Almost never b. A few times each month c. Several times each week d. Every day e. Other
12. How often do you use the computer NOW? a. Almost never b. A few times each month c. Several times each week d. Every day e. Other
13. What skills, THAT YOU HAD BEFORE, did you improve by participating in the STLP program?
a. Computer programming b. Using package software (not programming) c. Computer maintenance d. Network maintenance e. Understanding how computers help solve other problems f. Other
14. What NEW skills did you learn by participating in STLP? a. Computer programming b. Using package software (not programming) c. Computer maintenance d. Network maintenance e. Understanding how computers help solve other problems f. Other
15. What general skills did you learn or add to because of STLP?
What about these (if they haven’t been given already)? a. Leading, organizing or directing the work of other students b. Working together with students your age c. Working together with students of different ages d. Working together with students your didn’t know before e. Working effectively alone f. Explaining/sharing your work with other students or adults g. Using computers to help communities/neighborhoods h. Using computers to help my school/teachers in my school i. Using computers responsibly j. Other

38
16. Did you give any speeches or make any presentations about your STLP activities?
a. Yes b. No
17. Do you ever feel like your STLP activities take away from other academic or extracurricular ac-tivities? a. Yes b. No If so, how?
18. Have you or would you tell your friends to do STLP?
a. Yes b. No Why or why not?
19. If there is anything that we haven’t asked you about that you’d like to say about the STLP pro-
gram, please write it below. 20. Please tell us the following information about yourself.
a. What is your gender? Male Female b. What grade are you in? c. What is your age, in years? d. How do you describe your race?
White Black Hispanic (Mexican, Chicano, Central or South American) Native American Asian or Pacific Islander (Japanese, Chinese, Filipino, Korean, Vietnamese, Hawaiian, Gua-manian, Samoan) Asian Indian Bi-racial or Multi-racial.
e. How do you describe where you live? I live in a city. I live near a city. I live in a small town. I live on a farm or in a rural area.

39
Appendix C: Teacher/Coordinator Interview Protocol
1. Is your role as STLP coordinator clear to you?
2. Do you plan to continue your participation in the programs in future years? 3. Have you completed the STLP application to be state recognized? 4. Is your school recognized as either a Silver or a Gold STLP school? 5. One of the STLP program coordinator’s responsibilities is to promote awareness, accep-
tance, and achievements of the STLP program. How do you achieve this responsibility?
a. Do you give speeches about STLP? _____ Yes _____ No b. Do you write papers about STLP? _____ Yes _____ No c. Do you visit other non-STLP schools? _____ Yes _____ No d. Have you talked about STLP with parents? _____ Yes _____ No e. Have you talked about STLP with other members of the community?
_____ Yes _____ No
6. One of the STLP program coordinator’s responsibilities is to train/mentor STLP member
students. How much time during a typical week do you spend training and mentoring? _____ less than a day _____ 1 day _____ between 1-2 days _____ between 2-3 days _____ between 3-4 days _____ between 4-5 days
7. One of the STLP program coordinator’s responsibilities is to recruit and encourage STLP
participation from students from under-represented populations. How much time during a typical week do you spend recruiting and encouraging program participation from under-represented student populations?
_____ less than a day _____ 1 day _____ between 1 and 2 days _____ between 2 and 3 days _____ between 3 and 4 days _____ between 4 and 5 days
8. One of the STLP program coordinator’s responsibilities is to manage the school’s STLP ac-
tivities. How much time during a typical week do you spend on bureaucratic details (e.g., preparing, maintaining, and reporting STLP membership, coordinating STLP activities, de-veloping short-range and long-range plans)?
_____ less than a day _____ 1 day _____ between 1 and 2 days _____ between 2 and 3 days _____ between 3 and 4 days _____ between 4 and 5 days
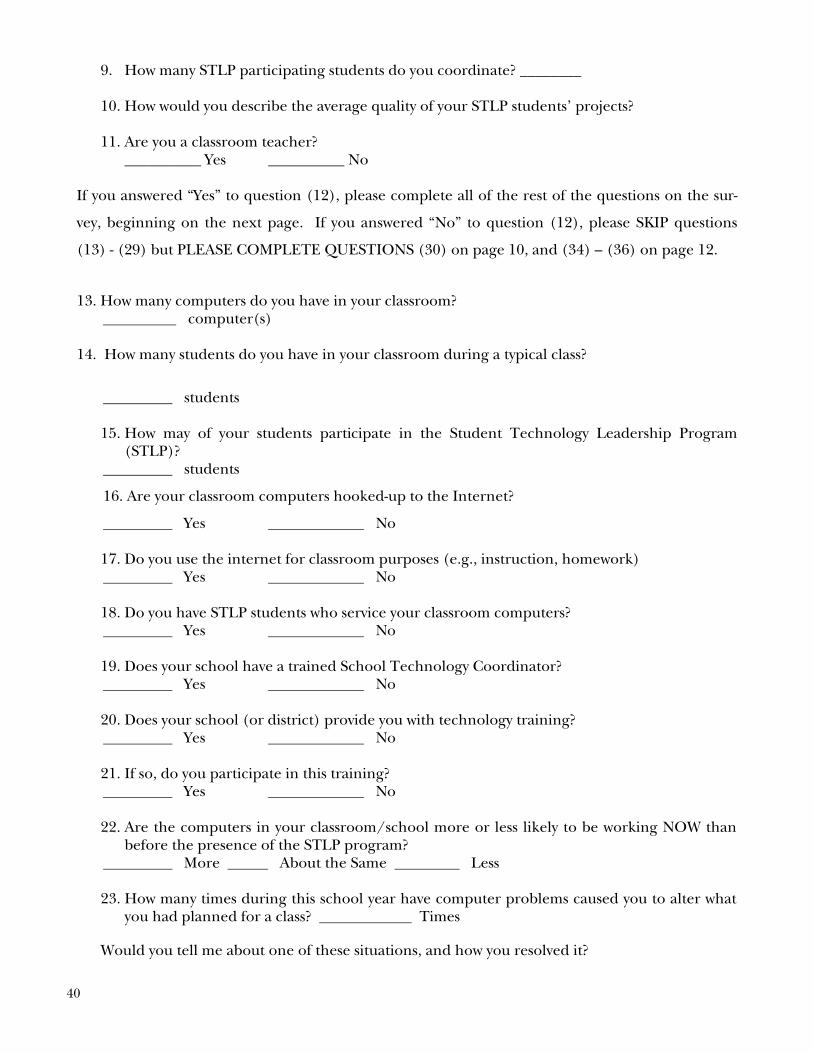
9. How many STLP participating students do you coordinate? ________
10. How would you describe the average quality of your STLP students’ projects?
11. Are you a classroom teacher? __________ Yes __________ No
If you answered “Yes” to question (12), please complete all of the rest of the questions on the sur-
vey, beginning on the next page. If you answered “No” to question (12), please SKIP questions
(13) - (29) but PLEASE COMPLETE QUESTIONS (30) on page 10, and (34) – (36) on page 12.
13. How many computers do you have in your classroom? computer(s)
14. How many students do you have in your classroom during a typical class?
students
15. How may of your students participate in the Student Technology Leadership Program (STLP)?
students
16. Are your classroom computers hooked-up to the Internet?
Yes No
17. Do you use the internet for classroom purposes (e.g., instruction, homework) Yes No
18. Do you have STLP students who service your classroom computers? Yes No
19. Does your school have a trained School Technology Coordinator? Yes No
20. Does your school (or district) provide you with technology training? Yes No
21. If so, do you participate in this training? Yes No
22. Are the computers in your classroom/school more or less likely to be working NOW than
before the presence of the STLP program? More About the Same Less
23. How many times during this school year have computer problems caused you to alter what
you had planned for a class? Times
Would you tell me about one of these situations, and how you resolved it?
40
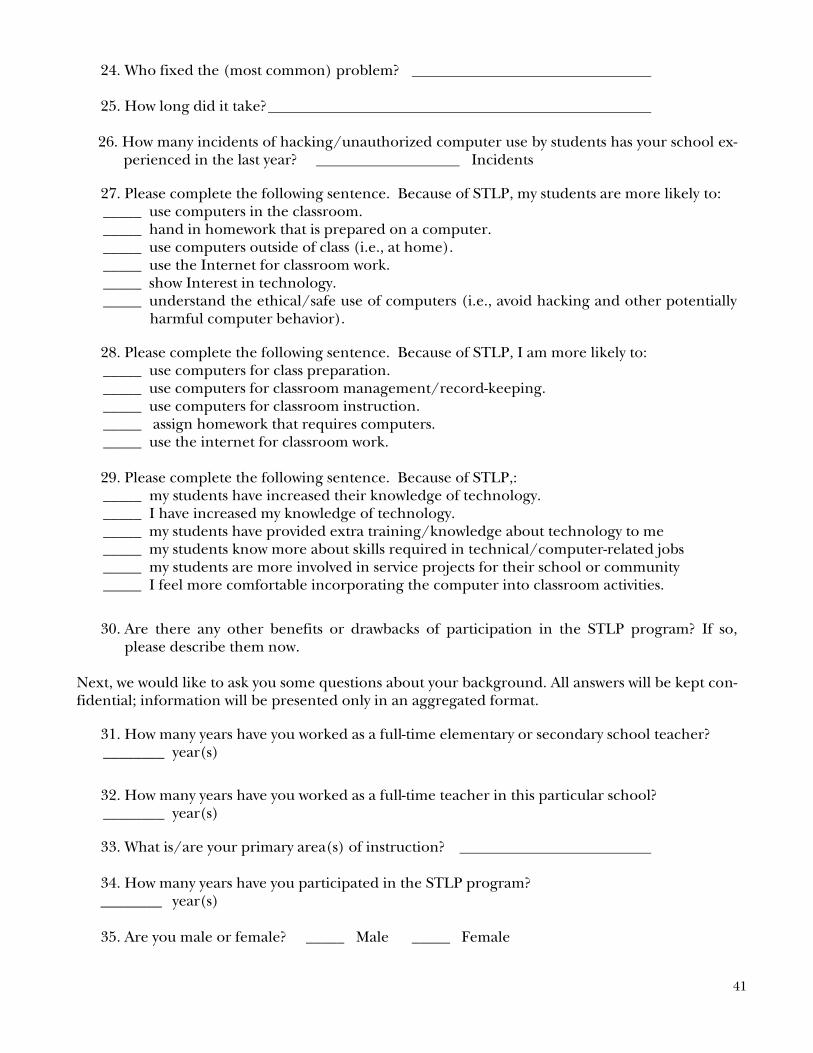
41
24. Who fixed the (most common) problem?
25. How long did it take?
26. How many incidents of hacking/unauthorized computer use by students has your school ex-perienced in the last year? Incidents
27. Please complete the following sentence. Because of STLP, my students are more likely to: _____ use computers in the classroom. _____ hand in homework that is prepared on a computer. _____ use computers outside of class (i.e., at home). _____ use the Internet for classroom work. _____ show Interest in technology. _____ understand the ethical/safe use of computers (i.e., avoid hacking and other potentially
harmful computer behavior).
28. Please complete the following sentence. Because of STLP, I am more likely to: _____ use computers for class preparation. _____ use computers for classroom management/record-keeping. _____ use computers for classroom instruction. _____ assign homework that requires computers. _____ use the internet for classroom work. 29. Please complete the following sentence. Because of STLP,: _____ my students have increased their knowledge of technology. _____ I have increased my knowledge of technology. _____ my students have provided extra training/knowledge about technology to me _____ my students know more about skills required in technical/computer-related jobs _____ my students are more involved in service projects for their school or community
_____ I feel more comfortable incorporating the computer into classroom activities.
30. Are there any other benefits or drawbacks of participation in the STLP program? If so, please describe them now.
Next, we would like to ask you some questions about your background. All answers will be kept con-fidential; information will be presented only in an aggregated format.
31. How many years have you worked as a full-time elementary or secondary school teacher? ________ year(s)
32. How many years have you worked as a full-time teacher in this particular school? ________ year(s)
33. What is/are your primary area(s) of instruction?
34. How many years have you participated in the STLP program? ________ year(s)
35. Are you male or female? _____ Male _____ Female

36. How would you describe your race? _____ American Indian _____ Asian or Pacific Islander (Japanese, Chinese, Filipino, Korean, Asian Indian, Vietnam-
ese, Hawaiian, Guamanian, Samoan, other Asian)
_____ Black _____ White _____ Hispanic (Mexican, Chicano, Central or South American) _____ Other
42
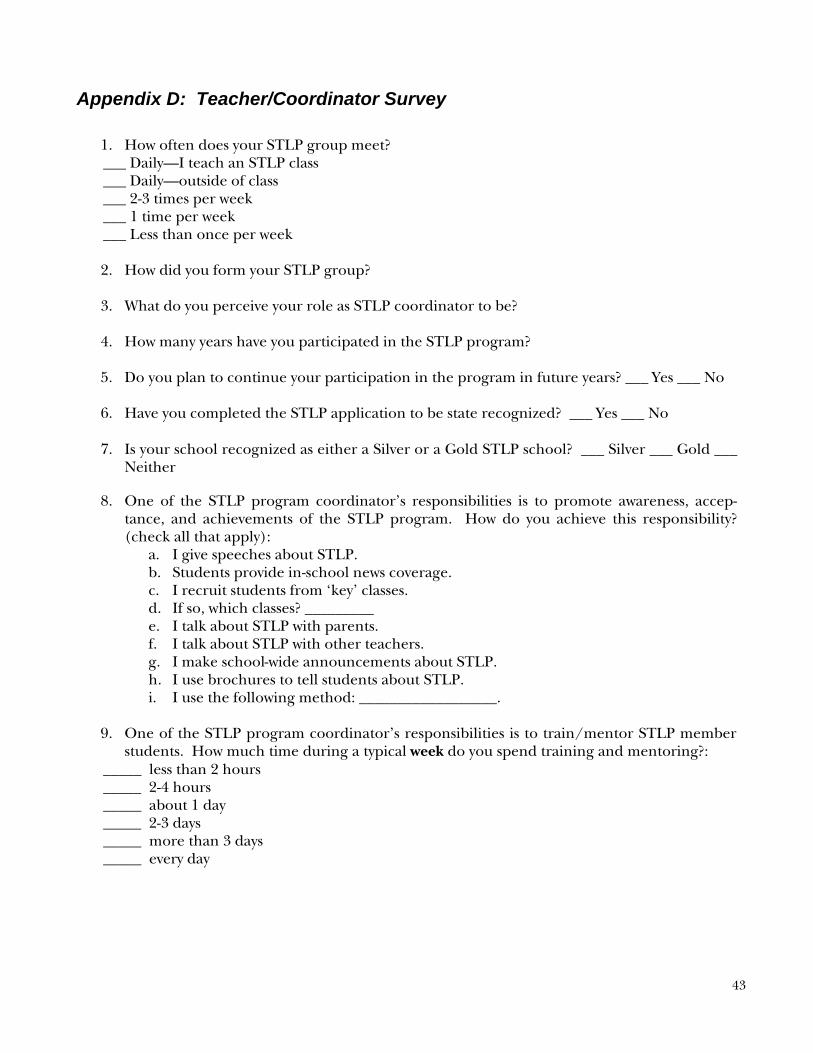
43
Appendix D: Teacher/Coordinator Survey
1. How often does your STLP group meet? ___ Daily—I teach an STLP class ___ Daily—outside of class ___ 2-3 times per week ___ 1 time per week ___ Less than once per week
2. How did you form your STLP group? 3. What do you perceive your role as STLP coordinator to be?
4. How many years have you participated in the STLP program? 5. Do you plan to continue your participation in the program in future years? ___ Yes ___ No 6. Have you completed the STLP application to be state recognized? ___ Yes ___ No
7. Is your school recognized as either a Silver or a Gold STLP school? ___ Silver ___ Gold ___ Neither
8. One of the STLP program coordinator’s responsibilities is to promote awareness, accep-tance, and achievements of the STLP program. How do you achieve this responsibility? (check all that apply):
a. I give speeches about STLP. b. Students provide in-school news coverage. c. I recruit students from ‘key’ classes. d. If so, which classes? _________ e. I talk about STLP with parents. f. I talk about STLP with other teachers. g. I make school-wide announcements about STLP. h. I use brochures to tell students about STLP. i. I use the following method: __________________.
9. One of the STLP program coordinator’s responsibilities is to train/mentor STLP member
students. How much time during a typical week do you spend training and mentoring?: _____ less than 2 hours _____ 2-4 hours _____ about 1 day _____ 2-3 days _____ more than 3 days _____ every day

10. One of the STLP program coordinator’s responsibilities is to recruit and encourage STLP participation from students from under-represented populations. How do you do this?:
I divide tasks in such a way that different students are assigned tasks they are most comfortable carrying out.
I talk to individual under-represented students to encourage their participa-tion and success.
I pair/team students to encourage success. I recruit under-represented students by: ___________________ I encourage participation from all students equally.
11. One of the STLP program coordinator’s responsibilities is to manage the school’s STLP ac-
tivities. How much time during a typical week do you spend on bureaucratic details (e.g., preparing, maintaining, and reporting STLP membership, coordinating STLP activities, de-veloping short-range and long-range plans)?
_____ less than 1 hour _____ 1-2 hours _____ 2-4 hours _____ 4-8 hours _____ 8-12 hours _____ 12-16 hours _____ more than 16 hours
12. How many STLP students do you coordinate? ________
13. How long does it take students to complete most STLP projects? a. Most projects are short-term in nature, completed within a single meeting or week. b. Most projects are moderately short-term in nature, completed within a couple of
weeks. c. Most projects are long-term in nature, taking a month or more to complete. d. Most projects are request-driven (like working at a Help Desk), so their lengths vary
widely.
14. One focus of STLP is on doing projects that benefit others, within and outside your school. What type(s) of service projects has your STLP group worked on? (Select all that apply.)
a. Community service with another school. b. Partnership with a local charity. c. Partnership with another organization. d. Staffing a computer help desk to assist people in our school. e. Staffing a computer help desk to assist people outside our school. f. Other (please describe briefly):
15. Many STLP groups use the skills they learn to start or run small businesses. Has your STLP
group started such a business? ___ Yes ___ No 16. How would you describe the students in STLP? ___ any student who shows an interest ___ ‘average’ students, but with a particular gift in technology ___ students who are otherwise uninterested in school ___ shy students who are otherwise overlooked ___ a mix of students, including some from each group above.
___ Other: ___________________________
44
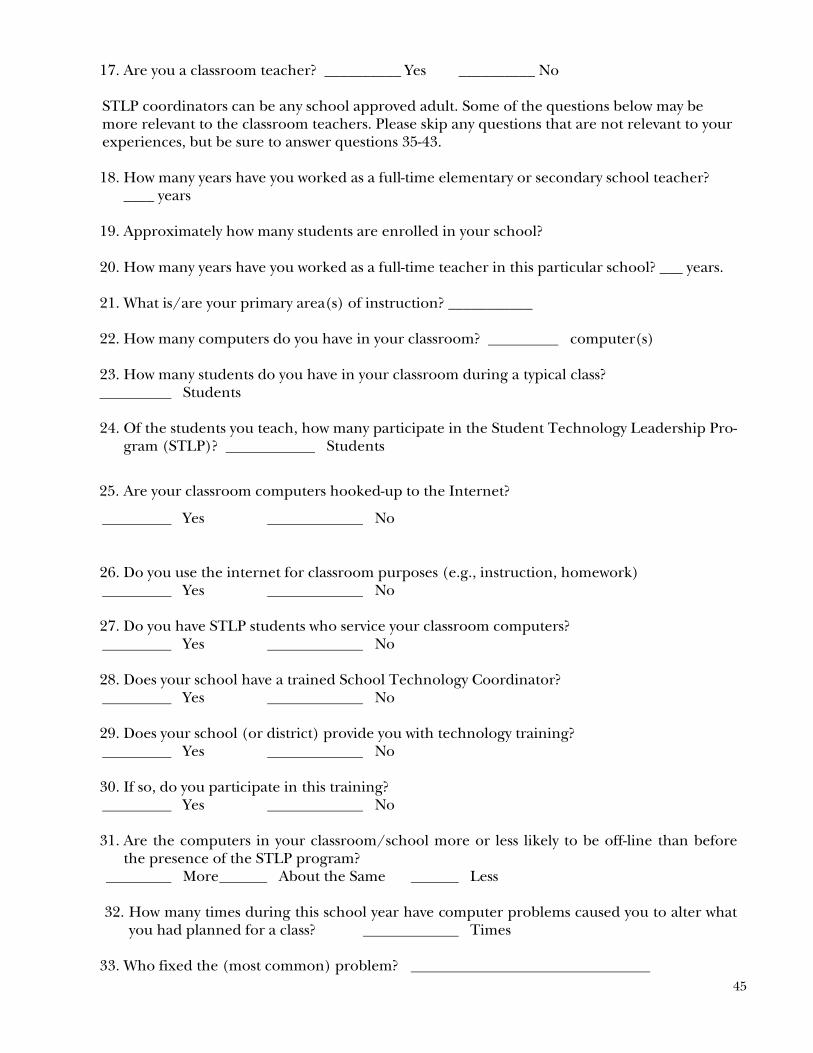
45
17. Are you a classroom teacher? __________ Yes __________ No
STLP coordinators can be any school approved adult. Some of the questions below may be more relevant to the classroom teachers. Please skip any questions that are not relevant to your experiences, but be sure to answer questions 35-43.
18. How many years have you worked as a full-time elementary or secondary school teacher?
____ years 19. Approximately how many students are enrolled in your school?
20. How many years have you worked as a full-time teacher in this particular school? ___ years.
21. What is/are your primary area(s) of instruction? ___________
22. How many computers do you have in your classroom? computer(s)
23. How many students do you have in your classroom during a typical class? Students 24. Of the students you teach, how many participate in the Student Technology Leadership Pro-
gram (STLP)? Students
25. Are your classroom computers hooked-up to the Internet?
Yes No
26. Do you use the internet for classroom purposes (e.g., instruction, homework) Yes No
27. Do you have STLP students who service your classroom computers? Yes No
28. Does your school have a trained School Technology Coordinator? Yes No
29. Does your school (or district) provide you with technology training? Yes No 30. If so, do you participate in this training? Yes No
31. Are the computers in your classroom/school more or less likely to be off-line than before
the presence of the STLP program? More About the Same Less 32. How many times during this school year have computer problems caused you to alter what
you had planned for a class? Times
33. Who fixed the (most common) problem?

46
34. How long did it take?
35. How many incidents of hacking/unauthorized computer use by students has your school experienced in the last year? Incidents
36. Check all of the phrases that complete the sentence. Because of STLP, my students are
more likely to: _____ use computers in the classroom. _____ hand in homework that is prepared on a computer. _____ use computers outside of class (i.e., at home). _____ use the Internet for classroom work. _____ show interest in technology. _____ understand the ethical/safe use of computers (i.e., avoid hacking and other potentially
harmful computer behavior). _____ receive recognition for their technical skills. _____ become involved in school. _____ be leaders. _____ be successful. 37. Check all of the phrases that complete the sentence. Because of STLP, I am more likely to: _____ use computers for class preparation. _____ use computers for classroom management/record-keeping. _____ use computers for classroom instruction. _____ assign homework that requires computers. _____ use the internet for classroom work. _____ let the students do more of the work in the classroom. _____ learn new things _____ remain in the school system.
38. Check all of the true statements. Because of STLP,: _____ my students have increased their knowledge of technology. _____ I have increased my knowledge of technology. _____ my students have provided extra training/knowledge about technology to me _____ my students know more about skills required in technical/computer-related jobs _____ my students are more involved in service projects for their school or community _____ I feel more comfortable incorporating the computer into classroom activities.
39. Are there any other benefits or drawbacks of participation in the STLP program? If so, please describe these briefly below.

Next, we would like to ask you some questions about your background. All answers will be kept con-fidential; information will be presented only in an aggregated format.
40. In which region is your school located? a. Region 1 b. Region 2 c. Region 3 d. Region 4 e. Region 5 f. Region 6 g. Region 7 h. Region 8 i. Don’t know
41. Are you female or male? ___ Female ___ Male
42. How would you describe your race? _____ American Indian _____ Asian or Pacific Islander (Japanese, Chinese, Filipino, Korean, Asian Indian, Vietnam-
ese, Hawaiian, Guamanian, Samoan, other Asian)
_____ Black _____ White _____ Hispanic (Mexican, Chicano, Central or South American) _____ Other
43. In case we need further information, what is your e-mail address? If you are in any way un-
comfortable about providing your address, please feel free to omit it. Thank you very much for your help—your responses will assist us in improving Kentucky’s STLP program!
47
