technology enterprise facility - ubc case study · technology enterprise facility - ubc case study...
TRANSCRIPT

TECHNOLOGY ENTERPRISE FACILITY - UBC CASE STUDY
Place Picture Here
USING ECOSMARTTM CONCRETE
IN SCHEDULE DRIVEN CONSTRUCTION
Prepared by: Diana Klein, P.Eng. READ JONES CHRISTOFFERSEN LTD.
April 24, 2003
TABLE OF CONTENTS Page 1.0 EXECUTIVE SUMMARY 1 2.0 PROJECT DESCRIPTION 1
2.1 Project Overview 1 2.2 Project Team 2 2.3 Project Details 3
3.0 USE OF ECOSMARTTM IN CONCRETE 4
3.1 Goals 4 3.2 Project Chronology 7 3.3 Concrete Use in Structure 7 3.4 Project Requirements 7 3.5 Concrete Mix Information 10 3.6 Findings 12
4.0 CONCLUSIONS 24
4.1 Current Practice 24 4.2 Benefits and Impacts 24 4.3 Future Acceptance 24 4.4 Acknowledgements 25
5.0 RECOMMENDATIONS 25

TABLE OF CONTENTS (Continued)
Page REFERENCES 26
FIGURES
Figure 1 2 Figure 2 3 Figure 3 6 Figure 4 12 Figure 5 15 Figure 6 22
GRAPHS
Graph 1 12 Graph 2 13 Graph 3 14 Graph 4 16 Graph 5 16 Graph 6 17 Graph 7 17 Graph 8 18 Graph 9 20 Graph 10 21 Graph 11 22
TABLES
Table 1 9 Table 2 10

UBC TEF III Page 1 RJC No. 38080-03
1.0 EXECUTIVE SUMMARY This report considers the challenges and successes of using EcoSmartTM concrete for the project at the University of British Columbia, Technology Enterprise Facility III (TEF III). A primary focus of the project team was to design a sustainable building. The team therefore researched and used materials that would have minimum environmental impact. The main structure of the building is constructed using concrete. Concrete is used extensively in the building industry and there are many good environmental reasons for choosing it as a structural material on buildings. However, the production of cement, which constitutes on average about 11% of the volume of concrete, is energy intensive to produce and a high source of CO2 (a significant contributor of greenhouse gas emissions). Therefore, in addition to minimizing the volume of concrete used on this project, there was a focus to reduce the amount of cement used in the concrete. This was achieved by using EcoSmartTM concrete. There are challenges that arise when using the EcoSmartTM concrete. Among these challenges are that EcoSmartTM concrete generally has lower early strength results than conventional concrete. The lower early strengths affect stripping time of the elements which in turn affects the schedule. This report discusses how to overcome this issue and also contains information on early strength test results for mixes used on the project. The use of in-situ tests such as Maturity tests and Lok tests were also considered and Lok tests subsequently tried. The results of the Lok tests were inconclusive, but their use to increase certainty of early strengths for stripping could be valuable and worth exploring on subsequent projects. Also discussed in the report was that certain elements, columns and shearwalls could be reduced in size by increasing concrete strength. The benefits of this could be an overall reduction in cement for these elements and earlier stripping. Information on the curing processes used on this project is also included. This project was identified for a case study by the EcoSmartTM Concrete Project as it addresses the challenges of lower early strengths and curing of EcoSmartTM concrete.
2.0 PROJECT DESCRIPTION
2.1 Project Overview TEF III is a six-storey facility with laboratories and office space at the University of British Columbia (UBC) (see Figure 1). The facility also incorporates two levels of underground parking. Discovery Parks Inc. developed this project and the project brief incorporated high standards for sustainability. The project set out to have minimum environmental impact in its construction and occupancy. At the outset, the design team established sustainable goals. A sustainability matrix was set up by Chernoff Thompson Architects to develop goals and targets for site management, water, energy, materials and waste. These were then monitored throughout the project design and construction process. An integrated design team approach was one of the key factors for success in
UBC TEF III Page 2 RJC No. 38080-03
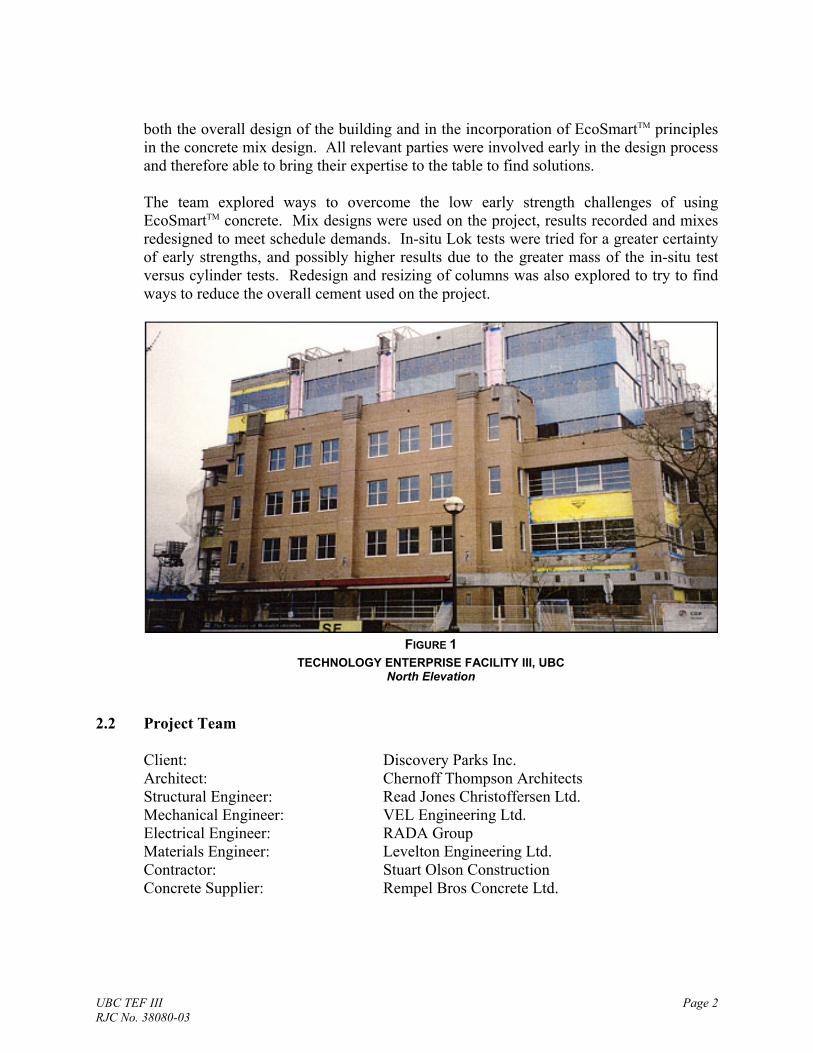
both the overall design of the building and in the incorporation of EcoSmartTM principles in the concrete mix design. All relevant parties were involved early in the design process and therefore able to bring their expertise to the table to find solutions. The team explored ways to overcome the low early strength challenges of using EcoSmartTM concrete. Mix designs were used on the project, results recorded and mixes redesigned to meet schedule demands. In-situ Lok tests were tried for a greater certainty of early strengths, and possibly higher results due to the greater mass of the in-situ test versus cylinder tests. Redesign and resizing of columns was also explored to try to find ways to reduce the overall cement used on the project.
2.2 Project Team Client: Discovery Parks Inc. Architect: Chernoff Thompson Architects Structural Engineer: Read Jones Christoffersen Ltd. Mechanical Engineer: VEL Engineering Ltd. Electrical Engineer: RADA Group Materials Engineer: Levelton Engineering Ltd. Contractor: Stuart Olson Construction Concrete Supplier: Rempel Bros Concrete Ltd.
FIGURE 1 TECHNOLOGY ENTERPRISE FACILITY III, UBC
North Elevation

UBC TEF III Page 3 RJC No. 38080-03
2.3 Project Details Design: 2001 Construction: 2002 - 2003 Completion Date: 2003 Building Area: 15,000 m² Storeys: Six, with two levels of underground parking Construction Cost: $12 million The site for TEF III is located at UBC, at Agronomy Road and East Mall, to the south of the first two TEF buildings constructed by Discovery Parks Inc.: the Gerald McGavin and Donald Rix buildings. A reinforced concrete structure was designed for the building. The laboratory and office floors are a system of concrete slabs and slab bands (wide concrete beams) (see Figure 2 for typical layout). These are supported on concrete columns on concrete pad and strip footings. Since the building housed offices and laboratories, the floor-to-floor heights were 4.0 m compared to the ±3.0 m in typical office buildings. The lateral force-resisting system utilizes the stair and elevator core walls as concrete shearwalls. This provides an economical and efficient lateral system that has minimum impact on the functional planning of the building. This choice of structural system minimizes materials whilst allowing for adaptability and durability of the building for the future. The floors are also designed for higher than code required live loads. For a concrete building, this has a minimal effect on the design and overall volume of materials used and yet gives flexibility for future changes hence enhancing the building’s adaptability. This may also increase the longevity of the building, a goal of sustainable design.
FIGURE 2 TECHNOLOGY ENTERPRISE FACILITY III, UBC
Partial 3rd Floor Plan of Structure

UBC TEF III Page 4 RJC No. 38080-03
3.0 USE OF ECOSMARTTM IN CONCRETE
3.1 Goals The use of fly ash in concrete is not a new concept. Studies for its use began in the 1930’s when fly ash became available from coal burning electric power plants. Fly ash is a waste product from the coal industry. It has been and is used extensively throughout the world to partially replace cement in concrete. Most concrete mixes supplied in Vancouver contain some fly ash, the amounts varying depending on site schedule, weather, specifications and structural elements. The environmental goal for TEF III was to further reduce cement content/increase fly ash without affecting the performance of the concrete, cost and schedule of project. Since the main structure proposed for TEF III was concrete, achieving this goal would have significant impact on reducing CO2 emissions. In addition to the direct benefits of using fly ash to reduce cement, there are also additional reasons to use fly ash. .1 Fly ash is approximately half the price of cement in the current Vancouver
market. The bulk of the price of fly ash is the transportation. Concrete suppliers utilize fly ash in their mixes to reduce price and be competitive in the market. There may not be an obvious direct savings on EcoSmartTM mixes on individual projects currently. However, as it is used more and gains acceptance, the competitive nature of the concrete industry may drive the price down. It is also possible that some EcoSmartTM mixes may be less economic if the total cementitious content of the mix is increased to the point where it costs more than straight Portland cement, and/or plasticizers and water-reducing admixtures added to the concrete to meet schedule demands for the project.
.2 Since fly ash is a waste product, its use redirects waste from landfills. Its only environmental impact on the project is in transportation. The fly ash for our project is supplied from Centralia in Washington, USA. It is Class F fly ash. The fly ash is supplied by a combination of rail and truck transportation.
.3 Some concrete properties are improved by use of Class F fly ash. The following is a brief summary of some improvements particularly relevant to this project: Durability of concrete is increased.
The use of fly ash in concrete reduces the heat of hydration in the curing process. In large mass sections, this has the advantage of reducing the possibility of thermal cracking. The industry has been using fly ash in mass concrete core footings for some time for this reason.
If properly cured, there is an increase in long-term strength. Subsequently, it is possible to change the specification of a 28-day strength to a 56-day strength for EcoSmartTM mixes. Overall long-term strength is not reduced as a result of this change to the specifications.

UBC TEF III Page 5 RJC No. 38080-03
Workability is generally better.
However, Class F fly ash does have some effects on concrete that are challenging to its use in concrete buildings with schedule-driven construction. One of the goals of this project was to look at ways to overcome these issues: .1 Early strengths are reduced with the use of EcoSmartTM concrete. This is an issue
since longer setting times impact the schedule on the construction sites. Forms cannot be stripped until the concrete reaches certain strength, typically 8 MPa to 10 MPa for walls and columns and 17 MPa for slabs and beams. So if elements are on a critical path, concrete mixes often have reduced amounts of fly ash. This slower early strength effect is further compounded in cold weather pouring conditions. In particular, the low early strengths are an issue with slabs, as they often require stripping after two to three days. They are also thin exposed elements that do not have the mass benefit of other elements to assist in the setting process. For example, larger elements have higher concrete temperatures due to heat of hydration. This higher temperature is easily dissipated in thin and/or small concrete sections. On TEF III, data on early strength tests were collected and the results are summarized in this report.
.2 Initial curing (i.e., sealing in moisture or providing adequate moisture to freshly
placed concrete as it hydrates and strengthens) of concrete is important with conventional concrete but becomes even more critical with fly ash concrete. It is particularly critical for slabs. Slabs are thin and dry out faster than other elements such as columns, walls, and footings (slabs have less mass and formwork on one side). Also, since fly ash slows the early set and strength gain, it is necessary to cure the slabs for this longer time period. If the slabs are not properly cured, problems can arise such as lower long-term strength in the concrete. The most effective method is to moist cure. Moist curing is to keep the concrete saturated by continuously adding moisture to the surface. Often, this is achieved by covering the slab with burlap that is kept wet. Other methods, such as curing compounds, can also be effective in the Vancouver climate, if properly applied. For TEF III, the following systems were effectively used: Parking Slabs and Bands: Moist cured (code requirement) Level 1 to Roof: Curing compound
The following specific aspects of the project were identified as goals: .1 Obtaining more data on early strengths of concrete (i.e., 2-day, 3-day, 4-day, and
5-day strength test results) for various mixes.
This information could be of use in future projects to assist in the initial discussion of cement reduction/schedule. More data from other projects on this

UBC TEF III Page 6 RJC No. 38080-03
would still be useful to the industry (i.e., some colder weather results/different levels of fly ash and cement).
.2 Obtaining more accurate early strength results to determine when the formwork can be stripped. Field in-situ tests such as Lok tests and Maturity tests were explored and Lok tests were used on the roof pour. The specific use of in-situ test was identified later in the project as a goal. It would be useful to explore this further on a future project, as the results from this project were inconclusive. Figure 3 shows the project under construction.
.3 Consideration of ways to reduce cement by resizing (reducing in size) elements that benefit from higher strengths of concrete such as columns and walls. The goal would be to reduce the overall cement content for these elements (although the strength of the concrete is higher, it is sometimes possible to use higher per cents of fly ash than in lower strength concretes). The design of columns and walls can, however, be governed by slenderness (the height to width ratio of the element). In these cases, increasing the concrete strength is not as effective as increasing the element width. It is possible that footings could also benefit from this type of study as their thickness is often governed by shear, which is sensitive to concrete strength. Slabs and beams, however, are often sized based on deflection which is sensitive to the span and thickness of elements, and not concrete strength.
FIGURE 3 TECHNOLOGY ENTERPRISE FACILITY III, UBC
East Elevation – Under Construction

UBC TEF III Page 7 RJC No. 38080-03
3.2 Project Chronology Concrete construction began at the end of March 2002. The final pour for the roof was completed in November 2002. There was some experience with cold weather pours towards the end of the project. Footings were poured between April and June with daytime air temperatures at the site ranging from 14ºC to 22ºC. Walls, columns and slabs were poured between May and November with daytime air temperatures at the site ranging from 9ºC to 30ºC. The initial schedule for the project required the slabs to be stripped at four days. Part way through the project, the schedule was tightened requiring the slabs to be stripped at three days.
3.3 Concrete Use in Structure The following table shows the volume of concrete for each element in the building. For this structure, the concrete slabs constitute a high percentage of the total concrete. Due to the schedule and early strength demands of the project, the slabs were also the most challenging elements to incorporate EcoSmartTM concrete.
Element Volume (m³) Volume of Element/ Total Volume
Footings 950 15%
Walls/Columns 1680 25%
Slabs 3800 60%
Total Volume 6430
The slab-on-grade and exterior concrete have been excluded from this table. There is research to support that a minimum cement content should be used for concrete subject to freezing and thawing, and severe de-icing chemicals. Subsequently, these elements were not targeted on this project.
3.4 Project Requirements The concrete specifications for the project requested that the mix designs take full advantage of the uses of fly ash to reduce the cement content of the concrete. Goal percentages of fly ash were broken down into various elements on the project. The intent

UBC TEF III Page 8 RJC No. 38080-03
of these percentages was that, by the addition of fly ash, the cement content should be proportionally reduced. It was also intended that the percentages listed provide a starting point for discussion with the structural engineer, contractor, materials engineer and concrete supplier. As a result of these discussions, the percentages could be increased or decreased depending on schedule and weather. It should be noted that specifying percentages of fly ash could lead to an overall increase in cementitious content of the mixes (i.e., not a decrease in cement content). This could happen if early strengths cannot meet the schedule requirements. The following percentages were provided in the concrete specifications:
Slabs and Slab Bands (including parking) 25%
Slab-on-Grade (interior parking) 25%
Slab-on-Grade (no parking) 25%
Slab-on-Grade (exterior) * 15%
Footings 55%
Walls and Columns 35%
* Generally, it is recommended to have minimum cement content for concrete subject to freezing and thawing and severe de-icing chemicals. For Vancouver, a minimum cement content of ±280 kg/m³ is recommended. The average cement replacement by fly ash in Vancouver is approximately 20% (see References). The specifications also requested alternate mixes with possible increase in cement/decrease in fly ash suitable for cold weather placing of the concrete. The following Tables 1 and 2 are excerpts from the structural drawings showing the structural concrete requirements:

UBC TEF III Page 9 RJC No. 38080-03
Structural requirements for stripping of concrete forms are as follows:
TABLE 1
NO REQUIREMENT208025MPa 5TH. TO U/S ROOF 3RD. TO U/S 5TH. 30MPa 80 20 NO REQUIREMENT
NO REQUIREMENT208035MPa GROUND TO U/S 3RD.40MPa P2 TO U/S GROUND
SHEAR WALLS:
-AND AGGREGATE SIZES AS TABLES 10, 11, 12, and 14 CSA-A23.1.WATER CEMENT RATIOS AND AIR CONTENTS FOR EXPOSURE CLASSES
HOUSEKEEPING PADS20MPaMECHANICAL 2070 NO REQUIREMENT
CLASS__(mm)(mm)STRENGTH(MPa)
LOWER SLUMPS MAY BE USED SUBJECT TO APPROVAL BY R.J.C.-
NO REQUIREMENT
-THEY ARE INTENDED.MIX DESIGNS SHALL STATE THE ELEMENT FOR WHICH
NO REQUIREMENT
70
SMALLER SIZES MAY BE USED (UNLESS NOTED OTHERWISE). - AGGREGATE SIZES SHOWN ARE MAXIMUMS.
NO REQUIREMENT
NO REQUIREMENT / F2
2070
20
C-232 MPaSLAB ON GRADE(EXTERIOR)
80 20OTHER WALLS
C-425 MPaSLAB ON GRADE
20
20
40
20
70
80
80
70
25 MPa
30MPa
35 MPa AND SLAB BANDS
1. CEMENT SHALL BE PORTLAND CEMENT TYPE 10 - U.N.O. CONCRETE SHALL BE STONE CONCRETE WITH A UNIT WEIGHT OF 23.6 kN/m3 (150 PCF).
2. CONCRETE PROPERTIES
MIN. 28 DAY SLUMP MAX. AGG. EXPOSURE ELEMENT
PARKING C-1 SLABS
ALL FOOTINGS
COLUMNS &
SLABS, BEAMS, AND SLAB BANDS (NON-PARKING)
NOTES - PUMP MIX SLUMPS ALSO AS ABOVE.
- SLUMP TOLERANCES - 20mm FOR SLUMPS LESS THAN 80mm, OTHERWISE 30mm.
CONCRETE NOTES
25MPa
UBC TEF III Page 10 RJC No. 38080-03
TABLE 2
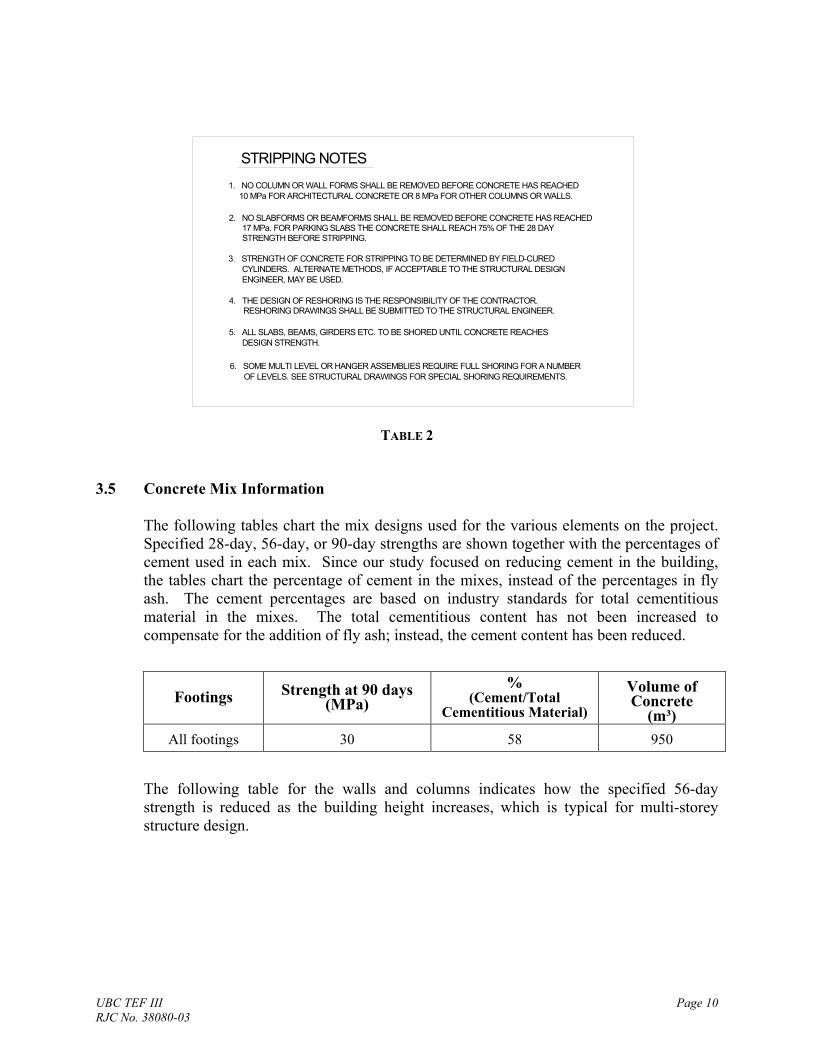
3.5 Concrete Mix Information The following tables chart the mix designs used for the various elements on the project. Specified 28-day, 56-day, or 90-day strengths are shown together with the percentages of cement used in each mix. Since our study focused on reducing cement in the building, the tables chart the percentage of cement in the mixes, instead of the percentages in fly ash. The cement percentages are based on industry standards for total cementitious material in the mixes. The total cementitious content has not been increased to compensate for the addition of fly ash; instead, the cement content has been reduced.
Footings Strength at 90 days (MPa)
% (Cement/Total
Cementitious Material) Volume of Concrete
(m³) All footings 30 58 950
The following table for the walls and columns indicates how the specified 56-day strength is reduced as the building height increases, which is typical for multi-storey structure design.
RESHORING DRAWINGS SHALL BE SUBMITTED TO THE STRUCTURAL ENGINEER.4. THE DESIGN OF RESHORING IS THE RESPONSIBILITY OF THE CONTRACTOR.
STRENGTH BEFORE STRIPPING. 17 MPa. FOR PARKING SLABS THE CONCRETE SHALL REACH 75% OF THE 28 DAY
2. NO SLABFORMS OR BEAMFORMS SHALL BE REMOVED BEFORE CONCRETE HAS REACHED
OF LEVELS. SEE STRUCTURAL DRAWINGS FOR SPECIAL SHORING REQUIREMENTS.6. SOME MULTI LEVEL OR HANGER ASSEMBLIES REQUIRE FULL SHORING FOR A NUMBER
1. NO COLUMN OR WALL FORMS SHALL BE REMOVED BEFORE CONCRETE HAS REACHED 10 MPa FOR ARCHITECTURAL CONCRETE OR 8 MPa FOR OTHER COLUMNS OR WALLS.
3. STRENGTH OF CONCRETE FOR STRIPPING TO BE DETERMINED BY FIELD-CURED CYLINDERS. ALTERNATE METHODS, IF ACCEPTABLE TO THE STRUCTURAL DESIGN ENGINEER, MAY BE USED.
5. ALL SLABS, BEAMS, GIRDERS ETC. TO BE SHORED UNTIL CONCRETE REACHES DESIGN STRENGTH.
STRIPPING NOTES

UBC TEF III Page 11 RJC No. 38080-03
Walls/Columns (Level)
Strength at 56 days (MPa)
% (Cement/Total
Cementitious Material)
Volume of Concrete
(m³)
P2 to Ground 40 65 526 Ground to 3rd 35 65 353
3rd to 5th 30 65 311
5th to Roof 25 65 489
For the nonparking slabs and slab bands, five different mixes were used on the project. The mixes were adjusted throughout the project until the most optimum mix was reached, satisfying the early strength requirements and containing the least amount of cement possible. Represented in the per cent (%) column, is an increase or decrease in cement used for the mixes relative to the original cement quantity in Mix A. Mix A had the least amount of cement, and to suit the schedule/early strength demands for the project, the mixes were adjusted and cement increased, until Mix E where the mix was adjusted, and the cement decreased. The process of mix adjustment is further explained in Section 3.6 - Slabs. Figure 4 shows the parkade at TEF III.
Slabs and Bands (Nonparking)
Strength at 56 days (MPa)
% (Cement/Total
Cementitious Material)
Volume of Concrete
(m³) Mix A 25 70 339 Mix B 25 72 260 Mix C 25 76 247 Mix D 25 80 528 Mix E 25 74 1921
Slabs and Bands (Parking)
Strength at 28 days (MPa)
% (Cement/Total
Cementitious Material)
Volume of Concrete
(m³) All Parking Levels 35 76 505

UBC TEF III Page 12 RJC No. 38080-03
3.6 Findings .1 Setting Times/Early Strengths
The following are graphs showing average strength results from cylinder tests - some field and some laboratory tested. The graphs have highlighted the early strengths since, as discussed, the early strengths often govern the design of the mixes and directly affect the fly ash/cement content of the mixes. Footings
TIME (DAYS)
30
STR
EN
GTH
(MP
a)
0
10
1 2 3
10
20
14.6
4 5 6 7
19.2
20.4
(30 MPa MIX @ 90 DAYS)GRAPH 1 - FOOTINGS
40
5628
27
90
LEGEND
LOWEST STRENGTH IN BATCHAVERAGE STRENGTHHIGHEST STRENGTH IN BATCH
31 32
58% (CEMENT / TOTAL CEMENTITIOUS MATERIAL)
FIGURE 4 TECHNOLOGY ENTERPRISE FACILITY III, UBC
Underground Parkade

UBC TEF III Page 13 RJC No. 38080-03
The early strengths for footings are not as critical, since stripping of forms is not an issue. High early strengths for footings also are often not on the critical path for projects. For TEF III, as indicated in Graph 1, the early strengths for the footings were adequate to form the columns for the first lift. The test results illustrated in the graph show how varied the spread of early strengths can be, particularly in the first seven days. Walls and Columns Graph 2 shows results from the 40 MPa column/wall mix and includes some early test results. Since this is a higher strength mix, it does contain higher total cementitious content and hence higher cement content (than a lower strength mix). Therefore, it is possible to have a higher percentage of fly ash in a higher strength mix as it can still contain a reasonable amount of cement to assist in the early strength gain. Also, a 40 MPa mix will reach the 8 MPa to 10 MPa strengths required to strip earlier than a 25 MPa mix. Therefore, if by using a stronger concrete mix for the walls and columns, their size can be reduced, hence reducing the volume of concrete used, it may be possible to reduce the overall amount of cement for these elements on the project.
TIME (DAYS)0
10
1 32 4 5 6 7 5628 90
50
STR
EN
GTH
(MP
a)
20
30
21
29.7
40
37 39
43
(40 MPa MIX @ 56 DAYS)GRAPH 2 - WALLS + COLUMNS
60
HIGHEST STRENGTH IN BATCHAVERAGE STRENGTHLOWEST STRENGTH IN BATCH
LEGEND
51.554
65% (CEMENT / TOTAL CEMENTITIOUS MATERIAL)

UBC TEF III Page 14 RJC No. 38080-03
A short study on this project was carried out to look at reducing the column sizes/increasing the concrete strength on this project. The columns were redesigned from the original design by reducing the size and increasing the concrete strength. The total cement content was then assessed and compared to the original design of larger columns and lower concrete strength. However, for this project, the floor-to-floor heights were high (4.0 m) and it was found that slenderness was a limiting factor in sizing the columns. Slenderness is the height-to-width ratio of the element. If vertical elements are tall and governed by slenderness increasing the concrete strength will have little effect. A larger cross-section for the column (in particular the width) is required. The assessment showed that the larger lower strength columns were the optimum environmental solution for this project, and therefore no additional greenhouse gas reductions could be achieved on this project in the columns. On projects where slenderness does not govern, smaller high strength columns may be the solution to use the least overall cement.
Graph 3 shows strength results from the 25 MPa column/wall mix at 7, 28, and 56 days. The average 7-day strength from the 40 MPa mix is 43 MPa (Graph 2), whereas the 7-day strength from the 25 MPa mix is 16 MPa (Graph 3). This is an increase in the 7-day strength of 270% compared to only 150% increase in cement. Again, this illustrates that if projects can utilize effectively higher strength concrete, overall savings in cement can be realized. However, many buildings are designed using a range of strengths from 25 MPa to 40 MPa. Shearwalls and
TIME (DAYS)
30
STR
EN
GTH
(MP
a)
0
10
1 2 3
20
4 5 6 7
16
(25 MPa MIX @ 56 DAYS)GRAPH 3 - WALLS + COLUMNS
40
5628
22
90
25.8
HIGHEST STRENGTH IN BATCHAVERAGE STRENGTHLOWEST STRENGTH IN BATCH
LEGEND
65% (CEMENT / TOTAL CEMENTITIOUS MATERIAL)

UBC TEF III Page 15 RJC No. 38080-03
columns can often benefit from the higher strength concrete. The size of these elements can often be reduced if the concrete strength is increased. Therefore, the increase in cement due to the higher concrete strength can result in overall cement savings as the volume of concrete is reduced. However, slabs do not generally benefit by increasing concrete strength. Slabs are typically designed using 25 MPa to 30 MPa concrete. Deflection usually governs the thickness of slabs and increasing the concrete strengths does not result in thinner slabs. Therefore, although using higher concrete strengths would result in higher early strengths for stripping of slabs, the increase in cement for the mix is not offset by smaller volumes of concrete. Although higher percentage of fly ash could be used, the overall cement content would still be higher for high strength mixes than in the lower strength mixes. Figure 5 shows a detailed photograph of the column/slab joint. Slabs The next five graphs (Graphs 4 to 8) show the strength results of the slab mixes used on TEF III, other than parking slabs (i.e., nonparking slabs).
FIGURE 5 TECHNOLOGY ENTERPRISE FACILITY III, UBC
Column in Parkade

UBC TEF III Page 16 RJC No. 38080-03
GRAPH 4 - SLABS + BANDS (NON-PARKING)
TIME (DAYS)
30
STR
ENG
TH (M
Pa)
0
10
1 2 3
20
4 5 6 7
13.9 15.516.75
MIX A (25 MPa MIX @ 56 DAYS)
40
5628
22.9
90
27.4
HIGHEST STRENGTH IN BATCHAVERAGE STRENGTHLOWEST STRENGTH IN BATCH
LEGEND
70% (CEMENT / TOTAL CEMENTITIOUS MATERIAL)
GRAPH 5 - SLABS + BANDS (NON-PARKING)
TIME (DAYS)
30
STR
EN
GTH
(MP
a)
0
10
1 2 3
20
15
4 5 6 7
16.915.1
19.4
MIX B (25 MPa MIX @ 56 DAYS)
40
5628
26
90
HIGHEST STRENGTH IN BATCHAVERAGE STRENGTHLOWEST STRENGTH IN BATCH
LEGEND
31
72% (CEMENT / TOTAL CEMENTITIOUS MATERIAL)

UBC TEF III Page 17 RJC No. 38080-03
GRAPH 6 - SLABS + BANDS (NON-PARKING)
TIME (DAYS)
30
STR
EN
GTH
(MP
a)
0
10
1 2 3
20
13.7
4 5 6 7
15
19
MIX C (25 MPa MIX @ 56 DAYS)
40
5628
26
90
HIGHEST STRENGTH IN BATCHAVERAGE STRENGTHLOWEST STRENGTH IN BATCH
LEGEND
76% (CEMENT / TOTAL CEMENTITIOUS MATERIAL)
GRAPH 7 - SLABS + BANDS (NON-PARKING)
TIME (DAYS)
30
STR
EN
GTH
(MP
a)
0
10
1 2 3
20
17
4 5 6 7
25
MIX D (25 MPa MIX @ 56 DAYS)
40
5628 90
HIGHEST STRENGTH IN BATCHAVERAGE STRENGTHLOWEST STRENGTH IN BATCH
LEGEND
33.4
80% (CEMENT / TOTAL CEMENTITIOUS MATERIAL)

UBC TEF III Page 18 RJC No. 38080-03
Mix A was used on Level 1, Graph 4, the first nonparking suspended slab. In order to strip the slabs, the structural specifications required that 17 MPa be reached. At four days, this first mix did not reach 17 MPa. The mix was adjusted, increasing the amounts of cement until Mix D. Mix D, at 4 days exceeded 17 MPa, whereas Mix C still had not achieved 17 MPa at 4 days. It should be noted that with all these mixes used and tested, reaching a strength of 25 MPa at 56 days did not govern the mix design. In most cases, the mixes reached the design strength of 25 MPa at 28 days. Instead, it was the early strengths that governed. At this point in the design process, the team (contractor, structural engineer, materials engineer) reassessed the mix being used and explored different ways to reduce the cement and still achieve the early strengths of 17 MPa required at four days. The following options to reduce the cement/increase fly ash and achieve the early strength were discussed:
.1 Lower the water/cement ratio and add plasticizer (lowering the water/cement ratio decreases workability so the plasticizer is added to offset this effect). The addition of fly ash also helps with workability so lower water/cement ratio mixes are possible.
GRAPH 8 - SLABS + BANDS (NON-PARKING)
TIME (DAYS)
30
STR
EN
GTH
(MP
a)
0
10
1 2 3
20
14.8
4 5 6 7
18.516.9
23
MIX E (25 MPa MIX @ 56 DAYS)
40
5628 90
HIGHEST STRENGTH IN BATCHAVERAGE STRENGTHLOWEST STRENGTH IN BATCH
LEGEND
30
74% (CEMENT / TOTAL CEMENTITIOUS MATERIAL)
UBC TEF III Page 19 RJC No. 38080-03
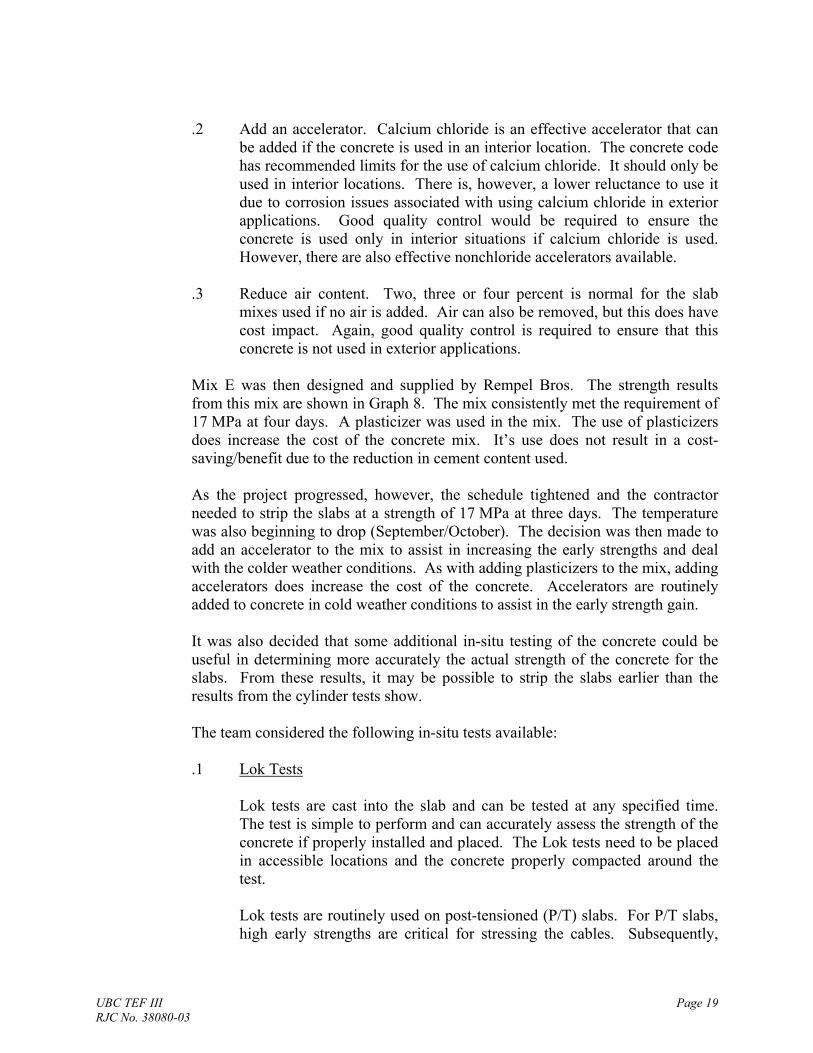
.2 Add an accelerator. Calcium chloride is an effective accelerator that can be added if the concrete is used in an interior location. The concrete code has recommended limits for the use of calcium chloride. It should only be used in interior locations. There is, however, a lower reluctance to use it due to corrosion issues associated with using calcium chloride in exterior applications. Good quality control would be required to ensure the concrete is used only in interior situations if calcium chloride is used. However, there are also effective nonchloride accelerators available.
.3 Reduce air content. Two, three or four percent is normal for the slab
mixes used if no air is added. Air can also be removed, but this does have cost impact. Again, good quality control is required to ensure that this concrete is not used in exterior applications.
Mix E was then designed and supplied by Rempel Bros. The strength results from this mix are shown in Graph 8. The mix consistently met the requirement of 17 MPa at four days. A plasticizer was used in the mix. The use of plasticizers does increase the cost of the concrete mix. It’s use does not result in a cost-saving/benefit due to the reduction in cement content used. As the project progressed, however, the schedule tightened and the contractor needed to strip the slabs at a strength of 17 MPa at three days. The temperature was also beginning to drop (September/October). The decision was then made to add an accelerator to the mix to assist in increasing the early strengths and deal with the colder weather conditions. As with adding plasticizers to the mix, adding accelerators does increase the cost of the concrete. Accelerators are routinely added to concrete in cold weather conditions to assist in the early strength gain. It was also decided that some additional in-situ testing of the concrete could be useful in determining more accurately the actual strength of the concrete for the slabs. From these results, it may be possible to strip the slabs earlier than the results from the cylinder tests show. The team considered the following in-situ tests available: .1 Lok Tests
Lok tests are cast into the slab and can be tested at any specified time. The test is simple to perform and can accurately assess the strength of the concrete if properly installed and placed. The Lok tests need to be placed in accessible locations and the concrete properly compacted around the test. Lok tests are routinely used on post-tensioned (P/T) slabs. For P/T slabs, high early strengths are critical for stressing the cables. Subsequently,

UBC TEF III Page 20 RJC No. 38080-03
Lok tests are carried out. On P/T projects a full-time testing technician is present to ensure the quality control of the tests. The benefits to doing Lok tests for normally reinforced slabs with higher fly ash content may be establishing that higher earlier strengths are actually achieved in-situ than the field cylinder tests indicate.
2. Maturity Meters These are also used to test the in-situ strengths of concrete. Maturity meters have to be calibrated for each concrete mix used. Routinely on projects, mixes are modified, accelerators, plasticizers added to adjust to site conditions, cold weather etc. It would be difficult, therefore, to get accurate results from this system on the projects. However, the benefit of maturity meters is that once they are calibrated, the strength of the concrete can be read at any time.
It was therefore decided that Lok tests would be carried out on the roof pour of TEF III. The roof was poured in two sections, north and south, and six Lok tests were placed in each section. It was decided that, where possible, the field cylinders would be taken and tested at similar times to the Lok tests to act as a comparison. The results are shown in the following Graphs 9 and 10.
GRAPH 9 - ROOF SLAB + BANDS (NORTH)
TIME (DAYS)
30
STR
EN
GTH
(MP
a)
0
10
1 2 3
68.7
20
15.3/15.517.9
12.6
4 5 6 7
15.3
TEST RESULTSPOSSIBLE LOK
17.9
19
MIX E (25 MPa MIX @ 56 DAYS)
40
5628 90
LOK TEST RESULTS
HIGHEST STRENGTH IN BATCHAVERAGE STRENGTHLOWEST STRENGTH IN BATCH
LEGEND
32.334.3
74% (CEMENT / TOTAL CEMENTITIOUS MATERIAL)
UBC TEF III Page 21 RJC No. 38080-03
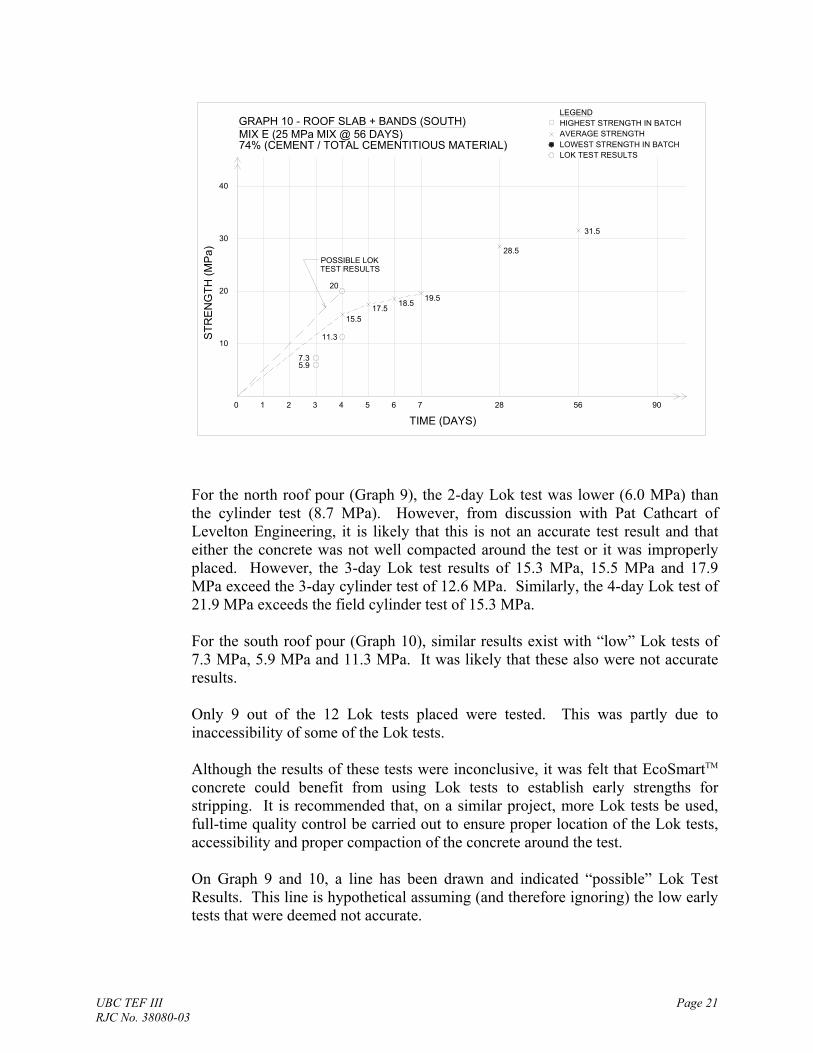
For the north roof pour (Graph 9), the 2-day Lok test was lower (6.0 MPa) than the cylinder test (8.7 MPa). However, from discussion with Pat Cathcart of Levelton Engineering, it is likely that this is not an accurate test result and that either the concrete was not well compacted around the test or it was improperly placed. However, the 3-day Lok test results of 15.3 MPa, 15.5 MPa and 17.9 MPa exceed the 3-day cylinder test of 12.6 MPa. Similarly, the 4-day Lok test of 21.9 MPa exceeds the field cylinder test of 15.3 MPa. For the south roof pour (Graph 10), similar results exist with “low” Lok tests of 7.3 MPa, 5.9 MPa and 11.3 MPa. It was likely that these also were not accurate results. Only 9 out of the 12 Lok tests placed were tested. This was partly due to inaccessibility of some of the Lok tests. Although the results of these tests were inconclusive, it was felt that EcoSmartTM concrete could benefit from using Lok tests to establish early strengths for stripping. It is recommended that, on a similar project, more Lok tests be used, full-time quality control be carried out to ensure proper location of the Lok tests, accessibility and proper compaction of the concrete around the test. On Graph 9 and 10, a line has been drawn and indicated “possible” Lok Test Results. This line is hypothetical assuming (and therefore ignoring) the low early tests that were deemed not accurate.
GRAPH 10 - ROOF SLAB + BANDS (SOUTH)
TIME (DAYS)
30
STR
EN
GTH
(MP
a)
0
10
1 2 3
7.35.9
20
11.3
4 5 6 7
17.5
20
15.5
TEST RESULTSPOSSIBLE LOK
18.5 19.5
MIX E (25 MPa MIX @ 56 DAYS)
40
5628
28.5
90
LOK TEST RESULTS
HIGHEST STRENGTH IN BATCHAVERAGE STRENGTHLOWEST STRENGTH IN BATCH
LEGEND
31.5
74% (CEMENT / TOTAL CEMENTITIOUS MATERIAL)

UBC TEF III Page 22 RJC No. 38080-03
Figure 6 shows a photograph of TEF III’s typical slab with rebar before the concrete is poured. The following graph, Graph 11, shows strength information on the parking slabs and bands.
GRAPH 11 - SLABS + BANDS (PARKING)
TIME (DAYS)
30
STR
EN
GTH
(MP
a)
0
10
1 2 3
20
4 5 6 7
25.1
(35 MPa MIX @ 28 DAYS)
40
34.3
5628 90
HIGHEST STRENGTH IN BATCHAVERAGE STRENGTHLOWEST STRENGTH IN BATCH
LEGEND
40.6
76% (CEMENT / TOTAL CEMENTITIOUS MATERIAL)
FIGURE 6 TECHNOLOGY ENTERPRISE FACILITY III, UBC
Slab Under Construction

UBC TEF III Page 23 RJC No. 38080-03
For parking slabs, the code requires a minimum specified 28-day strength of 35 MPa and a minimum cementing materials content of 320 kg/m³ (A23.1-94, Table 8; S413.94, 6.1.2.2). Since it is a stronger mix with higher levels of cement than the typical slab mixes, the early strength of 17 MPa for stripping was easily reached. It may be possible to increase the fly ash/decrease the cement in parking mixes in future mixes and still satisfy code requirements for parking slabs. Fly ash is also good for durability, an issue in the design of concrete for parking slabs. To summarize this first subsection on the information for early strengths with EcoSmartTM concrete, the following general comments are also made: The spread of early concrete strength results is large. Subsequently, it is
difficult to design EcoSmartTM slab mixes with “guaranteed” high early strengths. This is why P/T and fast-track projects with two-day cycles often contain little or no fly ash.
Early strengths are also slowed in cold weather conditions. The results in this report are from concrete poured in spring, summer and autumn conditions. The early strengths would be reduced for winter pouring conditions, without incorporating additional winter concreting techniques such as heating.
.2 Comments from Contractor/Site
The following comments were received from the contractor on the use of the EcoSmartTM concrete on the project: Strength - if the air temperature was approximately 15ºC, stripping of the
slabs was approximately 72 hours (once the mix was established). The project was able to schedule a four-day stripping for the slabs as the slab pours were staggered.
Workability - good, but mixes also had plasticizers added which increased workability further.
Appearance - not noticeably different than regular concrete at the levels of fly ash used for the mixes.
Finishing - no issues reported. The slabs were finished approximately two hours after pouring using steel trowel power float. Curing compounds were added after finishing.
.3 Assessment of Cement ‘Savings’ on the Project.
The total cement used on the project was 1,321.65 tonnes. An estimated ‘industry’ standard figure was calculated for the cement that may have been used if the environmental goals for the project had not existed. This estimated the possible cement use as 1,513.31 tonnes, resulting in a project savings in cement of

UBC TEF III Page 24 RJC No. 38080-03
191.66 tonnes (13% reduction in cement). It is estimated that each tonne of cement results in 0.9 tonnes of CO2 being produced into the atmosphere (Reference 3). Therefore, by reducing the cement used in the project by 191.66 tonnes, 172.5 tonnes of CO2 was not released into the atmosphere. Note that taken into account in the estimation of greenhouse gas emissions is the environmental cost of transportation of fly ash (by rail and truck) versus the transportation of raw materials for cement manufacture (by barge/ship and truck) over varying distances.
4.0 CONCLUSION
4.1 Current Practice In Vancouver, fly ash is currently used for concrete mixes to reduce the amount of cement used. The amounts are balanced by economics, and meeting strengths and schedule requirements. In many instances, it is the early strength requirements that govern the mix designs versus the 28-day, 56-day, or 90-day strengths.
4.2 Benefits and Impacts There are well-documented benefits to using fly ash: environmental, economic and enhanced concrete properties such as durability, reduced thermal cracking, workability and high long-term strengths (see references). The specific benefits to our project focused on the environmental benefits. Overall, the use of EcoSmartTM concrete on the project was very successful. The team worked together to find solutions to the issues of low early slab strengths instead of highlighting “problems”. The integration, enthusiasm and willingness to go that extra mile of the team on the project were key to its success. The data and information gathered and graphed on the early strengths for the mixes produced useful information to assist in understanding the issues around using EcoSmartTM concrete.
4.3 Future Acceptance In some cities in the world, there is legislation that limits the amount CO2 emissions that a new building can “create” in its construction. The use of fly ash to replace a percentage of cement would assist in this type of goal. The building industry may be required in the future to look at increasing the schedule on projects in order to use EcoSmartTM concrete to a maximum on schedule-driven elements such as slabs. In the meantime, the industry is increasing its knowledge in the use of EcoSmartTM concrete. Elements, such as footings, can use higher levels of fly ash due to mass and less schedule demands. Walls and columns also can achieve higher levels of fly ash. This is particularly possible on the higher strengths mixes since these elements gain strength faster due to higher cement content and can be stripped at lower strengths than slabs. Slabs can also use fly ash. The percentages used need to be balanced with schedule, cost of mixes (addition of

UBC TEF III Page 25 RJC No. 38080-03
plasticizers/admixtures to enhance early strength), weather conditions and strength, slenderness and deflection criteria. Lok tests or Maturity tests could be useful to establish greater accuracy for early strengths, possibly giving higher strength results than the cylinder tests. Overall, the goals to reduce cement for the project at UBC TEF III were successfully met.
4.4 Acknowledgements The author would like to thank Carl Lauren of Stuart Olson Construction, Bill Wehnert and Bryan Russell of Rempel Bros. Concrete Ltd. and Russ Riffell and Pat Cathcart of Levelton Engineering Ltd. Their spirit of teamwork and partnership throughout the EcoSmartTM project at TEF III was key to its success.
5.0 RECOMMENDATIONS This report describes the challenges and successes of using EcoSmartTM concrete on the TEF III project. From the work carried out, the following recommendations are made for investigation and research that could be done on future projects. .1 Further investigation should be done to overcome the issue of low early strength
gain in EcoSmartTM concrete. These could include: consideration of scheduling for stripping of forms; design of the mixes to enhance early strength; the use of in-situ strength tests such as Lok or Maturity tests.
.2 Optimizing and balancing element size and concrete strength to reduce the overall cement content and volume of concrete on the project.
.3 Consider reducing the cement/increasing fly ash on parking slabs. The code requires a minimum 28-day strength of 35 MPa and a minimum cementing materials content of 320 kg/m³. Since this is a stronger mix, meeting an early strength of 17 MPa to strip is not as onerous as with a lower strength slab. It may therefore be possible to reduce the cement content in parking slabs by adding fly ash and still satisfy the early strength demands for projects.
Prepared by: Reviewed by: Diana Klein, P.Eng. Jeff Corbett, P.Eng. Project Engineer Managing Principal - Structural LEEDTM Accredited Professional DK/db

UBC TEF III Page 26 RJC No. 38080-03
REFERENCES
1. ACI Materials Journal, “Use of Fly Ash in Concrete”, (report by Committee 226). 2. Phillip Seabrook and Kevin Campbell, “Using Fly Ash as a Concrete Replacement”. 3. Neil Cumming and Phillip Seabrooke, “The Role of Concrete in Sustainability”, High
Volume Fly Ash Concrete. Presentation - AGM APEGBC 2000 4. Arnie Rosenberg, “What to Look for When Using Fly Ash in Precast Products”, Using
Fly Ash in Concrete. 5. V.M. Malhotra, “Durability of Concrete Incorporating High-Volume of Low-Calcium
(ASTM Class F) Fly Ash”. 6. A. Bilodeau, V. Sivasundaram, K.E. Painter, and V.M. Malhotra, “Durability of Concrete
Incorporating High Volumes of Fly Ash from Sources in the U.S.”. 7. A. Bilodeau and V.M. Malhotra, “High Volume Fly Ash System: Concrete Solution for
Sustainable Development”.