technology diffusion within central banking: the case of ... · technology diffusion within...
TRANSCRIPT
Technology Diffusion within Central Banking:The Case of Real-Time Gross Settlement∗
Morten L. Bech and Bart HobijnFederal Reserve Bank of New York
We examine the diffusion of the real-time gross settle-ment (RTGS) technology across the world’s 174 central banks.RTGS reduces settlement risk and facilitates financial innova-tion in, for example, the settlement of foreign exchange trades.In 1985 only three central banks had implemented RTGS sys-tems; by year-end 2006 that number had increased to ninety-three. We find that the RTGS diffusion process is consistentwith a standard S-shaped curve. Real GDP per capita, therelative price of capital, and trade patterns explain a signif-icant part of the cross-country variation in RTGS adoption.These determinants are remarkably similar to those that seemto drive cross-country adoption patterns of other technologies.
JEL Codes: C72, E58.
1. Introduction
Modern growth theory suggests that financial-sector developmentaffects long-run economic growth. One of the most fundamentalfunctions of the financial sector is to provide efficient mechanismsto make and receive payments. By reducing transaction costs, thepayment system facilitates trade and allows greater specialization byagents in the economy. Over the past few decades, there has beena rapid increase in technological innovation in the financial sector.
∗We thank Allison Fleming and Ariel Stern for research assistance. We aregrateful for comments from Peter Allsopp and an anonymous referee. The viewsexpressed in this paper are those of the authors and do not necessarily reflectthose of the Federal Reserve Bank of New York or the Federal Reserve System.Corresponding author: Morten Bech, Research and Statistics Group, FederalReserve Bank of New York, 33 Liberty Street, Third Floor, New York, NY 10045;Tel: (212) 720-6935; Fax: (212) 720-8363; E-mail: [email protected].
147
148 International Journal of Central Banking September 2007
Nowhere is such innovation more apparent than in the electronifica-tion of means of payment.
In most countries, the payment system is provided by commer-cial banks in a symbiotic partnership with the central bank. Cen-tral banks tend to provide the medium to settle small payments(i.e., cash) and to support an interbank system that settles large-value and time-critical payments. Historically, interbank paymentshave been settled via netting systems. In a netting system, the set-tlement of payments is deferred for some period of time, usuallyuntil the end of the business day. At the end of the defermentperiod, all payments are tallied up, and money is exchanged oneither a bilateral or multilateral net basis among the participants.Commonly, this process is referred to as deferred net settlement(DNS).
The volume of interbank payments has increased dramaticallyover the last thirty years, mainly due to the aforementioned rapidfinancial innovation and the integration and globalization of finan-cial markets. As the volume and value of transactions increased,central banks became worried about settlement risks inherent in net-ting systems. In particular, central banks were concerned about thepotential for contagion (or even a systemic event) due to the unwind-ing of the net positions that would result if a participant failed tomake good on its obligations when due. Consequently, over the lastcouple of decades, many countries have chosen to modify the settle-ment procedure employed by their interbank payment system witha view to reducing settlement risks and the potential for systemwideimplications. Most central banks have opted for the implementationof a real-time gross settlement (RTGS) system. An RTGS systemreduces settlement risk, as payments are settled individually andirrevocably on a gross basis in real time. This ensures immediatefinality.
By 1985 three central banks had implemented an RTGS sys-tem. A decade later, that number had increased to sixteen, butRTGS was still utilized predominately by industrialized countries.In recent years, however, both transitional and developing countrieshave begun investing heavily in improving their financial systems,and now RTGS is a common choice for the interbank payment sys-tem. At the end of 2006, the use of RTGS systems had diffused to93 of the world’s 174 central banks.
Vol. 3 No. 3 Technology Diffusion within Central Banking 149
In this paper, we describe the diffusion of RTGS systems withinthe central banking community and seek to identify the determi-nants of adoption by using a new data set on the implementation ofRTGS systems. A small, but growing, literature analyzes how andwhy commercial banks adopt new technologies (e.g., Hannan andMcDowell 1984, Gowrisankaran and Stavins 2004, and Akhavien,Frame, and White 2005). However, to our knowledge, no studieshave focused on central bank adoption of new technologies, includ-ing RTGS systems.1 This is surprising, given the key role the centralbank plays in the financial sector. Moreover, the adoption decisionby a central bank is potentially interesting in its own right, as itmight be different from the profit considerations driving technologyadoption in the private sector.
We analyze our data in two different ways. First, we considerthe pattern of RTGS adoption over time and space. We estimatean S-shaped adoption curve that is a generalized version of thoseestimated by Griliches (1957) and find that, in all likelihood, it willtake at least another fifteen years before RTGS is fully adopted.Second, we consider the main determinants of RTGS adoptionusing a discrete-time duration model, based on a logistic hazardrate. We find that the probability that a country adopts RTGSin a given year increases significantly with the level of real GDPper capita. Moreover, countries with a lower relative price of cap-ital and countries whose major trading partners adopted RTGSare also more likely to adopt. This suggests that beyond marketforces reflected by real GDP and capital costs, spillovers seem toplay a significant role in the adoption of this financial innovation.These spillovers seem to disseminate mainly through trade relation-ships.
The structure of the rest of this paper is as follows. In the nextsection, we describe the role of the interbank payment systems aswell as the features of netting and real-time gross settlement usingthe U.S. large-value payment system as an example. In section 3we introduce our data on the adoption of RTGS, map out the
1Rogers (1995) defines diffusion as a process by which some type of innova-tion is communicated through certain channels over time and space among themembers of a social system. An innovation is any kind of idea, object, or practicethat members of the social system perceive as new.
150 International Journal of Central Banking September 2007
diffusion of RTGS across the world, and study the S-shaped natureof the world RTGS diffusion curve. Based on the theoretical andempirical literature on technology adoption, we review the potentialdeterminants of RTGS adoption in section 4, and we briefly discussour econometric methodology in section 5. In section 6 we presentour empirical results. We conclude with section 7. A more detaileddescription of our data can be found in the appendix.
2. Interbank Payment Systems and Real-TimeGross Settlement
At the apex of the financial system are a number of critical financialmarkets that provide the means for agents to allocate capital andmanage their risk exposures. Instrumental to the smooth function-ing of these markets is a set of financial infrastructures that facili-tate clearing and settlement.2 Many of these infrastructures use theinterbank payment system to achieve final settlement. In addition,most central banks use the interbank payment system to implementmonetary policy, and the system also serves as the platform for theinterbank money market. An efficient and resilient interbank pay-ment system reduces transaction costs for agents in the economyand is a precondition for the successful implementation of monetarypolicy and ensuring financial stability.
In the United States, there are two principal systems that settleinterbank payments: the Federal Reserve’s Fedwire Funds TransferSystem� (Fedwire) and the Clearing House Inter-Bank PaymentsSystem (CHIPS), a private-sector enterprise. Commercial banksuse Fedwire and CHIPS to handle large-value or time-critical pay-ments, such as payments for the purchase, sale, and financingof securities transactions; foreign exchange transactions; the set-tlement of interbank purchases and sales of federal funds; thedisbursement or repayment of loans; and the settlement of real
2Clearing is the process of transmitting and confirming payment orders orsecurity transfers arising from market trades, as well as establishing, possiblyby way of netting, final positions for settlement. Settlement is the act that dis-charges the obligations between two or more parties arising from the markettrades. Settlement is final when it is irrevocable and unconditional. Ultimatesettlement is sometimes used to denote final settlement in central bank money.

Vol. 3 No. 3 Technology Diffusion within Central Banking 151
estate transactions and other large-value purchases on behalf ofcustomers.3
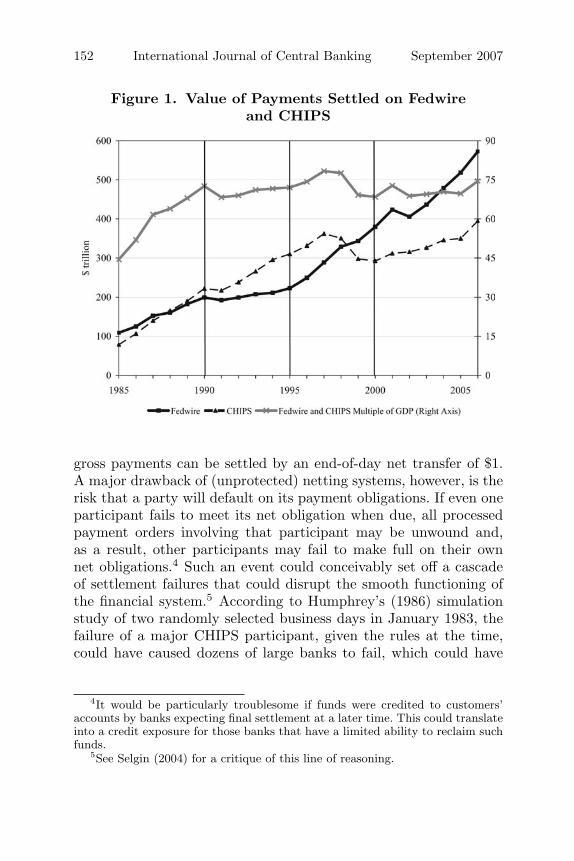
Through Fedwire, participants initiate funds transfers that areimmediate, final, and irrevocable when processed. Like other sys-tems with these key features, Fedwire is an RTGS system. In fact,Fedwire is the world’s oldest RTGS system. Its origins go backto 1918, when the Federal Reserve inaugurated a network of wirecommunications among the individual Reserve Banks. The new sys-tem of wire-initiated book entries allowed funds to be transferredon behalf of the member banks and significantly reduced the needfor physical shipment of gold and currency. In the early 1970s, theFedwire system migrated to a fully computerized platform, and set-tlement in “real time” was achieved. During the first year of Fedwireoperation, the Federal Reserve Bank of New York processed around100 wires per day; ten years later, the Bank was processing about600 wires per day. Today, more than 7,500 participants across thetwelve Reserve Banks originate an average of over 530,000 trans-fers per day. The value of transfers originated has seen tremendousgrowth. The annual turnover increased from around $100 trillion in1985 to over $570 trillion in 2006, equivalent to an annual growthrate of over 8 percent (see figure 1).
The New York Clearing House Association organized CHIPS in1970 for eight of its members to settle the dollar side of foreignexchange transactions and other large-value payments. Participa-tion in CHIPS expanded gradually in the 1970s and 1980s to includeother commercial banks, branches of foreign banks, and other finan-cial institutions. CHIPS began as a deferred net settlement system.Until 1981, final settlement occurred on the morning of the nextbusiness day through the transfer of balances across the books ofthe Federal Reserve Bank of New York. A sharp increase in set-tlement volumes raised concerns that next-day settlement undulyexposed participants to various overnight and overweekend risks.In response, CHIPS began providing same-day settlement throughFedwire in August 1981.
Netting substantially reduces the amount of money needed tosettle a given set of obligations. As a rough rule of thumb, $100 in
3Several payment and securities settlement systems (including CHIPS) useFedwire to square final positions over the course of the business day.
152 International Journal of Central Banking September 2007
Figure 1. Value of Payments Settled on Fedwireand CHIPS
gross payments can be settled by an end-of-day net transfer of $1.A major drawback of (unprotected) netting systems, however, is therisk that a party will default on its payment obligations. If even oneparticipant fails to meet its net obligation when due, all processedpayment orders involving that participant may be unwound and,as a result, other participants may fail to make full on their ownnet obligations.4 Such an event could conceivably set off a cascadeof settlement failures that could disrupt the smooth functioning ofthe financial system.5 According to Humphrey’s (1986) simulationstudy of two randomly selected business days in January 1983, thefailure of a major CHIPS participant, given the rules at the time,could have caused dozens of large banks to fail, which could have
4It would be particularly troublesome if funds were credited to customers’accounts by banks expecting final settlement at a later time. This could translateinto a credit exposure for those banks that have a limited ability to reclaim suchfunds.
5See Selgin (2004) for a critique of this line of reasoning.

Vol. 3 No. 3 Technology Diffusion within Central Banking 153
triggered a systemwide crisis.6 Accordingly, in response to the wishesof both participants and regulators, CHIPS moved in 2001 to a newsettlement system that provides intraday finality.7
The current version of CHIPS is referred to as a hybrid system,as it combines features of DNS and RTGS.8 Currently, CHIPS has45 participants (down from 142 in 1985) representing nineteen differ-ent countries. In 1985, CHIPS settled $78 trillion, which increased to$362 trillion in 1997. However, settlements over CHIPS dipped in thelate 1990s, and it was not until 2006 (with $395 trillion settled) thatthe previous peak was surpassed. As illustrated in figure 1, settle-ments over CHIPS were larger than those over Fedwire from 1988to 1998. Seen over the entire period, the annual growth rate is com-parable to that of Fedwire at almost 8 percent. Measured relativeto the economic output of the United States, Fedwire and CHIPSsettled payments equivalent to seventy-five times the gross domes-tic product in 2006. In other words, payments equivalent to the U.S.GDP run through the two systems on average every three-and-a-halfbusiness days.
3. Diffusion of Real-Time Gross Settlement
The U.S. experience with interbank payment systems is differentfrom that of most countries in the sense that there have been twosystems operating for the last thirty-five years and that RTGS wasimplemented before DNS. In the rest of the world, there is typi-cally only one large-value interbank payment system per country,and prior to the 1980s, that system settled payments using deferrednet settlement. As interbank payment systems around the world sawgrowth in the value of payments similar to that experienced by theUnited States, settlement risk issues emerged on the forefront of thepayments policy agenda of the world’s central banks. Because manyaspects of settlement risk are eliminated in an RTGS system, many
6Similar simulation studies of interbank netting schemes in other countrieshave not found risks of the same magnitude. See, e.g., Angelini, Maresca, andRusso (1996) and Bech, Natorp, and Madsen (2002).
7For a description of the current CHIPS system, see www.chips.org.8For a discussion of hybrid systems and new developments in large-value pay-
ment systems, see McAndrews and Trundle (2001) and Bank for InternationalSettlements (2005).
154 International Journal of Central Banking September 2007
central banks began to consider this option.9 However, the reduc-tion in risk comes at the cost of a greatly increased need for intradayliquidity to smooth the nonsynchronized payment flows.10
In the 1980s a number of Western European countries beganimplementing RTGS systems. By 1988, RTGS systems operated infive of the six major currencies (sterling being the other). Duringthe early 1990s, RTGS adoption continued at a rate of roughly onecountry per year. In 1992, the Treaty of Maastricht created thefoundation for the Economic and Monetary Union (EMU). A yearlater, the central banks within the European Union (EU) agreedthat each member state should have an RTGS system. Further-more, in 1995 it was decided to interlink the national RTGS systemsthrough the Trans-European Automated Real-time Gross settle-ment Express Transfer (TARGET) system in order to facilitate theEuropean Central Bank’s (ECB) single monetary policy and to pro-mote sound and efficient payment mechanisms in euros.11 Thesedecisions led to a flurry of new systems and upgrades to existingones. TARGET went live on January 4, 1999, and even EU countriesthat did not join the EMU at the outset were allowed to participatein the system.
As the ECB made RTGS a prerequisite for membership to theEMU, the prospective members in the rest of Europe began to imple-ment RTGS as well. Furthermore, as hostilities ended in the Balkansin the late 1990s, governments began to rebuild their respectiveeconomies. They considered the establishment of sound and efficientfinancial systems a priority. RTGS systems were implemented withsupport from the EU, the International Monetary Fund (IMF), and
9RTGS can also help reduce settlement risk by facilitating payment versuspayment or delivery versus payment in the settlement of foreign exchange andsecurities transactions, respectively. For a discussion of settlement risk in grossand net settlement systems, see Kahn, McAndrews, and Roberds (2003).
10Initially, central banks provided intraday credit for free to commercial banks.But this policy is no longer considered a viable option by central banks, asit exposes them (and ultimately the taxpayers), as guarantor of the finality ofpayments, to credit risk.
11The ECB also operates its own RTGS system for its account holders—theECB payment mechanism (EPM). EPM is connected to TARGET and is used forsettlement of euro positions arising from the EBA Clearing Company (throughthe EURO 1 system) and CLS, the continuous linked settlement system for foreignexchange transactions.
Vol. 3 No. 3 Technology Diffusion within Central Banking 155
the World Bank. With ongoing projects in Russia and Cyprus, thediffusion of RTGS in Europe is nearly complete.
In the late 1980s, the central banks of the Group of Ten (G-10)12
countries published the Angell and Lamfalussy reports, which studydifferent aspects of interbank netting schemes. In 1990, the perma-nent Committee on Payment and Settlement Systems (CPSS) wascreated by the G-10 governors. The CPSS has focused on dissemi-nating information on payment system design and has been instru-mental in defining the norms and best practices for the central bankcommunity in the area of payments. For example, in 1997, the CPSSpublished a report on real-time gross settlement that laid out gen-eral features as well as the specifics of the systems in operationin the G-10 countries. In 2002, the CPSS published a set of coreprinciples for systemically important payment systems. These CPSSrecommendations are now part of the toolkit of the Financial SectorAssessment Program (FSAP), jointly established by the IMF andthe World Bank. The FSAP reviews seek to identify strengths andvulnerabilities in order to reduce the potential for financial crisis.
Outside Europe, the rate of adoption of RTGS since the mid-1990s has been equally impressive. Australia and New Zealandimplemented RTGS in 1998 and remain the only countries inOceania that have gone live with RTGS. In Asia, the rate of RTGSimplementation has been fairly steady; on average, about one coun-try has adopted RTGS per year. Hong Kong is interesting in thatRTGS is used to settle payments not only in the local currencybut also in U.S. dollars and euros. Six countries in the Middle Easthave implemented RTGS. In Africa, the South African Reserve Bank(SARB) spearheaded adoption in 1998. Through the South AfricanDevelopment Community (SADC),13 the SARB has participated indeveloping and strengthening the financial infrastructure in the restof southern Africa. As of 2006, eleven African central banks haveimplemented RTGS, many with the support of the World Bank.
12The G-10 countries are Belgium, Canada, France, Germany, Italy, Japan,Netherlands, Sweden, Switzerland, the United Kingdom, and the United States.In 1997 the Hong Kong Monetary Authority and the Monetary Authority ofSingapore joined the Committee on Payment and Settlement Systems.
13The member states of the SADC are Angola, Botswana, the DemocraticRepublic of the Congo, Lesotho, Malawi, Mauritius, Mozambique, Namibia, Sey-chelles, South Africa, Swaziland, Tanzania, Zambia, and Zimbabwe.
156 International Journal of Central Banking September 2007
In the Western Hemisphere, Canada is an interesting case. It isthe only G-10 country that has decided not to implement an RTGSsystem. Instead, Canada opted for a hybrid system that primar-ily employs multilateral netting by novation. The Canadian LargeValue Transfer System is considered equivalent to RTGS in termsof finality, as the Bank of Canada provides an explicit guarantee ofsettlement in case of participant failure. In South America, Uruguaywas the first country to adopt RTGS, in 1995. In 2006, seven of thir-teen South American countries had adopted RTGS. RTGS imple-mentation in Central America and the Caribbean has only startedrecently, but the Inter-American Development Bank is assisting theefforts to implement RTGS systems in the region.14
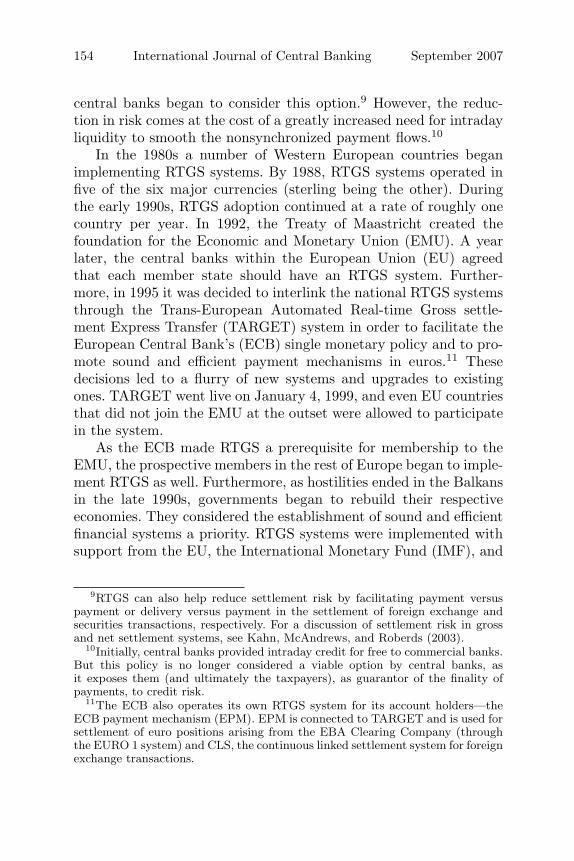
As illustrated in figure 2, the world RTGS adoption rate wasabout one central bank per year in the latter part of the 1980s and inthe beginning of the 1990s. In the mid-1990s, however, the adoption
Figure 2. Annual Number of Central BanksThat Adopt RTGS
14A central-bank-specific account of the diffusion of RTGS is available in Bech(forthcoming).
Vol. 3 No. 3 Technology Diffusion within Central Banking 157
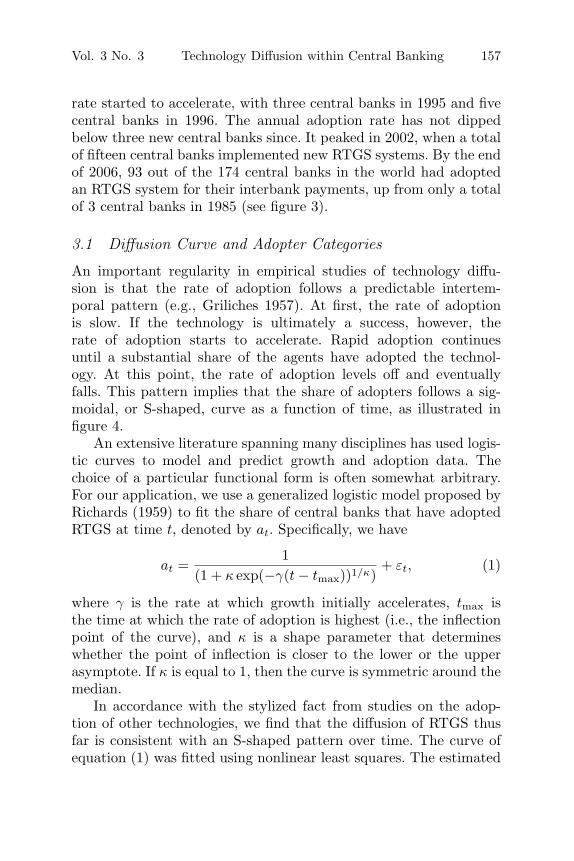
rate started to accelerate, with three central banks in 1995 and fivecentral banks in 1996. The annual adoption rate has not dippedbelow three new central banks since. It peaked in 2002, when a totalof fifteen central banks implemented new RTGS systems. By the endof 2006, 93 out of the 174 central banks in the world had adoptedan RTGS system for their interbank payments, up from only a totalof 3 central banks in 1985 (see figure 3).
3.1 Diffusion Curve and Adopter Categories
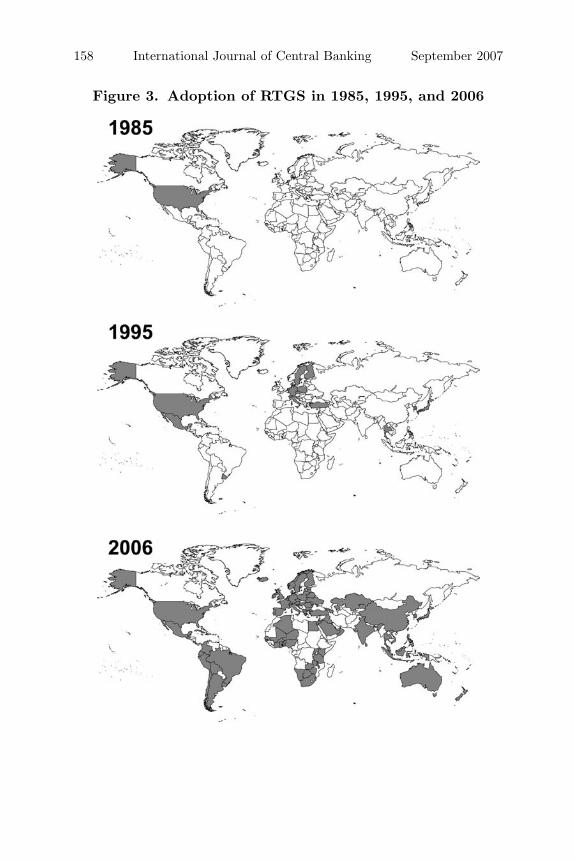
An important regularity in empirical studies of technology diffu-sion is that the rate of adoption follows a predictable intertem-poral pattern (e.g., Griliches 1957). At first, the rate of adoptionis slow. If the technology is ultimately a success, however, therate of adoption starts to accelerate. Rapid adoption continuesuntil a substantial share of the agents have adopted the technol-ogy. At this point, the rate of adoption levels off and eventuallyfalls. This pattern implies that the share of adopters follows a sig-moidal, or S-shaped, curve as a function of time, as illustrated infigure 4.
An extensive literature spanning many disciplines has used logis-tic curves to model and predict growth and adoption data. Thechoice of a particular functional form is often somewhat arbitrary.For our application, we use a generalized logistic model proposed byRichards (1959) to fit the share of central banks that have adoptedRTGS at time t, denoted by at. Specifically, we have
at =1
(1 + κ exp(−γ(t − tmax))1/κ)+ εt, (1)
where γ is the rate at which growth initially accelerates, tmax isthe time at which the rate of adoption is highest (i.e., the inflectionpoint of the curve), and κ is a shape parameter that determineswhether the point of inflection is closer to the lower or the upperasymptote. If κ is equal to 1, then the curve is symmetric around themedian.
In accordance with the stylized fact from studies on the adop-tion of other technologies, we find that the diffusion of RTGS thusfar is consistent with an S-shaped pattern over time. The curve ofequation (1) was fitted using nonlinear least squares. The estimated
158 International Journal of Central Banking September 2007
Figure 3. Adoption of RTGS in 1985, 1995, and 2006
Vol. 3 No. 3 Technology Diffusion within Central Banking 159
Figure 4. Stylized Sigmoidal Adoption Curve andAdopters Categories
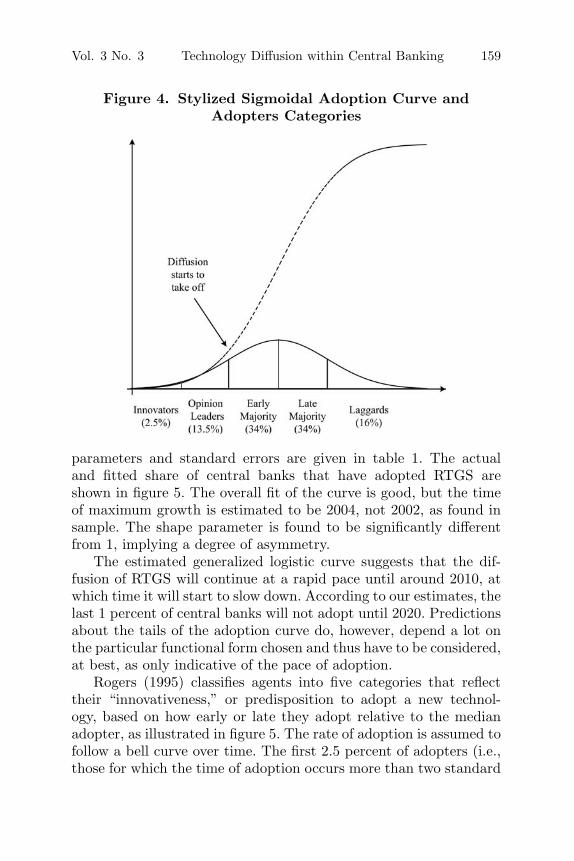
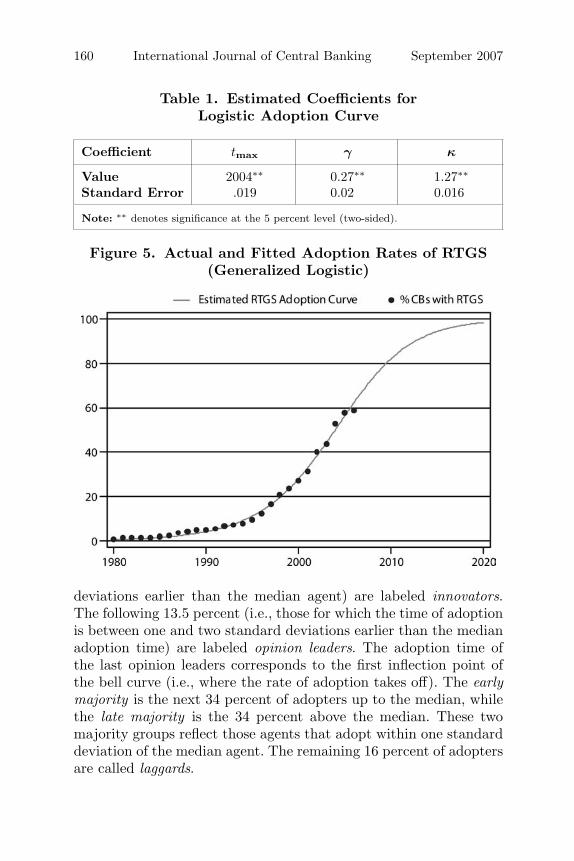
parameters and standard errors are given in table 1. The actualand fitted share of central banks that have adopted RTGS areshown in figure 5. The overall fit of the curve is good, but the timeof maximum growth is estimated to be 2004, not 2002, as found insample. The shape parameter is found to be significantly differentfrom 1, implying a degree of asymmetry.
The estimated generalized logistic curve suggests that the dif-fusion of RTGS will continue at a rapid pace until around 2010, atwhich time it will start to slow down. According to our estimates, thelast 1 percent of central banks will not adopt until 2020. Predictionsabout the tails of the adoption curve do, however, depend a lot onthe particular functional form chosen and thus have to be considered,at best, as only indicative of the pace of adoption.
Rogers (1995) classifies agents into five categories that reflecttheir “innovativeness,” or predisposition to adopt a new technol-ogy, based on how early or late they adopt relative to the medianadopter, as illustrated in figure 5. The rate of adoption is assumed tofollow a bell curve over time. The first 2.5 percent of adopters (i.e.,those for which the time of adoption occurs more than two standard
160 International Journal of Central Banking September 2007
Table 1. Estimated Coefficients forLogistic Adoption Curve
Coefficient tmax γ κ
Value 2004∗∗ 0.27∗∗ 1.27∗∗
Standard Error .019 0.02 0.016
Note: ∗∗ denotes significance at the 5 percent level (two-sided).
Figure 5. Actual and Fitted Adoption Rates of RTGS(Generalized Logistic)
deviations earlier than the median agent) are labeled innovators.The following 13.5 percent (i.e., those for which the time of adoptionis between one and two standard deviations earlier than the medianadoption time) are labeled opinion leaders. The adoption time ofthe last opinion leaders corresponds to the first inflection point ofthe bell curve (i.e., where the rate of adoption takes off). The earlymajority is the next 34 percent of adopters up to the median, whilethe late majority is the 34 percent above the median. These twomajority groups reflect those agents that adopt within one standarddeviation of the median agent. The remaining 16 percent of adoptersare called laggards.
Vol. 3 No. 3 Technology Diffusion within Central Banking 161
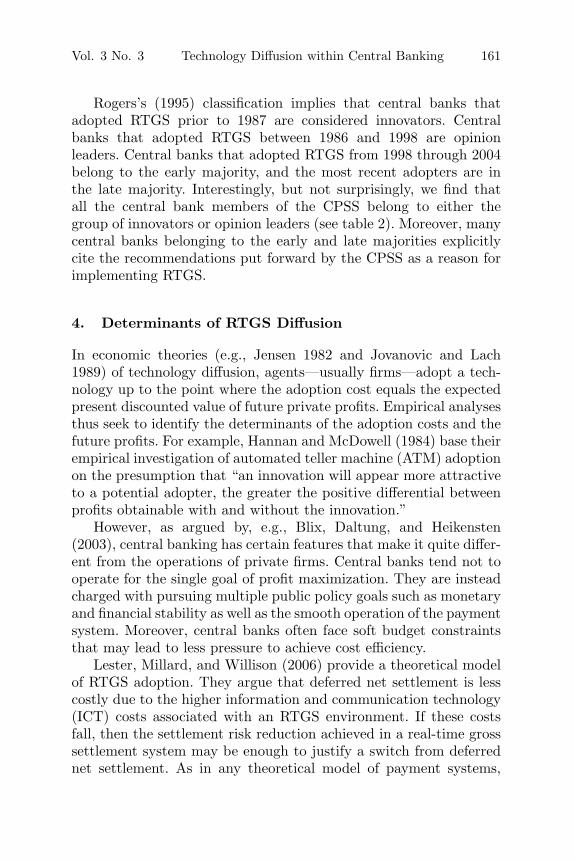
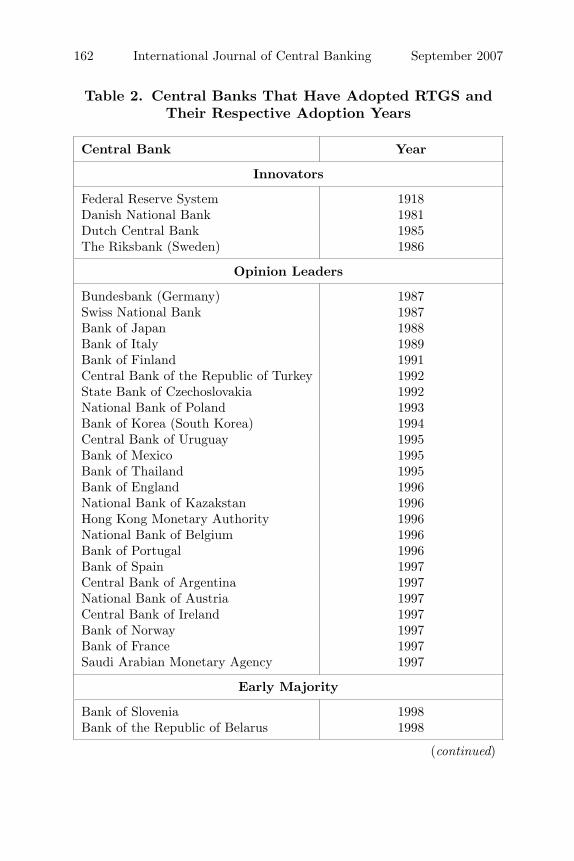
Rogers’s (1995) classification implies that central banks thatadopted RTGS prior to 1987 are considered innovators. Centralbanks that adopted RTGS between 1986 and 1998 are opinionleaders. Central banks that adopted RTGS from 1998 through 2004belong to the early majority, and the most recent adopters are inthe late majority. Interestingly, but not surprisingly, we find thatall the central bank members of the CPSS belong to either thegroup of innovators or opinion leaders (see table 2). Moreover, manycentral banks belonging to the early and late majorities explicitlycite the recommendations put forward by the CPSS as a reason forimplementing RTGS.
4. Determinants of RTGS Diffusion
In economic theories (e.g., Jensen 1982 and Jovanovic and Lach1989) of technology diffusion, agents—usually firms—adopt a tech-nology up to the point where the adoption cost equals the expectedpresent discounted value of future private profits. Empirical analysesthus seek to identify the determinants of the adoption costs and thefuture profits. For example, Hannan and McDowell (1984) base theirempirical investigation of automated teller machine (ATM) adoptionon the presumption that “an innovation will appear more attractiveto a potential adopter, the greater the positive differential betweenprofits obtainable with and without the innovation.”
However, as argued by, e.g., Blix, Daltung, and Heikensten(2003), central banking has certain features that make it quite differ-ent from the operations of private firms. Central banks tend not tooperate for the single goal of profit maximization. They are insteadcharged with pursuing multiple public policy goals such as monetaryand financial stability as well as the smooth operation of the paymentsystem. Moreover, central banks often face soft budget constraintsthat may lead to less pressure to achieve cost efficiency.
Lester, Millard, and Willison (2006) provide a theoretical modelof RTGS adoption. They argue that deferred net settlement is lesscostly due to the higher information and communication technology(ICT) costs associated with an RTGS environment. If these costsfall, then the settlement risk reduction achieved in a real-time grosssettlement system may be enough to justify a switch from deferrednet settlement. As in any theoretical model of payment systems,
162 International Journal of Central Banking September 2007
Table 2. Central Banks That Have Adopted RTGS andTheir Respective Adoption Years
Central Bank Year
Innovators
Federal Reserve System 1918Danish National Bank 1981Dutch Central Bank 1985The Riksbank (Sweden) 1986
Opinion Leaders
Bundesbank (Germany) 1987Swiss National Bank 1987Bank of Japan 1988Bank of Italy 1989Bank of Finland 1991Central Bank of the Republic of Turkey 1992State Bank of Czechoslovakia 1992National Bank of Poland 1993Bank of Korea (South Korea) 1994Central Bank of Uruguay 1995Bank of Mexico 1995Bank of Thailand 1995Bank of England 1996National Bank of Kazakstan 1996Hong Kong Monetary Authority 1996National Bank of Belgium 1996Bank of Portugal 1996Bank of Spain 1997Central Bank of Argentina 1997National Bank of Austria 1997Central Bank of Ireland 1997Bank of Norway 1997Bank of France 1997Saudi Arabian Monetary Agency 1997
Early Majority
Bank of Slovenia 1998Bank of the Republic of Belarus 1998
(continued)

Vol. 3 No. 3 Technology Diffusion within Central Banking 163
Table 2 (continued). Central Banks That Have AdoptedRTGS and Their Respective Adoption Years
Central Bank Year
Early Majority (continued)
Central Bank of Colombia 1998Monetary Authority of Singapore 1998Reserve Bank of Australia 1998Reserve Bank of New Zealand 1998South African Reserve Bank 1998Croatian National Bank 1999Central Bank of Luxembourg 1999Bank of Greece 1999Central Bank of Malaysia 1999National Bank of Hungary 1999Central Bank of Peru 2000Central Bank of Iceland 2000Qatar Central Bank 2000Bank of Indonesia 2000Bank of Latvia 2000Bank of Mauritius 2000Central Bank of the United Arab Emirates 2001State Bank of Vietnam 2001National Bank of the Republic of Macedonia 2001National Bank of Azerbaijan 2001Central Bank of Bosnia and Herzegovina 2001Central Bank of Netherlands Antilles 2001National Bank of Georgia 2001Central Bank of Costa Rica 2001Central Bank of Cuba 2001Central Bank of Brazil 2002Central Bank of Malta 2002Central Bank of the Philippines 2002Bank of Estonia 2002Bank of Namibia 2002Reserve Bank of Malawi 2002Reserve Bank of Zimbabwe 2002Central Bank of Barbados 2002Bank of Ghana 2002
(continued)

164 International Journal of Central Banking September 2007
Table 2 (continued). Central Banks That Have AdoptedRTGS and Their Respective Adoption Years
Central Bank Year
Early Majority (continued)
The Peoples Bank of China 2002Central Bank of Jordan 2002Central Bank of China (Taiwan) 2002Central Bank of Bulgaria 2002Bank of Botswana 2003Reserve Bank of India 2003National Bank of the Slovak Republic 2003National Bank of Serbia 2003Central Bank of Ecuador 2003Central Bank of Sri Lanka 2003Central Bank of Kuwait 2004Central Bank of Chile 2004Bank of Tanzania 2004Central Bank of Bolivia 2004Bank of Albania 2004Bank of Lithuania 2004Central Bank of West African States 2004Bank of Zambia 2004Central Bank of Trinidad and Tobago 2004
Late Majority
National Bank of Romania 2005Bank of Guatemala 2005Bank of Uganda 2005National Bank of Ukraine 2005Central Bank of Montenegro 2005Central Bank of Kenya 2005Central Bank of Oman 2005Central Bank of Nigeria 2005National Bank of Moldova 2006Bank of Algeria 2006Central Bank of Iraq 2006
Vol. 3 No. 3 Technology Diffusion within Central Banking 165
a switch from one system to another generally requires a facilitatorthat coordinates the choices of all market participants. This is wherethe public policy role of the central bank comes in.
Hence, our study of RTGS adoption is importantly different fromother empirical studies of technology adoption (e.g., Griliches 1957,Mansfield 1961, Gort and Klepper 1982, Jovanovic and Lach 1989,and Skinner and Staiger 2005). These studies focus on the adoptionof technologies by individuals or firms that have a profit incentive.Such a market incentive is only indirectly present in a central bank’sdecisions to adopt RTGS systems. The set of factors taken intoaccount by central banks when assessing the benefits of adopting anew technology is potentially much bigger than that of private-sectorfirms.
Technology is an input in the production function of clearing andsettlement services, just as labor and capital are. Keller (2004) high-lights two key aspects of technology that are applicable in our con-text as well. First, technology is a nonrival in the sense that the mar-ginal costs of an additional agent using the technology are negligibleand that the adoption of RTGS by one central bank does not in anyway hinder another central bank from adopting. Second, the returnsto technological investments are partly private and partly public.
The basic premise of our analysis is that a central bank that hasnot yet adopted RTGS will adopt at such time τi when the perceived(present discounted) value of benefits equals or exceeds the (presentdiscounted) cost of adoption. As argued above, we do not necessarilyinterpret the costs and benefits here in the neoclassical sense of aprofit function, but instead interpret them in the broader context ofboth private and social costs and benefits.
We regard an RTGS system to be an irreversible settlementprocess innovation with a considerable ICT investment embedded init. The adoption of an RTGS is virtually impossible to reverse due tothe central role of the interbank payment system and its many inter-connections and interdependencies with other financial infrastruc-tures. As other clearing and settlement mechanisms come to rely oninstant finality in real time, changing their modus operandi becomesincreasingly expensive or even infeasible. Moreover, the implementa-tion of a specific settlement process imposes certain requirements interms of ICT. For example, DNS requires batch-based computingand communication capabilities with participants, while RTGSrequires real-time computing and communication.
166 International Journal of Central Banking September 2007
Economic theory and evidence on technology adoption provideus with guidance on the set of potentially significant determinants ofperceived value and costs. In the rest of this section, we discuss thepotential determinants of innovativeness and the method by whichwe approximate them in our empirical analysis. We limit ourselvesto a brief description of the data here. The underlying details, def-initions, and sources are provided in the appendix. The cost andbenefit factors we identify for our empirical analysis can be clas-sified into two groups. The first group comprises direct indicatorsof costs and benefits. The second consists of the effects the actionsof other central banks have on a particular central bank’s cost andbenefit perception.
Investment Price Index. Our main indicator of direct adop-tion costs is the price of investment goods from the Penn WorldTable (Heston, Summers, and Aten 2002). We use this as a proxyfor the price of the ICT equipment that is necessary to execute settle-ments in an RTGS system. Hence, we expect countries in which ICTis cheaper, as reflected in a lower investment price, to adopt RTGSmore quickly. We are aware that our investment price measure isnot ICT specific. For this reason, we also use personal computersper capita as an additional proxy, where our main assumption isthat more personal computers reflect lower ICT prices and imple-mentation costs.
Education. Brynjolfsson and Hitt (2000) provide evidence thatthe costs of physical capital and software are only a small part ofthe total costs involved in implementing ICT-related process inno-vations in the U.S. private sector. A large part of the cost of imple-mentation has to do with the acquisition of the knowledge abouthow to use and benefit from the new process, which mainly involvesskilled labor inputs. That is, adoption costs are lower if employ-ees’ pre-RTGS skills and knowledge help them learn the best wayto use RTGS systems more quickly, as pointed out in Nelson andPhelps (1966). This is often referred to as the new technology being“appropriate” for the existing endowments (see, e.g., Basu and Weil1998).
Since we use a measure of education of the overall workforce, ourmeasure also includes the skill level of the (potential) users of theRTGS system. Because of capital-skill complementaries, an RTGSsystem increases the productivity of educated users more than that
Vol. 3 No. 3 Technology Diffusion within Central Banking 167
of other users. As a consequence, we expect the benefits of RTGS tobe higher in countries with a more educated workforce.
Independent of the cost versus benefit interpretation of educationfor RTGS adoption, we expect education to have an unambiguouslypositive effect on the probability of a central bank adopting an RTGSsystem.
Financial Market Development. On the direct benefits side,central banks themselves are not assumed to pursue a profit objec-tive per se. They are, however, presumed to contribute to the effi-ciency, stability, and competitiveness of domestic financial markets.The main benefit of adopting an RTGS system is that it improves theefficiency of domestic financial markets, primarily by significantlyreducing settlement risks.
Unfortunately, cross-country data on the amount of settlementson interbank payment systems is not available. This means we willhave to use indirect proxy variables for the level of financial devel-opment and its effects on RTGS adoption. We use three proxyvariables, shown by Levine, Loayza, and Beck (2000) to be corre-lated with GDP growth. These variables are liquid liabilities, whichmeasure the financial depth of a country; the ratio of commercialto central bank assets, which measures the degree to which the pri-vate part of the banking sector allocates savings; and private creditissued by financial intermediaries to the private sector. The latteris the preferred measure of financial development of Levine, Loayza,and Beck (2000).
Real GDP per Capita and Population. Real GDP per capitaseems to matter in almost all studies of cross-country technologyadoption patterns (e.g., Caselli and Coleman 2001 and Comı́n andHobijn 2004). Because the fixed setup costs of an RTGS system are,in large part, independent of the size of the market, while the benefitsof an RTGS system, as in the reduction of the settlement risk, areincreasing with the size of the market, we would expect to observethe adoption of RTGS to be subject to scale effects. These effectsare similar to those in the endogenous growth literature (Jones 1995)in which a fixed innovation cost would imply that the endogenousgrowth rate would be increasing with market size. To the extent suchscale effects exist, we expect the likelihood of adoption of RTGS tobe higher in countries with a bigger population and a larger economy,as measured by GDP per capita.
168 International Journal of Central Banking September 2007
So far, we have focused on a central bank’s adoption costs andbenefits of implementing an RTGS system that does not depend onthe actions of its counterparts.15 There are, however, several rea-sons to believe that the RTGS adoption decisions of central banksare likely to be interdependent.
First, the decision to adopt is influenced by competitive pressuresfrom global financial markets. To the extent that an RTGS systemprovides benefits that enhance the competitiveness of the domesticfinancial markets or financial assets denominated in the currency ofthe central bank, such pressures may speed up or force the adop-tion decision. For example, a prerequisite for a currency to be partof the Continuous Linked Settlement (CLS) foreign exchange set-tlement system is the ability to make real-time transfers in centralbank money.16
Second, just as is the case for personal computers (e.g., Goolsbeeand Klenow 2002), the adoption of RTGS is subject to network exter-nalities. That is, given international financial integration, it is morebeneficial for a central bank to adopt an RTGS system when thisallows access to a broad network of other countries’ RTGS systems.This consideration seems to have been an important driving forcebehind the EU’s requirement that countries have an RTGS systemin place before joining the monetary union.
Third, given the many cooperative structures set up among cen-tral banks (like the Bank for International Settlements and theEuropean Central Bank), as well as the many other interlinkagesbetween central banks (such as their historical linkages), it is verylikely that the knowledge acquired through experiences with RTGSsystems spills over to other central banks and helps them make their
15It is difficult to measure central bank efficiency (see Blix, Daltung, andHeikensten 2003 for a discussion). For example, the functions carried out by cen-tral banks vary significantly across countries. In fact, as noted by Brione (2006),it is hard to get an idea of the actual operating expenses of central banks, evenacross the OECD, let alone the rest of the world.
16CLS Bank International is currently the leading settlement institution forforeign exchange transactions. It is an industry-owned bank, chartered in theUnited States as an Edge corporation and supervised by the Federal ReserveSystem. CLS was founded in response to concerns raised by the G-10 centralbanks about settlement risk in foreign exchange transactions. It began opera-tions in September 2002 and now settles transactions in fifteen currencies for asizable share of the foreign exchange market.
Vol. 3 No. 3 Technology Diffusion within Central Banking 169
respective adoption decisions. Spillovers of this type have been exten-sively documented as they relate to R&D and trade flows (see, e.g.,Coe and Helpman 1995), and they are likely to be an importantfactor in the diffusion of payments systems as well.
Fourth, central banks do not necessarily have to install anddevelop the ICT component involved with the RTGS adoption them-selves. Several private companies have entered the marketplace andhave begun to offer “off-the-shelf” standardized software solutions.Currently, there are at least five providers that have built RTGSsystems in more than one country.17 The possibility of sharing devel-opment costs across customers and competition among providers haspresumably lowered the cost of implementing RTGS and hence madeit feasible for more countries to adopt.
The second point outlined above is known as a networkspillover, while the third and fourth points are known as knowl-edge spillovers.18 These are two types of indicators that we includein our analysis to capture interdependencies of central banks’ RTGSadoption decisions.
Membership of International Organizations. To captureknowledge spillovers that arise from countries sharing informationand jointly defining policy goals and standards in international orga-nizations, we control for central banks being members of the Bankfor International Settlements (BIS), countries being member statesof the European Union, and countries being member states of theSouth African Development Council.
To the extent that membership in these organizations providesearlier access to knowledge about RTGS, we expect membership inthese organizations to have a positive impact on the likelihood of acentral bank adopting an RTGS system.
17These providers are LogicaCMG plc of the United Kingdom, CMA SmallSystem AB of Sweden, the joint venture of Perago Ltd of South Africa and SIASpA of Italy, Montran Corporation of the United States, and BCS InformationSystems of Singapore.
18We are using the term spillover loosely here. The interdependencies in thedecisions of central banks that we describe are only spillovers in a pure economicsense if, when making adoption decisions, central banks do not take into accountthe positive effects that their RTGS adoption decisions have on their counter-parts. If central banks do not internalize these effects, the rate of adoption ofRTGS around the world would be inefficiently low.
170 International Journal of Central Banking September 2007
Bilateral Trade. To capture knowledge and network spilloversfrom the countries that interact most with each other economically,we calculate the trade-weighted fraction of countries’ trading part-ners that have adopted an RTGS system.19 This measure is verysimilar in spirit to the R&D spillover measure that Coe and Helpman(1995) use in their analysis and, just as in Coe and Helpman (1995),we expect it to have a positive effect on (RTGS) technology adoption.
5. Econometric Analysis
In this section, we outline our econometric approach. Let v∗it denote
the perceived value of the RTGS system for central bank i at timet, and let c∗
it denote the cost of adoption. In practice, we observeneither the perceived benefits nor the costs of adopting an RTGSsystem for any central bank. However, we assume that both v∗
it andc∗it can be represented by a linear combination of a set of observable
proxy variables. These are the variables described in section 4. Wedenote the vector with these variables as xit. Specifically, we assume
v∗it = x′
itθv + εvit, (2)
c∗it = x′
itθc + εcit, (3)
where θv and θc are vectors of unknown perceived marginal benefitand perceived marginal cost parameters. εv
it and εcit are country- and
time-specific random variables. The adoption time, τi, of RTGS forcentral bank i satisfies
τi = arg mint
{t |y∗it ≥ 0} , (4)
where
y∗it = v∗
it − c∗it = x′
it(θv − θc) + εvit − εc
it = x′itθ + εit (5)
is the net benefit of adopting RTGS at time t. We do not observe thisnet benefit; it is a latent variable. What we do observe is whether anRTGS system is adopted by a central bank at time t in our sampleperiod, {1, . . . , T}.
19We limit ourselves to the ten largest trading partners for each country.
Vol. 3 No. 3 Technology Diffusion within Central Banking 171
Let yit be a binary variable that equals 1 if central bank i hasadopted RTGS at time t and 0 otherwise. As the adoption processof RTGS is still ongoing, there are two types of central banks inour sample: (i) central banks that have already adopted—the uncen-sored part of the sample—and (ii) central banks that have not yetadopted—the censored part of our sample. For central banks thatadopt RTGS at time τi ≤ T , we observe the binary variable yit = 0for all t < τi and yit = 1 for t ≥ τi. This sequence of observationsimplies that the net benefit of adopting for central bank i was nega-tive (i.e., y∗
it < 0) for t = 1, . . . , τi − 1 and positive (i.e., y∗it ≥ 0) for
t = τi. The assumed irreversibility of the RTGS adoption decisionmeans that the observations for t > τi are of no empirical rele-vance for our analysis. For central banks in the censored part ofour sample—i.e., those that have yet to adopt RTGS—we observeyit = 0 for all t = 1, . . . , T . This implies that the latent net benefitof RTGS adoption was negative for every period up to time T .
Following the approach of Allison (1982), we assume that εit isindependently, logistically distributed—in our case across countriesand over time. This allows us to write our model as a logistic haz-ard model and to relate the probability of RTGS adoption to thecross-country and time variation in the covariates xit.20
The probability that central bank i adopts an RTGS system attime τi = t equals
p(τi = t) =T∏
s=tp(yis = 1|Ys−1) ·
t−1∏
u=2p(yiu = 0|Yu−1) · p(yi1 = 0), (6)
where Yt−1 denotes the set of observations up to and including yit−1.However, due to the irreversible nature of the adoption decision,
p(yis = 1| . . . , yiu = 1, . . .) = 1 for all s > u. (7)
Hence, the only observations that are relevant for calculating theprobability are the ones before the central bank adopts and the oneat the time that it adopts. From equations (6) and (7), we have
p(τi = t) = p(yit = 1|Yt−1) ·t−1∏
s=2p(yis = 0|Ys−1) · p(yi1 = 0). (8)
20Our technology adoption analysis is similar to the retirement decision analysisin Ashenfelter and Card (2002).
172 International Journal of Central Banking September 2007
In contrast, for central banks that do not adopt RTGS within oursample period (i.e., the censored part of the sample), we observeyit = 0 for all t. We have
p(τi > T ) =T∏
s=2p(yis = 0|Ys−1)p(yi1 = 0). (9)
In practice, this means that, for our empirical analysis, we use datanot only on central banks that have already implemented the sys-tem but also on central banks that have not yet done so. For thecentral banks that adopt, however, we only use information up toand including the time of adoption.
From equations (8) and (9), we can set up the likelihood func-tion. Let the set of countries that have adopted RTGS by theend of the sample period be AT = {i |τi ≤ T }. We have p(yit =1|xit) = p(y∗
it > 0|xit) = p(εit > −x′itθ). Assuming that yi1, . . . , yiT
(conditional on xi1, . . . ,xiT ) are independent and that εit has alogistic distribution Λ(ε) = p(εit < x′
itθ), the likelihood functionbecomes
L(θ; τi) =∏
i∈AT
p(τi = t|xit) ·∏
i/∈AT
p(τi > T |xit) (10)
=∏
i∈AT
[τi∏
t=1p(yit = 0|xit)]p(yit = 1|xit) ·
∏
i/∈AT
T∏
t=1p(yit = 0|xit)
=∏
i∈AT
[τi∏
t=11 − Λ(x′
itθ)]Λ(x′itθ) ·
∏
i/∈AT
T∏
t=11 − Λ(x′
itθ).
Our specification implies that we can only estimate (θv − θc) , whichis the excess benefit from a particular variable in xi,t. However, forproxy variables that we know affect only costs or only benefits (orfor which we can reasonably conjecture the same), the coefficientcan be interpreted as the cost or benefit parameter.
The above likelihood function is that of a logit model. Since theprobability of adoption can be interpreted as a hazard rate in termsof a duration model, our empirical analysis can be interpreted asa discrete-time duration model with logistic, time-varying hazardrates.
Vol. 3 No. 3 Technology Diffusion within Central Banking 173
6. Results
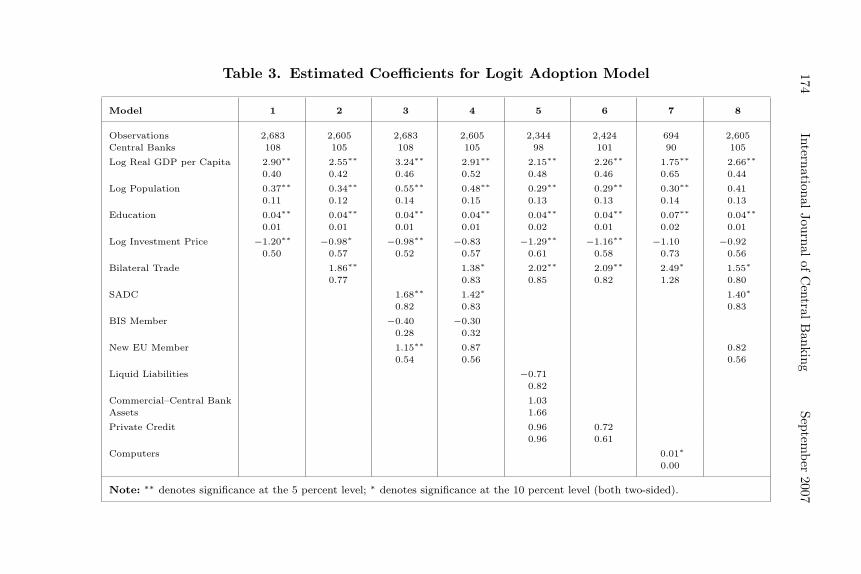
Table 3 contains the estimated coefficients from the logistic-hazard-rate model. Our sample covers 108 central banks from 1970 through2000. We take an incremental approach for our analysis of the causesof technology adoption of RTGS. We start by presenting the coreresults for the explanatory variables that matter consistently acrossour model specifications. These are (i) real GDP per capita, (ii) pop-ulation, (iii) education, and (iv) the investment price. For all ofthese variables, the estimated coefficients are significant and of theexpected sign for all model specifications for which we have 100 coun-tries or more. That is, larger countries (as reflected by population)with a higher standard of living (as reflected by real GDP per capita)and a higher level of human capital (as reflected by education) seemto be more likely to adopt an RTGS system than others.
Moreover, countries with a relatively low price of capital also aremore likely to adopt. Jones (1994) finds that capital prices, especiallythose of machines, help explain cross-country variation in growthrates of real GDP per capita. Our results suggest that this variationmight have to do with the ways in which these capital prices affecttechnology adoption decisions. That is, if these prices seem to besignificant in explaining variation in the adoption of a technology bythe public sector, they most likely matter even more for the adop-tion of technologies by the private sector where the profit motive isan even more powerful incentive for adoption decisions.
In terms of our spillovers proxies, we find that bilateral traderelationships with countries that have adopted RTGS significantlyincrease the probability of adoption. This is very much in line withthe evidence on international R&D spillovers, as in Coe and Help-man (1995). In terms of membership in international organizations,only membership of the South African Development Council seemsto function as a significant catalyst of the RTGS adoption process.A country’s membership in this organization significantly increasesthe per-period probability of adopting RTGS compared with itsnonmember counterparts.
The financial development measures—i.e., those that proxy forfinancial markets benefits of RTGS—do not seem to explain much ofthe cross-country variation in the adoption of RTGS. The insignifi-cance of these indicators is not due to their being highly correlated.
174International
Journalof
Central
Banking
September
2007Table 3. Estimated Coefficients for Logit Adoption Model
Model 1 2 3 4 5 6 7 8
Observations 2,683 2,605 2,683 2,605 2,344 2,424 694 2,605Central Banks 108 105 108 105 98 101 90 105
Log Real GDP per Capita 2.90∗∗ 2.55∗∗ 3.24∗∗ 2.91∗∗ 2.15∗∗ 2.26∗∗ 1.75∗∗ 2.66∗∗
0.40 0.42 0.46 0.52 0.48 0.46 0.65 0.44
Log Population 0.37∗∗ 0.34∗∗ 0.55∗∗ 0.48∗∗ 0.29∗∗ 0.29∗∗ 0.30∗∗ 0.410.11 0.12 0.14 0.15 0.13 0.13 0.14 0.13
Education 0.04∗∗ 0.04∗∗ 0.04∗∗ 0.04∗∗ 0.04∗∗ 0.04∗∗ 0.07∗∗ 0.04∗∗
0.01 0.01 0.01 0.01 0.02 0.01 0.02 0.01
Log Investment Price −1.20∗∗ −0.98∗ −0.98∗∗ −0.83 −1.29∗∗ −1.16∗∗ −1.10 −0.920.50 0.57 0.52 0.57 0.61 0.58 0.73 0.56
Bilateral Trade 1.86∗∗ 1.38∗ 2.02∗∗ 2.09∗∗ 2.49∗ 1.55∗
0.77 0.83 0.85 0.82 1.28 0.80
SADC 1.68∗∗ 1.42∗ 1.40∗
0.82 0.83 0.83
BIS Member −0.40 −0.300.28 0.32
New EU Member 1.15∗∗ 0.87 0.820.54 0.56 0.56
Liquid Liabilities −0.710.82
Commercial–Central Bank 1.03Assets 1.66
Private Credit 0.96 0.720.96 0.61
Computers 0.01∗
0.00
Note: ∗∗ denotes significance at the 5 percent level; ∗ denotes significance at the 10 percent level (both two-sided).
Vol. 3 No. 3 Technology Diffusion within Central Banking 175
Even when we only include private credit, as in column 7 of table 3,we do not find any significant effect of financial development on theprobability of RTGS adoption beyond that which is already capturedby including real GDP per capita among the regressors.
The adoption rate of personal computers per capita does seemto positively affect the probability of adoption of RTGS. This result,however, should be interpreted with caution because the small num-ber of observations on personal computers per capita means that thecoefficient is estimated with far fewer degrees of freedom than theother results.
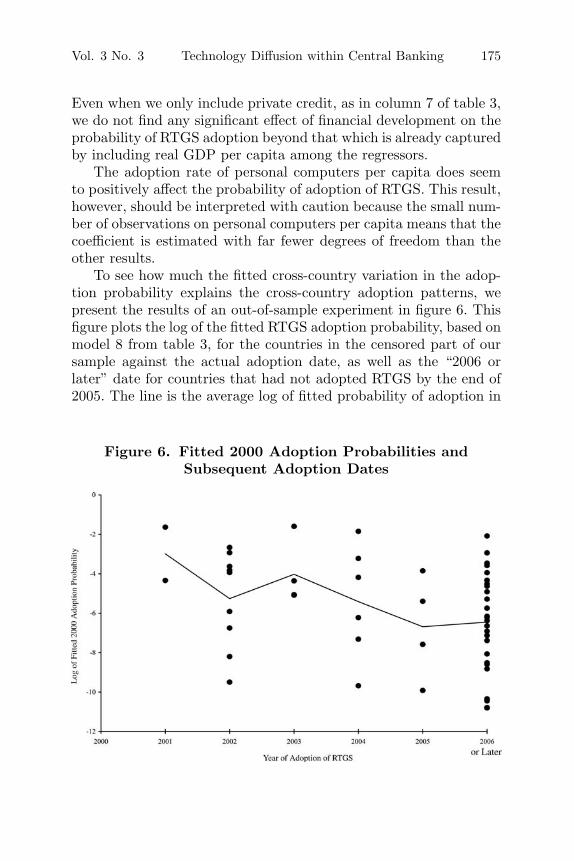
To see how much the fitted cross-country variation in the adop-tion probability explains the cross-country adoption patterns, wepresent the results of an out-of-sample experiment in figure 6. Thisfigure plots the log of the fitted RTGS adoption probability, based onmodel 8 from table 3, for the countries in the censored part of oursample against the actual adoption date, as well as the “2006 orlater” date for countries that had not adopted RTGS by the end of2005. The line is the average log of fitted probability of adoption in
Figure 6. Fitted 2000 Adoption Probabilities andSubsequent Adoption Dates
176 International Journal of Central Banking September 2007
2000 for the countries that adopt in each subsequent year. As canbe seen in the figure, later adopters had, on average, a lower fittedprobability of RTGS adoption in 2000.
7. Conclusion
We study the adoption of real-time gross settlement systems acrossthe world’s 174 central banks. These systems are used to facilitateinterbank payments. As Frame and White (2004) point out, the rapidrate of financial innovation over the past few decades is widely recog-nized as a stylized fact. A striking feature of the literature based onthis fact, however, is the relative dearth of empirical studies. Ourscan be interpreted as one such study. The study of RTGS in thecontext of technology adoption is interesting, since the decision toadopt RTGS is in large part based on the perception by a centralbank of the public goods benefit of the system, rather than on theprofit motive driving adoption in the private sector.
The adoption pattern of RTGS follows an S-shaped diffusioncurve, similar to that observed for other technologies in technologyadoption literature (e.g., Griliches 1957, Mansfield 1961, and Gortand Klepper 1982). The lags in the adoption of RTGS are long. In thelast twenty years, the number of central banks using RTGS for theirinterbank payments has increased from three to ninety-three. Thismeans that eighty-one central banks have not yet adopted RTGSand thus are not yet benefiting from the reduction in settlement riskprovided by such a system. Estimation of the world adoption curveof RTGS suggests that it might take another fifteen years beforeRTGS technology is adopted by the remaining eighty-one centralbanks.
The probability that a country adopts RTGS in a given yearincreases significantly with the level of real GDP per capita. More-over, countries with a lower relative price of capital and coun-tries whose major trading partners have already adopted RTGS arealso more likely adopters. This suggests that, beyond market forcesreflected by real GDP and capital costs, spillovers seem to play asignificant role in the adoption of this financial innovation. Thesespillovers seem to be transferred mainly through trade relationships.
These results suggest that the policy role of central banks isnot only to coordinate the adoption of the RTGS system in their
Vol. 3 No. 3 Technology Diffusion within Central Banking 177
domestic market but also to internalize the externalities of thisadoption decision by other central banks. International cooperationamong central banks is one way to facilitate this internalization. Towhat extent the RTGS adoption pattern, as well as its determinants,is representative of central banks’ technology decisions more broadlyis a topic for further research.
Appendix. Data: Sources and Definitions
Countries and Time Span
Our data cover the 174 central banks and monetary authoritieslisted in the 2006 Morgan Stanley Central Bank Directory. The dataspan a time period from 1970 through 2005. The majority of thecentral banks in our sample serve only one country. However, the fol-lowing five central banks encompass various countries: the EasternCaribbean Central Bank, the Central Bank of West African States(BCEAO), the Central Bank of Central African States (BEAC), theBank of France, and the Swiss National Bank.
Dependent Variable
RTGS Adoption: Dichotomous variable that indicates whether ornot a central bank has implemented an RTGS system. We gatheredinformation on each central bank’s usage of RTGS, as well as thedate of implementation, from publicly available web sites.
Explanatory Variables (Listed in Alphabetical Order)
Bilateral Trade Spillovers: Fraction of trade with top-ten trad-ing partners that is conducted with partners that have implementedRTGS. Source: International Monetary Fund (2006) and Gleditsch(2002). Period: 1970–2005.BIS Member: Dummy variable that indicates whether countryis a member of the BIS. Source: www.correlatesofwar.org. Period:1970–2005.Commercial–Central Bank Assets: Assets of deposit-moneybanks divided by assets of deposit-money banks plus central bankassets. Source: Levine, Loayza, and Beck (2000). Period: 1970–2004.
178 International Journal of Central Banking September 2007
Computers: Number of computers per 1,000 people. Source: WorldBank (2006). Period: 1980–2003.Deposits/GDP: Bank deposits as a fraction of GDP. Source: Inter-national Monetary Fund (2006). Period: 1970–2004.Education: Average primary school attainment rate. Source: Barroand Lee (1993). Period: 1970–2000 (average over sample).Investment Price: Capital goods price index. Source: Heston,Summers, and Aten (2002). Period: 1970–2000.Liquid Liabilities: Liquid liabilities of the financial system (cur-rency plus demand and interest-bearing liabilities of banks andnonbank financial intermediaries) divided by GDP. Source: Levine,Loayza, and Beck (2000). Period: 1970–2004.New EU Member: Dummy variable that indicates whether coun-try became a member of the European Union or applied after 1986.Source: www.wikipedia.com (keyword: Union). Period: 1970–2005.Population: Source: World Bank (2006). Period: 1970–2004.Private Credit: Credit by deposit-money banks and other financialinstitutions to the private sector divided by GDP. Source: Levine,Loayza, and Beck (2000). Period: 1970–2004.Real GDP per Capita: Source: Heston, Summers, and Aten(2002). Period: 1970–2000.SADC: Dummy variable that indicates whether a country isa member of the South African Development Council. Source:www.sadc.int. Period: 1970–2005.
Note: Not all series are available for every country and every year in oursample.
References
Akhavein, J., S. Frame, and L. White. 2005. “The Diffusion of Finan-cial Innovations: An Examination of the Adoption of Small Busi-ness Credit Scoring by Large Banking Organizations.” Journalof Business 78 (2): 577–96.
Allison, P. D. 1982. “Discrete-Time Methods for the Analysis ofEvent Histories.” Sociological Methodology, ed. Samuel Lein-hardt, 61–98. San Francisco: Jossey-Bass.
Vol. 3 No. 3 Technology Diffusion within Central Banking 179
Angelini, P., G. Maresca, and D. Russo. 1996. “Systemic Risk inthe Netting System.” Journal of Banking and Finance 20 (5):853–68.
Ashenfelter, O., and D. Card. 2002. “Did the Elimination of Manda-tory Retirement Affect Faculty Retirement?” American Eco-nomic Review 92 (4): 957–80.
Bank for International Settlements. 2005. “New Developments inLarge-Value Payment Systems.” Publication No. 67, Committeeon Payment and Settlement Systems.
Barro, R. J., and J. Lee. 1993. “International Comparisons of Edu-cational Attainment.” NBER Working Paper No. 4349.
Basu, S., and D. N. Weil. 1998. “Appropriate Technology andGrowth.” Quarterly Journal of Economics 113 (4): 1025–54.
Bech, M. Forthcoming. “The Diffusion of Real Time Gross Set-tlement.” In The Future of Payments, ed. S. Millard and V.Saporta. London: Routledge.
Bech, M., L. Natorp, and B. Madsen. 2002. “Systemic Risk inthe Danish Interbank Netting System.” Working Paper No. 8,Danmarks Nationalbank.
Blix, M., S. Daltung, and L. Heikensten. 2003.“On Central BankEfficiency.” Economic Review (Sveriges Riksbank) 3: 81–93.
Brione, P. 2006. “Central Bank Staff Costs.” Central Banking XVI(2): 69–74.
Brynjolfsson, E., and L. M. Hitt. 2000. “Beyond Computation: Infor-mation Technology, Organizational Transformation and BusinessPerformance.” Journal of Economic Perspectives 14 (4): 23–48.
Caselli, F., and W. J. Coleman. 2001. “Cross-Country TechnologyDiffusion: The Case of Computers.” American Economic Review91 (2): 328–35.
Coe, D. T., and E. Helpman. 1995. “International R&D Spillovers.”European Economic Review 39 (5): 859–87.
Comı́n, D., and B. Hobijn. 2004. “Cross-Country Technology Adop-tion: Making the Theories Face the Facts.” Journal of MonetaryEconomics 51 (1): 38–83.
Frame, W. S., and L. J. White. 2004. “Empirical Studies of FinancialInnovation: Lots of Talk, Little Action?” Journal of EconomicLiterature 42 (1): 116–44.
Gleditsch, K. S. 2002. “Expanded Trade and GDP Data.” Journalof Conflict Resolution 46 (5): 712–24.
180 International Journal of Central Banking September 2007
Goolsbee, A., and P. Klenow. 2002. “Evidence on Learning andNetwork Externalities in the Diffusion of Home Computers.”Journal of Law & Economics 45 (2): 317–44.
Gort, M., and S. Klepper. 1982. “Time Paths in the Diffusion ofProduct Innovations.” Economic Journal 92 (367): 630–53.
Gowrisankaran, G., and J. Stavins. 2004. “Network Externalitiesand Technology Adoption: Lessons from Electronic Payments.”RAND Journal of Economics 35 (Summer): 260–76.
Griliches, Z. 1957. “Hybrid Corn: An Exploration in the Economicsof Technological Change.” Econometrica 25 (4): 501.
Hannan, T. H., and J. M. McDowell. 1984. “The Determinants ofTechnology Adoption: The Case of the Banking Firm.” RANDJournal of Economics 15 (3): 328–35.
Heston, A., R. Summers, and B. Aten. 2002. “Penn World Table Ver-sion 6.1.” Center for International Comparisons at the Universityof Pennsylvania (CICUP).
Humphrey, D. B. 1986. “Payments Finality and Risk of SettlementFailure.” Technology and the Regulation of Financial Markets:Securities, Futures, and Banking, ed. A. Saunders and L. J.White. Lexington, MA: D. C. Heath and Company.
International Monetary Fund. 2006. International Financial Sta-tistics (IFS). Online Database. Washington, DC: InternationalMonetary Fund.
Jensen, R. 1982. “Adoption and Diffusion of an Innovation ofUncertain Profitability.” Journal of Economic Theory 27 (1):182–93.
Jones, C. I. 1994. “Economic Growth and the Relative Price ofCapital.” Journal of Monetary Economics 34 (3): 359–82.
———. 1995. “R&D-Based Models of Economic Growth.” Journalof Political Economy 103 (4): 759–84.
Jovanovic, B., and S. Lach. 1989. “Entry, Exit, and Diffusion withLearning by Doing.” American Economic Review 79 (4): 690–99.
Kahn, C. M., J. McAndrews, and W. Roberds. 2003. “SettlementRisk under Gross and Net Settlement.” Journal of Money,Credit, and Banking 35 (4): 591–608.
Keller, W. 2004. “International Technology Diffusion.” Journal ofEconomic Literature 42 (3): 752–82.
Lester, B., S. Millard, and M. Willison. 2006. “Optimal SettlementRules for Payment Systems.” Mimeo, Bank of England.
Vol. 3 No. 3 Technology Diffusion within Central Banking 181
Levine, R., N. Loayza, and T. Beck. 2000. “Financial Intermedia-tion and Growth: Causality and Causes.” Journal of MonetaryEconomics 46 (1): 31–77.
Mansfield, E. 1961. “Technical Change and the Rate of Imitation.”Econometrica 29 (4): 741–66.
McAndrews, J., and J. Trundle. 2001. “New Payment SystemDesigns: Causes and Consequences.” Financial Stability Review(Bank of England) 11 (December): 127–36.
Morgan Stanley. 2006. Central Bank Directory. London: CentralBanking Publications.
Nelson, R. R., and E. S. Phelps. 1966. “Investment in Humans, Tech-nological Diffusion, and Economic Growth.” American EconomicReview 56 (2): 69–75.
Richards, F. J. 1959. “A Flexible Growth Curve for Empirical Use.”Journal of Experimental Botany 10 (2): 290–300.
Rogers, E. 1995. Diffusion of Innovations. 5th ed. New York: FreePress.
Selgin, G. 2004. “Wholesale Payments: Questioning the Market-Failure Hypothesis.” International Review of Law and Economics24 (3): 333–50.
Skinner, J., and D. Staiger. 2005. “Technology Adoption fromHybrid Corn to Beta Blockers.” NBER Working Paper No.11251.
World Bank. 2006. World Development Indicators (WDI). OnlineDatabase. Washington, DC: World Bank Group.
