technology commercialization strategy dynamics and ... · pdf file1 technology...
TRANSCRIPT

1
Technology Commercialization Strategy Dynamics and Entrepreneurial Performance:
Evidence from the Speech Recognition Industry*
Matt Marx MIT Sloan School of Management
100 Main Street
E62-478 Cambridge, MA 02142
David H. Hsu The Wharton School
University of Pennsylvania 2028 Steinberg-Dietrich Hall
Philadelphia, PA 19104 [email protected]
October 2013
Abstract: We empirically evaluate the importance of a “temporary integration” commercialization
strategy wherein firms transiently compete in the product market in order to establish the value of their
technology and then “pivot” to a cooperative licensing model. In contrast, extant work focuses on the
innovator’s initial commercialization decision, neglecting the possibility of (or the reasons for) a dynamic
process. Evidence from a unique longitudinal dataset comprising all entrants into the world-wide
automatic speech recognition (ASR) industry from 1952-2010 shows that firms facing greater uncertainty
regarding the value of their technology are more like to undertake a temporary integration strategy and to
benefit from doing so. Our findings introduce a dynamic view to the technology commercialization
strategy literature and suggest a novel mechanism by which industry entrants gain credibility.
Keywords: Technology commercialization strategy; entrepreneurial performance; dynamics.
* We thank Ronnie Chatterji, Jason Davis, Chuck Eesley, April Franco, Joshua Gans, Thomas Hellmann, Ramana
Nanda, Henry Sauermann, Scott Stern, and Ezra Zuckerman, as well as audience members at Georgia Tech,
Wharton, the University of Chicago, Carnegie Mellon, London Business School, the Atlanta Competitive Advantage
Conference, INFORMS, the HBS-MIT Strategy Conference, the Duke Strategy Conference, and the BYU-Utah
Winter Strategy Conference for helpful comments. We acknowledge funding from the Wharton Entrepreneurship
and Family Business Research Centre at CERT and the MIT Sloan Roberts E-Center Fund. We thank Greg Hum,
Jacalyn Martelli, Lydia Volaitis, and Tianyu Wang for research assistance and are especially indebted to Walt
Tetschner of ASRNews and Bill Meisel of TMA Associates for help obtaining archival materials.

2
1. Introduction
Entrepreneurs seeking to commercialize their technical innovations often rely on partnerships, such as
technology licenses or strategic alliances, with other organizations. They do so to complement the
organizational skills or assets the new enterprise may not possess. An important obstacle to a cooperative
commercialization strategy, however, is convincing the partner of the value of the firm’s technical
invention. We empirically explore a two-stage commercialization strategy in which the entrant
temporarily forward-integrates into the product market in order to establish the value of the technology.
Ultimately, the entrant switches or “pivots” to its preferred strategy of cooperating with incumbents in
order to improve performance.
Consider the case of Qualcomm’s code-division multiple access (CDMA) technology for handling
cellular communications. CDMA took the controversial approach of handling multiple calls on the same
frequency and managing the interference as opposed to using a separate frequency for each call as in
TDMA (time-division multiple access). Although CDMA promised to be more efficient than TDMA,
there were many skeptics including a Stanford University professor who declared that the frequency-
sharing approach would “violate the laws of physics” (Brodsky 2008:199) and accused Qualcomm of
faking its first demonstration. Qualcomm temporarily abandoned licensing and forward-integrated into
manufacturing both base stations and handsets in order to prove the value of CDMA technology. It
retained these complementary businesses for several years before selling the former to Ericsson and the
latter to Kyocera. In personal communication, Qualcomm co-founder Andrew Viterbi (2012) recounted:
“[F]or this large and complex opportunity it was essential to produce the infrastructure
as well as the handsets…it was necessary to convince the carriers that CDMA was indeed
a workable technology which had a major advantage over alternates: GSM, U.S. and
Japanese TDMA standards. All of this took a lot of effort, several successful
demonstrations, some luck and about three or four years; there were many skeptics.”
Qualcomm’s decision to temporarily integrate into the product market and subsequently pivot to the
preferred licensing model serves as an example of how firms can demonstrate the value of their
technology to would-be partners by temporarily integrating into the product market. This “temporary
integration” technology commercialization strategy (TCS) extends extant frameworks linking the
environmental, organizational, and competitive factors to an entrant’s initial choice of TCS (Teece, 1986;
Gans and Stern, 2003). Such work characterizes TCS as a one-time, static decision to cooperate with
incumbents via licensing or to compete against them in the product market. Perhaps one reason
commercialization strategy has not been explored dynamically is the difficulty of obtaining longitudinal
data regarding TCS adoption and evolution. We introduce a hand-collected dataset tracking all entrants
into the automatic speech recognition (ASR) industry from its inception in 1952 through the end of 2010.

3
ASR is an attractive industry for TCS analysis because its commercialization environment does not
predetermine commercialization strategy. The data allow us to follow technology commercialization
strategies on an annual basis, including when firms change or pivot from their initial TCS. We then link
these to a variety of organizational performance outcomes.
Our analysis reveals that in the ASR industry, entrants are more likely to adopt a temporary integration
strategy when they face greater uncertainty regarding the value of their technology. Furthermore,
adopting a temporary integration strategy is associated with a variety of intermediate and ultimate
organizational performance outcomes. We evaluate the importance of three possible alternative
explanations for these empirical patterns: 1) a trial-and-error TCS experimentation process, 2) changing
industry structure, and 3) unobserved technical- and/or enterprise-level quality. In each case, we find the
empirical patterns either inconsistent with the alternative explanation or that the importance of a
temporary integration TCS is not overturned in the presence of the alternative.
Our results extend work on entrepreneurial technology commercialization strategy in three main ways.
First, we identify a novel mechanism—temporary integration into the product market—for mitigating
uncertainty about the value of the technology while eventually achieving their preferred TCS. Second, we
introduce a dynamic view of TCS that has not been empirically considered in the literature. Third, we
believe this paper to be the first that ties commercialization choices to organizational outcomes (both
intermediate and ultimate). We also contribute to the literature on the early formation of strategy and the
tradeoff between flexibility and stability, which has previously been examined either in success-biased
samples (including case studies) or in the dynamic-capabilities literature for the case of established firms
adapting to business environmental change.
2. Related literature and prior empirical work
At least since Teece (1986), scholars have sought to identify factors shaping the TCS decision.
Technology appropriability and availability of complementary assets have been identified as factors
favoring a strategy of cooperating with incumbents (e.g., via licensing) over integrating to enter the
product market for a competitive strategy (Gans, Hsu, and Stern 2002; Arora and Ceccagnoli 2006). The
rationale is that engaging in any negotiations for technology transfer, including agreeing on a price,
requires the entrepreneur to disclose details of its innovation. Doing so may expose the entrepreneur to an
expropriation threat, which may be curtailed with patent protection. Without such protection, the
entrepreneur may instead decide to enter the product market. In addition, if the necessary complementary

4
assets for commercialization are available to the entrepreneur at relatively low cost, product market entry
is more likely (and less likely if such assets are specialized and costly to access).
Furthermore, according to the prevailing TCS literature the choice of commercialization strategy is
viewed as static. Even when scholars have attempted to incorporate future considerations into the
commercialization decision (Gans, 2012), these are nonetheless factored into a model where the TCS is
not altered or reconsidered once made. Wakeman (2012) addresses the notion that firms might want to
change TCS in the future and consequently adopt a mixed-mode strategy to enable learning toward that
eventuality; however TCS changes are unobserved.
If industry-level or firm-specific factors make it difficult for an entrant to adopt its preferred TCS in the
short run, it may nonetheless achieve the ideal in the long run by crafting a dynamic, two-stage
commercialization strategy where the firm initially adopts one commercialization strategy and later pivots
to another when it is more able. One such factor is the ease or difficulty of establishing the commercial
value of a technological innovation. Consider the scenario outlined by Arora and Ceccagnoli (2006)
where the entrant’s innovation is appropriable but specialized complementary assets are necessary for
commercialization. Here, cooperating with incumbents (i.e., via licensing) is the dominant strategy as the
innovator would prefer to avoid expensive, inconvenient investments that might require additional
financial and human capital. At the same time, cooperation is attractive from the perspective of fostering
specialization, reducing duplicative investments, and enabling gains from trade.
Of course, for incumbents to want to in-license a technology, they must believe it holds commercial
value. Assessing this value may be trivial, as in the case of verifying the capacity claims for a disk drive
or instructions-per-second processing capability of a semiconductor chip. But in many settings, the value
of the technology may be less straightforward to establish. It may be the case that parties disagree on
performance metrics, or that such metrics are difficult to construct given the nature of the innovation. In
these and other situations, the inability to establish the value of the technology presents a clear obstacle
for innovators wishing to cooperate with incumbents: “it may be difficult to induce suppliers to make
costly irreversible commitments which depend for their success on the success of the
innovation…tak[ing] risks along with the innovator” (Teece, 1986:294). Thus entrants may find
themselves unable to execute a cooperative TCS even though it would seem the most efficient way for the
firm to organize.
Formal models have explored remedies to the contracting problem introduced by asymmetric information
regarding the value of a technology (Gallini and Wright, 1990), such as a contingent contract with a small
up-front fee and follow-on royalty payments. Such models contemplate a monopolist inventor whereas in

5
many industry settings multiple innovators may have proprietary approaches to the same technical
problem. In such a scenario, it can be impractical for a would-be licensee to sign contracts with several
entrants given innovation-specific integration costs. Even in the case of a monopolist innovator, to the
extent that existing complementary assets need to be cospecialized, it may be difficult to motivate such
investments by incumbents when the commercial value of an innovation is in question. Returning to the
Qualcomm example, their response to the uncertainty surrounding the feasibility of CDMA was not one
of contingent contracting, as even the most favorable contract would have been unlikely to motivate
existing manufacturers of cellular handsets and base stations to build versions compatible with the
unproven CDMA standard.1
We thus concur with Arora and Gambardella that extant work “neglect[s] the importance of uncertainty
about the commercial value of technology” (2010:776) and the potential for resulting licensing market
failure. Although Gans and Stern acknowledge that the inability of a potential licensee to assess the value
a new technology is an obstruction to licensing, they “abstract away from adverse selection or
renegotiation at the bargaining stage” (2000: 489). Similarly, they note that for an ideas-market to operate
efficiently, “the value offered by the technology must be clearly signaled and demonstrated” (Gans and
Stern, 2003: 342) but do not consider potential remedies for the innovator who wishes to license but
cannot easily demonstrate value. Another example is found in Fosfuri’s (2006) empirical examination of
licensing by large chemical firms, where the differentiation of the technology is found to be a key driver
of TCS choice but the process of signaling the differentiation is unexplored.
If contracting is difficult given uncertainty regarding the commercial value of the innovation, the entrant
might abandon cooperation altogether and instead compete in the product market. Integration obviates
contracting difficulties entirely (e.g., Grossman and Hart, 1986); moreover, it may be easier to evaluate
and appreciate the value of an integrated product than a raw technology, as was the case with Qualcomm.
However, in a scenario where licensing would be preferable (but for the uncertainty problem), such an
outcome is second-best. More attractive would be to use product-market integration to mitigate
uncertainty regarding the value of the technology while not permanently abandoning the licensing model.
Arora, Fosfuri, and Gambardella allude to this possibility in a footnote: “…[s]ometimes self-production is
a necessary condition for successful licensing. For instance, self-production could help assess the true
value of the technology or could help identify potential bottlenecks in technology transfer. However,
when there exists a well-functioning market for technology these problems are likely to be less relevant.”
1 A firm in such a situation might possibly offer to subsidize the incumbent’s customization costs, but even in this
extreme case the incumbent must still commit staff and managerial attention, which it may be reluctant to do.

6
(2001:430, italics ours). We build directly on this idea, noting that uncertainty about the value of an
innovation introduces frictions into the market for technologies. In such settings, product-market
integration may indeed be a precondition for licensing. Rather than attempt to contract initially or
abandon contracting permanently, the innovator temporarily integrates into the product market in order to
prove the value of the technology. The innovator later pivots from the initial strategy of competing back
to its preferred strategy of cooperating with incumbents.
Note that temporary product-market entry is different from simply waiting to persuade others over time
(Yildiz, 2004) as it involves an active effort on the part of the firm to accelerate the resolution of
technological uncertainty. Entering the product market is generally seen as a response to contracting
breakdown in the TCS literature; however, doing so is often viewed as unattractive given the supposedly
“sunk” costs of forward integration (Gans and Stern, 2000). In a dynamic view, however, the costs of
product-market integration are not fully sunk but may be at least partially recovered by divesting the less-
attractive assets originally necessary to enter the product market, such as when Qualcomm sold off its
handset and base-station manufacturing operations.
Moreover, the pivot from competing in the product market to cooperating with incumbents should be
attractive in the framework of Arora and Fosfuri (2003). They define the revenue effect as the incremental
income from out-licensing technologies and the profit dissipation effect as the accompanying decrement
given the increased competition from enabling a new competitor in the product market. If the revenue
effect outweighs the profit dissipation effect and licensing is the preferred commercialization strategy,
pivoting to licensing from integrating into the product market should naturally be attractive. (While the
firm may cede some revenue by de-emphasizing the product market, it is unlikely to pivot unless the
revenue from licensing is attractive by comparison.) Because the firm was previously in the product
market, its licensees need not necessarily introduce new competitors into the market but may well include
its former competitors, ameliorating the profit-dissipation effect. Thus we expect that in industries
characterized by uncertainty regarding the commercial value of innovations, firms that initially enter the
product market but later pivot to a cooperative licensing strategy will outperform.
However, we do expect heterogeneity among firms facing technological uncertainty in adopting a
dynamic strategy of pivoting from product-market competition to cooperating with incumbents. Entrants
enjoying high status or credibility may believe it possible to trade on their reputation in order to avoid
temporary integration. Others may be discouraged by the costs of (even temporarily) integrating into the
product market. Some may not even consider the possibility of a dynamic commercialization strategy.

7
Further, we do not claim that temporary integration will be a winning strategy (even for a subset of
entrants) in every setting; rather, at least two conditions must hold. First, the cost of integrating into the
product market cannot be prohibitively high for a new entrant. In the biopharmaceutical industry, for
example, conducting clinical trials may require such expenditure that a startup can hardly hope to forward
integrate. Second, competing in the product market must not require so much disclosure that it would be
difficult to license later on. Thus technologies that are easily reverse-engineered when embodied in
products are not suitable candidates for temporary integration.
If our extension to the TCS framework holds, then we anticipate the following two empirical patterns in
industries where the commercial value of innovation is unclear and investments in complementary assets
are potentially recoverable. First, entrants facing greater uncertainty regarding the commercial value of
their innovation will be the most likely to adopt a temporary integration strategy in which a firm first
integrates into the product market and then subsequently pivots to contracting with incumbents. Second,
we expect firms pivoting from competing to cooperating to improve organizational efficiency and overall
performance, while firms pivoting from cooperating to competing will not enjoy the same benefits.
3. Data
For our study we use a new, hand-collected dataset of the automatic speech recognition (ASR) industry
from its inception in 1952 through the end of 2010. ASR technology converts spoken language into text
by modeling the sound waves generated by the human vocal tract. It is a science-based industry whose
technology was incubated for many years in corporate and university research labs before coming to
market. The earliest recorded ASR research effort was in 1952, when scientists at AT&T Bell
Laboratories built a machine that could recognize the digits zero through nine when spoken in isolation.
Similar projects sprang up shortly thereafter at nearby RCA Laboratories and Lincoln Laboratories in the
U.S., as well as internationally at London’s University College, Kyoto University, and NEC. The early
1960s brought the entry of Texas Instruments and the founding of IBM’s T.J. Watson Research Center,
which invested in ASR. The industry’s first company dedicated exclusively to ASR was Threshold
Technology, spun out of RCA Labs. Threshold’s early success is said to have strongly influenced the
Department of Defense Advanced Research Projects Agency (DARPA) decision to initiate public funding
of basic ASR research. Since then, ASR has been used for myriad applications including radiology
dictation, plush toys that respond to voice, remote access to personal computers, 411 directory assistance
automation, personal telephone assistants, and podcast transcription.

8
ASR is an attractive industry for this study for at least two reasons. First, it represents a
commercialization environment where cooperating with incumbents does not strongly dominate
competing in the product market or vice versa. Technology is strongly excludable, with ASR firms having
filed more than 3,000 patents. While complementary assets are often needed to bring innovations to
market, including custom application development, many ASR entrants integrated into those assets
Qualcomm-style in order to compete in the product market. This stands in contrast to other industries,
such as automotive or biotechnology, where complementary assets such as clinical trials are so expensive
and difficult for a startup to undertake that new entrants can hardly hope to “go it alone” (Baum,
Calabrese, and Silverman, 2000). And because speech recognition algorithms are coded in software, there
is little risk that the algorithms can be expropriated when included as part of an end-user product.
Second, ASR is an industry where considerable uncertainty surrounds the value of new innovations. At
first glance this might seem surprising, as the performance of a algorithm ought to be testable and
verifiable. Indeed, many ASR companies have published performance claims for many years. As early as
September 1981 Interstate Electronics Corporation claimed 85% accuracy for its speech recognition
technology. One month later, competitor Weitek claimed 90% accuracy and the month after that, IBM
claimed 91% accuracy. By February of the following year, Votan claimed 99% accuracy, matched that
summer by Interstate Electronics and soon after by Verbex, NEC America, Dragon Systems, Kurzweil,
Integrated Wave, General Instrument, and others. Such claims made it difficult for potential licensees to
discriminate among technology suppliers, as reflected by the National Bureau of Standards’ observation
regarding “the present untenable situation of nearly all vendors claiming 99% accuracy” (Creitz, 1982).
The National Research Council echoed these concerns, lamenting that “there are no established/uniform
procedures for the design, comparison, and evaluation of speech recognition” (Creitz, 1984).
DARPA attempted to bring some rigor to the evaluation process by instituting annual “bakeoffs” for its
ASR research grant recipients, tying funding to performance in the evaluation. In order to execute the
evaluation, DARPA collected thousands of recordings of hundreds of different speakers making requests
in a specific domain (air-travel reservations). Recordings were kept secret so that participants could not,
so to speak, “train to the test.” While such bakeoffs might appear to be a solution to the difficulty of
establishing performance, most participants in the DARPA evaluations were universities. The authors are
unaware of any large-scale evaluations conducted on commercially-available ASR technology, probably
because few potential licensees would have had the sophistication to construct a large test corpus. Thus
ASR is a useful industry in which to observe firms given heterogeneous technological uncertainty.

9
Temporary integration should be an advantageous commercialization strategy given the uncertainty
surrounding innovations in the ASR industry. Moreover, the value of temporary integration should be
increasing in the level of technological uncertainty. While it might seem difficult to identify heterogeneity
regarding the perceived uncertainty of commercialization value, we exploit the fact that many ASR firms
pioneered potentially “disruptive” technologies (Christensen & Bower, 1996). Such innovations may not
perform as well on traditional metrics—such as in the ASR industry, recognition accuracy—and thus may
be less attractive to potential licensing partners who regard their value as suspect.2 Four such innovations
are listed below:
1) Speaker adaptation. Rather than requiring users to train the system to recognize their voice, some
systems began to automatically adapt to the speaker in hopes of improving accuracy without
requiring manual enrollment. As an example, although the original version of Dragon Dictate
required the user to spend 10-20 minutes reading long passages before first use, more recent
versions offer the option to skip the training session and have the system adapt to the user’s voice
over time. While it is certainly more convenient to skip the enrollment process, higher accuracy is
achieved by training to a specific voice. Thus ASR systems using speaker adaptation may have
lower accuracy than those requiring training.
2) Software-only. ASR involves intensive audio signal processing, so early systems generally
required algorithms to be downloaded as firmware to specialized DSP chips or standalone
processing units. For example, Speech Systems Inc.’s MEDTRANS radiology dictation system
tethered dedicated hardware to a Sun Sparcstation, which provided the user interface. While the
move to software promised both cost reduction and convenience as dedicated hardware was
eliminated, these came at the expense of performance tradeoffs in vocabulary size and (likely)
accuracy. Consequently, many firms were reluctant to abandon hardware acceleration.
3) Wordspotting. Speech recognizers generally operate by attempting to decode all words spoken by
the user, as is necessary in a dictation program. For some applications, however, it is less
important to understand everything the user said and more important to capture a few key
commands. As an example, automated telephone call routing systems by AT&T were designed to
pick out the words “operator” and “collect call” while ignoring whatever else the user happened
to say. Wordspotting promised to be advantageous for a niche set of applications, but the so-
2 As argued above, the accuracy of the ASR technology used by a given firm cannot be reliably determined.
However, the trade journals routinely identify the “vocabulary size” or maximum number of words that can possibly
be recognized. Unreported analysis shows that the firms introducing disruptive ASR technologies offered smaller
vocabularies, net of a host of controls including entry year, organizational heritage, and patents.

10
called “garbage models” required to filter out unwanted speech could be unreliable. Moreover,
only a small number of keywords could generally be handled by such systems.
4) Phonetic output. The typical output of an ASR system was a list of words supposedly spoken by
the user. Internally, however, the system decoded a stream of audio into sub-syllabic units known
as phonemes and then stochastically matched these to the most likely sequence of words. A recent
innovation was to output not words but the phonemes themselves. The purpose of phonetic output
was to facilitate more flexible searching of large corpora, such as detecting frustrated customer-
service calls or topic spotting of news broadcast or military intelligence intercepts. Because
phoneme output represents the “raw” internals of the recognizer, not taking advantage of bigram
and trigram syntax modeling, it can be more error-prone than traditional systems.
The data for our study comprise nearly sixty years since the inception of the ASR industry. The original
archives consist of approximately 15,000 pages of several monthly trade journals variously spanning the
years 1981 through 2010, as well as a historical account of the industry from its inception in 1952 (Juang
& Rabiner, 2004).3 While it is possible that some firms have been omitted from the newsletters or
historical documents, even obscure companies were covered in detail. These trade journals offer the
ability to characterize entrepreneurs’ backgrounds and choices “as it happened” from third-party accounts
rather than relying on retrospective reconstruction of events. Moreover, they offer detail regarding the
strategy formulation process that is unavailable from business registers or other traditional data sources.
The first author, along with research assistants, coded the monthly trade journals by hand, reading each
article individually. We noted in each article the ASR firms mentioned, and coded them as “active” in that
month. A firm was counted as having entered the industry as of its first mention in the trade journals. A
firm was coded as having left the industry when a trade journal article noted that it either ceased
operations in the ASR industry or was acquired by another company. For firms that were never noted to
have left the industry, we checked current corporate websites to ensure that they were still operating in the
ASR industry as of December 2010. For the few that were not, we attempted to determine their date of
exit from public sources; when such information was not otherwise available, we backdated their exit date
to their final mention in the trade journals. Patterns of entry and exit are depicted in Figure 1.
Figure 1 about here
3 Few firms were active in the 1970s and earlier, and results are robust to omitting pre-1981 data.
11
3.1 Variables
In addition to dates of operation, we collected data regarding organizational heritage as well as strategic
choices. Organizational data included whether the company was a de alio or de novo entrant, and is
motivated by the literature suggesting that organizational heritage implies different beginning knowledge,
even if firms are founded at the same time (e.g., Helfat and Lieberman, 2002). For de novo startups, we
recorded whether any of the founders had previously worked at another ASR firm (these firms are coded
as spinoff firms, following the convention in the literature). For most firms, the trade journals contained
information allowing us to code these organizational heritage variables; where such information was not
available, we consulted public sources including company websites to determine the founders’ prior work
experience. In a small number of cases where these sources proved uninformative, we contacted founders
to ask whether they had had prior experience in the ASR industry. We were able to characterize the
heritage of all but 35 de novo firms (results are similar whether we exclude these unclassifiable de novo
firms, assume that they were spinoffs, or assume that they were not). We also noted whether the de novo
companies were sponsored by their parent firms, either in part or as wholly-owned subsidiaries (classified
as de alio). We also recorded funding, leadership transitions, and patents. Financing sources included
venture capital (cross-checked with VentureXpert), government, banks, other firms, or the public markets
(i.e., IPOs). To round out the organizational variables, CEO transitions were noted, and data on granted
patents were merged based on application date.
Technology Commercialization Strategies (TCS)
Perhaps most unique to our study, we coded commercialization strategies undertaken by the firm. The
adoption of a particular TCS was coded as having taken place the month it was reported in the trade
journal. Firms that competed directly for end customers by offering products or services were classified as
having adopted a “compete” strategy. For example, Dragon Systems sold software enabling consumers to
dictate onto their personal computers. Tellme Networks offered an advertising-supported 1-800 number
for retrieving sports scores, stock quotes, etc. on its voice platform. Firms were categorized as adopting a
“compete” strategy if, using information from the trade journals, they sold end-user products, built
custom solutions, or provided an advertising-supported service. By contrast, ASR firms that licensed
technology or development tools were classified as having a “cooperate” strategy. As examples, BBN
licensed its ASR technology and VoiceObjects supplied toolkits that companies used to build end-user
12
applications.4 If both compete and cooperate strategies were mentioned at entry, the firm was coded as
having started with them simultaneously as a “mixed mode” (Teece, 1986).
A “pivot” was coded as such only if an initial TCS was noted in the newsletters, followed by a subsequent
mention of a different TCS. The variable pivoted was set to 1 for a given firm-year observation if the firm
had previously pivoted from its initial TCS, and 0 otherwise. Sub-categorizations of this variable were
also noted for firms pivoting from cooperate to compete and vice versa. As an example of a pivot from
cooperate to compete, Nuance Communications initially embarked on a cooperative commercialization
strategy involving technology licensing and the sale of development toolkits. But a December 2002 trade
journal article described Nuance’s pivot to a competitive TCS: “Nuance has in the past emphasized sales
through partners…contribut[ing] 82% of Q3 revenues. Nuance will develop and sell pre-packaged
applications directly, and has formed an applications group to develop the applications. Nuance will sell
directly to end-user customers” (Meisel 2002, emphasis ours).
As an example of pivoting from compete to cooperate—i.e., temporary integration—Vlingo Corporation
began by integrating its speech recognition technology into a downloadable application for smartphones,
only later entering into OEM licensing agreements with device manufacturers. Michael Phillips, co-
founder of Vlingo, recalled his firm’s reasons for a temporary integration strategy: “The great thing about
going direct to consumers is that you can iterate and control your own destiny, but it is still hard to get to
scale [without] a huge existing brand or spending tons of money on customer acquisition. Having the
consumer product greatly strengthened our ability to get the OEM deals – prove the technology works,
and to be the safe choice for the OEMs because they know that consumers will like it. Even if you are
losing money on the direct to consumer [product] that is OK because you will make it up on the OEM
[licensing deals]. We cut back on the consumer effort – the pressure meant we needed to divert the
resources.” (Phillips, 2013).
Pioneering possibly-disruptive technologies
Our theory proposes temporary integration as a means to mitigate uncertainty regarding the commercial
value of a technology. As described above, we exploit the pioneering of potentially-disruptive ASR
4 We depart from the extant literature in that we do not classify firms that were acquired as having adopted a
“cooperative” TCS. At least in the ASR industry, an acquisition was typically viewed as an attractive liquidity event
and favorable organizational outcome as opposed to a strategic tactic—a view we believe is common to many
entrepreneurs. Moreover, of the ASR firms that were eventually acquired, more of them adopted a “compete”
strategy as defined above as opposed to a “cooperate” strategy. More generally, Aggarwal and Hsu (2009) note that
different organizational processes are associated with different forms of entrant cooperative strategies.

13
technologies as a measure of increased uncertainty regarding commercialization value. As described
above, these are 1) speaker adaptation, 2) software-only, 3) wordspotting, and 4) phonetic output
(introduced in 1982, 1990, 1992, and 2008 respectively). We flag a firm as a “pioneer” if it uses any of
these technologies within a few years of its initial introduction into the market. We reason that such
technologies, which typically deliver poorer performance along existing dimensions, will be perceived as
having particularly uncertain commercialization value when they are first introduced. For example, Intel
introduced speaker adaptation in November 1983 with its Speech Transaction 2.0 system. Intel and other
firms adopting speaker adaptation by November 1986 are marked as pioneers. However, our already
pioneered variable is time-varying, set to 0 before the firm adopts the technology and 1 thereafter. (In
robustness checks, we also introduce a version of this variable that is set to 1 only in the year of the
adoption and then decays over a five-year period, taking on values of 1 divided by the number of years
since the firm’s adoption of the technology.)
Firm performance
For our firm-performance analysis, the primary outcome variables were coded from measures of failure
and liquidity events. Ceasing operations in the ASR industry was coded as having failed, whether the firm
was shut down entirely or continued operations in a different industry. Following an exit, no further
observations were recorded as the firm disappeared from the trade journals. Completing an IPO was
coded as an attractive liquidity event, and observations were censored thereafter even if the firm
continued to appear in the trade journals.
We also measure acquisitions as ultimate outcomes, though acquisitions can be noisy indicators. A
company (or its assets) may be purchased at a “fire sale” price resulting in little or no financial gain for
shareholders. Following Arora and Nandkumar (2011), we classify an acquisition as attractive if it meets
the following criteria. First, for venture capital-backed ventures, the acquisition price must exceed the
invested capital. Second, for non-VC-backed ventures (or VC-backed ventures where the acquisition price
was not available), either evidence from press releases and news stories that the founder or CEO of the
focal firm joined the acquirer or an upward sales and/or headcount growth trend must exist. We
implemented these criteria by retrieving acquisition values from SDC, Zephyr, and other public sources,
by reviewing press materials associated with the acquisition and by assessing headcount and sales trends
using data from Dun & Bradstreet (Walls, 2010). Using this method to determine whether sales and
headcount grew or shrank in the year prior to the acquisition, approximately one-quarter of acquisitions
were classified as unattractive. These firms were re-coded as having failed.

14
Interim outcome variables are derived from Dun & Bradstreet data, which we obtained for U.S. firms
after 1989. ASR firm names were matched manually for relevant establishments, with a success rate of
91.8%. D&B records annual sales as well as headcount, both of which we use in raw form. We then
computed annually the percentage growth in headcount and sales, with a 99% Winsorized growth
percentage (one order of magnitude, or 10x growth). We then computed sales per employee as a crude
proxy for organizational efficiency. Finally, we use D&B’s PAYDEX measure as an indicator of financial
health. PAYDEX is a score from 1-100 indicating the firm’s payment performance, 100 being best
(paying ahead of schedule) and lower figures corresponding to being weeks or months behind schedule.5
A total of 651 firms are observed in the trade journals. The vast majority of these are single-product firms
which developed one key innovation and then commercialized it (often continuing to refine the
innovation over time). This industry context is thus sharply different than studies of the licensing
practices of large chemical firms, for example, which may develop many innovations and decide how to
commercialize each one. That most ASR firms have a single innovation enables us to track not only the
initial TCS decision but how that evolves over time. Note that we drop from our sample a dozen firms
which had more than one innovation, lest the varying commercialization strategies of these products be
interpreted as “pivoting” on the part of the firm.6 We also drop 15 professional services firms that did not
enter the industry with an innovation.
3.2 Summary statistics and trends
Descriptive statistics and correlations for the remaining 624 ASR firms are in Table 1, Panel A. Although
the trade journals were issued monthly, we collapsed observations to the firm-year level for analysis.
(Analysis using firm-month observations yields consistent results.) Dun & Bradstreet data is available for
398 of the 624 firms and only since 1990, reducing the number of observations in models utilizing D&B-
based variables. Panel B presents firm-level variables broken down by entrant type. Approximately 17%
of firms have an ASR-related patent, though this figure is higher for spinoffs; moreover, de alio firms
have more patents on average. One-quarter of entrants raised venture capital, understandably less for de
alio firms and considerably higher (40%) for spinoffs. The CEO was replaced in one-tenth of firms, about
5 Dun & Bradstreet reports a PAYDEX score only when it has enough information to do so, so this variable is not
present for every observation where sales and headcount data are available. 6 An alternative approach would be to analyze TCS at the product level, but doing so would preclude the ability to
analyze ultimate outcomes because liquidity and failure events are firm-level, not product-level, constructs.
Moreover, it is difficult to obtain product-level sales and staffing data (at least in the ASR industry, though we
suspect this is true generally and helps to explain why prior literature has generally not tied TCS to performance).

15
half that for de alio entrants and twice that for de novo. De alio entrants are substantially larger than either
spinoff or non-spinoff de novo entrants in terms of both sales and headcount.
Four percent of firms either pioneered or were early adopters of one of the four ASR enhancements
described above; the corresponding time-varying variable is nonzero for 6.7% of observations. We note
that no ASR firm pioneered more than one of these potentially disruptive technologies, which should not
be surprising given that such innovations underperform on traditional metrics such as accuracy and
vocabulary size. However, several firms eventually adopted multiple of these innovations. For example,
Voice Control Systems pioneered wordspotting but did not adopt a software-only approach until some
years after its introduction.
Table 1 about here
Panel B of Table 1 also shows the distribution of cooperative versus competitive TCS among various
types of entrants. 40% of entrants started with a cooperative TCS, 58% with a competitive TCS, and 2%
with a mixed-mode strategy from the outset. This relatively even split between the two types of
commercialization strategy reinforces our claim that ASR firms are not subject to the sort of
environmental pressures that strongly direct the choice of commercialization strategy as in other
industries such as biotechnology. Moreover, a similar balance is observable among each entrant type.
4. Analysis
We first present a set of empirical analyses suggesting that temporary integration (TI) is more likely when
there is more technical uncertainty. We then examine performance outcomes associated with TI. We do
this in the context of both ultimate failure versus liquidity experienced by the enterprise on the one hand
(across-firm variation in outcomes), and normalized firm sales and credit scores (within-firm variation
over time) on the other. We then consider three classes of alternative explanations that might be
consistent with the empirical patterns: (1) trial-and-error experimentation, (2) industry evolution, and (3)
unobserved technology or enterprise level quality. We present additional analyses and conclude that these
alternatives do not overturn the importance of temporary integration as a strategy, especially for entrants
finding it difficult to license because proving the value of the technology is not straightforward.

16
4.1 Correlates of pivoting and temporary integration
Panel B of Table 1 indicates that approximately 8% of ASR firms pivoted TCS at some point.7 We begin
our analysis by considering the correlates of pivoting. Given our longitudinal, right-censored data, we use
a Cox failure model in which observations are firm-years and standard errors are clustered by firm (results
are robust to firm-month level analyses). Columns 1-3 of Table 3 analyze the full sample. We find that
pivoting is more common among later entrants and, as seen in the univariate statistics, among spinoffs.
Firms starting with a Compete TCS appear less likely to pivot, though this correlation softens somewhat
once accounting for sales growth and technology pioneering in columns 2 and 3. Replacement of the CEO
is more strongly associated with pivoting, as is patenting. Having pioneered a potentially disruptive
technology is not associated with pivoting in the full sample.
Table 2 about here
Decomposing the sample in the remaining columns of Table 2 helps to clarify the mechanisms underlying
pivoting. First, it is not simply the case that patenting firms pivot more; rather, that the association
between patenting and pivoting is strong only for the subset of firms that began with a Compete TCS, as
one would expect from the literature (Gans, Hsu, and Stern, 2008). Second, and more central to the
paper, the already pioneered variable continues to play no role in the subset of firms starting with a
Cooperate TCS (column 4) but achieves statistical significance among firms beginning with a Compete
TCS (column 5). Exponentiating this coefficient indicates that firms starting with a Compete TCS are
5.5x more likely to pivot from Compete to Cooperate once they have pioneered a potentially disruptive
ASR technology. This finding is consistent with our expectation that firms will be most eager to adopt a
temporary integration strategy when facing greater uncertainty regarding commercial value.
In column 6, we implement a robustness check in which the pioneering variable is defined as 1 only in the
year of adoption and then decays in magnitude over five years as described above. This model yields even
stronger statistical and economic significance for the coefficient on the pioneering variable. Unreported
models with a pioneering variable that decays over 4, 3, or 2 years yield similar results, as does a
pioneering variable set to 1 only in the year when the firm introduced or adopted the novel ASR
enhancement.
Temporary integration as a means of mitigating commercial uncertainty supposes that it is something of
an inconvenient detour through the product market in order to reach the desired mode of licensing. If this
7 As a point of comparison, Kaplan, et al. (2009) report that 7.5% of firms that completed an IPO in 2004 changed
their lines of business between initial business plan and IPO prospectus. Of course, theirs is a sample of successful
firms across many industries whereas ours is the full population of a single industry.

17
is so, then we might expect firms undertaking TI to be better matched with a cooperative TCS than with
competing in the product market. We consider this possibility by generating a “compete mismatch” score
for each ASR entrant, as follows. In unreported regressions available from the authors, we estimate a logit
on the likelihood of initially adopting a compete TCS using the same covariates as in Table 2. We then
predict the corresponding likelihood for each entrant adopting a compete TCS given its organizational
characteristics as well as commercialization environment. This statistic is subtracted from one to yield a
“compete mismatch” score. Table 3 shows the compete mismatch for various types of entrants, with the
values in the third column calculated by taking the average mismatch for each entrant type.
Table 3 about here
Panel A of Table 3 compares three types of entrants: firms that temporarily integrated by starting with
compete and then pivoting to cooperate (TI); firms that always had a compete TCS; and firms that started
with a cooperate TCS (whether they eventually pivoted or not). The first row shows that firms
undertaking temporary integration are less well matched to a compete strategy (0.459) than those in the
second row who start with and maintain a compete strategy (0.365), with the difference in means
significant at the 5% level (p<0.022). This suggests that firms undertaking temporary integration are
better suited to a cooperate TCS and may have undertaken an initial compete strategy reluctantly, as a
means to an end. Moreover, we can detect no statistically significant difference in compete mismatch
between TI firms and those who started with a cooperate TCS (.513, p<0.331). Again, this suggests that
firms engaging in temporary integration may have entered the product market, as Qualcomm did, as a
means to an end state of a cooperative TCS.
The same is however not true of firms pivoting from cooperate to compete. Panel B of Table 3 shows that
the compete mismatch for firms pivoting from cooperate to compete (0.609) is higher, not lower, than
firms that started and stayed with cooperate (0.499). Thus firms pivoting from cooperate to compete
appear to have diverged from their preferred TCS, possibly due to the difficulties of licensing in the ASR
industry without first having to compete in the product market. Moreover, firms pivoting from cooperate
to compete differ substantially in their degree of compete mismatch from firms that always had a compete
TCS (0.368), in strong contrast to Panel A. We conclude that pivoting converges on the preferred TCS
only for firms engaging in temporary integration.

18
4.2 Temporary integration and ultimate outcomes
We next consider performance outcomes in Table 4. Given that we have two absorbing states—failure
and liquidity—the simple survival model of Table 2 is insufficient. We instead estimate a discrete-time
competing hazard model (Martin & Mitchell, 1998; Boyd et al., 2005; Arora & Nandkumar, 2011)
implemented with a multinomial logit where the base state is continuing as a private firm.8 As in those
prior studies, we adopt a nested specification in which survival is first decided with some probability, and
conditional on survival, ratios of failures and liquidity are modeled.
Table 4 presents discrete-time hazard regressions for ultimate outcomes, starting with control variables
alone in column 1. The hazard of failure is lower later in the sample, though firms entering later have a
higher hazard of failure. Having the CEO replaced in past year is positively associated with failure,
though the opposite is true of having raised venture capital (though raising VC is only weakly correlated
with liquidity in this sample). Spinoffs are less likely to fail, while de alio entrants are less likely to
achieve liquidity.
In column 2 we add an indicator for firms that had already pivoted as of the observation year. As
anticipated by the univariate analysis, pivoting is associated with attractive liquidity events. If pivoting
were primarily reflective of a trial-and-error learning process as depicted in the practitioner literature, we
would expect this association to hold across both directions of pivoting: cooperate->compete and
compete->cooperate. However, in column 3 it is evident that the association is limited to the directional
pivot from Compete to Cooperate, which corresponds to a temporary integration strategy. The coefficient
on pivoted compete->cooperate is statistically significant at the 5% level, indicating that ASR firms
engaging in temporary integration were 2.7x as likely to achieve an attractive liquidity event. We note no
statistical significance on the pivoting coefficient for the failure outcome; this is important because one
might be concerned that pivoting is merely an artifact of firms surviving longer.
Table 4 about here
The remaining columns in Table 4 reinforce the role of temporary integration in mitigating
commercialization uncertainty. Columns 4 and 5 split the analysis according to whether the observation
was of a firm that had previously pioneered a novel ASR enhancement. The coefficient on pivoted
compete->cooperate for liquidity is statistically significant only among pioneering firms in column 4,
8 We acknowledge that our discrete outcomes are roughly ordered, but we are not aware of any competing-hazard
model for the ordered case.

19
consistent with our findings regarding the correlates of temporary integration. This result reinforces the
notion that a temporary integration strategy is at once more frequent and also more beneficial to firms
facing greater uncertainty regarding the commercial value of their innovations.
4.3 Within-firm analysis of interim performance
To further explore the performance implications of a temporary integration TCS strategy, we analyze two
additional performance variables, sales per employee (using fixed effects OLS regressions) and Dun &
Bradstreet’s PAYDEX (using conditional fixed effects negative binomial specifications), in Table 5. Here
we exploit within-firm temporal variation in TCS among firms that pivot, so the sample is confined to
firms changing TCS in either direction. The key independent variable is pivoted compete->cooperate, and
this coefficient should be interpreted relative to the omitted category, pivoting from cooperate to compete.
The results suggest that temporary integration is positively related to both performance outcome
measures. The implied economic effect in column 2 suggests that a pivot from compete to cooperate is
associated with a 43% boost in sales per employee. Our theory posited that firms having temporarily
integrated into the product market for purposes of mitigating commercialization uncertainty would pivot
to cooperation, in some cases divesting complementary assets. Returning to the case of Qualcomm, the
firm’s profitability jumped sharply once it was able to sell its handset and base-station manufacturing
businesses and focus instead on licensing CDMA. This indicates that firms utilizing a temporary
integration strategy should increase profitability or organizational efficiency more generally following the
pivot to cooperation. Unreported regressions indicate that the advantage of TI is not obtained for either
sales or headcount alone, only for sales per employee.
Table 5 about here
Columns 3 and 4 use the Dun & Bradstreet PAYDEX score as the dependent variable. Although not
strictly a measure of profitability, PAYDEX is nonetheless informative regarding organizational
performance, as it is a score ranging from 0-100 that indicates how promptly a firm pays its bills (100 is
best). PAYDEX is calculated at multiple points during the year, so we use the minimum PAYDEX score
for the year as an indicator of how much the firm struggled to pay its bills. In column 4, the positive and
significant coefficient on pivoted compete->cooperate shows that firms engaging in temporary integration
improved their PAYDEX score when compared with entrants who pivoted from cooperate to compete.

20
4.4 Alternative explanations
In the previous sections we presented evidence suggesting that the outperformance of ASR firms pivoting
from compete to cooperate is explained by temporary integration into the product market for purposes of
establishing the commercial value of an innovation, thereafter switching to the preferred licensing model.
Like any strategic decision, pivoting commercialization strategies is generally endogenous, and so
establishing the causal direction of temporary integration and performance is difficult. We have a more
modest aspiration in presenting correlations in our analyses. This section therefore assesses the
importance of three alternative explanations for the empirical correlations outside of the temporary
integration mechanism.
4.4.1 Learning and experimentation
A first set of alternatives centers on trial-and-error experimentation of TCS and/or unanticipated shocks in
the business environment inducing a mismatch in initial TCS. While the first mechanism suggests that the
entrepreneurial team learns about an optimal TCS over time via experimentation, the second process
emphasizes changing conditions that may make an initial TCS, which might have been initially optimal,
no longer ideal. However, these alternatives share the empirical implication that TCS pivots, regardless of
the directionality, should be performance-enhancing. Assessing whether the apparent benefits of
temporary integration can be explained as a learning process is key given existing studies of how
“technology entrepreneurs often ‘iterate’ towards a position which fits their overall environment” (Gans
& Stern, 2003: 346). Multiple case studies (Murray and Tripsas 2004; Gavetti and Rivkin 2007) suggest
that pivoting from one’s original strategy is not uncommon—in fact, Bhide (2000) finds that one-third of
the Inc. 500 changed from their original strategy.
Table 6 about here
Again, column 3 of Table 4 showed that pivoting was not associated with liquidity events in all cases but
only for the directional competecooperate pivot. This alternative mechanism also predicts that pivots
are more likely when sales performance lags, as a leading reason for trial and error based pivoting would
be dissatisfaction with status quo performance. Similarly, if the business environment has changed to
make an initial TCS less compelling, this would likely be reflected in sales levels and/or sales growth. But
Table 3 shows that across specifications, neither annual sales nor past-year sales growth are related to
pivot likelihood. Another piece of possible evidence for the learning hypothesis might be the replacement
of the CEO, which could be indicative of poor performance. Table 3, columns 1 and 2 shows that CEO

21
replacement in the past year is predictive of overall pivoting in the full sample. However, decomposing
the sample in columns 3 and 4 by the initial TCS shows that this antecedent only applies to pivoting from
cooperate to compete. The coefficient on CEO replaced in past year in column 4 is negative and lacks
statistical significance, indicating no association between CEO replacement and compete->cooperate
pivoting. The learning hypothesis may be relevant to cooperate->compete pivoting but does not appear to
be a driver of temporary integration. This could occur if, as discussed above, entrants starting with a
cooperate TCS encounter difficulty in the licensing market and eventually pivot to a compete TCS in
order to try to prove the value of their technology. This may be more difficult later on because a firm
pivoting from cooperating to competing by definition gives up licensing revenue, while the profit-
dissipation effect may not be alleviated because those competitors do not cease to exist but may license
from other technology providers. Further, because a firm pivoting from cooperation to competition now
competes with its former licensees, the move from contracting to product-market integration may
introduce significant channel conflict.
4.4.2. Industry evolution
A second class of alternative explanation is that industry level evolution could explain the empirical
patterns. This might result for general or specific reasons. The general explanation is that for reasons
including but not limited to management fads and fashions, a cooperate TCS became more popular over
time (and so we would expect to see more pivots in the compete to cooperate direction for reasons outside
of our temporary integration rationale). This might seem particularly plausible given Fosfuri’s (2006)
finding that licensing among large chemical companies is increasing in the number of technology
suppliers—a number we might expect to grow as an industry expands. Data consistent with our theory
that entrants facing commercialization uncertainty will initially forward-integrate into the product market
and only later pivot to cooperating with incumbents might alternatively be explained by an industry-
evolution process in which cooperation becomes the preferred TCS over time.
If anything, however, the data indicate a trend away from, not toward, cooperation as a dominant TCS.
Panel A of Figure 2 plots the density of ASR firms by entry mode, with overall ASR firm density for
reference. While cooperation dominates early on, this trend reverses sharply by the mid-1990s. Panel B
refines this view, restricting the graph only to new entrants; given the small number of entrants per year,
observations are grouped into five-year intervals. As in the full density plot of Panel A, Panel B shows
that a competitive TCS dominates later on among new entrants. It would thus be difficult to conclude that
pivoting from compete to cooperate can be explained by an industry trend toward a cooperative TCS.
22
Figure 2 about here
The more specific version of this alternative explanation is that technology licensing has become more
popular over time. One possible explanation for this is that the number of potential licensees has
expanded over time, but all of our models include a count of potential licensing partners (# firms
w/compete TCS). This variable has no bearing on either the hazard of pivoting (Table 3) or on ultimate
performance (Table 4).
4.4.3. Unobserved quality / technical development
A third set of alternative explanations is that unobserved technical development (eventually) well-suited
for licensing and/or unobserved or unmeasured commercial opportunity more generally may instead
explain the empirical results. Since forward patent citations have been validated as an indicator of
economic value (Trajtenberg, 1990), we substitute this indicator in our performance specifications for
simple patent counts in Column 6 of Table 4 and find that our main results are preserved. Although not
shown in order to conserve space, all other results, including the correlates of pivoting, are robust to
replacing the count of patents with the count of citations, whether all forward citations or those within a
5-year window following the patent grant. We use patent counts in our main models because that is what
potential partners would contemporaneously observe.
We also examine quality characteristics of firms that did not pivot and compare them to the subsample of
firms that did pivot (as of the year of the pivot) in Table 6. We find that total patent counts (conditional on
patenting), the likelihood of raising VC, maximum sales (median), and maximum employee headcount
(median) are all statistically indistinguishable between the two sub-samples for firms surviving beyond
their first birthday. (All prior results are robust to excluding firms not surviving beyond their first
birthday.) This suggests that ex ante quality differences before pivoting are not driving the results.
Finally, we might believe that entrants with prior knowledge such as spinoffs would possess more
industry knowledge and be more likely to possess commercial opportunity. However, as shown in Table
4, spinoff entrants are no more likely to reach liquidity than non-spinoff de novo entrants (the reference
category).

23
5. Discussion and conclusions
Using a dataset of the population of entrants into the worldwide speech recognition industry from 1952
through 2010, we find evidence consistent with an entrepreneurial temporary integration strategy in which
commercializing uncertain innovations starts with forward integration followed by a pivot to a
cooperative technology commercialization strategy. The industry context we examine is advantageous not
only because we are able to observe objective third party characterizations of technology
commercialization strategy over time, but also because the speech recognition industry operates in a
business environment in which no particular commercialization strategy is dominant and where there is
within-industry variation in the uncertainty surrounding the commercial value of innovations.
The temporary integration strategy differs from prior assessments of pivoting as a generally-beneficial
trial and error process of experimentation by which naïve entrants learn about the industry and the best
match with their capabilities (Bhide, 2000; Murray and Tripsas, 2004; Gavetti and Rivkin, 2007). Only
firms that pivot from competition to cooperation have a higher hazard of liquidity events and achieve
higher sales per employee. By comparison, pivoting from cooperation to competition does not appear
advantageous and is more often undertaken by firms appearing to struggle.
These findings will generalize most directly to settings in which commercialization value is not easily
established and also where investments in complementary assets can be at least partially recovered (i.e.,
are not fully “sunk” or irreversible). The former condition results from the difficulty nascent
entrepreneurs typically have in validating the commercial value of their innovation to would-be partners,
while the latter condition suggests limits on the financial viability of temporary forward integration. We
note also the possibility of additional motivations beyond commercialization uncertainty for a temporary
integration strategy. Even if the value of a technology is easily discernable, a nascent startup may fear
being lured into unattractive contractual arrangements with established players given their limited
bargaining power and instead opt for “self-production” in the language of Arora, Fosfui, and Gambardella
(2001) in order to give the startup an opportunity to develop an externally recognizable brand. Even
absent such concerns, it may simply be difficult to attract the attention of potential partners without first
having established a reputation in the market. Moreover, such conditions may hold outside of technical
fields. For instance, unknown authors lacking access to publishing houses may reluctantly fund the self-
publishing of their first novel in hopes of gaining popular acclaim they can leverage into future
partnerships.
We must also note that pivoting is an endogenous decision, so we do not deliver a causal result; instead
our main goal has been to show the association between commercial uncertainty and entrepreneurial use

24
of the temporary integration commercialization strategy and between such a strategy and organizational
performance. The ideal experiment for a causal interpretation of the performance regressions would
involve random assignment of initial strategies followed by random perturbation of the initial strategy—a
setup we fail to find in the ASR industry and which we believe will be difficult to find in most any
industry context. Further, there may be additional motivations for temporarily integrating into the product
market, including the desire to build a brand in order to avoid becoming commoditized as a less visible
component in the technology stack, which we do not observe. Nonetheless, as an initial large-sample
empirical foray into the dynamics of commercialization strategy, we believe the paper makes several
contributions.
Our study contributes to the literature on technology commercialization in four ways. First, while extant
TCS literature takes a static, one-time view of the commercialization process, we show in a non-success-
biased population of a single industry that firms do “pivot” from their initial TCS and that the decision to
do so can be impactful under certain conditions. We hope that future work in this domain will incorporate
the possibility of firms revising their original commercialization strategy.
Second, our paper is the first we know to measure firm outcomes as related to TCS choices. Prior studies
have examined the determinants of cooperative versus competitive behavior among innovators, but no
work has ascertained whether such choices are advantageous to the firm. One reason for this gap may be
the preponderance of studies focused on the commercialization of individual innovations within large
firms, as product-level financials are hard to obtain. By focusing on single-product firms, we connect TCS
to both intermediate financial performance and ultimate organizational outcomes.
Third, we offer a novel resolution to the problem introduced by uncertainty regarding the commercial
value of an innovation, particularly for new ventures that typically do not have established reputations.
Firms can forward integrate into the product market where it can demonstrate the value of its technology
as embodied in an end-user product. Then, once having established credibility, it can pivot from
competition to cooperation, engaging formerly-reluctant licensees.
Fourth, our study offers an illustration of how industry-level patterns of integration and de-integration can
play out at the firm level. Langlois (1988) was perhaps the first to identify that firms within an industry
may become more or less likely to vertically integrate (including forward-integrating into the product
market) based on the maturity and modularization of technology within the industry. Baldwin and Clark
(2000) offer the microcomputer industry as an example of how technological refinement and
standardization enables a greater degree of specialization by firms. Jacobides (2005) observes similar
industry-wide trends in mortgage banking. Our paper suggests that similar processes can play out at the
25
firm level, with individual firms de-integrating (i.e., pivoting to licensing) once they have proven the
value of their technology in the product market.
These results reinforce some of the conclusions of the practice-oriented literature while also sharpening
them. For example, in the lean startup methodology (Ries, 2011), startups are instructed to build a
minimum viable product, introduce it to customers, and run experiments on various customer groups. The
goal of entrepreneurs in this method is to shorten the learning feedback loop to guide startup actions to
persevere or pivot. While we study a specific type of startup commercialization strategy pivot, our results
suggest that only a particular form of pivoting is performance enhancing. Merely following the process of
pivoting may not lead to superior organizational outcomes; rather our results stratified by entrant type
suggest that organizational knowledge may be important in sensing when to pivot and having the
resources to do so successfully.
26
REFERENCES
V. Aggarwal and D. Hsu (2009). “Modes of Cooperative R&D Commercialization by Start-ups.”
Strategic Management Journal 30: 835-864.
A. Arora and A. Gambardella (2010). “Ideas for rent: an overview of markets for technology.” Industrial
and Corporate Change 19(3): 775-803.
A. Arora and M. Ceccagnoli (2006). “Profiting from licensing: The role of patent protection and
commercialization capabilities.” Management Science 52(2): 293-308.
A. Arora and A. Fosfuri (2003). “Licensing the market for technology.” Journal of Economic Behavior &
Organization 52(2): 277-295.
A. Arora, A. Fosfuri, and A. Gambardella (2001). “Markets for Technology and their Implications for
Corporate Strategy.” Industrial and Corporate Change 10(2): 419-451.
A. Arora and A. Gambardella (2010). “Ideas for rent: an overview of markets for technology.” Industrial
and Corporate Change 19(3): 775-803.
A. Arora and A. Nandkumar (2011). “Cash-out or Flameout! Opportunity Cost and Entrepreneurial
Strategy.” Management Science, 57(10): 1844-1860.
C. Baldwin and K. Clark (2000). Design Rules: The Power of Modularity. Cambridge, MA: MIT Press.
J. Baum, T. Calabrese, B. Silverman. (2000). “Don't Go it Alone: Alliance Network Composition and
Startups' Performance in Canadian Biotechnology.” Strategic Management Journal, 21(3): 267-294.
A. Bhide (2000). The Origin and Evolution of New Businesses, Oxford University Press.
I. Brodsky (2008). The History of Wireless: How Creative Minds Produced Technology for the Masses,
Telescope Books: St. Louis, MO.
C. Christensen and J. Bower. (1996). “Customer Power, Strategic Investment, and the Failure of Leading
Firms.” Strategic Management Journal 17(3):197-218.
W. Creitz. (1982). Monthly news briefs, Voice News, May 1982.
W. Creitz. (1984). Monthly news briefs, Voice News, September 1984.
A. Fosfuri (2006). “The Licensing Dilemma: Understanding the Determinants of the Rate of Technology
Licensing.” Strategic Management Journal 27: 1141-1158.
N. Gallini and B. Wright (1990). “Technology transfer under asymmetric information.” The RAND
Journal of Economics 21(1): 147-160.
J. Gans (2012). “Negotiating for the Market,” Working Paper, University of Toronto.
J. Gans, D. Hsu, and S. Stern (2002). “When does start-up innovation spur the gale of creative
destruction?” RAND Journal of Economics 33(4): 571-586.

27
J. Gans and S. Stern (2003). “The product market and the market for ‘ideas’: commercialization strategies
for technology entrepreneurs.” Research Policy 32: 333-350.
G. Gavetti and J. Rivkin (2007). “On the Origin of Strategy: Action and Cognition over Time.”
Organization Science 18(3): 420-439.
S. Grossman and O. Hart (1986). “The Costs and Benefits of Ownership: A Theory of Vertical and
Lateral Integration.” The Journal of Political Economy 94(4): 691-719.
C. Helfat and M. Lieberman (2002). “The birth of capabilities: market entry and the importance of pre-
history” Industrial and Corporate Change 11(4): 725-760.
B. Juang and L. Rabiner, Eds. (2004). Automatic Speech Recognition – A Brief History of the Technology
Development. Encyclopedia of Language and Linguistics, Elsevier.
M. Jacobides (2005). “Industry Change Through Vertical Disintegration: How and Why Markets
Emerged in Mortgage Banking.” Academy of Management Journal 48(3): 465-498.
R. Langlois (1988). “Economic Change and the Boundaries of the Firm.” Journal of Institutional and
Theoretical Economics 144: 635-657.
X. Martin and W. Mitchell (1998). “The Influence of Local Search and Performance Heuristics on New
Design Introduction in a New Product Market.” Research Policy 26(7): 753–771.
W. Meisel (2002). “Nuance to shift strategy and depend less on partners.” Speech Recognition Update
114:23.
F. Murray and M. Tripsas (2004). "The Exploratory Processes of Entrepreneurial Firms: The Role of
Purposeful Experimentation." Advances in Strategic Management 21: 45-75.
M. Phillips (2013). Personal communication with M. Marx, April 2013.
E. Ries (2011). The Lean Startup: How Today's Entrepreneurs Use Continuous Innovation to Create
Radically Successful Businesses. New York City: Crown Business.
D. Teece (1986). “Profiting from Technological Innovation: Implications for Integration, Collaboration,
Licensing, and Public Policy.” Research Policy 15: 285-305.
M. Trajtenberg (1990). “A penny for your quotes: patent citations and the value of innovations.” The
RAND Journal of Economics 21(1): 172-187.
A. Viterbi. (2012). Personal communication with M. Marx, December 2012.
S. Wakeman (2010). “Profiting from Technological Capabilities: Technology Commercialization Strategy
in a Dynamic Context.” ESMT – Berlin Working Paper.
Walls & Associates, 2010 National Establishment Time-Series (NETS) Database©, October 2011.
M. Yildiz (2004). “Waiting to Persuade.” The Quarterly Journal of Economics 119(1): 223-248.

28
Table 1: Descriptive statistics and correlations
Panel A: Firm-year observations for ASR firms
Panel B: Firm-level observations, segmented by entrant type
Variable # firms# obs Mean stdev Min Max 1) 2) 3) 4) 5) 6) 7) 8) 9) 10) 11) 12) 13) 14) 15) 16)
1) year of observation 624 4478 1999.3 9.18 1952 2010 1.00
2) year of entry 624 4478 1992.9 11.59 1952 2010 0.48 1.00
3) de alio 624 4478 0.61 0.49 0 1.00 -0.19 -0.26 1.00
4) spinoff 624 4478 0.12 0.32 0 1 0.09 0.10 -0.51 1.00
5) # of firms w/compete TCS 624 4478 121.19 74.20 0 214 0.98 0.48 -0.19 0.09 1.00
6) already raised VC 624 4478 0.33 0.47 0 1 0.01 0.06 -0.24 0.13 0.02 1.00
7) patents to date (L) 624 4478 0.54 1.13 0 5.79 -0.05 -0.38 0.09 -0.11 -0.05 -0.16 1.00
8) CEO replaced in past year 624 4478 0.04 0.19 0 1 -0.02 -0.01 -0.16 0.08 -0.01 0.10 0.04 1.00
9) sales (L) 398 2774 14.95 2.25 8 23.9 -0.17 -0.45 0.39 -0.21 -0.17 -0.21 0.47 -0.07 1.00
10) past-year sales growth 398 2774 0.16 1.36 -10.0 10.00 -0.01 0.06 -0.02 0.01 0.00 0.04 -0.03 0.04 0.06 1.00
11) sales per employee (L) 398 2774 11.48 0.86 3.51 15.20 -0.04 -0.10 0.18 -0.09 -0.06 -0.13 0.10 -0.06 0.51 0.09 1.00
12) Dun & Bradstreet PAYDEX 300 1933 63.91 14.00 2 83 0.11 0.06 -0.06 -0.01 0.09 -0.03 0.07 -0.01 -0.01 0.02 0.04 1.00
13) initial TCS: compete 624 4478 0.50 0.50 0 1 0.27 0.46 -0.13 0.11 0.28 0.05 -0.29 -0.03 -0.25 0.04 -0.08 -0.01 1.00
14) initial TCS: compete+cooperate 624 4478 0.02 0.13 0 1 0.06 0.10 -0.05 -0.03 0.06 -0.01 0.01 0.06 -0.05 0.02 -0.07 0.02 -0.17 1.00
15) already pivoted 624 4478 0.08 0.26 0 1 0.11 -0.26 -0.04 0.07 0.12 -0.04 0.36 0.10 0.23 -0.01 -0.06 -0.07 -0.22 -0.06 1.00
16) already pioneered 624 4478 0.067 0.249 0 1 -0.15 -0.32 0.08 -0.03 -0.16 -0.14 0.05 0.02 0.13 -0.01 0.06 0.00 -0.12 -0.05 0.01 1.00
all ASR firms de alio spinoff non-spinoff denovo
624 366 62 196
100% 58.7% 9.9% 31.4%
year of entry 1997.1 1995.8 1999.0 1999.0
any patents? 0.17 0.17 0.23 0.17
total # of patents 3.25 4.80 1.52 0.89
ever raised VC? 0.25 0.20 0.40 0.31
CEO ever changed? 0.10 0.04 0.19 0.18
initial TCS: compete 0.58 0.56 0.61 0.59
initial TCS: compete+cooperate 0.02 0.01 0.03 0.04
ever pivoted TCS 0.08 0.07 0.18 0.07
technology pioneer 0.04 0.05 0.03 0.03
ultimate outcomes
firm eventually failed 0.42 0.38 0.49 0.47
firm remained a going concern 0.44 0.53 0.20 0.36
firm achieved attractive liquidity event 0.14 0.09 0.31 0.17
for firms w/D&B data 398 236 45 117
maximum annual sales 97,800,000 162,000,000 4,035,546 4,803,003
maximum headcount 391.2 633.0 35.6 38.1
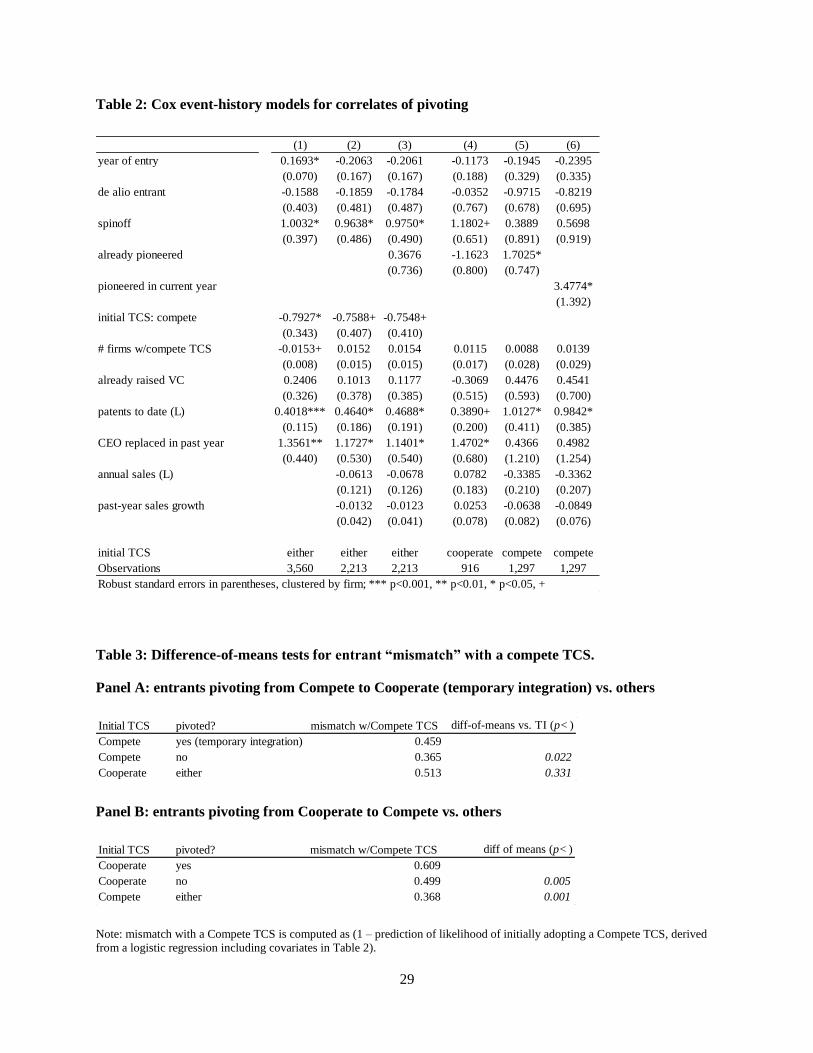
29
Table 2: Cox event-history models for correlates of pivoting
Table 3: Difference-of-means tests for entrant “mismatch” with a compete TCS.
Panel A: entrants pivoting from Compete to Cooperate (temporary integration) vs. others
Panel B: entrants pivoting from Cooperate to Compete vs. others
Note: mismatch with a Compete TCS is computed as (1 – prediction of likelihood of initially adopting a Compete TCS, derived
from a logistic regression including covariates in Table 2).
(1) (2) (3) (4) (5) (6)
year of entry 0.1693* -0.2063 -0.2061 -0.1173 -0.1945 -0.2395
(0.070) (0.167) (0.167) (0.188) (0.329) (0.335)
de alio entrant -0.1588 -0.1859 -0.1784 -0.0352 -0.9715 -0.8219
(0.403) (0.481) (0.487) (0.767) (0.678) (0.695)
spinoff 1.0032* 0.9638* 0.9750* 1.1802+ 0.3889 0.5698
(0.397) (0.486) (0.490) (0.651) (0.891) (0.919)
already pioneered 0.3676 -1.1623 1.7025*
(0.736) (0.800) (0.747)
pioneered in current year 3.4774*
(1.392)
initial TCS: compete -0.7927* -0.7588+ -0.7548+
(0.343) (0.407) (0.410)
# firms w/compete TCS -0.0153+ 0.0152 0.0154 0.0115 0.0088 0.0139
(0.008) (0.015) (0.015) (0.017) (0.028) (0.029)
already raised VC 0.2406 0.1013 0.1177 -0.3069 0.4476 0.4541
(0.326) (0.378) (0.385) (0.515) (0.593) (0.700)
patents to date (L) 0.4018*** 0.4640* 0.4688* 0.3890+ 1.0127* 0.9842*
(0.115) (0.186) (0.191) (0.200) (0.411) (0.385)
CEO replaced in past year 1.3561** 1.1727* 1.1401* 1.4702* 0.4366 0.4982
(0.440) (0.530) (0.540) (0.680) (1.210) (1.254)
annual sales (L) -0.0613 -0.0678 0.0782 -0.3385 -0.3362
(0.121) (0.126) (0.183) (0.210) (0.207)
past-year sales growth -0.0132 -0.0123 0.0253 -0.0638 -0.0849
(0.042) (0.041) (0.078) (0.082) (0.076)
initial TCS either either either cooperate compete compete
Observations 3,560 2,213 2,213 916 1,297 1,297
Robust standard errors in parentheses, clustered by firm; *** p<0.001, ** p<0.01, * p<0.05, + p<0.1
Initial TCS pivoted? mismatch w/Compete TCS diff-of-means vs. TI (p< )
Compete yes (temporary integration) 0.459
Compete no 0.365 0.022
Cooperate either 0.513 0.331
Initial TCS pivoted? mismatch w/Compete TCS diff of means (p< )
Cooperate yes 0.609
Cooperate no 0.499 0.005
Compete either 0.368 0.001
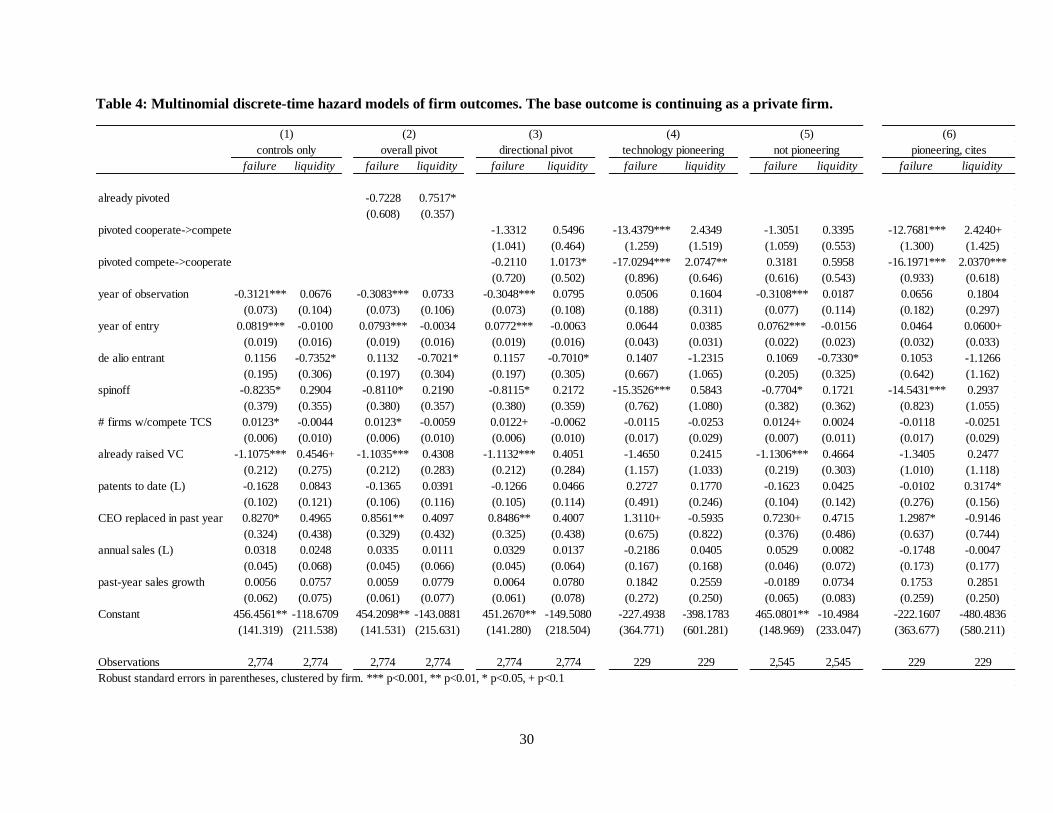
30
Table 4: Multinomial discrete-time hazard models of firm outcomes. The base outcome is continuing as a private firm.
failure liquidity failure liquidity failure liquidity failure liquidity failure liquidity failure liquidity
already pivoted -0.7228 0.7517*
(0.608) (0.357)
pivoted cooperate->compete -1.3312 0.5496 -13.4379*** 2.4349 -1.3051 0.3395 -12.7681*** 2.4240+
(1.041) (0.464) (1.259) (1.519) (1.059) (0.553) (1.300) (1.425)
pivoted compete->cooperate -0.2110 1.0173* -17.0294*** 2.0747** 0.3181 0.5958 -16.1971*** 2.0370***
(0.720) (0.502) (0.896) (0.646) (0.616) (0.543) (0.933) (0.618)
year of observation -0.3121*** 0.0676 -0.3083*** 0.0733 -0.3048*** 0.0795 0.0506 0.1604 -0.3108*** 0.0187 0.0656 0.1804
(0.073) (0.104) (0.073) (0.106) (0.073) (0.108) (0.188) (0.311) (0.077) (0.114) (0.182) (0.297)
year of entry 0.0819*** -0.0100 0.0793*** -0.0034 0.0772*** -0.0063 0.0644 0.0385 0.0762*** -0.0156 0.0464 0.0600+
(0.019) (0.016) (0.019) (0.016) (0.019) (0.016) (0.043) (0.031) (0.022) (0.023) (0.032) (0.033)
de alio entrant 0.1156 -0.7352* 0.1132 -0.7021* 0.1157 -0.7010* 0.1407 -1.2315 0.1069 -0.7330* 0.1053 -1.1266
(0.195) (0.306) (0.197) (0.304) (0.197) (0.305) (0.667) (1.065) (0.205) (0.325) (0.642) (1.162)
spinoff -0.8235* 0.2904 -0.8110* 0.2190 -0.8115* 0.2172 -15.3526*** 0.5843 -0.7704* 0.1721 -14.5431*** 0.2937
(0.379) (0.355) (0.380) (0.357) (0.380) (0.359) (0.762) (1.080) (0.382) (0.362) (0.823) (1.055)
# firms w/compete TCS 0.0123* -0.0044 0.0123* -0.0059 0.0122+ -0.0062 -0.0115 -0.0253 0.0124+ 0.0024 -0.0118 -0.0251
(0.006) (0.010) (0.006) (0.010) (0.006) (0.010) (0.017) (0.029) (0.007) (0.011) (0.017) (0.029)
already raised VC -1.1075*** 0.4546+ -1.1035*** 0.4308 -1.1132*** 0.4051 -1.4650 0.2415 -1.1306*** 0.4664 -1.3405 0.2477
(0.212) (0.275) (0.212) (0.283) (0.212) (0.284) (1.157) (1.033) (0.219) (0.303) (1.010) (1.118)
patents to date (L) -0.1628 0.0843 -0.1365 0.0391 -0.1266 0.0466 0.2727 0.1770 -0.1623 0.0425 -0.0102 0.3174*
(0.102) (0.121) (0.106) (0.116) (0.105) (0.114) (0.491) (0.246) (0.104) (0.142) (0.276) (0.156)
CEO replaced in past year 0.8270* 0.4965 0.8561** 0.4097 0.8486** 0.4007 1.3110+ -0.5935 0.7230+ 0.4715 1.2987* -0.9146
(0.324) (0.438) (0.329) (0.432) (0.325) (0.438) (0.675) (0.822) (0.376) (0.486) (0.637) (0.744)
annual sales (L) 0.0318 0.0248 0.0335 0.0111 0.0329 0.0137 -0.2186 0.0405 0.0529 0.0082 -0.1748 -0.0047
(0.045) (0.068) (0.045) (0.066) (0.045) (0.064) (0.167) (0.168) (0.046) (0.072) (0.173) (0.177)
past-year sales growth 0.0056 0.0757 0.0059 0.0779 0.0064 0.0780 0.1842 0.2559 -0.0189 0.0734 0.1753 0.2851
(0.062) (0.075) (0.061) (0.077) (0.061) (0.078) (0.272) (0.250) (0.065) (0.083) (0.259) (0.250)
Constant 456.4561** -118.6709 454.2098** -143.0881 451.2670** -149.5080 -227.4938 -398.1783 465.0801** -10.4984 -222.1607 -480.4836
(141.319) (211.538) (141.531) (215.631) (141.280) (218.504) (364.771) (601.281) (148.969) (233.047) (363.677) (580.211)
Observations 2,774 2,774 2,774 2,774 2,774 2,774 229 229 2,545 2,545 229 229
Robust standard errors in parentheses, clustered by firm. *** p<0.001, ** p<0.01, * p<0.05, + p<0.1
(6)
pioneering, cites
(5)(1) (3)
technology pioneering
(4)
not pioneeringcontrols only overall pivot directional pivot
(2)
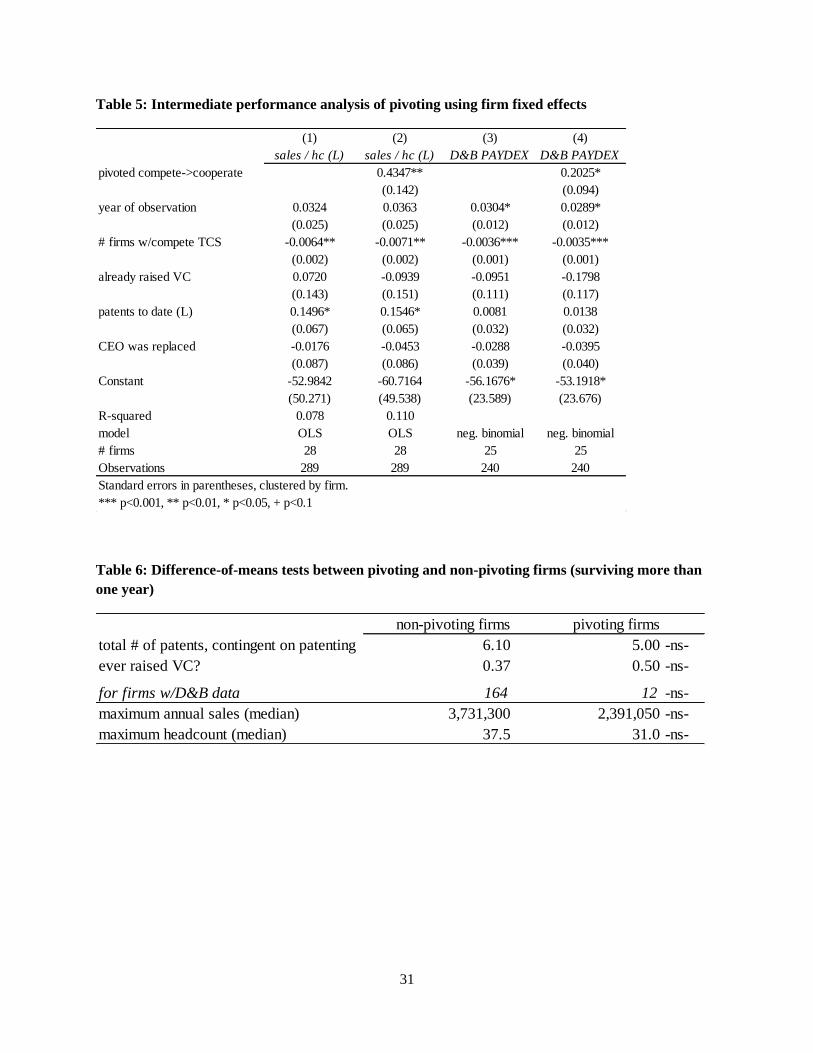
31
Table 5: Intermediate performance analysis of pivoting using firm fixed effects
Table 6: Difference-of-means tests between pivoting and non-pivoting firms (surviving more than
one year)
(1) (2) (3) (4)
sales / hc (L) sales / hc (L) D&B PAYDEX D&B PAYDEX
pivoted compete->cooperate 0.4347** 0.2025*
(0.142) (0.094)
year of observation 0.0324 0.0363 0.0304* 0.0289*
(0.025) (0.025) (0.012) (0.012)
# firms w/compete TCS -0.0064** -0.0071** -0.0036*** -0.0035***
(0.002) (0.002) (0.001) (0.001)
already raised VC 0.0720 -0.0939 -0.0951 -0.1798
(0.143) (0.151) (0.111) (0.117)
patents to date (L) 0.1496* 0.1546* 0.0081 0.0138
(0.067) (0.065) (0.032) (0.032)
CEO was replaced -0.0176 -0.0453 -0.0288 -0.0395
(0.087) (0.086) (0.039) (0.040)
Constant -52.9842 -60.7164 -56.1676* -53.1918*
(50.271) (49.538) (23.589) (23.676)
R-squared 0.078 0.110
model OLS OLS neg. binomial neg. binomial
# firms 28 28 25 25
Observations 289 289 240 240
Standard errors in parentheses, clustered by firm.
*** p<0.001, ** p<0.01, * p<0.05, + p<0.1
non-pivoting firms pivoting firms
total # of patents, contingent on patenting 6.10 5.00 -ns-
ever raised VC? 0.37 0.50 -ns-
for firms w/D&B data 164 12 -ns-
maximum annual sales (median) 3,731,300 2,391,050 -ns-
maximum headcount (median) 37.5 31.0 -ns-

32
Figure 1: ASR firm entry and exit since the inception of the industry in 1952. The connected blue
line is the overall industry density (i.e. number of active firms).
-500
50
10
0
15
0
20
0
25
0
cea
sed o
pera
tions
exited
AS
Racquir
ed
new
de n
ovo
new
de a
lioto
tal active

33
Figure 2: Commercialization strategy density (# of firms with a particular TCS)
Panel A: all firms, by year
Panel B: new entrants only, by five-year intervals
0
100
200
300
1940 1960 1980 2000 2020year
total firms firms w/cooperative TCS
firms w/competitive TCS
05
01
00
150
200
1940 1960 1980 2000period
total entrants entrants w/cooperative TCS
entrants w/competitive TCS

34
Appendix: Dataset Construction
In chronicling the history of speech recognition and its commercialization it was not possible to rely
purely on public sources such as SEC filings. Instead, we turned to a series of trade journals covering the
industry from early commercialization attempts. As these publications were sent only to subscribers, we
are deeply indebted to two individuals for making their archives available. William Meisel, president of
TMAA Associates and publisher of Speech Recognition Update, Telephone Strategy Update, and Speech
Strategy News, graciously made the complete set of his electronic archives available for all three
newsletters. Walt Tetschner, publisher of ASRNews, likewise made his electronic archives available and
also allowed us to borrow his personal, non-electronic archives of VoiceNews (William Creitz, editor),
Voice Processing Newsletter (ed. Karl Kozarsky), and Voice Technology News (ed. Mark Mikolas).
Meisel’s newsletters, along with ASRNews, focused specifically on ASR whereas the other newsletters
reported on the voice industry more generally. Related voice technologies include text-to-speech
generation (TTS), speaker verification (SV), and the digital recording and encoding technologies common
to all of these. As such, these trade journals chronicle the development of several industries including
interactive voice response systems (IVR, e.g. “for banking, press one…”), learning aids such as Speak ‘n
Spell, and even voice mail. Given the core speech-coding technology shared between all of these, several
firms participated in two or more areas. For example, InterVoice began by building IVR systems and later
added speech recognition. By contrast, Centigram started out in 1977 developing both TTS and ASR
algorithms but abandoned the latter in 1982, citing “poor market conditions.” Several ASR companies
added SV to their offerings. While an examination of several voice technologies could be enabled by
these archival sources, we have focused more narrowly on ASR alone.
We started with VoiceNews since it was the only trade journal that reached back to the beginning of the
1980s. Although VoiceNews was published through the late 1990s, it did not focus exclusively on ASR
and, more detrimentally, was unavailable to us in 1986 and 1990, with only partial availability from 1987
through 1989. We thus folded in Voice Processing Newsletter as it became available in 1984, though it
was not available in 1988 and 1992. As it was a fairly brief newsletter, we also summarized Voice
Technology News in 1989 and 1990 in order to provide more detail until we could switch to the more
specialized ASRNews in the summer of 1990 (Voice Technology News was summarized through the end
of 1990 to provide some overlap). In 1993, Speech Recognition Update commenced publication. This as
well as ASRNews continue through today and provide a nicely matched set as the editor of SRU is a
former ASR company founder and perhaps a bit of a “cheerleader” for the industry whereas the editor of
ASRNews is rather critical of the industry and leads off each issue with a column titled “The Emperor is
Naked!”. The two combined provide a balanced view of events within the industry.
Trade journal availability for each year is summarized in Figure A1. Coverage is present for every year
since 1981, and since 1984 multiple journals cover each year except for 1986 and 1992. In addition to the
trade journals described above, information on the history of ASR technology development—as opposed
to commercialization—is borrowed from “Automatic Speech Recognition – A Brief History of the
Technology Development” by B. H. Jung of the Georgia Institute of Technology and Lawrence R.
Rabiner of Rutgers University and the University of California at Santa Barbara.

35
The trade journals were coded as follows. For each (monthly) issue of each trade journal, key details from
each story were summarized, including information beyond what is used in the analyses in the present
paper. The data coded included the following fields:
Name of firm
Firm founder(s) and previous employment
Product introductions / withdrawals
Intended market for products
Price increases/reductions
Claimed accuracy, vocabulary size, speaker (in)dependence
Hiring of new CEO
Stated commercialization strategy
Acquisitions, liquidations, IPOs, industry exits
Funding events, including venture capital, government, and other sources
Lawsuits
Financial reports
Patent awards
Licensing deals
The coding task above was distributed among the first author and multiple research assistants. Each RA
was asked to code a year’s worth of newsletter data previously coded in order to calibrate accuracy.
Coded fields were then sorted by firm and date in Excel, which was exported to Stata for analysis.
Figure A1: ASR trade journal availability per year. All available issues were coded.
1981
1982
1983
1984
1985
1986
1987
1988
1989
1990
1991
1992
1993
1994
1995
1996
1997
1998
1999
2000
2001
2002
2003
2004
2005
2006
2007
2008
2009
2010
VoiceNews
Voice Processing Newsletter
Voice Technology News
ASRNews
Speech Recognition Update