technology assessment report: duty cycling controllers revisited
TRANSCRIPT

LBNL - 41754 May 1998
TECHNOLOGY ASSESSMENT REPORT: DUTY CYCLING CONTROLLERS REVISITED
Report by
Tom Webster, P.E. Center for the Built Environment
University of California Berkeley, CA
Peter Benenson
Consultant
Prepared for
U. S. Department of Energy
Federal Energy Management Program
This work was supported by the Assistant Secretary for Energy Efficiency and Renewable Energy, Federal Energy Management Program, of the U.S. Department of Energy under Contract No. DE-AC03-76SF00098.

2
TECHNOLOGY ASSESSMENT REPORT: DUTY CYCLING CONTROLLERS REVISITED
Tom Webster, P.E. and Peter Benenson
ABSTRACT This report covers an assessment of two brands of energy management controllers that are currently being offered that utilize the principle of duty cycling to purportedly save energy for unitary air conditioners and heat pumps, gas furnaces, and gas fired boilers. The results of an extensive review of past research on this subject as well as a review of vendor sponsored field testing of these controllers compares these newer controllers to those of the past. Included also is a discussion of how the duty cycling principle is prone to misinterpretation as to its potential to save energy.
3
Table of Contents 1. Introduction....................................................................................................................4
2. Summary and Conclusions ...........................................................................................4
2.1 Limitations of Application .........................................................................................5 2.2 Technology Outlook ...................................................................................................6
3. Technology Description.................................................................................................6
3.1 About the Technology ................................................................................................6 3.2 Theory & Principles of Operation .............................................................................8 3.3 Performance Claims ..................................................................................................9 3.4 Costs.........................................................................................................................10
4. Evaluation of Test results............................................................................................10
4.1 Air Conditioners and Heat Pumps...........................................................................10 4.1.1 Past studies........................................................................................................10 4.1.2 Recent tests .......................................................................................................11
4.2 Gas Furnaces ...........................................................................................................12 4.3 Boilers ......................................................................................................................12
4.3.1 Past tests............................................................................................................12 4.3.2 Recent tests .......................................................................................................12
5. Discussion and Conclusions ........................................................................................13
5.1 Performance of Duty Cycling ..................................................................................13 5.1.1 General..............................................................................................................13 5.1.2 Air conditioners and heat pumps ......................................................................15 5.1.3 Furnaces ............................................................................................................16 5.1.4 Boilers ...............................................................................................................16 5.1.5 Testing methodology ........................................................................................18 5.1.6 Manufacturers’ perspective...............................................................................18 5.1.7 Output reduction ...............................................................................................18
6. Appendix A: Testing Methodology Guidelines .........................................................20
6.1 Variable Base Degree-Day Method.........................................................................22 7. Appendix B: Vendors ..................................................................................................24
7.1 Energy Savings ........................................................................................................24 7.2 Peak Load Curtailment ............................................................................................24
Appendix C: References .................................................................................................25

4
1. Introduction The primary objective of this study is to evaluate recent offerings of products that belong to the class of energy management controllers known as “duty cyclers” or “cyclers”, and to determine if there is significant potential for this technology in Federal facilities. The impetus for this assessment were solicitation responses to the New Technology Demonstration Program (NTDP) of the Federal Energy Management Program (FEMP) from manufacturers of new versions of these controllers. Although duty cycling is still offered in various energy management system products, and utility direct load control (DLC) programs, the focus of this study is on standalone controllers suitable for retrofit to existing installations of residential and light commercial unitary heating and cooling equipment for the purpose of saving energy. This study included the following activities: 1) A products/vendors search to determine whether other products similar to the products evaluated in this assessment are available and to identify projects where these types of controllers have been rigorously tested; 2) a review of past studies of duty cycling controller technology, and 3) a review of products currently being offered in the Federal sector, including test reports submitted by the manufacturers. The following sections of this report document the findings from the activities listed above. Section 2 provides a summary of the major conclusions. Sections 3 provides a detailed description of the technology, its derivation, theory of operation, and performance improvements claimed for these controllers. Section 4 contains a discussion of the testing that has been performed with these types of controllers. Section 5 includes a discussion of the findings from all activities. Section 6 contains a list of references that may be useful for further research. Appended to this report are additional materials that summarize findings from some of the activities undertaken.
2. Summary and Conclusions There is a common thread in all of the duty cycling studies conducted to date. Independent of how duty cycling is implemented, and whether a particular implementation increases or decreases cycling rate, the technique always results in a lowered duty cycle (i.e., less on-time per cycle), and energy output of the equipment. Although more sophisticated in implementation, newer controllers accomplish basically the same result as those of the past. One of the newer controllers uses rate of change of temperature to dynamically adjust the off-period. Another calculates an off-period delay to increase total off-period of a cycle. The former method results in an increased cycling rate during an extended on-period, while the latter results in a lower cycling rate. The result, however, is the same for both; the operating duty cycle of the equipment is lowered. A review of past research studies and recent product literature and test reports about duty cycling of unitary heating and cooling equipment supports the following conclusions:

5
1. There are no significant energy savings to be derived from duty cycling technology for constant load and comfort conditions.
2. Duty cycling results in a change in operating point characterized by reduced output (which in turn produces a corresponding reduction in energy consumption).
3. Performance of new versions of these controllers does not appear to be significantly better than past versions.
The test results available to date for new versions are not adequate to verify manufacturers’ claims for energy savings at constant output so performance of these controllers is, at best, inconclusive. These conclusions and others are amplified immediately below. The body of studies conducted in the past suggest that the best that can be said for duty cycling is that it reduces output for a given load condition, and that it does not save energy or increase efficiency of the system for a given load condition. The purported savings derived from these controllers results from taking credit for the lowered output that they produce. The lowered output (for a given load) results in an increase in total on-time which counteracts the reduction in energy consumption derived from the reduced output. Whether used for energy savings or demand curtailment they all result in compromises in comfort to one degree or another; the energy and demand savings come at the expense of comfort. There is no “free lunch”. Whether the newer controllers offer benefits better than past versions remains inconclusive based on the test results to date.
2.1 Limitations of Application Although there are no significant performance benefits from duty cycling when a comparison is made at equivalent load conditions, if duty cycling is judiciously applied so that the comfort impacts are tolerable or unnoticed (e.g., hotel room or residence where occupants are gone most of the day), then both energy and demand savings can be achieved. Direct load control studies have shown that comfort can be compromised to some extent without upsetting the occupants (especially if they are being compensated for it). Accordingly, the following precautions and limitations should be born in mind when these controllers are being considered for use: Check first to see that existing controls are maintained, are adjusted correctly, and
operating properly. Apply duty cycling only after a thorough analysis has been made of the operational
and comfort needs of the prospective building occupants. Find out which times of the day or year comfort can be compromised so that it can be tolerated or go unnoticed.
Avoid assumptions about energy savings based on operation in other facilities that may or may not reflect the application in question.
Avoid making estimates of annual savings based on limited test data and testing done without metered energy input. Beware of “apples-to-oranges” performance claims that equate changes in duty cycle to efficiency improvements.
Avoid in situations where tight comfort conditions are required. Avoid use with undersized equipment; capacity will be further reduced such that the
comfort will be significantly impaired even on non-peak days.

6
Avoid high humidity cooling applications. Avoid use on older, natural draft heating equipment. Consider alternative, less expensive controls solutions.
Disregarding whether or not there are other more cost effective means to attain the same benefits that duty cycling controllers offer (e.g., much the same result can be attained by simply lowering the thermostat setpoint), it appears that these controllers are best utilized in the following situations: All situations where comfort impacts can be tolerated or are unnoticed. Large open architecture retail and offices where multiple units operate such that duty
cycling of one unit is made up by fully loading another and discomfort of one unit is made up partially by another.
Where demand charges are a significant part of energy costs.
2.2 Technology Outlook The outlook for this technology as a means of saving energy in Federal facilities is mixed for the following reasons. Testing is based on limited data so that results to date are inconclusive. Product literature does not present an adequate thermodynamic explanation about
how energy savings are derived. Past studies of similar technology concluded that duty cycling for air conditioning
and furnaces results in little or no energy savings. The limited use of this technique in the private sector as a means of saving energy
attests to its lack of endorsement by the HVAC controls industry. Current vendors for these products appear to be limited to two who market primarily to the Federal sector.
Simple time or adaptive strategies are widely accepted in utility DSM/DLC programs for their effectiveness in shifting peak demand, although no energy savings are expected.
As an energy saving technique for Federal facilities, these controllers should be used only under certain circumstances (see Limitations above) and with caution until performance can be verified.
3. Technology Description 3.1 About the Technology Duty cycling means to change or control the duty cycle (i.e., the ratio of on-period to total cycle time) of on/off controlled equipment. The duty cycling (DC) technique evolved from demand side management (DSM) and energy conservation technology developments explored in the 1970’s and 80’s where the primary goal was peak load reduction. A secondary claim was that these controllers produced a reduction in energy use by cycling equipment off for various periods of time and under certain conditions, and appears to have evolved from the notion that when equipment is off it is not using energy.
7
Duty cycling is a form of load management of which there are four basic types: 1. Load shedding - Equipment is shut down for certain periods of time on a regularly
scheduled basis when it is considered non-essential. A variation of this technique utilizes demand readings from utility meters to shut down equipment when instantaneous demand reaches certain levels.
2. Time- and temperature-based duty cycling - In time-based duty cycling, equipment is shut down periodically for fixed or variable intervals of time during its operating cycle. In a simple time-based control, the unit is not allowed to operate for a fixed interval out of a given period of time (e.g., 10 minutes off out of every 30 minutes). In temperature-based duty cycling the controller overrides the thermostat calls for heating or cooling, so for extended calls the unit is cycled according to these preset on/off parameters. More sophisticated devices monitor thermostat calls and supply and/or return temperatures and adjust the off-period based on these readings. For example, the off-period is decreased if the thermostat is not satisfied during a cycle; it is increased if the thermostat is satisfied.
3. Price based load control - This is a more recent version of direct load control where thermostat control setpoints are offset based on pricing signals sent by the utility. Using this technique the user can decide how much discomfort he is willing to tolerate based on the cost of energy at any particular time.
4. Optimal start/stop - For this technique equipment startup is delayed and/or shut down early to take advantage of thermal lags in building structures.
Type 2 is the form that is the subject of this report. This technique was studied extensively for its energy savings potential during the 1970’s and 80’s for both energy conservation and utility peak load management purposes. In fact, the use of duty cyclers for energy savings was a controversial subject that ultimately became the focus of a Federal Trade Commission (FTC) investigationa [1] about unreasonable claims made by some of the manufacturers at that time. The use of duty cycling for the purpose of reducing energy consumption subsequently fell out of favor for about a decade. Nevertheless, duty cycling continues to be used extensively for load shifting and peak demand curtailment by utilities under DSM direct load control (DLC) programs. Two controllers for which solicitations have been submitted to FEMP for evaluation under the NTDP exemplify the modern application of this technology. A search was conducted to ascertain whether other devices were available that utilize similar techniques, and to identify projects where these and/or other similar controllers have been rigorously tested. This survey included product manufacturers, research study authors, consulting engineers, contractors/distributors of HVAC controls, and manufacturers of HVAC equipment. A total of thirty three contacts were attempted and twenty three responses were received. This survey indicated that these two controllers may be the only standalone control devices currently available that employ duty cycling techniques with the express purpose of saving energy. This is in contrast to a variety of controllers (~6) that were found to be available for the purpose of load shifting/demand
a “FTC Alleges Duty Cycler Marketers are Making Fake Claims,” Air Conditioning, Heating and Refrigeration News, December 23, 1985, p. 1.
8
curtailment and the many Energy Management and Control Systems that include duty cycling as a part of their load management features. Another search was conducted to find research studies relevant to this technology. A total of 18 studies were reviewed and 11 were examined in detail (see the References listed in Appendix C for the 15 studies most relevant to this assessment). Results of these reviews are incorporated in the discussions below. One overall finding was that although both past and present controllers of this type rely on duty cycling as the primary energy management technique, many different approaches are used to implement it. The currently offered controllers are differentiated from past versions only in the manner by which the duty cycling is implemented and the types of operational precautions that are used. Another finding from this research was that in the past duty cycling controllers were more often applied to unitary air conditioners and furnaces than to boilers. For heating and cooling applications duty cyclers are applied to thermostatically controlled (as opposed to modulating equipment or built-up systems) unitary air conditioners, heat pumps, and furnaces in the general range of 2 to 40 Tons cooling, and about 500 Kbtuh heating. For boilers they are applied to sizes ranging up to 2-3 Mbtuh input. These devices are intended for retrofit, after-market application and are installed between the controlling thermostat and the equipment. A description of their theory of operation is included in the sections below.
3.2 Theory & Principles of Operation In the past a variety of methods were used to implement duty cycling on heating and cooling equipment. Typical examples were: Fixed time - A timer shuts off the equipment for a fixed interval out of a given period
after a thermostat call. Time and Temperature - Supply or return temperature is used to cut-in and cut-out the
heating and cooling equipment. The fan either continues to operate while the equipment is off or is shut down after a short delay period. In heating for example, the off-period may be adjusted based on a return air temperature reading and the burner may be shut down for the calculated off-period when the supply air temperature reaches a set value. Limits are set for the minimum off-period.
Thermostat call monitoring - The controller starts with a given off-period which is subsequently adjusted based on whether the thermostat call is satisfied or not during a cycle. For example, in cooling if the thermostat is satisfied during the off-period the off-period time would be increased; if it was not satisfied the off-period would be decreased. This technique is sometimes used in conjunction with the Time and Temperature technique.
Optimizer - The controller attempts to optimize off-period by continuously monitoring the on-period of thermostat calls during a cycle. Off-time is maximized to the extent possible while ensuring that the thermostat is satisfied.
In most cases the circulating fan is controlled by the thermostat so it would be cycled off when the thermostat was satisfied (unless set at the “on” or continuous circulation fan setting).

9
In all of these methods it is ultimately the off-period that is either fixed or adjusted in either a given reference period (typically 15 or 30 minutes), or dynamically based on temperature measurements. This results in the imposition of an equipment duty cycle that is primarily under the control of the cycler; it overrides the “natural” duty cycle of the thermostat. As discussed above, recent versions of these controllers implement duty cycling in a slightly different way than in the past. For example, one of the controllers studied (intended for air conditioners, heat pumps, and gas furnaces) cycles the equipment off when the rate of change of return air temperature has reached certain targets. The compressor or furnace gas valve is held off (while the circulating fan continues to run) until the rate of rise (or fall) of the supply temperature diminishes to set targets. By using rate of change of return air temperature, the off periods are adjusted dynamically to respond to changes in operating condition. The algorithm includes anticycle timers to ensure that compressor minimum run times are not compromised. Comfort impacts are mitigated to some extent since the supply temperature is used to limit the cycle ( ~100 F for heating, ~ 68 F for cooling) so that stored energy is not completely discharged to the point that cool (or warm) air is delivered to the space. Monitoring the return temperature also ensures that room temperature does not drift too low or too high during the off-period. The thermostat calls are monitored to be sure that the thermostat is satisfied at some point. If it is not, activation is canceled for the next cycle.
Another controller studied is intended for use on gas and oil fired boilers. This appears to represent a new focus for the application of this technology. In this case the controller is installed between the boiler aquastat and the burner controls, thus interrupting the normal cycling control of the aquastat. A temperature sensor is strapped to the hot water supply pipe to monitor for low temperature conditions. The controller monitors the off-period of the aquastat calls and applies a delay to lengthen off-period of the controller. This results in a dynamic and load dependent adjustment that reduces cycling rate. Generally in the past, the concept of duty cycling implied increased cycling rate brought about by the strategies outlined above. In the case of the boiler controller described above the effect is to decrease cycling rate. This points out the fact that duty cycling effects a change or control of the duty cycle (i.e., the ratio of on-period to total cycle time) of on/off controlled equipment and that changes in the cycling rate are a consequence of how the duty cycling control is implemented. The two controllers that are the focus of this assessment, although they both use duty cycling techniques, are different from one another in how they implement duty cycling and in the rationale used to explain the energy savings; one claims better performance due to heat recovery during the off-period while the other claims better performance due to decreased cycling of a boiler.
3.3 Performance Claims Product literature and manufacturers test reports, both past and present, indicate annual savings in the range of 15% to 40% using duty cycling products. For cooling systems, it is claimed that duty cycling saves energy by interrupting the thermostatic call cycles to periodically recover or “harvest” stored energy and to deliver it to the space via the continued operation of the circulating fan. Another explanation (for cooling) suggests
10
that the overall operating COP of the system is increased by operating the system with increased cycling. Higher average coil temperatures are thought to be caused by the cycling operation which results in operation at greater overall COP. Evidence for this is suggested by the fact that humidity control is decreased and discharge temperatures are higher when the controller is operating. For furnaces, both heat recovery and lower flue gas temperatures have been posited as the reason for energy savings. For boilers, savings are purported to be derived from longer but less frequent on-periods that result from the imposed lengthened off-periods.
3.4 Costs Current listed unit prices for commercial controllers marketed as energy savers are in the range of $500 to $2200, not including installation. Duty cyclers used for peak load control are near $100. Since the performance improvement at constant load has not been proven, the cost effectiveness of commercial energy saver controllers is questionable.
4. Evaluation of Test results The literature search identified a number of studies that were performed about a decade or more ago (see References, Appendix C). To supplement these reports an attempt was made to identify more recent studies and projects where the energy saving performance of these types of controllers has been analyzed. In addition to the twenty three contacts made with vendors, engineers, manufacturers, and research scientists, seven distributor/contractors and/or project managers were contacted. These contacts were from both the public and private sector. None of these responses resulted in identification of projects where rigorous band independent (i.e., non-manufacturer sponsored) tests were conducted.
4.1 Air Conditioners and Heat Pumps
4.1.1 Past studies Of the many studies conducted on duty cycling in the past, a study performed by Mulroy [2] at the National Institute of Standards and Technology (NIST) stands out as a definitive work for air conditioners. In this study, a split system heat pump was tested in the laboratory to analyze a number of efficiency improvement techniques including off-period energy recovery. The tests included detailed measurements and efficiency calculations for each technique. The stored energy recovery techniques studied included, 1) fan delay, where stored energy is recovered at the end of a cycle by operation of the fan without the compressor, and 2) “cyclic fan”, where the fan cycles on and off with the compressor and thus recovers the stored energy from the previous cycle during the initial part of the current cycle (i.e., coil resides in a well insulated cabinet). This study directly tested the concept of stored energy recovery and its impact on efficiency without utilizing a cycler per se.
b Rigorous testing refers to controlled testing conducted in a scientific manner using temperature and energy input measurements independent of the control device and with sufficient data that statistical significance can be evaluated.
11
The results show a loss in efficiency with either of the two cycling strategies relative to full output steady state operation, but better performance for the “cyclic fan” method. This suggests that control by a normal thermostat using its cyclic fan setting (i.e., the “Auto” setting) is nearly optimal and that duty cycling during normal thermostat cycles may actually decrease performance. The problem of condensate re-evaporation using fan delay or continuous fan operation were mentioned as a significant problem. This problem is further explored in a paper by Khattar [3].
4.1.2 Recent tests Recent tests consist of manufacturer-sponsored field tests; no independent or laboratory tests could be found. Testing on air conditioners and heat pumps with current controllers is exemplified by tests that were conducted on 2 Ton heat pump units in military housing at three locations in California. For all tests the thermostat fan was set to Auto (i.e., although the thermostat was set to cycle the circulating fan on and off with the compressor, this function is overridden by the duty cycling controller). The tests were conducted using the controller’s internal automated test procedure. This procedure measures run time of equipment operation which are in turn used to calculate savings. Test reports consisted of data entry sheets with recordings of operating hours recorded from the stored timing measurements. Tests were conducted for 28 days alternating between activated and deactivated periods (14 days total each). Although no dates appear on the test data sheets, it appears that these tests (for both heating and cooling) were conducted in January and February of 1995. Savings, as computed from internal stored readings, comparing activated vs. deactivated periods, ranged from 15% to 30% (see the discussion in Section 5 with respect to savings calculations). These results were then extrapolated to annual performance using NOAA degree days data. Degree days were converted to operating hours which were in turn used with the test results to extrapolate savings to the whole year. This was done by computing savings per hour from the tests and multiplying by hours per year. Some concerns about this testing are:
1. Extrapolation of short term data - Tests for both heating and cooling were conducted
during just 28 days in January and February, and the results were extrapolated to annual performance. The performance of this control technique cannot be uniform over the whole year. There should be greater savings during high load portions of the year and minimal savings during low loads. During low loads the thermostat cycling rate would be too low for the strategy to be useful (see discussion below).
2. The reference call time shown in the reports is the number of hours that the
thermostat is calling for heating or cooling during the deactivated period. In all of the tests the call times for both activated and deactivated periods are virtually the same. It is unclear as to why these call times are the same since total energy delivered during an activated period is less than during a deactivated period due to the effect of the duty cycling. If the load was the same then the deactivated call times should be shorter (i.e., for the same load condition the thermostat should be calling longer if the delivered energy is less). This suggests that the load conditions were not equivalent. It also points out why detailed data or energy input and load needs to be provided so
12
that load and energy input can be correlated for both activated and deactivated periods.
3. Lack of detailed data - No room temperatures, room humidity or outside temperatures
were recorded and energy input was not measured directly. Without detailed data about the performance, load conditions encountered, impact on space temperature and humidity during the tests, and without enough data samples to allow even rudimentary statistical analysis, the results cannot be considered conclusive.
4.2 Gas Furnaces Wise and Kweller [4] performed a thorough study in NIST laboratories on the effect of duty cycling on gas furnaces. This was part of an effort to determine the need for standards in this area. In this study a 75,000 btuh input gas furnace with atmospheric burner, electric ignition and draft diverter was tested in the laboratory. Accurate measurements were made to determine the changes in energy use over typical cycles with and without temperature-based or time-based cyclers. The conclusion was that for substantial portions of the heating season the cyclers would be ineffective in being able to interrupt the cycle of the furnace. In addition, for constant load (i.e., the thermostat setting is constant and load does not vary) the energy delivery cycle was simply longer using duty cycling. This is consistent with thermodynamic principles in that if the load is the same and the average delivery rate is less then the time period of delivery must be longer. Wise and Kweller concluded that there are virtually no savings associated with this strategy when a comparison is made at the same load condition. Based on these results NIST decided that a standards development effort was not justified.
4.3 Boilers
4.3.1 Past tests As mentioned above, no past studies were found where boilers were operated with duty cyclers. However, a number of studies [4, 5, 6] have documented the effect of part load operation and cycling rate on the performance of boilers. A study performed by Garbern and Kelly [7] included testing over a range of cycling rates for each part load condition. This research was conducted in NIST laboratories on a 300 Kbtuh input gas fired, cast iron hydronic boiler. This study corroborated other studies (see also Bonne [6]) in showing a strong correlation between part load efficiency and load, but the results also show only minimal (i.e., 1-2%) increase in efficiency due to lowered cycling rates from 25 cph to 1 cph at any load condition.
4.3.2 Recent tests As is the case for air conditioning, recent tests for boilers consist of manufacturer-sponsored field tests; no independent or laboratory tests could be found. One example is a series of tests conducted in selected post office buildings. Various tests were

13
performed ranging from cycle-by-cycle to multiple-day “flop/flop” c tests. Average overall savings reported were in the range of 20%. This savings percentage was used along with past fuel usage bills to estimate annual savings for other similar buildings in a post office region. In these tests the changes in the duty cycle as measured by the controller before and after activation were claimed as the savings. (This is not an appropriate measure of savings; see the discussion in Section 5 for arguments as to why.) In another test, a light commercial building was tested for a 60-day period and the energy bills were compared to the previous year’s bills for the same period. When the results were corrected for degree-days a seasonal savings of 44% was reported. No other information was provided to describe the building and how it was operated or whether the tests were controlled for other variables or not. It is difficult to understand how the performance of a boiler can be improved by 44% due to cycling changes alone. This improvement amounts to about 20 percentage points in efficiency (see Reference [5]). This is the range of the entire draft losses for a natural draft boiler without flue dampers operating at low load. The only variable that can have this large of an effect on efficiency (all other conditions equal) is part load ratio. For load variations from about 15% to full load it is possible for the efficiency to change by 15 to 20 percentage points. However, for the test being considered here the boiler was operated at about the same load condition with and without the controller installed (at least as represented by the degree-day data used). As discussed below, changes in cycling rate alone has a negligible effect on performance. Therefore, one can only conclude that there has to be another explanation for these savings. Some other changes in operations, solar loading, or boiler system changes (e.g., installation of flue dampers, etc.) might explain these results. For these results to be accepted, a thermodynamically sound explanation and/or detailed test data to show that efficiency improvements of this magnitude are possible, has to be offered.
5. Discussion and Conclusions
5.1 Performance of Duty Cycling
5.1.1 General A number of studies listed in the References document the results of field and laboratory testing conducted to determine energy savings associated with duty cycling. Two noteworthy papers present an overview and analysis of many of the studies relevant to this subject. Goldschmidt [8] reviews a number of the duty cycling performance studies that were conducted in the 1980s. He refutes results reported in several of these papers as indicated in the following annotated list. 1. Heaton & Lough - Heating, heat pump: Data too incomplete and erroneous to make
conclusions. When data was corrected, energy use was shown to increase.
c In these tests the control is alternatively activated and deactivated to attempt a comparison between before and after operation in a given installation.

14
2. Corcoron - Heating, heat pumps and gas fired furnaces: Insufficient data to determine energy savings.
3. Russell - Heating, gas fired furnaces: Data inconclusive and incomplete. No energy input measurements made.
4. Akridge [9] - Cooling: Data scatter greater than savings shown; inconclusive. Comfort was obviously compromised.
5. Thedford [10] - Cooling: Savings due to compromised comfort; when changes of inside temperature were accounted for, savings were negligible. Inside relative humidity increased.
6. Porterfield & Bournakis [11] - Used the PRISM method for analysis of a large number of homes using duty cylcers and a corresponding set of uncontrolled homes. Results show ~3.5% savings with a standard deviation of 10 - practically insignificant from a statistical point of view.
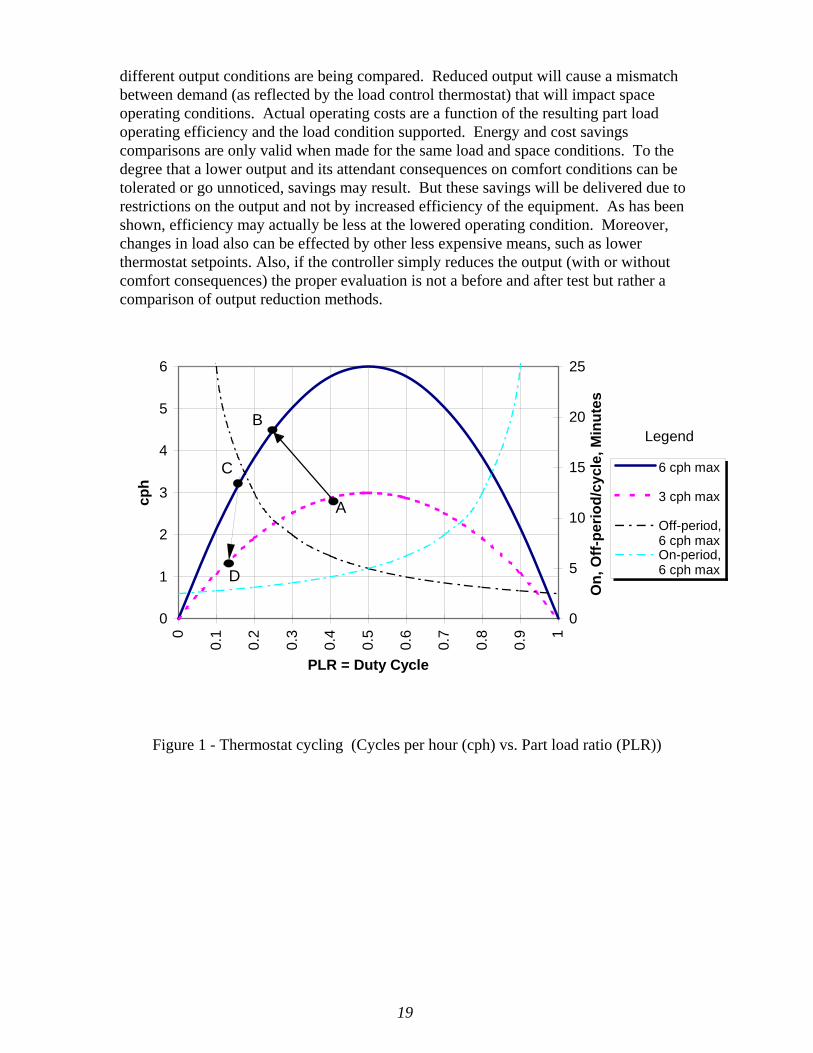
Likewise, Greenberg [12] reported that, overall, the studies were either inconclusive or showed negligible savings. One issue that appears repeatedly in the reporting of test results and savings claims in product literature is the direct or indirect implication that short term test results and “typical” examples at one operating point are equivalent to seasonal savings. This tends to overstate savings expectations. Savings are not shown as a function of load. Moreover, newer controllers use internal automated test procedures that make it easy to perform certain comparison tests but tend to make it too easy to overlook the complexity of calculating annual performance (as well as leading to a misinterpretation of savings magnitudes). In many cases annual savings projections made using life cycle costing calculations or DOE2 simulations were based on short term results only. For example, consider a furnace that is oversized by 70% (typical for furnaces). Most of the energy use for heating occurs between 30 and 60% of design loads. Therefore, part load ratios (PLR) would mostly be in the range of 15 to 35% with cycling rates in the range of 3 to 5 cph (see Figure 1). This would yield on-periods of 4 minutes or less. Part load ratio is load divided by capacity and by definition has to be equal to the duty cycle (on-period/total cycle time) of the controller; i.e., the average load condition is met by the cycling imposed by the thermostatic control. As shown from Figure 1, off-period is proportional to load but not linearly. For cooling, with over-sizing factors of 15% to 25%, cycling rates would be in the range of 1 to 3 cph for typical loads with on-periods of less than 10 minutes. Further complicating this situation is the fact that over-sizing varies widely between different installations and in most cases is not understood well by the owners or installation personnel.
These results indicate that typical on-periods are too short to allow effective operation of a duty cycler for the majority of the operating hours of a heating of cooling season. Duty cyclers are most effective at high part load ratios but these occurrences represent a relatively small number of the total annual operating hours. This leads to the conclusion that a single test at one operating condition (or averaged results that included only diurnal variation) are not adequate for extrapolation to seasonal energy savings. The
15
performance needs to be understood in terms of its savings at a full range of load conditions. (See Wise and Kweller [4] for a complete discussion for heating.)
Examples presented in product literature can also be misleading. One example that appears in sales literature shows a long cycle with an on-period of at least 30 minutes. This translates to a cycle rate of less than 2 CPH on the high load side of the typical thermostat cycling curve such as illustrated in Figure 1. A low cycle rate near 1-2 CPH is indicative of high load conditions with a minimally oversized unit at peak load operation. For heating this is just the opposite of what one would expect with typical oversizing in the range of 50 to 100%. In addition, the figures that compare between activated and deactivated operation do not show a typical cycle for the case without duty cycler. Without this the average output cannot be computed in a manner equivalent to that of the case with the cycler enabled. These figures also ignore the fact that the output is being reduced which may have an impact on space conditions (see below), and that two different load conditions are being compared. These results emphasize a number of problems with the arguments presented in promotional literature and test reports for how these systems save energy. These are outlined in the following sections.
5.1.2 Air conditioners and heat pumps For compressorized systems off-period stored energy recovery has been the primary explanation offered for the energy savings derived from duty cycling. Supposedly, energy is recovered during imposed off-periods to be used to cool the space at greater efficiency than when the compressor is operated. This argument ignores the fact that once the stored energy is depleted that it has to be recharged during the next on-period. This charging is done at lower than steady state efficiency. The net effect is negligible in terms of savings. The recovered energy is not “free” energy that is otherwise being lost from the system. In fact, savings can be negative since increased cycling can result in a decrease in overall average efficiency (see References [1, 2, 3]). The study by Mulroy explicitly addresses this issue and has definitively shown that energy recovery has no effect on system efficiency. Duty cycling used for cooling systems also tends to exacerbate humidity problems. During the off-period the circulating fan is left on which allows re-evaporation of condensate. This is why cooling systems are not normally operated using the continuous fan setting of the thermostat. Testing by Khattar showed that indoor relative humidity increased by almost 20% at normal cooling operating conditions when duty cyclers were used. This would be a serious problem for high humidity cooling climates. Another explanation offered for the energy savings derived from duty cycling is that higher coil temperatures result from duty cycling operation, apparently as a consequence of more time spent in transient startup conditions than would occur under normal cycling. For a worst case scenario where the refrigerant cycle thermodynamics are compared for 40 F vs. 50 F saturated evaporator temperature (SET)d, the COP would be increased by about 8%. This is much less than the 20 to 30% savings that are claimed and comes at
d 50 F results from assuming a sensible heat factor (SHF) of 95% and an apparatus dew point (ADP) of 57 F with a 7 F difference between coil ADP and SET.

1
the expense of a reduction in latent capacity and increased space humidity. It is unlikely that actual coil temperatures would be this high. Air conditioner controllers have minimum-on timers that require the unit to operate for a minimum of 5 minutes. Transient startup conditions typically take about 1-2 minutes thus leaving 3-4 minutes of operation at near steady state with low coil temperatures. A more likely explanation for the increased humidity is the one mentioned above; re-evaporation of moisture due to operation of the circulating fan results in higher humidity and a lower effective latent cooling capacity.
5.1.3 Furnaces Recovery of stored energy is also offered as an explanation for savings due to duty cycling for furnaces. The same arguments hold for furnaces as were presented above for cooling equipment. Moreover, normal furnace controllers already include a fan-on delay period at the end of each operating cycle. Thus any additional savings associated with delayed off-periods would be minimal. For furnaces there is great variation in flue design (and thus in performance) depending on the age of the furnace. In older furnaces with atmospheric, natural draft burners one would expect to see an increase in flue losses and therefore a lowering of cycling efficiency as cycling increased (unless they were fitted with flue dampers) (see References [13, 14]). In newer, induced draft furnaces one would expect less effect due to increased cycling. Lower flue gas temperatures are also sometimes used as an explanation for increased efficiency; lower average flue gas temperature is assumed to result in greater efficiency. However, flue loss efficiency (total energy removed from input gas as reflected in flue gases) and output efficiency (useful energy output per unit of energy input) are different during transient startup conditions. During the startup period, flue loss efficiency is greater than steady state due to lower heat transfer temperatures, and output efficiency is less than steady state due to charging of the thermal mass. The two are equivalent at steady state conditions. Goldschmidt shows that flue loss efficiency improvements, considering flue losses alone, could amount to a maximum of 8-10% and would depend on the cycling rate. The effect on delivered energy efficiency, however, would be much less for the reasons stated above. One side effect of lower flue gas temperatures is decidedly negative; it could lead to an increase in corrosion potential due to condensation in the flue for non-condensing furnaces. Overall, however, output efficiency of combustion equipment decreases with increase in cycling rate as shown by Hough [13] for furnaces and Chi [5] for boilers. Furnaces appear to be more sensitive to cycling rate than boilers; the large thermal mass of boilers tends to reduce the impact of cycling. Independent of the degree of sensitivity to cycling rate, several studies (see References [5, 6, 13, 14]) document the effect of load on cyclic efficiency. There is clear consensus for both furnaces and boilers that there is a significant decrease in output efficiency as load decreases.
5.1.4 Boilers When considering the application of duty cyclers to boilers several facts about boiler systems design and operation should be understood. The following are among them:
6

17
There are a variety of boiler types and ways that they are controlled depending on the application and size ranging from simple to complex. For light commercial/residential applications cast iron, hot water, single capacity boilers are typical. For larger systems, modulating boilers are used; these are not candidates for duty cycling controllers. Although manual control is not normally found in modern boiler systems, there are still old installations where it may be found. The majority of potential applications of duty cyclers are on hydronic systems. In these systems, zones are controlled by thermostatically controlled zone valves or secondary circulation pumps. The boiler controller is basically the same in either case. When any zone calls for heating, the boiler and its circulating pump are activated. The boiler supply water temperature is controlled either with a high limit aquastat or a high-low-limit aquastat. In either case the boiler is cycled to maintain an aquastat setting, the only difference being the control point. High-low-limit controls allow the cycling to be controlled at the low-limit while the high-limit serves as the high temperature limit safety. An alternative to this control is where a mixing valve is placed on the supply side of the boiler to allow the supply water temperature to be controlled by an independent mixing controller. The boiler itself, however, is controlled in the same manner as above. A common variation of this control is to utilize an outdoor reset controller to reset the supply water temperature downward as the outdoor temperature increases. This strategy reduces some system losses and allows the zone control valves to operate better at low load conditions but its impact on boiler operation is the same as without; the boiler operates at lower load and decreased efficiency as supply water temperature is reduced.
Boiler over-sizing - Boilers, like furnaces and air conditioners are intentionally
oversized as a way to ensure that worst case peak loads are met and to allow for timely pickup from a setback condition (and thus reduce the liability of the designer). For hydronic systems over-sizing can result in poor performance overall if the control settings are incorrect (low supply water setpoint) and/or the distribution convectors are undersized. These factors limit the capacity of the system, thereby defeating the capability of the boiler to meet its pickup load in a timely manner and reducing performance by forcing the system to operate at low part load ratios virtually all of the time. Good system design will preclude exaggerated over-sizing, but some over-sizing is unavoidable. The impact of over-sizing on part load operation is similar to that of furnaces presented above.
Product literature for boiler duty cylcers claim that savings are a result of lower cycling rates imposed by the cycler control strategy. Both Garbern and Kelly [7] and Chi [5] have shown that boiler efficiency is highly dependent on load but only weakly dependent on cycling rate. Newer boilers (like newer furnaces) have improved part load performance because they are either forced or inducted draft or utilize flue vent dampers so that their off-period draft losses are significantly lower. Garbern and Kelly’s results show that the performance increase of gas-fired hot water boilers is less than 4% as cycling rates are decreased from about 10 cph to 2 cph. This suggests that claims of 10-20% (and sometimes more) energy savings due to decreased cycling alone are overly optimistic.

18
5.1.5 Testing methodology A persistent problem with manufacturer supported tests is lack of adequate measurements. Test methods that use on and off times of compressors and gas valves are not accurate since they do not show the effects of different operating efficiencies. Input meter readings are necessary to capture this effect. Appendix A contains guidelines for how valid testing can be conducted.
5.1.6 Manufacturers’ perspective Several heating and cooling equipment manufacturers were contacted to ascertain their views about the use of duty cycling on their equipment. Responses were received from Amana, McQuay, and Rheem. Virtually all of them expressed little concern and stated that they are rarely concerned about it. They consider these add-on controls strictly as an after-market issue. They are confident that the controls offered on modern equipment are sufficient to prevent damage to the equipment.
5.1.7 Output reduction Independent of the effects that part load ratio and cycling rate have on performance is the fact that duty cycling reduces output. In virtually all studies, and the manufacturers’ test reports, it is clear that all of these techniques result in lowered output (and thus lower input energy) relative to normal control. It is the misunderstanding (and misrepresentation) of this fact that creates considerable confusion about the efficacy of duty cycling. As pointed out above, the duty cycle imposed by thermostatic controllers matches the equipment output to the load. Typical cycling rates of 1-3 cph for compressorized systems, 2-4 cph for high mass boilers, and 4-6 cph for furnaces and low mass boilers are optimum in terms of minimizing losses while maintaining good control (i.e., low swing and minimum droop). As load changes under normal thermostat control, the cycling rate (cph) changes as shown in Figure 1. When a duty cycling controller is interposed between the normal thermostatic controller and the unit, a new duty cycle is imposed on the system. This can result in a decrease or increase in the cycling rate. For example, in Figure 1 an increase in cycling rate (cph) is shown for the change in operation from point A to point B. Likewise, a decrease in cycling rate (cph) is shown for a change from point C to point D. Note that both of these changes correspond to a lowered duty cycle (i.e., part load ratio) and therefore a new part load operating point. These changes in duty cycling do not reflect a change in efficiency, only a change in operating point with reduced output. The overall effect on efficiency of using a duty cycling controller would show up only when energy input is metered for equivalent load conditions (i.e., the same part load ratio). Wise and Kweller have shown, for example, that a furnace system using a duty cycler must be operated for a longer total cycle time to meet the same load so that the overall energy input and cyclic efficiency ends up being about the same. Wise and Kweller’s results show seasonal efficiency decreased by 0.7 percentage points when duty cycling was used to satisfy the same load. This is understandable since the increased cycling rate actually reduces output efficiency somewhat. Performance improvements based on comparison of duty cycle rates before and after implementation of duty cycling is not an apples-to-apples comparison because two
19
different output conditions are being compared. Reduced output will cause a mismatch between demand (as reflected by the load control thermostat) that will impact space operating conditions. Actual operating costs are a function of the resulting part load operating efficiency and the load condition supported. Energy and cost savings comparisons are only valid when made for the same load and space conditions. To the degree that a lower output and its attendant consequences on comfort conditions can be tolerated or go unnoticed, savings may result. But these savings will be delivered due to restrictions on the output and not by increased efficiency of the equipment. As has been shown, efficiency may actually be less at the lowered operating condition. Moreover, changes in load also can be effected by other less expensive means, such as lower thermostat setpoints. Also, if the controller simply reduces the output (with or without comfort consequences) the proper evaluation is not a before and after test but rather a comparison of output reduction methods.
0
1
2
3
4
5
6
0
0.1
0.2
0.3
0.4
0.5
0.6
0.7
0.8
0.9 1
PLR = Duty Cycle
cph
0
5
10
15
20
25
On,
Off-
perio
d/cy
cle,
Min
utes
6 cph max
3 cph max
Off-period,6 cph maxOn-period,6 cph max
B
A
C
D
Legend
Figure 1 - Thermostat cycling (Cycles per hour (cph) vs. Part load ratio (PLR))
20
Appendices
6. Appendix A: Testing Methodology Guidelines In order to make estimates of energy savings, the performance of the controller must be measured and documented under actual operating conditions either by laboratory or field testing of single units or by large scale sample tests. The performance of the controller must be based on actual independent measurements in order to be credible. Once credible performance based on measured data is available it can be used to make estimates of annual savings and be used in a life cycle cost (LCC) analysis. To guide the project engineer in determining if adequate testing has been performed, a list of some common approaches used to verify these savings are shown in the table below. Included is the minimum necessary data requirements. The tests are listed in overall order of estimated accuracy (best to least). These methods assume that buildings to which the controllers are applied are skin load dominated so that simplified energy estimating methods can be used. (Of course more accurate results could be obtained by using calibrated simulation programs if detailed equipment performance data are available). All testing must be “controlled” to rule out variables other than load and controllable operation conditions. Some factors to be considered are: Changes in operating hours of building Changes in control setpoints Changes in ancillary loads that the system must meet such as hot water Other energy management changes such as insulation, window treatments, lighting
etc. Differences in solar conditions which can introduce significant variation in results
even in skin dominated buildings if there is large south facing glass. Equipment maintenance and operations changes such as flue dampers, new parts,
cleaning, new controls, etc.

21
Field Testing Guidelines. Type Description Testing requirements
“Flip/flop” Efficiency testing
Detailed testing with and without controller enabled with measurements made over a wide variety of operating conditions such that variations in performance over different load conditions can be determined.
• Make steady state measurements of energy input, load, and temperatures on a 5 to 15 minute basis sufficient to characterize total energy changes, and efficiency at various operating conditions with and without controller enabled. Take steps to reduce the impact of changes in solar input; e.g., conduct tests at night.
• Plot measured energy input and/or Efficiency vs. load or load proxies such as Trm-To, etc.
• Plot Energy vs duty cycle (duty cycle is proportional to part load ratio) for both conditions.
Single unit “Before & After”
Testing before and after controller is enabled for significant lengths of time and under documented and controlled building operations such that all variables except weather can be ruled out.
• Measure/record the following parameters at 30 minute to one hour intervals:
Energy input Indoor temperature & humidity Outdoor temperature Thermostat setpoints Fan settings Supply and return temperatures Fan volume measurement (single measurement)
• Plot energy input from bills and metering readings vs. degree day (DD) for both conditions. Use variable base DD for better accuracy (see below). Must have large enough sample sets to validate results statistically.
Single unit “After”
Testing after controller was installed with sufficient data to allow extrapolation or “mapping” of performance to equivalent conditions before controller was installed.
• Preferably use seasonal data measured at daily intervals. Use “mapping” technique to estimate performance for equivalent conditions without controller enabled. Minimum data requirements are:
Energy input (meter) Room temperature and humidity Outdoor temperature
.

22
Large scale multiple unit tests
A large sample test where a control group of nearly identical buildings are monitored over extended periods of times such that regression analyses can be performed
• Use large sample of data to allow statistical analysis; preferably a validated methodology such as Princeton Scorekeeping Method (PRISM). Minimum data requirements:
Energy input (meter) Room temperature and humidity Outdoor temperature
6.1 Variable Base Degree-Day Method A good method for determining savings is the variable base degree-day (DD) method. This method has the advantage of being relatively quick and simple and can account for variations in indoor temperature, outdoor temperature, and equipment performance (once it is known as a function of outdoor temperature and load). The test period must contain enough data to allow extrapolation to annual savings performance. For simple buildings this can be done with a modified DD technique to extrapolate a short term test to annual performance. Savings can be derived from a modified “mapping” technique where the test results for activated test periods can be mapped back to a standard unit operating under the same conditions using the unit performance vs load characteristics. To extrapolate this annual performance to other locations one can ratio on the basis of heating DD and cooling DD and use the new location’s energy, O&M costs, and installation costs for the LCC analysis. To do this one needs the following test data at least on an hourly basis:
Capacity measurement (CFM and delta T) Room temperature Outside temperature RH (for cooling tests) Room Setpoint Energy input Zero load outdoor temperature (balance point) Weather data for the location Unit nameplate and performance data Controller performance data as a function of PLR
From these data the following can be calculated:
DD (D-HR) for the test period (DD per days of test period) Capacity ratio (actual capacity/rated capacity) Total energy use (sum of energy measurements) Efficiency/COP of the unit (average) UA of the structure (calculate from, Energy *COP/DD)
The test data are then extrapolated to monthly energy at the site based on PLR and the part load performance of the unit. That is, the average conditions for the month will lead

23
to average operating conditions for the unit in terms of capacity and therefore PLR using load (from DD). The energy is computed from load (UA*DD), adjusted for operating conditions and efficiency (efficiency vs. PLR). The idea is to first extrapolate test data to annual performance and second to estimate performance of standard unit under the same conditions. Energy per DD should show a change in slope but not in intercept if the same base is used and there is a savings. A change in setpoint (or control point) effectively changes the intercept since the internal gains will be offset by a different load; i.e., a different balance point. Therefore, the effect of different control point could be accounted for by plotting results for before and after using the variable degree day method. Variable degree days can also be used for short tests and extrapolated to annual results by summing energy computed by this method or comparing energy computed for equivalent short periods before and after activation but modified by variable degree days. However, heat loss and gain factors are needed to calculate balance point. These may be able to be derived from long term energy measurements if differences in operation are stable and there is little scatter in the data.

24
7. Appendix B: Vendors Based on the results of the vendor search the following appear to be the major manufacturers of duty cycling controllers for the purposes indicated.
7.1 Energy Savings The Pentech Companies 6048 Cornerstone Court West, Suite A San Diego, CA 92121 619-550-8228
Microtherm, Inc. 1929 18th St. NW, Suite 1132 Washington, DC 200009 202-588-2201
7.2 Peak Load Curtailment Dencor 1450 West Evans Denver, CO 80223 303-922-1888 RELM Communications, Inc. 7707 Records St. Indianapolis, IN 46226 317-545-4281 Scientific Atlanta, Inc. 4261 Communications Dr. Norcross, GA 30093 770-903-5000

25
8. Appendix C: References
1. J.G. Crawford, “Duty Cycling of Residential HVAC Equipment: A Manufacturer’s Perspective,” ASHRAE Proceedings, # NY 87-19-3, ASHRAE, Atlanta, 1987. 2. W.J. Mulroy, “The Effect of Short Cycling and Fan Delay on the Efficiency of a Modified Residential Heat Pump,” ASHRAE Proceedings, #SF-86-17 No. 1, ASHRAE, Atlanta, 1986. 3 . M.K. Khattar, et.al., “Another Aspect of Duty Cycling: Effects on Indoor Humidity,” ASHRAE Proceedings, # NY 87-19-4, ASHRAE, Atlanta, 1987. 4 . R.A. Wise and E.R. Kweller, “Part-load, Seasonal Efficiency Test Procedure Evaluation of Furnace Cycle Controllers,” ASHRAE Proceedings, #PO-86-13 No. 3, ASHRAE, Atlanta, 1986. 5. Joseph Chi, “Computer Simulation of Fossil Fuel Fired Boilers,” ASHRAE Proceedings, Paper C.2, ASHRAE, Atlanta. 6 . U. Bonne, “Furnace and Boiler System Efficiency and Operating Cost Versus Increased Cycling Frequency,” ASHRAE Proceedings, # OH-85-02 No. 4, ASHRAE, Atlanta, 1985. 7. D. Garbern and G.E. Kelly, “Dynamic Efficiency of a Gas-Fired Boiler,” ASHRAE Proceedings, Paper C.1, ASHRAE, Atlanta. 8. V.W. Goldschmidt, “On the use of Duty Cyclers in Residential HVAC Systems,” ASHRAE Proceedings, # NY 87-19-2, ASHRAE, Atlanta, 1987. 9. J.M. Akridge, “Duty Cycler Evaluation Final Reprot,” College of Architecture, Georgia Institute of Technology, Atlanta, 1983. 10. M. Thedford and M.L. Wallace, “A study of the Preprogrammed Thermostat Timer as a Load Control Device,” ASHRAE Proceedings, # 87-19-5, ASHRAE, Atlanta, 1987. 11. A.D. Bournakis and J.M. Porterfield, “Project H>E>A>T>: Residential Duty Cycler Demonstration,” ASHRAE Proceedings, # 87-19-1, ASHRAE, Atlanta, 1987. 12. S. Greenberg, “Duty Cyclers for Furnaces and Air Conditioners: Energy Savers or Energy Wasters?,” Energy Auditor & Retrofitter, May/June 1987, p. 25. 13. R.E. Hough, et. al., “Field Monitoring Results for Natural-Draft and Induced-Draft Gas-Fired Residential Furnaces,” ASHRAE Proceedings, # KC 84-10 No. 3, ASHRAE, Atlanta, 1987. 14. R.R. White and V.W. Goldschmidt, “Off-design Performance of a Gas Furnace,” ASHRAE Proceedings, # Paper C.3, ASHRAE, Atlanta.

26
15. “Impact of Direct Load Control Programs: A Duty Cycle Approach,” EPRI # CU 7028, Vol. 1, 1990. 16. M.A. Piette, “Controls to Reduce Electrical Peak Demands in Commercial Buildings,” CADDET Analysis Series No. 7, Netherlands, 1991. LBNL-41754final.doc