technology and resources for education - support home...
TRANSCRIPT

RM plc Annual Report and Financial Statements Year ended 30 November 2014
RM plc Annual Report and Financial Statem
ents – Year ended 30 Novem
ber 2014
Technologyand resourcesfor education

The RM plc group of businesses creates and maintains an extensive range of innovative solutions and services - all designed or selected to meet the specific needs of educational users.
RM ResourcesThis division comprises two operating businesses: TTS and SpaceKraft. TTS provides a wide range of resources for use in schools and other educational settings. TTS is a leading provider of physical resources to UK schools, with over 14,000 product lines and an established leadership position in Primary and Early Years age groups. SpaceKraft is a leading provider of resources and immersive environments to meet the specific requirements of learners with Special Educational Needs.
RM ResultsFormerly known as Assessment and Data Services, RM Results supplies government ministries, exam boards and professional awarding organisations with technology and expertise to improve efficiency, accuracy and clarity in the assessment cycle, both in the UK and internationally. This includes the systems required to provide the ‘league tables’ for English schools.
RM Results is a business that provides products and services that include secure, innovative systems for creating high-stakes exams and tests, onscreen testing, onscreen marking and the management and analysis of educational data.
RM EducationFormerly known as Education Technology, the division provides technology-based software and services, specifically designed for UK schools and other educational establishments, across the following categories:
Services
Outsourcing, support and implementation services, including managed services, onsite support, telephone support and consultancy services.
Infrastructure Solutions
Network software, tools and infrastructure services, such as the Community Connect network and device management tools and virtualisation.
Digital Platforms and Content
Access to curriculum resources and school management solutions, including RM Integris school management systems, RM Unify ‘launch pad to the cloud’, RM Books e-book system, RM Easimaths and RM Easiteach.
Internet
The provision of broadband and e-safety solutions.
The RM group comprises the following divisions:

01
Contents
Overview
02 Chairman’s Statement
04 Strategic Report
Governance
14 Directors’ Biographies
16 Directors’ Report
21 Corporate Governance Report
28 Audit Committee Report
34 Remuneration Report
Financial Statements
46 Independent Auditor’s Report
49 Consolidated Income Statement
50 Consolidated Statement of Comprehensive Income
51 Consolidated Statement of Changes in Equity
52 Consolidated Balance Sheet
53 Consolidated Cash Flow Statement
54 Company Statement of Changes in Equity
55 Company Balance Sheet
56 Company Cash Flow Statement
57 Notes to the Financial Statements
96 Shareholder Information

02
Chairman’s Statement2014 has been a good year for RM plc. Two of RM’s three divisions produced encouraging organic growth and all three showed further improvements in annual operating margins. Trading performance, which is detailed below, showed overall Group revenues down as anticipated, although this was combined with improvements in profitability, together with good cash generation.
RM Resources (formerly Education Resources), the largest contributor of profit to the Group, had an excellent year. TTS generated strong organic growth based on market share gains and achieved a further increase in already strong margins, whilst the small SpaceKraft business is no longer loss making.
RM Results (formerly Assessment and Data Services) secured new customers and delivered top-line growth and improving margins.
The reshaping of RM Education (formerly Education Technology) continues. This year saw the successful execution of the move away from the manufacture and sale of hardware devices. A new managing director was appointed to the division and priority areas within services and software have been identified.
The Group has a strong balance sheet, with cash and short-term deposits at the year end of £47.9 million (2013: £63.2 million). This was after payment of
£14.7 million as a special dividend and £8.0 million into a new escrow account to be applied to reducing risks associated with the Defined Benefit Pension Scheme which is now closed to accrual of benefits.
The Group has had four years of over 100% conversion of operating profit to cash generated from operations. It is anticipated that the Group will remain cash generating at an operating level, albeit at lower levels of cash conversion due to the run-down of a favourable working capital position related to long-term contracts.
The Board is recommending a final dividend of 3.04 pence per share which would constitute, at 4.00 pence per share in total, an increase of 21% over the prior year (excluding the impact of the 16.00p per share special dividend). Over time, the Board will adopt a progressive dividend policy towards a more appropriate level of dividend cover.
In the year ahead, we are confident that our two growing divisions will continue to perform well. RM Education, with a more focussed business and reduced cost-base, will take further steps towards building a secure platform for development.
John Poulter Chairman 2 February 2015

03
Two of RM’s three divisions
produced encouraging organic growth and all three showed further
improvements in annual operating margins.
John Poulter
Chairman

04
RM’s objective is to create shareholder value through the provision of resources, software and services to the education sector.The strategies by which the Group pursues this objective are specific to the businesses within the Group and are addressed in the Divisional Reviews contained later in this report.
Strategic Report

05
We understand the need to balance customer success and
employee satisfaction with long-term shareholder return.
David Brooks
Chief Executive Officer

06
Group Financial PerformanceGroup revenue declined by 22.6% to £202.5 million (2013: £261.8 million).
To provide a better understanding of underlying business performance, the Income Statement amortisation charges relating to acquisition related intangible assets, share-based payment charges and other non-cash items of an exceptional nature have been disclosed in an adjustments column in the Income Statement to give ‘Adjusted’ results.
Adjusted operating profit margins increased again this year from 6.6% in 2013 to 9.1%. Adjusted operating profit increased to £18.5 million (2013: £17.2 million). The Group generated an unadjusted statutory profit before tax of £15.8 million (2013: £9.4 million).
The total tax charge within the Income Statement for the year was £4.2 million (2013: £3.3 million). The Group’s tax charge for the period, measured as a percentage of profit before tax, was 26% (2013: 35%). This decrease is principally due to the reduction in the UK corporate tax rate and a significant prior year adjustment in 2013, offset by a lower proportion of ‘Adjustments’ to operating profit being non-tax deductible. Adjusted basic earnings per share were 16.4p (2013: 12.6p). Statutory basic earnings per share were 13.9 pence (2013: 6.7 pence) and statutory diluted earnings per share were 13.0 pence (2013: 6.6 pence).
RM delivered another year of good cash generation with cash generated from operations for the year of £19.1 million (2013: £34.7 million). Cash and short-term deposits decreased to £47.9 million (2013: £63.2 million) principally due to the payment in the year of a £14.7 million special dividend and the payment of £8.0 million into a pension escrow account described in more detail below. The lowest cash position during the year due to seasonal cash flows was £25.9 million (2013: £33.0 million).
Cash generated from operations is expected to be less than operating profit in coming years, reflecting the reversal of a favourable working capital position related to long-term contracts and utilisation of property-related provisions.
Dividends
The total dividend paid and proposed for the year has been increased by 21% to 4.00 pence per share (2013: 3.30 pence excluding the 16.00p special dividend). This comprises an already paid interim dividend of 0.96 pence per share and, subject to shareholder approval, a proposed final dividend of 3.04 pence per share. The estimated total cost of normal dividends paid and proposed for 2014 is £3.2 million (2013: £3.0 million). In addition, a special dividend of
16.00 pence per share was paid at the same time as the final dividend in April 2014.
Defined Benefit Pension Scheme
The RM Defined Benefit Pension Scheme was closed to new entrants in 2003. An agreement was reached with the Trustees to close the Scheme to future accrual of benefits from 31 October 2012. At 30 November 2014 the IAS 19R scheme deficit (pre-tax) was £26.8 million (2013: £15.8 million). The principal reason for the deterioration in the balance sheet position was an increase in liabilities due to reduced corporate bond yields which are used to determine the liability discount rate. In addition, as explained below, an insurance policy was purchased in the year with the price paid being higher than the IAS 19R value of liabilities insured, partially offset by better than assumed returns on Scheme assets and the shortfall contributions paid by the Group. The triennial valuation of the Scheme’s position at 31 May 2012 for statutory funding purposes showed a Scheme deficit of £53.5 million. A deficit recovery plan over 15 years was agreed with the Trustees for future annual deficit recovery payments of £3.6 million, these amounts being guaranteed by the Parent Company. The Group also pays the Scheme’s expenses, including the Pension Protection Fund levy.
An escrow account was established in the year to be utilised for initiatives to reduce the risks related to the Scheme. These funds are held jointly between RM Education Ltd, the principal employer, and the Trustee for the sole purpose of funding risk reduction or risk management exercises for the Scheme. £8.0 million was paid into this account in 2014 in addition to the annual deficit recovery payments to the Scheme. Total cash payments including expenses for the year were £11.8 million (2013: £4.4 million).
In October 2014, £4.7 million of the funds in escrow were paid to the Scheme to help fund a pension buy-in. The transaction will produce an income stream to the Scheme which closely matches payments to all 165 existing pensioners. Such a buy-in largely eliminates the inflation, interest rate and longevity risks associated with these pension benefits. The transaction coverage represented 9% of the Scheme members and around 13% of the total Scheme liability. The insurance premium payable under the buy-in agreement was £30.7 million. The insurance premium was funded by way of £26.0 million of fixed income assets from the Scheme and £4.7 million paid from the escrow account. This leaves £3.3 million remaining in the escrow account to be used for future risk reduction exercises.
07
Divisional ReviewThe Group is structured in three operating divisions, each with its own managing director and management team. Some staff functions are provided centrally. Approximately 28% of Group headcount is based in India, providing support services and software development to the operating divisions.
RM ResourcesThe RM Resources division, formerly known as Education Resources, comprises two operating businesses: TTS and SpaceKraft.
TTS provides resources used in schools mainly through a direct marketing business model with goods supplied from large, centralised UK distribution centres. Products supplied are a mix of third party branded and TTS branded items manufactured by a network of third party suppliers.
The division’s strategy is to grow market share in the provision of resources to the UK schools, early years and Special Educational Needs markets via direct catalogue and online sales and marketing channels as well as through selective supply of products to UK trade and international schools and distributors.
Divisional revenue increased by 16% to £62.8 million (2013: £54.0 million) in a flat UK market, with strong UK market share gains and an 18% increase in international revenues.
Divisional adjusted operating margins increased to 16.4% compared with 13.3% in the prior year reflecting the benefits of growth and the realisation of efficiency gains from systems investments made in prior years. Adjusted operating profit was £10.3 million (2013: £7.2 million).
Further investment is being made in direct marketing across online and traditional channels and in export business development to support continued growth.
TTS UK Direct Marketing
Revenue from TTS UK direct marketing increased by 19% to £46.2 million (2013: £38.8 million) with a particularly strong performance from products targeted at the new English primary school curriculum. The proportion of sales through online channels showed further increases in the year.
TTS International
Revenue from international sales to overseas resellers and to international schools increased by 20% to £8.5 million (2013: £7.0 million). This was driven by growth in Europe, the Middle East and the Americas.
TTS UK Distributors
Revenue from sales to UK trade partners decreased by 7% to £4.4 million.
SpaceKraft
SpaceKraft supplies products and installation services for the Special Educational Needs market. Products are a mix of own-brand manufactured items and third party sourced. Sales of installations are made direct with other products supplied through catalogues and online.
Under the leadership of a new management team appointed at the end of 2013, the recent declining trend in revenue was reversed with growth of 11% to £3.7 million (2013: £3.4 million). The business is no longer loss-making.
RM ResultsThe RM Results business, formerly known as Assessment and Data Services, provides onscreen exam marking (e-marking), onscreen testing (e-assessment) and the management and analysis of educational data. Its customers include government ministries, exam boards and professional awarding bodies around the world, improving the efficiency, accuracy and clarity of the assessment cycle.
The strategy in the assessment side of the business is to expand the scope of services to existing customers through the provision of leading software products and services and to win new customers in both the UK and overseas markets. Software and services are provided through a combination of proprietary and third party, in-house and outsourced arrangements. Internationally the business is anticipated to evolve through partnerships and software licensing rather than as a service-based activity.
Revenue increased by 5% to £27.8 million (2013: £26.5 million). Adjusted operating margins increased further to 16.7% (2013: 16.1%). Adjusted operating profit was £4.6 million (2013: £4.3 million).
The business was successful in securing a contract with the Caribbean Examinations Council, a new e-marking customer. The summer 2014 e-marking pilot with the education charity AQA was completed successfully. RM Results has subsequently been appointed as one of two preferred suppliers for long-term e-marking contracts.
Internationally, the business is pursuing opportunities for the onscreen marking of paper-based exams. In the UK, examination and curricula changes introduced by the English Department for Education have reduced the number of exam retakes, while a move away from modular courses to final exam-based assessment will also impact the business in the medium term. There is a long-term trend from paper-based to onscreen testing,

0808
though the adoption of such systems for school-based examinations is low.
The educational data side of the business is dependent on one public sector customer, the Department for Education. The National Pupil Database and RAISE Online contracts, which include the capture and publishing of data for the school performance tables in England, were extended during the year following the agreement to stop work on the School Performance Data Programme.
RM EducationFormerly known as Education Technology, RM Education is a UK-focussed business supplying IT software and services to schools and colleges. The sale of personal computing devices ceased from December 2013 and manufacturing of hardware devices ceased in June 2014.
The divisional strategy, under a new managing director who was appointed in May 2014, is to continue to develop and encourage adoption of its portfolio of software products and services through new and existing propositions which meet the needs of UK schools.
Market trends affecting the business include the demand from schools for solutions which are low-cost yet can cope with an increasingly diverse range of hardware and software. In addition, purchasing decisions in England have been increasingly devolved to schools and academy groups and away from central government and local authorities. This required a change in the way the division engages with its market and the review has resulted in an increased focus on the top c.2,000 customers.
As anticipated, continued funding pressures in the UK education sector and the change of strategy away from selling hardware devices led to overall revenue in RM Education declining by 38% to £111.9 million (2013: £181.2 million). However, adjusted operating profit margins increased again this year from 5.2% to 6.9%. Staff cost reductions were implemented ahead of plan over the year and write downs in the value of remaining inventory have been significantly less than originally expected. The hardware devices business delivered higher revenue with lower costs than planned but this level of contribution will not be repeated in future. In addition, the Defined Benefit Pension Scheme was closed to future accrual of benefit in October 2012 and the costs relating to the Defined Benefit Pension Scheme (£1.3 million in 2014 and £0.9 million in 2013) are no longer allocated to individual divisions but are shown as unallocated costs. Adjusted operating profit was £7.7 million (2013: £9.4 million).
The performance of the four retained product groups and the personal computing hardware business, which has been exited, are reviewed below.
Services
These include implementation, management and support of IT infrastructure within schools and colleges, including Building Schools for the Future (BSF) contracts. As anticipated, revenues in 2014 again declined with a reduction in new school openings under the BSF programme. Services revenues decreased by 29% to £61.2 million (2013: £85.7 million).
Many services are subject to long-term project accounting policies and revenues and profits were positively affected by good operational performance and cost control in completing BSF contracts.
Priority areas of focus are on retention of existing customers at the end of current contracts and on winning individual school sites.
Digital Platforms and Content
These include established products such as RM Integris (RM’s cloud-based school management system), RM Easimaths curriculum software and RM EasiTeach whole class teaching software as well as newer offerings including RM Books and RM Unify. Digital Platforms and Content revenues increased by 4% to £7.6 million.
Revenue from RM Integris increased following good market share gains including Oxfordshire, won in 2013. The strategy is to increase RM’s market share in a market dominated by a large competitor and with low levels of switching between suppliers. RM Integris is a cloud-based Software as a Service offering with annual licences.
RM Unify is a product launched by RM in 2013 as a technology solution to allow customers easy access to the varied digital, cloud-based, educational specific content and materials that are now available. RM Unify incorporates a cloud-based ‘launchpad’ and ‘application store’ enabling schools to procure and access a wide variety of digital content in a secure, single sign-on environment. Revenue is derived from annual school subscriptions and from fees from sales of third party applications. The division’s strategy is generally not to develop its own curriculum software but to provide the best of what is available from third parties via RM Unify.
RM Books provides the first e-book solution designed for UK schools. The majority of leading UK textbook publishers are now participating, with approximately 16,000 titles currently available. The service is free to schools with RM taking a share of revenue from content sold through the system. The market penetration of e-books in consumer markets has increased dramatically in recent years but e-book adoption in schools is slow and revenue is still limited. The current focus is on demonstrating the educational value added.

09
Priority areas of focus are on winning new RM Integris customers and on embedding and expanding system usage amongst existing RM Unify customers.
Network Solutions
Network Solutions includes sales of RM’s Community Connect and Ranger network management tools and related provision of hardware such as routers and wireless systems. Existing products are typically sold as perpetual licences with annual maintenance contracts. Revenues decreased by 45% to £8.6 million (2013: £15.7 million) as demand for established products reduced year on year with reduced school capital budgets.
Sales of RM Neon, a new generation of network and device monitoring tools launched in the year, have been disappointing.
The focus is on ensuring that existing customers are on the latest version of our software and on developing enhanced propositions which meet users’ evolving requirements.
Internet
RM is a broadband and e-safety service provider to approximately 5,000 schools. RM designs and manages networks, procuring and integrating bandwidth and e-safety products from third parties. Competitors include regional educational aggregators and some of the large telecom providers who sell to schools directly. The devolution of purchasing decisions to individual schools is reducing the likelihood of local authorities procuring services centrally on their behalf.
This business is dominated by one large regional consortium which accounts for a large share of its revenue. This relationship is underpinned by a contract which runs until 2018 though volumes are variable.
Revenues decreased by 14% to £16.7 million (2013: £19.3 million) reflecting the end of some regional consortium contracts and the movement from private to public networks.
The business’ broadband connectivity and e-safety propositions were streamlined and simplified during the year. The priority now is on growing customer numbers.

1010
Personal Computing Hardware
Revenue derived from hardware (RM-branded and third party computing products, together with maintenance and warranty and other third party classroom equipment) decreased by 67% to £17.8 million (2013: £53.1 million) with RM’s exit of the personal computing devices business over the course of FY14.
Revenue was significantly higher than planned and the costs of exit, including obsolescent inventory, were much lower than expected. These benefits will not recur in future years.
Third party partners Misco and Kelway have been appointed to provide hardware devices to customers, where still required under existing contracts and bundled procurement processes, and to manage existing warranty and maintenance obligations respectively.
RM IndiaAs at 30 November 2014, RM’s operation in Trivandrum accounted for 28% of Group headcount (2013: 25%).
The Indian operation provides services solely to RM Group companies. Activities include software development, customer and operational support and back office shared service support (e.g. customer order entry, IT, finance and HR) and administration.
EmployeesAverage Group headcount for the year was 1,870 (2013: 2,148). At 30 November 2014 headcount was 1,778, a 12% reduction from 2,018 at 30 November 2013. The November 2014 headcount comprises 1,568 permanent and 210 temporary or contract staff, of which 1,274 were located in the UK and 504 in India.
The following table sets out a more detailed summary of the permanent staff employed as at 30 November 2014:
Male Female
Directors 2 (100%) 0 (0%)
Senior Managers (excluding Directors)
45 (80%) 11 (20%)
All employees 1,037 (66%) 531 (34%)
The Group is committed to offering equal employment opportunities and its policies are designed to attract, retain and motivate the best staff regardless of gender, sexual orientation, race, religion, age or disability. The Group gives proper consideration to applications for employment when these are received from disabled persons and will employ them in posts whenever suitable vacancies arise. Employees who become disabled are retained whenever possible through retraining, use of appropriate technology and making available suitable alternative employment.
The Group encourages the participation of all employees in the operation and development of the business and has a policy of regular communications. The Group incentivises employees and senior management through the payment of bonuses linked to performance objectives, together with the other components of remuneration detailed in the Remuneration Report.
The Group has a wide range of other written policies, designed to ensure that it operates in a legal and ethical manner. These include policies related to health and safety, ‘whistle blowing’, anti-bribery and corruption, business gifts, grievance, career planning, parental leave, systems and network security. All of RM’s employment policies are published internally.
Going ConcernThe Directors, having made appropriate enquiries, consider that the Company and the Group have adequate resources to continue in operational existence for the foreseeable future and that therefore it is appropriate to adopt the going concern basis in preparing the Financial Statements.
Environmental MattersThe Group’s impact on the environment, and its policy in relation to such matters, are noted in the Directors’ Report.

11
Principal Risks and UncertaintiesThe management of the business and the execution of the Group’s strategy are subject to a number of risks. Risks are reviewed by the Audit Committee and Board and appropriate processes put in place to monitor and mitigate them. The key business risks for the Group are set out in the table below:
Risk Description Mitigation
Public policy The majority of RM’s business is funded from UK government sources. Changes in political administration, or changes in policy priorities, might result in a reduction in education spending.
UK government funding in the education sector is constrained by fiscal policy.
Global economic conditions might result in a reduction in budgets available for public spending generally and education spending specifically.
The Group seeks to understand the education policy environment by regular monitoring of policy positions and by building relationships with education policy makers.
The Group’s three divisions have diverse revenue streams and product/service offerings.
The Group’s strategy is to focus on areas of education spend which are important to meet customers’ objectives. Where individual business’ revenues are in decline, management seek to ensure that the cost base supporting these is adjusted accordingly.
Education practice Education practices and priorities may change and, as a result, RM’s products and services may no longer meet customer requirements.
The Group seeks to maintain knowledge of current education practice and priorities by maintaining close relationships with customers.
Operational execution RM provides sophisticated products and services, which require a high level of technical expertise to develop and support, and on which its customers place a high level of reliance.
RM is engaged in the delivery of large, multi-year education projects, typically involving the development and integration of complex ICT systems, and may have liability for failure to deliver on time.
The Group invests in maintaining a high level of technical expertise.
Internal management control processes are in place to govern the delivery of projects, including regular reviews by relevant management. The operational and financial performance of projects, including future obligations, the expected costs of these and potential risks are regularly monitored by management.

1212
Risk Description Mitigation
Data and business continuity
RM is engaged in storing and processing sensitive data, where accuracy, privacy and security are important.
The Group would be significantly impacted if, as a result of a disaster, one of its major buildings, systems or infrastructure components could not function for a long period of time.
The Group’s IS function has invested in developing its Data Centres, and has been successfully certified to ISO/IEC 27001:2005 for the provision of systems, information and hosting services.
The Group has established an Information Security Committee to oversee the security aspects of the Group’s information systems. This covers data integrity and protection, defence against external threats and disaster recovery.
The Group seeks to protect itself against the consequences of a disaster by implementing a series of back-up and safety measures.
The Group has property and business interruption insurance cover.
People RM’s business depends on highly-skilled employees.
The Group seeks to be an attractive employer and regularly monitors the engagement of its employees. The Group has talent management and career planning programmes.
Innovation The IT market is subject to rapid, and often unpredictable, change. As a result of inappropriate technology choices, the Group’s products and services might become unattractive to its customer base.
The Group’s continued success depends on developing and/or sourcing a stream of innovative and effective products for the education market and marketing these effectively to customers.
The Group monitors technology and market developments and invests to keep its existing products and services and sales methods up-to-date as well as seeking out new opportunities and initiatives.
The Group works with teachers and educators to understand opportunities and requirements.
Dependence on key contracts
The performance of the RM Education and RM Results divisions are dependent on the winning and extension of long-term contracts with government, local authorities, examination boards and commercial customers.
The Group invests in maintaining a high level of technical expertise and on building effective working relationships with its customers. The Group has in place a range of customer satisfaction programmes, which include management processes designed to address the causes of customers’ dissatisfaction.

13
Risk Description Mitigation
Pension The Group operates a defined benefit pension scheme in the UK, which is in deficit. The scheme deficit can adversely impact the net assets position of the trading subsidiary RM Education Ltd.
The Scheme was closed to new entrants in 2003 and closed to future accrual of benefits in October 2012.
A pension escrow account was established in 2014 to fund risk mitigation exercises. The first of these was completed in October 2014 with the purchase a pensioner buy-in from an insurance company.
The Group evaluates risk mitigation proposals with the Scheme trustee.
Financial – foreign exchange
The Group is exposed to foreign currency risk with respect to purchases of goods in US Dollars and from its operations in India.
The Group enters into US Dollar and Indian Rupee denominated hedging contracts with approved banking organisations.
Financial – liquidity
The Group is exposed to counterparty risk on liquid assets.
Limits are placed on the level of deposit with any one counterparty. Bank selection takes into account credit ratings.
Financial – capital
The Group’s ability to pay dividends to shareholders depends on having sufficient distributable reserves in the holding company, RM plc. Additional losses incurred as a result of significant increases in the pension scheme deficit could further impair the ability of RM Education Ltd to pay dividends up to RM plc.
The Group monitors the level of distributable reserves in subsidiary companies and considers their ability to make dividend payments to the holding company.
David Brooks Director 2 February 2015

1414
John PoulterChairman (a) (r) (n)
John Poulter (72) was appointed as Non-Executive Chairman of RM plc on 1 May 2013. He is also Chairman of the Nomination Committee of the Board. Mr Poulter is currently Executive Chairman of 4imprint Group plc. He is a former Chairman and former Chief Executive of Spectris plc, a former Non-Executive Chairman of Filtronic plc and a former Non-Executive Chairman of Hampson Industries plc. He has also acted as Non-Executive Director to a number of public and private companies including FTSE 250 constituents BTP plc, RAC plc and Kidde plc.
Lord Andrew AdonisIndependent Non-Executive Director (a) (r) (n)
Lord Andrew Adonis (51) joined the Board on 1 October 2011. He served 12 years in government as a Minister and special adviser, including Secretary of State for Transport, Minister for Schools, Head of the No.10 Policy Unit, and senior No. 10 adviser on education, public services and constitutional reform. Before joining government, he was Public Policy Editor of the Financial Times. Lord Adonis is also a Non-Executive Director of Dods (Group) plc and a number of charitable organisations.
David BrooksChief Executive Officer
David Brooks (45) was appointed Chief Executive Officer of RM plc on 1 March 2013, having been appointed to the Board as Chief Operating Officer on 1 July 2012. He originally joined RM, with a degree in computing, on the Group’s graduate scheme. He has gained extensive experience in the education sector across many parts of the RM Group and is an alumnus of the Harvard Business School Advanced Management Programme.
Iain McIntoshChief Financial Officer
Iain McIntosh MA, FCA (51) joined RM on 30 November 2009 and was appointed to the Board as a Director on 1 April 2010. Before joining RM, he held equivalent positions in listed and private equity backed IT and service companies, most recently as CFO of FTSE 250 listed Axon Group plc. Mr McIntosh initially qualified as a Chartered Accountant and then spent four years as a management consultant with McKinsey & Co.
Patrick MartellIndependent Non-Executive Director (a) (r) (n)
Patrick Martell (51) joined the Board on 1 January 2014 as a Non-Executive Director. Mr Martell is a former Group CEO of St Ives plc, having joined in 1980. He was appointed to the Board of St Ives plc on 1 August 2003 and held the position of Managing Director, Media Products and Managing Director, UK Operations from 2006 to 2009, at which point he was appointed Group CEO. Mr Martell is currently Chief Executive of the Business Intelligence Division of Informa plc.
Deena MattarSenior Independent Non-Executive Director (a) (r) (n)
Deena Mattar FCA (49) joined the Board on 1 June 2011 as a Non-Executive Director and was appointed Chair of the Audit Committee on 26 March 2012. She served as Group Finance Director of Kier Group plc from 2001 to 2010, having joined the Group in 1998 as Finance Director of Kier National. Prior to this she held senior positions at KPMG. Ms Mattar is also a Non-Executive Director of Wates Group Ltd and, until its recent sale to Schneider Electric, she was a Non-Executive Director and Chairman of the Audit Committee for Invensys plc. She is also a former Non-Executive Director of Lamprell plc.
Committee membership as at the date of this report.
(a) Audit Committee Member
(r) Remuneration Committee Member
(n) Nomination Committee Member
Directors’ Biographies

Two of our three businesses are growing and make up
two thirds of our profit.Our RM Education business is on the road to recovery.
David Brooks
Chief Executive Officer
15

16
Directors’ ReportThe Directors submit their report together with the audited consolidated and Company Financial Statements for the year ended 30 November 2014.
The Corporate Governance Report is incorporated into this report by reference.
DividendsThe total dividend paid and proposed for the year has been increased by 21% to 4.00 pence per share (2013: 3.30 pence). This comprises an interim dividend of 0.96 pence per share paid in September 2014 and, subject to shareholder approval, a final dividend of 3.04 pence per share.
Treasury and foreign exchangeThe Group has in place appropriate treasury policies and procedures, which are approved by the Board. The treasury function manages interest rates for both borrowings and cash deposits for the Group and is also responsible for ensuring there is sufficient headroom against any banking covenants contained within its credit facilities, and for ensuring there are appropriate facilities available to meet the Group’s strategic plans.
In order to mitigate and manage exchange rate risk, the Group routinely enters into forward contracts and continues to monitor exchange rate risk in respect of foreign currency exposures.
All these treasury policies and procedures are regularly monitored and reviewed. It is the Group’s policy not to undertake speculative transactions which create additional exposures over and above those arising from normal trading activity.
Environmental policy and reportingThe Group recognises that its activities must be carried out in an environmentally friendly and compliant manner. Good standards of environmental performance are adopted to minimise the potential negative environmental impact of products and processes and also to promote sustainability. These actions include efficient utility usage, waste reduction/recycling and use of energy saving features in products.
The Group is required to report Scope 1 and 2 emissions for all Group companies within the Annual Report and has elected to report emissions for the year to 30 September 2014.

17
Set out below are all of the emission sources required to be reported under the Companies Act 2006 (Strategic Report and Directors’ Reports) Regulations 2013.
The GHG Protocol Corporate Accounting and Reporting Standard (revised edition) has been applied. The figures include emissions arising from all financially controlled assets, as well as business travel arising from air and other vehicle use.
All emissions factors have been selected from the emissions conversion factors published annually by Defra (which can be found at www.gov.uk/measuring-and-reporting-environmental-impacts-guidance-for-businesses).
Emissions by scope
Year ended 30 September 2014 Year ended 30 September 2013
Scope Source Country Tonnes CO2℮Absolute totals
Tonnes CO2℮ Tonnes CO2℮Absolute totals
Tonnes CO2℮
Scope 1 Air travel UK 733 527
Air travel India 397 339
Van/car travel UK 800 1,017
Van/car travel India 96 82
Gas UK 758 2,784 846 2,811
Scope 2 Electricity and gas UK 2,844 3,065
Electricity and gas India 730 3,574 798 3,863
Total 6,358 6,674
Emissions have also been analysed using an intensity metric, which will enable the Company to monitor how well emissions are controlled on an annual basis, independent of fluctuations in the levels of activity. The metric used is ‘emissions per full-time equivalent (FTE) employee’. The Group’s emissions per employee are shown in the table below:
Tonnes CO2℮/employeeYear ended
30 September 2014Year ended
30 September 2013
Scope 1 1.49 1.34
Scope 2 1.91 1.84
Total 3.40 3.18
Health and safetyThe Group has implemented a health and safety management system which aims to continually improve health and safety implementation and is designed to meet the requirements of OHSAS 18001. The following objectives are incorporated into the management system:
• Accident reduction
• Raising health and safety awareness
• Effective training
• Risk reduction and management.
Political donationsNeither the Company nor any of its subsidiaries made any political donations or incurred any political expenditure during the year.

1818
Substantial shareholdingsOn 31 January 2015 the Company had received notifications that the following parties were interested in accordance with DTR 5:
ShareholderNo. of
shares
Percentage of Issued Share Capital
as at 31 January 2015No. of shares
DirectNo. of shares
Indirect
Schroders Investment Management Ltd 15,071,278 18.24% 15,071,278 0
Aberforth Partners 12,505,033 15.13% 0 12,505,033
Artemis Investment Management LLP 8,754,376 10.59% 5,740,463 3,013,913
River and Mercantile Asset Management LLP 5,495,398 6.65% 5,495,398 0
The Wellcome Trust Ltd 4,798,752 5.81% 0 4,798,752
Majedie Asset Management Ltd 4,174,358 5.05% 0 4,174,358
The Takeovers DirectiveThe Company has one class of share capital, ordinary shares. All the shares rank pari passu. There are no special control rights in relation to the Company’s shares. As at 30 November 2014, the RM plc Employee Share Trust owned 2,351,321 ordinary shares in the Company (2.85% of the issued share capital); any voting or other similar decisions relating to those shares would be taken by the Trustee, who may take account of any recommendation of the Board of the Company.
The Group enters into long-term contracts to supply ICT products and services to its customers. Wherever possible, these contracts do not have change of control provisions, but some significant contracts do include such provisions.
In January 2012 the Group entered into a £30 million revolving credit facility with Barclays Bank, which has been extended to March 2017. This facility has a change of control provision and is subject to termination in the event of change of control of the Company.
Repurchase of own sharesAt the Annual General Meeting held on 19 March 2014, members renewed the authority under section 701 of the Companies Act 2006 to make market purchases on the London Stock Exchange of up to 8,182,601 ordinary shares, being 10% of the issued share capital of the Company. The minimum price which may be paid for each share is the nominal value. The maximum price which may be paid for a share is an amount equal to the higher of (1) 5% above the average of the middle market quotations of the Company’s ordinary shares as derived from the London Stock Exchange Daily Official List for the five business days immediately preceding the day on which such share is contracted to be purchased and (2) the amount stipulated by Article 5(1) of the Buy-back and Stabilisation Regulation 2003. This authority has not been used since the Annual General Meeting.
The Directors will seek to renew this authority at the next Annual General Meeting scheduled for 25 March 2015.
Overseas branchesThe Group has overseas branches in Italy and Singapore.
DirectorsDetails of those Directors who have held office during the financial year and up to the date of signing this report and any changes since the start of the financial year are given below:
John Poulter Lord Andrew Adonis David Brooks Jo Connell (retired 19 March 2014) Iain McIntosh Patrick Martell (appointed 1 January 2014) Deena Mattar
Biographical details of the current Directors are given on page 14. At the forthcoming Annual General Meeting all continuing Directors will stand for re-election in accordance with best practice and guidance set out in the UK Corporate Governance Code. The Directors who are proposed for re-election or election have either a letter of appointment or a service contract, details of which can be found in the Remuneration Report.
19
The Group has provided indemnity insurance for one or more of the Directors during the financial year and at the date of signing this report. The Directors also have the benefit of a Deed of Indemnity in respect of liabilities which may attach to them in their capacity as Directors of the Company. These provisions are qualifying third party indemnity provisions as defined by section 234 of the Companies Act 2006.
Independent auditor and disclosure of information to auditorAs far as the Directors are aware, there is no relevant audit information (as defined by section 418(3) of the Companies Act 2006) of which the Company’s auditor is unaware and each of the Directors has taken reasonable steps in order to make themselves aware of relevant audit information and to establish that the Company’s auditor is aware of that information.
A resolution to reappoint KPMG LLP as auditor of the Company will be proposed at the next Annual General Meeting.
Directors’ responsibilities statementThe Directors are responsible for preparing the Annual Report, the Remuneration Report and the Financial Statements in accordance with applicable UK law and regulations.
UK company law requires the Directors to prepare financial statements for each financial year. Under that law the Directors are required to prepare the Group Financial Statements in accordance with International Financial Reporting Standards (IFRSs) as adopted by the European Union and have elected to prepare the Company Financial Statements on the same basis. Under company law the Directors must not approve the Financial Statements unless they are satisfied that they give a true and fair view of the state of affairs of the Company and the Group and of the profit or loss of the Group for that year.
In preparing those financial statements, the Directors are required to:
• select suitable accounting policies and then apply them consistently;
• make judgments and estimates that are reasonable and prudent;
• state whether applicable IFRSs as adopted by the European Union have been followed, subject to any material departures disclosed and explained in the financial statements; and
• prepare the financial statements on a going concern basis unless it is inappropriate to presume that the Group and the Company will continue in business.
The Directors are responsible for keeping proper accounting records that are sufficient to show and explain the Company’s transactions and disclose with reasonable accuracy at any time the financial position of the Company and to enable them to ensure that the financial statements comply with the Companies Act 2006. They are also responsible for safeguarding the assets of the Group and hence for taking reasonable steps for the prevention and detection of fraud and other irregularities.
Under applicable law and regulations, the Directors are also responsible for preparing a Strategic Report, Directors’ Report, Remuneration Report, Corporate Governance Report and Audit Committee Report that complies with that law and those regulations.
Each of the Directors, whose names and functions are listed at the front of this report confirm that, to the best of their knowledge:
• the Group Financial Statements, which have been prepared in accordance with IFRSs, as adopted by the EU, give a true, balanced and fair view of the assets, liabilities, financial position and performance of the Group; and
• the information contained in pages 04 to 13 of this Annual Report includes a true, balanced and fair review of the development and performance of the business and the position of the Group, together with a description of the principal risks and uncertainties that it faces.
A copy of the Group Financial Statements is posted on the Group’s website www.rmplc.com. The Directors are responsible for the maintenance and integrity of the Group’s website and the financial information included on the website. Information published on the website is accessible in many countries with differing legal requirements but only legislation in the United Kingdom governing the preparation and dissemination of financial statements applies to the Group.
Annual General MeetingThe forthcoming Annual General Meeting will be held on 25 March 2015 at 140 Eastern Avenue, Milton Park, Milton, Abingdon, Oxfordshire OX14 4SB, at the time set out in the Annual General Meeting notice. The notice of the Annual General Meeting contains the full text of resolutions to be proposed.
By Order of the Board
Greg Davidson Company Secretary 2 February 2015

20

21
Statement of complianceThe Group has applied the principles set out in the UK Corporate Governance Code 2010 and also the UK Corporate Governance Code 2012 (together the “Codes”). The Company has complied with the Codes throughout the 12 month period ended 30 November 2014.
Compliance with the UK Corporate Governance Codes 2010 and 2012
Code of Best Practice – Principles RM Statement of compliance
A DIRECTORS
A1 The Role of the Board
Every company should be headed by an effective board, which is collectively responsible for the success of the company.
The Directors’ responsibilities are outlined in the Directors’ Report. The Board meets regularly on a formal basis plus additional ad hoc meetings as necessary. Further details of the operation of the Board and the structure of internal governance arrangements are referred to below.
A2 Division of responsibilities
There should be a clear division of responsibilities at the head of the company between the running of the board and the executive responsibility for the running of the company’s business. No one individual should have unfettered powers of decision.
There is a clear distinction between the role of the Non-Executive Directors on the Board, which is chaired by the Chairman, and the Chief Executive Officer and Chief Financial Officer, who have executive responsibility for the running of the Company’s business.
A3 The Chairman
The Chairman is responsible for leadership of the board and ensuring its effectiveness on all aspects of its role.
The Chairman sets the Board’s agenda and ensures that adequate time is available for the discussion of all agenda items. The Chairman promotes a culture of openness and debate. He also ensures constructive relations between the Executive Directors and the Non-Executive Directors. The Chairman ensures effective communication with shareholders.
The Chairman meets the independence criteria.
A4 Non-executive Directors
As part of their role as members of a unitary board, non executive directors should constructively challenge and help develop proposals on strategy.
The Non-Executive Directors scrutinise strategic proposals for the Group and monitor performance on an ongoing basis.
Corporate Governance Report

2222
Code of Best Practice – Principles RM Statement of compliance
B EFFECTIVENESS
B1 The composition of the Board
The board and its committees should have the appropriate balance of skills, experience, independence and knowledge of the company to enable them to discharge their respective duties and responsibilities effectively.
The Board consists of the Chief Executive Officer and Chief Financial Officer plus, currently, four Non-Executive Directors including the Chairman. All of the Non-Executive Directors are considered by the Board to be independent of the management of the Company and free from any business or other relationship which could materially interfere with the exercise of their independent judgment. The Directors have a combination of financial, business and educational expertise which is suited to the nature of the Company.
B2 Appointments to the Board
There should be a formal, rigorous and transparent procedure for the appointment of new directors to the board.
A separate Nomination Committee, comprised of all Non-Executive Directors, including the Chairman, is responsible for identifying and nominating candidates to fill Board vacancies. An external search consultancy, which had no other connection to the Company, assisted with the appointment of Patrick Martell as a Non-Executive Director (appointment effective 1 January 2014).
B3 Commitment
All directors should be able to allocate sufficient time to the company to discharge their responsibilities effectively.
The Board ensures that on appointment and thereafter all Directors have sufficient time to carry out their duties.
B4 Development
All directors should receive induction on joining the board and should regularly update and refresh their skills and knowledge.
All Non-Executive Directors receive an induction on joining the Board. All Non-Executive Directors have extensive experience and possess relevant skills and knowledge to perform their duties.
B5 Information and Support
The board should be supplied in a timely manner with information in a form and of a quality appropriate to enable it to discharge its duties.
The Board is supplied with monthly management accounts and detailed operational reviews.
All Directors have access to the advice and services of the Company Secretary or suitably qualified alternative, and all the Directors are able to take independent professional advice, if necessary, at the Company’s expense. All Directors are also invited to attend meetings of the Executive Committee and have access to managers within the Group.

23
Code of Best Practice – Principles RM Statement of compliance
B6 Evaluation
The board should undertake a formal and rigorous annual evaluation of its own performance and that of its committees and individual directors.
The performance of the Board and each Board Committee is reviewed on an annual basis and a review was conducted during the year ended 30 November 2014.
The performance of the Chairman is assessed by the Non-Executive Directors led by the Senior Independent Director. The Senior Independent Director also meets with the Non-Executive Directors without the Chairman being present on such other occasions as considered appropriate.
The performance of the Chief Executive Officer is assessed by the Chairman, in consultation with the other Non-Executive Directors. The performance of the Chief Financial Officer is assessed by the Chief Executive Officer, in consultation with the Chairman and other Non-Executive Directors.
The Chairman also holds meetings with the Non-Executive Directors without the Executive Directors present when considered appropriate.
B7 Re-election
All directors should be submitted for re-election at regular intervals, subject to continued satisfactory performance.
All Directors are appointed for specific terms subject to annual re-election.
C ACCOUNTABILITY
C1 Financial and Business reporting
The board should present a fair, balanced and understandable assessment of the company’s position and prospects.
In preparing the Annual Report to shareholders, the Directors consider that they present a summarised but fair, balanced and easily understood assessment of the Group’s performance and position and provide guidance on its future prospects.
C2 Risk Management and Internal Control
The board is responsible for determining the nature and extent of the significant risks it is willing to take in achieving its strategic objectives. The board should maintain sound risk management and internal control systems.
The Company operates a risk management and internal control process which is reviewed at least on an annual basis by the Audit Committee and endorsed by the Board.
C3 Audit Committee and Auditors
The board should establish formal and transparent arrangements for considering how they should apply the corporate reporting and risk management and internal control principles and for maintaining an appropriate relationship with the company’s auditors.
The Audit Committee is comprised of Non-Executive Directors and meets at least three times a year. The Chief Executive Officer and Chief Financial Officer are invited to attend. The Audit Committee meets separately with the Company’s auditor without the Executive Directors present. Further details are set out in the Audit Committee Report.

2424
Code of Best Practice – Principles RM Statement of compliance
D REMUNERATION
D1 The Level and Components of Remuneration
Levels of remuneration should be sufficient to attract, retain and motivate directors of the quality required to run the company successfully, but a company should avoid paying more than is necessary for this purpose. A significant proportion of executive directors’ remuneration should be structured so as to link rewards to corporate and individual performance.
Each of the Chief Executive Officer’s and Chief Financial Officer’s remuneration consists of basic salary and a variable annual bonus. Basic salaries are reviewed annually in the light of individual performance and market comparisons for similar jobs. Annual bonuses may be paid as described in the Remuneration Report.
In addition there are long-term incentive schemes in place as detailed in the Remuneration Report. These long-term incentive schemes include the Performance Share Plan and Share Option Plans.
During the period, neither the Chief Executive Officer nor the Chief Financial Officer held any Non-Executive positions with other companies.
D2 Procedure
There should be a formal and transparent procedure for developing policy on executive remuneration and for fixing the remuneration packages of individual directors. No director should be involved in deciding his or her own remuneration.
Remuneration packages for individual Directors are set by the Remuneration Committee after, if required, receiving information from independent sources and the Company’s Human Resources function. The Chief Executive Officer and Chief Financial Officer may be invited to attend the Committee’s meetings.
E RELATIONS WITH SHAREHOLDERS
E1 Dialogue with Shareholders
There should be a dialogue with shareholders based on the mutual understanding of objectives. The board as a whole has responsibility for ensuring that a satisfactory dialogue with shareholders takes place.
The Chief Executive Officer and Chief Financial Officer offer meetings with major shareholders at least twice a year after the announcement of preliminary full year and interim results. The Chairman also meets with shareholders, as appropriate.
Deena Mattar is Senior Independent Director and is available to shareholders if they have concerns which contact through the normal channels has failed to resolve.
All Non-Executive Directors are available to meet institutional shareholders on an ad hoc basis.
E2 Constructive use of the AGM
The board should use the AGM to communicate with investors and to encourage their participation.
All Directors make themselves available at the Annual General Meeting to respond to any questions raised by the investors in attendance.

25
Board of DirectorsThe Board of Directors meets regularly to review strategic, operational and financial matters, including proposed acquisitions and divestments, and has a formal schedule of matters reserved to it for decision. It approves the interim and annual Financial Statements, the annual financial plan, significant Stock Exchange announcements, significant contracts and capital investment in addition to reviewing the effectiveness of the internal control systems and business risks faced by the Group. Where appropriate, it has delegated authority to committees of Directors.
Board committeesThere are four Board committees: Audit, Remuneration, Nomination and Transactions; each of which, apart from the Transactions Committee, comprises only Non-Executive Directors.
The Audit Committee is chaired by Deena Mattar. The Audit Committee is comprised solely of independent Non-Executive Directors. The Audit Committee meets at least three times a year. The Company’s external auditor, Chief Executive Officer, Chief Financial Officer, Company Secretary, and the Group Financial Controller, who is Head of Internal Audit, normally attend these meetings. The Audit Committee is responsible for reviewing the accounting policies, internal control assessment and the financial information contained in the annual and interim reports. It provides an opportunity for the Non-Executive Directors to make independent judgments and contributions, thus furthering the effectiveness of RM’s internal financial controls. Further details of the Audit Committee’s activities are given in the Audit Committee Report. The terms of reference for the Audit Committee are published on www.rmplc.com.
During the period the Remuneration Committee was chaired by Jo Connell (until 19 March 2014) and Patrick Martell (from 19 March 2014) and comprised independent Non-Executive Directors. Executive Directors and senior managers may be invited to attend Committee meetings, but will not be present during any discussion of their own pay arrangements. The Remuneration Committee sets the remuneration of the Executive Directors and senior management. It also considers grants and performance conditions under RM’s share-based payment schemes and reviews RM’s employment strategy generally. Further details of the Remuneration Committee’s activities are given in the Remuneration Report. The terms of reference for the Remuneration Committee are published on www.rmplc.com.
The Nomination Committee is chaired by the Chairman and includes all of the independent Non-Executive Directors. The Nomination Committee recommends to the Board candidates for appointment as Directors. It meets as required, when the Group is considering the appointment of Directors. The terms of reference for the Nomination Committee are published on www.rmplc.com.
The Transactions Committee comprises the Chairman plus any one independent Non-Executive Director and any one Executive Director. The Transactions Committee meets at such times as are required. The Transactions Committee approves, enters into and authorises the execution of all deeds and documents and does everything that is necessary to give effect to any ‘substantial transaction’ that has already been approved in principle by the Board. The terms of reference for the Transactions Committee are published on www.rmplc.com.

2626
Board attendanceDetails of the number of meetings of the Board, including sub-committees and individual attendances by Directors are set out in the table below:
Board Meetings
Audit Committee
Remuneration Committee
Nomination Committee
Number of meetings held in the period 12 3 5 1
John Poulter 12 3 5 1
Lord Andrew Adonis 12 3 5 1
David Brooks 11 - - -
Jo Connell1 4 1 3 1
Iain McIntosh 12 - - -
Patrick Martell2 11 3 4 -
Deena Mattar 12 3 5 1
Notes:
1. Retired 19 March 2014.
2. Appointed 1 January 2014.
Executive CommitteeThe Executive Committee is chaired by the Chief Executive Officer. The Executive Committee comprises the Chief Executive Officer, Chief Financial Officer and other senior managers within the Group. The Executive Committee normally meets on a monthly basis to discuss policy and operational issues. Those issues outside the delegated authority levels set by the Board are referred to the Board for its decision. All Non-Executive Directors are invited to attend the Executive Committee.
Relations with shareholdersIn order to maintain dialogue with institutional shareholders the Executive Directors offer to meet with them following interim and final results announcements, or as appropriate, with other Directors available to meet institutional shareholders on request. Where practicable the Annual Report is sent to shareholders at least 20 working days before the Annual General Meeting and each issue for consideration at the Annual General Meeting is proposed as a separate resolution. All Directors generally attend the Annual General Meeting.
Social, ethical and environmental issuesThe Board takes regular account of the significance of social, ethical and environmental (‘SEE’) matters related to the Group’s business of providing IT services and solutions (including software, managed services and consultancy) to educational institutions.
The Board considers that it has received adequate information to enable it to assess significant risks to the Company’s short and long-term value arising from SEE matters and has concluded that the risks associated with SEE matters are minimal. The Board will continue to monitor those risks on an ongoing basis and will implement appropriate policies and procedures if those risks become significant.

27
Internal controlThe Group maintains an ongoing process in respect of internal control to safeguard shareholders’ investments and the Group’s assets and to facilitate the effective and efficient operation of the Group.
These processes enable the Group to respond appropriately, and in a timely fashion, to significant business, operational, financial, compliance and other risks, in line with the Codes, which may otherwise prevent the achievement of the Group’s objectives.
The Group recognises that it operates in a highly competitive market that can be affected by factors and events outside its control. Details of the risks faced by the Group are set out in the table on pages 11 to 13. It is committed to mitigating risks arising wherever possible and accepts that internal controls, applied and monitored, are an essential tool in achieving this objective.
The key elements of Group internal control, which have been effective during 2014 and up to the date of approval of these Financial Statements, are set out below:
• the existence of a clear organisational structure with defined lines of responsibility and delegation of authority from the Board to its Executive Directors and operating divisions
• a procedure for the regular review of reporting business issues and risks by operating divisions
• regular review meetings with the operating management
• a planning and management reporting system operated by each division and the Executive Directors
• the establishment of prudent operating and financial policies.
The Directors have overall responsibility for establishing financial and other reporting procedures to provide them with a reasonable basis on which to make proper judgments as to the financial position and prospects of the Group, and have responsibility for establishing the Group’s system of internal control and for monitoring its effectiveness. The Group’s systems are designed to provide Directors with reasonable assurance that physical and financial assets are safeguarded, transactions are authorised and properly recorded and material errors and irregularities are either prevented or detected with the minimum delay. However, systems of internal financial control can provide only reasonable and not absolute assurance against material misstatement or loss.
The key features of the systems of internal financial control include:
• a financial planning process with an annual financial plan approved by the Board. The plan is regularly updated providing an updated forecast for the year
• monthly comparison of actual results against plan
• written procedures detailing operational and financial internal control policies which are reviewed on a regular basis
• regular reporting to the Board on treasury and legal matters
• defined investment control guidelines and procedures
• periodic reviews by the Audit Committee of the Group’s systems and procedures.
The majority of the Group’s financial and management information is processed and stored on computer systems. The Group is dependent on systems that require sophisticated computer networks. The Group has established controls and procedures over the security of data held on such systems, including business continuity arrangements.
On behalf of the Board, the Audit Committee has reviewed the operation and effectiveness of this framework of internal control for the period and up to the date of approval of the Annual Report.

28
Audit Committee ReportThe Audit Committee operates under terms of reference approved by the Board, with the purposes of:
• monitoring the integrity of the Financial Statements of the Company and the Group
• reviewing the adequacy and effectiveness of the Group’s internal financial controls and risk management systems
• reviewing the adequacy and security of the Group’s arrangements for whistleblowing, the procedures for detecting fraud and the systems and controls for the prevention of bribery and the reporting of non-compliance
• monitoring and reviewing the effectiveness of the Group’s internal audit processes, the remit of internal audit and its operations
• considering and making recommendations on matters relating to the appointment of the Company’s external auditor, overseeing the relationship with the Company’s external auditor (including recommending remuneration levels and considering non-audit services), assessing the auditor’s independence and objectivity, reviewing the audit plan and reviewing the findings of the audit with the Company’s auditor.

29

3030
Monthly management accounts and reports are provided to the Board and Audit Committee. These management accounts are based on detailed information obtained by management which take into account the following:
• the forecast costs to complete on contracts and the margin to recognise or loss to be provided
• contract variations and extensions and whether they should be combined with existing contractual arrangements and their impact on recognised revenue and margin
• evaluation of contract deliverables and whether the delivery criteria have been met for revenue recognition.
Where a contract has a significant impact on revenue and profit or where there is a significant variation to the contract outturn or a significant judgement is required, this information is typically included in the management accounts and discussed by the Board and the Audit Committee.
Taking into account the track record and experience of the management team which prepares the costs to complete on long-term contracts and after reviewing the presentations and reports from management and the auditor and consulting with the auditor, the Audit Committee was satisfied that, overall, the Financial Statements appropriately addressed the critical judgements and key estimates (both in respect to the amounts reported and the disclosures).
Management reported to the Committee that they were not aware of any material misstatements. The auditor reported to the Committee the misstatements that they had found in the course of their work and no material amounts remain unadjusted. The Audit Committee was also satisfied that the significant assumptions used for determining the value of assets and liabilities had been appropriately scrutinised, challenged and were sufficiently robust.
The Audit Committee considered and is satisfied that, taken as a whole, the Annual Report and Financial Statements 2014 is fair, balanced and understandable and provides the information necessary for shareholders to assess the Group’s performance, business model and strategy.
Financial StatementsThe Audit Committee reviewed the form and content of the Annual Report and Financial Statements and the interim results prior to their publication to provide assurance that the disclosure made in the Financial Statements was properly set in context.
The Audit Committee reviewed and considered the following areas:
• the methods used to account for significant or unusual transactions where different approaches are possible
• whether the Group has followed appropriate accounting standards and made appropriate estimates and judgements, taking into account the views of the Company’s auditor
• the consistency of, and any changes to, accounting policies both on a year-on-year basis and across the Group
• the clarity of disclosure in the Company’s financial reports.
As part of this process the Audit Committee received reports from the management and the external auditor. The external auditor provided its audit opinion along with its audit findings that were of significance in relation to the audit of the annual Financial Statements and a high-level review of the interim Financial Statements. The Audit Committee reviewed these reports with the external auditor.
The Audit Committee considers that the significant accounting judgements upon which the Financial Statements are based relate primarily to long-term contract accounting and the related revenue recognition. Long-term contracts represent a significant part of the Group’s business and the accounting is inherently judgemental. To determine the revenue to be recognised it is necessary to assess how far a contract has progressed and the value of goods and services delivered as a proportion of the whole contract. To decide the margin to be recognised or loss to be provided, it is necessary to estimate future costs. Also, the Group may sign variations, extensions and/or new contracts with an existing customer and it is necessary to assess whether or not, for accounting purposes, these should be combined with an existing contract.

31
Composition and qualifications of the Audit CommitteeDuring the period the Audit Committee comprised Deena Mattar BSc (Econ), FCA (Chair), John Poulter, Lord Andrew Adonis, Jo Connell (until 19 March 2014) and Patrick Martell (from 1 January 2014), all of whom are independent Non-Executive Directors. The Group considers that Deena Mattar as a Fellow of the Institute of Chartered Accountants in England and Wales and former FTSE250 Finance Director has significant recent and relevant financial experience.
David Brooks (Chief Executive Officer), Iain McIntosh MA, FCA (Chief Financial Officer), Ed Warwick MEng, FCA (Group Financial Controller) and other management as appropriate are invited to attend Audit Committee meetings.
Schedule of meetingsThe Audit Committee met three times during the period. All of these meetings were part of the regular schedule of meetings set out in the Committee’s terms of reference.
Audit Committee meetings have formal agendas, which cover all of the areas of responsibility set out in the Committee’s terms of reference. These agendas include meetings with the external auditor without Executive Directors or managers of the Company present.
Appointment of external auditorThe Audit Committee recommended, and shareholders approved at the Company’s Annual General Meeting on 19 March 2014, the appointment of KPMG LLP as Group external auditor, with KPMG Audit plc not seeking re-appointment after internal restructuring within KPMG.
KPMG has been the Group’s auditor since 2011. The external auditor is required to rotate the audit partner responsible for the Group audit every five years and the current lead audit partner has been in place since 2011.
There are no contractual obligations restricting the Group’s choice of external auditor.
Oversight of external auditThe Audit Committee has reviewed the scope and results of the audit services, and the cost effectiveness and independence and objectivity of the external auditor.
Internal auditThe Audit Committee has approved the re-appointment of RM’s Group Financial Controller, Ed Warwick MEng FCA as Head of Internal Audit. For the purposes of this role, the Group Financial Controller reports directly to the Chair of the Audit Committee. The Audit Committee, with the advice and support of the Head of Internal Audit, sets an internal audit plan, focussed on financial controls and risk areas. The Head of Internal Audit reports on progress against this plan at Audit Committee meetings. Internal audit activities are undertaken on a peer-to-peer basis.
Policy on non-audit workThe Audit Committee has considered the issue of the provision of non-audit work by the external auditor and has agreed a policy intended to ensure that the objectivity of the external auditor is not compromised. The policy sets a limit for fees for non-audit work and states that non-audit work should only be undertaken by the external auditor where there is a clear commercial benefit in doing so. Any significant activity must be approved, in advance, by at least two Audit Committee members.
The Audit Committee’s policy is to include a cap on fees for non-audit work of 25% of the annual audit fee. This fee incorporates a review of the Group’s interim results. In exceptional circumstances it may be appropriate for the auditor to carry out non-audit work in excess of this cap. If this is the case the type of work and the fee is considered very carefully by the Audit Committee in advance of appointing the auditor to the work. Fees for total non-audit work in the period were 2.6% of the annual audit fee.
Internal control
Control environment
The Board has put in place an organisational structure with clearly defined lines of responsibility and delegation of authority to Executive management. A Group-wide approval matrix is in place. Individuals are made aware of their level of authority and their budgetary responsibility which enables them to identify and monitor financial performance. There are established policies and procedures, which are subject to regular review. The Boards of the operating companies work within terms of reference and any matters outside those terms or the agreed business plan are referred to the Board for approval.

3232
Identification and evaluation of business risks and control objectives
The Board has the primary responsibility for identifying the principal business risks facing the Group and developing appropriate policies to manage those risks. It delegates responsibility for operational risks to the Executive Committee which meets monthly.
Public reporting
The Audit Committee reviews and comments upon both the Group’s Annual Report and Financial Statements and interim results prepared by management.
Management information
Executive managers are required to produce a business plan for approval at the beginning of each financial year and detailed financial reporting is formally compiled monthly and reviewed by the Board. Consolidated management accounts are produced each month and results measured against plan and the previous year to identify significant variances. Forecasts are produced each month during the year, with variances to plan being measured.
Main control procedures
The existing finance systems and procedures allow the Board to derive confidence in the completeness and accuracy of the recording of financial transactions. The processes in place and the level of analytical detail given within the management accounts facilitate the identification of unreliable data. The Group’s treasury activities are operated within a defined policy designed to control the Group’s cash and to minimise its exposure to foreign exchange and liquidity risk.
Monitoring
The Audit Committee meets periodically to review reports from management and the external auditor so as to derive reasonable assurance on behalf of the Board that financial control procedures are in place and operate effectively. An internal audit plan is set with the Audit Committee and updates on progress are provided periodically. The internal audit work is performed on a peer-to-peer review basis directed by a qualified accountant who is independent of the business divisions.
‘Whistleblowing’ policyThe Group has adopted a formal ‘whistleblowing’ policy, which allows staff to raise concerns about possible improprieties. No concerns were raised during the year.
Anti-briberyRM conducts all its business in an honest and ethical manner and seeks to ensure that all associates and business partners do the same.
The Bribery Act 2010 sets clear standards of behaviour, which govern the Group’s operations. The Group has implemented policies and procedures to ensure that it is transparent and ethical in all business dealings. The Group has an anti-corruption and anti-bribery policy which sets out the legal standards the Group enforces as part of its ongoing commitment to implement adequate procedures to guard against illegal practices. Staff certification of compliance with the policy is regularly reported to the Committee.
Statement of risksAs with any business, RM is exposed to risks as an inherent part of creating value for shareholders. As described above, the Group has put in place processes designed to identify these principal risks and to manage and mitigate the effect of them. The Audit Committee is responsible for ensuring that risks are properly considered and the Board is responsible for deciding what risks should be taken and how best to manage and mitigate the risks.
The Audit Committee is satisfied that the Group’s risk management and internal control processes are appropriate to the business and Executive management has identified and addressed the principal risks affecting RM.
The most significant risks the Group is exposed to are set out in the Strategic Report.
Deena Mattar Chair, Audit Committee 2 February 2015

Cash and short-term deposits at the year end were £47.9 million, after
payment of £14.7 million as a special dividend and an extra
£8 million to the Defined Benefit Pension Scheme.
John Poulter
Chairman
33

34
Part A - IntroductionOn behalf of the Board, I am pleased to present the Remuneration Report for the year ended 30 November 2014.
This Report is divided into the following three sections:
Part A – Introduction Part B – Remuneration Policy Part C – Implementation Report
The introduction in this Part A provides an overview of the Report and explains any major decisions or changes in remuneration made during the year and the context of those changes (if any). It also summarises the functioning and membership of the Remuneration Committee.
The proposed Remuneration Policy set out in Part B will be put to a binding vote at the next
Annual General Meeting and the Implementation Report in Part C will be put to an advisory vote.
1. The Remuneration Committee
The Committee operates under terms of reference approved by the Board with the purposes of determining, on behalf of the Board and shareholders, the remuneration of the Executive Directors and senior employees throughout the Group. The Committee also oversees major policy changes (if any) to the overall reward structure of employees throughout the Group. In particular, the Committee keeps under review incentive plans operated throughout the Group so as to ensure that these plans are structured appropriately and are coherent. The Committee’s terms of reference can be found on the Group’s website at www.rmplc.com.
Remuneration Report

35
Part B – Remuneration Policy1. General objectives
The Remuneration Committee is responsible for the remuneration of the Directors and senior employees across the Group.
RM’s Remuneration Policy is designed to attract, retain and motivate Executive Directors and senior employees, both to achieve the Group’s business objectives and to deliver outstanding shareholder returns. To achieve this, RM’s Remuneration Policy aims to provide ‘median’ reward compared to comparator groups when acceptable levels of performance have been delivered. For the achievement of outstanding performance, it aims to deliver ‘upper quartile’ remuneration compared to comparator groups.
Under these arrangements, the variable component of the remuneration package is designed to be focussed on performance. These incentive arrangements enable Executive Directors and senior employees to have the opportunity to earn high levels of reward but only if they enhance shareholder returns by meeting the Group’s short-term and long-term targets. The Remuneration Policy therefore seeks to ensure that Executive Directors and senior employees are focussed on the achievement of key company objectives. The Committee is satisfied that this model provides appropriate alignment with shareholder interests and therefore acts as an appropriate motivator.
The Committee, together with the entire Board, also recognises the need for investment in the long-term future of the Company, not just performance in a single year. Since such measures are difficult to quantify, the Committee retains the discretion to adjust annual bonus payments to ensure that balance is maintained between short-term performance and longer-term investment.
The Committee has reviewed the level of risk inherent in the Remuneration Policy and is satisfied that there is an appropriate balance between encouraging entrepreneurial behaviour from Executive Directors and senior employees, whilst at the same time ensuring that there are no areas of the Policy which encourage undue risk taking. In relation to the target setting process and other matters arising in relation to the operation of the annual bonus and long-term incentive plans, the Committee considers that the structure should not encourage excessive risk taking.
2. Membership of the Committee
The membership of the Remuneration Committee during the year ended 30 November 2014 comprised Lord Andrew Adonis, Jo Connell (until her retirement at the Annual General Meeting on 19 March 2014), Patrick Martell (from his appointment on 1 January 2014), Deena Mattar and John Poulter, all of whom are independent Non-Executive Directors. Jo Connell was Chair of the Committee until her retirement, at which point Patrick Martell became Chair of the Committee. The other Directors attend meetings by invitation.
None of the members of the Remuneration Committee has any personal financial interest in the Company other than through fees received or as a shareholder. They are not involved in the day-to-day running of the business and have no personal conflicts of interest which could materially interfere with the exercise of their independent judgement.
3. Major decisions on Directors’ remuneration
During the year, the following key decisions were considered by the Committee:
• Agreement of the bonuses payable in respect of the financial year ended 30 November 2013.
• Approval of the Remuneration Report for the year ended 30 November 2013.
• The base salary for David Brooks, Chief Executive Officer, was increased from £250,000 to £300,000, with effect from 1 January 2014. As noted in last year’s report, the remuneration of the Chief Executive Officer was not increased on his appointment to the role of Chief Executive Officer and it was agreed to defer that decision until Mr Brooks’ performance in the role after a period of time could be considered. The increase noted above followed that performance review and also a benchmarking exercise.
• The grant of PSP awards to Executive Directors and senior management in August 2014.
4. Proposed new Shareholding Policy
This year’s Remuneration Report follows a similar structure to last year’s report. The key change is the proposed introduction of a Shareholding Policy, further details of which are set out below.

3636
Element Purpose and link to strategy Operation Maximum Opportunity Performance Metrics Changes for 2013/14
Fixed Pay
Base Salary To attract and retain talent by ensuring that salaries are competitive in the market.
Reviewed annually, with changes usually taking effect from 1 January. Reviews take account of:
• business performance and the wider economic and market conditions;
• market position relative to relevant comparator groups;
• the range of salary increases (if any) across the group; and
• individual experience and performance.
Reviews may be conducted at other times if appropriate (e.g. on a change in responsibility).
Base salaries will be determined from the outcome of reviews.
None. No change to policy.
Pension (see also note 1 below)
To attract and retain talent by ensuring that remuneration is competitive in the market.
Entitlement is the same as for other employees within the Group. Cash allowance alternative where individuals are subject to HMRC pension limits (subject to there being the same overall cost to the Group).
Up to 7% of base salary depending upon level of employee contribution.
None. No change to policy.
Benefits To attract and retain talent by ensuring that remuneration is competitive in the market.
Entitlement is the same as for other employees within the Group. The range of benefits offered to employees is reviewed periodically to ensure that offerings are in line with market practice.
Private healthcare. Permanent health insurance. Life assurance. Car allowance. Mobile phone allowance.
None. No change to policy.
Variable Pay
Annual Bonus Provides an element of at risk pay, which incentivises good annual financial results.
Reviewed annually prior to the start of each financial year to ensure targets support short-term and long-term business strategy. Targets are intended to:
• be stretching but realistic;
• reflect expectations of the investor community;
• avoid unnecessary risk-taking; and
• encourage long-term decision-making (e.g. incentivising long-term investments).
55% of base salary for on-target performance, with a maximum figure for over-performance of 110% of base salary.
Set by the Committee at the beginning of each year to focus on alignment with shareholders’ interests.
No change to policy.
LTIPs Incentivises Directors to achieve returns for shareholders over a longer time frame.
Awards are granted to Executives and senior management typically no more than once per year, with the vesting of awards being based on criteria designed to align with shareholder interests and encourage long-term performance.
150% of base salary. Set by the Committee at the date of grant to align with shareholders’ interests over a period of not less than 3 years.
See proposed new Shareholding Policy below. No other change to policy.
Notes:
1. Group company RM Education Ltd operates a defined benefit pension scheme. This closed to new members in 2003 and, in respect of current members, closed to future accruals on 31 October 2012. David Brooks, CEO, has past benefits accrued as at 31 October 2012. His entitlements under that Scheme are calculated on the same basis as those of other members. Since 1 November 2012, Mr Brooks has been a member of a defined contribution pension scheme.
2. Components of remuneration for Executive Directors
The following table sets out a summary of the various components of remuneration for Executive Directors, their purpose and link to strategy, how it operates, the maximum opportunity available, the nature of any applicable performance metrics and changes (if any) made during the year:

37
Element Purpose and link to strategy Operation Maximum Opportunity Performance Metrics Changes for 2013/14
Fixed Pay
Base Salary To attract and retain talent by ensuring that salaries are competitive in the market.
Reviewed annually, with changes usually taking effect from 1 January. Reviews take account of:
• business performance and the wider economic and market conditions;
• market position relative to relevant comparator groups;
• the range of salary increases (if any) across the group; and
• individual experience and performance.
Reviews may be conducted at other times if appropriate (e.g. on a change in responsibility).
Base salaries will be determined from the outcome of reviews.
None. No change to policy.
Pension (see also note 1 below)
To attract and retain talent by ensuring that remuneration is competitive in the market.
Entitlement is the same as for other employees within the Group. Cash allowance alternative where individuals are subject to HMRC pension limits (subject to there being the same overall cost to the Group).
Up to 7% of base salary depending upon level of employee contribution.
None. No change to policy.
Benefits To attract and retain talent by ensuring that remuneration is competitive in the market.
Entitlement is the same as for other employees within the Group. The range of benefits offered to employees is reviewed periodically to ensure that offerings are in line with market practice.
Private healthcare. Permanent health insurance. Life assurance. Car allowance. Mobile phone allowance.
None. No change to policy.
Variable Pay
Annual Bonus Provides an element of at risk pay, which incentivises good annual financial results.
Reviewed annually prior to the start of each financial year to ensure targets support short-term and long-term business strategy. Targets are intended to:
• be stretching but realistic;
• reflect expectations of the investor community;
• avoid unnecessary risk-taking; and
• encourage long-term decision-making (e.g. incentivising long-term investments).
55% of base salary for on-target performance, with a maximum figure for over-performance of 110% of base salary.
Set by the Committee at the beginning of each year to focus on alignment with shareholders’ interests.
No change to policy.
LTIPs Incentivises Directors to achieve returns for shareholders over a longer time frame.
Awards are granted to Executives and senior management typically no more than once per year, with the vesting of awards being based on criteria designed to align with shareholder interests and encourage long-term performance.
150% of base salary. Set by the Committee at the date of grant to align with shareholders’ interests over a period of not less than 3 years.
See proposed new Shareholding Policy below. No other change to policy.
Notes:

3838
3. Shareholding Policy
The Committee has implemented the following Shareholding Policy for all Executive Directors in order to further align their interests with those of the Company’s shareholders:
1. Within five years of being appointed to the Board, Executive Directors are required to build up, and retain, ordinary shares in the Company equivalent in value to at least 100% of their base annual salary.
2. Compliance with the Shareholding Policy will be measured as at 30 November each year, based on base salaries as at that date.
3. To comply with the Shareholding Policy, the value of Executive Directors’ shareholdings must exceed the relevant amount on at least one of the following bases: (a) the prevailing share price as at 30 November each year (applied to the total number of shares held); or (b) the aggregate of (i) the price actually paid for shares (in the case of prior purchases) and (ii) the value of shares that have vested through earlier share-based awards, based on the share price applicable on the date of vesting of each such award.
4. Provided that Executive Directors hold the appropriate level of shares, they may sell shares (i) to realise their LTIP awards or (ii) upon the exercise of share options. If income tax / national insurance becomes payable on the vesting of any awards, Executive Directors may still be able to sell shares to satisfy the relevant liability to income tax / national insurance, even where the appropriate level of shares is not held. In all cases, any such sale will be subject to the normal Listing Rules and Disclosure and Transparency Rules’ requirements for directors’ dealings.
4. Illustration of Remuneration Policy
The graphs below provide estimates of the potential future reward for each of the Executive Directors based on their current roles, the Remuneration Policy outlined above and base salaries as at 1 December 2014. However, it is noted that the illustrations show maximum LTIP awards at 150% of base salary, whereas the typical value of LTIP awards is lower (e.g. as is shown in paragraph 2 of Part C of this Remuneration Report, the value of LTIP awards made during the year ended 30 November 2014 was 93% of base salary for David Brooks and 92% of base salary for Iain McIntosh).
David Brooks – Chief Executive Officer
0
200
400
600
800
1000
1200LTIPs
Variable Pay
Fixed
MaximumOn-targetMinimum
£000
Explanations:
Base Benefits Pension Total
Fixed (£000)
300 11 21 332
On-target On-target is assumed to be an annual bonus equal to 55% of maximum and an LTIP award of 25% of maximum
Maximum • Full pay-out of annual variable pay i.e., 110% of base salary
• Maximum vesting of LTIP awards
Iain McIntosh – Chief Financial Officer
0
200
400
600
800
1000
1200LTIPs
Variable Pay
Fixed
MaximumOn-targetMinimum
£000
Explanations:
Base Benefits Pension Total
Fixed (£000)
235 11 16 262
On-target On-target is assumed to be an annual bonus equal to 55% of maximum and an LTIP award of 25% of maximum
Maximum • Full pay-out of annual variable pay i.e., 110% of base salary
• Maximum vesting of LTIP awards

39
5. Comparison of Remuneration Policy
This policy sets out the remuneration structure applicable to Executive Directors of the Group. Salary levels and incentive arrangements applicable to other Group employees are determined by reference to local employment conditions for comparative roles.
Budgeted salary increases for Group employees are taken into consideration when determining increases for the Executive Directors.
Employees are provided with a competitive benefits package including (as appropriate) private healthcare, permanent health insurance, life assurance, car allowance, mobile phone allowance and pension.
The closure of RM Education Ltd’s Defined Benefit Pension Scheme in October 2012 applied equally to all employees, including Directors.
Consistent with Directors, the majority of employees are eligible to participate in an annual bonus scheme with conditions linked to their personal performance, the performance of their operating business and the Group overall.
The Group does not consult with employees in respect of the Remuneration Policy. However, the Committee receives regular updates on salary and bonus levels across the Group and is aware of how the remuneration of Directors compares to employees.
In addition, when setting remuneration levels for the Executive Directors, the Committee takes account of the levels of remuneration received by executive directors of similar companies.
Whilst remuneration consultants have not been engaged during the period, regular benchmarking is undertaken against comparable companies using salary reports and surveys of established remuneration consultants.
6. Directors’ service contracts and letters of appointment
The Committee’s policy on Executive Directors’ service contracts is for them to contain a maximum notice period of one year. Each service contract expires at the respective normal retirement date of the Executive Director but is subject to earlier termination for cause or if notice is given under the contract. The contracts are designed to allow for flexibility to deal with each case on its own particular merits in accordance with the law and policy as they have developed at the relevant time. In the event that the Company wishes to terminate the employment of an Executive Director, it will take into account the Executive Director’s obligations to mitigate losses when deciding on an appropriate level of compensation.
Details of the Directors’ service contracts and/or letters of appointment who served for all or part of the year ended 30 November 2014 are shown in the table below:
Initial agreement dateExpiry date of
current agreementNotice to be given by
employer and individual
Current Directors
John Poulter 1 May 2013 30 April 2016 6 months
Lord Andrew Adonis 1 October 2011 30 September 2017 3 months
David Brooks 1 July 2012 Indefinite 12 months
Iain McIntosh 22 October 2009 Indefinite 12 months
Deena Mattar 1 June 2011 31 May 2017 3 months
Patrick Martell 1 January 2014 31 December 2016 6 months
Past Directors
Jo Connell 20 December 2007 19 March 2014 6 months

4040
Part C – Implementation Report1. Directors’ Remuneration - Single figure of Remuneration
The tables below set out a single figure of remuneration for each of the Directors in respect of the year ended 30 November 2014 and, in respect of those Directors, the equivalent figures for the year ended 30 November 2013:
Year ended 30 November 2014
Name
Salary and fees
£000
Taxable benefits
£000
Annual bonus
£000LTIPs £000
Retirement Benefits
£000Total £000
Executive
David Brooks 2961 11 248 - 211 576
Iain McIntosh 2351 11 155 - 161 417
Non-Executive
John Poulter 120 - - - - 120
Lord Andrew Adonis 36 - - - - 36
Jo Connell (retired 19 March 2014)
14 - - - - 14
Patrick Martell (appointed 1 January 2014)
35 - - - - 35
Deena Mattar 42 - - - - 42
Total 778 22 403 - 37 1,240
Year ended 30 November 2013
Name
Salary and fees
£000
Taxable benefits
£000
Annual bonus
£000LTIPs £000
Retirement Benefits
£000Total £000
Executive
David Brooks 2501 10 158 - 181 436
Iain McIntosh 2351 10 148 - 161 409
Non-Executive
John Poulter 70 - - - - 70
Lord Andrew Adonis 36 - - - - 36
Jo Connell (retired 19 March 2014)
40 - - - - 40
Patrick Martell (appointed 1 January 2014)
- - - - - -
Deena Mattar 45 - - - - 45
Total 676 20 306 - 34 1,036
Notes:
1. The section below headed “Retirement Benefits” explains how those benefits have been calculated and presented in the above tables. The figures for 2013 have been restated in accordance with those notes.

41
The following provides details of how the ‘single figure’ has been calculated:
Taxable benefits These comprise the benefits noted in Part B above other than retirement related benefits. The figure included in the above table in respect of such benefits is calculated based on the taxable value of such benefits.
Annual bonus As stated in the Remuneration Policy, on-target performance is paid out at 55% of base salary, with over-performance capped at a maximum of 110% of base salary. At the start of the year, the Committee decided that David Brooks’ bonus should be based upon Group adjusted operating profit for the year. Whilst the specific target is not disclosed for reasons of commercial sensitivity, the Committee took analyst forecasts into account when setting targets for bonus payments. Adjusted operating profit for the year exceeded the targets set and initial analyst forecasts for the year. Taking those targets into account the Committee considered that a bonus of 83% of base salary was appropriate for David Brooks.
The Committee set similar targets for Iain McIntosh, as well as a further target based on a reduction in the costs of central corporate overheads. All of those targets were achieved in full, with Group adjusted operating profit having over-performed as noted above. Based on those targets, the Committee considered that a bonus of 66% of base salary was appropriate for Iain McIntosh.
LTIPs None of the awards previously granted under the RM plc Performance Share Plan 2010 (the “PSP scheme”) were due to vest during the year. It is noted that the award granted under the PSP scheme in December 2011 vested on 2 December 2014 and this will be included in next year’s report.
An award to Iain McIntosh under the Group’s Deferred Bonus Plan vested in February 2014. In respect of this award, £39,487 of Mr McIntosh’s bonus for the financial year ended 30 September 2010 was deferred into 25,151 shares. The value of these shares on vesting in February 2014 was £32,633, indicating a loss of £6,854 over the period. As such, and in accordance with section 8(3) of the Large and Medium-sized Companies and Groups (Accounts and Reports) (Amendment) Regulations 2013, a figure of zero is included in the above table.
Retirement benefits David Brooks is a member of a defined contribution pension scheme operated by RM Education Ltd, into which the Group makes a contribution of 7% of base salary. A salary sacrifice arrangement is operated in relation to this Scheme (for all employees), meaning that base salary is reduced by the contribution that would otherwise be made by the individual, with that amount then being added to the employer contribution made to the Scheme. However, to make the figures in the above tables more meaningful, base salaries are stated prior to the reduction in base salary as a result of that salary sacrifice arrangement.
Iain McIntosh was a member of the defined contribution pension scheme noted above for part of the year. During the year, he ceased membership of that scheme and instead now receives a cash allowance equivalent to 7% of base salary in lieu of such contribution. Again, to make the figures in the above tables more meaningful, the cash received in lieu of pension contribution is shown as a retirement benefit and not as part of base salary.
David Brooks is also a member of RM Education Ltd’s Defined Benefit Pension Scheme which closed to future accrual with effect from 31 October 2012. During the year, the increase in Mr Brooks’ accrued pension under that Scheme was nil.
Note: There were no termination or exit payments made during the year.

4242
2. Directors’ long-term incentive plans
During the year ended 30 November 2014, the following long-term incentive awards were made:
Name
Type of share
awardGrant date
Face value of award
£000
Percentage that would
vest at threshold
performance
Maximum percentage of the face value
where this is more than the
face value
The end of the period over
which the performance
conditions have to be fulfilled
A summary of performance
targets and measures
David Brooks
PSP1 4 August 2014
279 (93% of base salary) 2
25% n/a 3 August 2017 Relative TSR performance3
Iain McIntosh
PSP1 4 August 2014
217 (92% of base salary) 2
25% n/a 3 August 2017 Relative TSR performance3
Notes:
1. Awards granted under the RM plc Performance Share Plan 2010.
2. The face value of each award has been calculated by multiplying the maximum number of shares in the award (180,000 shares for David Brooks and 140,000 shares for Iain McIntosh) by the share price on the date of grant of the award (154.75 pence).
3. Targets are based on relative TSR compared with a comparator group of the companies in the FTSE Small Cap (ex. Investment Trusts) Index. Threshold vesting is at median performance, maximum vesting at upper quartile performance, with straight line vesting in between these points.
3. Performance graph
The following graph shows the value, by 30 November 2014, of £100 invested in RM plc on 30 November 2009 compared with the value of £100 invested in the FTSE Small Cap (ex. Investment Trusts) Index on the same date. The other points plotted are the values at intervening financial year-ends.
Total shareholder return
0
£50
£100
£150
£200
FTSE Small Cap Index (ex. Investment Trusts)
RM plc
201420132012201120102009
4. Historical Chief Executive Officer Pay
The table below sets out details of:
• the total pay for each of the persons who have performed the role of Chief Executive for the current year and the preceding four financial years. The ‘single figure’ is calculated using the same methodology as that used for the “Single Figure of Remuneration” table in paragraph 1 above
• the pay-out of incentive awards as a proportion of the maximum opportunity for the period.
43
2010 20111 20122 20133 2014
Single Figure (£000) 517 426 286 379 576
Annual variable element award rates against maximum opportunity
56% 0% 0% 58%4 75%
Long-term incentive vesting rates against maximum opportunity
40% 0% 0% 0% 0%
Notes:
1. Terry Sweeney to 24 October 2011 (single figure: £369,000). Rob Sirs from 25 October 2011 to 30 November 2011 (single figure: £57,000).
2. Rob Sirs from 1 December 2011 to 31 January 2012 (single figure: £49,000). Martyn Ratcliffe from 1 February 2012 to 30 November 2012 (single figure: £237,000).
3. Martyn Ratcliffe from 1 December 2012 to 28 February 2013 (single figure: £52,000). David Brooks from 1 March 2013 (single figure: £327,000). Figures from the single-figure table in paragraph 1 of this Part C have been pro-rated to reflect the period during which Mr Ratcliffe and Mr Brooks respectively fulfilled the role of Chief Executive Officer.
4. Relates to David Brooks only. Martyn Ratcliffe had no annual variable remuneration.
5. Relative importance of spend on pay
The following table sets out, in respect of the year ended 30 November 2014 and the immediately preceding financial year, the total remuneration paid to all employees as compared to other significant distributions and payments:
2014 £m
2013 £m
Total remuneration to employees 69.1 87.2
Total remuneration to Directors 1.2 1.1
Dividends paid 17.7 2.8
Corporation tax paid 2.5 1.8
Defined benefit pension cash contribution 11.8 4.4
6. Relative changes in pay – Chief Executive Officer and employees
The average increase in pay for permanent employees across the Group between the year ended 30 November 2013 and the year ended 30 November 2014 was 4.4% (3.5% in the UK and 18.3% in India). In the year ended 30 November 2014, the base salary for the Chief Executive Officer increased by 20%. As noted above, the remuneration of the Chief Executive Officer was not increased on his appointment to the role of Chief Executive Officer and it was agreed to defer that decision until Mr Brooks’ performance in the role after a period of time could be considered. The increase noted above followed that performance review and also a benchmarking exercise.
7. Statement of shareholder voting
Voting at the Annual General Meeting held on 19 March 2014 in respect of the Remuneration Report for the year ended 30 November 2013 was as follows:
% of votes in favour
% of votes against
Number of votes withheld
Resolution to approve the remuneration report 97.85 2.14 719,768 (0.01%)
Resolution to approve the Directors’ Remuneration Policy 96.24 3.75 707,414 (0.01%)

4444
8. Directors’ shareholdings
The beneficial interests of the Directors (including connected persons as defined for the purposes of section 96B(2) of the Financial Services and Markets Act 2000) in the ordinary shares of RM plc as at 30 November 2014 were:
30 November 2014 30 November 20131
John Poulter 87,500 87,500
Lord Andrew Adonis - -
David Brooks 3,976 3,976
Iain McIntosh 131,382 131,382
Patrick Martell - -
Deena Mattar 17,933 17,933
Notes:
1. Shareholdings as at 30 November 2013 have been adjusted to reflect the share consolidation that took place on 20 March 2014, to give a more accurate comparison between the two years shown.
2. Following the vesting of the December 2011 PSP award on 2 December 2014, and the sale of sufficient shares from those awards to satisfy the tax and national insurance liabilities arising on vesting, the shareholdings of David Brooks and Iain McIntosh increased to 136,240 and 290,099 shares respectively. No other changes to the Directors’ shareholdings took place between 1 December 2014 and the date of this Report. In accordance with section 17(b)(iii) of the Large and Medium-sized Companies and Groups (Accounts and Reports) (Amendment) Regulations 2013, the above table does not include interests reported elsewhere in this Report.
9. Directors’ interests in share plans
As at 30 November 2014, the Executive Directors had the following interests in the Company’s share plans1:
Share Options2 PSP Awards3
David BrooksDate of Grant
No. of Options
Exercise Price
6/12/06 10,000 £1.742
28/11/07 20,000 £1.973
Date of Grant No. of shares / options
Performance Conditions
1/12/11 250,000 See note 4
6/8/12 250,000 See note 5
10/7/13 125,000 See note 5
4/8/14 180,000 See note 5
Iain McIntosh None.Date of Grant No. of shares
/ optionsPerformance
Conditions
1/12/11 300,000 See note 4
10/7/13 125,000 See note 5
4/8/14 140,000 See note 5
Notes:
1. To avoid duplication, and in accordance with Section 17(b)(iii) of The Large and Medium-sized Companies and Groups (Accounts and Reports) (Amendment) Regulations 2013, the figures in the above table do not include the shares or share-based awards referred to in paragraph 1 (Directors’ Remuneration – Single Figure of Remuneration) or in the table in paragraph 8 (Directors’ Shareholdings) above.
45
2. Granted under “The RM plc 2004 Inland Revenue Approved Company Share Option Plan and The RM plc 2004 Non-Inland Revenue Approved Company Share Option Plan”. All Options lapse if not exercised within 10 years of the date of grant. The Options in the above table have vested and are no longer subject to any performance conditions. Other Options previously granted but which have lapsed due to the performance conditions not having been met are not included.
3. Granted under “The RM plc Performance Share Plan 2010”. All PSP awards are subject to a minimum vesting period of 3 years.
4. This award vested in full on 2 December 2014. Please see note 2 in paragraph 8 above.
5. Targets are based on relative TSR compared with a comparator group of the companies in the FTSE Small Cap (ex. Investment Trusts) Index. Threshold vesting is at median performance, maximum vesting at upper quartile performance, with straight line vesting in between these points.
6. The PSP awards granted in 2011, 2012 and 2013 were all conditional share awards. The award granted in August 2014 was an award of options, with an exercise price of £0.00 per option. If these options vest, they would be exercisable in the period 7 August 2017 to 2 August 2024.
10. Details of Directors’ Service Contracts
Relevant information relating to the Service Contracts of the Directors is set out in Part B of this Report (Remuneration Policy).
11. Remuneration Committee details
Details of the Remuneration Committee and its membership are contained in Part A of this Report (Introduction).
12. Compliance with Regulations
This Report has been prepared in accordance with Schedule 8 of the Large and Medium-Sized Companies and Group (Accounts and Reports) Regulations 2008, as amended by The Large and Medium-Sized Companies and Groups (Accounts and Reports) (Amendment) Regulations 2013. The Report also meets the relevant requirements of the Listing Rules of the UK Listing Authority and illustrates how the principles of the UK Corporate Governance Code relating to Directors’ remuneration are applied by the Company.
The Group’s auditor is required to comment on whether certain parts of the Group’s Remuneration Report have been prepared in accordance with Schedule 8 of the Large and Medium-Sized Companies and Group (Accounts and Reports) Regulations 2008. Accordingly, the following sections of this Part C of this Report have been audited by KPMG LLP:
• The “Single Figure of Remuneration” table in paragraph 1.
• Total pension entitlements, as described in the notes to paragraph 1.
• Scheme interests awarded during the year, as set out in paragraph 2.
• Directors’ shareholdings, as set out in paragraph 8.
• Directors’ interests in share plans, as set out in paragraph 9.
By Order of the Board
Patrick Martell Chair, Remuneration Committee 2 February 2015

46
Independent Auditor’s Reportto the members of RM plc only
Opinions and conclusions arising from our audit1. Our opinion on the financial statements is unmodified
We have audited the financial statements of RM plc for the year ended 30 November 2014 set out on pages 49 to 95. In our opinion:
• the financial statements give a true and fair view of the state of the Group’s and of the parent company’s affairs as at 30 November 2014 and of the Group’s profit for the year then ended;
• the Group financial statements have been properly prepared in accordance with International Financial Reporting Standards as adopted by the European Union (IFRSs as adopted by the EU);
• the parent company financial statements have been properly prepared in accordance with IFRSs as adopted by the EU and as applied in accordance with the provisions of the Companies Act 2006; and
• the financial statements have been prepared in accordance with the requirements of the Companies Act 2006 and, as regards the Group financial statements, Article 4 of the IAS Regulation.
2. Our assessment of risks of material misstatement
In arriving at our audit opinion above on the financial statements the risk of material misstatement that had the greatest effect on our audit was as follows.
Long-term contracts (Revenue £69.6m; Receivables £0.2m; Payables £31.3m)
Refer to page 30 (Audit Committee statement), page 58 (accounting policy) and page 76 (financial disclosures).
• The risk – Long-term contracts including Building Schools for the Future implementation and managed service contracts and e-marking software and services contracts, represent a significant part of the Group’s business and the accounting is inherently judgemental. To determine the revenue to be recognised it is necessary to assess how far a contract has progressed. To decide the margin to be
recognised or loss to be provided, it is necessary to estimate future costs, including contingent amounts in respect of contract risks. Also, the Group may sign variations, extensions and/or new contracts with an existing customer and it is necessary to assess whether or not, for accounting purposes, these should be combined with an existing contract.
• Our response – Our audit procedures included, among others, making an assessment of the Group’s ability to forecast costs. We assessed the knowledge and skill of the Group’s project accounting staff by attending two project review meetings at which the progress of a number of contracts was discussed. We assessed the range and seniority of those present, the quality and relevance of documents prepared for discussion, the size of the financial variances for which explanations were sought and the extent of relevant technical and commercial information provided. Separately, we compared actual outturn to previous forecast for a number of contracts.
• We selected for detailed testing a number of long-term contracts based on the magnitude of revenue recognised in the year and risk indicators (such as contracts with a significant change in the estimate of lifetime revenue, margin or risk provision, loss making contracts and contracts with a large work in progress balance). For the contracts we selected, we read any variations, extensions and new contracts and considered, amongst other matters, whether the new agreement provided value to the customer on a stand-alone basis (and therefore should be treated as a separate contract) or whether, together with an existing contract, it was effectively a single project with an overall profit margin (and therefore should be accounted for as a revision to the existing contract). To evaluate whether revenue had been recognised appropriately for the selected contracts, we read the contract, determined the contract deliverables and obtained evidence of whether significant contract requirements had been met (for example, by inspecting a customer sign off). We assessed the completeness and accuracy of costs included in contract estimates, including those for specified contract risks, by reading the contract and customer

4747
correspondence and obtaining evidence to support selected inputs.
• Where a contract had been selected for detailed work during a prior year’s audit and the contract is now in a stable managed service phase, we determined whether revenue and margin in the current year was in line with our expectation. We also assessed the adequacy of the Group’s disclosure about estimation uncertainty regarding long-term contract outcome.
3. Our application of materiality and an overview of the scope of our audit
The materiality for the Group financial statements as a whole was set at £1.1 million determined with reference to a benchmark of Group profit before taxation, normalised to exclude this year’s restructuring charge, the gain on sale of operations and the increase in provision for dilapidations on leased properties and onerous lease contracts as disclosed in the Adjustments column on the face of the income statement, of which it represents 7%. We consider the adjusted Group profit before taxation to be one of the principal considerations for members of the Company in assessing the financial performance of the Group.
We report to the Audit Committee any corrected or uncorrected identified misstatements exceeding £55,000, in addition to other identified misstatements that warrant reporting on qualitative grounds.
Of the Group’s ten reporting components, we subjected four to audits for group reporting purposes and two to specified risk-focused audit procedures. The components for which we performed specified risk-focused procedures were not individually financially significant enough to require an audit for group reporting purposes, but did present specific individual risks that needed to be addressed. These group procedures covered 98% of total Group revenue; 99% of the total profits and losses that made up Group profit before tax; and 99% of total Group assets.
The Group audit team instructed component auditors as to the significant areas to be covered, and the information to be reported back. The Group audit team approved the component materialities, which ranged from £0.75 million to £1 million, having regard to the mix of size and risk profile of the Group across the components. The work on three of the six components was performed by component auditors and the rest by the Group audit team.
The Group audit team visited one component location in Nottingham, UK , including to assess the audit risk and strategy. Telephone meetings were held with the
component auditors in the UK and India. At these meetings, including the site visit, the findings reported to the Group audit team were discussed in more detail.
4. Our opinion on other matters prescribed by the Companies Act 2006 is unmodified
In our opinion:
• the part of the Directors’ Remuneration Report to be audited has been properly prepared in accordance with the Companies Act 2006; and
• the information given in the Strategic Report and Directors’ Report for the financial year for which the financial statements are prepared is consistent with the financial statements.
5. We have nothing to report in respect of the matters on which we are required to report by exception
Under ISAs (UK and Ireland) we are required to report to you if, based on the knowledge we acquired during our audit, we have identified other information in the annual report that contains a material inconsistency with either that knowledge or the financial statements, a material misstatement of fact, or that is otherwise misleading.
In particular, we are required to report to you if:
• we have identified material inconsistencies between the knowledge we acquired during our audit and the Directors’ statement that they consider that the annual report and financial statements taken as a whole is fair, balanced and understandable and provides the information necessary for shareholders to assess the Group’s performance, business model and strategy; or
• the section of the annual report describing the work of the Audit Committee does not appropriately address matters communicated by us to the Audit Committee.
Under the Companies Act 2006 we are required to report to you if, in our opinion:
• adequate accounting records have not been kept by the parent company, or returns adequate for our audit have not been received from branches not visited by us; or
• the parent company financial statements and the part of the Directors’ Remuneration Report to be audited are not in agreement with the accounting records and returns; or
• certain disclosures of Directors’ remuneration specified by law are not made; or

4848
• we have not received all the information and explanations we require for our audit.
Under the Listing Rules we are required to review:
• the Directors’ statement, set out on page 10, in relation to going concern; and
• the part of the Corporate Governance Statement on pages 21 to 24 relating to the Company’s compliance with the nine provisions of the 2010 UK Corporate Governance Code specified for our review.
We have nothing to report in respect of the above responsibilities.
Scope and responsibilities
As explained more fully in the Directors’ Responsibilities Statement set out on page 19, the Directors are responsible for the preparation of the financial statements and for being satisfied that they give a true and fair view. A description of the scope of an audit of financial statements is provided on the Financial Reporting Council’s website at www.frc.org.uk/auditscopeukprivate. This report is made solely to the Company’s members as a body and is subject to important explanations and disclaimers regarding our responsibilities, published on our website at www.kpmg.com/uk/auditscopeukco2014a, which are incorporated into this report as if set out in full and should be read to provide an understanding of the purpose of this report, the work we have undertaken and the basis of our opinions.
Tudor Aw (Senior Statutory Auditor) for and on behalf of KPMG LLP, Statutory Auditor
Chartered Accountants Arlington Business Park, Theale, Reading, RG7 4SD
2 February 2015

49
Consolidated Income Statement
Year ended 30 November 2014 Year ended 30 November 2013
Note
Adjusted
£000
Adjustments
£000
Total
£000
Adjusted
£000
Adjustments
£000
Total
£000
Revenue 3 202,544 - 202,544 261,759 - 261,759
Cost of sales (126,974) - (126,974) (187,793) - (187,793)
Gross profit 75,570 - 75,570 73,966 - 73,966
Operating expenses 5 (57,044) - (57,044) (56,757) - (56,757)
Amortisation of acquisition related intangible assets
13 - (303) (303) - (195) (195)
Impairment of goodwill 12 - - - - (328) (328)
Gain on sale of operations - 429 429 - 1,387 1,387
Share-based payment charges - (932) (932) - (507) (507)
Increase in provisions for onerous lease contracts
- (774) (774) - (2,627) (2,627)
Restructuring costs - (472) (472) - (5,128) (5,128)
Exceptional credit on settlement - - - - 543 543
(57,044) (2,052) (59,096) (56,757) (6,855) (63,612)
Profit from operations 5 18,526 (2,052) 16,474 17,209 (6,855) 10,354
Investment income 7 476 - 476 730 - 730
Finance costs 8 (924) (269) (1,193) (1,490) (159) (1,649)
Profit before tax 18,078 (2,321) 15,757 16,449 (7,014) 9,435
Tax 9 (4,359) 201 (4,158) (4,910) 1,643 (3,267)
Profit for the year 13,719 (2,120) 11,599 11,539 (5,371) 6,168
Earnings per ordinary share
10
- basic 16.4p (2.5)p 13.9p 12.6p (5.9)p 6.7p
- diluted 15.4p (2.4)p 13.0p 12.4p (5.8)p 6.6p
Paid and proposed dividends per share
11
- interim 0.96p 0.84p
- final 3.04p 2.46p
- special - 16.00p
Adjustments to results have been presented to give a better guide to business performance (see note 1).
All amounts were derived from continuing operations.

50
Consolidated Statement of Comprehensive Income
Note
Year ended 30 November 2014
£000
Year ended 30 November 2013
£000
Profit for the year 11,599 6,168
Items that will not be reclassified subsequently to profit or loss
Defined Benefit Pension Scheme remeasurements 23 (21,892) 1,442
Tax on items that will not be reclassified subsequently to profit or loss
9 4,378 (799)
Items that are or may be reclassified subsequently to profit or loss
Fair value gain/(loss) on hedged instruments 1,018 (435)
Exchange gain/(loss) on translation of overseas operations 81 (329)
Tax on items that are or may be reclassified subsequently to profit or loss
9 657 73
Other comprehensive expense (15,758) (48)
Total comprehensive (expense)/income for the year attributable to equity holders
(4,159) 6,120

51
Consolidated Statement of Changes in Equity
Note
Share
capital
£000
Share
premium
£000
Own shares
£000
Capital
redemption
reserve
£000
Hedging
reserve
£000
Translation
reserve
£000
Retained
earnings
£000
Total
£000
At 1 December 2012 1,870 26,997 (2,972) 94 (39) (56) (662) 25,232
Profit for the year - - - - - - 6,168 6,168
Other comprehensive income/(expense)
- - - - (435) (329) 716 (48)
Total comprehensive income
- - - - (435) (329) 6,884 6,120
Transactions with owners of the Company
Share-based payment fair value charges
25 - - - - - - 507 507
Dividends paid 11 - - - - - - (2,834) (2,834)
At 30 November 2013 1,870 26,997 (2,972) 94 (474) (385) 3,895 29,025
Profit for the year - - - - - - 11,599 11,599
Other comprehensive income/(expense)
- - - - 1,018 81 (16,857) (15,758)
Total comprehensive income/(expense)
- - - - 1,018 81 (5,258) (4,159)
Transactions with owners of the Company
Shares issued 22 19 21 (18) - - - - 22
Share-based payment awards exercised
- - 40 - - - (40) -
Share-based payment fair value charges
25 - - - - - - 932 932
Dividends paid 11 - - - - - - (17,706) (17,706)
At 30 November 2014 1,889 27,018 (2,950) 94 544 (304) (18,177) 8,114

52
Consolidated Balance Sheet
Note
At 30 November 2014 £000
At 30 November 2013 £000
Non-current assetsGoodwill 12 14,067 14,067 Acquisition related intangible assets 13 461 764 Other intangible assets 13 537 1,026 Property, plant and equipment 14 8,040 9,099 Other receivables 18 1,878 1,911 Deferred tax assets 9 8,147 4,622
33,130 31,489 Current assets
Inventories 16 10,604 10,549 Trade and other receivables 18 32,928 35,134 Tax assets 821 340 Cash and short-term deposits 19 47,893 63,169
92,246 109,192 Total assets 125,376 140,681 Current liabilities
Trade and other payables 20 (79,085) (78,917)Tax liabilities (600) - Provisions 21 (3,660) (7,201)
(83,345) (86,118)Net current assets 8,901 23,074 Non-current liabilities
Other payables 20 (1,657) (3,455)Provisions 21 (5,507) (6,255)Defined Benefit Pension Scheme obligation 23 (26,753) (15,828)
(33,917) (25,538)Total liabilities (117,262) (111,656)Net assets 8,114 29,025 Equity attributable to shareholders
Share capital 22 1,889 1,870 Share premium account 27,018 26,997 Own shares 24 (2,950) (2,972)Capital redemption reserve 94 94 Hedging reserve 544 (474)Translation reserve (304) (385)Retained earnings - (deficit)/earnings (18,177) 3,895
Total equity 8,114 29,025
These Financial Statements of RM plc, registered number 01749877, were approved and authorised for issue by the Board of Directors on 2 February 2015.
On behalf of the Board of Directors,
David Brooks Iain McIntosh Director Director

53
Consolidated Cash Flow Statement
Note
Year ended 30 November 2014
£000
Year ended 30 November 2013
£000
Profit before tax 15,757 9,435 Investment income (476) (730)Finance costs 1,193 1,649 Profit from operations 16,474 10,354 Adjustments for:
Impairment of goodwill 12 - 328 Amortisation of acquisition related intangible assets 13 303 195 Amortisation of other intangible assets 13 417 582 Depreciation and impairment of property, plant and equipment 14 3,415 3,919 Gain on sale of operations (429) (1,387)Loss on disposals of other intangible assets 73 736 Gain on disposals of property, plant and equipment (398) (118)(Gain)/loss on foreign exchange derivatives (83) 75 Share-based payment charge 932 507 Increase in provisions 1,339 7,777 Defined Benefit Pension Scheme administration cost 23 475 391
Operating cash flows before movements in working capital 22,518 23,359 (Increase)/decrease in inventories (55) 4,238 Decrease in receivables 2,792 20,383 Decrease in payables:
- decrease in trade and other payables (708) (10,779) - decrease in onerous lease and dilapidations provisions 21 (836) (1,331) - decrease in employee-related restructuring provisions 21 (4,348) (1,155) - decrease in other provisions 21 (289) (52)
Cash generated from operations 19,074 34,663 Defined benefit pension Scheme cash contributions 23
- deficit catch-up payments and Scheme expenses (3,821) (4,384) - pension escrow account (8,000) -
Tax paid (2,527) (1,790)Borrowing facilities arrangement and commitment fees (353) (451)Interest paid - (20)Income on sale of finance lease debt 7 55 289 Net cash inflow from operating activities 4,428 28,307 Investing activities
Interest received 7 403 441 Repayment of loans by third parties 33 - Proceeds of sale of operations - 336 Proceeds on disposal of property, plant and equipment 661 420 Purchases of property, plant and equipment 14 (2,597) (1,980)Purchases of other intangible assets 13 (1) (68)Increase in short-term deposits 19 - (6,000)
Net cash used in investing activities (1,501) (6,851)Financing activities
Dividends paid 11 (3,028) (2,834)Special dividend paid 11 (14,678) - (Repayment of)/net proceeds from vehicle finance leases (530) 771 Proceeds of share capital issue, net of share issue costs 22 -
Net cash used in financing activities (18,214) (2,063)Net (decrease)/increase in cash and cash equivalents (15,287) 19,393 Cash and cash equivalents at the beginning of the year 57,169 37,823 Effect of foreign exchange rate changes 11 (47)Cash and cash equivalents at the end of the year 19 41,893 57,169

54
Company Statement of Changes in Equity
Note
Share
capital
£000
Share
premium
£000
Own shares
£000
Capital
redemption
reserve
£000
Retained
earnings
£000
Total
£000
At 1 December 2012 1,870 26,997 (2,972) 94 27,105 53,094
Profit for the year - - - - 6,117 6,117
Total comprehensive income - - - - 6,117 6,117
Transactions with owners of the Company
Share-based payment fair value charges 25 - - - - 507 507
Dividends paid 11 - - - - (2,834) (2,834)
At 30 November 2013 1,870 26,997 (2,972) 94 30,895 56,884
Profit for the year - - - - 6,281 6,281
Total comprehensive income - - - - 6,281 6,281
Transactions with owners of the Company
Shares issued 22 19 21 (18) - - 22
Share-based payment awards exercised - - 40 - (40) -
Share-based payment fair value charges 25 - - - - 932 932
Dividends paid 11 - - - - (17,706) (17,706)
At 30 November 2014 1,889 27,018 (2,950) 94 20,362 46,413
As permitted by section 408 of the Companies Act 2006, no separate income statement is presented for the parent company, RM plc.

55
Company Balance Sheet
Note
At 30 November 2014 £000
At 30 November 2013 £000
Non-current assets
Investments 15 64,255 55,548
Other receivables 18 1,628 1,661
65,883 57,209
Current assets
Trade and other receivables 18 14,372 104
Tax assets 53 -
14,425 104
Total assets 80,308 57,313
Current liabilities
Amounts owed to Group undertakings 20 (29,002) -
Net current (liabilities)/assets (14,577) 104
Non-current liabilities
Provisions 21 (4,893) (429)
Total liabilities (33,895) (429)
Net assets 46,413 56,884
Equity attributable to equity holders
Share capital 22 1,889 1,870
Share premium account 27,018 26,997
Own shares 24 (2,950) (2,972)
Capital redemption reserve 94 94
Retained earnings 20,362 30,895
Total equity 46,413 56,884
These Financial Statements of RM plc, registered number 01749877, were approved and authorised for issue by the Board of Directors on 2 February 2015.
On behalf of the Board of Directors,
David Brooks Iain McIntosh Director Director
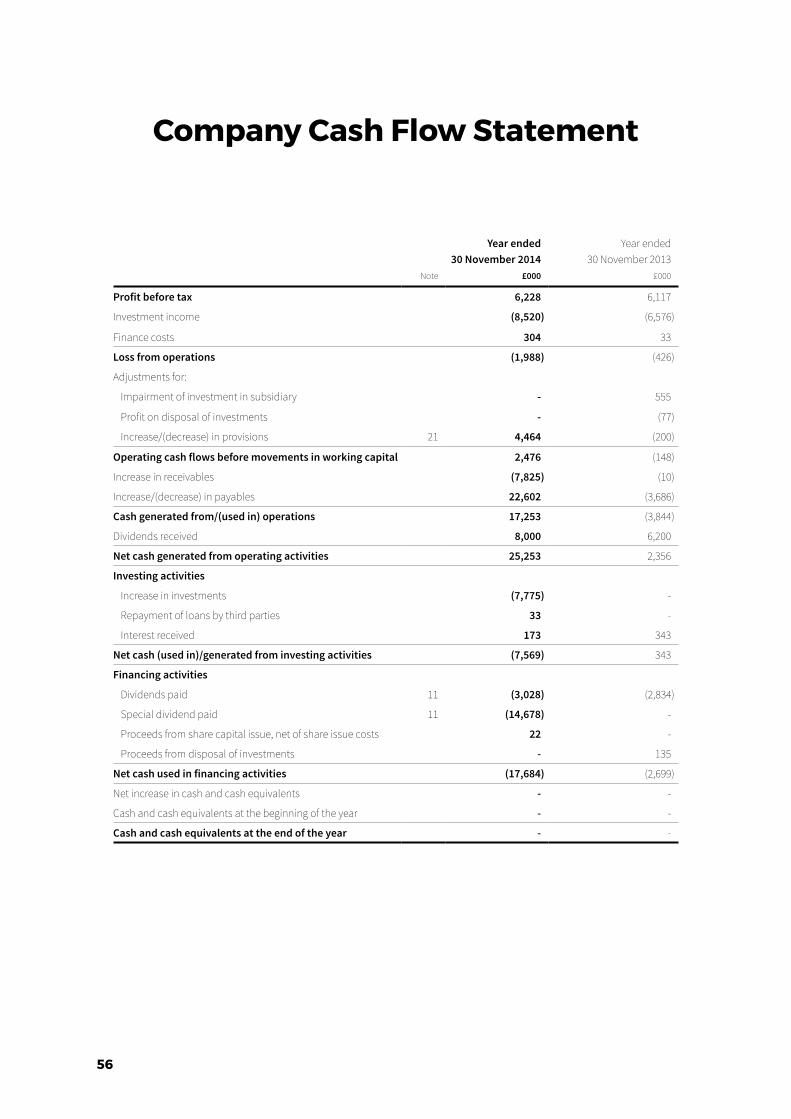
56
Company Cash Flow Statement
Note
Year ended 30 November 2014
£000
Year ended 30 November 2013
£000
Profit before tax 6,228 6,117
Investment income (8,520) (6,576)
Finance costs 304 33
Loss from operations (1,988) (426)
Adjustments for:
Impairment of investment in subsidiary - 555
Profit on disposal of investments - (77)
Increase/(decrease) in provisions 21 4,464 (200)
Operating cash flows before movements in working capital 2,476 (148)
Increase in receivables (7,825) (10)
Increase/(decrease) in payables 22,602 (3,686)
Cash generated from/(used in) operations 17,253 (3,844)
Dividends received 8,000 6,200
Net cash generated from operating activities 25,253 2,356
Investing activities
Increase in investments (7,775) -
Repayment of loans by third parties 33 -
Interest received 173 343
Net cash (used in)/generated from investing activities (7,569) 343
Financing activities
Dividends paid 11 (3,028) (2,834)
Special dividend paid 11 (14,678) -
Proceeds from share capital issue, net of share issue costs 22 -
Proceeds from disposal of investments - 135
Net cash used in financing activities (17,684) (2,699)
Net increase in cash and cash equivalents - -
Cash and cash equivalents at the beginning of the year - -
Cash and cash equivalents at the end of the year - -
57
Notes to the Financial Statements
1. General informationRM plc (‘Company’) is incorporated in the United Kingdom and listed on the London Stock Exchange. It is the parent company of a group of companies (‘Group’) whose business activities and financial position, together with the factors likely to affect its future development, performance and position, and risk management policies are presented in the Strategic Report and the Directors’ Report.
Consolidated Income Statement presentation
The Income Statement is presented in three columns. This presentation is intended to give a better guide to business performance by separately identifying the following adjustments to profit which are considered exceptional in nature or with potential significant variability year on year in non-cash items which might mask underlying trading performance: the amortisation of acquisition related intangible assets; the impairment of goodwill; the gain/loss on sale of operations; share-based payment charges; restructuring costs; changes in the provision for onerous lease contracts; and exceptional credit on settlement. The columns extend down the Income Statement to allow the tax and earnings per share impacts of these transactions to be disclosed. Equivalent material adjustments to profit arising in future years, including increases in or reversals of items recorded, will be disclosed in a consistent manner.
2. Significant accounting policiesThe accounting policies are drawn up in accordance with those International Accounting Standards (IAS) and International Financial Reporting Standards (IFRS) issued by the International Accounting Standards Board (IASB) and adopted for use in the EU and therefore comply with Article 4 of the EU IAS Regulation applied in accordance with the provisions of the Companies Act 2006.
These accounting policies have been consistently applied to the years presented unless otherwise specified.
The Financial Statements are prepared on a going concern basis. The Directors’ reasons for continuing to adopt this basis are set out in the Going Concern section of the Strategic Report.
Basis of preparation
The Financial Statements have been prepared on the historical cost basis except for certain financial instruments, share-based payments and pension assets and liabilities which are measured at fair value. The preparation of financial statements, in conformity with generally accepted accounting principles, requires the use of estimates and assumptions that affect the reported amounts of assets and liabilities and disclosure of contingent assets and liabilities at the date of the financial statements and the reported amounts of revenues and expenses during the reporting period. Although these estimates are based on the Directors’ best knowledge of current events and actions, actual results ultimately may differ from those estimates.
Consolidation
The Group Financial Statements incorporate the Financial Statements of the Company and all its subsidiaries for the periods during which they were members of the Group.
Inter-company balances and transactions between Group companies are eliminated on consolidation. On acquisition, assets and liabilities of subsidiaries are measured at their fair values at the date of acquisition with any excess of the cost of acquisition over this value being capitalised as goodwill.
Investment in subsidiaries
In the Company Financial Statements, investments in subsidiaries are stated at cost less any provision for impairment where appropriate.
Business combinations
The acquisition of subsidiaries is accounted for using the acquisition method. The cost of the acquisition is measured at the aggregate of the fair values, at the date of exchange, of assets given and liabilities incurred or assumed in exchange for control. The acquired company’s identifiable assets, liabilities and contingent liabilities that meet the conditions for recognition under IFRS 3 Business Combinations are recognised at their fair value at the acquisition date.

5858
Revenue
Revenue represents amounts receivable for goods supplied and services provided to third parties net of VAT and other sales-related taxes.
Revenue from the sale of goods and services is recognised upon transfer to the customer of the significant risks and rewards of ownership. This is generally when goods are despatched to, or services performed for, customers. Revenue on hardware and perpetual software licences is recognised on shipment providing there are no unfulfilled obligations that are essential to the functionality of the delivered product and with consideration of any significant credit risk uncertainty. If such obligations exist, revenue is recognised as they are fulfilled. Revenue from term licences is spread over the period of the licence, reflecting the Group’s obligation to support the relevant software products or update their content over the term of the licence. Revenue from contracts for maintenance, support and annually and other periodically contracted products and services is recognised on a pro-rata basis over the contract period. Revenue from installation, consultancy and other services is recognised when the service has been provided. For multiple element arrangements revenue is allocated to each element on a fair value basis. The portion of the revenue allocated to an element is recognised when the revenue recognition criteria for that element have been met. Appropriate provisions for returns, trade discounts and other allowances are deducted from revenue. Where customer payments are received in advance of the recognition of revenue, the amount is included within deferred income and is aged dependent upon the estimated recognition profile.
Long-term contracts
Revenue on long-term contracts is recognised while contracts are in progress. Revenue is recognised proportionally to the stage of completion of the contract, based on the fair value of goods and services provided to date, taking into account the sign-off of milestone delivery by customers.
Long-term contracts represent those accounted for in accordance with the principles of IAS 18 Revenue and related linkage with IAS 11 Construction Contracts.
Profit on long-term contracts is recognised when the outcome of the contract can be assessed with reasonable certainty, including assessment of contingent and uncertain future expenses. Thereafter profit is recognised based upon the expected outcome of the contract and the revenue recognised at the balance sheet date as a proportion of total contract revenue.
If the outcome of a long-term contract cannot be assessed with reasonable certainty, no profit is recognised. Any expected loss on a contract as a whole, is
recognised as soon as it is foreseen. The loss is calculated using a discounted cash flow model utilising a discount rate that reflects an estimate of the market’s assessment of the time value of money and the risks specific to the liability. Any unwinding of the discount is included in the Income Statement in finance costs.
Where the cumulative fair value of goods and services provided exceeds amounts invoiced the balance is included within trade and other receivables as long-term contract balances. Where amounts invoiced exceed the fair value of goods and services provided the excess is first set off against long-term contract balances and then included in amounts due to long-term contract customers within trade and other payables.
Pre-contract costs are expensed until the awarding of the contract to the Group is considered to be virtually certain which is not before the Group has been appointed sole preferred bidder. Once virtual certainty has been established and the contract is expected to be awarded within a reasonable timescale and pre-contract costs are expected to be recovered from the contract’s net cash flows, then pre-contract costs are recognised as an asset and accounted for as long-term contract costs.
Intangible assets
All intangible assets, except goodwill, are stated at cost less accumulated amortisation and any accumulated impairment losses.
Goodwill
Goodwill represents the amount by which the fair value of the cost of a business combination exceeds the fair value of net assets acquired. Goodwill is not amortised and is stated at cost less any accumulated impairment losses. For business combinations occurring before 1 October 2004, the Group’s transition date to IFRS, the cost of goodwill is deemed to be the UK GAAP net book value at this date.
The recoverable amount of goodwill is tested for impairment annually or when events or changes in circumstance indicate that it might be impaired. Impairment charges are deducted from the carrying value and recognised immediately in profit or loss. For the purpose of impairment testing, goodwill is allocated to each of the Group’s cash generating units expected to benefit from the synergies of the combination. If the recoverable amount of the cash generating unit is less than the carrying amount of the unit, the impairment loss is allocated first to reduce the carrying amount of any goodwill allocated to the unit and then to the other assets of the unit pro-rata on the basis of the carrying amount of each asset in the unit. An impairment loss recognised for goodwill is not reversed in a subsequent period.

59
Research and development costs
Research and development costs associated with the development of software products or enhancements and their related intellectual property rights are expensed as incurred until all of the following criteria can be demonstrated, in which case they are capitalised as an intangible asset:
a. the technical feasibility of completing the intangible asset so that it will be available for use or sale; and
b. an intention to complete the intangible asset and use or sell it; and
c. ability to use or sell the intangible asset; and
d. how the intangible asset will generate probable future economic benefits. Among other things, the Group can demonstrate the existence of a market for the output of the intangible asset or the intangible asset itself or, if it is to be used internally, the usefulness of the intangible asset; and
e. the availability of adequate technical, financial and other resources to complete the development and to use or sell the intangible asset; and
f. an ability to measure reliably the expenditure attributable to the intangible asset during its development.
The technological feasibility for the Group’s software products is assessed on an individual basis and is generally reached shortly before the products or services are released, and late in the development cycle. Capitalised development costs are amortised on a straight-line basis over their useful lives, once the product is available for use. Useful lives are assessed on a project-by-project basis.
Other intangible assets
Intangible assets purchased separately, such as software licences that do not form an integral part of hardware and the costs of internally generated software for the Group’s use, are capitalised at cost and amortised over their useful lives of 2-8 years.
For business combinations occurring after 1 October 2004, net assets acquired includes an assessment of the fair value of separately identifiable acquisition related intangible assets, in addition to other assets, liabilities and contingent liabilities purchased. These are amortised over their useful lives which are individually assessed.
Property, plant and equipment
Property, plant and equipment assets are stated at cost, less accumulated depreciation and any accumulated impairment losses where appropriate.
Property, plant and equipment are depreciated by equal annual instalments to write down the assets to their estimated disposal value at the end of their useful lives as follows:
Freehold property Up to 50 years
Leasehold building improvements Up to 25 years
Plant and equipment 3 - 10 years
Computer equipment 2 - 5 years
Vehicles 2 - 4 years
Impairment of tangible and intangible assets excluding goodwill
At each balance sheet date, the Group reviews the carrying amounts of its tangible and intangible assets to determine whether there is any indication that those assets have suffered an impairment loss. If any such indication exists, the recoverable amount of the asset is estimated in order to determine the extent of any impairment loss. Where the asset does not generate cash flows that are independent from other assets, the Group estimates the recoverable amount of the cash generating unit to which the asset belongs.
The recoverable amount is the higher of fair value less costs to sell and value in use. In assessing value in use, the estimated future cash flows are discounted to their present value using a pre-tax discount rate that reflects current market assessments of the time value of money and the risks specific to the asset for which the estimates of future cash flows have not been adjusted.
If the recoverable amount of an asset (or cash generating unit) is estimated to be less than its carrying amount, the carrying amount of the asset (or cash generating unit) is reduced to its recoverable amount. An impairment loss is recognised as an expense immediately.
Where an impairment loss subsequently reverses, the carrying amount of the asset (or cash generating unit) is increased to the revised estimate of its recoverable amount, but so that the increased carrying amount does not exceed the carrying amount that would have been determined had no impairment loss been recognised for the asset (or cash generating unit) in prior periods. A reversal of an impairment loss is recognised as income immediately.

6060
Financial instruments
Trade receivables
Trade receivables are not interest bearing and are stated at their original invoiced value reduced by appropriate allowances for estimated irrecoverable amounts.
Cash and short-term deposits
Cash comprises cash at bank and in hand and deposits with a maturity of three months or less. Bank overdrafts are included in cash only to the extent that the Group has the right of set-off. Short-term deposits represent cash deposited with a maturity period in excess of three months and where the deposited amounts cannot be recalled on demand.
Trade and other payables
Trade payables on normal terms are not interest bearing and are stated at original invoiced amount.
Derivative financial instruments
The Group holds derivative financial instruments to hedge its foreign currency exposure.
On initial designation of the derivative as the hedging instrument, the Group formally documents the relationship between the hedging instrument and hedged item, including the risk management objectives and strategy in undertaking the hedge transaction and the hedged risk, together with the methods that will be used to assess the effectiveness of the hedging relationship. The Group makes an assessment, both at the inception of the hedge relationship as well as on an ongoing basis, as to whether the hedging instruments are expected to be “highly effective” in offsetting the changes in the fair value or cash flows of the respective hedged items attributable to the hedged risk, and whether the actual results of each hedge are within a range of 80 – 125 percent. For a cash flow hedge of a forecast transaction, the transaction should be highly probable to occur and should present an exposure to variations in cash flows that could ultimately affect reported profit or loss.
Derivatives are recognised initially at fair value and attributable transaction costs are recognised in profit or loss as incurred. Subsequent to initial recognition, derivatives are measured at fair value, and changes therein are accounted for as described below. Fair value measurements are classified using a fair value hierarchy that reflects the significance of the accuracy of inputs used in making the measurements.
Cash flow hedges
When a derivative is designated as the hedging instrument in a hedge of the variability in cash flows attributable to a particular risk associated with a recognised asset or liability or a highly probable forecast transaction that could affect profit or loss, the effective portion of changes in the fair value of the derivative is recognised in Other Comprehensive Income and presented in the hedging reserve in equity. Any ineffective portion of changes in the fair value of the derivative is recognised immediately in profit or loss.
When the hedged item is a non-financial asset, the amount accumulated in equity is included in the carrying amount of the asset when the asset is recognised. In other cases the amount accumulated in equity is reclassified to profit or loss in the same period that the hedged item affects profit or loss. If the hedging instrument no longer meets the criteria for hedge accounting, expires or is sold, terminated or exercised, or the designation is revoked, then hedge accounting is discontinued prospectively. If the forecast transaction is no longer expected to occur, then the balance in equity is reclassified in profit or loss.
Other non-trading derivatives
When a derivative financial instrument is not designated in a hedge relationship that qualifies for hedge accounting, all changes in its fair value are recognised immediately in profit or loss.
Inventories
Finished goods and work-in-progress are valued at cost on a first in first out basis, including appropriate labour costs and other overheads. Raw materials and bought in finished goods are valued at purchase price. Stocks are recognised when the Group has the rights and obligations of ownership, which in the case of supply from the Far East may be from the point of production or the point of shipment. All inventories are reduced to net realisable value where lower than cost. Provision is made for obsolete, slow moving and defective items where appropriate.
Provisions
A provision is recognised if, as a result of a past event, the Group has a present legal or constructive obligation that can be estimated reliably, and it is probable that an outflow of economic benefits will be required to settle the obligation. Provisions are determined by discounting the expected future cash flows at a pre-tax rate that reflects current market assessments of the time value of money and the risks specific to the liability. The unwinding of the discount is recognised as a finance cost.

61
Restructuring
A provision for restructuring is recognised when the Group has approved a detailed and formal restructuring plan, and the restructuring either has commenced or has been announced publicly. Future operating losses are not provided for.
Onerous contracts
A provision for onerous contracts is recognised when the expected benefits to be derived by the Group from a contract are lower than the unavoidable cost of meeting its obligations under the contract. The provision is measured at the present value of the lower of the expected cost of terminating the contract and the expected net cost of continuing with the contract. Before a provision is established, the Group recognises any impairment loss on the assets associated with that contract.
Dilapidations provision
A dilapidations provision is recognised when the Group has an obligation to rectify, repair or reinstate a leased premises to a certain condition in accordance with the lease agreement. The provision is measured at the present value of the estimated cost of rectifying, repairing or reinstating the leased premises at a specified future date. To the extent that future economic benefits associated with leasehold improvements are expected to flow to the Group, this cost is capitalised within the leasehold improvement category of property, plant and equipment and is depreciated over its useful economic life.
Leases
Where assets are financed by leasing agreements which give rights approximating to ownership, the assets are treated as if they had been purchased outright. The amount capitalised is the lower of the fair value or the present value of the minimum lease payments during the lease term determined at the inception of the lease. The assets are depreciated over the shorter of the lease term or their useful life. Obligations relating to finance leases, net of finance charges in respect of future periods, are included, as appropriate, under other payables due within or after one year. The finance charge element of rentals is charged to finance costs in the Income Statement over the lease term.
All other leases are classified as operating leases, the rentals of which are charged to the Income Statement on a straight line basis over the lease term.
Share-based payments
The Group operates a number of executive and employee share schemes. For all grants of share-based payments, the fair value as at the date of grant is calculated using
a pricing model and the corresponding expense is recognised over the vesting period. Where the vesting period is shortened after the date of grant, the remaining expense, is recognised over the shortened vesting period. Over the vesting period and at vesting the cumulative expense is adjusted to take into account the number of awards expected to or actually vesting as a result of survivorship and where this reflects non-market-based performance conditions. Share-based payment charges which are incurred by a subsidiary undertaking are included as an increase in Investments in subsidiary undertakings within the parent company, and a capital contribution in the subsidiary.
Employee benefits
The Group has both defined benefit and defined contribution pension schemes. For the Defined Benefit Pension Scheme, based on the advice of a qualified independent actuary at each balance sheet date and using the projected unit method, the administrative expenses are charged to operating profit, with the interest cost, net of interest on scheme assets, reported as a financing item. Defined benefit pension scheme remeasurements are recognised directly in equity such that the balance sheet reflects the Scheme’s surplus or deficit as at the balance sheet date.
Contributions to defined contribution plans are charged to operating profit as they become payable.
Employee Share Trust
The Employee Share Trust, which holds ordinary shares of the Company in connection with certain share schemes, is consolidated into the Financial Statements. Any consideration paid to the Trust for the purchase of the Company’s own shares is shown as a movement in shareholders’ equity.
Taxation
Current tax, including UK corporation tax and foreign tax, is provided at amounts expected to be paid or recovered using the tax rates and laws that have been enacted or substantively enacted by the balance sheet date.
Deferred taxation is accounted for using the balance sheet liability method in respect of temporary differences arising from differences between the carrying amount of assets and liabilities in the Financial Statements and the corresponding tax bases used in computation of taxable profit. Deferred tax liabilities are recognised for all taxable temporary differences except in respect of investments in subsidiaries where the Group is able to control the reversal of the temporary difference and it is probable that the temporary difference will not reverse in the foreseeable future.

6262
Current tax balances are offset when there is a legally enforceable right to set off current tax assets against current tax liabilities.
Deferred tax assets are recognised to the extent that it is probable that future taxable profit will be available against which the temporary difference can be utilised. Their carrying amount is reviewed at each balance sheet date on the same basis.
Deferred tax is measured on an undiscounted basis, and at the tax rates that are expected to apply in the periods in which the asset or liability is settled. It is recognised in the Income Statement except when it relates to items credited or charged directly to equity, in which case the deferred tax is also presented in equity. Deferred tax assets and liabilities are offset when they relate to income taxes levied by the same taxation authority and when the Group intends to settle its current tax assets and liabilities on a net basis.
Foreign currencies
The Group presents its Financial Statements in Sterling because this is the currency in its primary operating environment. Balance sheet items of subsidiary undertakings whose functional currency is not Sterling are translated into Sterling at the period-end rates of exchange. Income Statement items and the cash flows of subsidiary undertakings are translated at the average rates for the period. Exchange differences on the translation of subsidiary opening net assets at closing rates of exchange and the differences arising between the translation of profits at average and closing exchange rates are recorded as movements in the currency translation reserve.
Transactions denominated in foreign currencies are translated into Sterling at rates prevailing at the dates of the individual transactions. Foreign currency monetary assets and liabilities are translated at the rates prevailing at the balance sheet date. Exchange gains and losses arising are charged or credited to the Income Statement within operating costs. Foreign currency non-monetary amounts are translated at rates prevailing at the time of establishing the fair value of the asset or liability.
Dividends
Dividends are recognised as a liability in the period in which the shareholders’ right to receive payment has been established.
Key sources of estimation uncertainty and critical accounting judgements
In applying the Group’s accounting policies the Directors are required to make judgements, estimates and assumptions. Actual results may differ from these estimates. The Group’s key risks are set out in the
Strategic Report and give rise to the following estimations and judgements which are disclosed within the relevant note to the Annual Report and Financial Statements:
• Long-term contract outcome – see note 17
• Defined Benefit Pension Scheme valuation – see note 23
• Onerous lease provision – see note 21
• Goodwill valuation and impairment – see note 12
Adoption of new and revised International Financial Reporting Standards
The IFRIC interpretations, amendments to existing standards and new standards that are mandatory and relevant for the Company’s accounting periods beginning on or after 1 December 2013 have been adopted. The following new standards and interpretations have been adopted in the current period but have not impacted the reported results or the financial position:
• IFRS 1 First time Adoption of IFRS, amendments to repeat application, borrowing costs
• IFRS 2 Share-based Payment amendment for grant dates after 30 June 2014
• IFRS 3 Business Combinations amendment for acquisitions after 30 June 2014
• IFRS 7 Financial Instruments: Disclosures, amendments relating to offsetting of assets and liabilities
• IFRS 10 Consolidated Financial Statements
• IFRS 11 Joint Arrangements
• IFRS 12 Disclosure of Interests in Other Entities
• IFRS 13 Fair Value Measurement
• IAS 1 Presentation of Financial Statements amendment relating to comparative information
• IAS 16 Property, Plant and Equipment amendment relating to servicing equipment
• IAS 27 Separate Financial Statements (2011)
• IAS 28 Investments in Associates and Joint Ventures issued 2011
• IAS 32 Financial Instruments: Presentation amendments relating to offsetting of assets and liabilities, and tax effect of equity distributions
• IAS 33 Interim Reporting amendment relating to interim reporting of segment assets

63
New standards and interpretations not yet adopted
At the date of authorisation of these Financial Statements, the following Standards and Interpretations which have not been applied in these Financial Statements were in issue but not yet effective/endorsed (and in some cases had not yet been adopted by the EU):
• IFRS 2 Share-based Payment amendments
• IFRS 3 Business Combinations amendments
• IFRS 5 Non-current Assets Held for Sale and Discontinued Operations amendments
• IFRS 7 Financial Instruments: Disclosure amendments in connection with IFRS 9
• IFRS 8 Operating Segments amendments
• IFRS 9 Financial Instruments as amended 2014
• IFRS 10 Consolidated Financial Statements amendments
• IFRS 11 Joint Arrangements amendments
• IFRS 12 Disclosure of Interests in Other Entities amendments
• IFRS 13 Fair Value Measurement
• IFRS 14 Regulatory Deferral Accounts
• IFRS 15 Revenue from Contracts with Customers
• IAS 16 Property, Plant and Equipment amendments
• IAS 19 Employee Benefits amendments
• IAS 24 Related Party Disclosure amendments
• IAS 27 Separate Financial Statements amendments
• IAS 28 Investments in Associates amendments
• IAS 34 Interim Financial Reporting amendments
• IAS 36 Impairment of Assets amendments
• IAS 38 Intangible Assets amendments
• IAS 39 Financial Instruments: Recognition and Measurement amendments
• IAS 40 Investment Properties amendments
• IAS 41 Agriculture amendments
• IFRIC 21 Levies
The Directors are finalising their analysis and do not expect that the adoption of the standards listed above will have a material impact on the Financial Statements of the Company and Group in future periods, except potentially for IFRS 7 and IFRS 9 (measurement and disclosure of financial instruments), and IFRS 15 (revenue and deferred income). IFRS 15 will first apply for the year ended 30 November 2018, and an exercise to investigate the impact on the Group is planned during the coming financial year.
3. Revenue
Year ended 30 November 2014
£000
Year ended 30 November 2013
£000
Revenue from supply of products 93,998 136,307
Revenue from rendering of services 92,807 107,494
Revenue from the sale of licences and receipt of royalties 15,739 17,958
Total revenue 202,544 261,759

6464
4. Operating segmentsThe Group’s business is supplying products, services and solutions to the UK and international education markets.
The Group is structured into three operating divisions: RM Resources (previously known as Education Resources), RM Results (previously Assessment and Data Services) and RM Education (previously Education Technology).
A full description of each division, together with comments on its performance and outlook, is given in the Strategic report.
This Segmental analysis shows the result and assets of these divisions. Revenue is that earned by the Group from third parties.
Segmental results
Year ended 30 November 2014RM Resources
£000
RM Results £000
RM Education £000
Corporate Services
£000
Total
£000
Revenue
UK 53,903 27,136 110,712 - 191,751
Europe 4,052 37 315 - 4,404
North America 994 - 206 - 1,200
Asia 2,980 119 - - 3,099
Rest of the world 875 535 680 - 2,090
62,804 27,827 111,913 - 202,544
Adjusted profit from operations 10,330 4,648 7,700 (4,152) 18,526
Investment income 476
Adjusted finance costs (924)
Adjusted profit before tax 18,078
Adjustments (see note 1) (2,321)
Profit before tax 15,757
Year ended 30 November 2013RM Resources
£000
RM Results £000
RM Education £000
Corporate Services
£000
Total £000
Revenue
UK 46,458 23,515 180,661 - 250,634
Europe 3,248 2,718 352 35 6,353
North America 575 - 22 - 597
Asia 2,764 312 26 - 3,102
Rest of the world 963 - 110 - 1,073
54,008 26,545 181,171 35 261,759
Adjusted profit from operations (see note below)
7,164 4,268 9,406 (3,629) 17,209
Investment income 730
Adjusted finance costs (1,490)
Adjusted profit before tax 16,449
Adjustments (see note 1) (7,014)
Profit before tax 9,435

65
In the year ended 30 November 2014 Corporate Services adjusted profit from operations includes £1,272,000 in respect of costs paid by the Group related to the Defined Benefit Pension Scheme. In 2013 the equivalent costs of £897,000 have been consistently allocated to Corporate Services, with no impact on overall adjusted profit from operations.
Year ended 30 November 2013RM Resources
£000
RM Results £000
RM Education £000
Corporate Services
£000
Total £000
Adjusted profit from operations as previously disclosed
7,164 4,134 8,643 (2,732) 17,209
Adjustment in respect of costs paid by the Group related to the Defined Benefit Pension Scheme
- 134 763 (897) -
Segmental profit for 2013 comparable to 2014
7,164 4,268 9,406 (3,629) 17,209
Segmental assets
At 30 November 2014RM Resources
£000
RM Results £000
RM Education £000
Corporate Services
£000
Total
£000
Segmental 33,970 6,636 27,334 353 68,293
Other 57,083
Total assets 125,376
At 30 November 2013RM Resources
£000
RM Results
£000
RM Education
£000
Corporate Services
£000
Total
£000
Segmental 31,794 6,890 33,728 221 72,633
Other 68,048
Total assets 140,681
Included within the disclosed segmental assets are non-current assets (excluding deferred tax assets) of £24,552,000 (2013: £26,311,000) located in the United Kingdom and £432,000 (2013: £556,000) located in India. Other non-segmented assets includes other receivables, tax assets and cash and short-term deposits.

6666
5. Profit for the yearProfit for the year is stated after charging/(crediting):
Note
Year ended 30 November 2014
£000
Year ended 30 November 2013
£000
Amortisation of acquisition related intangible assets 13 303 195
Amortisation of other intangible assets 13 417 582
Impairment of goodwill 12 - 328
720 1,105
Depreciation of property, plant and equipment:
- charged in cost of sales 992 1,475
- charged in operating expenses 1,668 2,444
14 2,660 3,919
Impairment of property plant and equipment 755 -
3,415 3,919
Selling and distribution costs 27,922 31,204
Research and development costs 10,520 10,665
Administrative expenses - adjusted 18,602 14,888
Operating expenses - adjusted 57,044 56,757
Adjustments to administrative expenses (see Consolidated Income Statement)
2,052 6,855
Total operating expenses 59,096 63,612
Gain on disposals of property, plant and equipment (398) (118)
Loss on disposals of other intangible assets 73 736
Cost of inventories recognised as expense 54,290 89,801
Staff costs 6 69,147 87,247
Operating lease expense 4,070 4,348
Foreign exchange loss 156 354
(Decrease)/increase in inventory obsolescence provision (1,394) 983
Fees payable to the Company's auditor
Fees payable to the Company's auditor for the audit of these Financial Statements:
- the audit of the Company's Financial Statements 16 15
- the audit of the Company's subsidiaries pursuant to legislation 167 162
Other fees payable to the Company's auditor:
- other services pursuant to legislation 15 14
- tax compliance services - 7
- corporate finance services 2 4
200 202

67
6. Staff numbers and costsThe average number of persons employed by the Group during the year was as follows:
Year ended 30 November 2014
Number
Year ended 30 November 2013
Number
Research and development, products and services 1,525 1,645
Marketing and sales 209 293
Corporate Services 136 210
1,870 2,148
Aggregate emoluments of persons employed by the Group comprised:
Year ended 30 November 2014
£000
Year ended 30 November 2013
£000
Wages and salaries 56,891 69,740
Termination payments 838 4,942
Social security costs 5,332 6,227
Other pension costs 5,154 5,831
Share-based payments (note 25) 932 507
69,147 87,247
The Company employs no staff (2013: none)
Information regarding the remuneration of the Directors is shown in the Remuneration Report.
7. Investment income
Year ended 30 November 2014
£000
Year ended 30 November 2013
£000
Bank interest 242 223
Income on sale of finance lease debt 55 289
Other finance income 179 218
476 730
8. Finance costs
Note
Year ended 30 November 2014
£000
Year ended 30 November 2013
£000
Interest on bank overdrafts and loans - 15
Borrowing facilities arrangement fees and commitment fees 467 495
Cost of leasing finance - 130
Finance lease interest 21 20
Net finance costs on Defined Benefit Pension Scheme 23 379 830
Unwind of discount on long-term contract provisions 57 -
Unwind of discount on onerous lease and dilapidations provisions 21 269 159
1,193 1,649
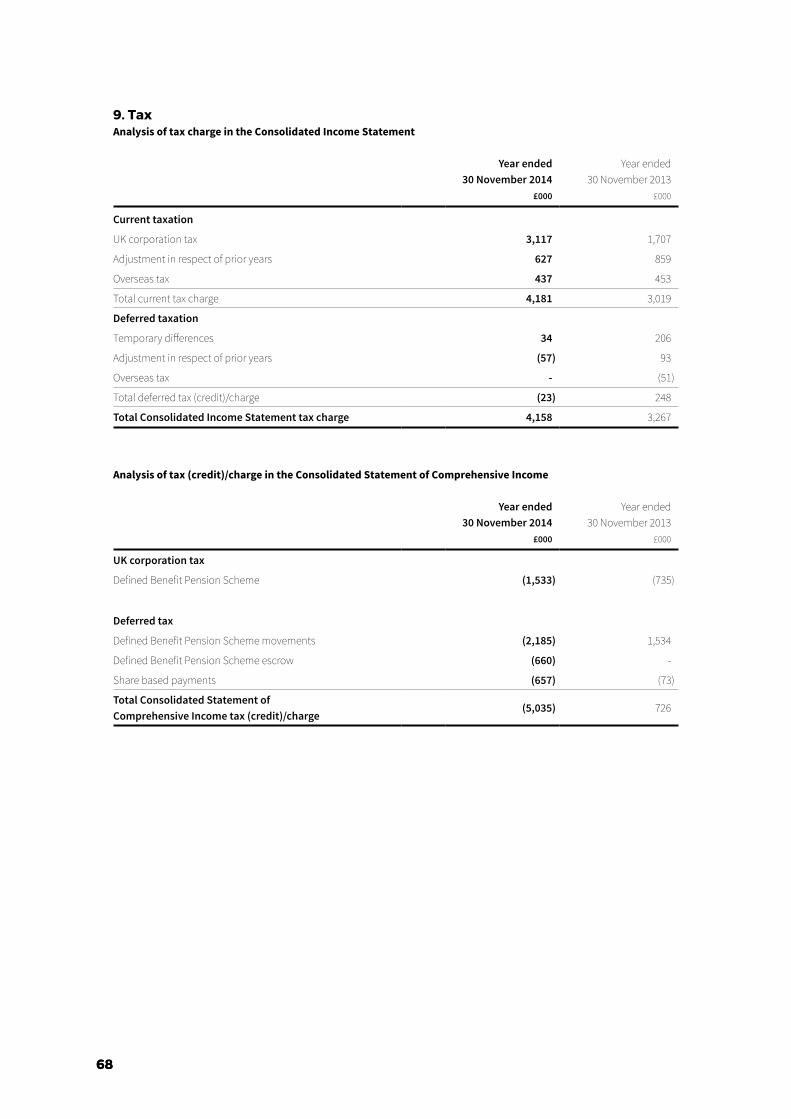
6868
9. TaxAnalysis of tax charge in the Consolidated Income Statement
Year ended 30 November 2014
£000
Year ended 30 November 2013
£000
Current taxation
UK corporation tax 3,117 1,707
Adjustment in respect of prior years 627 859
Overseas tax 437 453
Total current tax charge 4,181 3,019
Deferred taxation
Temporary differences 34 206
Adjustment in respect of prior years (57) 93
Overseas tax - (51)
Total deferred tax (credit)/charge (23) 248
Total Consolidated Income Statement tax charge 4,158 3,267
Analysis of tax (credit)/charge in the Consolidated Statement of Comprehensive Income
Year ended 30 November 2014
£000
Year ended 30 November 2013
£000
UK corporation tax
Defined Benefit Pension Scheme (1,533) (735)
Deferred tax
Defined Benefit Pension Scheme movements (2,185) 1,534
Defined Benefit Pension Scheme escrow (660) -
Share based payments (657) (73)
Total Consolidated Statement of Comprehensive Income tax (credit)/charge
(5,035) 726
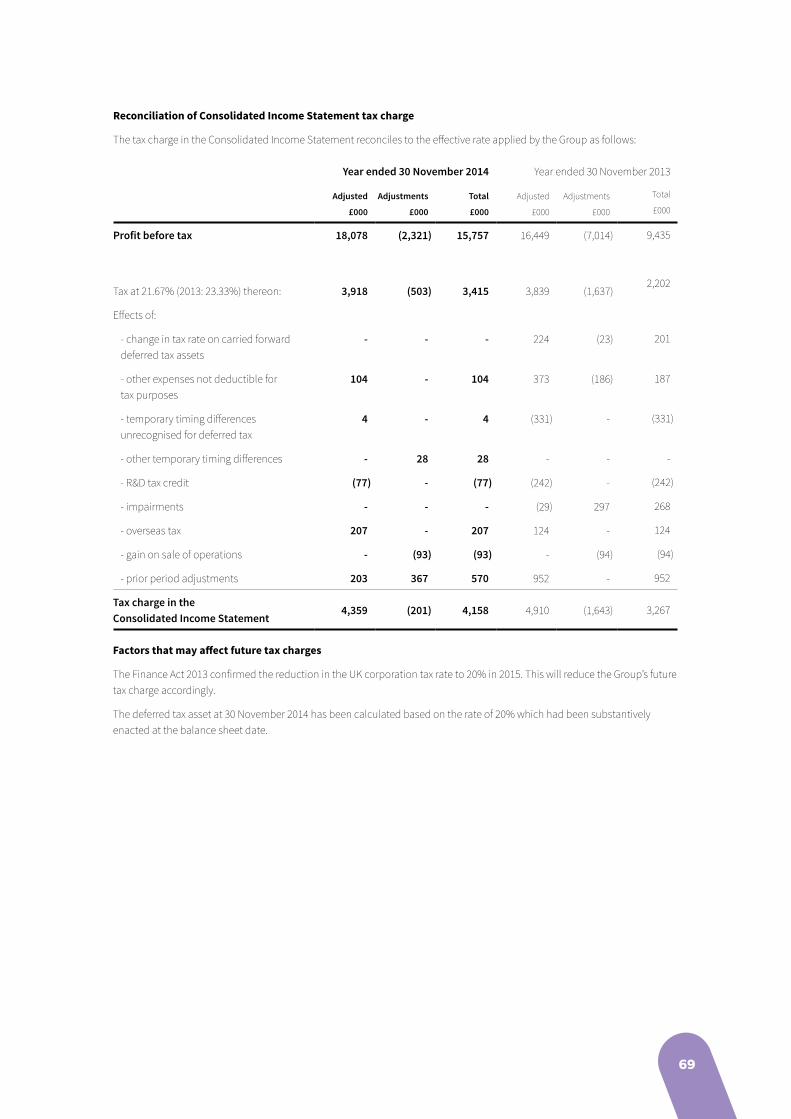
69
Reconciliation of Consolidated Income Statement tax charge
The tax charge in the Consolidated Income Statement reconciles to the effective rate applied by the Group as follows:
Year ended 30 November 2014 Year ended 30 November 2013
Adjusted
£000
Adjustments
£000
Total
£000
Adjusted
£000
Adjustments
£000
Total
£000
Profit before tax 18,078 (2,321) 15,757 16,449 (7,014) 9,435
Tax at 21.67% (2013: 23.33%) thereon: 3,918 (503) 3,415 3,839 (1,637)2,202
Effects of:
- change in tax rate on carried forward deferred tax assets
- - - 224 (23) 201
- other expenses not deductible for tax purposes
104 - 104 373 (186) 187
- temporary timing differences unrecognised for deferred tax
4 - 4 (331) - (331)
- other temporary timing differences - 28 28 - - -
- R&D tax credit (77) - (77) (242) - (242)
- impairments - - - (29) 297 268
- overseas tax 207 - 207 124 - 124
- gain on sale of operations - (93) (93) - (94) (94)
- prior period adjustments 203 367 570 952 - 952
Tax charge in the Consolidated Income Statement
4,359 (201) 4,158 4,910 (1,643) 3,267
Factors that may affect future tax charges
The Finance Act 2013 confirmed the reduction in the UK corporation tax rate to 20% in 2015. This will reduce the Group’s future tax charge accordingly.
The deferred tax asset at 30 November 2014 has been calculated based on the rate of 20% which had been substantively enacted at the balance sheet date.
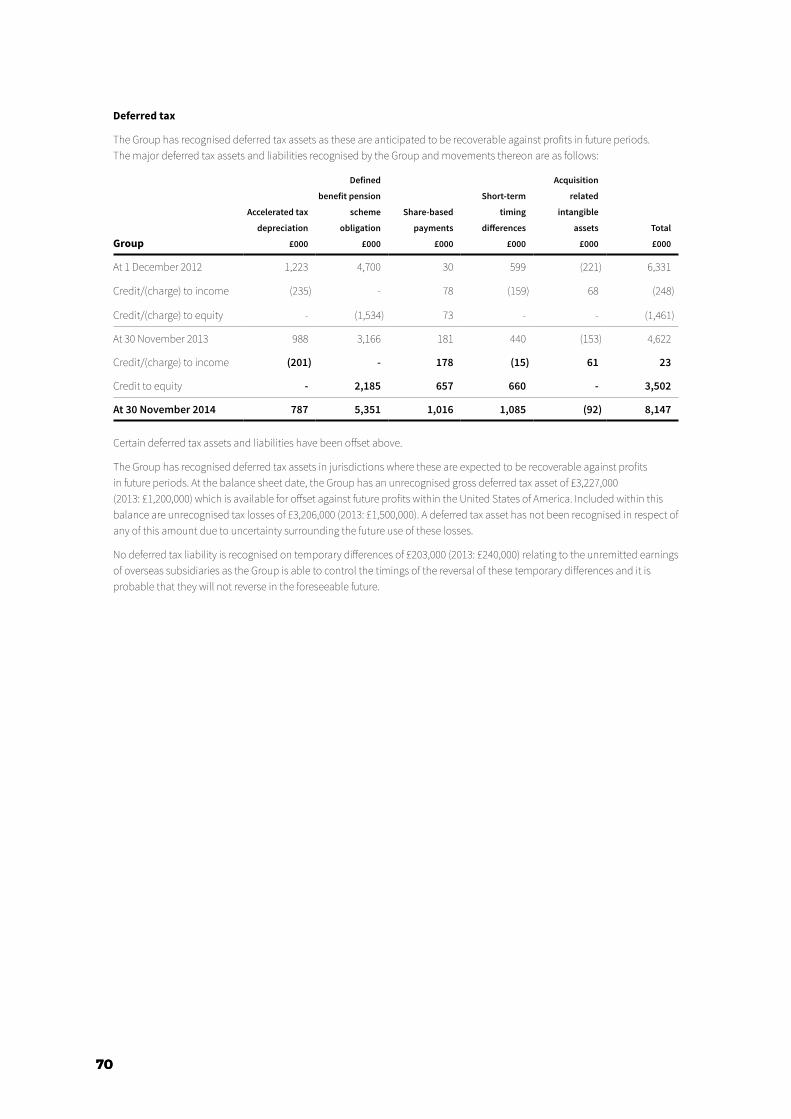
7070
Deferred tax
The Group has recognised deferred tax assets as these are anticipated to be recoverable against profits in future periods. The major deferred tax assets and liabilities recognised by the Group and movements thereon are as follows:
Group
Accelerated tax
depreciation
£000
Defined
benefit pension
scheme
obligation
£000
Share-based
payments
£000
Short-term
timing
differences
£000
Acquisition
related
intangible
assets
£000
Total
£000
At 1 December 2012 1,223 4,700 30 599 (221) 6,331
Credit/(charge) to income (235) - 78 (159) 68 (248)
Credit/(charge) to equity - (1,534) 73 - - (1,461)
At 30 November 2013 988 3,166 181 440 (153) 4,622
Credit/(charge) to income (201) - 178 (15) 61 23
Credit to equity - 2,185 657 660 - 3,502
At 30 November 2014 787 5,351 1,016 1,085 (92) 8,147
Certain deferred tax assets and liabilities have been offset above.
The Group has recognised deferred tax assets in jurisdictions where these are expected to be recoverable against profits in future periods. At the balance sheet date, the Group has an unrecognised gross deferred tax asset of £3,227,000 (2013: £1,200,000) which is available for offset against future profits within the United States of America. Included within this balance are unrecognised tax losses of £3,206,000 (2013: £1,500,000). A deferred tax asset has not been recognised in respect of any of this amount due to uncertainty surrounding the future use of these losses.
No deferred tax liability is recognised on temporary differences of £203,000 (2013: £240,000) relating to the unremitted earnings of overseas subsidiaries as the Group is able to control the timings of the reversal of these temporary differences and it is probable that they will not reverse in the foreseeable future.

71
10. Earnings per ordinary share
Year ended 30 November 2014 Year ended 30 November 2013
Profit for
the year
£000
Weighted
average
number of
shares
000
Pence per
share
Profit for
the year
£000
Weighted
average
number of
shares
000
Pence per
share
Basic earnings per ordinary share
Basic earnings 11,599 83,702 13.9 6,168 91,718 6.7
Adjustments* 2,120 - 2.5 5,371 - 5.9
Adjusted basic earnings 13,719 83,702 16.4 11,539 91,718 12.6
Diluted earnings per ordinary share
Basic earnings 11,599 83,702 13.9 6,168 91,718 6.7
Effect of dilutive potential ordinary shares: share-based payment awards
- 5,346 (0.9) - 1,153 (0.1)
Diluted earnings 11,599 89,048 13.0 6,168 92,871 6.6
Adjustments* 2,120 - 2.4 5,371 - 5.8
Adjusted diluted earnings 13,719 89,048 15.4 11,539 92,871 12.4
* Refer to note 1 for an explanation of adjustments to profits.
The weighted average number of shares for the year ended 30 November 2014 has been calculated based upon the weighted average of the number of ordinary shares of 2p each and ordinary shares of 22/7p each following the share consolidation (see note 22).
11. Dividends Amounts recognised as distributions to equity holders were:
Year ended 30 November 2014
£000
Year ended 30 November 2013
£000
Final dividend for the year ended 30 November 2013 of 2.46p per share (2012: 2.25p)
2,257 2,064
Special dividend for the year ended 30 November 2013 of 16.00p per share (2012: nil)
14,678 -
Interim dividend for the year ended 30 November 2014 of 0.96p per share (2013: 0.84p)
771 770
17,706 2,834
The proposed final dividend of 3.04p per share for the year ended 30 November 2014 was approved by the Board on 30 January 2015. The dividend is subject to approval by shareholders at the annual general meeting. The anticipated cost of this dividend is £2,460,000, which is not included as a liability at 30 November 2014.

7272
12. Goodwill
Group £000
Cost
At 1 December 2012, 30 November 2013 and 30 November 2014 23,761
Accumulated impairment
At 1 December 2012 9,366
Impairment loss 328
At 30 November 2013 and 30 November 2014 9,694
Carrying amount
At 30 November 2013 and 30 November 2014 14,067
The discount rates used for goodwill impairment reviews and the carrying amount of goodwill is allocated as follows:
2014 2013
Pre tax
discount rate £000
Pre tax
discount rate £000
RM Resources - TTS Group Limited 10.2% 11,111 11.8% 11,111
RM Results 11.5% 2,956 12.0% 2,956
14,067 14,067
Further information pertaining to the performance and future strategy of the divisions can be found within the Strategic Report.
A review of the forecast future cash flows of TTS Group Limited and of RM Results indicated no impairment was required.
The recoverable amounts of the Cash Generating Units (‘CGU’) are determined from value in use calculations. The key assumptions for the value in use calculations are those regarding the discount rates and growth rates.
The Group monitors its post-tax Weighted Average Cost of Capital and those of its competitors using market data. In considering the discount rates applying to CGUs, the Directors have considered the relative sizes, risks and the inter-dependencies of its CGUs and their relatively narrow operation within the education products and services market. The impairment reviews use a discount rate adjusted for pre-tax cash flows. Analysis of the sensitivity of the resultant impairment reviews to changes in the discount rate is included below.
The Group prepares cash flow forecasts derived from the most recent annual financial plan approved by the Board, which also contains forecasts for the two years following, and extrapolates cash flows based on internal forecasts with terminal rates of between 0% and 3% (2013: between 0% and 3%).
Sensitivity analysis
The sensitivity of goodwill carrying values to reasonably possible changes in key assumptions has been performed. No changes produce a significant movement in the carrying value of goodwill allocated to a CGU and therefore no sensitivity analysis is presented.

73
13. Other intangible assets
Group
Customer
relationships
£000
Brands
£000
Intellectual
property &
database assets
£000
Acquisition
related
intangible
assets sub-total
£000
Other
software assets
£000
Total
£000
Cost
At 1 December 2012 1,599 564 325 2,488 10,336 12,824
Additions - - - - 68 68
Effect of movements in exchange rates
- - - - (29) (29)
Disposals - - - - (7,686) (7,686)
At 30 November 2013 1,599 564 325 2,488 2,689 5,177
Additions - - - - 1 1
Effect of movements in exchange rates
- - - - 9 9
Disposals - - - - (73) (73)
At 30 November 2014 1,599 564 325 2,488 2,626 5,114
Accumulated amortisation and impairment
At 1 December 2012 994 209 325 1,528 8,058 9,586
Charge for the year 124 71 - 195 582 777
Effect of movements in exchange rates
1 - - 1 (27) (26)
Disposals - - - - (6,950) (6,950)
At 30 November 2013 1,119 280 325 1,724 1,663 3,387
Charge for the year 191 112 - 303 417 720
Effect of movements in exchange rates
- - - - 9 9
At 30 November 2014 1,310 392 325 2,027 2,089 4,116
Carrying amount
At 30 November 2014 289 172 - 461 537 998
At 30 November 2013 480 284 - 764 1,026 1,790
A review of other intangible assets at the balance sheet date indicated there was no additional impairment loss in the year ended 30 November 2014 (2013: £nil).
The carrying amount of Acquisition related intangible assets and Other software assets at 30 November 2014 include impairment losses of £443,000 (2013: £443,000) and £275,000 (2013: £275,000) respectively.
The carrying amount of Other software assets at 30 November 2014 included purchased software assets of £9,000 (2013: £68,000), and internally developed software assets of £528,000 (2013: £958,000).
During the year, no material expenditure on research and development is considered to have met the criteria whereby the expenditure is capitalised as an intangible asset (2013: £nil). The carrying amount of capitalised research and development at 30 November 2014 was £nil (2013: £nil).

7474
14. Property, plant and equipment
Group
Freehold land &
buildings
£000
Short leasehold
improvements
£000
Plant &
equipment
£000
Computer
equipment
£000
Vehicles
£000
Total
£000
Cost
At 1 December 2012 2,779 4,493 9,186 13,547 4,214 34,219
Additions - 199 175 1,531 75 1,980
Effect of movements in exchange rates
- (46) (98) (143) (20) (307)
Assets reclassified - 48 (48) 1 (1) -
Disposals - (135) (4,448) (8,018) (1,409) (14,010)
At 30 November 2013 2,779 4,559 4,767 6,918 2,859 21,882
Additions 314 1,216 383 583 101 2,597
Effect of movements in exchange rates
- 12 30 45 7 94
Disposals (81) - (392) (156) (1,457) (2,086)
At 30 November 2014 3,012 5,787 4,788 7,390 1,510 22,487
Accumulated depreciation and impairment
At 1 December 2012 785 2,753 6,760 10,161 2,320 22,779
Charge for the year 98 534 1,022 1,546 719 3,919
Effect of movements in exchange rates
- (15) (69) (112) (11) (207)
Assets reclassified - 12 (12) 2 (2) -
Disposals - (135) (4,435) (7,859) (1,279) (13,708)
At 30 November 2013 883 3,149 3,266 3,738 1,747 12,783
Charge for the year 97 432 559 1,196 376 2,660
Effect of movements in exchange rates
- 6 25 37 4 72
Impairment - 379 69 277 30 755
Disposals (67) - (387) (142) (1,227) (1,823)
At 30 November 2014 913 3,966 3,532 5,106 930 14,447
Carrying value
At 30 November 2014 2,099 1,821 1,256 2,284 580 8,040
At 30 November 2013 1,896 1,410 1,501 3,180 1,112 9,099
The carrying value of vehicles at the year end included £444,000 (2013: £1,032,000) held under finance leases.

75
15. Investments in subsidiary undertakingsThe principal subsidiary undertakings of the Company at 30 November 2014 were:
Name Principal activityCountry of
incorporationClass of
share % held
RM Books Limited Software services England Ordinary 100%
RM Education Limited Software, services & systems England Ordinary 100%
RM Education Solutions India Pvt Limited * Software and corporate services India Ordinary 100%
Space Kraft Limited Resource supply England Ordinary 100%
TTS Group Limited Resource supply England Ordinary 100%
* Held through subsidiary undertaking.
The investment in subsidiary undertakings comprises:
Company
Investment in
share capital
£000
Capital contribution
shared-based
payments
£000
Quasi-equity loan
£000
Total
£000
Cost
At 1 December 2012 46,281 8,541 7,077 61,899
Disposals (1,014) - - (1,014)
Share-based payments - 507 - 507
At 30 November 2013 45,267 9,048 7,077 61,392
Investment in RM Education Limited 11,920 - (7,077) 4,843
Share-based payments - 932 - 932
At 30 November 2014 57,187 9,980 - 67,167
Accumulated impairment
At 1 December 2012 6,245 - - 6,245
Impairment loss 555 - - 555
Disposals (956) - - (956)
At 30 November 2013 5,844 - - 5,844
Reversal of impairment (2,932) - - (2,932)
At 30 November 2014 2,912 - - 2,912
Carrying value
At 30 November 2014 54,275 9,980 - 64,255
At 30 November 2013 39,423 9,048 7,077 55,548
The Company purchased an additional 32 shares in its subsidiary undertaking, RM Education Limited, during the year. The consideration was £11,920,000, satisfied by a reduction of £7,077,500 in the quasi-equity loan and £4,842,500 in additional capital funding.
The impairment loss at 30 November 2014 applied primarily to the Company’s investment in Space Kraft Limited (£2,824,000). The impairment loss in RM Education Limited was reversed in the year (2013: Space Kraft Limited increase of £555,000).
The assumptions for the impairment reviews performed are outlined in note 12.

7676
16. Inventories
Group2014
£000
2013 £000
Components 141 845
Work in progress - 87
Finished goods 10,463 9,617
10,604 10,549
17. Long-term contracts
Group Note
2014 £000
2013 £000
Contract costs incurred plus recognised profits less recognised losses to date 440,840 375,058
Less: Progress billings (472,006) (402,095)
(31,166) (27,037)
Amounts due from contract customers included in trade and other receivables 18 154 671
Amounts due to contract customers included in trade and other payables 20 (31,320) (27,708)
(31,166) (27,037)
Total revenue from long-term contracts recognised in the year ended 30 November 2014 amounted to £69,600,000 (2013: £91,100,000).
Long-term contract outcome – estimation uncertainty
The Group’s long-term contracts represent a significant part of the Group’s business. As a result of the accounting for these contracts, as outlined in note 2, it is necessary for the Directors to assess the outcome of each contract and also estimate future costs and contracted revenues to establish ultimate contract profitability. Key judgements include performance indicator outcomes, future inflation rates, implementation/software development costs and whether the contract variations and extensions should be combined with existing arrangements. Profit is then recognised based on these judgements and, depending on the maturity of the contract portfolio, a greater or lesser proportion of Group profit will arise from long-term contracts.
Sensitivity to assumptions has been considered but due to their nature it is not practicable to perform an analysis.

77
18. Trade and other receivables
Group Company
Note
2014 £000
2013 £000
2014
£000
2013
£000
Current
Financial assets
Trade receivables 24,830 24,599 - -
Long-term contract balances 17 154 671 - -
Other receivables 1,308 474 6 -
Accrued income 1,571 2,990 - -
Amounts owed by Group undertakings - - 14,366 104
27,863 28,734 14,372 104
Non-financial assets
Prepayments 5,065 6,400 - -
32,928 35,134 14,372 104
Non-current
Financial assets
Other receivables 1,878 1,911 1,628 1,661
34,806 37,045 16,000 1,765
Currency profile of receivables
Sterling 34,387 36,748 16,000 1,765
US Dollar 163 17 - -
Euro - 56 - -
Indian Rupee 256 224 - -
34,806 37,045 16,000 1,765
A reclassification has been made in the Group comparative figures for 2013 reallocating £2,833,000 of balances previously included within trade receivables to accrued income reflecting the un-billed nature of these long-term contract related recoverable amounts.
The amounts owed by Group undertakings to the Company are repayable on demand and bear interest at LIBOR plus 2%.
The Directors consider that the carrying amounts of trade and other receivables approximates their fair values.
The Company’s Non-current Other receivables are the gross amounts owed by the Company’s equity investments in BSF delivery companies, Newham Learning Partnership (PSP) Ltd and Essex Schools (Holdings) Ltd. The interest charged on these receivables is 11.75% pa.

7878
Analysis of trade receivables by type of customer
Group2014
£000
2013 £000
Government 10,016 10,482
Commercial 14,814 14,117
24,830 24,599
Trade receivables included an allowance for estimated irrecoverable amounts at 30 November 2014 of £1,361,000 (2013: £1,777,000), based on management’s knowledge of the customer, externally available information and expected payment likelihood. This allowance has been determined by reference to specific receivable balances and past default experience. New customers are subject to credit checks where available, using third party databases prior to being accepted.
Ageing of unimpaired trade receivables
Group2014
£000
2013 £000
Not past due 18,128 18,273
Overdue by less than 60 days 3,955 5,622
Overdue by between 60 and 90 days 1,074 323
Overdue by more than 90 days 1,673 381
24,830 24,599
19. Cash and short-term deposits
Group Company
2014 £000
2013 £000
2014 £000
2013 £000
Cash and cash equivalents 41,893 57,169 - -
Short-term deposits 6,000 6,000 - -
47,893 63,169 - -
The short-term deposits are for a maximum period of 6 months at interest rates of 0.80-0.85%.
The interest and currency profile of cash and short-term deposits is disclosed in note 28.
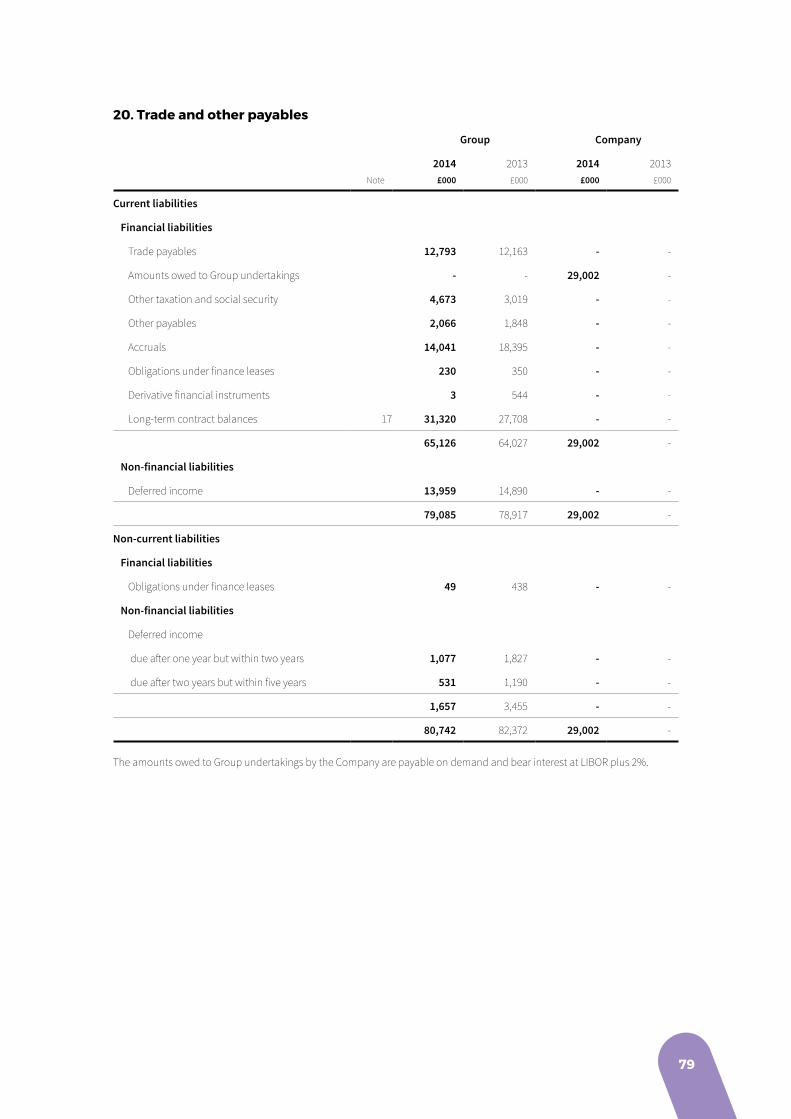
79
20. Trade and other payables
Group Company
Note
2014 £000
2013 £000
2014 £000
2013 £000
Current liabilities
Financial liabilities
Trade payables 12,793 12,163 - -
Amounts owed to Group undertakings - - 29,002 -
Other taxation and social security 4,673 3,019 - -
Other payables 2,066 1,848 - -
Accruals 14,041 18,395 - -
Obligations under finance leases 230 350 - -
Derivative financial instruments 3 544 - -
Long-term contract balances 17 31,320 27,708 - -
65,126 64,027 29,002 -
Non-financial liabilities
Deferred income 13,959 14,890 - -
79,085 78,917 29,002 -
Non-current liabilities
Financial liabilities
Obligations under finance leases 49 438 - -
Non-financial liabilities
Deferred income
due after one year but within two years 1,077 1,827 - -
due after two years but within five years 531 1,190 - -
1,657 3,455 - -
80,742 82,372 29,002 -
The amounts owed to Group undertakings by the Company are payable on demand and bear interest at LIBOR plus 2%.

8080
Currency profile of trade and other payables
Group Company
2014 £000
2013 £000
2014 £000
2013 £000
Sterling 79,752 80,284 29,002 -
US Dollar 208 1,364 - -
Euro 80 193 - -
Indian rupee 754 531 - -
80,794 82,372 29,002 -
The Directors consider that the carrying amount of trade and other payables approximates their fair value.
Amounts payable under finance lease contracts
2014 2013
Group
Minimum lease
payments
£000
Present value of
minimum lease
payments
£000
Minimum
lease payments
£000
Present value of
minimum lease
payments
£000
Within one year 236 230 373 350
In the second to fifth years inclusive 49 49 446 438
285 279 819 788
Less: finance charges allocated to future periods (6) - (31) -
Present value of minimum lease payments 279 279 788 788
Interest charged on vehicle finance lease contracts is at the Bank of England base rate plus 2% fixed at the date of acquiring the asset, and the vehicles are leased until they are 4 years old.

81
21. Provisions
Group
Onerous lease
and dilapidations
£000
Employee-related
restructuring
£000
Other
£000
Total
£000
At 1 December 2012 6,409 453 2,175 9,037
Utilisation of provisions (1,331) (1,154) (52) (2,537)
Release of provisions - - (1,092) (1,092)
Increase in provisions 2,627 4,942 320 7,889
Effect of movements in exchange rates 21 - (21) -
Unwind of discount 159 - - 159
At 30 November 2013 7,885 4,241 1,330 13,456
Utilisation of provisions (836) (4,348) (289) (5,473)
Release of provisions (524) (366) (431) (1,321)
Increase in provisions 1,298 838 95 2,231
Effect of movements in exchange rates 2 - 3 5
Unwind of discount 269 - - 269
At 30 November 2014 8,094 365 708 9,167
Provisions for onerous leases and dilapidations have been recognised at the present value of the expected obligation at discount rates of 3% reflecting a risk free discount rate applicable to the liabilities. These discounts will unwind to their undiscounted value over the remaining lives of the leases via a finance cost within the Income Statement. At 30 November 2014, £5,738,000 (2013: £5,587,000) of the provision refers to onerous leases, and £2,356,000 (2013: £2,298,000) refers to dilapidations.
The average remaining life of the leases at 30 November 2014 is 5.1 years (2013: 2.1 years). Given the lengths remaining on onerous leases and current market conditions, no assumption has been made for the Group’s ability to sub-let, with any sub-letting likely to result in a release of a proportion of the provision held.
Employee-related restructuring provisions refer to costs arising from restructuring to meet the future needs of the Group and are all expected to be utilised during the following financial year.
Other provisions includes one-off items not covered by any other category. The major release of Group provisions during the year relates to the provision within RM plc Company (see below). The significant elements in the provision at 30 November 2014 continue to be related to on-going legal activity and provisions recognised as part of the exit of operations, both of which were included in the previous year.

8282
Disclosure of provisions
Group2014
£000
2013 £000
Current liabilities 3,660 7,201
Non-current liabilities 5,507 6,255
9,167 13,456
Company Non-current liabilities £000
At 1 December 2012 629
Release of provisions (200)
At 30 November 2013 429
Release of provisions (429)
Increase in provisions 4,893
At 30 November 2014 4,893
The Company’s outstanding provisions at 1 December 2013 relating to warranties on businesses sold in previous years has been released to the Income Statement as it is no longer required.
The increase in provisions during the year relates to the guarantee of an intergroup balance between subsidiary undertakings.
The Directors consider that the carrying amounts of provisions in the Group and the Company approximate their fair value.
22. Share capital
Company and Group Ordinary shares of 2p Ordinary shares of 22/7p Total
Allotted, called-up and fully paid Number, 000 £000 Number, 000 £000 £000
At 1 December 2012 and 30 November 2013 93,515 1,870 - - 1,870
Share consolidation (93,515) (1,870) 81,826 1,870 -
Issued in the year - - 814 19 19
At 30 November 2014 - - 82,640 1,889 1,889
During the year 800,000 ordinary shares of 22/7p were issued to the RM plc Employee Share Trust at par, and 14,000 shares options were exercised at an exercise price of £1.54 from the Employee share option scheme.
Ordinary shares issued carry no right to fixed income.
23. Retirement benefit schemesa) Defined contribution scheme
The Group operates or contributes to a number of defined contribution schemes for the benefit of qualifying employees. The assets of these schemes are held separately from those of the Company. The total cost charged to income of £4,914,000 (2013: £5,555,000) represents contributions payable to these schemes by the Group at rates specified in employment contracts. At 30 November 2014 £373,000 (2013: £465,000) due in respect of the current financial year had not been paid over to the schemes.

83
b) Local government pension schemes
The Group has TUPE employees who retain membership of local government pension schemes. The Group makes payments to these schemes for current service costs in accordance with its contractual obligations, most of which are limited through reimbursement rights under the contracts. The total costs charged to income for these schemes was £240,000 (2013: £276,000). The amount due in respect of these schemes at 30 November 2014 was £28,000 (2013: £24,000).
c) Defined Benefit Pension Scheme
One Group sponsored Defined Benefit Pension Scheme is in operation, the Research Machines plc 1988 Pension Scheme (“Scheme”). The Scheme is a funded scheme. The Scheme provides benefits to qualifying employees and former employees of RM Education Limited, but was closed to new members with effect from 1 January 2003 and closed to future accrual of benefits from 31 October 2012. The assets of the Scheme are held separately from RM Education Limited’s in a trustee-administered fund. The Trustee is a limited company. Directors of the Trustee company are appointed by RM Education Ltd and by members.
Under the Scheme, employees were entitled to retirement benefits of 1/60th of final salary for each qualifying year on attainment of retirement age of 60 or 65 years and additional benefits based on the value of individual accounts. No other post-retirement benefits were provided by the Scheme.
The most recent actuarial valuation of Scheme assets and the present value of the defined benefit obligation was carried out for statutory funding purposes at 31 May 2012 by a qualified independent actuary. IAS 19 Employee Benefits liabilities have been rolled forward based on this valuation’s base data.
As at 31 May 2012, the triennial valuation for statutory funding purposes showed a deficit of £53,500,000 (31 May 2009: £16,600,000). RM Education Limited agreed with the Scheme Trustees that it will repay this amount via deficit catch up payments of £4,000,000 per annum until 31 May 2013 and thereafter at £3,600,000 per annum until 31 May 2027. There was one month’s deficit payment of £300,000 outstanding at 30 November 2014 (2013: £300,000). The next triennial valuation of the Scheme is due as at 31 May 2015 and may result in changes to the level of deficit catch up payments required.
A further £8,000,000 contribution was paid into an escrow account established during the year, the form of use of which within the Scheme is required to be agreed by RM Education Limited and the Scheme Trustee.
In October 2014, £4,700,000 of this was paid to the Scheme from the escrow account to help fund a pension buy-in, the income from which will closely match payments to all 165 existing pensioners. Such a buy-in largely eliminates the inflation, interest rate and longevity risks associated with these pension benefits. The transaction covered liabilities in respect of 9% of the Scheme members and around 13% of the total Scheme liability. The insurance premium payable under the buy-in agreement was £30,700,000. The insurance premium was funded by way of £26,000,000 of fixed income assets from the Scheme and £4,700,000 paid from the escrow account. This leaves £3,300,000 remaining in the escrow account to be used for future risk reduction exercises.
Scheme assets are measured at bid-price at 30 November 2014. The present value of the defined benefit obligation was measured using the projected unit method.
The entire deficit position of the Scheme is held within these Financial Statements on the balance sheet as RM Education Limited in substance bears all of the material risks associated with the Scheme.
The parent company RM plc has entered into a guarantee in respect of the £3,600,000 annual deficit recovery payments agreed with the Trustees in 2012. The guarantee for the deficit recovery remains in place on condition that the assumptions underlying the valuation in 2012 remain materially unchanged for all subsequent triennial valuations undertaken.
No liability has been recognised for this within the Company as the Directors consider that the likelihood of it being called upon is remote.

8484
Amounts recognised in the Income Statement and in the Statement of Comprehensive Income
Note
Year ended 30 November 2014
£000
Year ended 30 November 2013
£000
Administrative expenses and taxes (475) (391)
Operating expense (475) (391)
Interest cost (7,513) (6,722)
Interest on Scheme assets 7,134 5,892
Net interest expense 8 (379) (830)
Expense recognised in the Income Statement (854) (1,221)
Effect of changes in demographic assumptions 1,198 -
Effect of changes in financial assumptions (26,666) (8,199)
Total actuarial losses (25,468) (8,199)
Return on Scheme assets excluding interest on Scheme assets 3,576 9,641
(Expense)/income recognised in the Statement of Comprehensive Income (21,892) 1,442
(Expense)/income recognised in Total Comprehensive Income (22,746) 221
Reconciliation of the Scheme assets and obligations through the year
Year ended 30 November 2014
£000
Year ended 30 November 2013
£000
Assets
At start of period 147,688 129,710
Interest on Scheme assets 7,134 5,892
Return on Scheme assets excluding interest on Scheme assets 3,576 9,641
Administrative expenses (475) (391)
Contributions from Group 11,821 4,384
Benefits paid (3,905) (1,548)
At end of period 165,839 147,688
Obligations
At start of period (163,516) (150,143)
Interest cost (7,513) (6,722)
Actuarial losses (25,468) (8,199)
Benefits paid 3,905 1,548
At end of period (192,592) (163,516)
Deficit in Scheme and obligation recognised on the Balance Sheet (26,753) (15,828)
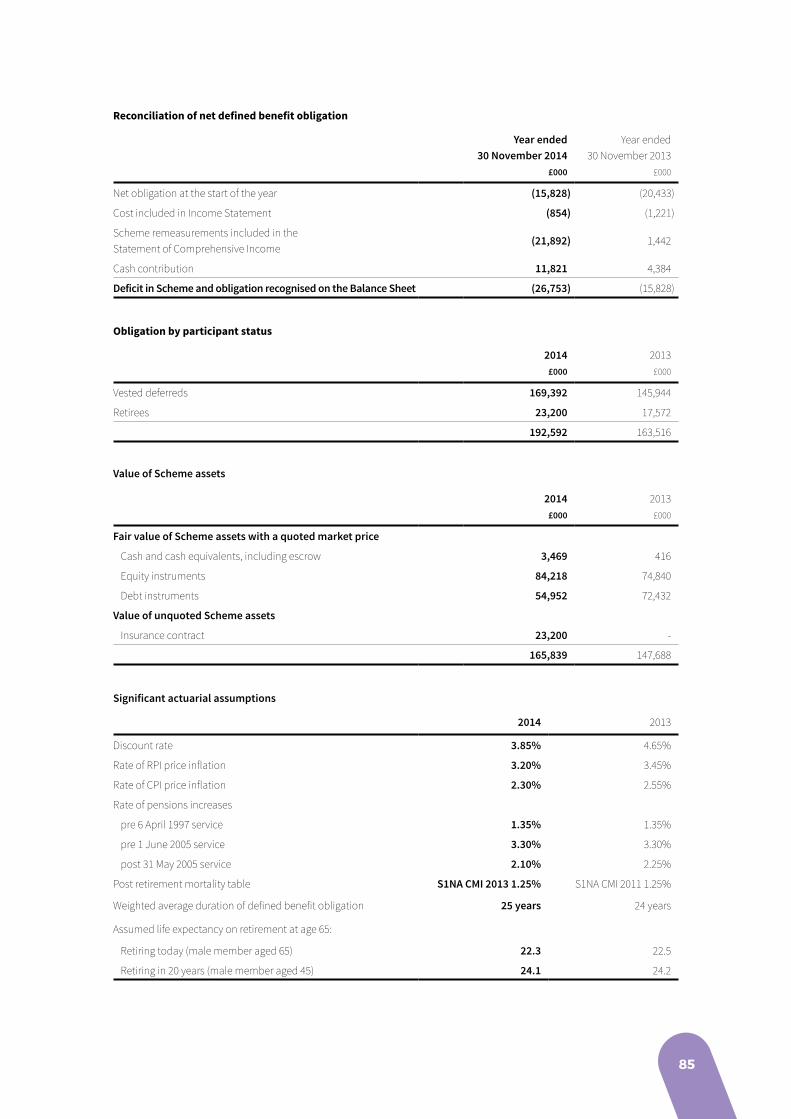
85
Reconciliation of net defined benefit obligation
Year ended 30 November 2014
£000
Year ended 30 November 2013
£000
Net obligation at the start of the year (15,828) (20,433)
Cost included in Income Statement (854) (1,221)
Scheme remeasurements included in the Statement of Comprehensive Income
(21,892) 1,442
Cash contribution 11,821 4,384
Deficit in Scheme and obligation recognised on the Balance Sheet (26,753) (15,828)
Obligation by participant status
2014 £000
2013 £000
Vested deferreds 169,392 145,944
Retirees 23,200 17,572
192,592 163,516
Value of Scheme assets
2014 £000
2013 £000
Fair value of Scheme assets with a quoted market price
Cash and cash equivalents, including escrow 3,469 416
Equity instruments 84,218 74,840
Debt instruments 54,952 72,432
Value of unquoted Scheme assets
Insurance contract 23,200 -
165,839 147,688
Significant actuarial assumptions
2014 2013
Discount rate 3.85% 4.65%
Rate of RPI price inflation 3.20% 3.45%
Rate of CPI price inflation 2.30% 2.55%
Rate of pensions increases
pre 6 April 1997 service 1.35% 1.35%
pre 1 June 2005 service 3.30% 3.30%
post 31 May 2005 service 2.10% 2.25%
Post retirement mortality table S1NA CMI 2013 1.25% S1NA CMI 2011 1.25%
Weighted average duration of defined benefit obligation 25 years 24 years
Assumed life expectancy on retirement at age 65:
Retiring today (male member aged 65) 22.3 22.5
Retiring in 20 years (male member aged 45) 24.1 24.2

8686
Expected cash flows
£000
Expected employer contributions per annum 3,984
Expected total benefit payments
Year 1 2,186
Year 2 2,247
Year 3 2,309
Year 4 2,373
Year 5 2,439
Years 6 - 10 13,247
Sensitivities to assumptions - one item changed with all others held constant
------------------- 30 November 2014 ------------------- 30 November 2013
Base
£m
-0.1%
discount
rate
£m
+0.1%
discount
rate
£m
-0.1% RPI
£m
+0.1% RPI
£m
Life +1 yr
£m
Base
£m
Analysis of net balance sheet position
Fair value of Scheme assets 165.8 166.1 165.5 165.6 166.0 166.4 147.7
Present value of Scheme obligations (192.6) (197.5) (187.8) (188.5) (196.7) (196.2) (163.5)
Deficit (26.8) (31.4) (22.3) (22.9) (30.7) (29.8) (15.8)
Actuarial assumptions
Discount rate 3.85% 3.75% 3.95% 3.85% 3.85% 3.85% 4.65%
Rate of RPI 3.20% 3.20% 3.20% 3.10% 3.30% 3.20% 3.45%
Rate of CPI 2.30% 2.30% 2.30% 2.20% 2.40% 2.30% 2.55%
Mortality table ------------------- S1NA CMI 2013 1.25% ------------------- S1NA CMI 2011 1.25%
Rating (years) - - - - - (1) -
24. Own sharesThe RM plc Employee Share Trust (EST) was established in March 2003 to hedge the future obligations of the Group in respect of shares awarded under the RM plc Co-Investment Plan, RM plc Performance Share Plan and Deferred Bonus Plan. The EST has waived any entitlement to the receipt of normal dividends in respect of all of its holding of the Company’s ordinary shares, and also waived its entitlement to the 2014 special dividend. The EST’s waiver of dividends may be revoked or varied at any time.
The trustee of the EST, Computershare Trustees (C.I.) Ltd, purchased 800,000 new ordinary shares during the year at nominal value, with funds provided by the Group.

87
Company and GroupOrdinary shares of 2p
Number 000
Ordinary shares of 22/7p
Number 000 £000
At 1 December 2012 1,797 - 2,972
Additions 14 - -
At 30 November 2013 1,811 - 2,972
Share-based payment awards exercised (40) - (40)
Transfer from RML Staff Share Scheme 1 - -
Share consolidation (1,772) 1,551 -
Shares issued - 800 18
At 30 November 2014 - 2,351 2,950
The valuation of the shares is weighted average cost.
25. Share-based paymentsThe Group operates the following executive and employee equity settled share-based payment schemes:
a) employee share option schemes
b) performance share plans
c) staff share schemes.
The fair values of awards made under these schemes have been assessed using Black-Scholes and Monte-Carlo models, as appropriate to the scheme, at the date of grant. The fair values of the schemes are expensed over the period between grant and vesting.
Share-based payment awards exercised in the period and disclosed in the statement of changes in equity represents the impact on retained earnings of releasing the fair value charge accrued under IFRS 2 Share-based payment, which for deferred bonus scheme is partially matched by the release of own-shares held.
a) Employee share option scheme
The Group has in place a share option scheme which issued options over shares in the Company. There have been various performance conditions attached to share option grants including EPS, share-price and share purchase conditions. Options are usually forfeited if an employee leaves the Group before the options vest.
Details of share options outstanding are as follows:
GroupNumber of
share options
Weighted average
exercise price
Weighted average
share price at
exercise Exercise price range
At 1 December 2012 3,112,900 £1.37 £0.51 - £2.05
Lapsed during the year (1,569,500) £0.93
At 30 November 2013 1,543,400 £1.81 £1.45 - £2.05
Exercised during the year (14,000) £1.54 £1.57
Lapsed during the year (250,400) £1.58
At 30 November 2014 1,279,000 £1.86 £1.54 - £2.05
The options outstanding at 30 November 2014 had a weighted average contractual life of 2.4 years (2013: 3.0 years).
All of the outstanding options at the end of the current and prior period are exercisable. No option grants were made under this scheme in the current year (2013: nil).

8888
b) Performance share plans
The Group uses performance share plans for the remuneration of senior executives and senior management. Details of Directors’ awards are contained within the Remuneration Report. Participation has been subject to various vesting conditions, including EPS, total shareholder return and share price conditions. If the participants leave the Group’s employment then in most circumstances the award lapses.
Details of performance share plan shares are as follows:
Group Maximum number of shares Market price on grant
At 1 December 2012 5,091,505
Granted during the year 1,615,000 £0.74
Lapsed during the year (1,112,238)
At 30 November 2013 5,594,267
Granted during the year 1,755,000 £1.55
Lapsed during the year (2,003,444)
At 30 November 2014 5,345,823
The plans outstanding at 30 November 2014 had a weighted average contractual life of 1.3 years (2013: 1.3 years).
The fair values of shares granted during the year are determined using a Monte-Carlo model which gives a fair value of £1.01 per share under the TSR performance condition.
Inputs to the model are as follows:
Group4 August 2014
TSR
Share price at grant £1.55
Exercise price £nil
Expected life 3 years
Expected dividends 2.20%
The expected life used in the modelling has been adjusted, based on management’s best estimate, for the effects of non-transferability and exercise restrictions.
Comparator company volatility is assessed using annualised, daily historic TSR growth assessed over a period prior to the date of grant that corresponds to the performance period of three years. The company correlation uses historic pairwise correlations of the companies over a three year period. The fair value of the TSR element is based on a large number of stochastic projections of Company and comparator TSR.
In March 2003 the Company established the RM plc Employee Share Trust to hedge the future obligations of the Group in respect of shares schemes awarded. These shares are used to hedge the estimated liability but until vesting represents own shares held – see note 24.
c) Staff share schemes
The RM plc 2002 Staff Share Scheme historically made annual grants of shares in RM plc to almost all employees, although no awards were made in the current year or the prior year. At grant, the Trustee of the scheme purchased shares on the open market and held these in trust on behalf of the employees, hence the shares are not shown in the Group or Company balance sheets. The shares vest to the employees after a minimum of three years, but normally after five years. The scheme is an HMRC approved employee share scheme constituted under a trust.

89
The Scheme holds the following shares:
GroupOrdinary shares of 2p
Number
Ordinary shares of 22/7p Number £000
RM plc 2002 Staff Share Scheme 358,834 - 588
RML Staff Share Scheme 1,361 - 1
At 1 December 2012 360,195 - 589
Sold or transferred (32,958) - (54)
At 30 November 2013 327,237 - 535
RM plc 2002 Staff Share Scheme 325,876 - 534
RML Staff Share Scheme 1,361 - 1
At 30 November 2013 327,237 - 535
Transferred into own shares (1,361) - (1)
Sold or transferred (43,555) (71)
Share consolidation (282,321) 246,827 -
Sold or transferred - (40,261) (76)
At 30 November 2014 - 206,566 387
RM plc 2002 Staff Share Scheme - 206,566 387
These shares are held for staff and therefore not included in the Group or Company balance sheet.
d) Deferred bonus plan
The Group had in place a deferred bonus plan for the remuneration of executives and senior management. The remaining outstanding award vested in February 2014, and the Board has no plans to utilise this scheme in the future.
Details of deferred bonus grants outstanding are as follows:
Group Number of bonus shares Market price on grant
At 1 December 2012 and 30 November 2013 40,074
Released during the year (40,074) £1.30
At 30 November 2014 -
Performance conditions – estimation uncertainty
Assigning a fair value charge to share-based payments requires estimation of: the projected share price; the number of instruments which are likely to vest; other non-market based performance conditions. Assigning a fair value charge requires continuing reassessment of these estimates.
26. Guarantees and contingent liabilitiesGuarantees
The Company has entered into guarantees relating to the performance and liabilities of certain major contracts of its subsidiaries. The Directors are not aware of any circumstances that have given rise to any liability under such guarantees and consider the possibility of any arising to be remote.
Contingent liabilities
The Group has provided performance guarantees and indemnities relating to performance bonds and letters of credit issued by its banks on its behalf, in the ordinary course of business. The Directors are not aware of any circumstances that have given rise to any liability under such guarantees and indemnities and consider the possibility of any arising to be remote.

9090
27. CommitmentsOperating leases
The Group had outstanding commitments for future minimum lease payments (to the next lease break or to the end of the lease, whichever is sooner) under non-cancellable operating leases which fall due as follows:
Group2014
£000
2013 £000
Within 1 year 3,347 3,593
In years 2 to 5 inclusive 9,824 6,799
After year 5 621 1,461
13,792 11,853
Operating lease commitments represent rentals payable by the Group for certain of its office properties and include the period up to the first break clause of the lease.
The terms of these leases are subject to renegotiation on average terms of 2.5 years (2013: 4.2 years) and rentals are fixed for an average of 2.0 years (2013: 1.7 years).
The Company had no operating leases during the year.
Capital commitments
The Group had the following capital expenditure commitments:
Group2014
£000
2013 £000
Contracted but not provided for 243 -
The Company had no capital commitments at the end of either year.
28. Financial risk managementCarrying value of financial assets and financial liabilities
Group Company
2014 £000
2013 £000
2014 £000
2013 £000
Financial assets
Trade and other receivables - current 27,863 28,734 14,372 104
Trade and other receivables - non-current 1,878 1,911 1,628 1,661
Cash and short-term deposits 47,893 63,169 - -
77,634 93,814 16,000 1,765
Financial liabilities
Trade and other payables - current (65,126) (64,027) (29,002) -
Trade and other payables - non-current (49) (438) - -
Provisions - current (3,660) (7,201) - -
Provisions - non-current (5,507) (6,255) (4,893) (429)
(74,342) (77,921) (33,895) (429)
All financial assets are classified as loans and receivables except for forward foreign exchange contracts of £565,000 (2013: £4,000) which are classified as fair value through profit or loss.

91
The Directors consider that the carrying amount of all financial assets and financial liabilities approximates their fair value. Fair value information for financial assets and financial liabilities not shown at fair value is therefore not disclosed.
It is, and has been throughout the period under review, the Group’s policy that no trading in financial instruments shall be undertaken and the Group does not hold or issue derivative financial instruments for speculative purposes.
The main risks arising from the Company’s financial assets and liabilities are market risk (foreign currency risk and interest rate risk), credit risk and liquidity risk. The Board reviews and agrees policies on a regular basis for managing the risks associated with these assets and liabilities.
Foreign currency risk
Translation
During the year the Group held operations in the United States of America and India and trades internationally, exposing the Group to foreign exchange risk on non-Sterling assets, liabilities and cash flows. The individual Group companies have long-term intra-group loans of £8,905,000 (2013: £8,513,000) denominated in US dollars and the Group applies net investment hedging to the balances.
The Group also maintains foreign currency denominated cash accounts, but only holds balances required to settle its payables.
Transaction
Operations are also subject to foreign exchange risk from transactions in currencies other than their functional currency, and once recognised, the revaluation of foreign currency denominated assets and liabilities. Principally, this relates to transactions arising in US dollars and Indian Rupees. Specifically, the Group purchases a proportion of its inventory in US dollars and operating costs in the Group’s subsidiary RM Education Solutions India Pvt Ltd are in Indian Rupees.
In order to manage these risks the Group enters into derivative transactions in the form of forward foreign currency contracts. To manage the US dollar to Sterling risk, the forward foreign currency contracts purchased are designed to cover 85% of forecast currency denominated purchases and the contracts are set up to provide coverage over the fixed price periods of up to 12 months. To manage the Indian Rupee to Sterling risk, the contracts purchased are designed to cover 80% of forecast Rupee costs and are renewed on a revolving basis of approximately 11 to 12 months.
The total amount of outstanding forward foreign exchange contracts to which the Group was committed was:
2014 2013
GroupNominal Value
£000
Fair Value
£000
Nominal Value
£000
Fair Value
£000
Forward foreign exchange contracts 9,485 562 9,315 (540)
The fair value of the derivative financial instruments is estimated by discounting the future contracted cash flow, using readily available market data and represents a level 2 measurement in the fair value hierarchy under IFRS 7. These fair value gains/(losses) are included within trade and other receivables and trade and other payables respectively.
Of these, forward foreign currency exchange contracts with a nominal value of £9,500,000 (2013: £8,700,000) and fair value gain of £562,000 (2013: loss £528,000) have been designated as effective hedges in accordance with IAS 39 Financial Instruments: Recognition and Measurement. The movement in fair value of hedged derivative financial instruments during the year was a credit of £1,090,000 (2013: debit £529,000) which has been recognised in Other comprehensive income and presented in the hedging reserve in equity. In addition the Group retain the gain or loss on realised foreign currency contracts used to hedge non-financial assets which are realised when the asset is recognised. A fair value loss of £18,000 (2013: £54,000 gain) has been realised on forward contracts which were designated as effective hedges in accordance with IAS 39 Financial Instruments: Recognition and Measurement. The movement in value of realised forward contracts was a debit of £72,000 (2013: credit £94,000) which has been recognised in Other comprehensive income and presented in the hedging reserve in equity.
No forward foreign currency exchange contracts have been designated as ineffective hedges in accordance with IAS 39 Financial Instruments: Recognition and Measurement (2013: nominal value £600,000, fair value loss £12,000, charge to income £19,000).
Commercially effective hedges may lead to income statement volatility in the future, particularly if the hedges do not meet the criteria of an effective hedge in accordance with IAS 39 Financial Instruments: Recognition and Measurement.

9292
Foreign exchange rate sensitivity
The following table details how the Group’s income and equity would increase/(decrease) if there was a 10% increase in the amount of the respective currency which could be purchased with £1 Sterling (assuming all other variables remain constant), for example from $1.60:£1 to $1.76:£1 at the balance sheet date. The sensitivity analysis includes only outstanding foreign currency denominated monetary items and adjusts their translation at the period end for a 10% change in foreign currency. A 10% weakening of Sterling against the relevant currency would be estimated to have a comparable but opposite impact on income and equity.
Sensitivity 2014 2013
GroupIncome
£000
Equity
£000
Income
£000
Equity
£000
10% increase in foreign exchange rates against Sterling:
US Dollar 4 525 115 637
Indian Rupee 45 (117) (14) (175)
Euro 7 (41) 12 (38)
In management’s opinion, the sensitivity analysis is unrepresentative of the inherent foreign exchange risk as the period end exposure does not reflect the exposure during the period, as the analysis does not reflect management’s proactive monitoring methods and processes for exchange risk.
Interest rate risk
The only significant interest bearing financial assets held by the Group are cash and short-term deposits which comprise cash held by the Group and Company and short-term bank deposits with an original maturity of six months or less. Surplus sterling balances are invested in the money market, or with financial institutions on maturing terms from within 24 hours up to a period of six months with interest earned based on the relevant national inter-bank rates available at the time of investing. During the year, average cash and short-term deposits were £47,460,000 (2013: £47,670,000), and the maximum bank overdraft was £nil (2013: £nil).
The interest and currency profile of cash and short-term deposits is shown below:
2014 2013
GroupFloating rate
£000
Interest free
£000
Total
£000
Floating rate
£000
Interest free
£000
Total
£000
Sterling cash and cash equivalents 35,633 5,722 41,355 54,229 1,984 56,213
Sterling short-term deposits 6,000 - 6,000 6,000 - 6,000
US Dollar - 126 126 - 474 474
Euro - 72 72 - 120 120
Indian Rupee - 289 289 195 143 338
Singapore Dollar - 51 51 - 24 24
41,633 6,260 47,893 60,424 2,745 63,169
The Group has a £30,000,000 committed Barclays revolving credit facility signed on 27 January 2012, £3,000,000 of which is allocated to an on demand working capital facility and £600,000 allocated to a performance bond facility, leaving £26,400,000 unallocated.
Interest payable on any utilised revolving credit facility is fixed 2.5% above LIBOR for the remainder of the 3 year committed term subject to certain financial ratios. A commitment fee of 1.2% is payable on the unutilised balance and an arrangement fee of £75,000 (2013: £75,000) has been paid in 2014 and is recognised in the Consolidated Income Statement on an effective interest rate basis over the duration of the facility. The total paid since the inception of the facility is £550,000.

93
The weighted average effective interest rates at the balance sheet date were as follows:
2014 2013
GroupFloating rate
£000
Weighted
average interest
rate
%
Floating rate
£000
Weighted average
interest rate
%
Financial assets:
Cash and short-term deposits 41,633 0.55 63,169 0.55
Trade and other receivables (non-current) 1,878 10.39 1,911 10.41
The interest rate risk sensitivity (assuming all other variables remain constant) is as follows:
2014 2013
Group
Income
sensitivity
£000
Equity
sensitivity
£000
Income
sensitivity
£000
Equity
sensitivity
£000
1% increase in interest rates 437 437 419 419
1% decrease in interest rates (437) (437) (419) (419)
Credit risk
The Group’s principal financial assets are bank balances and trade and other receivables. The Group’s credit risk is primarily attributable to its trade receivables. Credit checks are performed on new customers and before credit limits are increased. The amounts presented in the balance sheet are net of allowances for doubtful receivables. Note 18 includes an analysis of trade receivables by type of customer and of the ageing of unimpaired trade receivables.
The credit risk on liquid funds and derivative financial instruments is limited because the counterparties are banks with high credit-ratings assigned by international credit-rating agencies. The Group has no significant concentration of credit risk, with exposure spread over a large number of counterparties and customers and a large proportion are ultimately backed by the UK Government.
The carrying amount of financial assets represents the maximum credit exposure. The Group does not hold any collateral to cover its risks associated with financial assets.
Liquidity risk
Cash is managed to ensure that sufficient liquid funds are available with a variety of counterparties, to meet short, medium and long-term cash flow forecasting requirements.
The Group meets its seasonal working capital requirements from current funds. At the balance sheet date, the Group had a £30,000,000 three year committed revolving credit facility to March 2017 held with Barclays Bank, of which £3,600,000 has been allocated. The unallocated facilities at the end of the year were £26,400,000 of working capital funding capacity at the end of the year. At 30 November 2014 £300,000 of the performance bond facility was drawn down (2013: £570,000).

9494
Capital management
The Group monitors capital through the calculation and review of economic profit. A monthly working capital charge on Group operating assets (excluding primarily goodwill, cash, provisions treated as adjustments and tax balances) or credit on Group operating liabilities is applied to the Group adjusted operating profit to provide economic profit, as follows:
Year ended 30 November 2014
£000
Year ended 30 November 2013
£000
Adjusted profit from operations 18,526 17,209
Capital return on operating liabilities 2,295 1,831
Economic profit 20,821 19,040
29. Related party transactionsKey management personnel
The remuneration of the Directors and other key management personnel of the Group during the year, in aggregate, was:
Company
Year ended 30 November 2014
£000
Year ended 30 November 2013
£000
Short-term employee benefits 3,065 2,855
Post-employment benefits 285 327
Termination payments 169 -
Share-based payment 578 281
Share-based payments above include a fair value charge for executive Directors of £136,000 in respect of awards to David Brooks (2013: £89,000) and £104,000 in respect of Iain McIntosh (2013: £75,000).
Further information about the remuneration of individual Directors is provided in the audited part of the Remuneration Report.
Transactions between the Company and its subsidiary undertakings
During the year, the Company entered into the following transactions with its subsidiary undertakings:
Company
Year ended 30 November 2014
£000
Year ended 30 November 2013
£000
Receipts/(payments)
Management recharges (447) (348)
Net inter-company interest income 37 122
Dividends received 8,000 6,200
Total amounts owed between the Company and its subsidiary undertakings are disclosed in notes 18 and 20 respectively.
Other related party transactions
TES Global Limited
RM plc Board Director Lord Andrew Adonis is a member of the Advisory Board of TES Global Limited (formerly TSL Education Limited), from which the Group made purchases of £5,512 (2013: £26,094) and to which the Group made sales of £1,778 during the year (2013: £nil).

95
Dods (Group) plc
RM plc Board Director Lord Andrew Adonis is a director of Dods (Group) plc from which the Group made purchases of £474 during the year.
Ofcom
Jo Connell, who was an RM plc Board Director until 19 March 2014, is the Chair of the Advisory Committee for Older and Disabled People within Ofcom, from which the Group made purchases of £8,550 during the year (2013: £8,330).
Wates Group Limited
RM plc Board Director Deena Mattar is a director of Wates Group Limited, to which no sales were made by the Group during the year (2013: £70,000) but there was a retention balance owing to the Group of £2,106 at 30 November 2014.
PricewaterhouseCoopers LLP
The Group uses PricewaterhouseCoopers LLP to provide certain consultancy and assurance services, but excluding external audit services. RM Board Director Iain McIntosh’s wife is an equity partner in PricewaterhouseCoopers. She has not been involved in any services provided to the Group. The Group made purchases from PricewaterhouseCoopers for the year ended 30 November 2014 of £255,350 (2013: £27,800) and the balance outstanding at 30 November 2014 was £nil (30 November 2013: £26,160).
The Group encourages its Directors and employees to be Governors, Trustees or equivalent of educational establishments. The Group trades with these establishments in the normal course of its business.
30. Events after the reporting periodOn 2 December 2014, after the balance sheet date, the awards granted in December 2011 and February 2012 under the RM plc Performance Share Plan 2010 vested to participants, with 2,146,000 shares vesting. Details of Performance Share Plan awards can be found in note 25 b).
The Group’s obligations under the awards were satisfied with shares held by the RM plc Employee Share Trust (see note 24 for details of Trust holdings at 30 November 2014).
Following vesting of the awards, the RM plc Employee Share Trust repurchased 1,438,000 shares from participants at a cash cost of £2,293,000, being the market value of the shares at the close of business on 1 December 2014. The repurchase was made via agreement with participants made before 30 November 2014, taking into account participants’ wishes to retain or realise vesting shares (particularly in order to cover individual tax liabilities arising).
This transaction is not an adjusting post balance sheet event and will be recorded in the Financial Statements for the year ending 30 November 2015.

96
Shareholder Information
Financial calendar Ex-dividend date for 2014 final dividend 12 March 2015
Record date for 2014 final dividend 13 March 2015
Annual General Meeting 25 March 2015
Payment of 2014 final dividend 10 April 2015
Announcement of 2015 interim results July 2015
Preliminary announcement of 2015 results February 2016
Corporate websiteInformation about the Group’s activities is available from RM at www.rmplc.com.

97
Investor informationInformation for investors is available at www.rmplc.com. Enquiries can be directed to Greg Davidson, Company Secretary, at the Group head office address or at [email protected].
Registrars and shareholding informationShareholders can access the details of their holdings in RM plc via the Shareholder Services option within the investor section of the corporate website at www.rmplc.com. Shareholders can also make changes to their address details and dividend mandates online. All enquiries about individual shareholder matters should be made to the registrar either via email at [email protected] or telephone: 0871 664 0300 (calls cost 10p per minute plus network extras; lines are open 8.30am to 5.30pm, Monday to Friday). To help shareholders, the Capita website at www.capitaassetservices.com contains a shareholders’ frequently asked questions section.
Electronic communicationShareholders are able to receive Company communication via email. By registering your email address, you will receive emails with a web link to information posted on our website. This can include our report and financial statements, notice of meetings and other information we communicate to our shareholders.
Electronic communication brings numerous benefits, which include helping us reduce our impact on the environment, increased security (your documents cannot be lost in the post or read by others), faster notification of information and updates, easy access (you can check your shareholding and account transactions online at any time) and convenience (you can change your name, address or dividend mandate details online). To sign-up to receive e-communications go to Capita Asset Services’ Share Portal at www.capitashareportal.com.
Beneficial shareholders with ‘information rights’Please note that beneficial owners of shares who have been nominated by the registered holders of those shares to receive information rights under section 146 of the Companies Act 2006 are required to direct all communications to the registered holder of their shares rather than to Capita Asset Services, or to the Company directly.
Multiple accounts on the shareholder registerIf you have received two or more copies of this document, it may be because there is more than one account in your name on the shareholder register. This may be due to either your name or address appearing on each account in a slightly different way. For security reasons, Capita will not amalgamate the accounts without your written consent. If you would like to amalgamate your multiple accounts into one account, please write to Capita Asset Services.
Company SecretaryGreg Davidson
Group head office and registered office140 Eastern Avenue Milton Park Milton Abingdon Oxfordshire OX14 4SB United Kingdom
Telephone: +44 (0)8450 700 300
Registered numberRM plc’s registered number is 01749877.
AuditorKPMG LLP Arlington Business Park Theale Reading RG7 4SD
Financial Adviser and StockbrokerNumis Securities Ltd 10 Paternoster Square London EC4M 7LT
Financial Public RelationsFTI Consulting Ltd 200 Aldersgate Aldersgate Street London EC1A 4HD
RegistrarCapita Asset Services The Registry 34 Beckenham Road Beckenham Kent BR3 4TU
Legal AdviserOsborne Clarke One London Wall London EC2Y 5EB

RM plc140 Eastern Avenue Milton Park Milton Abingdon Oxfordshire OX14 4SB
Telephone: +44 (0)8450 700 300 Fax: +44 (0)8450 700 400
Stock code: RM.
www.rmplc.com
RM plc Annual Report and Financial Statem
ents – Year ended 30 Novem
ber 2014