technology and policy options for making … · transport technology and policy options ... world...
TRANSCRIPT
CSD19/2011/BP2
UNITED NATIONS DEPARTMENT OF ECONOMIC AND SOCIAL AFFAIRS
Commission on Sustainable Development Nineteenth Session New York, 2-13 May 2011
TECHNOLOGY AND POLICY OPTIONS FOR MAKING TRANSPORT SYSTEMS MORE SUSTAINABLE
Prepared by
Karlson 'Charlie' Hargroves Adjunct Associate Professor
Curtin University Sustainability Policy Institute Principal Researcher, The Natural Edge Project
and
Ernst Ulrich von Weizsäcker Co-Chair of the International Resource Panel
United Nations Environmental Programme (UNEP)
Background Paper No.2 CSD19/2011/BP2

CSD19/2011/BP2
CONTENTS
I. Introduction 1
A. Key transport issues and trends 1 B. Transportation related issues in developing countries 3
II. City scale: encouriaging cities to reduce car use and congestion 7
A. Encouraging alternatives to the use of cars 7 B. Investing in public transport and other modes 10
III. National scale: encouraging a shift to low carbon intensive modes 13
A. Encouraging alternatives to the use of trucks for long-haul freight 15 B. Encouraging alternatives to air travel 14
IV. National/International scale: reducing the energy/carbon intensity of vehicles 15
A. Decarbonising cars and light vehicles 15 B. Decarbonising heavy freight trucks 17 C. Decarbonising aircraft, rail and shipping 18
V. Conclusions and recomme ndations 23
CSD19/2011/BP2
1
Transport Technology and Policy Options for Making Transport Systems More Sustainable
Karlson 'Charlie' Hargroves, Adjunct Associate Professor,
Curtin University Sustainability Policy Institute Principal Researcher, The Natural Edge Project
and Ernst Ulrich von Weizsäcker
Co-Chair of the International Resource Panel United Nations Environmental Programme (UNEP)
I. INTRODUCTION A. Key transport issues and trends
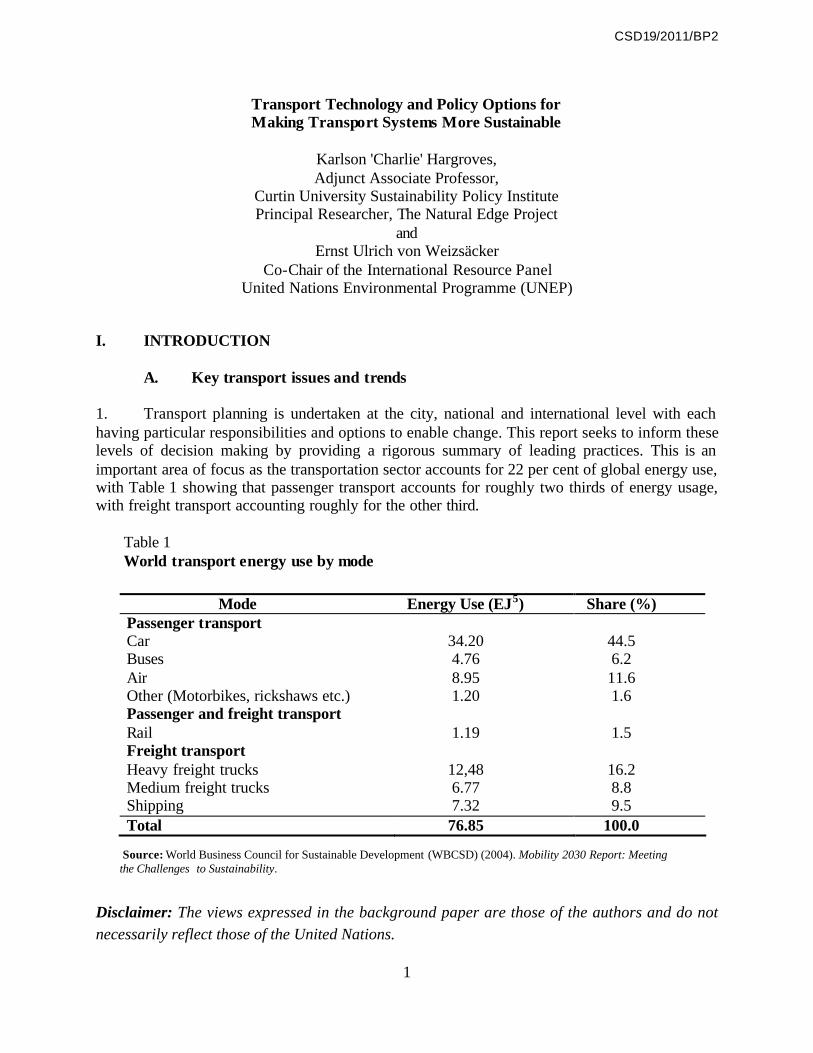
1. Transport planning is undertaken at the city, national and international level with each having particular responsibilities and options to enable change. This report seeks to inform these levels of decision making by providing a rigorous summary of leading practices. This is an important area of focus as the transportation sector accounts for 22 per cent of global energy use, with Table 1 showing that passenger transport accounts for roughly two thirds of energy usage, with freight transport accounting roughly for the other third. Table 1 World transport energy use by mode
Mode Energy Use (EJ5) Share (%) Passenger transport Car 34.20 44.5 Buses 4.76 6.2 Air 8.95 11.6 Other (Motorbikes, rickshaws etc.) 1.20 1.6 Passenger and freight transport Rail 1.19 1.5 Freight transport Heavy freight trucks 12,48 16.2 Medium freight trucks 6.77 8.8 Shipping 7.32 9.5 Total 76.85 100.0
Source: World Business Council for Sustainable Development (WBCSD) (2004). Mobility 2030 Report: Meeting the Challenges to Sustainability.
Disclaimer: The views expressed in the background paper are those of the authors and do not necessarily reflect those of the United Nations.

CSD19/2011/BP2
2
2. Virtually all energy for transportation comes from petroleum based fuels. Thus one of the most pressing issues related to the transportation sector is local air pollution as well as its significant and growing contribution to global greenhouse gas emissions. According to the Intergovernmental Panel on Climate Change (IPCC) in 2004, the global transportation sector was responsible for 23 per cent of world energy-related CO2 emissions 1. Hence transportation will form an important and vital part of climate change related programmes both at the city and national levels. 3. There has been exponential growth in private car ownership, with the 200 million cars in operation in 1970 expected to reach 12 billion by 2030, with much of this pressure felt by cities. As can be seem from Figure 1, in 2001 road transport via cars (light duty vehicles) and freight trucks accounted for the majority of total transport CO2 emissions, some 74 per cent, with air travel close behind. Hence, strategies at the city level and the national level that intend to reduce the environmental impact from the transportation sector will need to include a strong focus on both light vehicles and trucks.
Figure 1 Current and projected transport-related well-to-wheels
CO2 emissions (per annum)
Source: WBCSD.
4. To achieve sustainable mobility in the coming decades the re are a range of strategies that can be applied at the city, national and international level. Strategies for sustainable transportation will need to be carefully investigated and implemented, and hence are the focus of this report:
1 IPCC (2007). Climate Change 2007 Mitigation of Climate Change, Contribution of Working Group III to the Fourth Assessment Report of the Intergovernmental Panel on Climate, Cambridge University Press, Cambridge, see “Transport and its Infrastructure”.
CSD19/2011/BP2
3
• City Scale: This report focuses on presenting evidence and recommendations to assist in encouraging cities to reduce car use through the offer of attractive alternatives to cars, such as public transport and other modes of transport.
• National Scale: This report focuses on presenting evidence and recommendations to assist in encouraging a shift to low carbon intensive transport modes through the use of alternatives to freight trucks for long-haul freight carriage, and by encouraging alternatives to air travel.
• National/International Scale: This report focuses on presenting evidence and recommendations to assist in reducing the carbon intensity of vehicles such as cars and light vehicles, heavy freight trucks, and aircrafts, railway services and shipping.
5. When seeking to address issues related to transportation, an integrated approach is required that considers the range of economic, social and environmental issues associated with transport systems, that are applicable to local and national levels of decision making.
B. Transportation related issues in developing countries 6. Due to the rapid motorisation of transportation systems in many developing countries, the amount of transport fuel being consumed is rapidly rising. For instance between 1982 and 2002 the number of motorcycles in India increased from an estimated 3 million to 42 million, 2 and in China numbers increased from 200,000 to over 50 million. 3 Furthermore, in Beijing, for instance, approximately 1,300 new vehicles are registered each day, while in Bangalore, India the daily figure is more than 900.4 7. Such rapid growth is causing a number of the issues raised in Table 2. However they are being experienced at an unprecedented rate and scale when compared to the experience of developed countries, particularly with regard to traffic congestion, traffic accidents, and the adverse health effects from air pollution. A study conducted in 1999 by a leading Indian environmental NGO revealed that as many as 10,000 people die prematurely in Delhi due to air pollution primarily from vehicles each year,5 which is equivalent to an average of one death every 52 minutes. This is not unique to Delhi as currently only a few major cities in Asia have pollution levels below the World Health Organisations (WHO) recommended limits.6 However as Table 3 shows that there is growing precedent for taking positive action in the transportation sector in developing countries.
2 Ministry of Road Transport and Highways (2003). Handbook on Transport Statistics in India, Transport Research Office, Ministry of Road Transport and Highways, Delhi, India. Cited in Pucher, John, Peng, Zhong-ren, Mittal, Neha, Zhu, Yi and Korattyswaroopam, Nisha (2007). Urban Transport Trends and Policies in China and India: Impacts of Rapid Economic Growth, Transport Reviews, 27:4, 379 - 410 3 National Bureau of Statistics of China (2004). China Statistical Yearbook 2003. China Statistical Press, Beijing, China. Cited in Pucher, John, Peng, Zhong-ren, Mittal, Neha, Zhu, Yi and Korattyswaroopam, Nisha , (2007) Urban Transport Trends and Policies in China and India: Impacts of Rapid Economic Growth, Transport Reviews, 27:4, 379 - 410 4 Clean Air Initiative for Asian Cities Centre (2007). 2007 Annual Report. Clean Air Initiative for Asian Cities Centre. 5 Centre for Science and Environment (1999). Sick of Air Pollution, Press Release, CSE, 5 June 1999. 6 Clean Air Initiative for Asian Cities Centre (2007). 2007 Annual Report. Clean Air Initiative for Asian Cities Centre, Clean Air Initiative for Asian Cities Centre.

CSD19/2011/BP2
4
Table 2 Economic, social and environmental considerations related to decarbonising the transport sector
Economic Social Environmental Deterioration of infrastructure from air pollution (e.g. tropospheric ozone caused by vehicle emissions is estimated to cost the UK economy US$135 million/year through rubber decomposition and disintegration)
Air pollution related health effects (e.g. a 1999 study revealed that as many as 10,000 people die prematurely in Delhi due to air pollution each year, equivalent to an average of one death every 52 minutes in the city)
Generation of greenhouse gases (e.g. in 2004 the global transportation sector was responsible for 23 per cent of world energy-related CO2 emissions, with road transport accounting for 74 per cent)
Reduced agricultural yields from air pollution (e.g. tropospheric ozone is estimated to cause up to US$12 billion/year in lost production in Europe)
Corrosion of heritage structures (e.g. sulphur and nitrogen oxides corrode buildings and heritage structures, such as the Taj Mahal in India and the Colosseum in Rome)
Oil depletion (e.g. oil demand is projected to grow from 85 million barrels per day in 2008 to 105 mb/d in 2030. Conventional oil production is set to peak around 2010 in non-OPEC countries)
Costs related to climate change (e.g. according to the Stern Review, costs related to climate change may be as high as 20 per cent of GDP)
Public health and fitness (e.g. it has been estimated that for every 60 minutes spent in the motor vehicle on average per day, the probability of a participant being obese increases by 6 per cent)
Air pollution (e.g. the formation of photochemical smog and tropospheric ozone, release of particulate matter such as PM10, along with the products of incomplete combustion of fossil fuels, such as benzene and ethylene)
Traffic congestion (e.g. in 2003 it was estimated that congestion cost UK businesses as much as GBP15 billion/ year)
Inequity (e.g. more than half the population in automobile dependant cities are transportation disadvantaged as they do not drive because they are too young, too old, too poor or disabled)
Acidification (e.g. along with coal fired electricity generation transport emissions contribute to acidification that can lead to a loss of resilience of ecosystems)
Infrastructure investment (e.g. cities that focus on road systems can spend up to 17 per cent of their wealth, where as cities focused on integrated public transport systems spend as much as 5 per cent)
Community development (e.g. community and neighbourhood interactions are lessened in low public transport cities)
Land use (e.g. the loss of land to parking spaces and roads greatly reduces the amount of productive land available)
Sources: 1. Watkiss, P. (2004). Damage Costs for Air Pollution. DEFRA, London. 2. Centre for Science and Environment (1999). Sick of Air Pollution. Press Release, CSE, 5 June 1999. 3. Holland, M., Kinghorn, S., Emberson, L., Cinderby, S., Ashmore, M., Mills, G. and Harmens, H. (2006). Development of a framework for probabilistic assessment of the economic losses caused by ozone damage to crops in Europe. CEH project No. C02309NEW. Centre for Ecology and Hydrology, Natural Environment Research Council, Bangor, Wales. 4. International Energy Agency (2009). World Energy Outlook , IEA. 5. Stern, N. (2006). The Stern Review: the Economics of Climate Change. Cambridge University Press, Cambridge. 6. Haagen-Smit, A. and Fox, M. (2009). Ozone formation in photochemical oxidation of organic substances . Industrial and Engineering Chemistry, vol 48, p1484.
CSD19/2011/BP2
5
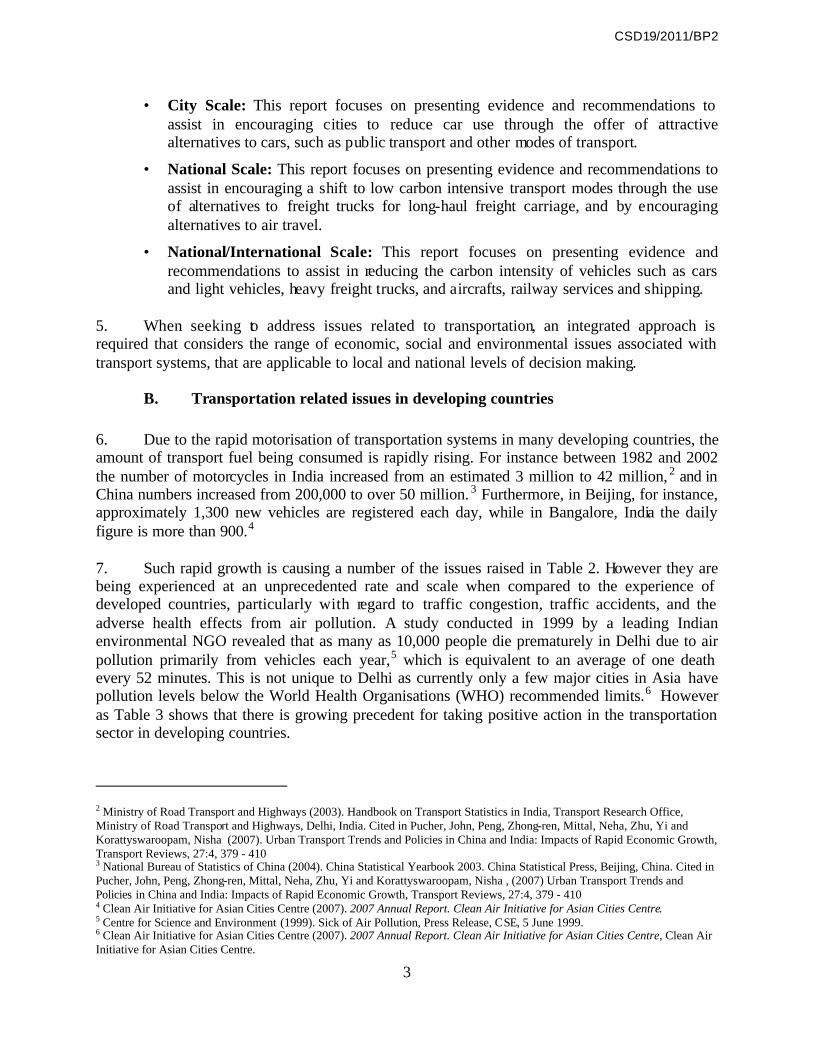
Table 3 Examples of leading efforts in developing countries to reduce transport fuel consumption and associated air pollution
City Initiative
Curitiba Brazil
The now famous case of Curitiba successfully uses a bus rapid transit system with dedicated bus lanes to provide cost effective transport options that are comparable with private car use, thus reducing fossil fuel consumption and air pollution. Some 70 per cent of commuters use transit, despite per capita income well above the national average. Curitiba has now achieved one of the lowest ambient air pollution levels in the country, and this success has inspired many other cities to also invest in effective rapid bus transit, such as the TransMilenio in Bogotá, Colombia, the Orange Line of Los Angeles, California, the Transmetro system in Guatemala City, and the Metrobús of Mexico City.
Bogotá Colombia
In 1998, Bogotá mayor, Enrique Penalosa, began an urban renewal campaign. Modelled on Curitiba’s bus system, a new TransMilenio Bus Rapid Transit system was built which now carries over 1.4 million passengers per day. Furthermore, a doubling of parking costs was imposed, along with a 20 per cent increase in fuel taxes. The proceeds directly funded the upgrades to the public transport system. Curitiba and Bogota are showing that sustainable transport – cycling, walking and buses – can comfortably manage over 50 per cent of commutes, with reduced air pollution and greenhouse gas emissions, as well as improved health and economic outcomes. In Bogota, 85 per cent of residents now live within 500 metres of a bus service.
Guayaquil Ecuador
In Guayaquil, Ecuador, in 2006, Mayor Nebot opened the first 15 kilometres (9.3 miles) of the Metrovia bus rapid transit system to provide a cleaner, higher quality service and reduce trip times in key travel corridors. In 2008, the bus system has been expanded to 45 kilometres (28 miles) and serves over 200,000 daily passengers. Since 2006, the city has run ‘Car-Free Sundays’, closing Central Business District streets to traffic to encourage residents to participate in city-life by walking and riding bicycles.
Mexico City Mexico
In 2007, the Mayor of Mexico City launched a new “Plan Verde” (Green Plan) committed to expanding Metrobus (the city’s bus rapid transit system), and increasing pedestrian and bicycle paths. The plan also included other measures to reduce air pollution, such as an expansion of the “Hoy No Circula” (Today Don't Drive) programme, where drivers are prohibited from using their vehicles one weekday per week based on their license plate numbers.
Source: Complied from sources and presented in Smith, M., Hargroves, K. and Desha, C. (2010). Cents and Sustainability: Securing Our Common Future through Decoupling Economic Growth from Environmental Pressures , Earthscan and The Natural Edge Project. 8. Globally, in 2005, 81 countries had still not banned leaded petrol, 80 of which were non-OECD countries.7 Encouragingly, by 2006 a number of African nations had made a significant commitment to ban leaded petrol, due mostly to the work of “The Partnership for Clean Fuels and Vehicles (PCFV)” launched at the World Summit on Sustainable Development in
7 Lead Group Inc (2005). 81 Countries possibly still to ban leaded petrol as at 20th Oct 2005. Available form www.lead.org.au/fs/fst27superseded.html, accessed 12 July 2009.
CSD19/2011/BP2
6
Johannesburg, South Africa in 2002. Economists have calculated that making gasoline unleaded rarely costs more than 2 cents a litre and countries can save 5-10 times as much as that through health and economic cost savings. The World Bank points out that when the United States converted to unleaded gasoline, it saved more than US$10 for every US$1 invested due to reduced health costs, savings on engine maintenance, and improved fuel efficiency. 8 Leaded gasoline, because it contains lead salts and halogen acids, causes greater corrosion of automobile exhaust systems and requires more frequent oil and spark plug changes. As of today, there are still some developing countries still using leaded petrol. Continued technical cooperation and assistance will be essential to achieve a complete global phase-out of the use of lead in petrol. 9. Another air pollution related issue that particularly affects developing countries is particulate matter (PM). The WHO believes that reducing levels of one particular type of pollutant, PM10 (meaning particular matter smaller than 10 micrometres, or “microns”) could reduce deaths in polluted cities by as much as 15 per cent every year9 - with 500,000 attributed deaths recorded in Asia and the Pacific in the year 2000 alone.10 Combustion of fossil fuels is the principal source of fine particle emissions. Older coal- fired power plants, industrial boilers, diesel and gasoline-powered vehicles, and wood stoves are also major sources of the pollution. Particles larger than 10 microns in diameter generally do not penetrate into the lungs, and have a short residence time in the atmosphere, however, PM10 will enter the nasal cavity and PM2.5 can enter the bronchia and lungs. These smaller particles have been proven, through epidemiological research, to be linked to adverse effects on health, and even at levels well below the current standards of many nations the smaller particles have proved to adversely affect the health of those exposed. 10. The WHO’s air quality standards recommend that the concentration of suspended particulates should be less than 90 µg/m3. In many cities, however, this number is often higher, with Beijing experiencing levels that are often three times higher. When exposed to such particles people with heart or lung diseases and the elderly are at a higher risk, with health affects resulting from exposures lasting as little as 24 hours or less. Long-term exposures of a year or more have been linked to the development of lung diseases, such as chronic bronchitis. Those exposed to the particles who already have a lung disease may not be able to breathe as deeply or vigorously as normal, and may have respiratory difficulties. Since particulate air pollution is produced from numerous sources, it needs to be addressed through an integrated approach which reduces particulate pollution through a range of strategies. The strategies related to transportation include emission control devices for motor vehicles and the use of cleaner fuels in the short term as well as shifting to low emission options such as electric vehicles in the medium to long term.
8 The World Bank (2002). Toward an Unleaded Environment: World Bank Support to Transition Economies. The World Bank, Washington DC. 9 WHO (2006). World Health Organisation challenges world to improve air quality: Stricter air pollution standards could reduce deaths in polluted cities by 15%. WHO News Releases. 10 Cohen, A.J., Anderson, H.R., Ostro, B., Pandey, K., Krzyzanowski, M., Künzli, N., Gutschmidt, K., Pope, C.A., Romieu, I., Samet, J.M. and Smith, K.R. (2004). Mortality impacts of urban air pollution. In WHO, Comparative quantification of health risks: global and regional burden of disease attributable to selected major risk factor (Vol. 2). World Health Organization, Geneva, Chapter 17.

CSD19/2011/BP2
7
II. CITY SCALE : ENCOURAGING CITIES TO REDUCE CAR USE AND CONGESTION 11. Private car ownership is expected to grow from around 650 million cars in 2005 to 12 billion by 2030,11 an increase of nearly twenty times. As the greenhouse gas emissions from cars have been estimated as being roughly 17 per cent of global emissions, a 20 times increase in car ownership without significant per vehicle reductions in emissions would be clearly dangerous. The possibilities for a Mayor or local municipality to encourage alternatives to car use that can complement efforts at a national and international level to reduce the energy consumption of cars and light vehicles are outlined below.
A. Encouraging alternatives to the use of cars 12. Many cities in the world are now investigating options for encouraging alternatives to car use, particularly those cities with high population growth levels that experience excessive costs from congestion and vehicle accidents. Congestion costs alone have been estimated to be as much as US$6.7 billion in Australia in 2005, 12 US$78 billion in the US in 2007, 13 and are expected to be in the order of US$44 billion in the UK by 2010.14 13. Efforts at a city scale include initiatives to increase public transport patronage and availability, and promote and facilitate walking and cycling. When designing programmes to encourage alternatives to car use the potential for success is significantly increased when car drivers perceive, and receive, real benefits or when they avoid penalties or costs. Successful programmes often provide a combination of public transport, cycling, and walking to allow faster, cheaper and more convenient transport. Encouraging alternatives can involve increasing the cost of car ownership, including through pollution taxes, inner-city congestion charges or increased cost of car parking in cities; along with improving the viability of alternatives such as prioritising public transport on roads, increasing the frequency and coverage of services, and providing transit hubs that allow rapid connections to various parts of the city, and which facilitate land-use concentrations around the hub. Several studies have assessed the cost of public funding support for private motorized transport. In many cities, indirect subsidization of private transport is often higher than the funding support for public transport. 14. Such an emphasis on interconnected public transport and development has led to what is now commonly referred to as Transit Orientated Design (TOD), pioneered by experts such as Professor Peter Newman and others. The principles of TOD involve directing growth along transit serviced corridors, where dense, mixed-use urban communities are concentrated around
11 Chamon, M., Mauro, P. and Okawa, Y. (2008). Mass car ownership in the emerging market giants. Economic Policy, vol 23, Issue 54, pp243-296. 12 BTRE (2007). Estimating urban traffic and congestion cost trends for Australian cities. Bureau of Transport and Regional Economics, Australian Government. Available from http://www.bitre.gov.au/publications/49/Files/wp71.pdf, accessed 01 April 2009. 13 Shrank, D.L. & Lomaz, T.J. (2007). The 2007 Urban Mobility Report – What does congestion cost us? Texas Transportation Institude, Texas A & M University. Available from http://mobility.tamu.edu/ums/, accessed 01 April 2009. 14 Goodwin, P. (2004). The economic costs of road traffic congestion. Discussion paper. The Rail Freight Group, London, UK. Available from http://eprints.ucl.ac.uk/1259/, accessed 01 April 2009.
CSD19/2011/BP2
8
transit stations which link each community with the city as a whole. Within each transit centre bus feeder systems complement networks of cycle paths and walkways to ensure residents can quickly access the main transit corridor. 15. Transit oriented cities work on several fronts. Firstly, they minimise cross city trips with local, high density centres of mixed residential, commercial, retail and civic spaces which are accessible to each other within a ten minute walk. Secondly, they assist car- free movement between these nodes though easily accessible high speed transit corridors. Residents in transit oriented cities are found to spend less time and money on travelling, and to enjoy a reduced sensitivity to fluctuating petrol prices. Newman concludes that healthier lifestyles result from walking and cycling, reduced congestion and pollution, while constraining car usage makes the streets safer.15 16. There are a number of additional benefits to pursuing a path of alternative transport. A car-reliant society leads not just to higher energy use and greenhouse gas emissions, but also greater urban pollution, congestion, health care costs, obesity, and urban sprawl, as outlined in Table 2. Consideration of the costs and benefit of various transportation options must also take these traditionally external costs and benefits into account. A car’s convenience can make it the default or automatic mode of transport, even for short trips. For example, even in Australian cities with significant urban and suburban sprawl, a study has shown that 25-37 per cent of trips are three kilometres or less, and 42-48 per cent of all trips are five kilometres or less.16 The study showed that on average 40 per cent of trips could be made by bicycle, walking, or public transport or a combination of any of these modes, and a further 40 per cent could be made by these same modes if the facilities, infrastructure and services were improved - showing that at least 80 per cent of car trips could be avoided. Such a shift away from the car to more sustainable forms of transport yields significant health benefits as most alternatives to the automobile include some form of physical activity. 17. Sustainable transport can also benefit the economy. A 1997 study found that cities that emphasise public transport, cycling and walking spend less on transportation. Public transport, walking and cycling need less land for infrastructure and associated facilities (parking etc.). A single lane of railway is able to carry up to 50,000 persons per hour (pph), a bus lane 7,000 pph, and a highway lane just 2,500 pph.17 Further studies have shown that more jobs result from building public transport systems per dollar invested than from constructing roads. Private cars carry higher costs of traffic policing, accidents (including hospitalisation and damage costs), and costs of air pollution to health and infrastructure. On average, OECD workers spend one day a
15 Newman P. (2001). Transportation Energy in Global Cities: Sustainable Transportation Comes in from the Cold? Natural Resources Forum, vol 25, no 2, pp91-107 16 Edwards, S. and Magarey, P. (2007). Cycling Fact Sheet: Environmental Benefits of Cycling. Cycling Promotion Fund and Bicycling Federation of Australia, Australia. Available from http://bfa.asn.au/cms/uploads/resources/bfa_fact_sheet_02%20_environmental_benefits_of_cycling.pdf, accessed 27 March 2009. 17 Kenworthy, J., Laube, F., Newman, P. and Barter, P. (1997). Indicators of transport efficiency in 37 cities . Report to World Bank, ISTP, Murdoch University, Western Australia.
CSD19/2011/BP2
9
week working to pay for the costs of their car,18 and Newman found that in Australia the average household could save US$536,000 over a lifetime by avoiding a second car (Newman, 1998). 18. The city of Bogotá is one of the most progressive cities in the world in encouraging alternatives to car use by actively restricting the use of private cars in the city and increasing their gasoline tax by 20 per cent. Currently 40 per cent of all cars are restricted from the urban area during peak hours, and the city holds an internationally acclaimed car free day each year. This encourages the use of alternative modes of transport, discourages car use and significantly reduces congestion. The benefits recorded include: 43 per cent increase in trip velocity; 28 per cent decrease in accidents; and 29 per cent decrease in trip duration. 19 However, perhaps the most radical move in Bogotá’s future will be the prohibition of private vehicles on the streets for six hours a day, during peak hours, taking effect from the 1 January 2015. Voted in by the citizens in a 2000 referendum, this was a conscious act to create a more liveable city where public transport is valued over private cars, pollution is minimised, and the streets are safer for walking and cycling.20 19. Congestion pricing is now being recognised as a key mechanism to mitigate congestion and revitalize inner city districts, with over fifteen cities in OECD countries having successfully implemented a congestion tax.21 Technology used in these cities includes displaying licenses, stop and pay toll booths, radio tags at toll stations (e-tolls), and photographing the license plates of cars. The goal of such systems is to allow the congestion charge to be applied without disruption of the flow of traffic. Common exemptions from the charging zone include residents, buses and taxis. Some schemes, such as in Milan, exempt fuel efficient and lower emission cars, while others such as those in Norway offer discounts to lighter vehicles. Singapore, for example, charges different amounts depending on the time of day, and the road being used depending on levels of congestion. London is still a stand-out example, however, 22 having implemented a congestion pricing scheme in February 2003 to control congestion in the city centre. This bold action has been met with considerable success and public approval and has inspired many other cities around the world to implement similar schemes, including Stockholm (Sweden), Valletta (Malta) and Milan (Italy). Since the implementation of the charge in London, traffic entering the charging zone has decreased by 21 per cent, key traffic pollutants and accidents have decreased (with a 12 per cent drop in particulate matter and nitrous oxides, and a 20 per cent reduction in greenhouse gas emissions),23 and £123 million were raised in the 2006/2007 financial year and spent on improving London’s transport system.24
18 Australian Bureau of Statistics (2007). 2006 Census QuickStats: West Pennant Hills (State Suburb). Available from www.censusdata.abs.gov.au/, accessed 15 May 2008. 19 Diaz, Oscar Edmundo (2001). Car Free Bogotá: The response to the Transportation Challenge. The New Colonist, USA. Available from www.newcolonist.com/bogota.html, accessed 3 July 2008. 20 Diaz, Oscar Edmundo (2001). Car Free Bogotá: The response to the Transportation Challenge. The New Colonist, USA. Available from www.newcolonist.com/bogota.html, accessed 3 July 2008. 21 Roadpricing (undated). Cities. Available from www.roadpricing.biz/, accessed 7 March 2008. 22 Taylor, M. (2008). City's two-wheel transformation. The Guardian, 9 February 2008, UK, Available from www.guardian.co.uk/uk/2008/feb/09/transport.world1, accessed 7 March 2008. 23 Environmental Defense Fund (2008). Transportation: Congestion Pricing. Available from www.edf.org/page.cfm?tagID=6241, accessed 21 July 2008. 24 Mayor of London – Transport for London (undated). About the Congestion Charge: Benefits. Available from www.tfl.gov.uk/roadusers/congestioncharging/6723.aspx, accessed 3 July 2008.
CSD19/2011/BP2
10
20. Following the early success of the London scheme, Stockholm introduced a congestion pricing scheme on a trial basis in 2005, while extending the public transport system to support the increased patronage, and then held a referendum to determine whether to introduce it permanently. A system of automatic identification was utilised with the current fee displayed above the charging stations. The charge was varied at different times throughout the day, including peak periods, semi-peak, and medium volume periods. Evenings, weekends and holidays were exempt from the charge, and there was a maximum daily charge. Some vehicle categories were exempt from the charge, including taxis, emergency vehicles, vehicles with disabled permits, foreign vehicles, motorcycles, buses over fourteen tons and vehicles using alternative fuels. 21. The trial resulted in an overall 22 per cent reduction in congestion. Queuing times for the inbound city traffic in the morning fell by a third and were halved for outbound traffic in the evening. Road use in the inner city, as measured by kilometres travelled, fell by 14 per cent.25 There was also a 10 per cent reduction in air pollutants.26 In a subsequent referendum, the public, which had initially had reservations about the scheme, voted for its continuation. 27 A cost benefit analysis was undertaken as part of the trial period to assess its viability, and showed significant net benefits of 1048 million Swedish Krona (SEK) per annum (approx US$124 million, April 2009).28 22. Understandably, the introduction of such a charge carries with it considerable political risk. However, there are a growing number of international examples of successful systems beyond London and Stockholm, as well as a strong body of research to make a congestion charge attractive to the public with appropriate inclusions. Through good management and implementation and a strong educational campaign, congestion charging can be used to great effect.
B. Investing in public transport and other modes of transport 23. Designing, or rather re-designing, cities for sustainable transport options rather than for the car, is hardly new. Until the 20th century all cities in the world were designed to be walkable and easy to get around. Up until last century, trams and trains allowed growing populations to develop dense city centres and corridors where essential activities and services surrounded the stations. This form still predominates in most European and wealthy Asian cities. In Mumbai, over 84 per cent of daily trips are made by public transport, while in Chennai, Shanghai, Hong Kong and Dakar it is close to 70 per cent. In the US and Australia barely 10 per cent of all trips are currently being made on public transport, highlighting the great potential for improvement.29
25 Stockholm STAD (2006). Evaluation of the Effects of the Stockholm Trial on Road Traffic, Stockholm STAD, Sweden, p41. 26 Transportation Alternatives (2008). Congestion Pricing: International Examples. Available from www.transalt.org/campaigns/congestion/international, accessed 4 July 2008. 27 Stockholmforsoket (2006). Referendum on the implementation of congestion charges in the city of Stockholm. Available from www.stockholmsforsoket.se/templates/page.aspx?id=10215, accessed 4 July 2008. 28 Transek (2006). Cost-Benefit analysis of the Stockholm trial, Transek AB, Sweden, p11. 29 Newman, P. and Kenworthy, J. (2007). Transportation energy in global cities: sustainability comes in from the cold. Natural Resources Forum, vol 25, no 2, pp91-107.
CSD19/2011/BP2
11
24. Switching to public transport and cycling using existing technology can achieve well over 80 per cent reductions in fuel consumption and greenhouse gas emissions. For instance, one bus with 25 passengers reduces energy consumption and greenhouse gas emissions per capita by approximately 86 per cent per kilometre compared to 25 (single occupant) vehicles.30 Hybrid engines, light weight buses, and plug- in hybrid technology can enable even higher efficiency improvements. 25. Options for improving the quality of public transport and cycling infrastructure, service and accessibility are covered in great detail in a range of reports, studies and texts. In this part we outline some of the major opportunities for providing viable alternatives for cars in an attempt to reduce car usage, such as:
• Walking: The city of Vancouver, as part of its “EcoDensity” initiative, has invested in a range of measures to encourage and facilitate walking and cycling. Transport has been dramatically reprioritised to consider walking first, then cycling, public transport, freight movement and finally private car use. In terms of encouraging walking, Vancouver has a policy of widening sidewalks, increasing landscaping (including street trees and benches) and requiring buildings to include awnings in the ir design. Pedestrian controlled street crossings are being installed throughout the city and curb bulges to enhance visibility of oncoming traffic. As a result, trips made by walking have increased by 44 per cent and now account for 27 per cent of all trips to the city centre.31
• Cycling: In Amsterdam, every part of the city can be reached via an extensive network of bicycle routes, over 75 per cent of all residents older than twelve own a bike, and half use it daily.32 In Copenhagen bike riders have equal priority as car drivers and pedestrians, while 36 per cent of Copenhageners ride their bicycle to work.33 In Freiburg 35 per cent of the residents have chosen to not own a car and a third of all trips are made on bicycles.34 Bicycles are still the transportation mode of choice for commuting to work, school, shopping and general day-to-day activities throughout Asian countries. Not surprisingly, the region produces approximately 75 million bicycles each year - three quarters of the entire global production. In China, the 500 million bicycles in use by far outnumber the 20 million cars in the country. The Chinese bicycle manufacturing industry contributes significantly to its economy, employing over 150,000 people and generating an excess of US$1 billion worth of foreign exchange.35
30Northern Territory Government (2007). NT Greenhouse Gas Emissions: Transport. Available from www.nt.gov.au/nreta/environment/greenhouse/emissions/transport.html, accessed 18 March 2009. 31 COV (2007). Transportation Plan Update - A Decade of Progress. The City of Vancouver, Canada. Available from www.vancouver.ca/engsvcs/transport/plan/pdf/trans-plan-brochure.pdf, accessed 9 July 2008. 32 Gemeente Amsterdam (2008). Amsterdam paves the way for cyclists. Gemeente Amsterdam, Netherlands. Available from http://amsterdam.nl/aspx/download.aspx?file=/contents/pages/66753/2008-10_brochure_uk.pdf, accessed 31 March 2009; Mygatt, E. (2005). Bicycle Production Remains Strong Worldwide. The Earth Policy Institute. Available from http://earth-policy.org/Indicators/Bike/2005.htm, accessed 31 March 2009. 33 C40 Cities (2008). Transport: Copenhagen, Denmark. Climate Leadership Group, Clinton Foundation. Available from www.c40cities.org/bestpractices/transport/copenhagen_bicycles.jsp, accessed 27 March 2009. 34 C40 Cities (2008). Transport: Freiburg, Germany, Climate Leadership Group, Clinton Foundation. Available from www.c40cities.org/bestpractices/transport/freiburg_ecocity.jsp, accessed 27 March 2009. 35 Car Free Asia (undated). Asia Today. Available from www.carfreeasia.org/today.html, accessed 18 April 2009.

CSD19/2011/BP2
12
• Bus rapid transit: Particularly in developing countries bus rapid transit has proven to deliver significant improvements to public transportation systems and urban traffic with now a great deal of literature and case study material developed to support such an option, as outlined in Table 3.
• Rail: Light rail can be between 2.5 and 5 times more energy efficient per capita than buses, and between 17.5 and 35 times more efficient than cars. 36 Compared with the average efficiency of a car in the USA, the Manila Light Rail Transit System in the Philippines is 59 times more energy efficient, and a similar efficiency is achieved in Beijing. In less dense cities in Europe, the average light rail system is 7 times more efficient. 37 Light rail with overhead cables can also run on electricity without storage requirements. The City of Calgary has built wind turbines to power light rail systems, the C-Train. It is estimated that the switch to wind power increases riding costs of 0.5 per cent per passenger.38 The C-Train, despite concerns it was oversized, is now attracting the highest ridership of any light rapid transit in North America.39
• Car sharing: The philosophy of car sharing is that individuals gain the benefits of private vehicle use without the costs and responsibilities of ownership. There are now car sharing schemes in operation in various form in over 600 cities. Vehicles are usually deployed in parking lots which can be easily accessed from homes, transit centres or major business centres and can be reserved online or by phone within a few minutes notice. Smart cards or similar technologies provide access to members, who generally pay a small upfront fee to join the organisation, and then a fee each time a car is used based on an hourly rate, and the distance driven. One car sharing vehicle generally displaces 4-10 new privately owned cars in continental Europe, 7-10 vehicles in Australia, and between 6-23 cars in North America.40
• Combining options: By combining walking or cycling with public transport, longer trips become feasible without a car. Bicycles can be transported on trains, ferries and buses - where racks on the front of the bus can store and carry bikes, such as in Boulder, Colorado. Many cities are also providing ‘park and ride’ facilities for bike riders at public transport stops to enable bike riders to safely store their bike and continue their trip by bus, train or ferry. Studies have shown that people’s perception of how quickly they will arrive at their destination is a critical determinant in deciding whether to take public transport. Peak hour public transport is often faster than driving, and as cycling to a train station can be at least four times faster than walking, a bike can greatly facilitate a switch in transportation modes. Even cycling alone can often beat a car. During peak hour, or at any time of the day, cycling avoids the time consuming pitfalls of queuing at traffic lights,
36 Newman, P. and Kenworthy, J. (2007). Transportation energy in global cities: sustainability comes in from the cold. Natural Resources Forum, vol 25, no 2, pp91-107. 37 Newman, P. and Kenworthy, J. (2007). Transportation energy in global cities: sustainability comes in from the cold. Natural Resources Forum, vol 25, no 2, pp91-107. 38 Calgary Transit (undated). Calgary Transit and The Environment. Available from www.calgarytransit.com/environment/ride_d_wind.html, accessed 31 March 2009. 39 Light Rail Now (2008). C Train Light Rail growth continues with North East extension. Available from www.lightrailnow.org/news/n_cal_2008-01a.htm, accessed 31 March 2009. 40 Shaheen, S. and Cohen, A. (2006). Worldwide Carsharing Growth: An International Comparison, Submitted to Transportation Research Board, p3, p5

CSD19/2011/BP2
13
congestion and parking, and provides door to door transport. It is important to create dedicated bicycle lanes in order to increase safety of bike riders.
III. NATIONAL SCALE: ENCOURAGING A SHIFT TO LESS CARBON INTENSIVE MODES
A. Encouraging alternatives to the use of trucks for long-haul freight 26. Many of the world’s land-based national and international freight systems are dominated by the use of trucks, which is predicted by the World Business Council for Sustainable Development to experience the highest growth of all freight modes over the next 50 years.41
Given such significant levels of expected future growth, countries focused on reducing energy consumption and greenhouse gas emissions need to ensure the most efficient modes of freight transportation. Such an agenda will involve collaborations between cities and national governments to allow a systemic approach to the issue. At the city level many see the future role of trucking being focused on short trips from rail ports and shipping yards to warehouses and vendors, with the long haul trips between destinations being done by train or coastal shipping. 27. Companies moving their own freight by rail are at least 80 per cent more efficient than companies trucking their freight, and third parties moving freight for other companies are still around 66 per cent more efficient than trucking. 42 Currently, although Australian road freight transport accounts for only 38 per cent of domestic freight transported by volume, it is responsible for 84 per cent of the total freight transport emissions. Conversely, coastal shipping provided 22 per cent of freight movements by volume while only releasing 4 per cent of emissions, and rail moved 36 per cent of domestic freight and emitted only a marginally larger proportion of greenhouse gases.43 In the United States, where freight movements account for 9 per cent of the nation’s total greenhouse gas emissions, shifting existing long-haul truck transport to rail could reduce total freight related emissions by 85 per cent, even taking into account truck transport at either end of the trip.44 28. Significant rail and shipping freight infrastructure already exists around the world, which can underpin a transition away from trucking. In the US for example, rail is responsible for the same number of ton-kilometres (tkm) as road transport, each moving 40 per cent of the total domestic freight, and marine shipping already moves approximately 9 per cent of freight along the eastern and western coasts. In Europe, 45 per cent of freight is moved by trucks, whereas 41 World Business Council for Sustainable Development (2004). Mobility 2030 Report: Meeting the Challenges to Sustainability, WBCSD. Available from www.wbcsd.org/plugins/DocSearch/details.asp?type=DocDet&ObjectId=NjA5NA, accessed 8 April 2009. 42 Kamakaté, F. (2007). Understanding Current and Future Trends in Energy Intensity from Heavy -duty Trucks. Presentation by the International Council on Clean Transportation to the International Workshop on Fuel Efficiency Policies for Heavy-Duty Vehicles. International Energy Agency, 22 June 2007, see Slides 16-17. Available from www.iea.org/textbase/work/2007/vehicle/Kamakate.pd , accessed 10 April 2009. 43 Macintosh, A. (2007). Climate Change and Australian Coastal Shipping . Discussion Paper Number 97 to The Australia Institute, pp19,20. Available from www.tai.org.au/file.php?file=DP97.pdf, accessed 3 April 2009. 44 Frey, H.C. and Kuo, P.Y. (2007). Assessment of Potential Reduction in Greenhouse Gas (GHG) Emissions in Freight Transportation. North Carolina State University, USA. Available from www4.ncsu.edu/~frey/conf_other/Frey_Kuo_2007a.pdf, accessed 2 April 2009.
CSD19/2011/BP2
14
river and short sea transport are responsible for 40 to 44 per cent of the tkm.45 Increasing the portion of freight carried by rail and shipping involves development of “multi-modal” systems, and is underpinned by the ability to move freight quickly and efficiently from one mode, such as rail, to another, such as trucks.
B. Encouraging alternatives to air travel
1. On-line conferencing
29. In the ground breaking 1997 book, “Factor Four”, the authors showed that a six hour video conference can save some 99 per cent of energy and material resources that would be consumed by the transatlantic trips required to hold the same meeting in a single location.46
Video-conferencing offers significant potential to reduce energy use and greenhouse gas emissions for governments, organisations and businesses for which air travel is a significant component of their carbon footprint. 30. Video teleconference systems have rapidly evolved from highly expensive proprietary equipment, software and network requirements to standards based technology that is readily available to the general public at a reasonable cost. Internet Protocol based video conferencing was developed in the 1990s and together with video compression technologies, made it possible to conduct video conferences from a personal computer. There is now a plethora of free video conferencing services, web plug- ins and software available, which have made this technology available to virtually anyone who owns a computer and has access to the internet. The cost-effectiveness and quality of video conferencing has improved along with broadband networks worldwide. High speed internet services make it possible to conduct national and international “virtual meetings” without the environmental and financial costs of travel.47
2. Fast trains
31. There is significant promise os so-called “fast trains” to provide countries with a realistic alternative to air travel, especially between cities that are no more than 500 miles apart. This is important as the IPCC has shown that car and air travel between cities is one of the fastest growing areas of transport energy usage. Paris and London, for instance, are 211 miles apart and the Eurostar fast train is roughly as fast as flying between the two cities. Eurostar has now captured over 70 per cent of the London-Paris transit market from the airlines.48 However, Japan has pioneered this mode of travel with its high-speed bullet trains carrying almost a million passengers a day. Japan’s high-speed rail network now stretches for 1,360 miles, linking nearly all its major cities. One of the most heavily travelled links is the original line between Tokyo and
45 Corbett, J. and Winebrake, J. (2007). Sustainable Goods Movement – Environmental Implications of Trucks, Trains, Ships and Planes. EM and Air and Waste Management Association’s Magazine for Environmental Managers, November, pp8-12. Available from http://coast.cms.udel.edu/Papers/EMCorbettWinebrake2007.pdf, accessed 2 April 2009. 46 von Weizsäcker, E., Lovins, A. and Lovins, L. H. (1997) Factor Four: Doubling Wealth, Halving Resource Use, Earthscan, London, pp112-114. 47 World Wildlife Fund (2009) Virtual meetings and Climate Innovation in the 21st Century, World Wildlife Fund. Available from www.worldwildlife.org/who/media/press/2009/WWFBinaryitem11938.pdf, accessed on 4 May 2009. 48 Seat 61 (undated) ‘London to Paris by Eurostar’. Available from www.seat61.com/London-Paris-train.htm, accessed 15 April 2008.

CSD19/2011/BP2
15
Osaka, where the bullet trains carry 117,000 passengers a day. The transit time is two hours and 30 minutes between the two cities compared to a driving time of eight hours. Although Japan’s bullet trains have carried billions of passengers over 40 years at high speeds, there are no reports of accidents with casualties. 32. China already has the world’s longest high-speed rail network with about 7,431 km of routes in service by 2010, including 1,995 km of rail lines with top speeds of 350 km/h (220 mph). China is the first and only country to have commercial train service on conventional rail lines that can reach 350 km/h (217 mph). China’s high-speed rail lines consist of upgraded conventional rail lines and newly-built high-speed passenger designated lines. Currently, the country is experiencing a high-speed rail building boom with 17,000 km of high-speed lines under construction. China is making very significant investment in high-speed rail building (approx. US$284 billion during the 12th Five Year Plan period 2011-2015). The entire high-speed rail network will reach 13,000 km by 2012 and 16,000 km by 2020. 33. On 16 April 2008, the President of the United States announced the plan for the US to invest significantly in fast trains. The plan includes the initiative to build a new high-speed passenger rail network in 100-600 mile corridors between major cities. It will be funded by US$8 billion for rail from the economic-stimulus package, as well as another US$1 billion per year requested in the next budget over the next five years, and the administration has already identified ten potential corridors for high-speed rail.49 Plans for large-scale investment in high-speed rail were also announced as a part of the President’s State of Union Address in January 2011.50
IV. NATIONAL/INTERNATIONAL SCALE: REDUCING ENERGY/CARBON INTENSITY OF MOTOR VEHICLES 51
A. Decarbonising cars and light vehicles
34. It is technically possible to produce cars for the mainstream market that achieve significant decarbonisation. Many vehicle manufacturers have produced concept vehicles and are now investing heavily in R&D. A strategic combination of reducing mass, drag and rolling resistance, together with using hybrid drives can reduce fuel consumption by 50 per cent at roughly no cost, and by more than 70 per cent with a two-year payback period.52 Typically the various subsystems of a car are refined independently in order to improve their particular efficiency. However taking a whole system approach to the design can deliver compounding efficiency gains, primarily by targeting mass reductions. By first aiming to minimise the mass of the structure, based on safety and performance standards, this then reduces the required capacity 49Department of Transportation (undated). Federal Railroad Administration: High-Speed Railroad Corridor Descriptions. Available from www.fra.dot.gov/us/content/203, accessed 3 May 2009. 50 Available from www.whichhosue.gov, accessed 28 January 2011. 51 The following section is an edited extract by the lead authors of von Weizsäcker, E., Hargroves, K., Smith, M., Desha, C. and Stasinopoulos, P. (2009). Factor 5: Transforming the Global Economy through 80% Increase in Resource Productivity, Earthscan, London. 52 Lovins, A.B. (2007). Class Lectures in Advanced Energy Efficiency: 3. Transportation. Stanford University.
CSD19/2011/BP2
16
of the propulsion system, the design load on the chassis, and potentially the need for additional trim. A smaller propulsion capacity means that a hybrid or electric drive can be used and thus the electrical system can be consolidated. A smaller propulsion system also requires a smaller volume of fluids, and using a hybrid or electric drive would almost eliminate the use of fluids. 35. A number of key innovations can, when combined, help to achieve significant decarbonisation of cars and light vehicles, namely:
• Materials: New, low-density, high-strength metals, plastics and composite materials allow the mass of cars to be reduced, thus reducing the required propulsion power, and hence the total mass of batteries required as part of a hybrid-electric or electric drive. Reducing the mass also reduces rolling resistance and thus further reduces the required propulsion power.
• Low-drag room: A car’s size and exterior shape are major influencing factors in the aerodynamic drag forces experienced. Accurate optimisation and manufacturing of complex aerodynamic body features are now achievable through innovations in technologies such as computer aided modelling, design, and manufacturing. The largest opportunity for reducing drag is to make the car’s under-body, which contributes about a quarter of the total drag, as smooth as the top side.
• Low-rolling resistance tyres: Due to the properties of their material, conventional tyres suffer from a compromise between tread pattern detail, which affects the car’s handling ability and safety, and the resulting rolling resistance. New “Fuel Saver” tyres, seek to resolve this compromise by replacing some of the tyre’s tread compound with silica. These tyres can reduce fuel consumption by 3-8 per cent, and new generation tyres may reduce fuel consumption by an additional 2-9 per cent.53
• Hybrids: A hybrid-electric drive train can power a vehicle using either an internal combustion engine, or batteries or a combination of both, depending on the configuration and operating mode. Most current hybrid-electric cars use “deep cycle” nickel-metal-hydride (NiMH) batteries, which can store about twice as much energy per unit mass as lead acid batteries.54 Deep cycle batteries are charged by a combination of an electric generator driven by the internal combustion engine and the car’s regenerative braking system, which harnesses the car’s own inertia to generate electricity. 55
36. Once the vehicle is lightweight, aerodynamic, and hybrid/electric powered, plug- in technology can then be used to provide the option of charging the batteries via a typical electrical outlet, say at home or at work, or battery arrays can be swapped out, say at a service station, to allow greater flexibility and avoid issues with limited ranges. The ability to store energy in batteries to power the vehicle is cost effective because purchasing electricity directly from the grid is cheaper than generating electricity onboard by burning fuel in an internal combustion 53 Tyres-Online (2000). The Benefits of Silica in Tyre Design – A Revolution in Tyre Technology. Available from www.tyres-online.co.uk/technology/silica.asp, accessed 19 November 2008. 54 HybridCars (2008). The Hybrid Car Battery: A Definitive Guide. Available from www.hybridcars.com/components.htm, accessed 14 April 2009. 55 HybridCars (2008). Regenerative Braking. Available from www.hybridcars.com/components/regenerative-braking.html, accessed 14 April 2009.

CSD19/2011/BP2
17
engine. However, if the vehicle is not optimised for weight, drag and resistance, the size of the batteries required for a suitable driving range may be prohibitive. 37. The automotive industry is now experimenting with lithium-ion (Li- ion) batteries, which can store roughly twice as much energy per unit mass as the NiMH batteries currently being used.
The combination of plug- in technology and new battery options can enable a car to operate within the parameters for range and performance that car owners expect, and in doing so can deliver significant fuel savings over conventional designs. Many car manufactures have announced intentions to introduce production PHEV automobiles in the next two to five years. 38. Further to designing cars and light vehicles to reduce their energy requirement, and shifting to hybrid plug- in engines, alternate fuels, such as second generation bio-fuels, can be used to replace oil-based fuels and reduce greenhouse gas emissions. Some automotive companies are now developing vehicles that can run on a number of fuels, thus ensuring that their vehicles are competitive no matter which fuel blends dominate the market in the future.
B. Decarbonising heavy freight trucks 39. Trucks weighing 15,000 kg or more (“heavy freight trucks”, classified as “Class 8”), represent a small proportion of the fleet, but a significant proportion of the fuel consumed. For example in the US, while Class 8 vehicles comprise about 2 million of the 45 million commercial trucks in use (i.e. under 5 per cent), they consume 68 per cent of the country’s commercial truck fuel. Long-haul Class 8 trucks, which travel more than 160 km (100 miles) per trip, account for almost 50 per cent of all commercial truck fuel used in the US.56 National and international programmes to reduce the carbon intensity of freight modes should consider options to improve the energy productivity of heavy freight trucks. 40. The requirement for fuel in a truck is essentially to allow the engine to create enough kinetic energy to achieve speeds of up to at least 110 km/h, while fully loaded. In order to do this enough power must be created to overcome both the aerodynamic drag losses from the air resistance of the truck, and the rolling resistance of the tyres caused by the weight of the truck. The remainder of the energy is lost in the engine as the fuel is converted into kinetic energy and transferred to the driveline of the vehicle. Hence any improvements to the shape of the truck that reduces aerodynamic drag, or reductions to the weight of the truck that reduces rolling resistance, can directly reduce the power output requirements for the engine and save fuel. 41. In 2000, the US Department of Energy established the “21st Century Truck” programme, which set ambitious goals - including a 70 per cent improvement in energy efficiency for long-haul trucks and trailers, including Class 8 type heavy trucks.57 This significant improvement was considered to be achievable with development and implementation of technologies currently
56 World Business Council for Sustainable Development (2004). Mobility 2030 Report: Meeting the Challenges to Sustainability. WBCSD, p89. Available from www.wbcsd.org/plugins/DocSearch/details.asp?type=DocDet&ObjectId=NjA5NA, accessed 9 April 2009. 57 US Department of Energy (USDOE/OSTI) (2000). Technology Roadmap for the 21st Century Truck Programme. US Department of Energy, 21CT-01. Available from www.osti.gov/bridge/servlets/purl/777307-BKSUFs/native/777307.pdf, accessed 9 April 2009.

CSD19/2011/BP2
18
being considered but not yet commercially viable. 58 Investigating the potential for such improvements, it was found that reducing aerodynamic drag and rolling resistance by 50 per cent each, and reducing idling by 80 per cent, can save up to 50 per cent of fuel, increasing performance from around 2.5 km/l to 5.0 km/l (or 6.1-11.8 mpg).59 42. The fuel economy of trucks can be further improved using a combination of existing and future control systems and technologies, including operational improvements, such as reducing unnecessary kilometres through GPS navigation, load-sensing cruise control, and improved driver behaviour by providing feedback though dashboard fuel economy indicators.
C. Decarbonising aircraft, rail and shipping 1. The potential for decarbonisation of aircraft
43. Air travel uses just under 12 per cent of all energy used in the transport sector,60 and is responsible for 2 per cent of global greenhouse gas emission, but these emissions could rise by as much as 10 fold by 2050 given the growth in this sector.61 44. The airline industry is now showing significant interest in developing solutions to reduce energy usage and greenhouse gas emissions. This is because fuel use contributes to around 20 per cent of operating costs.62 Aviation will be included in the EU emissions trading scheme from 2012. Such inclusion will affect over 80 major airlines, of which 35 are headquartered outside the EU. According to the IPCC, while airlines have already achieved significant energy productivity gains over the past decades, many opportunities still exist to further improve this. Passenger jet aircraft produced today are 70 per cent more fuel efficient than the equivalent aircraft produced 40 years ago and continued improvement is expected. A 20 per cent improvement over 1997 aircraft efficiency is likely by 2015 and possibly 40 to 50 per cent improvement is anticipated by 2050.63 45. With innovative designs, such as the blended wing body, there is potential for aircraft to achieve over 50 per cent energy productivity improvements over the coming decades. A blended wing design approach integrates the engines, wings, and the body into a single lifting surface thus improving the aerodynamics and fuel efficiency of aeroplanes. However, blended wing bodies also accommodate more passengers than conventional aircraft, which further reduces fuel
58 US Department of Energy (USDOE/OSTI) (2000). Technology Roadmap for the 21st Century Truck Programme. US Department of Energy, 21CT-01, Table 4.1. Available from www.osti.gov/bridge/servlets/purl/777307-BKSUFs/native/777307.pdf, accessed 9 April 2009. 59 Bustnes, O.E (2005). Taking on the Leadership Challenge in Class 8 Trucking: How To Double Class 8 Truck Efficiency – Profitably. Rocky Mountain Institute, p1. Available from http://unjobs.org/authors/odd-even-bustnes, accessed 9 August 2008. 60 IPCC (2007). Climate Change 2007 Mitigation of Climate Change. Contribution of Working Group III to the Fourth Assessment Report of the Intergovernmental Panel on Climate, Cambridge University Press, Cambridge, see ‘Transport and its Infrastructure’. 61 IPCC (1999). Special report of the Intergovernmental Panel on Climate Change (IPCC). Working Groups I and III, Cambridge University Press, Cambridge, see ‘Aviation and the Global Atmosphere’. 62 ICAO (2006). Form A - ICAO Reporting form for Air Carrier Traffic, ICAO. 63 IPCC (1999). Special report of the Intergovernmental Panel on Climate Change (IPCC). Working Groups I and III, Cambridge University Press, Cambridge, see ‘Aviation and the Global Atmosphere’.

CSD19/2011/BP2
19
burn per seat – approaching a 40 per cent reduction on a seat-kilometre per litre basis.64 Other than redesigning the aircraft significant progress towards efficiency improvements can be made across the existing fleet through the following approaches:
• Light-weighting through advanced composites: Lightweight composite materials promise significant weight reductions and fuel efficiency. For instance, the use of advanced composites in the next generation of modern aircraft reduces fuel consumption by 20 per cent.
• Ultra-efficient engine technology: The ultra-efficient engines used in the blended wing aircraft are more fuel efficient than those traditionally used in aircraft and, as they are installed in a lightweight, blended wing body aircraft, can also be of smaller capacity.
• Drag reduction: The use of boundary layer ingestion engine inlets can reduce fuel consumption by reducing the mass and drag associated with having engine pylons; by reducing the exposed surface area of the engine housing; and by eliminating drag resulting from the engines and wings interfering with each other’s air flow.
• Air transportation and logistics: Improvements in the air transportation systems and logistics, mainly through information technology, are expected to save an additional 5-10 per cent of fuel, both in the air and on the ground. For instance, the traditional aircraft approach towards a runway is done by “stepping” down rather than a smooth steady descent. This means that traditionally, at each step, the pilots changed the thrust of the engines. New technology enables airlines to work with air traffic control and airports to create a much smoother descent to the runway, improving fuel efficiency.
46. When combined, the above aircraft features and improved logistics provide the airline industry with the potential to improve fuel efficiency and reduce greenhouse gas emissions. However, even though significant improvements are possible, the rate of growth of the industry and the risks of rebound effects necessitate that additional alternative strategies are encouraged as well.
2. The potential for decarbonisation of rail 47. Even though currently a shift to rail can result in as much as 80 per cent energy demand reduction per passenger compared to the car, trains can be better designed to further improve their performance. The UK Carbon Trust argues that significant efficiencies could be achieved in this sector through energy efficiency, re-generative breaking, lighter rolling stock, and better traffic flow and load factor management. 48. Rail has many advantages over transporting freight by trucks on the road. Efficient hybrid diesel-electric motors now power freight trains, and steel wheels on steel tracks minimise friction compared to trucks. The ability to hook up multiple cars and carry more freight per locomotive than a truck also provides an energy advantage. 64 Lovins, A.B., Datta, E.K., Bustnes, O.E., Koomey, J.G. and Glasgow, N.J. (2004). Winning the oil endgame: innovation for profits, jobs and security, Technical Annex. Rocky Mountain Institute, Snowmass, Colorado, Chapter 12: Airplanes, p16. Available from www.oilendgame.com/TechAnnex.html, accessed 29 July 2007.

CSD19/2011/BP2
20
49. The rail freight industry has worked hard to improve energy efficiency. As Figure 2 shows, the volume of rail freight in the US has nearly doubled while energy use has only marginally increased since 1980.65 Rail infrastructure can also be improved, including improved tracks and additional freight yards so that more destinations have freight stops near them, and new switches and switching yards so that the lower cost per mile is not undone by indirect routes requiring more miles between start and destination. 50. The Centre for Transportation Research of the Argonne National Laboratory has published an extensive review of strategies to improve rail fuel efficiency. The major areas identified were engine efficiency, saving energy during idling, using energy efficient lighting and reducing aerodynamic drag.66 51. Further to these options, a number of additional strategies exist, such as energy and power recovery, optimising speeds, improved logistics, materials efficiency and light-weighting. 52. Several countries are moving to improve the efficiency of their transport sectors by making large investments in rail freight infrastructure, including improving the modal interfaces. For instance, China has invested US$292 billion to improve and extend its rail network from 78,000 km in 2007, to over 120,000 km by 2020, much of which will be dedicated to freight. This will extend rail building capacity, which between 2003 and 2007 saw a per annum rail extension of on average 3.4 per cent.67
Figure 2 US rail freight volume versus rail freight fuel consumption, 1980-2007
Source: Based on data from the Association of American Railroads Policy and Economics Department (2009) Railroads: Green From the Start, Association of American Railroads.
65 Association of American Railroads Policy and Economics Department (2009). Railroads: Green From the Start, Association of American Railroads. 66 Stodolsky, F. et al (2002). Railroad and Locomotive Technology Roadmap. Center for Transportation Research, Energy Systems Division, Argonne National Laboratory. Available from www.climatevision.gov/sectors/railroads/pdfs/roadmap.pdf, accessed 17 April 2009. 67 Xinhua News Agency (2008). China announces huge rail investment. Xinhua News Agency, 27 October 2008. Available from www.china.org.cn/government/central_government/2008-10/27/content_16669965.htm, accessed 6 March 2009.

CSD19/2011/BP2
21
53. India is also investing in rail, in the amount of US$4.3 billion, which will finance the building of two dedicated freight corridors, an eastern corridor that will run for 1,279 km, and a western corridor that will run for 1,483 km, most of which will be double tracked.68 In Germany, investment in advanced rail transport has overturned long standing trends. Currently the growth in rail transport of 12 per cent is outstripping the growth of road transport in Gemany which is 8 per cent.69
3. The potential for decarbonisation of shipping
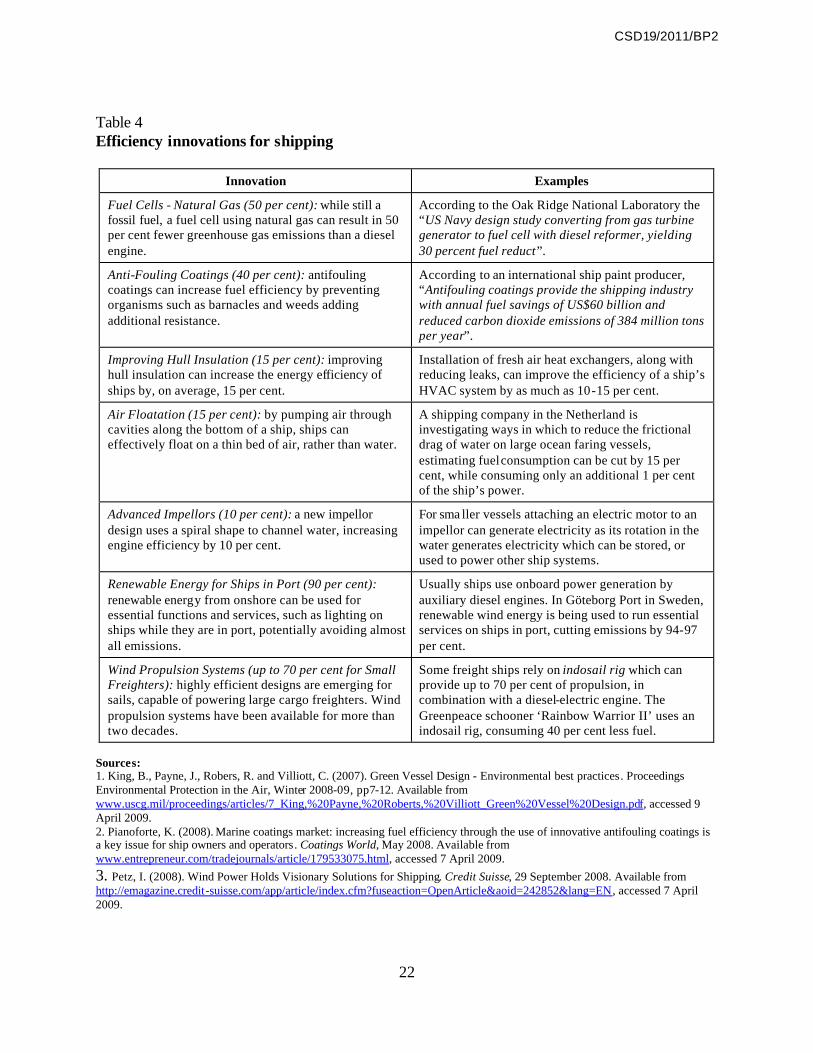
54. Shipping contributes an estimated 960 million tons of carbon dioxide, and consumes 300 million tons of fuel per year.70 According to the International Maritime Organization (IMO), without corrective action or the introduction of new technologies, air emissions, due to increased fuel consumption by the world shipping fleet, could increase by between 38-72 per cent by 2020.71 Hence, there is a strong impetus to increase shipping efficiency. 55. By combining existing knowledge with emerging innovations as much as 80 per cent reductions in energy demand are possible in shipping, through options such as the use of fuel cells, anti- fouling coatings to reduce drag, improving hull design, air floatation, propeller design, harnessing wind for propulsion, and by using renewable energy in ports. 56. As ships have to be self sufficient while travelling there are already a range of resource saving initiatives used. For example, most plumbing fixtures are “low-flow” to minimise the amount of onboard water storage, and the on-board energy use is minimised to reduce the amount of batteries that are needed to provide ongoing electricity.
68 Dedicated Freight Corridor Corporation of India Ltd. (undated). DFC Project. Available from www.dfccil.org/wps/portal/DFCCILPortal, accessed 6 March 2009. 69 Deutsche Bahn (2008). Designing Sustainable Logistics. Available from www.deutschebahn.com/site/nachhaltigkeitsbericht__2007/en/our__products/sustainable__logistics/logistics__strategy/lo gistics__strategy.html, accessed 2 April 2009. 70 Pianoforte, K. (2008). Marine coatings market: increasing fuel efficiency through the use of innovative antifouling coatings is a key issue for ship owners and operators. Coatings World, May 2008. Available from www.entrepreneur.com/tradejournals/article/179533075.html, accessed 12 April 2009. 71 Pianoforte, K. (2008). Marine coatings market: increasing fuel efficiency through the use of innovative antifouling coatings is a key issue for ship owners and operators. Coatings World, May 2008. Available from www.entrepreneur.com/tradejournals/article/179533075.html, accessed 12 April 2009.
CSD19/2011/BP2
22
Table 4 Efficiency innovations for shipping
Innovation Examples
Fuel Cells - Natural Gas (50 per cent): while still a fossil fuel, a fuel cell using natural gas can result in 50 per cent fewer greenhouse gas emissions than a diesel engine.
According to the Oak Ridge National Laboratory the “US Navy design study converting from gas turbine generator to fuel cell with diesel reformer, yielding 30 percent fuel reduct”.
Anti-Fouling Coatings (40 per cent): antifouling coatings can increase fuel efficiency by preventing organisms such as barnacles and weeds adding additional resistance.
According to an international ship paint producer, “Antifouling coatings provide the shipping industry with annual fuel savings of US$60 billion and reduced carbon dioxide emissions of 384 million tons per year”.
Improving Hull Insulation (15 per cent): improving hull insulation can increase the energy efficiency of ships by, on average, 15 per cent.
Installation of fresh air heat exchangers, along with reducing leaks, can improve the efficiency of a ship’s HVAC system by as much as 10-15 per cent.
Air Floatation (15 per cent): by pumping air through cavities along the bottom of a ship, ships can effectively float on a thin bed of air, rather than water.
A shipping company in the Netherland is investigating ways in which to reduce the frictional drag of water on large ocean faring vessels, estimating fuel consumption can be cut by 15 per cent, while consuming only an additional 1 per cent of the ship’s power.
Advanced Impellors (10 per cent): a new impellor design uses a spiral shape to channel water, increasing engine efficiency by 10 per cent.
For sma ller vessels attaching an electric motor to an impellor can generate electricity as its rotation in the water generates electricity which can be stored, or used to power other ship systems.
Renewable Energy for Ships in Port (90 per cent): renewable energy from onshore can be used for essential functions and services, such as lighting on ships while they are in port, potentially avoiding almost all emissions.
Usually ships use onboard power generation by auxiliary diesel engines. In Göteborg Port in Sweden, renewable wind energy is being used to run essential services on ships in port, cutting emissions by 94-97 per cent.
Wind Propulsion Systems (up to 70 per cent for Small Freighters): highly efficient designs are emerging for sails, capable of powering large cargo freighters. Wind propulsion systems have been available for more than two decades.
Some freight ships rely on indosail rig which can provide up to 70 per cent of propulsion, in combination with a diesel-electric engine. The Greenpeace schooner ‘Rainbow Warrior II’ uses an indosail rig, consuming 40 per cent less fuel.
Sources: 1. King, B., Payne, J., Robers, R. and Villiott, C. (2007). Green Vessel Design - Environmental best practices. Proceedings Environmental Protection in the Air, Winter 2008-09, pp7-12. Available from www.uscg.mil/proceedings/articles/7_King,%20Payne,%20Roberts,%20Villiott_Green%20Vessel%20Design.pdf, accessed 9 April 2009. 2. Pianoforte, K. (2008). Marine coatings market: increasing fuel efficiency through the use of innovative antifouling coatings is a key issue for ship owners and operators. Coatings World, May 2008. Available from www.entrepreneur.com/tradejournals/article/179533075.html, accessed 7 April 2009. 3. Petz, I. (2008). Wind Power Holds Visionary Solutions for Shipping. Credit Suisse, 29 September 2008. Available from http://emagazine.credit-suisse.com/app/article/index.cfm?fuseaction=OpenArticle&aoid=242852&lang=EN, accessed 7 April 2009.

CSD19/2011/BP2
23
V. CONCLUSIONS AND RECOMMENDATIONS 57. Many transport technologies exist, which, if applied more effectively, could significantly increase the resource and energy efficiency in the transport sector. Such energy efficiency potentials exist in almost all countries, and in all modes of transport. 58. Considering current trends and the projected rapid growth in global motorization, much greater research and development efforts will also be needed to further develop, test, commercialize and deploy “greener” low-carbon transport technologies. 59. The challenges and opportunities for improving energy use and efficiency in the transport sector differ significantly from country to country. Hence, there is no one-size-fits-all standard approach to address these challenges. 60. Coherent and pro-active transport policies are urgently needed to mobilize the necessary domestic and international public and private human capacities and financial resources to enhance investment and modernization of the transport sector, in particular also in the developing countries, with a view to gradually reduce the energy intensity and the carbon footprint of transport activities. Private investment in fuel saving transport technologies will be more attractive in countries where energy prices are comparatively high. 61. City administrations and local governments have a particularly important role to play in promoting low carbon transport options at the local level, including public transport as well as non-motorized transport. Significant increases of investment in public transport infrastructure and services are urgently needed, in particular, in the rapidly growing cities of developing countries. City administrations may consider options for reducing indirect subsidization of private motorized transport, in particular in city centres, which may free us resources for investment in public transport. 62. National governments have a considerable variety of policy options and can implement various measures, including fiscal incentives, subsidies, taxation and penalties, to influence market outcomes and to encourage investment in and use of more environmentally sustainable transport options. 63. Multilateral development banks play an important role in financing transport infrastructure in developing countries. All financing of transport projects should include an appropriate component for non-motorized forms of transport. 64. Transport policy and transport investment decision making should involve representatives of all concerned stakeholders, including local communities, consumers/commuters/travellers, as well as the concerned manufacturers, service providers and other private sectors. 65. Greater international cooperation and sharing of international experiences as well as technology development and technology transfer to developing countries will be essential to advance sustainable transport systems in developing countries.