technology and market foresight • strategic research ... · keywords svoc, material emission,...
TRANSCRIPT
VTT RESEARCH NOTES 2486VTT CREATES BUSINESS FROM TECHNOLOGY�Technology�and�market�foresight�•�Strategic�research�•�Product�and�service�development�•�IPR�and�licensing�•�Assessments,�testing,�inspection,�certification�•�Technology�and�innovation�management�•�Technology�partnership
•�•�•��VTT�RESEA
RC
H�N
OTES�2486���
SEMI�VO
LATILE�O
RG
AN
IC�C
OM
POU
ND
S�AN
D�FLA
ME�R
ETAR
DA
NTS.�O
CC
UR
REN
CE�IN
�IND
OO
R...ISBN 978-951-38-7299-1 (URL: http://www.vtt.fi/publications/index.jsp)
ISSN 1455-0865 (URL: http://www.vtt.fi/publications/index.jsp)
Helena Järnström, Sirje Vares & Miimu Airaksinen
Semi volatile organic compounds and flame retardants
Occurrence in indoor environments and risk assessment for indoor exposure
This project reviews the occurrence of SVOC compounds and flame retardants in the commonly used building and furnishing materials in Finland. The knowledge for the review was gathered from housing statistics, building product statistics, the chemical registry at The National Product Control Agency’s (STTV), The National Board of Antiquities and Historical Monuments in Finland, Finnish Environment Institute (SYKE), and from interviews with the construction product industry. In addition, emissions of SVOCs and flame retardants were measured from the most commonly used building materials. On the basis of present knowledge, risk assess-ment for exposure indoors is presented.

VTT TIEDOTTEITA � RESEARCH NOTES 2486
Semi volatile organic compounds and flame
retardants Occurrence in indoor environments and
risk assessment for indoor exposure
Helena Järnström, Sirje Vares & Miimu Airaksinen
2
ISBN 978-951-38-7299-1 (URL: http://www.vtt.fi/publications/index.jsp) ISSN 1455-0865 (URL: http://www.vtt.fi/publications/index.jsp)
Copyright © VTT 2009
JULKAISIJA � UTGIVARE � PUBLISHER
VTT, Vuorimiehentie 5, PL 1000, 02044 VTT puh. vaihde 020 722 111, faksi 020 722 7001
VTT, Bergsmansvägen 3, PB 1000, 02044 VTT tel. växel 020 722 111, fax 020 722 7001
VTT Technical Research Centre of Finland, Vuorimiehentie 3, P.O. Box 1000, FI-02044 VTT, Finland phone internat. +358 20 722 111, fax +358 20 722 7001
Technical editing Maini Manninen Edita Prima Oy, Helsinki 2009

3
Helena Järnström, Sirje Vares & Miimu Airaksinen. Semi volatile organic compounds and flame retardants. Occurence in indoor environments and risk assessment for indoor exposure. Espoo 2009. VTT Tiedotteita � Research Notes 2486. 58 p. + app. 8 p.
Keywords SVOC, material emission, exposure indoors
Abstract The first part of the project presented in this publication reviews the occurrence of semi-volatile or-ganic compounds (SVOCs) and flame retardants in commonly used building and furnishing materials in Finland. SVOCs included in the review are plasticisers, like phthalates, flame retardants (FRs), like brominated organic compounds and organophosphate esters. In addition, polyaromatic hydrocarbons (PAHs), which are constituents in coal tar/ creosote and have been used for moisture proofing in struc-tures, are also discussed. On the basis of present knowledge, risk assessment for exposure indoors is presented. In addition, sources of SVOCs and the waste potential in the old building stock are clari-fied. The knowledge for the review was gathered from housing statistics, building product statistics, the chemical registry at The National Product Control Agency's (STTV), The National Board of An-tiquities and Historical Monuments in Finland, Finnish Environment Institute (SYKE), and from inter-views with the construction product industry.
In the second part of the project, SVOCs were measured from a total of 13 building materials in-cluding flooring materials, paints, insulations and a levelling agent (screed). Both short and long term (up to 60 days) emissions were measured by modifying the existing standard sampling method for the measurement of volatile organic compounds (VOCs). Emissions were measured at room temperature 23 °C and at 40 °C. The elevated temperature was considered to simulate real life situations, such as when a floor structure has heating or a surface gets warmed up by direct sunlight.
The results showed that the initial specific emission rates (SER) of SVOCs are typically low, less than 5 µg/m2h. An exception was newly prepared foam type polyurethane insulations, which emitted SVOCs up to 65 µg/m2h. The SVOC SERs were higher at 40 °C, up to 165 µg/m2h. No phthalates were detected from the air samples collected at room temperauture during the 60 -day test period. However, 218 µg of a phthalate compound was detected from the solvent used to rinse the walls of the chamber that was used to measure the PVC sample. Also, 72 ng of the fire retardant hexabromocyclo-dodecane (HBCD) was detected from the rinsing samples of the chamber used for measuring the ex-panded polystyrene (EPS) insulation for FR applications. A commonly used FR, Fyrol PCF (Tris (2-chloroisopropyl) phosphate, TCCP) was detected from air samples taken from the polyurethane insula-tion (foam type) at 24 µg/m2h (as toluene equivalent) after 120 minutes at 40°C. Boron was detected from air samples from the cellulose based insulation material at 0.3�5 µg/m3.
The study showed that SVOCs and FRs are emitted at low levels at room temperature from common building materials. However, the variety of compounds emitted and emission ranges varied markedly depending on which building product was measeured. SVOC (and VOC) SERs increased markedly when the temperature increased to 40 °C. In real life, such temperatures can be reached on surfaces with direct sunlight during the summer or in cases when floor heating is used. Consequently, exposure assessments for SVOCs in such environments can be assessed better based on the emission results collected during this project. Exposures at room temperature were esitimade to <0.1 - <2 µg/kg day. However, the migration of FRs and SVOCs into indoor air is probably less from building materials that are inside a structure, e.g. insulation, which decrases exposure to these compounds indoors.

4
Preface
This project was part of the Environmental cluster research projects 2006�2009 financed by the Minis-try of Environment in Finland. The supervisors for the project were Chief engineer Kaisa Kauko and Chief engineer Juha-Pekka Maijala. The following construction product industry partners also contrib-uted to the financing of the project: maxit Oy, Upofloor Oy, Saint-Gobain Rakennustuotteet Oy, The Cellulose insulation industry in Finland, The EPS insulation industry in Finland, The Construction Polyurethane Industry of Finland , and Tikkurila Oy. The financers are greatly acknowledged for mak-ing the project possible and for their valuable advice during the project.
The authors want to express their gratitude to Kristina Saarela for her work in initiating this project and to Senior research scientist Tiina Tirkkonen and Technician Eero Luostarinen for their valuable advice during the realisation of it. The sampling and VOC& SVOC analysis work was done by Assis-tant researcher Kaija Luomanperä, Researcher Jari Kiuru and Technician Helena Vähäkuopus at VTT. The authors are grateful for their contribution in doing the laborious measurements. The authors also want to thank Researcher Sami Huhtala at SYKE, who was responsible for the analyses of the bromi-nated compounds. Building conservation officer Olli Cavén at the The National Board of Antiquities and Historical Monuments in Finland, Senior inspector Ritva Vuorinen at STTV, Marja Hermiö at the Central Statistical Office of Finland as well as Researcher Kaisa Belloni, Senior research scientist Tuomas Paloposki and Senior research scientist Terttu Vainio at VTT, are greatly acknowledged for giving information on relevant building statistics to the review. Finally, the authors want to thank Dr. Cynthia Howard Reed for reviewing the report.

5
Contents
Abstract ...........................................................................................................................3
Preface ............................................................................................................................4
Abbreviations and definitions ..........................................................................................7
1. Introduction ................................................................................................................9
2. Semi volatile organic compounds (SVOCs).............................................................11 2.1 Chemical structure, properties and production ......................................................................... 11 2.2 Applications in buildings ........................................................................................................... 12 2.3 Regulations given by the authorities......................................................................................... 13
3. Flame retardants......................................................................................................15 3.1 Chemical structure, properties and production ......................................................................... 15 3.2 Applications in buildings ........................................................................................................... 17 3.3 Regulations given by the authorities......................................................................................... 19
4. Indoor air exposure for SVOCs and flame retardants..............................................20
5. Waste potential of SVOCs and flame retardants in the existing building stock .......25
6. Measurement techniques to determine emission from materials and the indoor air concentration of SVOCs and flame retardants ........................................................27 6.1 Emission test chambers ........................................................................................................... 27 6.2 Sampling and analysis.............................................................................................................. 28
7. Emissions of SVOCs from building materials ..........................................................30 7.1 Materials tested ........................................................................................................................ 30 7.2 Methods.................................................................................................................................... 31
7.2.1 Sampling.................................................................................................................... 31 7.2.2 Analysis ..................................................................................................................... 33
7.2.2.1 Pre tests................................................................................................... 33 7.2.2.2 Tenax samples......................................................................................... 34 7.2.2.3 PUF samples ........................................................................................... 34
7.3 Results ..................................................................................................................................... 34

6
7.3.1 Pre tests..................................................................................................................... 34 7.3.2 Sampling on Tenax TA .............................................................................................. 35
7.3.2.1 Results at 23°C........................................................................................ 35 7.3.2.2 Results at 40°C........................................................................................ 38
7.3.3 Sampling on PUF....................................................................................................... 42 7.3.3.1 SVOCs and phthalates ............................................................................ 42 7.3.3.2 Brominated compounds ........................................................................... 45 7.3.3.3 Organophosphates .................................................................................. 45 7.3.3.4 Boron ....................................................................................................... 45
7.4 Discussion ................................................................................................................................ 46
8. Conclusions and recommendations for further action .............................................50
References ....................................................................................................................54
Appendices Appendix A: Chemical product registry search list Appendix B: Recycling of selected building materials

7
Abbreviations and definitions BAM Bundesanstalt für Materialforschung und -prüfung (Federal Institute for Materials
Research and Testing, Germany)
BBP Butylbenzyl phthalate
BFR Brominated flame retardants
CFC Chlorine-fluorine-carbon compounds
DBP Dibutyl phthalate
DCM Dichloromethane
DEP Diethyl phthalate
DEHP Di (ethylhexyl) phtalate
DIBP Diisobutyl phthalate
DIDP Diisodecyl phthalate
DIHP Diisohexyl phthalate
DIOP Diisooctyl phthalate
DINP Diisononyl phthalate
DIUP Diisoundecyl phthalate
DPHP Dipropylheptyl phthalate
DPP Diphenylphthalate

8
DUP Diundecyl phthalate
ECB European Chemicals Bureau
ECPI European Council for Plasticisers and Intermediates
EU European Union
FLEC Field and laboratory emission cell
FR Flame retardant
LCFI Loose-fill cellulose fibre insulation
LOD Limit of Detection
LOQ Limit of Quantification
OECD Organisation for Economic Co-operation and Development
PAH Polycyclic aromatic hydrocarbon
PBB Polybrominated biphenyl
PBDE Polybrominated diphenylether
PVC Polyvinyl chloride
SER Specific emission rate
SVOC Semi volatile organic compounds
TBBPA Tetrabromobisphenol A
TCEP Tri (chloroethyl) phosphate
TCPP Tris (chloroisopropyl) phosphate
TSVOC Total semi volatile organic compounds
TTL Työterveyslaitos (The Finnish Occupational Health Institute)
TVOC Total volatile organic carbon
WHO World Health Organisation

1. Introduction
9
1. Introduction
The occurrence of semi volatile organic compounds (SVOC) in the indoor environment is under spe-cial interest today since health concerns have risen. These compounds might be released to the sur-roundings from new products as well as from older building materials as a result of wearing. The con-cern about the health effects has led to the need to evaluate sources and possible exposure routes for these compounds in the indoor environment. Also, the fate of these compounds within the waste man-agement during renovation is of interest. Common SVOCs in the indoor environment are plasticisers like phtalates, and flame retardants (FRs) like brominated organic compounds and organophosphate esters. In addition, polyaromatic hydrocar-bons (PAHs) are constituents in coal tar/ creosote, which have been used for moisture proofing in structures. The indoor air concentration of SVOCs and flame retardants is usually low because of their adsorption to surfaces and dust particles. The probable exposure routes in the indoor environment are skin contact with surfaces, aerosol deposition on skin and respiratory intake. Especially in the case of very young children, the oral and dermal uptake from house dust might be of relevance for risk as-sessment. It is of importance that the knowledge of the use of these chemicals in the production proc-esses and their behaviour is incorporated to the general information management within the material and building industry.
The Finnish building stock has grown more pronounced since the 1950�s (Table 1, Figure 1). Reno-vation work has been increasing markedly since the 1990´s. In 2004, the value of renovation work was about 7 billion euros, which is about 44 % of the total building industry market (Virtanen et al. 2005). Therefore, the waste management of these chemicals is crucial in terms of environmental protection.
Table 1. Building types in Finland in year 2005 (Vainio et al. 2006, www.tilastokeskus.fi)
Building type Number (municipally owned/ total) Residential buildings 12 914/ 1 183 893
Business and office buildings 1 412/ 10 772 Day-care centers 1 318/ no statistics School buildings 5 881/ 9 005 Public buildings (theater and concert buildings, libraries,
museums and exhibition halls, club& society houses, sports and fitness facilities etc.)
2 132/ 13 318
Health care buildings etc. 3 021/ 7 612

1. Introduction
10
0
5,000
10,000
15,000
20,000
25,000
30,000
Separate smallhouses
Row houses Apartmentbuildings
Business andoffice facilities
Public facilities
-19201921-19301931-19401941-19501951-19601961-19701971-19801981-19901991-20002001-2005
Floor area of the Finnish building stock in year 20051000 m2
Figure 1. Floor area of the Finnish building stock through year 2005 (VTT 2006a).
This project reviews the occurrence of SVOCs and flame retardants in commonly used building and furnishing materials in Finland, and the need for their use and possible alternative materials or build-ing technology solutions to minimise indoor air exposure. In addition, sources of SVOCs and waste potential in the old building stock are clarified. The knowledge was gathered from housing statistics provided by Terttu Vainio at VTT, Ritva Vuorinen at the chemical registry at STTV, Olli Cavén at The National Board of Antiquities and Historical Monuments in Finland, and from interviews with the construction product industry. The report also includes regulations given by the authorities associated with the materials used in residential, office and public facilities and which contain SVOCs and/or flame retardants. In the last section of the review, the current information available on sampling and analytical techniques for the determination of material emission and indoor air concentrations of SVOCs and flame retardants are summarised for possible incorporation of these compounds to the Finnish material classification. Finally, the emission testing results for 13 different building materials are presented.

2. Semi volatile organic compounds (SVOCs)
11
2. Semi volatile organic compounds (SVOCs)
2.1 Chemical structure, properties and production
The World Health Organisation has defined SVOCs as organic compounds with boiling points ranging from 240 °C to 400 °C (WHO 1997). SVOCs considered here are phthalates (PVC plasticiser), pol-yaromatic hydrocarbons (PAHs), and flame retardants. Flame retardants are discussed separately in Chapter 3. An evaluation of the occurrence of PCB in Finnish buildings has been published earlier (Maijala and Nippala 2002).
Phthalates, i.e. phthalate esters are by far the most widely produced plasticisers worldwide. Phtha-late esters are manufactured from alcohols such as methanol and ethanol (C1/C2) up to iso-decanol (C13), either as a straight chain or with some branching. There are over 100 commercially available phthalate compounds, which provide a wide range of different properties for different uses such as fast-fusing applications, low viscosity applications, temperature flexibility, high temperature use like high performance cables, etc. (Phthalates Information Centre 2006).
The annual use of phthalates in Europe is about 1 million tons. Di (2-ethylhexyl) phthalate (DEHP) is by far the most commonly used. More than 90 % of phthalates produced in Europe are used to plas-ticise PVC (polyvinyl chloride) to make flexible PVC products (ECPI 2006). The plasticiser diisononyl phthalate (DINP) and diisodecyl phthalate (DIDP) account for around 60 % of all plasti-ciser use in Western Europe (Phthalates Information Centre 2006).
Typically, C1 and C2 phthalates are used in non-PVC applications. The C3 to C7 phthalates are used in applications where rapid setting and resistance is required, foamed leather cloth and flooring for example. The C8/C9 and C10 phthalates are the most widely used general purpose plasticisers used for such applications as wall covering, flooring and medical applications. The C11 to C13 phthalates are used where high temperature stability is required (Phthalates Information Centre 2006). Table 2 summarises phthalate compounds and their applications registered in Finland by year 2005. A list of phthalate compounds included in the search from the chemical registry is shown in Appendix A.

2. Semi volatile organic compounds (SVOCs)
12
Table 2. Phthalates in chemicals registered in Finland in 2005 (no inf.= no information, STTV 2006).
Phtalate CAS Number Tons Application
DMP (dimethyl phthalate) 131-11-3 19 280 curing agent, polyme-risation initiator
DEP (diethyl phthalate) 84-66-2 6 8 production of medicinal substance, cosmetics
DBP (di-n-butyl phthalate) 84-74-2 51 332 paint, glue, plasticiser
BBP (butylbenzyl phthalate) 85-68-7 27 603 paint, glue
DEHP / DOP (di(2-ethylhexyl) phthalate)
117-81-7 28 757 paint, glue, plasticiser
DINP (diisononyl phthalate) 28553-12-0 18 4 paint, glue, sealing compound
DIDP (diisodecyl phthalate) 26761-40-0 4 2 sealing compound
DUP (diundecyl phthalate) 3648-20-2 7 0.1 printing ink (silk)
DIUP (diisoundecyl phthalate) 85507-79-5 no inf. no inf. glue, plasticiser
PAH compounds
Polynuclear (or polycyclic) aromatic hydrocarbons (PAH) are a group of several hundred different organic compounds with two or more benzene rings. They are highly lipophilic and have low vapour pressures. They are mainly produced as a result of pyrolytic processes, especially the incomplete com-bustion of organic materials (WHO 2000). Coal tar and its distillation fractions like creosote, crude oil, fuel oil, diesel oil and bitumen contain PAH compounds. Coal tar, creosote and bitumen have been used as a water repellent/barrier and wood preservative.
2.2 Applications in buildings
Phthalates
Phthalate compounds can be found in the following indoor materials: flooring materials (PVC), vinyl plates, shower curtains, plumbing, wires, cables, sealant ribbon, wall papers, adhesives, paint, electri-cal equipment, textiles, and coated fabrics. In addition, consumer products like toys and hand grips in tools can contain phthalates.
Creosote, coal tar
In Finnish construction industry, creosote or coal tar has been used for waterproofing building struc-tures. In old buildings, especially the floors and/or walls of lower floors and cellars have been treated with these chemicals. In addition, proofing with coal tar has been done for brick walls and its joints.

2. Semi volatile organic compounds (SVOCs)
13
Coal tar has been used in Finnish buildings built until the 1980´s. These buildings constitute 73�88 % of the total area of buildings in Finland, which correspond a total floor area of ~350 million m2 (VTT 2006a). Since 1996, the use of creosote and wood treated with it has been restricted to industrial and professional applications (railroad, power transmission and telephone line support, fences, farming and harbors, The Council of State 1995). Applications, where there is a risk for repetitive dermal exposure or the pollution of nutrition or animal feed, as well as applications indoors, in garden furniture and in gardens is prohibited since 2003 (The Council of State 2003).
The National Board of Antiquities and Historical Monuments in Finland has through its renovation work experience in creosote applications in old buildings. Creosote has been found, for example, in the insulations of the national theatre building, which was built in the beginning 20th century. In Valkeala, the floors and walls of an old wooden building was treated with creosote. In Suomenlinna, creosote was found in several buildings built in 1890�1910. Usually it was found on the surface of the ground concrete slab (not reinforced), on which a wooden wall, supported with a platform made of brick, was installed.
2.3 Regulations given by the authorities
Phthalates
Exposure to some phthalates has been found to increase the risk of cancer, deformations and reproduc-tion disruptions. Newer research has found an increase in rhinitis and eczema as well as asthma (TTL 2006).
The EU has confirmed that two of the most widely-used plasticisers are not classified as hazardous and pose no risks to either human health or the environment from their current use. The publication in the European Union Official Journal of the outcomes of the EU risk assessments for Di-isononylphthalate (DINP) and Di-isodecylphthalate (DIDP) state that there is no need for any further measures to regulate the use of these two compounds. The outcome of the risk assessment for the lesser-used specialty plasticiser, DBP, has also been published in the EU�s Official Journal. Following the assessment, measures are to be taken within the framework of the IPPC Directive (96/61/EC) and the Occupational Exposure Directive (98/24/EC) (ECPI 2006).
The European Union has confirmed that DEHP poses no general risk to human health in its risk as-sessment published in 2008 (European Union 2008). For BBP, a risk reduction strategy is to be ad-vised but no further risk reduction measures are recommended for human safety. In 2007, permanent restrictions on the use of phthalate plasticisers in toys came into effect throughout the European Un-ion. DINP and the two phthalates DIDP and DNOP can only be used in toys and childcare articles that cannot be placed in the mouth. DEHP, DBP and BBP will no longer be allowed in any childrens toys or childcare articles (European Union 2005).

2. Semi volatile organic compounds (SVOCs)
14
PAH compounds are carcinogenic and no safe level for them can be recommended (WHO 2000). Of the PAH compounds, benzo (A) pyrene is classified as a carcinogen by the International Agency of Cancer (IARC). The use of creosote and wood treated with it has been restricted in Finland since 1996 (The Council of State 1996 and 2003).

3. Flame retardants
15
3. Flame retardants
3.1 Chemical structure, properties and production
Flame retardants (FRs) have been found to lengthen escape time , reduce the heat production to 25 %, decrease the combustion of a material by 50 % and decrease the production of toxic flame gases by 30 % (Steukers et al. 2004). Flame retardants are divided into four different groups: 1) inorganic, 2) halogenated organic 3) organic phosphorus containing and 4) nitrogen containing flame retardants (WHO 1997). The bonding of flame retardant compounds in the polymer is of importance when the migration into the environment is considered. The volatilization or leakage is less probable for reactive bonding compared to additive bonding. Table 3 summarizes FRs, their applications and the annual use in Europe in 1999 (WHO 1997, BSEF 2003). OECD approximated that the annual global production of FRs in 1992 was 600 000 tons (OECD 1994). By 2001, the amount had doubled to 1 217 000 tons (Davenport et al. 2002). The relative por-tion of organophosphate compounds is expected to increase since the use of polybrominated diphenyls (PBDEs) is nowadays restricted by the authorities. Brominated flame retardants (BFRs) are the largest market group (1998: 39 %, BSEF 2003) because of their low cost and high performance efficiency. There are over 75 different commercial BFRs. Their consumption by final applications is as follows: Electronics and electrical 56 %, building/construction 31 %, textile/other 7 % and transportation 6 % (BSEF 2003). Table 4 summarizes the FRs in chemicals registered in Finland in 2005. A list of the compounds included in the search from the chemical registry is shown in Appendix A.

3. Flame retardants
16
Table 3. Flame retardants, type of bonding in the polymer and annual volumes in Europe in 1999 (WHO 1997, BSEF 2003, no inform.= no information available).
Flame retardant (FR) group
Compound Applications Volume estimates (tons)
Inorganic
d Metal hydroxides, antimony trioxide, alumina trihydrate, boron compounds, ammonium polyphosphate (APP)
polymers, textiles, papers, cotton, paints, polyamide& pehnolic appl.
no inform.
Chlorinated FRs (plastics) plastics (wire& cable appl.), fabrics, paints, coatings
no inform.
Tetrabromobisphenol (TBBPA) epoxy resins in printed circuit boards
13 800
Polybrominated diphenylethers (PBDE): deca (DBDE), octa(OBDE) penta (PBDE)
high impact polystyrene (TV cabinets), thermoplastics, polyolefins, PVC, elastomer
8 160
Hexabromocyclodecane (HBCD) polystyrene foam, fire resistant polymers, textiles, furniture, electronics
8 900
Halogenated organic
Polybrominated biphenyls (PBB) plastics, electrical appl., textiles
no in-form.
Organic phospho-rous containing
Phosphate esters Phosphonium salts Tris (1-chloro-2-propyl) phosphate (TCPP)
cellulosic materials, textiles, PVC- based products, poly-urethane foam
no in-form.
Nitrogen contain-ing
Melamine compounds polypropylene, polyethylene, polyamides, terephthalates
no inform.
Table 4. Flame retardant compounds in chemicals registered in Finland in 2005 (STTV 2006).
Flame retardant CAS Number of registrations
Tons Application ( as documented in the register)
Alumina trihydrate ATH 21645-51-2 12 0.5 paint, glue, flame retardant, clean-up of waste water
Antimony trioxide (synergist) 1309-64-4 32 182 flame retardant, production of plas-tics
Sodium antiomonate 15432-85-6 not available flame retardant
Boric acid 10043-35-3 14 42 wood perservative, chemical for photoghraphy, flame retardant
TCPP 13674-84-5 16 1571 production of polyurethane, glue, flame retardant
Triphenylphosphate 115 86 6 31 10 lubricant, flame retardant, clipping liquid
Triethylphosphate 78-40-0 9 7 glue, flame retardant
Trioctyl phosphate 78-42-2 6 100 flame retardant, clipping liquid
2-ethylhexyl-diphenyl phos-phate
1241-94-7 5 190 flame retardant, lubricant
Melamine 108-78-1 not available printing ink (silk), flame retardant

3. Flame retardants
17
3.2 Applications in buildings
The brominated FRs have been used in polymers like polystyrene foams, high-impact polystyrene and epoxy resins (Birnbaum & Staskal 2004). TBBPA, deca-BDE and octa-BDE are common BFRs in plastic housings like TVs, PCs and office equipment (BSEF 2003). Kemmlein et al. studied the emis-sion of selected brominated and organophosphate FRs from insulating boards, polyurethane (PU) foams, a mattress and electronic equipment. The content of FRs were < 1 %�20 % and the highest content was measured for the PU foam. TCPP was found to be the most commonly emitted organo-phosphate FR in polyurethane foam (Kemmlein et al. 2003). The use of BFRs has been clarified quite extensively in the Danish and Swedish building industry (Miljøstyrelsen 2007, Jönsson and Yndemark 2002). The Swedish investigation concluded that BFRs are used in roofing products (rubber mem-branes and polyethene products), insulations, piping insulations, and installation materials (some cable products, circuit boards etc.). The most common BFRs were HBCD, decaBDE, PBDE and TBBP-A. The annual use of BFRs was 50�100 tons in Denmark.
As a summary, potential sources of FRs in building structures are as follows: insulation materials, i.e. insulation boards, foams, paints, varnishes and glues, and other plastics. In addition, FRs in indoor environments can be found in electrical and electronic equipment (cables, PCs, printers, fax machines, copiers, TVs) and textiles and upholstery foams. The Finnish building code gives requirements for fire resistance (Ministry of Environment 2002). The requirements do not specify any chemicals for fire retardant purposes. The following summarizes the interviews made among building material manufacturers concerning the use of FRs in building materi-als produced in Finland. The interviews were made in December 2006�May 2007. Insulations:
The polyurethane industry
The main three polyurethane producers in Finland use FRs in their products. However, the FRs used are considered as less hazardous for health (Rakennuspolyuretaaniteollisuus 2006). Foreign manufac-turers commonly use commercial mixtures, which do not specify their FRs. Expanded polystyrene (EPS)
Expanded polystyrene (EPS) is extensively used in building industry because of its durability and in-sulation properties. EPS insulation is used for example for roofs, facades, ground floor structures, foundations, frost insulation and for civil engineering applications. EPS insulation is manufactured as normal quality and as flame retardant quality (FR quality). Hexabromocyclodecane (HBCD) is used as a fire retardant in EPS raw material. The EPS of FR quality is only used in the applications were fire protection is needed. These kind of applications are for example wall/facade and roof structures in construction. The content of HBCD is 0.7% in the product. EPS applications are mainly in the build-ing frame, i.e it is not used as a surface or covering material.

3. Flame retardants
18
Seven Finnish producers manufacture EPS insulation materials and one Finnish company produces EPS raw material. EPS raw material is also imported to Finland.
Extruded Polystyrene (XPS)
Extruded polystyrene (XPS) is used in roofs, parking levels, ground floor, foundations and frost. One Finnish company produces XPS in Finland. HBCD is used as a flame retardant in XPS products. XPS is also imported to Finland, for example Saint-Gobain Rakennustuotteet Oy markets a XPS product in Finland. The insulation products marketed by Saint-Gobain Rakennustuotteet Oy do not contain any FRs listed in appendix A.
Loose-fill and sprayed cellulose based insulations (LCFI)
LCFI-insulations are used for insulating roof, wall and floor structures. Also ventilation ducts can be located in LCFI insulation layers. Boron (borax and boric acid) is added as a FR. Mineral wool
The insulation marketed by Saint-Gobain are made from glass and do not contain FRs. Recycled glass is used up to 60�80 % in manufacturing glass wool insulations. The insulations marketed by Paroc Oy are made of stone material. Acoustic boards:
The acoustic boards marketed by Saint-Gobain Ecophon Oy do not contain FRs. Paints:
Tikkurila Oy: No flame retardants are added to paints used for indoor application. FRs have been used for paints that are applied on steel constructions, e.g. industrial facilities and ware houses. The con-structions are usually finished with paint that does not contain FRs. The most common FRs are poly-phosphate and chlorinated paraffin. Also, wooden structure has been finished with paints containing FRs. However, this has not been common in Finland. Some products sold by the Finnish company have been produced in Germany. The possible use of FRs is not known because only compounds with known health effects have to be reported.
Presso Center Oy produces/ markets paints and laquers for fire protection applications. The products are halogen free. Sitrate and phosphate salts are used as FRs. The products are used on steel construc-tions, wooden structures in the interiors and textiles.

3. Flame retardants
19
Flooring materials:
Upofloor Oy: PVC and linoleum flooring materials do not contain any FRs Wooden materials
The common FRs used for wooden materials are inorganic or organic salts (phosphates, sulphates, boric acid and borax, Belloni 2007). In Europe, fire protected wood is used in exterior and interior walls as covering materials (panels etc.), and in the facades.
3.3 Regulations given by the authorities
Many flame retardants currently used are classified as hazardous substances or must be regarded as potentially hazardous to health, so that possible impairments following inhalative, oral, or dermal in-take must be evaluated (WHO 1997). The brominated FRs are especially of concern. The clarification work done in the EU concluded that flame retardants should be assessed as separate compounds, i.e., an evaluation for compound groups is not satisfactory. The EU directive 2003/11/EC has restricted the use of penta and octabromodiphenylether. These compounds were banned in the EU from August 2004 (Steukers et al. 2004).
The ROHS (Restriction of the use of Certain Hazardous Substances in Electrical and Electronic Equipment) directive restricts the use of PBB and PBDE in electrical equipments (domestic appli-ances, information and telecommunication equipment, consumer electronics, electric tools, toys, sports and leisure equipments, automatics, glow lamps, European Union 2003).
The EU risk assessment report concluded recently that there are no health risks of concern for TBBPA (European Chemicals Bureau 2006).

4. Indoor air exposure for SVOCs and flame retardants
20
4. Indoor air exposure for SVOCs and flame retardants
The concentration of SVOCs indoors is usually very low, 10 µg/m3 or less (Wensing et al. 2005). The vapor pressure for SVOCs at normal indoor conditions is low and consequently their partition to parti-cles or on surfaces is higher than to the air (Weschler 2003). The SVOC concentration measured in accordance to the ISO 16000-6 standard (ISO, 2004) in one year old Finnish buildings, which were built during 1999�2002 and in which low emitting, M1 classified (FiSIAQ, 2001) building materials were used (n = 14) was on average 8 µg/m3 (max:17 µg/m3, Figure 2). These buildings had painted walls and the ceiling structure was finished with a leveling agent. A statistically significant higher concentration of SVOCs (p < 0.05) was found in apartments with PVC as flooring materials compared to apartments with parquet flooring. The identified SVOCs were alkyl benzenes and isopropyl myristate.

4. Indoor air exposure for SVOCs and flame retardants
21
0month 6months 12months
0
10
20
30
40
50
60
70
3
8
2
Indoor air SVOC concentration in 0-12 month-old buildings
µg/m3
Figure 2. Indoor air SVOC concentration in buildings completed during 2000�2002 in Finland (VTT 2006b). The thick line shows the median value. The box edges are the 25 and 75 percentiles. The lines show the minimum and maximum values, the O stands for outliers (= cases with values between 1.5 and 3 box lengths from the upper or lower edge of the box, the box length is the interquartile range) and the stars stand for extreme values (= cases with values more than 3 box lengths from the upper or lower edge of the box, the box length is the interquartile range).
Phthalates
Field studies have shown that phthalate concentrations in residences are on the level < 10 µg/m3. Commonly detected phthaltes are DEHP, DBP and BBP. Daily intakes of phthalates (infants) have been estimated to 0.04�0.8 µg/kg (inhalative) and 2.5�26.8 µg/kg (oral) (Wensing et. al. 2005).
The EU Risk Assessments of the phthalates DEHP, DINP, DIDP and BBP include estimates of ex-posure to various sectors of the population via a range of exposure scenarios (ECB 2006). The ap-proach adopted for exposure indoors is similar for all the phthalates and is exemplified by DEHP. The worst case assumptions made are 1) all surfaces of the room are covered in PVC and the air is satu-rated with DEHP vapour, 2) three times more DEHP is bound to dust particles in the air than is present as vapour, 3) the concentration of DEHP indoors (at 20º C) is 5.3 µg/m3, as calculated from the satu-rated vapour pressure. The amount of DEHP adsorbed onto dust particles is therefore assumed to be 15.9 µg/m3 (3 x 5.3) and the total air concentration is 21.2 µg/m3. The daily exposure to DEHP in in-door environments for adults and children is calculated as follows:

4. Indoor air exposure for SVOCs and flame retardants
22
(1) The assumed body weight (BW) for an adult is 60 kg and 8 kg for a child. The inhalation rate, assum-ing moderate activity (Vinh) for an adult is 20 m3/day and 9.3 m3/day for a child.Uinh is the uptake (mg/kg/day), Binh the bioavailability for inhalation exposure (75 % for adults and 100 % for children), Cinh the air concentration (mg/m3) and t the exposure duration (20h/day for adults and 22 h/day for children). The calculated uptakes are on the basis of Equation 1 above 4.4 µg/kg b.w/day for adults and 22.4 µg/kg b.w/day for children (ECB 2006). PAH compounds
Liquid applied damp proof membrane products containing coal tar can emit VOCs such as naphtha-lene, acetnaphthalene and biphenyl as well as other PAH compounds. These can penetrate into the indoor environment and pose a health risk (Brown et al. 1990, Honkanen 2006). Penetration has often occurred in buildings where a new air exchange system has been installed during renovation. In these cases, the exhaust air flow has been too high compared to the supply air, i.e. infiltration of supply air from the structures has occurred. Other common sources for PAH compounds indoors are traffic and smoking.
About 500 PAH compounds have been detected in air. The most common is naphthalene. PAH compounds have boiling points starting at about 200 ◦C and therefore their concentration in air is very low, nano- or micrograms per cubic meter. Indoors, PAH compounds are mainly partitioned on parti-cles and surfaces.
The concentrations of PAHcompounds varied between 3�38 µg/m3 (average 13 µg/m3) in a reno-vated Finnish office building, in which with coal tar was left under the new carpeting. Workers in this building complained of bad and stuffy air. The major compounds were naphthalene, phenanthrene, fluoranthene and pyrene (Honkanen et al. 2006). The average naphthalene concentration, measured in the indoor air in 200 randomly chosen residences in Helsinki in 1996�1997, was 0.64 µg/m3 (Edwards et al. 2001).
The natural background level of the carcinogenic PAH compound benzo [a] pyrene (BaP) is nearly zero and the annual average values in urban outdoor air (without coke-ovens) and measurements indi-cate that annual means in major urban areas are mainly in the range 1�10 ng/m3. Elevated PAH con-centrations can be measured from indoor air under special conditions. Benzo [a] pyrene levels of 6 µg/m3 have been measured in houses without chimneys (WHO 2000).
The daily intake of BaP has been estimated to 400 ng from exposure to a relatively high concentra-tion of 50 ng/m3. In cities with adequate smoke control and clean rural areas the daily intake is ap-proximated to a few percent of this amount (WHO 2000). The calculated uptakes are on the basis of Equation 1 above is 0.01 µg/kg b.w/day for adults and 0.05 µg/kg b.w/day for children.

4. Indoor air exposure for SVOCs and flame retardants
23
Polybrominated FRs PBDEs have been found to be ubiquitous in the environment and evidence for bioaccumulation exists. PBDE toxicity decreases as the number of bromines increases. Octa- and deca- PBDE are belived to break down to lower (and more toxic) congeners, i.e. penta- PBDE. The lower brominated congeners are predominant in air samples (Birnbaum and Staskal 2004, Janssen 2005, Wilford et al. 2005). Oc-cupational exposure to PBDEs has been found among electronics-dismantling plant workers and com-puter technicians (Sjödin et al. 1999, Jakobsson et al. 2005). Recent studies indicate that the indoor environment is potentially the dominant exposure route for PBDEs for young children (toddlers) (Har-rad and Diamond 2006).
PBDEs have been found in higher amounts in North American and Japanese dust samples (< 5� 320 µg/g) compared to European samples (< 5�20 µg/g) (Wilford et al. 2005).Indoor air concentrations and relations of PBDEs and PCBs were determined in offices and homes in UK between September 2003 and November 2005. Concentration levels for PCBs were ng/m3 and for PBDEs pg/m3. The variability in PCB& PBDE concentrations between rooms (microenvironments) were attributed to room content and ventilation. No clear and consistent evidence of statistically significant relationships between PCB/& PBDE concentration and the number of PCs, electronic devices, number of items of PUF-containing furniture and age of the building was found (Hazrati and Harrad 2006). However, a drop in the PBDE concentration (but not PCB) was coupled to the change of a computer from 1998 to a new one. Higher concentrations of PBDEs have been coupled to computers and PUF containing furniture in other studies (Wilford et al. 2004, Harrad et al. 2004, Gevao et al. 2006). Seasonal varia-tions are likely to be governed by changes in temperature and ventilation (Hazrati and Harrad 2006). The higher temperature during operation increases emissions from appliances (Kemmlein et al. 2003, Hazrati and Harrad 2006).
Higher PBDE concentrations were measured in urban indoor& outdoor samples compared to rural samples in Toronto, Canada. The samples were taken from window surfaces. The mean concentration in urban indoor window organic films was 34.4 ng/m2, which was three times higher than in rural in-door films. Calculated indoor concentrations (using the air-film partition coefficient KFA) were 42.1 pg/m3 for indoor urban sites (Butt et al. 2004).
Wilford et al. investigated PBDEs in both indoor dust and air in Ottawa, Canada. Mean concentra-tion of PBDEs in dust of 68 homes was 5500 ng/g (range 170�170 000 ng/g) and in air of 74 homes 260 pg/m3 (range 2�3600 pg/m3). Penta and deca congeners accounted for about 90 % of the dust compositions. Significant correlations were found between air and dust PBDEs, except for PBDs 183 and 209. The content of organic carbon (OC) in dust samples varied between 9�39%. No correlation between OC and PBDEs was found. Also, no correlation was found between PBDEs and house age, percentage carpeted, the addition of insulation, or new upholstred furniture (Wilford et al. 2004, 2005). Exposure scenarios for PBDEs through intake of air and dust were also made. The daily expo-sures (95th percentile) by inhalation were 23 ng for males and 21 ng for females. The corresponding mean daily dust intakes were estimated to 42 ng for adults and 550 ng for 6 month - 2 years old chil-dren (Wilford et al. 2004, 2005).
Kemmlein et al. measured detectable, ng/m2h level emissions of brominated FRs from insulating materials, assembly foams, upholstery/mattress and electronics equipment (Kemmlein et al. 2003).

4. Indoor air exposure for SVOCs and flame retardants
24
Organophosphate FRs
Hartmann et al. studied organophosphate FRs and plasticisers in indoor air in 12 locations in Swizer-land. TBP, TCEP and TCPP were the most abundant organophosphates and the concentrations were 0.1�150 ng/m3 in office environments. A risk assessment made in the study concluded that the expo-sure is tolerable (Hartmann et al. 2004). The intakes for organophosphoric esters has been estimated to < 0.005�3.18 µg/kg (inhalative) and 0.12�1.67 µg/kg (oral) (Wensing et al. 2005). The emission of TCPP from polyurethane foam was between 10�140 ng/m2h in a German study. TCEP emission from a printed circuit board at 60 ºC and from a PC under operating conditions resulted in a concentration level of 96 ng/m3 in a 17 m3 room with 0.5h-1 air exchange rate (Kemmlein et al. 2003).
Table 5 summarizes measured indoor air concentration levels and estimates for exposure through inhalation as calculated with equation 1 for SVOCs, phthalates, PAHs, polybrominated FRs and or-ganophosphate FRs.
Table 5. Measured indoor air concentration levels and estimates for exposure through inhalation as calculated with equation 1.
Compound Indoor air concentration Exposure indoors by alveo-lar air (adult)/ day
SVOCs (ISO 16000�6) < 10 µg/m3
Phthalates < 10 µg/m3
PAHs < 10 µg/m3
< 2µg/ kg
Polybrominated FRs < 0.5 µg/m3 < 0.1 µg/kg
Organophosphate FRs < 1 µg/m3 < 0.2µg/ kg

5. Waste potential of SVOCs and flame retardants in the existing building stock
25
5. Waste potential of SVOCs and flame retardants in the existing building stock
A majority of construction waste is wooden, stone and metal waste. In addition there is waste which includes plastic, contaminated wood as well as chip and other wooden based boards. Due to different classification systems there are inconsistent results for different waste types and their amounts in lit-erature and statistics; part of the construction waste material is classified under the household waste and part of the waste is goes under different items. As for SVOCs and FRs, the waste categories and statistics are insufficient to describe their waste potential in constructions. Only rough estimations can be done as follows.
According to the Statistic Finland 41 % is wooden based waste, 28 % is stone materials, 14 % is metal, 2% is glass and more than 13 % of other waste materials from the total construction waste mass (from renovation + building demolition + building a new buildings). The SVOCs and FRs would mainly fall into the category of other waste materials. Perälä et al 2006 estimated the building waste from new construction in 2004 being a bit less than 0.25 million tons, from the renovation sites (build-ings + housing/apartments) 0.9 million tons and from the building demolitions almost 0.45 million tons. Based on these figures, SVOCs and FRs waste potential would be less than 210 000 tons in total mass of building product waste (13%). According to the Statistic Finland, the waste from construction sector (including buildings, road and water construction) was 21.87 million tons (2005), from which 344 000 tons were hazardous or prob-lem waste (by general definition, a hazardous waste is waste that poses substantial or potential threats to public health or the environment and generally exhibits one or more of these characteristics: can-cerogenic, ignitable (i.e., flammable), oxidizing, corrosive, toxic, radioactive, explosive, Tilastoke-skus, Table 6). The biggest amount measured in mass scale was mineral waste including landmass (mineral soil materials) and other mineral waste which is not separated in the statistics. The category other mineral wastes include all concrete waste, tiles, ceramic waste, gypsum, insulation materials etc. The category ´'mixed waste' includes besides household waste also glass, plastic and wood wastes which may also contain hazardous substances. Detailed information about the recycling of selected materials is given in Appendix B. Figure 3 shows the distribution by waste types from new construc-tion of detached houses, attached houses and multi-story residential building (based on the VTT�s calculations).

5. Waste potential of SVOCs and flame retardants in the existing building stock
26
Table 6. Waste from construction sector (including buildings, road and water construction).
Waste category Yearly amount (2005) % Chemical 1 00 tn 0.0005 % Metal 212 800 tn 1.0 % Glass 35 000 tn 0.2 % Wood 631 000 tn 2.9 % Electricity and electronic 1 00 tn 0.0005 % Animals and plants 1000 tn 0.005 % Mixed waste including household waste 290 200 tn 1.3 % Mineral based 20 700 200 tn 94.6 % TOTAL 21 870 400 tn from which hazardous waste 343 600 tn
Figure 3. Waste proportions and types from the construction site of new residential buildings. Calcu-lated according to the VTT�s waste characteristics.
Waste from the construction of multi-story buidings
53 %
13 %
11 %
15 %0,4 %
3 % 4 %
Concrete
Tiles
Other stonebased materialsSawn timber
Other woodenbased materialsSteel sheets
Other steel
Wastes from the construction of detached houses
36 %
15 %8 %
33 %
4 %3 % 1 %
Concrete
Tiles
Other stonebased materialsSawn timber
Other woodenbased materialsSteel sheets
Other steel
W astes from the construction of attached houses
25 %
14 %
14 %
37 %
2 %4 %3 %
Concrete
Tiles
Other stonebased materialsSawn timber
Other woodenbased materialsSteel sheets
Other steel

6. Measurement techniques to determine emission from materials and the indoor air concentration of SVOCs and flame retardants
27
6. Measurement techniques to determine emission from materials and the indoor air concentration of SVOCs and flame retardants
6.1 Emission test chambers
Emission testing of VOCs from building products is standardised on an international level (ISO 2006a, 2006b). The measurement of low vapour pressure compounds like SVOCs and flame retardants, are however, more difficult with these techniques because of sink effects, i.e. deposition on surfaces and airborne particles. To minimise sink effects, high loading factors (i.e. sample area m2/ test chamber volume m3) should be used. Table 7 summarises test chamber types and testing conditions in earlier studies.
Table 7. Test chambers and testing conditions for SVOCs and flame retardants (T = temperature, RH = relative humidity, q = area-specific air flow rate, L = loading factor).
Application (reference)
Chamber size T (ºC), RH (%)
q (m3/m2h) L (m2/m3)
POCs, BFRs (Kemmlein et al. 2003)
0.001� 0.02 m3 and 1 m3
23ºC, 50% 60ºC (printed circuit board)
1.24 (insulating board) 5.12 (assembly foam) 1 (upholstery foam) 1.24 (upholstery foam) ~1 (mattress)
1.1�17.7
Biocides (Horn et al. 2003)
0.020�0.023 m3
23ºC, 50%
1�1.25 (carpet) 5 (wood)
5.43�6.25

6. Measurement techniques to determine emission from materials and the indoor air concentration of SVOCs and flame retardants
28
A common feature for SVOC emissions is that they increase slowly until they reach a constant value that persists for a long period of time. For example, the linear emission level for the biocide propi-conazole was reached in forty (40) days (Horn et al. 2003).
Wilke et al. made comparisons between four different emission test chambers/ cells and their TVOC and SVOC emissions. Test chamber sizes were 0.02 m3�1 m3 and test cells were 1 litre (BAM cell) and 0 .035 litre (FLEC cell). The material was stainless steel and glass. TSVOC was the sum of all compounds eluting after hexadecane. Good comparability was found for VOCs/SVOCs and TVOC/TSVOC.
A Japanese application is to first measure the SVOCs by means of traditional chamber tests. Then, the test sample is removed and the emission test chamber is heated (up to 250 ºC) to collect substances that have been absorbed on the inner walls (Katsumata et al. 2005).
6.2 Sampling and analysis
Sampling of high boiling compounds like SVOCs and flame retardants is usually done on polyure-thane foam (PUF) or a polymer adsorbent (Tenax, XAD). Typical sample volumes are 10�40 m3. Passive air samplers have also been utilised and evaluated (Wilford et al. 2005, Hazrati and Harrad 2006). A sample preparation step, i.e. extraction and cleanup is needed prior to analysis with GC/MSD or HPLC (liquid injection). Thermal desorption can be applied if SVOCs are sampled on Tenax TA as in the ISO standard for VOCs (ISO 2004). The optimisation of the parameters for ther-mal desorption (temperature, flow rates etc) of SVOCs, however, means reduced sensitivity for lower boiling VOCs (Thomas and Uhde 2006).
The effects of extraction parameters on the recovery of phthalates have been studied by Korpi et al. (2007). The overall best performance was obtained by using toluene and ultrasonic treatment for glass fibre filters, Soxhlet extraction and toluene for XAD + glass fibre filter, and dichloromethane and ul-trasonic for polyurethane foam (each of the combinations is suitable in terms of extraction recovery).
Large volume injection techniques are recommended to be used in order to increase sensitivity in the analysis of polybrominated diphenyl ethers (PBDEs, Björklund 2003). By selecting a short narrow bore column it is possible to decrease the degradation of high molecular weigh PBDEs.
Sampling and analysis techniques found in the literature are summarised in Table 8.

6. Measurement techniques to determine emission from materials and the indoor air concentration of SVOCs and flame retardants
29
Table 8. Sampling and analysis of SVOCs and flame retardants.
Application and reference
Adsorbent/ sampling equipment
Sampling rate and volume (active)/ time (passive)
Preconditioning and analysis
Specifications/ comments
POCs, BFRs in air, test cham-ber (Kemmlein et al. 2003)
glass tubes with PUF plugs, d = 12 mm, l = 50 mm TEP: glass tubes with Tenax TA
PUF: 15�100 l/h, 2.5�40 m3
Tenax TA: 100 l/min, 1 l
PUF: Soxhlet extrac-tion (BFR), ultra so-nic extraction (POC) Tenax TA : thermal desorption Analysis with GC-MS : DB-5-ms 15 m column (BFR), HP-5-ms 30m column and HPLC (BDP)
LOD : 0.09�1.8 ng/m3 (BFRs), 3�10.5 ng/m3, no breakthrough was observed
PBDEs in air and dust (Wil-ford et al. 2005)
Air: Passive air samplers on top of a furniture. Dust: Vacuum cleaner bag content was sieved
3 weeks Both: Extraction and analysis with GC/MS: DB-5-60 m and 15 m columns, negative chemical ionisation mode, m/z: 79 (PBDEs), 81 (PBDE confirmation).
PBDEs window surfaces (Butt et al. 2004)
Sampling with pre-cleaned laboratory Kim-wipes wetted with dicloro-methane / iso-propyl alcohol
- Extraction, cleanup, GC-HRMS
PBDEs in in-door air (Hazrati and Harrad 2006)
PUF passive disk sampler
1 month Soxhlet extraction, GC/MS analysis (SIM).
BDE 153 and 154 (particle bound) IAC underesti-mated
POCs in indoor air (Hartmann et al. 2004)
PUF plugs 4 l/min, 14�34 m3
Soxhlet extraction, GC/MS analysis (SIM).
recoveries 62�100%
PAH com-pounds in air samples
XAD > 1 m3 Soxhlet extraction, GC/MS analysis (SIM).
LOD: 0.01 µg/m3
Biocides in test chamber (Horn et al. 2003)
PU foam plugs, d=12mm, l=50 mm
115 l/h (max), 20 m3 (max)
GC-MSD (SIM), column: HP 5 (30x 0.25 x 0.25)
LOD : 4�4000 ng/m2h, no break-through was ob-served
Biocides (Yu et al. 2005)
GC- FID/MSD, col-umn: SGE BPX5 30m

7. Emissions of SVOCs from building materials
30
7. Emissions of SVOCs from building materials
7.1 Materials tested
A total of thirteen different building materials were tested (Table 9). The test specimens were taken directly from the production line and sent within a day to the test laboratory, tightly wrapped without using any plastic materials. The tests were started within < 15 minutes after unwrapping. The immedi-ate testing time point was chosen in order to avoid any contamination of SVOCs from the surround-ings during ageing. An exception was made with the two paints tested. These were pre-conditioned in separate environmental chambers at 23 °C and 50 % RH for four weeks in order to ensure proper film formation. The �on site foam type� polyurethane was prepared one the day before the testing was per-formed and was covered loosely with aluminium overnight.
Table 9. Materials tested.
Abbreviation Material Specification
PAINT 1 Paint For fire retardant appl.
PAINT 2 Paint Interior wall paint
SCREED Screed Interior wall screed
GB Gypsum board For interior use
ADV Acoustic board (thickness 15 mm) For interior use
MSQ Acoustic board (thickness 40 mm) For interior use
PU1 Polyurethane insulation Foam type
PU2 Polyurethane insulation Foam type, prepared on site
EPS1 Expanded polystyrene With fire retardant
EPS2 Expanded polystyrene No fire retardant
LCFI Cellulose insulation Loose-fill cellulose fibre
PVC Floor covering PVC
NO PVC Floor covering Plastic, does not contain PVC
LINO Floor covering Linoleum

7. Emissions of SVOCs from building materials
31
7.2 Methods
7.2.1 Sampling
Two test specimens were prepared for all tested materials (samples 1A and 1B, Figure 4). Emission tests were performed by using 1) a FLEC connected to a 2 litre chamber (Picture 1) and 2) a 2.5 litre glass desiccator (Picture 2). All materials, tubing and fittings were made of stainless steel, glass or Teflon. The air flow was on average 200 ml/min, which resulted in air flow/ area values (q/a) between 0.35�1.69 m3/m2h. An exception to this was the two paints, which were measured with a higher flow rate (q/a ~3 m3/m2h). Table 10 summarises q/a values for the tested materials.
Picture 1. The FLEC chamber.

7. Emissions of SVOCs from building materials
32
Picture 2. The glass desiccators.
Table 10. Test specimen area and q/a (m3/m2h) during the emission testing for the tested materials in the FLEC chamber and the desiccator.
Name Test specimen area, m2
FLEC q/a, at 23°C/40°C
m3/m2h or m3/m2g Desiccator q/a,
m3/m2h or m3/m2g
Paint 1 0.01 3/ 3.6 1.44
Paint 2 0.01 3/ 1.32 1.44
Screed 0.018 0.69/ 0.77 0.81
GB 0.014 0.83/ 0.97 1.03
ADV 0.018 0.69/ 0.67 0.8
MSQ 0.03 0.39/ 0.40 0.48
PU1 0.035 0.35/ 0.38 0.41
PU2 0.014 0.88/ 0.92 1.03
EPS1 0.026 0.47/ 0.48 0.55
EPS2 0.026 0.53/ 0.54 0.55
LCFI 0.014 1.21/ 1.44 1.5
PVC 0.01 1.19/ 1.35 1.44
no PVC 0.01 1.14/ 1.38 1.44
Linoleum 0.01 1.21/ 1.38 1.44

7. Emissions of SVOCs from building materials
33
Sampling of the outlet air from the FLEC-chamber was done on Tenax TA adsorbents at 23 °C and 40 °C. The samples at the elevated temperature were taken 20, 60 and 120 minutes after the 40 °C was reached, which was in about 10 minutes. Blank samples were collected prior to placing the test speci-men in the chamber. In general, sampling was done according to ISO 16 000-6 standard (ISO 2004).
Sampling of the outlet air from the glass desiccator was done on purified polyurethane foam (PUF) for ~ 20 days, which correspond to ~ 7 m3 samples (= one working day exposure for an adult). The PUF was changed two times, i.e. the total time of sampling was ~ 60 days. Blank samples were col-lected parallel to the real samples. Finally, a �rinsing sample� was taken by rinsing the desiccator walls with 20 ml of dichloromethane (DCM) after the 60 day sampling period.
Sample 1A: Sample 1B:Chamber: FLEC DesiccatorAdsorbent: Tenax TA PUFTemperature: 23oC, 40oC 23oCSampling time: 20-120 min 20-60 daysRinsing sample: no yes
Analysis: 1) VOCs C16-C22 1) SVOCs incl. Phthalates2) SVOCs C16- 2) Brominated compounds
3) Organophopsphates4) Boron
Figure 4. Sampling and analysis scheme (PUF = polyurethane foam).
7.2.2 Analysis
7.2.2.1 Pre tests
Before doing specific analysis of the compounds of interest, elementary analysis from all building products was made by X-ray fluorescence analysis (semiquantitative). Especially, the occurrence of bromine was of interest. The PU2 and EPS2 were not analysed since they were included at a later timepoint during the project. In addition, a small amount of the building material was grinded and dissolved in DCM (later referred as �SVOC pre test�). The SVOCs were analysed by a gas chromato-graph equipped with a mass selective detector (GC/MSD) after liquid injection (see 7.2.2.3 for the detailed description of the analysis). This step was done in order to reveal any phthalates (and other SVOCs soluble in DCM) in the product itself.

7. Emissions of SVOCs from building materials
34
7.2.2.2 Tenax samples
Tenax tubes were thermally desorbed at 260 ºC for 6 minutes (cold trap temperature -30ºC) and ana-lysed with a gas chromatograph (GC) connected to a mass selective detector (MSD) and flame ionisa-tion detector (FID). The gas chromatograph was equipped with a double-capillary column HP PONA (50 m x 0.2 mm x 0.25 µm) and the sample was split 1:1 in the two columns, which were connected to MSD and FID detectors. The temperature programme of the GC oven was as follows: 40 ºC (5 min), 6 ºC/ min, 280 ºC (5 min), total run time 50 minutes. MSD in SCAN mode was used to identify single VOCs and the FID response was used for quantification. TVOC was calculated as toluene equivalents from the total integrated FID signal between hexane and hexadecane. An external toluene standard was used for calibration. SVOCs were reported as the total integrated area after hexadecane (TSVOC).
7.2.2.3 PUF samples
PUF samples were extracted with DCM in a Soxhlet apparatus for eight hours. The extract was di-vided into three equal parts and the samples were concentrated to 1 ml. Different analysis was per-formed for the different building material emission samples based on the results from the pre test.
SVOCs (and VOCs) were analysed from the first part by injecting (splitless) 1 µl to a GC/MSD equipped with a HP-5MS (30m x 0.25mm x 0.25µm) column. The temperature programme was as follows: 40 °C (1min), 13 °C/min, 320 °C (10 min). SVOCs and phthalates were calculated from the total integrated area of the MSD detector (SCAN mode) as toluene equivalents.
PBDEs (BDE-17, -47, -66, -99, -100, -85, -153, -154, -183, -203 and -209), HBCD and organo-phosphates were analysed with a GC/MS system. C13 labelled internal standards were used for quanti-fication of bromine compounds. Boron was analysed with an ion chromatograph.
7.3 Results
7.3.1 Pre tests
According to the X-ray fluorescence results, only the EPS1 and paint 1 contained bromine above the detection limit of 0.005 % (0.26 % and 0.02 % respectively). Therefore, the EPS1 emission samples were analysed further for brominated compounds (see Chapter 7.3.3.2). The X-ray analysis also showed that the phosphor content in paint 1 (fire retardant paint) was 7.3 %. This was a significantly higher percentage than in the other materials (0.01�0.5 %). Thus, the paint 1 was analysed for organo-phosphates (see Chapter 7.3.3.3). The SVOC pre tests showed that only PVC contained phthalates above the blank value.

7. Emissions of SVOCs from building materials
35
7.3.2 Sampling on Tenax TA
7.3.2.1 Results at 23°C
The TVOC specific emission rates (SER) measured at 23 °C varied between 5�2312 µg/m2h and the TSVOC SER varied between 1�66 µg/m2h (average 7 µg/m2h, Figure 5a and 5b). The highest SVOC concentration was measured from the foam type PU. In general, the SVOCs were difficult to identify from the mass spectra because of low concentration levels. Aliphatic hydrocarbons were however abundant. The VOCs identified were typical for the building products in question, i.e. aldehydes, gly-cols and glycolethers were main compounds identified (Table 11).
2
30
3
17
2
33
3
185
2
90
18
16
0
12
0
6
2
1
2
3
2
1
3
12
0 50 100 150 200
paint 1 blank
paint 1
paint 2 blank
paint 2
screed blank
screed
ADV blank
ADV
MSQ blank
MSQ
GB blank
GB
TVOC 23oCTSVOC 23oC
SER at 23°Cµg/m2h
Figure 5a. Specific emission rate (SER, µg/m2h) measured at 23 °C.

7. Emissions of SVOCs from building materials
36
1
5
5
66
2
408
3
153
3
43
6
8
130
5
572
0
1
5
66
1
1
2
7
2
7
5
2
2
4
2
7
0 100 200 300 400 500 600 700 800 900 1000
PU1 blank
PU1
PU2 blank
PU2
EPS1 blank
EPS1
EPS2 blank
EPS2
LCFI blank
LCFI
PVC blank
PVC
no PVC blank
no PVC
LINO blank
LINO
TVOC 23oC
TSVOC 23oC
SER at 23°C µg/m2h
2312
Figure 5b. Specific emission rate (SER, µg/m2h) measured at 23 °C.

7. Emissions of SVOCs from building materials
37
Table 11. Main compounds identified from the Tenax TA adsobents at 23°C and 40°C.
Name Main compounds identified
23°C 40°C
Paint 1 Decanal, nonanal Decanal, nonanal, ethanol- ( 2,2-phenoxyethoxy)
Paint 2 Decanal, nonanal Decanal, 1,2- propanediol
Screed Decanal, nonanal ,1,2- pro-panediol
Oktanal, nonanal ,1,2- propanediol, 2-ethoxy-ethoxyethanol
GB Decanal, nonanal Decanal, nonanal, C16-C21 aliphatic hy-drocarbons
ADV 1,2- propanediol 1,2- propanediol
MSQ 1,2- propanediol, Ethanol, 2-butoxy-
1,2- propanediol, Ethanol, 2-(2-butoxyethoxy)-, Ethanol, 2-(2-butoxyethoxy) acetate
PU1 Decanal Cyclohexamine, dimethyl-
PU2 2-methyl- 2�pentenal, tetradec-ane
2-methyl- 2 �pentenal, tetradecane , tris (1,3-dichloroisopropyl) phosphate
EPS1 Ethylbenzene, styrene, phenylethanone Ethylbenzene, styrene, phenylethanone
EPS2 Ethylbenzene, styrene, phenylethanone, xylenes
Ethylbenzene, styrene, phenylethanone, xylenes
CELL hexanal hexanal, C16 => aliphatic hydrocarbons
PVC
Ethanol,2-butoxy-, phenol, etha-nol, 2-(2-ethoxyethoxy)-, 2-pyrrolidone, 1-methyl-, ethanol, 2-(2-butoxyethanol)-, ethanol, phenoxy-, decanal DECANAL (CAS) ETHANOL, 2-PHENOXY- (CAS)
Ethanol, 2-butoxy-, phenol, ethanol, 2-(2-ethoxyethoxy)-, 2-pyrrolidone, 1-methyl-, ethanol, 2-(2-butoxyethanol)-, ethanol, phenoxy-, decanal
no PVC aliphatic hydrocarbons aliphatic hydrocarbons
Linoleum pentanal, hexanal, nonanal, oc-tanal, acetic acid, hexanoic acid
hexanal, nonanal, octanal, hexanoic acid, C16 => aliphatic hydrocarbons

7. Emissions of SVOCs from building materials
38
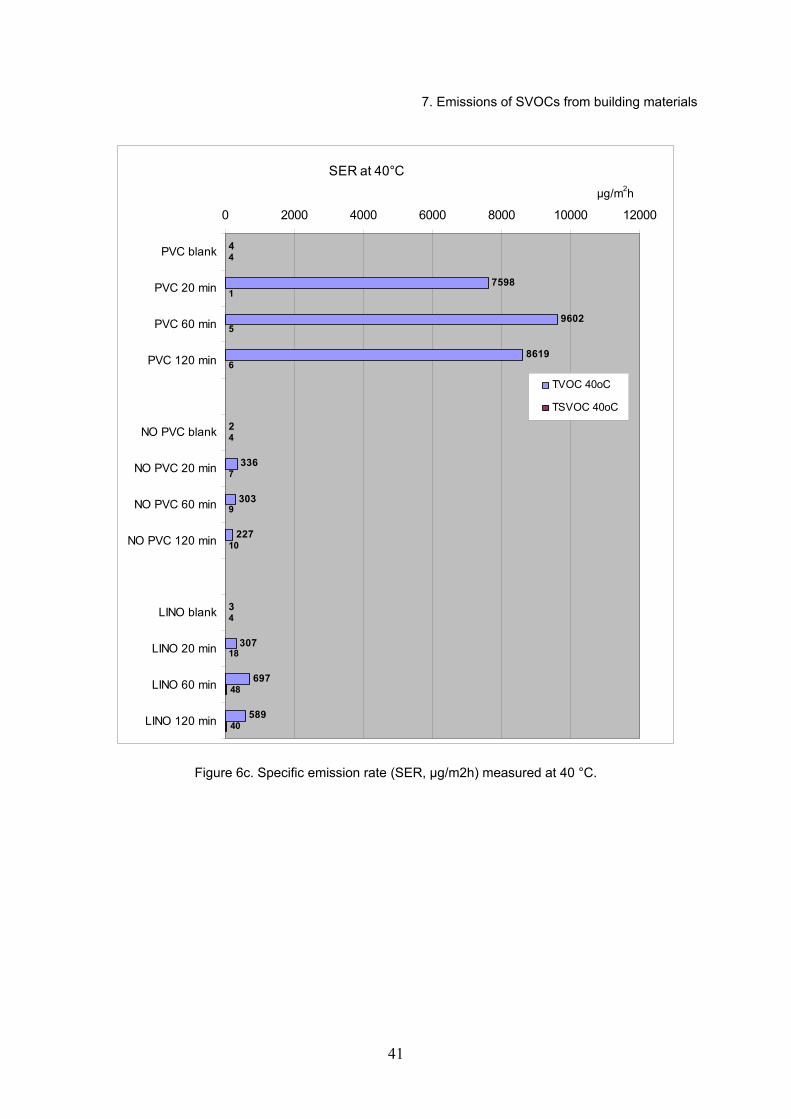
7.3.2.2 Results at 40°C
The emissions measured at 40 °C showed large variations (Figures 6a, b and c). The TVOC SER varied between 10�10 000 µg/m2h. The highest TVOC emission was measured from the PVC. The SVOC SERs were between < 1�150 µg/m2h. The highest SVOC emission was measured from the foam type polyurethane (PU2), cellulose insulation and linoleum. The known fire retardant tris (di-chloroisopropyl) phosphate (Fyrol PCF or TCPP) was identified from the foam type polyurethane. The emission rate of PCF was 24 µg/m2h after 120 minutes at 40 °C. Otherwise, aliphatic hydrocarbons of higher than C16 were identified. Table 11 summarises the main compounds identified at 40 °C.

7. Emissions of SVOCs from building materials
39
8
65
167
2
15
45
54
2
274
233
182
5
241
230
150
3
117
132
86
14
49
46
23
1016
29
38
74
23
54
13
43
2
2422
3
314
10
0 50 100 150 200 250 300
Paint 1 blank
Paint 1 15 min
Paint 1 30 min
Paint 2 blank
Paint 2 20 min
Paint 2 60 min
Paint 2 120 min
Sreed blank
Screed 20 min
Screed 60 min
Screed 120 min
ADV blank
ADV 20 min
ADV 60 min
ADV 120 min
MSQ blank
MSQ 20 min
MSQ 60 min
MSQ 120 min
GB blank
GB 20 min
GB 60 min
GB 120 min
TVOC 40oC
TSVOC 40oC
SER at 40°Cµg/m2h
Figure 6a. Specific emission rate (SER, µg/m2h) measured at 40 °C.

7. Emissions of SVOCs from building materials
40
2
96
148
155
2
12
48
82
1
328
410
334
5
89
193
204
4
71
120
132
2
1
1
1
2
26
76
151
2
1
1
0
4
7
6
4
4
23
69
87
0 50 100 150 200 250 300 350 400 450
PU1 blank
PU1 20 min
PU1 60 min
PU1 120 min
PU2 blank
PU2 20 min
PU2 60 min
PU2 120 min
EPS1 blank
EPS1 20 min
EPS1 60 min
EPS1 120 min
EPS2 blank
EPS2 20 min
EPS2 60 min
EPS2 120 min
LCFI blank
LCFI 20 min
LCFI 60 min
LCFI 120 min
TVOC 40oC
TSVOC 40oC
SER at 40°C µg/m2h, µg/gh
Figure 6b. Specific emission rate (SER, µg/m2h or µg/gh for cellulose based insulation) measured at
40° C.
7. Emissions of SVOCs from building materials
41
4
7598
9602
8619
2
336
303
227
3
307
697
589
4
1
5
6
4
7
9
10
4
18
48
40
0 2000 4000 6000 8000 10000 12000
PVC blank
PVC 20 min
PVC 60 min
PVC 120 min
NO PVC blank
NO PVC 20 min
NO PVC 60 min
NO PVC 120 min
LINO blank
LINO 20 min
LINO 60 min
LINO 120 min
TVOC 40oC
TSVOC 40oC
SER at 40°Cµg/m2h
Figure 6c. Specific emission rate (SER, µg/m2h) measured at 40 °C.

7. Emissions of SVOCs from building materials
42
7.3.3 Sampling on PUF
7.3.3.1 SVOCs and phthalates
The total amount of SVOCs measured from the PUF samples varied from < 10 µg/m3 up to 500 µg/m3 (Figures 7a�d). Highest concentrations (200-500 µg/m3) were measured from paint 1 (20 day sample) , screed (20 day sample), cellulose insulation (20&60 day samples) and EPS1 (60 day sample). Very low concentrations were measured from paint 2, polyurethane, no PVC, gypsum board and acoustic board (MSQ). The SVOCs were in general poorly identified. However, hydrocarbon compounds were abundant. Product typical VOCs like glycols and glycolethers were identified from paint and screed products. Likewise, typical VOCs for the flooring materials were also identified.
The amount of SVOCs in the rinsing samples varied between < 100�800 µg (Figures 7a�d). Lowest levels of less than 100 µg were measured from the cellulose insulation and the �no PVC�. Phthalate above the blank level was only identified from the PVC rinsing sample (218 µg). This phthalate was most likely di-isononylphthalate (DINP), which is used in its production. However, no standard was available to confirm this. Figure 8 shows the GC/MSD chromatogram for the PVC rinsing sample.
SVOC concentration (µg/m3 ) or amount (µg, rinsing sample)
0 100 200 300 400 500 600 700 800 900
Paint 1 20d
Paint1 1 60 d
Rinsing sample
Paint 2 20d
Paint 2 60d
Rinsing sample
Screed 20d*
Screed 60d*
Rinsing sample
CH- compounds
aliphatic CH compounds
aliphatic hydrocarbons
2(2-phenoxyethoxy) ethanol ~80µg/m3
1,2- dipropylene glycol 24 µg/m3
Figure 7a. SVOC concentration or amount measured from the desiccator samples (air & rinsing samples).

7. Emissions of SVOCs from building materials
43
SVOC concentration (µg/m3 ) or amount (µg, rinsing sample)
0 100 200 300 400 500 600 700 800 900
PU1 20d
PU1 60d
Rinsing sample
EPS1 20d
EPS1 60d
Rinsing sample
LCFI 20d
LCFI 60d
Rinsing sample
CH cluster rt~14 min
CH compounds
2-(2-buthoxyethoxy)-ethanol 35 µg/m3
CH compounds
Figure 7b. SVOC concentration or amount measured from the desiccator samples (air & rinsing samples).
SVOC concentration (µg/m3 ) or amount (µg, rinsing sample)
0 100 200 300 400 500 600 700 800 900
PVC 20d
PVC 60d
Rinsing sample
NO PVC 20d
NO PVC 60d
Rinsing sample
LINO 20d
LINO 60d
Rinsing sample
organic acids
CH cluster, benzophenone
20d: 2-Ethyli hexanoic acid, butyl hydroxytoluene,
Benzophenone
organic acids
Brombutylipiperidinone 400 µg
phthalate 218 µg
60d: 2-(2-butoxyetoxyi)ethanol, butylhydroxytoluene, 1-methyl-2-pyrrolidinone, organic acids
Figure 7c. SVOC concentration or amount measured from the desiccator samples (air & rinsing samples).

7. Emissions of SVOCs from building materials
44
SVOC concentration (µg/m3 ) or amount (µg, rinsing sample)
0 100 200 300 400 500 600 700 800 900
GB 20d
GB 60d
Rinsing sample
ADV 20d
ADV 60d
Rinsing sample
MSQ 20d
MSQ 60d
Rinsing sample
CH compounds
CH compounds, iodine-propynylibutylicarbamate
CH compounds
not identified
Figure 7d. SVOC concentration or amount measured from the desiccator samples (air & rinsing samples).
4.00 6.00 8.00 10.00 12.00 14.00 16.00 18.00 20.00 22.00 24.00 26.00 28.00 30.000
100000200000
300000400000
500000600000
700000800000
90000010000001100000
12000001300000
14000001500000
16000001700000
180000019000002000000
21000002200000
23000002400000
25000002600000
270000028000002900000
3000000
Time-->
Abundance
TIC: 2501025.D\data.ms
4.130
4.209
4.4544.6254.7125.158 7.077
7.158
7.2257.4327.619
7.6957.7617.842 8.758 9.671
9.725
9.8149.8789.96010.01410.15710.21010.308 11.91312.331 13.84014.199 15.566 18.02818.16718.935
19.816
20.43320.58320.71721.02221.10721.14421.29721.337
4.00 6.00 8.00 10.00 12.00 14.00 16.00 18.00 20.00 22.00 24.00 26.00 28.00 30.004.00 6.00 8.00 10.00 12.00 14.00 16.00 18.00 20.00 22.00 24.00 26.00 28.00 30.000
100000200000
300000400000
500000600000
700000800000
90000010000001100000
12000001300000
14000001500000
16000001700000
180000019000002000000
21000002200000
23000002400000
25000002600000
270000028000002900000
3000000
Time-->
Abundance
TIC: 2501025.D\data.ms
4.130
4.209
4.4544.6254.7125.158 7.077
7.158
7.2257.4327.619
7.6957.7617.842 8.758 9.671
9.725
9.8149.8789.96010.01410.15710.21010.308 11.91312.331 13.84014.199 15.566 18.02818.16718.935
19.816
20.43320.58320.71721.02221.10721.14421.29721.337
Figure 8. The GC/MSD chromatogram for the PVC rinsing sample, phthalate peak at rt = 19.8 min.

7. Emissions of SVOCs from building materials
45
7.3.3.2 Brominated compounds
Only the air samples collected from EPS 1 were analysed for brominated compouns since its bromine content was 0.26% according to the pre test (chapter 7.3.1). As expected, no PBDE compounds were detected from the EPS1 air samples above the limit of quantification (4e�4 ng/m3). The congener 209 was detected in the rinsing sample from EPS1, however, the amount was only 0.5 ng. The HBCD con-centrations (sum of α,β and γ congeners) in the EPS1 air samples were also below of the limit of quan-tification (4e�3 ng/m3). However, the rinsing sample collected from the desiccator walls after the end of the 60 day sampling period contained 72 ng of HBCD (sum of α,β and γ congeners).
7.3.3.3 Organophosphates
The organophosphates analysed from paint 1 and polyurethane 1 were below the detection limits (<0.04�0.32 µg/m3 for air samples collected). The concentration levels correspond to emission levels of less than 60�460 ng/m2h (paint 1) and 15�140 ng/m2h (PU1). Table 12 summarises the concentra-tion levels.
Table 12. The organophosphate concentrations measured in the paint samples collected 20 and 60 days after the test sample was placed in the chamber.
Organophosphate Concentration (µg/m3)
Paint1 20 days, sample
V = 6.9 m3
Paint1 60 days, sample
V = 3.8 m3
PU 20 days, sample
V = 7.7 m3
PU 60 days, sample
V = 7.7 m3
Tris(chloroisopropyl) phos-phate (TCCP) < 0.17 < 0.32 < 0.16 < 0.16
Triphenylphosphate < 0.04 < 0.08 < 0.04 < 0.04
Triethylphosphate < 0.17 < 0.32 < 0.16 < 0.16
Trioctyl phosphate 0.23 < 0.08 < 0.04 0.21
2-ethylhexyl-diphenyl phos-phate < 0.04 < 0.08 < 0.04 < 0.04
7.3.3.4 Boron
Boron was measured from the cellulose based insulation emission samples since it was known that boric acid is used as a FR. Boron was identified from the air samples collected from the FLEC at 40 °C for 48 hours and from the glass desiccators at 23 °C 20 and 60 days after the sampling started (Fig-ure 8). The concentration at 23 °C varied between 0.4�0.7 µg/m3 (SER = 0.6�1 µg/gh). At 40 °C, the concentration reached 5 µg/m3. This corresponds to a SER of 6 µg/gh.

7. Emissions of SVOCs from building materials
46
0
1
2
3
4
5
6
flec 48h 40oC exsiccator 20d 23oC exsiccator 60d 23oc
Boron concentrationµg/m3
Figure 8. Boron concentration in the cellulose based insulation emission samples.
7.4 Discussion
General remarks on the emission results The studied materials showed a large diversity when it comes to their VOC and SVOC emissions both in terms of emission levels and compounds emitted. However, it seemed that aliphatic hydrocarbons are the most abundant SVOCs measured.
The TVOC and TSVOC emissions increased by a factor of four and two respectively, when the temperature increased from 23 °C to 40 °C. The elevated temperature was used in order to increase the emissions of SVOCs for better detection. Also, real life situations like direct sunlight may cause tem-peratures up to 70 °C on surfaces indoors. In fact, the known fire retardant tris (dichloroisopropyl) phosphate (TCCP) was identified from the polyurethane foam from the Tenax TA sample taken 120 minutes after the temperature reached 40 °C. The phosphate content in the PU sample was 0.5 % ac-cording to the elementary analysis.
Phosphate FRs were also expected from the Paint 1, which had a phosphor content of 7.3 %. How-ever, no organophosphates were detected from air samples above LOQs which were, depending on sample volume, < 0.04�0.32 µg/m3.
A brominated FR, namely HBCD, was detected above LOQ only in the rinsing sample from the des-iccator rinsing samples in which the EPS with FR (EPS 1) was measured. The amount of HBCD (sum of three congeners) was 72 ng.
A phthalate was detected above blank values only from the desiccator rinsing samples in which the PVC was measured. The results showed that the sorption of this compound on chamber walls is sig-

7. Emissions of SVOCs from building materials
47
nificant for the time period of 60 days. The amount on the walls corresponded to an average concen-tration of 0.01 µg/m3 throughout the sampling period of 60 days.
In addition, boron was detected from the cellulose insulation air samples. The mechanism of boron transfer to the air samples was not clarified further during this project, however, its concentration in-creased by 5 times when the temperature was raised to 40 °C.
Figure 9 summarises the percentage of SVOC mass (not SER) distributed between the air samples collected during the 60 day test period on the PUF and the rinsing samples from the exsiccator walls after the 60 days. Large variations could be seen, i.e. depending on the product the SVOC mass on chamber walls varied between < 5�100 %.
0 %10 %20 %30 %40 %50 %60 %70 %80 %90 %
100 %
Paint 1
Paint 2
Screed GB
ADVMSQ
PU1EPS1
LCFI
PVC
NO PVCLIN
O
SVOC sum in air samples 60d rinsing sample
Figure 9. The percentage of SVOC mass in the air samples (sum of 0�60 day results) and the rinsing samples (= deposition on chamber walls).
Correlations between the different sampling methods for SVOCs
The TVOC and TSVOC SERs measured from the Tenax TA and PUF samples at 23 °C were com-pared (an average of the PUF samples during the 60 day test period was used in the calculations). The PUF TSVOC and Tenax TA TSVOC result correlated positively (0.839, Figure 10). The correlation was statistically significant (p < 0.01). The TVOC result correlated negatively with the TSVOC results from the Tenax TA samples, however, the correlation was not statistically significant. The TSVOC measured from the Tenax TA was 1�74 % from the PUF TSVOC, except for PU1 and gypsum board, for which the percentages were 186 % and 120 % respectively. The Tenax TA TSVOC varied between 2�66 µg/m2h and the TSVOC measured from the PUFs varied between 1�435 µg/m2h. The 435 µg/m2h SER was measured from the cellulose based insulation which was five times the amount in the Tenax TA (TVOC+TSVOC). Otherwise, the amount of SVOCs (and VOCs) measured from the PUF was 5�35 % of the Tenax TA result (TVOC+TSVOC).

7. Emissions of SVOCs from building materials
48
It could be concluded that the different sampling methods do show correlation for TSVOC taking into account the large variations within the SER levels. The results implied that the SVOCs calculated from the 2 litre Tenax TA sample collected in the beginning of the test period does give some implica-tion of the 60 day SVOCs result collected on the PUF. However, because of small sample size (n=8, samples with internal standard interference were excluded from the statistical analysis) no general conclusions should be drawn. At this point it should be further noticed that the quantification from Tenax TA samples was made from the FID whereas the results from the PUF were quantified from the MSD.
CorrelationsTenaxTVOC SER TenaxTSVOC SER PufTSVOC SER
TenaxTVOC SER Pearson Correlation 1 -0.257 0.218Sig. (2-tailed) 0.539 0.604N 8 8 8
TenaxTSVOC SER Pearson Correlation -0.257 1 .839**Sig. (2-tailed) 0.539 0.009N 8 8 8
PufTSVOC SER Pearson Correlation 0.218 .839** 1Sig. (2-tailed) 0.604 0.009N 8 8 8
**. Correlation is significant at the 0.01 level (2-tailed).
Figure 10. Pearson correlations between TVOC and SVOC SER measured from the Tenax TA and PUF samples.
Figure 11 concludes the correlation tests between the Tenax TA results at 23 °C and 40 °C (TVOC+TSVOC) and PUF results at 23 °C (TSVOC). The TVOC measured at 40 °C 20, 60 and 120 minutes after the temperature reached 40 °C showed strong correlation with the TVOC measured at 23 °C (Tenax TA samples, 0.978�0.984, p < 0.01). The TSVOC measured 60 and 120 minutes after the temperature reached 40 °C correlated with the TSVOC measured from the Tenax TA at 23 °C (0.857�0.927, p < 0.01). Also, the TSVOC measured from the PUF at 23 °C had a statistically significant correlation between the TSVOC measured 120 minutes after reaching 40 °C. These results imply that the Tenax TA results at 40 °C does correlate with the TVOC and SVOC results at room temperature. In the experiment presented here, the best time point for sample collection was 120 minutes.

7. Emissions of SVOCs from building materials
49
40oC samples: TenaxTVOC40oC TenaxTSVOC40oCTenaxTVOC40oC 20 minute sample 1 -0.355
60 minute sample 1 -0.211120 minute sample 1 -0.172
TenaxTSVOC40oC 20 minute sample -0.355 160 minute sample -0.211 1120 minute sample -0.172 1
TenaxTVOC23oC 20 minute sample .978** -0.28920 min sample 60 minute sample .984** -0.151
120 minute sample .983** -0.149TenaxTSVOC23oC 20 minute sample -0.238 0.48420 min sample 60 minute sample -0.233 .857**
120 minute sample -0.228 .927**PufTSVOC23oC 20 minute sample 0.252 0.356average of 60 day sampling 60 minute sample 0.544 0.698
120 minute sample 0.259 .817***. Correlation is significant at the 0.01 level (2-tailed).
Figure 11. Pearson correlations between TVOC and SVOC SER measured from the Tenax TA and PUF samples at 23 °C and 40 °C.
Validation tests
Validation of a test method means that the repeatability of the method is well defined, i.e. the results are within certain known limits. Parallel testing with the FLEC chamber was done for the polyurethane and cellulose based insulations since their emissions represented a good range in terms of VOC and SVOC emissions (Table 13). The samples were prepared as identical as possible and they were equal of age. The Tenax TA sampling volumes were 2�3 litres. The relative standard deviations varied be-tween 1.3�22 % for concentration levels between 10�400 µg/m3.
Table 13. Results from parallel testing with the FLEC.
Cellulose based insulation (µg/m3) Polyurethane insulation(µg/m3)
FLEC 1 FLEC 2 STEDV% FLEC 1 FLEC 2 STEDV%
TVOC 23°C 35 36 1.4 151 110 22
40°C 20 min 54 45 13 244 260 4
40°C 60 min 88 78 8 405 369 7
40°C 120 min 91 93 1.3 426 387 7
SVOC 23°C 7 5 17 7.4 8.6 11
40°C 20 min 14 18 18 14 12 11
40°C 60 min 46 49 4 13 11 12
40°C 120 min 57 64 9 14 17 14

8. Conclusions and recommendations for further action
50
8. Conclusions and recommendations for further action
This publication reviewed the occurrence of SVOCs and flame retardants in the Finnish building in-dustry, the regulations concerning them as well as exposure scenarios for exposure to these com-pounds indoors. The summary was made in order to clarify the possible need of both restricting the use of these compounds and for the waste management especially in renovation.
SVOCs are found in a numerous of building materials. This report concentrated mainly on the SVOCs phthalates and PAH compounds because these are discussed widely nowadays. Phthalates have been used as palsticisers in flooring materials whereas PAH compounds can penetrate into indoor air from damp proofing used in the structures in older buildings. PAH compounds are carcinogenic whereas the health effects of phthalates are still under review. Studies concluding that negative health effects arise from exposure to phthalates, however, have been published. Exposure scenarios estimate that the inhalative exposure for these compounds is less than 2 µg/kg/day for an adult. The phthalates can be replaced with other compounds, but often these too are classified as SVOCs and therefore they are as persistent as phthalates in the indoor environment. The annual use of phthalates in the Finnish industry, as registered by STTV, is up to 2000 tons.
The brominated FRs are regarded as potentially hazardous to health, and actions have been taken to restrict the use of these compounds. From the chemical registry held by STTV it was concluded that no halogenated FRs were used in Finland in year 2006. However, the registry only contains chemicals that occur at above 1 % in the product. The registration procedure has in this aspect changed since the implementation of REACH (Registration, Evaluation, Authorization and Restriction of Chemicals) within the European Union in 2007. REACH obligates that all chemical substances that are produced in 1 ton or more per year falling under the REACH system need to be registered by manufacturers and importers to the Chemicals Agency, otherwise they cannot be manufactured and/or imported. In Europe, ~30 000 such chemicals are in use and ~300 new chemicals are taken into use annually. The registration requires that the manufacturers and importers present information about the dangerous properties of the chemical, its methods of use and methods for safe handling. The use of the most dan-gerous chemicals will be authorized. These chemicals are those that have long term and severe effects, like carcinogens and persistent environmental pollutants (www.ymparisto.fi 2007).
Besides regulative efforts, the demand from consumers and construction companies is essential in terms of decreasing the use of brominated FRs in the construction industry. Possible measures to re-duce the environmental impact of brominated flame retardants, when fire safety standards are not re-

8. Conclusions and recommendations for further action
51
duced, are replacing them with other, less dangerous FRs, using alternative technological solutions or other working methods to maintain fire safety standards, and using materials that are not flammable in themselves instead of materials containing brominated flame retardants. However, as in the case of EPS for FR applications, at the moment HBCD is the best available fire retardant according to the EPS industry. There is currently no technically and commercially feasible alternative flame retardant, with a proven better environmental profile.
From the interviews made among the domestic building product manufacturers it could be con-cluded that not all chemicals used in their products are known for the manufacturers. Domestic pro-ducers often use imported raw materials, for which specifications are lacking. A summary table of SVOCs and FRs on the Finnish market is presented below. No data exists for the waste potential for the specific product groups. However, the �mixed waste� (includes plastics) is estimated to be less than 300 000 tons/ year.
Table 14. Summary of SVOCs and FRs in building products and their applications in the Finnish mar-ket.
Product/ product group
Compound Applications examples
Plastic materials Phthalates Floor covering materials, cables
Creosote, bitumen PAHs Damp-proofs in structures
Insulation, polymere based (EPS for FR ap-plications) and PU
HBCD (FR), TCPP Insulations in building
Wooden products used as covering materials
Sitrate salts (FR) Interior/ exterior panels
Paints Inorganic salts (FR), b All constructions which need fire protection
Clearly, there are a lot of challenges in measuring SVOC emissions from building products and setting limit values for them. Firstly, the diversity of materials and their chemical constituents as well as ma-trixes is enormous. Secondly, the concentration levels of SVOCs are low and therefore, sophisticated measurement techniques are needed to detect them from air samples or deposition samples. Also, the contamination of samples with SVOCs and FRs from the environment is a challenge. Moreover, the impact on IAQ for different types of materials may vary a lot. For example, the impact of SVOCs emitted from inside a structure (like insulation) on IAQ is presumably less than for the more volatile compounds since SVOCs are easily deposited on surfaces. In addition, the health effects of SVOCs and FRs are not known well enough.
Nevertheless, long term occurrence of SVOCs and FRs indoors may possess a health risk. It seems as if the definition of the compounds of interest would be the right approach for any regulatory ac-tions. Based on such a definition, exposure limits indoors would be set and further, emission limit values for different building product types. If no health effects have been proven, a pre cautionary type of limit value would be set until more health data evolves.
The results presented in this publication show that SVOCs and FRs are emitted from building prod-ucts normally used. However, the emission levels are low and therefore the exposure levels concluded

8. Conclusions and recommendations for further action
52
in Table 5 (or even lower) are confirmed. The results also showed that in real life situations, like direct sunlight and the use floor heating, elevated emissions and significantly higher exposures may occur.
The importance of blank samples was pronounced because of the low levels of SVOCs measured. For example, the tubing and fittings in the analysis equipment is a common source of contaminants. Any contamination of the surroundings was avoided by measuring samples directly, i.e. no ageing of the products were done. The sampling at elevated temperatures on Tenax TA proved to be a suitable method for detecting the flame retardant tris (dichloroisopropyl) phosphate (TCCP) from the PU insu-lation. The repeatability for the emission testing at temperatures 23 °C and 40 °C was good.
For measuring SVOC emissions from building products, a pre step measuring the elemental con-stituents is recommended. Products containing phosphor or bromine (e.g. above 0.1 %) would then be tested further for the occurrence of brominated compounds and organophosphates. Similarly, phtha-lates should be pre tested from the material itself.
In conclusion, the following scheme is proposed for the measurement of SVOCs from building products:
1. Pre test 1: elementary analysis (bromine, phosphorus etc.). Emission testing is performed if the content is > 0.1 % according to specifications in Table 15 and 16. If content is < 0.1 %, emission testing is performed according to Table 16.
2. Pre test 2: phthalate occurrence. Emission testing is performed if phthalate is identified above blank values according to specifications in Table 15. If no phthalate is detected, emission test-ing is performed according to Table 16.
Table 15. Emission testing of SVOCs and FRs (A).
Compound Sampling Analysis LOD
Brominated FRs GC/MS-MS 2e-3�2e-4 ng/m3
Organophosphates GC/MS 0.04�0.0008 µg/m3
Phthalates (and TSVOCs)
Chamber size: < 2.5 dm3. Q/A: ISO 16 000-9 Collection media: PUF samples, minimum sample volume 5 m3 GC/MS ~ 0.005µg/m3
Table 16. Emission testing of SVOCs and FRs (B).
Compound Sampling Analysis LOD
TSVOC Chamber size: < 2.5 dm3. Q/A: ISO 16 000-9 Collection media: PUF samples, minimum sample volume 5 m3
GC/MS ~ 0.005µg/m3
TSVOC
Chamber size: < 2.5 dm3. Q/A: ISO 16 000-9 Collection media: Tenax TA sam-ples, minimum sample volume 2 litres
GC/MS-FID ~ 1µg/m3

8. Conclusions and recommendations for further action
53
Finally, this study found research need for the future on SVOCs and FRs as follows. More results on measured emissions of SVOCs and FRs from building products are needed. This requires that a standard measurement method for SVOCs and FRs, including validation data like uncertainty calculations, is developed. The contribution of the emissions to the indoor air and exposure scenarios indoors could then be better evaluated. In addition, specific data on the waste potential as well as life span assessment and extensive health evaluation for these compounds within the built environment is still lacking.

Appendix A: Chemical product registry search list
54
References Belloni, K. 2007. Personal communication.
Bergman, Å. 2002. Exposure to polybrominated diphenyl ethers and tetrabromobisphenol A among computer technicians. Chemosphere 46, pp. 709�716.
Birnbaum, L. and Staskal, D. F. 2004. Brominated flame retardants: Cause for Concern? Environ-mental Health Perspectives, 112, Number 1, January 2004.
Björklund, J. 2003. Gas chromatography and mass spectrometry of polybrominated diphenyl ethers. Department of analytical chemistry, Stockholm university, ISBN 91-7265-563-1.
Brown, V. M., Cockram, A. H., Crump, D. and Gardiner, D. 1990. Investigations of the volatile organic compound content of indoor air in homes with an odorous damp proof membrane. In: Pro-ceedings of the 5th International Conference on Indoor air Quality and Climate, Toronto. Pp. 575�580.
BSEF. 2003. An introduction to brominated flame retardants. Bromine Science and Environmental Forum. www.bsef.com
Butt, C. M., Diamond, M. L. and Truong, J. 2004. Spatial distribution of polybrominated diphenyl ethers in Southern Ontario as measured in indoor and outdoor window organic films. Envi-ron. Sci. Technol., 38, pp. 724�731.
Davenport, B., Fink, U. and Sasano, T. 2002. Flame retardants. SRI Consulting. http://scup.sric.sri.com
DEHP Information Centre, http://www.dehp-facts.com/
ECB, European Chemicals Bureau. 2006. http://ecb.jrc.it/
ECPI, European Council for Plasticisers and Intermediates. http://www.ecpi.org/
Edwards, R., Jurvelin, J., Saarela, K. and Jantunen, M. 2001b. VOC concentrations measured in per-sonal samples and residential indoor, outdoor and workplace microenvironments in EXPOLIS- Helsinki, Finland. Atmospheric Environment 35, pp. 4531�4543.

55
European Chemicals Bureau. 2006. European Risk Assessment Report on 2,2,6,6-tetrabromo-4,4´-isopropylidenediphenol (tetrabromobisphenol-A or TBBP-A), Cas No: 79-94-7, European Commission, Joint Research Centre, Luxemburg.
European Commission. 2008. Benzyl butyl phthalate (BBP), CAS No: 85-68-7, EINECS No: 201-622-7, Summary Risk Assessment Report, EUR 22773 EN/2.
European Union. 2003. Directive 2002/95/EC of the European Parliament and of the Council. Journal of the European Union, L 37, 13.2.2003.
European Union.2005. Directive 2005/84/EC of the European Parliament and of the Council. Official Journal of the European Union, L 344/40, 27.12.2005.
European Union, 2008. Information from European Union Institutions and Bodies, Comission, Official Journal of the European Union, C34/1, 7.2.2008.
FiSIAQ 2001. Classification of Indoor Climate 2000. Finnish Society of Indoor Air Quality and Climate, ISBN 952-5236-11-0, Espoo.
Gevao, B., Al-Bahloul, M., Al-Ghadban, A. N., Ali, L., Al-Omair, A.A., Helaleh, M., Al-Matrouk, K. and Zafar, J. 2006. Polybrominated diphenyl ethers in indoor air in Kuwait: Implications for hu-man exposure. Atmos. Environ. 2006, pp. 1419�1426.
Harrad, S. and Diamond, M. 2006. New directions: Exposure to polybrominated diphenyl ethers (PBDEs) and polychlorinated biphenyls (PCBs): Current and future scenarios. Atmospheric environment, 40, pp. 1187�1188.
Harrad, S., Wijesekra, R., Hunter, S., Halliwell, C. and Baker, R. A. 2004. Preliminary assessment of UK human dietary and inhalation exposure to polybrominated diphenyl ethers. Environ. Sci. Technol., 38, pp. 2345�2350.
Hartmann, P. C., Bürgi, D. and Giger, W. 2004. Organophosphate flame retardants and plasticizers in indoor air. Chemosphere, 57, pp. 781�787.
Hazrati, S. and Harrad, S. 2006. Causes of variability in concentrations of polychlorinated biphenyls and polybrominated diphenyl ethers in indoor air. Environ. Sci. & Technol, 40, pp. 7584�7589.
Honkanen, H., Riala, R. and Kokotti, H. 2006. Volatile polycyclic aromatic hydrocarbons in coal tar pitch of water barrier in floors and in ceiling of an old office building and IAQ. In: Proceedings of Healthy buildings 2006, Lisboa, pp. 267�270.
Horn, W., Jann, O. and Wilke, O. 2003. Suitability of small environmental chambers to test the emis-sion of biocides from treated materials into the air. Atmospheric environment, 37, pp. 5477�5483.
ISO. 2004. ISO 16 000-6. Indoor Air � Part 6: Determination of volatile organic com-pounds in indoor and chamber air by active sampling on Tenax TA, thermal desorption and gas-chromatography MSD/FID.

56
ISO. 2006a. ISO 16000-9. Indoor- Air Part 9: Determination of the emission of volatile organic com-pounds from building products and furnishings � Emission test chamber method.
ISO 2006b. ISO 16000-10. Indoor- Air Part 10: Determination of the emission of volatile organic com-pounds from building products and furnishings- Emission test cell method.
Jakobsson, K., Thuresson, K., Rylander, L., Sjödin, A., Hagmar, L. and Janssen, S. 2005. Brominated flame retardants: rising levels of concern. www.noharm.org
Jönsson, K. and Yndemark, B. 2002. Bromerade flamskyddsmedel i byggindustrin. Brandforsk-project 706�201. Skanska Sverige.
Katsumata, H., Murakami, S., Kato, S., Hoshino, K. and Ataka, Y. 2005. Measurement of semi volatile organic compounds emitted from various types of indoor materials. In: Proceedings of Indoor Air 2005, Bejing, pp. 1882�1885.
Kemmlein, S., Hahn, O. and Jann, O. 2003. Emissions of organophosphate and brominated flame retardants from selected consumer products and building materials. Atmospheric Environ-ment, 37, pp. 5485�5493.
Korpi, A., Puttonen, K., Mäkinen, M. and Pasanen, P. 2007. Determination of phthalates- effects of extraction parameters on recovery. In: Proceedings of Clima 2007 WellBeing Indoors.
Maijala, J. ja Nippala, E. 2002. Elohopea ja PCB Suomen rakennuskannassa. Tampereen teknillinen korkeakoulu. 79 s.
Miljøstyrelsen, www.mst.dk, 2007.
Ministry of the Environment. 2002. The national building code of Finland. E1 fire safety of buildings.
OECD, Organisation for Economic Co-operation and Development, Environment Directorate . 1994. Selected brominated flame retardants. Paris. 152 p.
Perälä, A.-L., Rintanen, R., Nuuttila, H., Mäensivu, S. 2006. Vuoden 2004 rakennusjätetilastoa tukeva VTT:n asiantuntijatyö. VTT:n tutkimusraportti Nro VTT-R-06178-06 23 sivua (not published)
Phtalates Information Centre. http://www.phthalates.com/
Rakennuspolyuretaaniteollisuus (The construction polyurethane industry of Finland), 2006.
Steukers, V., Kroon, S. and Drohmann, D. 2004. Flame retardants: European Union risk assessments update. Plastics Additives & Compounding, March/April, 28�29. ISSN 1461-391x/04.
Sjödin, A., Hagmar, L., Klasson-Wehler, E., Kronholm-diab, K., Jakobsson, E. and Bergman, Å. 1999. Flame retardant exposure: Polybrominated Diphenyl ethers in blood from Swedish workers. Environmental Health Perspectives, 107 (8), pp. 643�648.
STTV. 2006. Kemikaalituoterekisteri. Sosiaali- ja terveydenhuollon tuotevalvontakeskus.

57
Thomas, S. and Uhde, E. 2006. Thermal desorption of semivolatile organic compounds, In: Proceed-ings of Healthy buildings 2006, Lisaboa, pp. 255�258.
The Council of State, 1995. Statutes of Finland, Numbers 1396�1405, p.3217. Valtioneuvoston pää-tös kreosootin ja sillä käsitellyn puun käytön sekä markkinoille luovuttamisen rajoittamisesta. Julkaistu Helsingissä 14 päivänä joulukuuta 1995.
The Council of State 2003. SUOMEN SÄÄDÖSKOKOELMA 2003 Julkaistu Helsingissä 22 päivänä tammikuuta 2003 N:o 6�12, s.15. Valtioneuvoston asetus N:o 8 kreosootin ja sillä käsitellyn puun käytön ja markkinoille luovuttamisen rajoittamisesta. Annettu Helsingissä 16 päivänä tammikuuta 2003. www.vn.fi.
The National Board of Antiquities and Historical Monuments in Finland, 2007.
TTL. 2006. Lisääntymiselle vaaralliset ftalaatit (dietyyliheksyyliftalaattia ja dibutyyliftalaatti). Teokses-sa: Kemikaalit ja työ. p. 196. http://www.ttl.fi/Internet/Suomi/Aihesivut/Kemikaaliturvallisuus/Kemikaalit+ja+tyo/
Vainio T., Jaakkonen, L. Nuuttila, H.and Nippala, E. 2006. Kuntien rakennuskanta 2005. Suomen kun-taliitto, Helsinki. ISBN 952-213-110-5.
Wensing, M., Uhde, E. and Salthammer, T. 2005. Plastics additives in the indoor environment- flame retardants and plasticizers. Science of the total environment, 339, pp. 19�40.
Weschler, C. J. 2003. Indoor/ outdoor connections exemplified by processes that depend on an or-ganic compound´s saturation vapor pressure. Atmospheric Environement 37, pp. 5455�5465.
WHO, World Health Organization, 2000. Air Quality Guidelines for Europe, 2nd edition. European Series 91, WHO Regional Publications, Copenhagen, ISBN 92-890-114-9.
WHO, World Health Organization. 1997. Environmental Health Criteria 192, International programme on chemical safety. Geneva. 81 p. ISBN 9241571926.
Wilford, B. H., Harner, T., Zhu, J. Shoeib, M. and Jones K. C. 2004. A passive sampling survey of polybromintaed diphenyl ether flame retardants in indoor and outdoor air in Ottawa, Canada. Environ. Sci. Technol., 38, pp. 5312�5318.
Wilford, B. H., Shoeib, M., Harner, T., Zhu, J. and Jones K. C. 2005. Polybrominated diphenyl ethers in indoor dust in Ottawa Canada: Implications for sources and exposure. Environ. Sci. Tech-nol., 39, pp. 7027�7035.
Virtanen, K., Rahtola, R., Vahanen, R., korhonen, P., Levamo, H., Salmi, J. and Taskinen, J. 2005. Asukaslähtöisen perusparantamisen kehitystarpeet. Ympäristöministeriö, Helsinki 2005 (in Finnish).
VTT. 2006a. Housing statistics.
VTT. 2006b. Indoor air and material emission databases (not public).

58
www.tilastokeskus.fi (Statistics Finland).
www.ymparisto.fi (Ministry of the Environment), 2007.
YTV, 2004, Pääkaupunkiseudun rakennustyömailla syntyvä rakennusjäte. Pääkaupunkiseudun jul-kaisusarja. C 2004:13, YTV (Waste produced at construction sites within the Helsinki metro-politan area, in finnish)
Yu, C., Crump, D., Rowley, J., Brown, V. and Squire, R. 2005. Measurement of emission to air of VOCs and SVOCs: a pre-requisite for exposure risk assessment of products to be used in indoor environments. In Proceedings of Indoor Air 2005, Beijing, pp. 2139�2143.

Appendix B: Selected materials and their recycling
A1
Appendix A: Chemical product registry search list
The following compounds were included in the search from the chemical registry at STTV.
Phthalates CAS C1 DMP (dimethyl phthalate) 131-11-3C2 DEP (diethyl phthalate) 84-66-2C3 DPP (dipropyl phthalate) 131-18-0C4 DBP (di-n-butyl phthalate) 84-74-2DIBP (diisobutyl phthalate) 3001-15-8C4 / C6 BBP (butylbenzyl phthalate) 85-68-7C7 DIHP (diisohexyl phthalate) 68515-50-4C6 / C8 / C10 610P (six-ten phthalate) C7 DIHP (diisoheptyl phthalate) 71888-89-6C7 / C9 79P (seven-nine phthalate) C8 DEHP / DOP (di(2-ethylhexyl) phthalate) 117-81-7DIOP (diisooctyl phthalate) 27554-26-3C8 / C10 810P (eight-ten phthalate) C9 DINP (diisononyl phthalate) 28553-12-0C9 / C11 911P (nine-eleven phthalate) C10 DIDP (diisodecyl phthalate) 26761-40-0DPHP (dipropylheptyl phthalate) 84294-98-4C10 / C12 1012P (ten-twelve phthalate) C11 DUP (diundecyl phthalate) 3648-20-2DIUP (diisoundecyl phthalate) 85507-79-5 Flame retardants Inorganic: Alumina trihydrate ATH 21645-51-2antimony trioxide (synergist) 1309-64-4antimony oxides and antimonates sodium antiomonate 15432-85-6boric acid 10043-35-3sodium borate 1330-43-4zinc borate 12536-65-1ammonium polyphosphate APP 68333-79-9Halogenated: tetarbromobisphenol (TBBPA) 79-94-7polybrominated diphenylethers (PBDE): 32534-81-8

Appendix A: Chemical product registry search list
A2
decabromodiphenyl ether (DBDE) 13654-09-6 octabromodiphenylether (OBDE) 32536-52-0pentabromodiphenylether (pentaBDE) 32534-81-9
hexabromocyclodecane (HBCD) 3194-55-6,
25637-99-4polybrominated biphenyls (PBB) 67774-32-7Organophosphorus: TCPP 13674-84-5phosphate esters triphenylphosphate 115 86 6triethylphosphate 78-40-0trioctyl phosphate 78-42-22-ethylhexyl-diphenyl phosphate 1241-94-7Nitrogen based: melamine 108-78-1melamine cyanurate 37640-57-6melamine phosphate 20208-95-1

Appendix B: Selected materials and their recycling
B1
Appendix B: Recycling of selected building materi-als
This appendix summarises the recycling data available for selected building materials that are considered to be sources of SVOCs and FRs.
1 Joint sealing compounds in concrete structures in buildings PCB-compounds have been added to the joint sealing (elastic polysulphides) until at least 1974, possi-bly to the end of 70�s. Majority of the 1970 and 1960 buildings joint sealing have been renewed. In 1980 and 1990 it was typical to install a new sealing on the old ones without removing those. Sealings containing PCB, or butyl are also used in roof and window joints. (Haukijärvi and Pentti 2000).
In addition to PCB also lead and polychlorinated biphenyls were used in joint sealings as hardeners (lead) or plasticisers (polychlorinated biphenyls).
According to field test, the PCB concentrations in joint sealing are 50 mg/kg, which is the limit value for hazardous problem waste. For lead concentration the limit value is 1500 mg/kg (Pyy & Lyly 1998). According to the same study the PCB concentrations in the ground soil were higher than rec-ommended limit values in the environments where PCB containing joint sealing was used. PCB was also found in concrete samples close to joints.
PCB and lead are classified as hazardous problem waste. Thus recycling and re-use is not possible or very limited.
2 Masonry products, light weight clay aggregate blocks
Masonry products and light weight clay aggregate blocks are typically re-used as crushed land fillings (excluding the insulation material). Some blocks contain EPS or polyurethane insulation material. Typically one wall m2 weights 140�170 kg of which 4�6 kg is insulation. When bricks are used in foundations bitumen coating is used to protect against moisture.

Appendix B: Selected materials and their recycling
B2
3 Damp proofs and water vapour resistance layers
In old buildings coal pitch was used as damp proof and water vapour resistance layer. Typically coal pitch is found in floors (ground and intermediate floors), foundations and walls against ground soil, swimming pools etc. In the demolition of building structures, treated with coal pitch, the most prob-lematic compounds are poly aromatic hydrocarbons (PAH compounds), which are classified as car-cinogenic. The structures with coal pitch are not suitable for re-use. 4 Thermal insulation materials
Mineral wool
Glass wool consists 95% of recycled glass and the natural stones and 5% of resin and oil. Glass wools (and other mineral wools) are non-combustible. Cellulose based insulation
Cellulose based insulation materials can be used as layers or blow inside a structure. When blowing technique is used water and glue is added to the material. Cellulose based insulation is made from recycled news paper. During the manufacturing process boron is added against mould and fire. Insula-tion can be reused or used as fillings in land but since Boron can dissolve the amount of material com-pared to the ground soil should be considered. The limit value for boron in terms of PNEC value (Predicted No Effect Concentration) is 2.5 mg/kgdry (Braunschweiler 1993, Koivisto 1998). In normal conditions the boron concentration in ground soil can be 2�100(�300) mg/kg depending on soil type and climate. Polystyrene
EPS (Expanded polystyrene) insulation layers consist of small polystyrene pearls including pentane gas. EPS does not include styrene monomers. The expanded gas is evaporated during manufacturing process. Polystyrene is not water soluble. There are several options to treat EPS building and demoli-tion waste, each with environmental, technical and economic implications to consider when choosing the best option to implement at specific sites.Generally,the most beneficial is direct re-use by grinding clean EPS waste and adding it to virgin material during production. This waste can also be used to improve soil condition. Alternatively, EPS can be melted and extruded to make compact polystyrene, for items such as plant pots, coat hangers and a wood substitute. Medium toughened polystyrene from which sheets for thermoformed articles,such as trays, can also be made. As part of mixed plastic waste, EPS can be recycled to make, for example, park benches, fence posts and road signs, ensuring the plastic material has a long and useful second life. EPS can also be used for the recovery of energy, usually in the form of heat from incineration. This gives EPS-waste a genuine post-consumer use. The calorific value of EPS available for heat recovery is slightly more than that of coal by weight.

Appendix B: Selected materials and their recycling
B3
Polyurethane
Polyols and di-isosyanates are the pre-stages of polyurethane. In building materials difenylmethane-di-isosyanate (MID) is typically used. The amount of catalyst, pigments and surface activated ingredients are typically 1�2%, the fire resistance and propellant gas amount is 2�20% of the weight.
Until now CFC (chlorine-fluorine-carbon) compounds are not collected for building products. Part of the polyurethane insulation materials could be recovered and used in the manufacturing of new insulation products or in soil construction.
20% of the CFC is emitted by diffusion to the environment during 30 to 50 years time span. Also other gases are diffused in a small amounts e.g. the pentane which is typically used today in polyure-thane insulations. That can possibly cause slightly elevated VOC emissions. On the other hand, aero-sols are less used today.
5 Boards
Gypsum boards
Gypsum boards can be recycled. The weight of a gypsum board is gypsum board is typically 9.0 and 11.7 kg/m2 depending of the type of the board. Recycled gypsum boards are crushed and used as raw material together wit raw gypsum for new boards. Concrete fibre boards (asbestos)
Asbestos was widely used in 1960�70s, but the use of asbestos started already in 1920. Asbestos was used in several products such as sealing, air ducts, thermal insulation, floor coverings, water proof layers, paints, plasters etc. The most harmful asbestos applications are shotcrete materials and insula-tion materials, since they release asbestos fibres more easily (the asbestos is not bind to the base mate-rial). Undamaged asbestos materials are not harmful for building users.
6 Flooring materials
The yearly use of different flooring materials was 6 million m2 for parquet and laminate and 4 million m2 for plastic, linoleum carpets as well as ceramic tiles. Plastic floorings
The main raw material of plastic floorings is PVC, which is chlorinated hydrocarbon polymer. The polymer is produced from vinyl chloride. In addition, other plastic materials like polyethene and poly-

Appendix B: Selected materials and their recycling
B4
propylene, and fillers like dolomite, talc, calcium carbonate and quartz sand are used. The additives used include plasticisers, stabilizers, pigments etc.
The weight of flooring product used in residential buildings is 1400�1500 g/m2. The products that are used in office and in public buildings weight roughly 4000 g/m2 (plastic plates) and 2700�3300 g/m2 (plastic carpets). The floorings used in moist and wet conditions weight typically 2300�2400 g/m2. The loss of materials in assembling of floorings is typically roughly 10%.
The alternative ways to remove the product from service are placing to dumping place, de-composting, incineration and recycling or reuse. The incineration of plastic materials as well as co-combustion in municipal solid waste combustion plants has been studied and results have been pub-lished by for example APME.
The biggest European manufacturers of flooring product belong to the European Resilient Flooring Manufacturer's Institute (ERFMI). The organisation has committed to support the recycling floorings. Vinyloop is a new industrial method of recycling of floorings. It is a combination of mechanical and chemical recycling methods with help of which recovered plastic can be produced from flooring waste.
The Vinyloop PVC recycling process separates the usable PVC compound from other materials (other plastics, rubber, metal, textile...) by selective dissolution and filtration and precipitates it into micro-granules of PVC compound. This regenerated PVC compound (R-PVC) that can be re-processed by extrusion, injection or calendaring. The process works on an industrial scale.
Vinyloop is not classified as a "chemical recycling technology" but rather as a "mechanical technol-ogy" because it conserves the molecular structure of the components. By simply dissolving the PVC compound and bringing it back to a solid state by precipitation, Vinyloop uses far less non renewable energy than competitive chemical recycling technologies.
In Finland a recycling system for assembling waste of flooring materials is organised by a company. The assembling waste is assorted and made use of as a bottom layer in the production of plates. 7 Bitumen
Nowadays the bitumen waste is not recycled. However, there could be some re-use options in filling lands. For roof materials the waste dump is 5.6 kg/m2. 8 References
Braunschweiler, H. 1993. Boorihappo. Vesi- ja ympäristöhallitus, kemikaalivalvonta-yksikkö. Helsinki, 23 s.
Haukijärvi, M., Pentti, M., 2000, Rakennusten saumausmassat ja PCB-yhdisteet, Tutkimusselostus 954/2000, Tampereen Teknillinen korkeakoulu
Koivisto, S. 1998. Ecotoxicological risk assessment of the wood preservative Jerbor. Finnish Environ-ment Institute, chemicals. Helsinki, 22 s.
Micales,J. A. and Skog, K.E. The decomposition of forestn products in landfills. International biodete-rioration & Biodegradation Vol. 39 No 2 - 3. 1997. pp. 145 � 158

Appendix B: Selected materials and their recycling
B5
Perälä, A-L., Nippala, E. 1998. Rakentamisen jätteet ja niiden hyötykäyttö.VTT Tiedotteita 1936. 67 s + 20 s. liitteitä
Pyy, Virpi & Lyly, Olavi, PCB elementtitalojen saumausmassoissa ja pihojen maaperässä. Ym-päristökeskuksen julkaisuja. 10/98. Helsinki 25 p.
Tanskanen, J.-H. 1997. YTV:n alueen jätehuollon mallintaminen. Helsinki, YTV. Pääkaupunkiseudun julkaisusarja C 1997:2.

Series title, number and report code of publication
VTT Research Notes 2486VTT-TIED-2486
Author(s) Helena Järnström, Sirje Vares, Miimu Airaksinen Title Semi volatile organic compounds and flame retardants Occurence in indoor environments and risk assessment for indoor exposure Abstract The first part of the project presented in this publication reviews the occurrence of semi-volatile organic compounds (SVOCs) and flame retardants in commonly used building and furnishing materials in Finland. SVOCs included in the review are plasticis-ers, like phthalates, flame retardants (FRs), like brominated organic compounds and organophosphate esters. In addition, pol-yaromatic hydrocarbons (PAHs), which are constituents in coal tar/ creosote and have been used for moisture proofing in struc-tures, are also discussed. On the basis of present knowledge, risk assessment for exposure indoors is presented. In addition, sources of SVOCs and waste potential in the old building stock are clarified. The knowledge for the review was gathered from housing statistics, building product statistics, the chemical registry at The National Product Control Agency's (STTV), The Na-tional Board of Antiquities and Historical Monuments in Finland, Finnish Environment Institute (SYKE), and from interviews with the construction product industry.
In the second part of the project, SVOCs were measured from a total of 13 building materials including flooring materials, paints, insulations and a levelling agent (screed). Both short and long term (up to 60 days) emissions were measured by modify-ing the existing standard sampling method for the measurement of volatile organic compounds (VOCs). Emissions were meas-ured at room temperature and at 40 °C. The elevated temperature was considered to simulate real life situations, such as when a surface gets warmed up by direct sunlight.
The results showed that the initial specific emission rates (SER) of SVOCs are typically low, less than 5 µg/m2h. An exception was newly prepared foam type polyurethane insulations, which emitted SVOCs up to 65 µg/m2h. The SVOC SERs were higher at 40 °C, up to 165 µg/m2h. No phthalates were detected from the air samples collected during the 60 -day test period. However, 218 µg of a phthalate compound was detected from the solvent used to rinse the walls of the chamber that was used to measure the PVC sample. Also, 72 ng of the fire retardant hexabromocyclododecane (HBCD) was detected from the rinsing samples of the chamber used for measuring the expanded polystyrene (EPS) insulation for FR applications. A commonly used FR, Fyrol PCF (Tris (2-chloroisopropyl) phosphate, TCCP) was detected from air samples taken from the polyurethane insulation (foam type) at 24 µg/m2h (as toluene equivalent) after 120 minutes at 40°C. Boron was detected from air samples from the cellulose based insulation material at 0.3�5 µg/m3. The study showed that SVOCs and FRs are emitted at low levels at room temperature from common building materials. Howe-ver, the variety of compounds emitted and emission ranges varied markedly. SVOC (and VOC) SERs increased markedly when the temperature increased to 40 °C. In real life, such temperatures can be reached on surfaces with direct sunlight during the summer or in cases when floor heating is used. Consequently, exposure assessments for SVOCs in such environments can be assessed better based on the emission results collected during this project. Exposures at room temperature were esitimade to <0.1 - <2 µg/kg day. However, the migration of FRs and SVOCs into indoor air is probably less than this from building materials that are inside a structure, e.g. insulation, which decrases exposure to these compounds indoors.
ISBN 978-951-38-7299-1 (URL: http://www.vtt.fi/publications/index.jsp)
Series title and ISSN Project number VTT Tiedotteita � Research Notes 1455-0865 (URL: http://www.vtt.fi/publications/index.jsp)
31646
Date Language Pages May 2009 English 58 p. + app. 8 p.
Name of project Commissioned by SVOC altistuminen Keywords Publisher SVOC, material emission, exposure indoors VTT Technical Research Centre of Finland
P.O.Box 1000, FI-02044 VTT, Finland Phone internat. +358 20 722 4520 Fax +358 20 722 4374


VTT RESEARCH NOTES 2486VTT CREATES BUSINESS FROM TECHNOLOGY�Technology�and�market�foresight�•�Strategic�research�•�Product�and�service�development�•�IPR�and�licensing�•�Assessments,�testing,�inspection,�certification�•�Technology�and�innovation�management�•�Technology�partnership
•�•�•��VTT�RESEA
RC
H�N
OTES�2486���
SEMI�VO
LATILE�O
RG
AN
IC�C
OM
POU
ND
S�AN
D�FLA
ME�R
ETAR
DA
NTS.�O
CC
UR
REN
CE�IN
�IND
OO
R...ISBN 978-951-38-7299-1 (URL: http://www.vtt.fi/publications/index.jsp)
ISSN 1455-0865 (URL: http://www.vtt.fi/publications/index.jsp)
Helena Järnström, Sirje Vares & Miimu Airaksinen
Semi volatile organic compounds and flame retardants
Occurrence in indoor environments and risk assessment for indoor exposure
This project reviews the occurrence of SVOC compounds and flame retardants in the commonly used building and furnishing materials in Finland. The knowledge for the review was gathered from housing statistics, building product statistics, the chemical registry at The National Product Control Agency’s (STTV), The National Board of Antiquities and Historical Monuments in Finland, Finnish Environment Institute (SYKE), and from interviews with the construction product industry. In addition, emissions of SVOCs and flame retardants were measured from the most commonly used building materials. On the basis of present knowledge, risk assess-ment for exposure indoors is presented.