technology acceptance model of online learning management
TRANSCRIPT

* Corresponding author E-mail: [email protected] © 2017 NSP
Natural Sciences Publishing Cor.
Int. J. Learn. Man. Sys. 5, No. 1, 1-15 (2017) 1
http://dx.doi.org/10.18576/ijlms/050101
Technology Acceptance Model of Online Learning Management Systems
in Higher Education: A Meta-Analytic Structural Equation Model
Nicola L. Ritter*
Texas A&M University TAMU MS 4458, USA
Received: 11 Mar. 2016, Revised: 15 Jul. 2016; Accepted: 20 Jul. 2016
Published online: 1 Jan. 2017.
Abstract: The present meta-analysis employs meta-analytic structural equation modeling (MASEM) to quantitatively
synthesize studies that investigates college students’ acceptance of online learning managements systems. This study
combined meta-analysis and path analysis to extend and refine the Technology Acceptance Model (TAM) within a higher
education online learning environment context. Analyses of 13 studies representing 3407 undergraduate students from world-
wide universities were conducted. The study investigated four path models (e.g., fixed-effects and random-effects) measuring
different combinations of variables and formed conclusions about the relationships between the variables that were available.
The model fit of each path model suggested mixed-results. Some models resulted in an acceptable fit, while others resulted in
poor fit. Invariance tests resulted in statistically different findings across multiple parameter estimates, suggesting little to no
replicability of findings across studies. Educational technology researchers should be cautious when forming conclusions
about undergraduate online learning management systems based on the TAM.
Keywords: Meta-analysis; structural equation modeling; technology acceptance model; learning management systems.
1 Introduction
Practitioners need to gain an understanding of students’ acceptance of the online learning environment.24, 38 While
instructors’ preferences are often taken into consideration before implementing online learning; students’ preferences are
often explored only after adoption or when issues emerge during the course. Students’ acceptance of the online learning
environment is crucial to the success of online learning programs and for funds to be wisely invested. Before investing in
online learning technologies, instructors understand whether the online learning environment will be accepted by the students
involved. 2
2 The Technology Acceptance Model
The Technology Acceptance Model7 (TAM; c.f. Figure 1a) is one of many underlying theories used in technology adoption.
The TAM is one of the most commonly used models to explain user’s technology acceptance behavior. The TAM is rooted
in Social Psychology Theory and the Theory of Reasoned Action. The core constructs in the original TAM include perceived
Ease of Use (EU), Perceived Usefulness (PU), attitude (A) toward using, and actual system use (U). Over time, the model
has been modified by adding constructs such as Behavioral Intention (BI) to use. Note, the TAM also specifies relationships
between numerous endogenous variables (i.e., predictor variables) and other variables within the model.
Figure 1 depicts the evolution of the TAM between 1986 and 1996. At the TAM’s core (Figure 1c), the TAM posits
perceived ease of use and perceived usefulness of the technology will individually predict user’s behavioral intention to use
the technology. In other words, the easier the technology is to use or the more useful a particular technology is found to be,
the more likely the user intends to use the technology again. The TAM (Figure 1c) also proposes that perceived usefulness
mediates the relationship between perceived ease of use and behavioral intention to use the technology. This mediation effect
may be observed when a technology is easy to use, but the technology is not useful to a person. If the technology is not
perceived as useful, then it does not matter how easy the technology is to use; the end user will not continue to use the
technology.
3 Literature Review
International Journal of Learning Management Systems

2 N. L. Ritter : Technology acceptance model …
© 2017 NSP
Natural Sciences Publishing Cor.
To validate any version of the TAM, researchers must look at how the TAM functions with different technologies and
different populations. One way explore this is to synthesize previous studies through meta-analysis. However, meta-analysts
have faced numerous challenges in synthesizing the literature and in turn validating the TAM. One challenge meta-analysts
face is the inability to conduct moderator analyses relating to a specific type of technology used. In the context of the TAM, a
structural equation model, moderator analyses allow researchers to understand to what degree a model explains or predicts an
outcome. This is important because the TAM may fit one technology well, while fit poorly with different technology. For
example, Schepers and Wetzels32 reviewed all empirical studies assessing the TAM. The authors had sufficient information
to code for multiple types of technologies. However, there were not enough studies to conduct a moderator analysis based on
a single technology. Instead, the meta-analysts aggregated all of the technologies into two categories (e.g., microcomputers
and non-microcomputers). By narrowing these technologies into two groups, the study loses some of the information that
could be observed by conducting a moderator analysis with more than two groups. To this end, model parsimony is favored
when exploring numerous technologies.
Figure 1: Evolution of Core Constructs In the Technology Acceptance Model.
Notes. PU = Perceived Usefullness; EU = Ease of Use; A = Attitude; BI – Behavioral Intention to Use the Technology; U =
Actual Usage of the Technology.
Another challenge meta-analysts face is the inability to validate the TAM with a specific population. For example, King and
He conducted a meta-analysis on the TAM using different users (e.g., students, professionals, and general users) and found
differences between types of users.13 More specifically, King and He concluded that, although students were similar to
professionals, students were “not exactly like either of the other two groups” (p. 751) (i.e., professionals and general users).
Although the researchers found that these groups were different, the results reported the results as if the groups were the
same. Aforementioned with reviewing multiple technologies, parsimony within the study’s sample is preferred.
Moreover, few meta-analysts of the TAM have conducted a meta-analysis of the TAM as a whole. Instead, previous meta-
analysts have looked at each pairwise relationship within the model and formed conclusions regarding each relationship in
the model. Tai, Zhang, Chang, Chen, and Chen36 is unique in that the authors have evaluated the TAM as a whole by

Int. J. Learn. Man. Sys. 5, No. 1, 1-15 (2017) / http://www.naturalspublishing.com/Journals.asp 3
© 2017 NSP
Natural Sciences Publishing Cor.
combining meta-analysis and structural equation modeling. However, Tai et al. only tested one version of the TAM.36 It is
unknown exactly why few researchers, with the exception of Tai et al., have attempted to validated the TAM as whole.36 As
discussed later, researchers may have had difficulty acquiring data to create a pooled covariance matrix. Unfortunately,
primary studies of the TAM often only investigate the individual pairwise relationships within the TAM instead of
investigating the TAM holistically, with a structural equation model mindset. As such, the meta-analyst must carefully pull
effect sizes from each pairwise relationship that was investigated and create the covariance matrix for each study before the
meta-analyst can begin to conduct the MASEM.
Previous studies have used meta-analytic techniques to validate the TAM; however, researchers failed to explore the TAM
with a single type of technology or among a specific population using the TAM. 13,17 The results from prior meta-analyses
suggest there is a lack of understanding of a specific population’s ability to accept a specific type of technology.
4 Purpose
To date, researchers are unable to validate the TAM meta-analytically because previous analyses select broad populations
(e.g., undergraduate students, professionals, and general users) and numerous technologies (e.g. learning management
systems, email, word processors). Before investing in online learning technologies, practitioners should determine whether
an online learning environment will be accepted by the students involved. In contrast to previous meta-analyses, the present
meta-analysis isolated one population (e.g. undergraduate students) and one technology (e.g., learning management systems)
to determine whether the core variables of the TAM explains undergraduates’ acceptance of online learning management
system by combining meta-analysis and structural equation modeling.
5 Methods
5.1 Search Procedures
First, articles were found using three academic databases: 1) ERIC database via EBSCO Host, 2) Educational Full Text via
Wilson Web, and 3) Proquest Dissertations & Theses database via ProQuest. Similar thesaurus terms and keywords were
used across all three databases. The database searched for the following words: “Technology Acceptance Model,” AND "e-
learning" OR "distance education" OR "online learning" AND "undergraduate" OR "college". The database search retrieved
a total of 38 articles. After external duplicates were removed, 34 articles remained for screening. Table 1 presents the total
number of articles retrieved from each database.
Second, articles were found while hand-searching articles from Ritter.26 The hand-search retrieved 4 articles. Lastly, the
reference section of the articles found in the database search and hand-search were searched. The reference list search
retrieved 39 articles.
5.2 Screening
The screening process occurred in two phases: a primary and secondary (e.g. Moher, Liberati, Tetzlaff, Altman, & The
PRISMA Group20), using an online reference management system, RefWorks. During the primary screening, each article’s
title and abstract was reviewed to determine if the article was written in English, was quantitative in nature, and tested the
TAM. The articles which met the first screening’s criteria progressed to the second phase. During the secondary screening,
the entire article was reviewed to determine if the article included samples coming from an undergraduate student
population, used the technology in an online learning context, reported adequate statistics to calculate covariances, measured
all variables in the TAM, and measured variables at one time point. Interested readers may access the screened articles using
the following permalink: http://goo.gl/5NYDKV.
Figure 2 presents the screening process, which includes the number of articles excluded and the reason for exclusion. The
search process identified 77 studies with 34 found via databases and 43 found by hand searching or snowballing the
reference sections of articles found in the database search. Three articles were excluded during the primary screening with
one article excluded for being qualitative in nature and two articles did not test the Technology Acceptance Model. Sixty-one
articles were excluded during the secondary screening. Six studies were excluded because those studies did not have samples
consisting of undergraduate college students. Two articles were removed because those were not tested in an online learning
context. Forty-nine studies were excluded because the researchers did not report sufficient statistics to calculate a
covariances, which was needed to meta-analyze the studies. Two articles were excluded because they did not measure the
variables represented in the TAM. Two studies were excluded because researchers used repeated measures design, which
provided two different sets of data for the sample. These two studies were deemed more appropriate to compare results with
rather than decide whether to synthesize pre-intervention or post-intervention results. After screening the 77 articles, a total

4 N. L. Ritter : Technology acceptance model …
© 2017 NSP
Natural Sciences Publishing Cor.
of thirteen articles were included in current meta-analysis.
Most of the articles did not report sufficient statistics to synthesize results. Given that 49 articles would be excluded due to
lack of statistics reported, two emails were sent to the authors whose articles did not contain statistics to compute a
covariance. The first email requested missing information (e.g., means and SDs and/or correlations), and a second email
followed two weeks later with a reminder of the initial request. Of the 49 articles with missing information, 13 authors
responded, with one author providing the information requested. The most common response was to refer me to a co-author
or suggest the data was lost.
Figure 2: Article Screening Process.
All 13 articles meeting inclusion criteria were published in seven peer-reviewed journals. Most came from a single journal,
Computers & Education. Table 2 presents the distribution of the articles according to journal.
Table 1 Articles Retrieved
Search Database Vendor Number retrieved External dups New articles added
1 ERIC EBSCO 16 0 16
Education Full Text EBSCO 19 4 15
ProQuest Dissertations & Theses ProQuest 3 0 3
2 Hand-searching - 4 0 4 3 Reference lists - 39 0 39
Total 81 4 77
Note. External dups = External duplicates between databases.
5.3 Coding Procedures
A coding scheme was created for the attributes of interest for the current study. All 13 articles were coded using an Excel

Int. J. Learn. Man. Sys. 5, No. 1, 1-15 (2017) / http://www.naturalspublishing.com/Journals.asp 5
© 2017 NSP
Natural Sciences Publishing Cor.
spreadsheet. Given that the 13 studies measured different combinations of the variables in the TAM, the studies were
grouped based on the common variables measured. Unfortunately, the studies had to be grouped by common variables
measured because although MASEM can account for missing data, MASEM cannot account for missing variables. Table 3
presents the four groups tested. Each group included a different number of studies. As such, the covariance matrix used for
each group of studies had a different number of variables (i.e., columns and rows in the covariance matrix) and different
sample size.
Table 2: Journals Represented in Meta-Analysis
Rank Journal Count %
1 Computers & Education 6 46.15
2 Educational Technology & Society 2 15.38
3 International Review of Research in Open and Distance Learning 1 7.69
4 Turkish Online Journal of Educational Technology - TOJET 1 7.69
5 British Journal of Educational Technology 1 7.69
6 Behaviour & Information Technology 1 7.69
7 Journal of Educational Computing Research 1 7.69
Note. n = 13.
Table 3: Groups of Studies Tested
Once the studies were grouped, a meta-analysis within each group was conducted and then compared the studies within each
group using multiple-group analysis. Given the number of parameters estimated in Groups 2 and 4, the SEM could not be
identified. Hence, only the multiple-group analysis is reported for Groups 2 and 4. By grouping the studies based on the
common variables measured, some of the 13 articles were not included in a given analysis.8, 14, 28, 21 Furthermore, some
studies were analyzed in more than one group.18, 23, 31, 43
5.4 Meta-analysis
The current meta-analysis used MASEM. MASEM combines meta-analysis and structural equation modeling by pooling

6 N. L. Ritter : Technology acceptance model …
© 2017 NSP
Natural Sciences Publishing Cor.
covariance matrices and testing structural equation models using the pooled covariance matrix. The current study used
Cheung and Chan’s (2005) proposed two-stage structural equation modeling (TSSEM) approach to fit MASEM using
covariance matrices.6 The MASEM using the TSSEM approach was conducted using the metaSEM package version 0.8-4,
the OpenMx package version 1.3.1-2301, and R version 2.15.3.5
5.5 Multiple group analysis
For the present study, a path analysis using maximum likelihood estimation was used to estimate the structural parameters of
the variables measured in each of the studies. To test the invariance across studies, a multi-group analysis of structural
invariance for each group of studies was conducted. The first step established a baseline model, labeled as Model 1 in each
group. Secondly, a constrained model was established and labeled as Model 2 in each group. In the constrained model, each
parameter was forced to be equal across all studies in the group. Thirdly, a chi-square difference test between Model 2 and
Model 1 was conducted. If the chi-square difference test resulted in a non-statistically significant difference across the
studies, it is concluded that the studies found statistically similar results. If the chi-square difference test resulted in a
statistically significant difference across the studies, the specific path differences were located by
reviewing the critical ratios (e.g., z- statistics) of the parameter estimates in each study.
The AMOS software was utilized to conduct the multiple-group analysis. Multiple fit indices were reported and used to
interpret model fit. While the chi-square test measures the model’s ability to reproduce the sample covariance matrix; the chi-
square test is sensitive to sample size and non-normality. Thus, several fit indices were considered to assess model fit,
including root mean square error of approximation (RMSEA), root mean square residual (RMR), normed fit index, (NFI),
goodness of fit index (GFI), and comparative fit index (CFI). RMSEA below .06 indicate a reasonable fit. An RMR of zero
indicates a perfect fit; thus, the closer RMR is to zero, the better model fit. NFI, GFI and CFI values greater than 0.95 suggest
reasonable model fit.39
6 Results
6.1 Meta-Analyses
Group 1
A fixed-effects MASEM combines two studies from Group 1. Figure 3 presents the model tested in the two studies.
Figure 3 Group 1 Model
Notes. PU = Perceived Usefullness; EU = Ease of Use; A = Attitude; BI – Behavioral Intention to Use the Technology.
In Stage 1, homogeneity of the covariance matrices was met based on the goodness-of-fit indices: Χ² (df = 6, N = 490) =
12.78; p = .05, CFI = 0.99, TLI = 0.98, SRMR = 0.06, and RMSEA = 0.07. Given that the covariance matrices were
homogeneous, the analysis continues to Stage 2 to fit structural model using RAM specification. In Stage 2, the fit indices of
the structural model indicate good fit, Χ² (df = 2, N = 490) = 12.77; p = .0017, CFI = 0.99, TLI = 0.96, SRMR = 0.04, and
RMSEA = 0.10. These indicators were consistent in indicating a generally acceptable fit of the hypothesized model to the
data. Table 4 presents the standardized parameter estimates of the model.
PU
EU
A BI
e11
e21
e31

Int. J. Learn. Man. Sys. 5, No. 1, 1-15 (2017) / http://www.naturalspublishing.com/Journals.asp 7
© 2017 NSP
Natural Sciences Publishing Cor.
Table 4: Group 1 Synthesis
95% CI
Parameter Stand. Lower Upper
PU -> EU 0.51 0.44 0.57
PU -> A 0.52 0.45 0.60
EU -> A 0.16 0.08 0.24
A -> BI 0.61 0.55 0.67
Note. CI = confidence interval; Stand. = standardized estimate.
Group 3
A random-effects MASEM combines three studies from Group 3. Figure 4 presents the model tested in the three studies.
Figure 4: Group 3 Model
Notes. EU = Ease of Use; BI – Behavioral Intention to Use the Technology; U = Actual Usage of the Technology.
In Stage 1, homogeneity of the covariance matrices was not met based on the goodness-of-fit indices: Χ² (df = 6, N = 489) =
34.03; p = 0.98, CFI = 0.81, TLI = 0.71, SRMR = 0.16, and RMSEA = 0.17. Given that the covariance matrices were
heterogeneous, a random-effects model is appropriate. In Stage 1, heterogeneity was confirmed Q (6) = 27.93, p < .001. The
heterogeneity of EU, BI, and U were 97.30%, 96.64%, and 96.52%, respectively. In Stage 2, the fit indices on structural
model indicates a perfect fit, Χ² (df = 1, N = 489) = 0.00, p < .001, CFI = 1.00, TLI = 1.00, SRMR = 0.00 and RMSEA =
0.00. Table 5 presents the standardized parameter estimates of the model.
Table 5: Group 3 Synthesis
95% CI
Parameter Stand. Lower Upper
EU -> BI 0.55 0.38 0.68
BI -> U 0.36 0.23 0.50
Note. CI = confidence interval; Stand. = standardized estimate.
6.2 Multi-group Analyses
Group 1
Group 1 compared two studies. Figure 3 presents the model tested in the two studies. Table 6 presents the model fit statistics
and the invariance test between the constrained and unconstrained model. Recall, the constrained model assumes the
parameters from each study are equal to each other. The chi-square difference test was not statistically significant; thus, the
parameter estimates across the two studies were statistically the similar or invariant. Table 7 presents the standardized and
unstandardized parameter estimates.
Table 6: Model Fit Statistics and Invariance Analysis of Group 1
No. Model Χ² df p-value RMSEA RMR NFI GFI CFI ΔΧ² Δ df p-value
1 unconstrained model 16.5 4 .002 .080 .060 .972 .984 .979
2 constrained model 23.2 8 .003 .062 .078 .961 .976 .974 6.7 4 .153
Note. n = 490.
EU BI U
e11
e21

8 N. L. Ritter : Technology acceptance model …
© 2017 NSP
Natural Sciences Publishing Cor.
Table 7: Parameter Estimates of Group 1
Study
EU -> PU
PU -> A
EU -> A
A -> BI
Stan. Unst. Stan. Unst. Stan. Unst. Stan. Unst.
Saadé & Galloway
(2005)a 0.47 0.41
0.47 0.46
0.03 0.02
0.55 0.63
Saadé et al. (2007)b 0.51 0.47 0.51 0.51 0.21 0.19 0.60 0.61
Note. an1 = 128. bn2 = 36. Stan = Standardized estimate, Unst. = Unstandardized estimate.
Group 2
Group 2 compared five studies. Figure 5 presents the model tested in the five studies. Table 8 presents the model fit statistics
and the invariance test between the constrained and unconstrained model. The chi-square difference test was statistically
significant; thus, there is a lack of model invariance across the five studies in this group. In other words, the parameter
estimates across the five studies were statistically different. Table 9 presents the standardized and unstandardized parameter
estimates.
Figure 5: Group 2 Model.
Notes. PU = Perceived Usefullness; EU = Ease of Use; BI – Behavioral Intention to Use the Technology.
Table 8: Model Fit Statistics and Invariance Analysis of Group 2
No. Model Χ² df
p-
value RMSEA RMR NFI GFI CFI ΔΧ²
Δ
df
p-
value
1
unconstrained
model 0.0 0 - .256 0.000 1.000 1.000 1.000
2
constrained
model 143.4 12
p <
.001 .094 .453 .883 .931 .892 143.4 12
p <
0.0001
Note. n = 1267.
Given that the five studies had different parameter estimates, a post-hoc analysis was conducted to determine which studies
had similar or different parameter estimates. To identify differences, the critical ratios of the parameters estimates between
each study were compared. Table 10 presents the critical ratios. A statistically significant critical ratio suggests that the
parameter estimate in one study is statistically different than the parameter estimate in another study. For example, the
critical ratio of EU -> PU in Almrashdah et al.2 and Yi and Hwang43 is z = -5.54 and is statistically significant at z = 1.96 (p
= .05). Thus, the parameter estimates of the EU -> PU in Almrashdah et al.2 and Yi and Hwang43 were statistically different
from one another. Conversely, the critical ratio of EU -> PU in Almrashdah et al. 2 and Martins and Kellermanns18 is z = -
1.328 and is not statistically significant at z = 1.96 (p = .05). Thus, the parameter estimates of EU -> PU in Almrashdah et al.
2 and Martins and Kellermanns18 were similar to each other. The results of the post
hoc analysis across the five studies suggest that their parameter estimates may be different for EU -> PU and PU -> BI, but
similar for EU -> BI. While the post hoc analysis provides potential insight to the nature of the differences in parameter
estimates among the five studies, these results should be interpreted with caution. The post hoc analysis is exploratory in
nature.
Group 3
Group 3 compared three studies. Figure 4 presents the model tested in the three studies. Table 11 presents the model fit
statistics and the invariance test between the constrained and unconstrained model. The chi-square difference test was
PU
EU
BI
e11
e21

Int. J. Learn. Man. Sys. 5, No. 1, 1-15 (2017) / http://www.naturalspublishing.com/Journals.asp 9
© 2017 NSP
Natural Sciences Publishing Cor.
statistically significant; thus, there was a lack of model invariance across the three studies in this group. Table 12 presents the
standardized and unstandardized parameter estimates.
Given that the three studies had different parameter estimates, a post-hoc analysis was conducted to determine which studies
had similar or different parameter estimates. To identify differences, the critical ratios of the parameters estimates between
each study were compared. Table 13 presents the critical ratios between the three studies. The results of the post hoc analysis
across the three studies suggest that the parameter estimates were statistically different for both EU -> BI and BI -> U.
Table 9: Parameter Estimates of Group 2
EU -> PU
PU -> BI
EU -> BI
Study Stan. Unst. Stan. Unst. Stan. Unst.
Saadé & Bahli (2005)a
0.26 0.23
0.36 0.47
0.06 0.07
Saadé et al. (2007)b
0.51 0.47
0.42 0.42
0.05 0.05
Almrashdah et al. (2010)c
0.79 0.83
0.62 0.69
0.19 0.23
Martins & Kellermanns
(2004)d
0.49 0.72
0.37 0.45
0.25 0.44
Yi & Hwang (2003)e 0.29 0.29 0.46 0.50 0.22 0.24
Note. an1 = 128. bn2 = 362. cn3 = 425. dn4 = 243. en5 = 109. Stan. = Standardized estimate, Unst.
= Unstandardized estimate.
Table 10: Critical Ratios of Parameter Estimates of Group 2 Study
Almrashdah et al. (2010)
Martins & Kellermann (2004)
Saadé & Bahli (2005)
Saadé et al. (2007)
EU -
PU
PU -
BI
EU -
BI
EU -
PU
PU -
BI
EU -
BI
EU -
PU
PU -
BI EU - BI
EU -
PU
PU
-
BI
EU -
BI
Almrashd
ah et al.
(2010)a
Martins
&
Kellerma
nn
(2004)b
-
1.328
-
2.56
4*
1.748
Saadé &
Bahli
(2005)c
-
6.501
*
-
1.62
9
-
1.222
-
4.048
*
0.15
3
-
2.370
*
Saadé et
al.
(2007)d
-
7.012
*
-
3.41
4*
-2.3*
-
2.705
*
-
0.26
4
-
3.244
*
2.438
*
-
0.34
9
-0.197
Yi &
Hwang
(2003)e
-
5.54*
-
1.76
1
0.123
-
3.435
*
.446 -
1.427 0.461
0.20
3 1.154 -1.736
0.7
30 1.814
Note. an1 = 425. bn2 = 243. cn3 = 102. dn4 = 362. en5 = 109. * |z-value| statistically significant at z ≥ 1.96.
Table 11: Model Fit Statistics and Invariance Analysis of Group 3
No. Model Χ² df p-value RMSEA RMR NFI GFI CFI ΔΧ² Δ df p-value
1 unconstrained model 23.5 3 p < .001 .118 7.526 .848 .971 .859
2 constrained model 38.7 7 p < .001 .097 21.762 .750 .952 .782 15.2 12 p = 0.0043
Note. n = 489.
Table 12: Parameter Estimates of Group 3
EU -> BI
BI -> U
Study Stand. Unstand. Stand. Unstand.
Martins & Kellermanns
(2004)a
0.43 0.76
0.30 0.31
Yi & Hwang (2003)b
0.35 0.38
0.26 18.74
Liao & Lu (2008)c 0.47 0.47 0.17 0.33
Note. an1 = 243. bn2 = 109. cn3 = 137.

10 N. L. Ritter : Technology acceptance model …
© 2017 NSP
Natural Sciences Publishing Cor.
Table 13: Critical Ratios of Parameter Estimates of Group 3
Study
Liao & Lu (2008) Martins & Kellermanns (2004)
EU -> BI
BI -> U
EU -> BI
BI -> U
Liao & Lu (2008)a
Martins & Kellermanns (2004)b
2.330*
-0.114
Yi & Hwang (2003)c -0.643 2.752* -2.649* 2.756*
Note. an1 = 137 . bn2 = 243. cn3 = 109. * |z-value| statistically significant at z ≥ 1.96.
Group 4
Group 4 compared four studies. Figure 6 presents the model tested in the four studies. Table 14 presents the model fit
statistics and the invariance test between the constrained and unconstrained model. The chi-square difference test was
statistically significant; thus, there was a lack of model invariance across the four studies in this group. Table 15 presents the
standardized and unstandardized parameter estimates.
Table 14: Model Fit Statistics and Invariance Analysis of Group 4
No. Model Χ² df
p-
value RMSEA RMR NFI GFI CFI ΔΧ²
Δ
df p-value
1 unconstrained model 0 0 - .213 0.000 1.000 1.000 1.000
2 constrained model 37.9 9 p < .001 .068 14.509 .903 .965 .924 37.9 9 p < 0.0001
Note. n = 700.
Table 15: Parameter Estimates of Group 4
EU -> PU
PU -> U
EU -> U
Study Stand. Unstand. Stand. Unstand. Stand. Unstand.
Brown (2002)a
0.39 0.40
0.04 0.05
0.32 0.37
Martins & Kellermanns (2004)b
0.49 0.72
0.23 0.28
0.07 0.13
Ramayah (2006)c
0.55 0.46
0.32 0.41
0.45 0.48
Yi & Hwang (2003)d
0.29 0.29
-0.04 -3.16
0.24 19.15
Note. an1 = 73. bn2 = 243. cn3 = 275. dn4 = 109.
Given that the four studies had different parameter estimates, a post-hoc analysis was conducted to determine which studies
had different parameter estimates. To identify differences, the critical ratios of the parameters estimates between each study
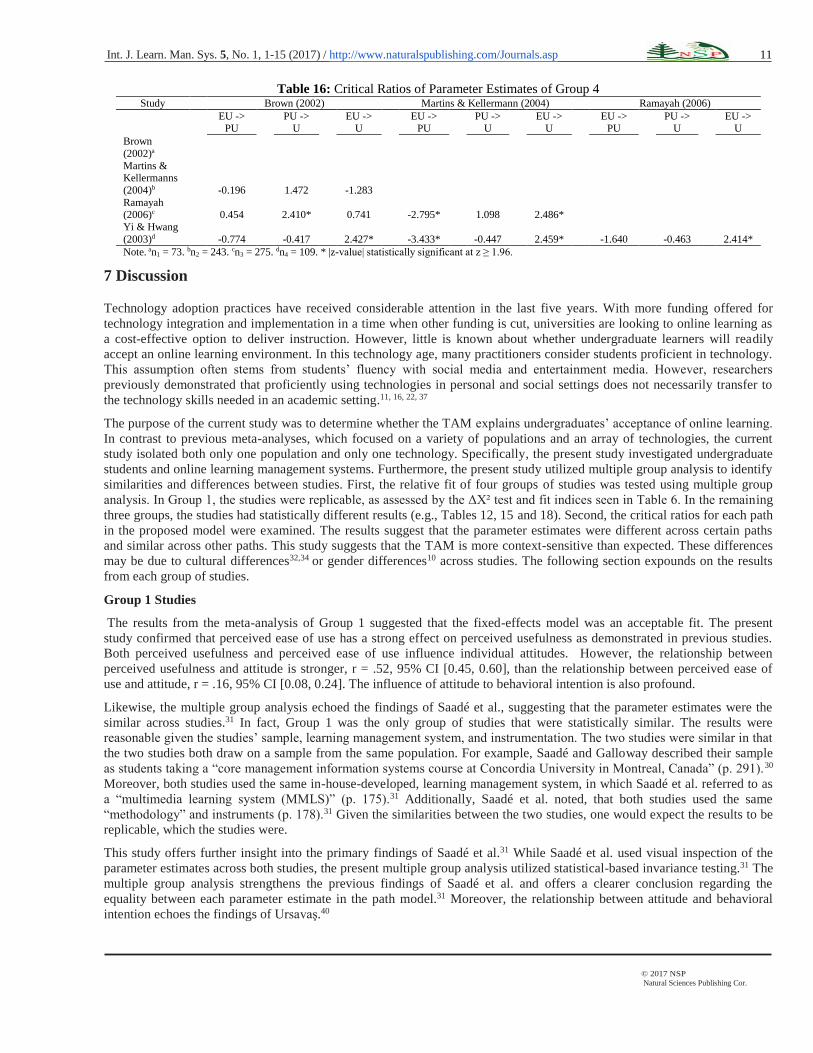
were compared. Table 16 presents the critical ratios. The results of the post hoc analysis across the four studies suggested that
the parameter estimates were invariant for both EU -> PU, PU -> U, but non-invariant for the path, EU -> U.
Figure 6: Group 4 Model
Int. J. Learn. Man. Sys. 5, No. 1, 1-15 (2017) / http://www.naturalspublishing.com/Journals.asp 11
© 2017 NSP
Natural Sciences Publishing Cor.
Table 16: Critical Ratios of Parameter Estimates of Group 4 Study
Brown (2002)
Martins & Kellermann (2004)
Ramayah (2006)
EU -> PU
PU -> U
EU -> U
EU -> PU
PU -> U
EU -> U
EU -> PU
PU -> U
EU -> U
Brown
(2002)a
Martins & Kellermanns
(2004)b
-0.196
1.472
-1.283
Ramayah (2006)c
0.454
2.410*
0.741
-2.795*
1.098
2.486*
Yi & Hwang
(2003)d -0.774 -0.417 2.427* -3.433* -0.447 2.459* -1.640 -0.463 2.414*
Note. an1 = 73. bn2 = 243. cn3 = 275. dn4 = 109. * |z-value| statistically significant at z ≥ 1.96.
7 Discussion
Technology adoption practices have received considerable attention in the last five years. With more funding offered for
technology integration and implementation in a time when other funding is cut, universities are looking to online learning as
a cost-effective option to deliver instruction. However, little is known about whether undergraduate learners will readily
accept an online learning environment. In this technology age, many practitioners consider students proficient in technology.
This assumption often stems from students’ fluency with social media and entertainment media. However, researchers
previously demonstrated that proficiently using technologies in personal and social settings does not necessarily transfer to
the technology skills needed in an academic setting.11, 16, 22, 37
The purpose of the current study was to determine whether the TAM explains undergraduates’ acceptance of online learning.
In contrast to previous meta-analyses, which focused on a variety of populations and an array of technologies, the current
study isolated both only one population and only one technology. Specifically, the present study investigated undergraduate
students and online learning management systems. Furthermore, the present study utilized multiple group analysis to identify
similarities and differences between studies. First, the relative fit of four groups of studies was tested using multiple group
analysis. In Group 1, the studies were replicable, as assessed by the ΔΧ² test and fit indices seen in Table 6. In the remaining
three groups, the studies had statistically different results (e.g., Tables 12, 15 and 18). Second, the critical ratios for each path
in the proposed model were examined. The results suggest that the parameter estimates were different across certain paths
and similar across other paths. This study suggests that the TAM is more context-sensitive than expected. These differences
may be due to cultural differences32,34 or gender differences10 across studies. The following section expounds on the results
from each group of studies.
Group 1 Studies
The results from the meta-analysis of Group 1 suggested that the fixed-effects model was an acceptable fit. The present
study confirmed that perceived ease of use has a strong effect on perceived usefulness as demonstrated in previous studies.
Both perceived usefulness and perceived ease of use influence individual attitudes. However, the relationship between
perceived usefulness and attitude is stronger, r = .52, 95% CI [0.45, 0.60], than the relationship between perceived ease of
use and attitude, r = .16, 95% CI [0.08, 0.24]. The influence of attitude to behavioral intention is also profound.
Likewise, the multiple group analysis echoed the findings of Saadé et al., suggesting that the parameter estimates were the
similar across studies.31 In fact, Group 1 was the only group of studies that were statistically similar. The results were
reasonable given the studies’ sample, learning management system, and instrumentation. The two studies were similar in that
the two studies both draw on a sample from the same population. For example, Saadé and Galloway described their sample
as students taking a “core management information systems course at Concordia University in Montreal, Canada” (p. 291).30
Moreover, both studies used the same in-house-developed, learning management system, in which Saadé et al. referred to as
a “multimedia learning system (MMLS)” (p. 175).31 Additionally, Saadé et al. noted, that both studies used the same
“methodology” and instruments (p. 178).31 Given the similarities between the two studies, one would expect the results to be
replicable, which the studies were.
This study offers further insight into the primary findings of Saadé et al.31 While Saadé et al. used visual inspection of the
parameter estimates across both studies, the present multiple group analysis utilized statistical-based invariance testing.31 The
multiple group analysis strengthens the previous findings of Saadé et al. and offers a clearer conclusion regarding the
equality between each parameter estimate in the path model.31 Moreover, the relationship between attitude and behavioral
intention echoes the findings of Ursavaş.40

12 N. L. Ritter : Technology acceptance model …
© 2017 NSP
Natural Sciences Publishing Cor.
Group 2 Studies
The multiple group analysis results suggested that the parameter estimates were different across the five studies. First, the
current study found the EU -> PU path was statistically different between 7 of the 10 pairs of studies. For example,
Almrashdah et al.2 and Saadé et al.31 were statistically different from each other. Unlike Tai et. al.36, the present results
suggest mixed findings across the five studies regarding the relationship between ease of use and perceived ease of use.
Second, the current study found the relationship between perceived usefulness and behavioral intention was relatively
consistent across studies, with only 2 of the 10 pairs of studies diverging from each other. The results mirror Saadé et al.’s
meta-analysis 31, which suggested a consistent and slight relationship between perceived usefulness and behavioral intention.
Lastly, the relationship between ease of use and behavioral intention was statistically different between only 3 of the 10 pairs
of studies, a result emulating King and He’s findings.13 Given the differences across studies, researchers should be cautious
when forming conclusions regarding the relationships between the three variables: perceived usefulness, ease of use, and
behavioral intention.
Group 3 Studies
The results from the meta-analysis suggest that the random-effects model represented in Group 3 was an acceptable fit.
Despite the adequate model fit, researchers should be cautious when forming conclusions regarding the relationships between
the three variables: ease of use, behavioral intention, and actual use, because the model tested only two relationships within
the TAM. For example, the relationship between ease of use and behavioral intention was relatively strong, while the
relationship between behavioral intention and use was moderate.
Furthermore, the multiple group analysis suggests that the parameter estimates were different across the four studies. First,
the current study found the EU -> BI path was statistically different between 2 of the 3 pairs of studies. Second, the
relationship between behavioral intention and actual use was statistically different across 2 of the 3 pairs of studies. The
results suggest that the parameters estimates were different across studies, which also maintains the idea that findings were
not replicable across studies.
Group 4 Studies
As seen in the multiple group analysis, results suggest that the parameter estimates were different across the four studies.
First, the current study found the EU -> PU path was statistically different between only 2 of the 6 pairs of studies,
suggesting Group 4 studies relatively reproduce a similar relationship between ease of use and perceived ease of use. Second,
the relationship between perceived usefulness and actual use was relatively consistent across studies, because only 1 of the 6
pairs of studies were different from each other. Lastly, the relationship between ease of use and actual use was statistically
different between 4 of the 6 pairs of studies. The results suggest mixed findings across the four studies regarding the
relationship between ease of use and actual use, a finding which resonates with Ma and Liu.17
8 Limitations
Although primary studies have validated the TAM with undergraduate students in an online learning context, practitioners in
the field should be cautious when making decisions about undergraduate online learning based on the TAM. Moreover, most
of the prior meta-analyses have only looked at the bivariate relationships represented in the TAM, instead of the model as a
whole, with one exception: Tai et al. meta-analytically tested the model as a whole using correlation matrices.36 Tai et al.’s
attempt was a progressive step and should be commended.36 However, the study was limited by only using a pooled
correlation matrix. The current study attempted to use a pooled covariance matrix, which provides more information for the
path analysis. However, the present study faced many challenges in attempting to meta-analyze studies. Perhaps, Tai et al.
encountered similar challenges, and therefore chose to utilize a more accessible correlation matrix to synthesize findings.36
This study faced many challenges in attempt to meta-analyze studies. First, the current study was limited by the range of
variables included in past research, a limitation that Fried, Shirom, Gilboa, and Cooper also found in their meta-analysis
using structural equation modeling.9 Second, this meta-analysis was limited to the statistics provided by the authors. More
specifically, the current study was limited by the range of variables included in past research. For example, studies that used
the TAM tested different combinations of the variables within the multiple iterations of the TAM. By testing different
combinations of variables, all 13 studies could not be synthesized together due to missing variables. Another challenge was
the inadequate reporting of statistics to conduct the meta-analysis. Among the 77 articles identified, authors of 49 articles did
not report the appropriate statistics to compute a covariance matrix. This denotes authors did not report either the means
and/or standard deviations and/or correlations of the variables.
Int. J. Learn. Man. Sys. 5, No. 1, 1-15 (2017) / http://www.naturalspublishing.com/Journals.asp 13
© 2017 NSP
Natural Sciences Publishing Cor.
9 Conclusions and Implications
The advancement of online learning technologies has provided unmatched accessibility for colleges to meet the educational
needs of students than ever before. As Bennett and Green noted, “There is little doubt that more and more college classes will
be placed online in the future, and we are fast approaching the point when it will be the norm to have several courses online
at the universities throughout the nation” (p. 495).3 Although prophetic in its time, today this statement seems commonplace.
While college administrators advocate for online courses, the current study suggests practitioners are making decisions based
on non-replicable results. Essentially, this meta-analysis found that results from primary studies did not reproduce the same
results when considering the model as a whole. As such, this study suggests that the TAM is not a good model to make
decisions related to online learning management systems. As such, practitioners should not base learning management
system adoptions based on studies that use the TAM.
The TAM is a popular model for explaining and predicting undergraduates’ learning management system use. To date,
researchers have conducted numerous studies on the TAM and obtained numerous confirmatory results through primary
studies. Researchers have selected a variety of ways to validate or extend the TAM. For example, some researchers
conducted replication studies, such as Adams, Nelson, and Todd1, while other researchers rely on meta-analyses (e.g.,
Šumak, Heričko, & Pušnik35). Moreover, some researchers look to longitudinal studies (e.g., Venkatesh & Davis42), while
other researchers relied on a series of single primary studies to validate or extend the TAM. The current study attempted to
use meta-analytic structural equation modeling to validate or extend the TAM. Unfortunately, there were too many obstacles
to definitively confirm any version of the TAM meta-analytically. Recall, that the studies used different versions of the
TAM, preventing the current study to synthesize all 13 studies. As such, conclusions are formed based on smaller groups of
three to five TAM studies. Although the findings of this study are useful, there are still questions about the TAM that cannot
be answered meta-analytically.
However, researchers should heed the concerns expressed here regarding the application and accuracy of the model in an
undergraduate online learning context. As demonstrated in the current study, some researchers may have formed erroneous
conclusions regarding the relationships between the variables in the TAM. Moreover, the multiple group analysis suggests
that the studies included here resulted in statistically different findings. Hence, the findings across studies were not
replicable.
Consequently, researchers have spent over a decade modifying a theoretical model based on primary studies that has
demonstrated little explanatory or predictive power. Hence, future research should be careful not to develop new models
which would exploit the strengths of the TAM while ignoring the model’s weaknesses. Future research should investigate
stronger ways to proceed with model development within the TAM. This may be through investigating the construct validity
of the TAM, testing and improving on the reliability and validity of the instruments used. In sum, practitioners should
carefully consider students’ preferences before investing in online learning technologies. However, practitioners should base
their decisions on the findings from theoretical models validated in an online learning context.
References
[1] Adams, D. A., Nelson, R. R., & Todd, P. A. (1992). Perceived usefulness, ease of use, and usage of information technology: A
replication, MIS Quarterly, 16, 227-247.
[2] *Almrashdah, I. A., Sahari, N., Mat Zin, N. A. H., & Alsmadi, M. (2010, November). Distance learners acceptance of learning
management system. Paper presented at the meeting of Advanced Information Management and Service (IMS), International
Conference Seoul, 304 – 309.
[3] Bennett, G. & Green, F. P. (2001). Promoting service learning via online instruction. College Student Journal, 35, 491-497.
[4] *Brown, I. T. J. (2002). Individual and technological factors affecting perceived ease of use of web-based learning technologies in a
developing country. The Electronic Journal on Information Systems in Developing Countries, 9(5), 1-15.
[5] Cheung, M. W.-L. (2013). Meta-analysis using structural equation modeling (Version 0.8-4) [Computer Software]. Retrieved from
http://courses.nus.edu.sg/course/psycwlm/Internet/metaSEM/
[6] Cheung, M.W.-L. & Chan, W. (2005). Meta-analytic Structural Equation Modeling: A two-stage approach. Psychological Methods,
10, 40-64. doi: 10.1037/1082-989X.10.1.40
[7] Davis, F. D. (1986). A technology acceptance model for empirically testing new end-user information systems: Theory and results.
(Doctoral dissertation). Retrieved from DSpace@MIT. (http://hdl.handle.net/1721.1/15192)
[8] *Davis, R. & Wong, D. (2007). Conceptualizing and measuring the optimal experience of the elearning environment. Decision
Sciences Journal of Innovative Education, 5, 97-126. doi: 10.1111/j.1540-4609.2007.00129.x

14 N. L. Ritter : Technology acceptance model …
© 2017 NSP
Natural Sciences Publishing Cor.
[9] Fried, Y., Shirom, A., Gilboa, S., & Cooper, C. L. (2008). The mediating effects of job satisfaction and propensity to leave on role
stress-job performance relationships: Combining meta-analysis and structural equation modeling. International Journal of Stress
Management, 15, 305-328. doi: 10.1037/a0013932
[10] Gefen, D. & Straub, D. W. (1997). Gender Differences in the Perception and Use of E-Mail: An Extension to the Technology
Acceptance Model. MIS Quarterly, 21, 389-400.
[11] Goode, J. (2010). Mind the gap: The digital dimension of college access. Journal of Higher Education, 81, 583-618.
[12] Hoban, C. F. (1958). Research on media. AV Communication Review, 6, 169-178.
[13] King, W. R. & He, J. (2006). A meta-analysis of the TAM. Information & Management 43, 740-755.
[14] *Lee, J. K. & Lee, W. K. (2008). The relationship of e-Learner’s self-regulatory efficacy and perception of e-Learning environmental
quality. Computers in Human Behavior, 24, 32-47 . doi: 10.1016/j.chb.2006.12.001
[15] *Liao, H. & Lu, H. (2008). The role of experience and innovation characteristics in the adoption and continued use of e-learning
websites. Computers & Education, 51, 1405-1416. doi:10.1016/j.compedu.2007.11.006
[16] Lloyd, J. M., Dean, L. A., & Cooper, D. L. (2007). Students' technology use and its effects on peer relationships, academic
involvement, and healthy lifestyles. NASPA Journal, 44, 481-495.
[17] Ma, Q., & Liu, L. (2004). The TAM: A meta-analysis of empirical findings. Journal of Organization and End User Computing,
16(1), 59-72.
[18] *Martins, L. L. & Kellermanns, F. W. (2004). A model of business school students’ acceptance of a web-based course management
system. Academy of Management Learning and Education, 3, 7-26.
[19] McArdle J.J. & McDonald R.P. (1984). Some algebraic properties of the reticular action model for moment structures. British
Journal of Mathematical and Statistical Psychology, 37, 234-251. doi:10.1111/j.2044-8317.1984.tb00802.x.
[20] Moher, D. Liberati, A., Tetzlaff, J., Altman, D. G., & The PRISMA Group. (2009). Preferred Reporting Items for Systematic
Reviews and Meta-Analyses: The PRISMA Statement PLoS Med 6(6): e1000097. doi: 10.1371/journal.prned1000097
[21] *Pituch, K. A., & Lee,Y. (2006). The influence of system characteristics on e-learning use. Computers & Education, 47, 222-244.
doi:10.1016/j.compedu.2004.10.007
[22] Presley, A., & Presley, T. (2009). Factors influencing student acceptance and use of academic portals. Journal of Computing in
Higher Education, 21, 167-182. doi: 10.1007/s12528-009-9022-7
[23] *Ramayah, T. (2006). Course website usage: Does prior experience matter?. WSEAS TRANS. on Information Science & Applications,
2, 299-306.
[24] Ramayah, T. (2010). The role of voluntariness in distance education students' usage of a course website. The Turkish Online Journal
of Educational Technology, 9, 96-105.
[25] Reeves, T.C. (2000, April). Enhancing the worth of instructional technology research through “design experiments” and other
development research strategies. In Session 41.29, International perspectives on instructional technology research for the 21st
century. Symposium conducted at the annual meeting of the American Educational Research Association, New Orleans, LA.
[26] Ritter, N. L. (2014). The Need for Meta-Analytic Thinking in Educational Technology Research. (Doctoral dissertation). Retrieved
from ProQuest Dissertation & Theses Database.
[27] Rourke, L., & Szabo, M. A. (2002). A content analysis of the Journal of Distance Education 1986–2001. Journal of Distance
Education, 17(1), 63-74.
[28] *Saadé, R. G. (2007). Exploring dimensions to perceived usefulness: Towards an enhanced assessment. Decision Sciences Journal of
Innovative Education, 5, 289-310.
[29] *Saadé, R., & Bahli, B. (2005). The impact of cognitive absorption on perceived usefulness and perceived ease of use in on-line
learning: an extension of the technology acceptance model. WSEAS TRANS. on Information Science & Applications, 42, 317-327.
doi:10.1016/j.im.2003.12.013
[30] *Saadé, R. G. & Galloway, I. (2005). Understanding intention to use multimedia information systems for learning. Issues in
Informing Science and Information Technology, 2, 287-296.
[31] *Saadé, R., Nebebe, F., & Tan, W. (2007). Viability of the “Technology Acceptance Model” in multimedia learning environments: A
comparative study. Interdisciplinary Journal of Knowledge and Learning Objects, 3, 175-184.
[32] Schepers, J. & Wetzels, M. (2007). Meta-analysis of the technology acceptance model: Investigating subjective norm and moderation
effects. Information & Management, 44, 90-103.
[33] Shih, M., Feng, J. & Tsai, C. C. (2008). Research and trends in the field of e-learning from 2001 to 2005: A content analysis of

Int. J. Learn. Man. Sys. 5, No. 1, 1-15 (2017) / http://www.naturalspublishing.com/Journals.asp 15
© 2017 NSP
Natural Sciences Publishing Cor.
cognitive studies in selected journals. Computers & Education, 51, 955-967.
[34] Straub, D., Keil, M., & Brenner, W. (1997). Testing the technology acceptance model across cultures: A three country study.
Information & Management, 33, 1–11.
[35] Šumak, B., Heričko, M., & Pušnik, M. (2011). A meta-analysis of e-learning technology acceptance: The role of user types and e-
learning technology types. Computers in Human Behavior, 27, 2067, 2077. doi:10.1016/j.chb.2011.08.005
[36] Tai, D. W. S., Zhang, R., Chang, S., Chen, C., & Chen, J. (2012). A Meta-Analytic Path Analysis of e-Learning Acceptance Model.
World Academy of Science, Engineering and Technology, 65, 104-107.
[37] Teclehaimanot, B., & Hickman, T. (2011). Student-teacher interaction on facebook: What students find appropriate. TechTrends:
Linking Research and Practice to Improve Learning, 55(3), 19-30.
[38] Tselios, N., Daskalakis, S., & Papadopoulou, M. (2011). Assessing the Acceptance of a Blended Learning University Course.
Educational Technology & Society, 14 (2), 224–235.
[39] Thompson, B. (2004). Exploratory and confirmatory factor analysis. Washington, DC: American Psychological Association.
[40] Ursavaş, Ö. F. (2013). Reconsidering the role of attitude in the TAM: An answer to Teo (2009) and Nistor and Heymann (2010), and
Lopez-Bonilla and Lopez-Bonilla (2011). British Journal of Educational Technology, 44, E22–E25. doi:10.1111/j.1467-
8535.2012.01327.x
[41] Venkatesh, V. & Davis, F. D. (1996). A model of the antecedents of perceived ease of use: Development and test. Decision Sciences,
27, 451-481. doi: 10.1111/j.1540-5915.1996.tb00860.x
[42] Venkatesh, V. & Davis, F. D. (2000). A theoretical extension of the technology acceptance model: Four longitudinal field studies.
Management Science, 46, 186-204. doi: http://www.jstor.org/stable/2634758
[43] *Yi, M. Y. & Hwang, Y. (2003). Predicting the use of web-based information systems: self-efficacy, enjoyment, learning goal
orientation, and the technology acceptance model. International Journal of Human-Computer Studies, 59, 431-448.
doi:10.1016/S1071-5819(03)00114-9