technological information inequality as an incessantly ... · technological information inequality...
TRANSCRIPT

Technological information inequality Hilbert, JASIST 2013
1
Technological information inequality as an
incessantly moving target:
The redistribution of information and communication capacities
between 1986 and 2010
This is a preprint of an article accepted for publication in
Journal of the American Society for Information Science and Technology
(forthcoming 2013)
of The Association for Information Science &Technology
http://www.asis.org/jasist.html
Martin Hilbert
United Nations ECLAC, Dag Hammarskjold 3477, Santiago, Chile;
Pontificia Universidad Católica de Chile, Facultad de Comunicaciones.
Email: [email protected]
ABSTRACT:
The article provides first-time empirical evidence that the digital age has first increased
and then (only very recently) decreased global, international and national inequalities of
information and communication capacities among and within societies. Previous studies on
the digital divide were unable to capture the detected trends appropriately, since they
worked with proxies, such as the number of subscriptions or related investments, without
considering the vast heterogeneity in informational performance among technological
devices. We created a comprehensive dataset (based on over 1,100 sources) that allows
measuring the information capacity directly, in bits per second, bits, and instructions per
second. The newly proposed indicators provide insights into inequalities in access to, usage
of, and impact of digitized information flows. It shows that the digital divide has gone into
a second stage, which is based on a relative universalization of technological devices and a
continuously evolving divide in terms of communication capacity.
Key words: inequality, digital divide, diffusion of innovation, Gini, information and
communication technology, international.
Technological information inequality Hilbert, JASIST 2013
2
Social Divider or Equalizer?
The digital age is often assumed to be inherently “decentralizing, globalizing, harmonizing, and
empowering” (Negroponte, 1996: 229), “characterized by decentralized ownership and equity” and by the
“power of the bottom, where peers holds sway” (Kelly, 1999: 117, 15). Such kinds of promises have led
to the tendency that it is “generally is used in a positive frame to indicate the democratization of access to
information” (Firth and Mellor, 2002: 7). A content analysis of online postings showed that people
frequently associate the Internet with “global access to information, democratization of information”, and
the notion of “bringing humanity together” (Colley and Maltby, 2008: 2009).
On the contrary, others have long argued that there is a tangible divide in the digital age: the so-called
digital divide (NTIA, 1995; Yu, 2006; Hilbert, 2011a). The introduction of new innovations is never
immediate and uniform. The nature of the S-shaped diffusion process of information and communication
technologies (ICTs) inevitably creates a divide between the ones that are fully integrated into the new
paradigm and those not yet reached. The barrier of entry to the digital realm consists in obtaining access
and in being able to effectively use the information resources.
Several theoretical models have been proposed to explain the nature of this S-shaped diffusion curve
(e.g. Rogers, 2003; Bocquet, Brossard and Sabatier, 2007; Geroski, 2000; Karshenas and Stoneman,
1993). These models explain differential ICT adoption in terms of demand side variables of the adopters
(e.g. Katz and Rice, 2002; James, 2008; Hilbert, 2010; 2011a, 2011b; Dutton, et al., 2004); as well as
supply-side variables of the technology and its markets (e.g. Davis, 1989; Beise, 2004; Maicas, et al.,
2009).
In this article we will not repeat these well-established theories on how and why technologies diffuse.
Rather we will show that, independent from the nature of the diffusion process, the measurement of any
ICT diffusion process can and should be fine-tuned by improving the central variable that describes the
diffusing technologies: we not only focuses on “how many devices diffuse”, but additionally on the
heterogeneous capacity of these devices (e.g. in bits per second), and therefore on “how much
communication capacity diffuses”. The results will show that this more nuanced measurement has
become increasingly important over recent years, since the digital divide has outgrown the binary
question about the “haves” and the “haves not” and has become a structural question about the “haves
much” and “haves little”. It is shown that this more fine-tuned indicator in terms of information and
communication capacity can be integrated into all existing approaches and models on the access to, usage
of, and impact of digital technologies.
The divide in access, usage, and impact
The literature frequently distinguishes between the diffusion of ICT and their eventual social
embeddedness (Avgerou, 2008) and it has become common practice among researchers (Katz and Rice,
2002) and practitioners (OECD, 2001) to distinguish among three complementary stages: (1) mere access
to the technology; (2) effective usage of the technology; (3) social integration and tangible impact of the
technology. These consecutive levels of connectivity differentiate between the level at which the digital
divide is considered to be closed.

Technological information inequality Hilbert, JASIST 2013
3
The question of access diffusion goes back to the beginning of the last century (Burgees, 1928, 1929,
1930). Today it is often seen as an accomplished task, since ICT devices have quickly reached even the
most remote corners of the globe (e.g. Compaine, 2001; Dutta, Lopez-Claros and Mia, 2006; ITU and
UNCTAD, 2007). There seems to be a natural limit to how many ICT devices a person can handle, and as
the advanced group is reaching a certain level of saturation, the laggard are catching up in relative terms.
The rapid proliferation of the mobile phone (e.g. Waverman, Meschi and Fuss, 2005; Castells, et al.,
2009) is often taken as the epitome of (almost) “universal access”. The mobile phone can be considered to
be the fastest diffusing technology of human history to date, having reached 9 out of 10 people worldwide
in less than two decades (ITU, 2012).
The second question emphasizes that potential access is necessary, but not sufficient, and demands
the effective usage of the technology as an integral part of the digital divide. Explaining the step from
access to usage requires complementary factors, which include skills and capabilities, cultural attitudes,
strategic choices, the institutional environment, and social reorganization, among others (e.g.
Brynjolfsson and Hitt, 1995; Hargittai, 2002; Mossberger, Tolbert and Stansbury, 2003; DiMaggio,
Hargittai, Celeste and Shafer, 2004; Perez, 2004; Warschauer, 2004; van Dijk, 2005; Buente and Robbin
2008; Robinson, 2009). Empirical results confirm a decisive usage divide on top of differential access
(Hargittai and Hinnant, 2008) and nowadays official statistical institutes around the world have
recognized the difference between access and usage in their household questionnaires (Partnership, 2008).
Finally, even equality in usage does not automatically lead to more or less social equality. On the one
hand, some groups of society might still be able to benefit more from these technologies than others.
Social scholars since the Frankfurt school have notoriously seen communication technologies as “as
weapons of total war” (Waples, 1942: 907) and another tool of mass deception and Orwellian-like social
control (Brecht, 1932; Enzensberger, 1970; Horkheimer and Adorno, 2002). This implies dominance and
therefore an increasing social divide as the result of the social impact of ICT. On the other hand, a
considerable body of literature from across the social sciences has provided evidence that ICT lead to
social, economic and political empowerment, collaboration, and convergence (e.g. Rosenblat and Mobius,
2004; Jensen, 2007; Peres and Hilbert, 2010; Allagui and Kuebler, 2011; Hilbert, 2011b; Klein, 2012).
A step-by-step approach to social embeddedness
In this article we propose to start using direct measures of communication capacity (e.g. measured in
kbps) in all three levels of ICT access, usage and impact. We will show examples for each case. We will
start with focusing on the access level of the digital divide. The adequate assessment of this level is of
outmost theoretical importance because the technological means inevitably frame and influence any
analysis of the social ends. We provide first time empirical evidence about the role of the digital age in
the progression of inequality of the installed information capacity (a) among devices, (b) among
countries, (c) among the global population, and (d) within countries. We find that traditional proxies of
the access divide do not adequately reflect the evolution of inequality of the installed information and
communication capacities. Following a step-by-step approach to social embeddedness of ICT, we then
show how we can integrate the newly proposed conceptualization of access capacity into a more solid
analysis of effective usage and social impact.
Technological information inequality Hilbert, JASIST 2013
4
Method: How to Measure the Digital Divide?
Traditional proxies and their shortcomings
Traditionally studies try to settle the question about the level of inequality in our technological
capacities to handle information by assessing the access, usage or impact of the number of installed
technological devices (Burgees, 1928, 1929, 1930; Waples, 1942; Cadwallader, 1959; Hardy, 1980;
Duttaet al., 2006; ITU, 2012) or the amount of related investments (Jorgenson, et al., 2008). In both cases,
a certain level of saturation is increasingly being reached. Many countries around the world have more
active mobile phone subscriptions than inhabitants (ITU, 2012) and the amount of ICT spending per
capita also seems to reach a plateau.1 However, this does not necessarily imply an accompanying level of
saturation in the amount of information a person handles. Technological change in the digital age is not
only driven by more, but also by better technology (Hilbert, forthcoming). As it turns out, more and better
are not consistently correlated in the case of ICT.
While the number of telecom subscribers per capita grew at a compound annual growth rate of some
11 % for the 25 years between 1986 and 2010, the average telecommunication capacity per capita (in
optimally compressed bits per second) has grown almost three times faster, with a compound annual
growth rate of 31 % per year (see Supplementary Figures S-A.1 and S-A.5). The performance per device
has grown faster than the diffusion of devices. This potentially leads to an inequality in information
capacity even with an impressively swift diffusion of ICT devices. The fact that the world got swamped
with internet subscriptions and mobile phones does not necessarily mean that equality in informational
capacities has increased worldwide, since inequality is a relative, not an absolute measure. Even if
everybody advances (e.g. has a short-message enabled mobile phone), some can advance even more than
others (e.g. already have an internet enabled smart phone and a fiber-optic connection), potentially
increasing relative inequality on basis of a continuously increasing absolute level of connectivity (more
for everybody in absolute terms, but unequal among everybody in relative terms).
This shows that in reality the digital divide is not a binary black or white question, but rather a
continuum of shades of grey between different levels of connectivity. By 2011, 86 % of human kind
already maintains a minimum connectivity to the digital realm through a short-message-service (SMS)
enabled mobile phone (ITU, 2012), which transmits some 14 kbps, while at the same time the average
connectivity among inhabitants of developed countries almost reaches 4,000 kbps (see Supplementary
Table S.A.-3; also Hilbert, López & Vasquez, 2010). Technological progress is a moving target, and in
the case of digital technologies, this target moves at an extraordinary speed.
The actual flow and capacity of information is not usually used as the key variable to assess the
respective infrastructure, with the exception of some notable studies that focus on one single technology,
such as international Internet bandwidth (Barnett, Chon & Rosen, 2001; Seo & Thorson, 2011) or fixed-
line telephony traffic (Monge & Matei, 2004; Lee, Monge, Bar & Matei, 2007). Only a handful of
pioneering studies have started to directly quantify the overall amount of information handled by the
(more or less complete) total stock of ICT (Ito, 1981; Pool, 1983; Lyman, et al., 2003; Bohn & Short,
2009; Hilbert & López, 2011; for an overview see Hilbert, 2012), but these studies have not yet
thoroughly investigated the question of informational equality. This study fills this gap, and as we will
see, with data reaching until 2010, in a timely manner.

Technological information inequality Hilbert, JASIST 2013
5
Measuring technological information capacity directly
One of the main reasons why analysts have been slow in measuring the capacity instead of simply
counting the number of devices is not a lack of theoretical understanding of the difference2, but simply
data availability. For the present study we created a unique and original database that takes inventory of
the world’s technological capacity to communicate, store, and compute information (measured in
optimally compressed bits per second, optimally compressed bits, and instructions per second) (see also
Hilbert & López, 2011). We base our estimations on more than 1,100 different sources from international
organizations (such as UPU, 2007; ITU, 2012), individuals with academic and commercial and
backgrounds (such as McCallum, 2002; Porter, 2005), statistics from private research firms (IDC, 2008),
and many sales and product specifications from technology producers (see also Supplementary
Information). For example, for broadband speeds we consult NetIndex (Ookla, 2011), which has gathered
the result of end-user initiated bandwidth velocity tests per country per day over recent years (through
Speedtest.net and Pingtest.net, e.g. an average 180,000 test per day in 2010). It has been attested to be
“the best of the currently available data sources for assessing the speed of ISP's broadband access service”
(Bauer, Clark & Lehr, 2010;. p. 3). We present our sources and explain our assumptions in detail in
almost 300 pages of methodological notes on our database (López & Hilbert, 2012; Hilbert & López,
2012a, 2012b).
We define information and communication technologies (ICTs) in the true sense of the term as all
kinds of tools that technologically mediate information and communication, that is, store information
through time, transmit information through space, or transform/compute information, be it in analog or
digital form. We measure the total technological capacity as the sum of the products of the number of
installed devices and their respective performances as yearly averages:
∑ ([ ] [ ])
We cover three main groups g of technologies (telecommunication, storage, and computation), which
consist of the 49 most common technologies t in both analog and digital formats, and are able to
distinguish between 261 tkyu subtypes of technologies with different performances for a given year (66 for
computation, 172 for storage, and 23 for telecom, see Supplementary Table S-A.1 and S-A.2).
For the case of computation we include the 6 most popular kinds of general-purpose computers and
measure the performance in installed hardware capacity in MIPS (million instructions per second). This
implies that we consider the installed capacity of the devices (without considering their effective use) (see
Hilbert & López, 2012a).
For the case of storage we include 12 analog and 13 digital storage technologies. We again measure
the installed capacity (acting as if it all analog and digital storage space ‘was filled up completely’). We
normalize the hardware performance on compression rates, measuring what we call optimally compressed

Technological information inequality Hilbert, JASIST 2013
6
information, not merely the capacity of the hardware to store data compressed to an arbitrarily degree
(Hilbert & López, 2012b). The optimal level of compression approaches the entropy of the source (in
Shannon’s (1948) information theoretic sense). For the estimation of compression rates of different
content we elaborate justifiable estimates for the years 1986, 1993, 2000, and 2007 and interpolate
linearly in between (see Supplementary Information, also López & Hilbert, 2012).
For the case of telecommunication we include the 2 most common analog technologies (fixed and
mobile telephony) and their 4 most widely used digital heirs (fixed and mobile phone and Internet). In
Figure 1 we measure effective usage capacity in optimally compressed bits per second, which means that
we normalize on compression rates and consider only those bits that are effectively transmitted. In the
following Figures 2 – 5 we focus on mere access potential and measure the installed capacity, or installed
bandwidth potential in optimally compressed bits per second. For the purposes of our relative
comparisons this is effectively equivalent with the assumption that all countries and individuals use their
technologies with the same intensity.
Concentration among devices
We start with a two-dimensional analysis of the relation between the two main indicators that we just
discussed: number of subscriptions and their informational performance (no people or social entities
involved for now). Has the heterogeneous performance of ICT devices become more uniform or more
unequal?
We use the Gini coefficient (Gini, 1921) to test for the concentration and inequality.3 While there are
other measures of inequality (e.g. Shannon/Boltzmann entropy, Simpson’s Index, Herfindahl-Hirschman
Index, etc., see Stirling, 2007), Gini’s measure is adequate because it allows us to take account of two
dimensions (diffusion and performance).
Figure 1 shows that performance difference among ICT devices has increased during the transition
from the “analogue age” to the “digital age”.4 This provides first-time large-scale empirical evidence to
confirm the long-standing vision of industry leaders that the world’s information storage and processing
power is increasingly being concentrated in the so-called “information cloud” (WEF, 2010). Driven by
economic incentives such as economies of scale and short product lifecycles (Shapiro & Varian, 1998), a
smaller group of high performance devices captures a much larger share of the global informational
capacity than before the digital age.
Figure 1 also shows that the transition from the analog to the digital age was characterized by periods
of slightly varying levels of concentration among devices. The process does not follow a monotonic and
linear path. The particular patterns of technological evolution and dissemination are obviously influenced
by a myriad of social, economic, political, and cultural considerations (as discussed above).
Notwithstanding this social complexity, the general tendency of increasing concentration of performance
among devices between the “pre-digital-” and “digital age” remains as a detectable macro pattern. In the
digital age, a smaller share of high performance devices captures a larger share of the global information
and communication capacity.

Technological information inequality Hilbert, JASIST 2013
7
Figure 1: Gini coefficient between the number of devices and their performance. The Gini coefficient is normalized between 0 (maximal equality) and 1 (maximal inequality). Our analysis
is binned by tkyu subgroups, 1986 – 2007. Computation and storage measures the installed capacity and telecommunication measures the effective usage capacity.
Access Divide
The condition sine qua non to convert this highly concentrated information capacity among devices
(“the cloud”) into a democratized information capacity among and within societies lies in the social
ownership of telecommunication access. Even if information storage and computational power is highly
concentrated among devices, these resources could be highly democratized among users who access them
through decentralized telecommunication networks. Telecom access is the necessary (but not sufficient)
condition to provide a large number of people with access to this concentrated storage and computation
capacity from a distance through ever increasing bandwidth in real-time. In the following we therefore
concentrate on an analysis of the levels of concentration of telecommunication capacities among
countries, and later, among people worldwide, and within countries.
Concentration among countries
For the assessment of the international digital divide we measure the installed telecommunication
bandwidth potential (Hilbert & López, 2012a, also referred to as “subscribed capacity” or “subscribed
bandwidth potential”, ITU, 2012, Ch.5) of fixed and mobile voice telephony (analog and digital), and
mobile data and fixed Internet services for a sample of 171 countries, representing 97 % of the world
population.

Technological information inequality Hilbert, JASIST 2013
8
Divide between developed and developing countries
On the one hand, our data reconfirm an impressive increase in the absolute level of technologically
mediated communication capacity. For example, the combined fixed and mobile telecommunication
capacity of the average inhabitant of the developed (OECD) countries experienced an increase from 50
kbps in 2001, over 720 kbps in 2006, to some 3,700 kbps per capita in 2010 (Table S-A 3). Even the
capacity of the average inhabitant of developing (non-OECD) countries has increased from 5.7 kbps in
2001, to 50 kbps in 2006, to 500 kbps in 2010 (see Supplementary Information Table S-A 3). On the
other hand, comparing OECD and non-OECD, we do not see a monotonic tendency in relative terms:
50:5.7 = 8.8 in 2001; 720:50 = 14.4 in 2006 (divide widened in relative terms); and 3,700:500 = 7.4 in
2010 (divide narrowed in relative terms).
At the same time, the increasing absolute mean levels went along with an increase in variance around
the mean. As a result, the communication differential has also widened in absolute terms. In 2001 the
average inhabitant of the developed world had some 45 kbps more telecommunication capacity than its
peer from the developing world (50 kbps -5.7 kbps), while this difference increased to 3,200 kbps a
decade later (3,700 kbps – 500 kbps) (see Supplementary Information Table S-A 3 and Figure S-A.9; also
Hilbert, López & Vasquez, 2010). These increasing absolute levels of deviation are a natural statistical
phenomenon that results from the increased mean levels. Supplementary Information Figure S-A 10
shows that the mean-normalized coefficient of variation of telecommunication capacity per capita among
countries (which is often used as a measure of inequality) has stayed predictably constant over the same
period (1.8 times the mean for both, 1986 and 2010). This implies that absolute increases in mean levels
amplified variation around the mean in absolute terms, but that these deviations stayed fairly constant in
relative terms. This was statistically to be expected, but in fact leads to an increasing differential in
telecom capacity in absolute terms.
Figure 2 illustrates the global share of telecommunication capacity, divided into different groups of
more and less developed groupings of countries. The Figure shows a clear convergence in
telecommunication capacity between countries that have traditionally dominated the global
communication landscape (such as the member countries of the G75 and the OECD
6) and the rest of the
“developing world”. While the number of telecommunication subscriptions is quickly aligning with “real-
world” population proportions (mainly driven by mobile phones) (see triangles and x-symbols in Figure
2), the divide in terms of telecommunication capacity (in optimally compressed kbps) is characterized by
some technological shocks. This reconfirms once more that the number of subscriptions has its limitations
when used as a proxy for the informational capacity of a society. The theoretical reason behind the
fluctuations in the communication capacity is the fact that each new innovation reopens the divide as the
diffusion process starts again. For example, the introduction of broadband technologies (fixed-line:
Digital-Subscriber-Line (DSL), cable-modem, and fiber-optics FTTH/B; and mobile: 2.5G and 3G) first
increased inequality between 2002 and 2006, and once the inflection point in the S-shaped logistic
diffusion curve was reached, bandwidth inequality decreased quickly. It is interesting to note that the
most dramatic decrease of inequality just happened very recently: just during the period from 2006 to
2010 the dominance of the OECD in terms of communication capacity decreased from 76 % (same as in
1986) to 62 %, its lowest level during the past quarter century.

Technological information inequality Hilbert, JASIST 2013
9
Figure 2: Different patterns of the international digital divide among groups of countries. Share of a group of indicated countries as a percentage of the global total. Kbps capacity is measured in optimally compressed bits of installed bandwidth potential. The G7 is a group
considered to consists of seven “highly developed” countries5, the OECD of a group of (self-proclaimed) “industrialized” countries6, so-called “BRIC” countries include Brazil, Russia, India,
and China and the so-called “Asian Tigers” are Hong Kong, South Korea, Singapore, Taiwan.
Overall we detect a general tendency of convergence in capacity (circles in Figure 2), but one that is
quite different from the smooth and monotonically decreasing inequality in terms of subscriptions
(triangles in Figure 2). Figure 2 also shows that his more recent redistribution of communication capacity
is accompanied by a (somewhat lagging) redistribution of economic wealth (measured in Gross National
Income, GNI) (crossed squares in Figure 2). We will come back to the relation between income and
communication capacity in the later section on impact.
Notwithstanding, Figure 2 also shows that only a small group of developing countries accomplished
a significant catch-up, among them the a group of very populous countries (the so-called “BRIC”: Brazil,
Russia, India, and China) and a handful of small Asian countries (the so-called “Asian Tigers”: Hong
Kong, South Korea, Singapore, Taiwan), with the remaining 156 countries of our sample and shows that
this reminder has not gained nor lost ground, capturing a quite constant 25% of the world’s
telecommunication capacity (see small empty circles In Figure 2, see also Supplementary Fig. S.-A.11
and S.-A.12, and S.A-14).
Technological information inequality Hilbert, JASIST 2013
10
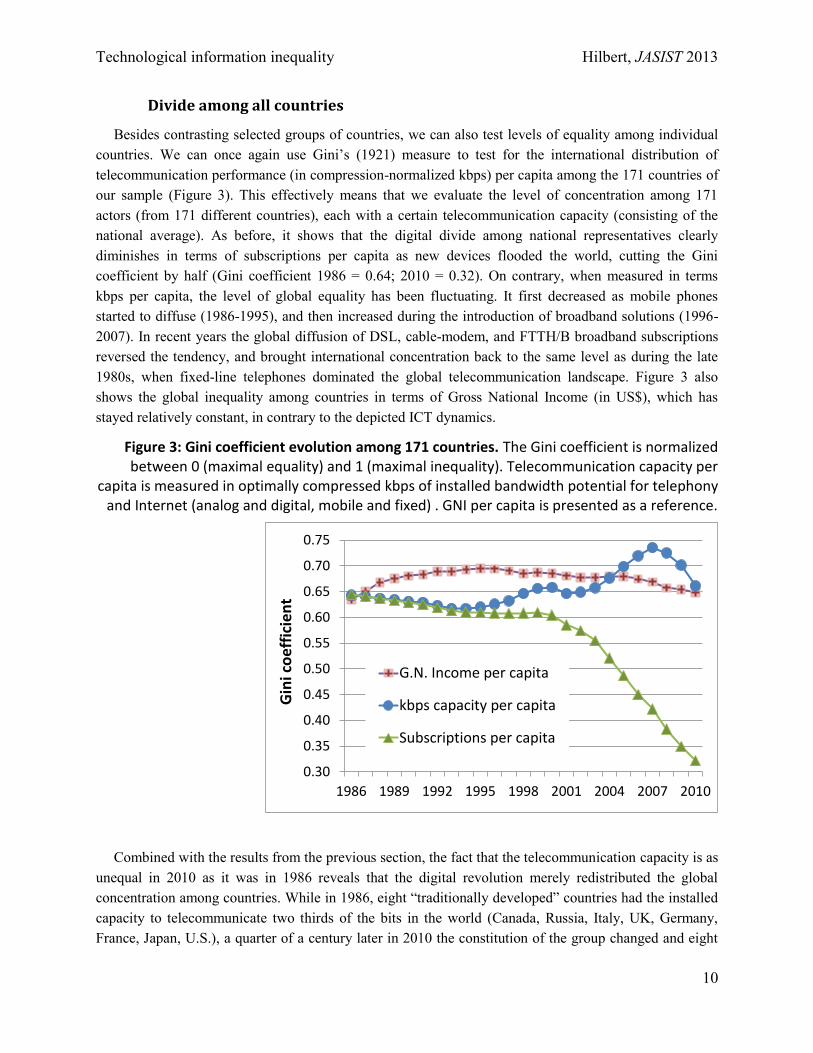
Divide among all countries
Besides contrasting selected groups of countries, we can also test levels of equality among individual
countries. We can once again use Gini’s (1921) measure to test for the international distribution of
telecommunication performance (in compression-normalized kbps) per capita among the 171 countries of
our sample (Figure 3). This effectively means that we evaluate the level of concentration among 171
actors (from 171 different countries), each with a certain telecommunication capacity (consisting of the
national average). As before, it shows that the digital divide among national representatives clearly
diminishes in terms of subscriptions per capita as new devices flooded the world, cutting the Gini
coefficient by half (Gini coefficient 1986 = 0.64; 2010 = 0.32). On contrary, when measured in terms
kbps per capita, the level of global equality has been fluctuating. It first decreased as mobile phones
started to diffuse (1986-1995), and then increased during the introduction of broadband solutions (1996-
2007). In recent years the global diffusion of DSL, cable-modem, and FTTH/B broadband subscriptions
reversed the tendency, and brought international concentration back to the same level as during the late
1980s, when fixed-line telephones dominated the global telecommunication landscape. Figure 3 also
shows the global inequality among countries in terms of Gross National Income (in US$), which has
stayed relatively constant, in contrary to the depicted ICT dynamics.
Figure 3: Gini coefficient evolution among 171 countries. The Gini coefficient is normalized between 0 (maximal equality) and 1 (maximal inequality). Telecommunication capacity per
capita is measured in optimally compressed kbps of installed bandwidth potential for telephony and Internet (analog and digital, mobile and fixed) . GNI per capita is presented as a reference.
Combined with the results from the previous section, the fact that the telecommunication capacity is as
unequal in 2010 as it was in 1986 reveals that the digital revolution merely redistributed the global
concentration among countries. While in 1986, eight “traditionally developed” countries had the installed
capacity to telecommunicate two thirds of the bits in the world (Canada, Russia, Italy, UK, Germany,
France, Japan, U.S.), a quarter of a century later in 2010 the constitution of the group changed and eight
0.30
0.35
0.40
0.45
0.50
0.55
0.60
0.65
0.70
0.75
1986 1989 1992 1995 1998 2001 2004 2007 2010
Gin
i co
eff
icie
nt
G.N. Income per capita
kbps capacity per capita
Subscriptions per capita

Technological information inequality Hilbert, JASIST 2013
11
different countries reached the same level of concentration (Canada, Italy, and UK have been replaced by
India, South Korea, and China).
Figure 4 opens up the conglomerate total for 2010 and displays the 100 countries with the largest
telecom capacity among the two main axis of this analysis: telecom subscriptions per capita (horizontal x-
axis) versus the installed bandwidth potential in optimally compressed kbps (vertical y-axis). The figure
shows clearly that there is no simple linear relationship between the number of devices and the respective
installed telecommunication capacity. In general, the number of subscriptions seems to hit a certain level
of saturation at around 2 – 2.5 devices per capita. Despite this, the telecommunication capacity continues
to grow and even to accelerate: the compound annual growth rate of the installed kbps capacity per capita
between 1986 and 1994 was 7 %, 27 % between 1994 and 2002, and between 2002 and 2010 even 66 %.
In contrary, the growth rate of worldwide telecom subscribers for the same periods was 7 %, then 17 %,
and then slowing down to 13.5 % during 2002 and 2010.
Figure 4: Subscriptions per capita vs. Capacity per capita (in optimally compressed kbps of installed capacity) for 2010. Size of the bubbles represents Gross National Income (GNI) per
capita (N = 100). Note: checkered bubbles identify members of the OECD
The size of the bubbles in Figure 4 represents income (GNI) per capita and shows that both more and
better technology is related to more income. However, there are some decisive differences. For example,

Technological information inequality Hilbert, JASIST 2013
12
both Croatia and the Slovak Republic have roughly the same installed telecom capacity per capita, while
Croatia has almost twice as many telecom subscribers. At the same time, Croatia and Russia have roughly
the same number of devices, but Russia counts with more than twice the telecom capacity per capita.
Interestingly, the Slovak Republic has the highest income level of the three, followed by Croatia and then
Russia (which, despite its geography and relatively low income level, already counts with some 3 million
fiber optics FTTH/B subscriptions in 2010). More communication technology and better communication
technology and resource availability are different questions and each has its own dynamic.
Figure 4 also reveals several countries with outstanding telecommunication capacities, among them,
Republic of Korea, Japan, Sweden and the Netherlands, but also some developing countries, such as
Lithuania and Latvia. Both South Korea and Japan have a fiber optics FTTH/B penetration of over 15 %
in 2010 and Lithuania almost 10 %. A vibrant fiber optic infrastructure is becoming an important driver of
overall telecommunication capacity.
A series of high-level tests about the correlations between income and population and the number of
subscribers and telecom capacity reveals an important change in these relations since the beginning of the
digital age (Table 1). During the 1980s the number of subscribers and telecom capacity hardly differed,
because the global stock of telecom basically consisted of fixed-line telephone with a homogenous
performance level (correlation coefficient R between subscribers per country and capacity per country =
1.00). Income was highly correlated with the number of subscribers as well as with the capacity per
country (R = 0.99), while the population level of the country only weakly correlated with both (R = 0.22-
0.23) (see Table 1). This changed somewhat 12 years later in 1998, but not much. However, after mobile
phones and broadband internet subscriptions swapped the planet, the correlation between the number of
subscribers and the respective telecommunication capacity started to weaken (R = 0.75). In 2010, the
number of subscribers is highly correlated with the population level of a country (R = 0.92), while the
installed telecommunication capacity is much more strongly correlated with the available income in a
country (R = 0.87). This suggests that the digital divide in terms of devices per capita is almost closed,
while the digital divide in terms of communicational capacity is still mirroring existing economic divides,
which are notoriously persistent.
Table 1: Correlation coefficients R between different combinations of telecom
measures among 171 countries (representing 97 % of the world population).
1986 1998 2010
Population Income Population Income Population Income
Subscribers 0.22 0.99 0.44 0.97 0.92 0.69
Capacity 0.23 0.99 0.41 0.97 0.52 0.87
R(subscribers,capacity) 1.00 0.99 0.75
Technological information inequality Hilbert, JASIST 2013
13
Inequality among individuals
Let us know focus on the divide among individuals. While statistics about the individual ownership of
ICT has significantly improved over the recent decade (Katz and Rice, 2002; Partnership, 2008), there is
still a significant lack of internationally harmonized statistics that include the heterogeneous performance
of the technology. We therefore use a trick to test for the evolution of the level of access among people by
establishing an upper level of concentration (or a lower limit of equality) among “hypothetical users”.
This allows for a macro-level analysis of the general tendency without micro-level statistics.
We know that the diffusion of innovations (like ICT) follows an S-shaped curve that characterizes the
diffusion from innovators in the “center of innovation” to laggards in the “periphery of innovation” in a
society (see discussion above). For our assumption, it is not even necessary to know which variables
characterize the center, and which the periphery. We merely assume that the diffusion process follows
this well-known pattern from “center” to “periphery”.
We assume that a person can maximally possess three different kinds of subscriptions (Internet,
mobile phone, and fixed-line telephony) and that the first group of people in the “center of innovation”
possesses the highest performing subscriptions of all three kinds of technologies: the best available
Internet subscription, the best available mobile phone, and a fixed-line phone. The second group starts
where one of the devices is being replaced by the second highest performing device of the same kind, and
so forth (see Supplementary Information). Users from the lower end in the periphery can also own only
two or one subscriptions or none at all. While it can be expected that the results replicates reality quite
faithfully, this indicator is bias toward more concentration than there actually is. In reality one person
might possess a high performing internet connection but a low performing mobile phone, etc., which
lowers the existing level of inequality. This bias increases in later years with the diversity of existing
devices (the bias did not exist in the late 1980s at the time of exclusivity of uniformly performing fixed-
line phones). We will use the Gini coefficient which combines both, the number of subscriptions and the
performance of the subscriptions per individual (hypothetical) user.
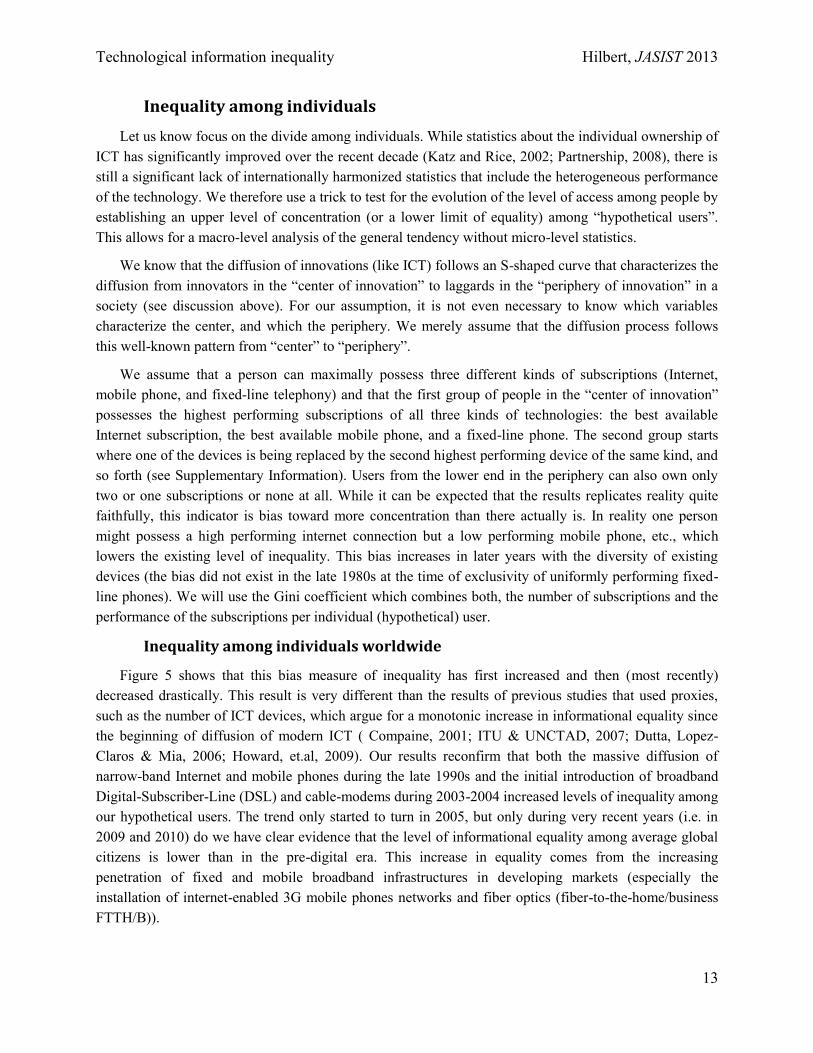
Inequality among individuals worldwide
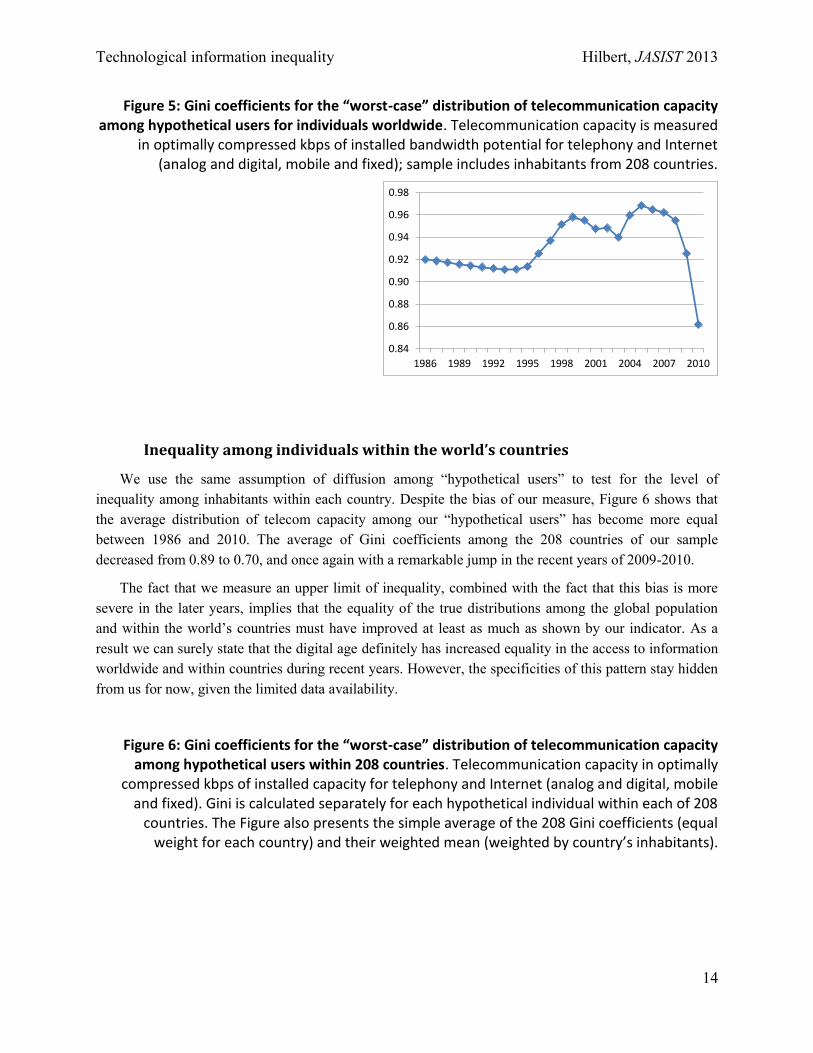
Figure 5 shows that this bias measure of inequality has first increased and then (most recently)
decreased drastically. This result is very different than the results of previous studies that used proxies,
such as the number of ICT devices, which argue for a monotonic increase in informational equality since
the beginning of diffusion of modern ICT ( Compaine, 2001; ITU & UNCTAD, 2007; Dutta, Lopez-
Claros & Mia, 2006; Howard, et.al, 2009). Our results reconfirm that both the massive diffusion of
narrow-band Internet and mobile phones during the late 1990s and the initial introduction of broadband
Digital-Subscriber-Line (DSL) and cable-modems during 2003-2004 increased levels of inequality among
our hypothetical users. The trend only started to turn in 2005, but only during very recent years (i.e. in
2009 and 2010) do we have clear evidence that the level of informational equality among average global
citizens is lower than in the pre-digital era. This increase in equality comes from the increasing
penetration of fixed and mobile broadband infrastructures in developing markets (especially the
installation of internet-enabled 3G mobile phones networks and fiber optics (fiber-to-the-home/business
FTTH/B)).
Technological information inequality Hilbert, JASIST 2013
14
Figure 5: Gini coefficients for the “worst-case” distribution of telecommunication capacity among hypothetical users for individuals worldwide. Telecommunication capacity is measured
in optimally compressed kbps of installed bandwidth potential for telephony and Internet (analog and digital, mobile and fixed); sample includes inhabitants from 208 countries.
Inequality among individuals within the world’s countries
We use the same assumption of diffusion among “hypothetical users” to test for the level of
inequality among inhabitants within each country. Despite the bias of our measure, Figure 6 shows that
the average distribution of telecom capacity among our “hypothetical users” has become more equal
between 1986 and 2010. The average of Gini coefficients among the 208 countries of our sample
decreased from 0.89 to 0.70, and once again with a remarkable jump in the recent years of 2009-2010.
The fact that we measure an upper limit of inequality, combined with the fact that this bias is more
severe in the later years, implies that the equality of the true distributions among the global population
and within the world’s countries must have improved at least as much as shown by our indicator. As a
result we can surely state that the digital age definitely has increased equality in the access to information
worldwide and within countries during recent years. However, the specificities of this pattern stay hidden
from us for now, given the limited data availability.
Figure 6: Gini coefficients for the “worst-case” distribution of telecommunication capacity among hypothetical users within 208 countries. Telecommunication capacity in optimally
compressed kbps of installed capacity for telephony and Internet (analog and digital, mobile and fixed). Gini is calculated separately for each hypothetical individual within each of 208
countries. The Figure also presents the simple average of the 208 Gini coefficients (equal weight for each country) and their weighted mean (weighted by country’s inhabitants).
0.84
0.86
0.88
0.90
0.92
0.94
0.96
0.98
1986 1989 1992 1995 1998 2001 2004 2007 2010

Technological information inequality Hilbert, JASIST 2013
15
Usage Divide
The next step from access to impact is the effective usage of the installed capacity (Katz & Rice,
2002; Hargittai, 2002; DiMaggio, et al., 2004; Hargittai & Hinnant, 2008; Buente & Robbin 2008). This
perspective underlines that the digital divide is not “a problem of ownership of the technology than […] a
problem of developing a relationship with the technology” (Jung, Qiu & Kim, 2001, p. 514).
A traditional way of accessing this measure is to ask about the minutes spent for information or
communication consumption (Ito, 1981; Pool, 1983), but can be complemented with additional statistics
on and nature and intensity of usage (Jung, Qiu & Kim, 2001). Our direct measure of communication
suggests to fine-tune any consumption measure with the respective bits flow and to assess the information
intensity in terms of the actual traffic flow per time unit (Bohn & Short, 2009; Hilbert & López, 2012a).
While we were able to do this for the global information infrastructure (in Figure 1), unfortunately
internationally harmonized indicators on effective ICT usage do not yet exist for different countries at a
large scale (even so considerable efforts are underway, see Partnership, 2008). For now, we therefore
need to approximate the actual usage of the installed capacity from a macro-perspective.
We know that the available income and ICT prices are two of the main impediment in the step from
access to usage (Katz & Rice, 2002; Hilbert, 2010; 2011a; 2011b). This allows us to approximate the
effective usage by normalizing on the price of ICT and the available income in each country in 2008 and
2010 (a kind of purchasing power parity measure for bandwidth). This assumes that the same amount of
installed capacity is effectively more used if the price/income relation of actual traffic / bit flows is lower.
In practice we normalize the installed capacity on the “ICT Price basket” of the International
0
0.2
0.4
0.6
0.8
1
208 countries, ranked from lowest (most equal) to highest Gini (most unequal)
Gini coefficients 1986
Gini coefficients 2010
Average of Gini coefficients 1986
Average of Gini coefficients 20100.65
0.70
0.75
0.80
0.85
0.90
0.95
1986 1992 1998 2004 2010
Weighted mean of Gini coefficients
Simple average of Gini coefficients
Technological information inequality Hilbert, JASIST 2013
16
Telecommunication Union (ITU) of the United Nations (ITU, 2012), which exists for all countries for the
years 2008 and 2010.7 The index tracks tariff sets for a fixed-line telephone sub-basket a mobile phone
sub-basket; and a fixed-broadband sub-basket (in minutes and bits of traffic). The costs of several selected
services are expressed as a percentage of the available Gross National Income per capita (capped at a
maximum of 100% of income). This normalization represents purchasing parity of the respective services
(also Hilbert, 2011c).
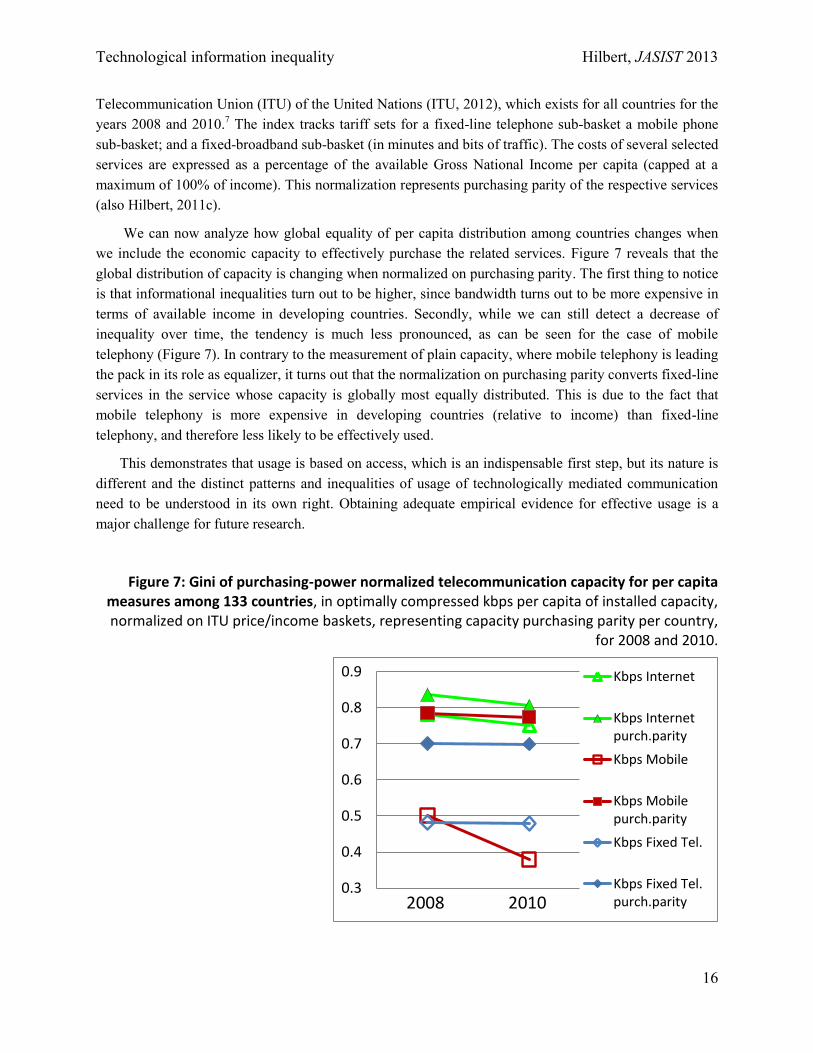
We can now analyze how global equality of per capita distribution among countries changes when
we include the economic capacity to effectively purchase the related services. Figure 7 reveals that the
global distribution of capacity is changing when normalized on purchasing parity. The first thing to notice
is that informational inequalities turn out to be higher, since bandwidth turns out to be more expensive in
terms of available income in developing countries. Secondly, while we can still detect a decrease of
inequality over time, the tendency is much less pronounced, as can be seen for the case of mobile
telephony (Figure 7). In contrary to the measurement of plain capacity, where mobile telephony is leading
the pack in its role as equalizer, it turns out that the normalization on purchasing parity converts fixed-line
services in the service whose capacity is globally most equally distributed. This is due to the fact that
mobile telephony is more expensive in developing countries (relative to income) than fixed-line
telephony, and therefore less likely to be effectively used.
This demonstrates that usage is based on access, which is an indispensable first step, but its nature is
different and the distinct patterns and inequalities of usage of technologically mediated communication
need to be understood in its own right. Obtaining adequate empirical evidence for effective usage is a
major challenge for future research.
Figure 7: Gini of purchasing-power normalized telecommunication capacity for per capita measures among 133 countries, in optimally compressed kbps per capita of installed capacity, normalized on ITU price/income baskets, representing capacity purchasing parity per country,
for 2008 and 2010.
0.3
0.4
0.5
0.6
0.7
0.8
0.9
2007 2008 2009 2010 2011
Kbps Internet
Kbps Internetpurch.parity
Kbps Mobile
Kbps Mobilepurch.parity
Kbps Fixed Tel.
Kbps Fixed Tel.purch.parity2008 2010
Technological information inequality Hilbert, JASIST 2013
17
Impact Divide
We now finally come back to the question of the impact of technologically mediated communication.
Of course, the first question here is: impact on what? Per definition, a general-purpose technology like
ICT affects all aspects of human conduct (Perez, 2004; Hilbert, 2011a), which gives us the free choice for
the area of impact. Independent from the chosen area of impact, the chosen impact indicator should be
assessed in combination with a direct measure of the information and communication capacity. While the
impact and the flow of information are different variables, the assessment of the first requires the second:
[impact] per [unit of information].
This calls for using direct information measures as an integral component of more sophisticated
measures, such as [US$/kbps] or [kbps/US$]. More elaborate indexes and models can even integrate an
arbitrary combination of these variables with communication capacity, just as economist have come up
with a myriad of ways to evaluate the impact of monetary currency with a society. In the statistical
analysis of economics the unifying metric is naturally $, while in the statistical analysis of technologically
mediated communication the unifying metric is naturally the bit.
For illustrative purposes, Figure 8 displays several indicators of different aspects of social impact that
incorporate telecommunication capacity in kbps. The Figure shows again Gini’s (1921) coefficient of
inequality among countries. The first indicator normalizes the installed communication capacity of a
country on the available income (GNI). The indicator [kbps/US$] gives insights into how efficiently an
economy puts its available resources to work for technological communication. The respective trajectory
shows that during the period when mobile phones started to dominate the communication landscape,
income levels started to loose importance, while the introduction of advanced broadband solutions (after
2003) reestablished the importance of GNI, returning it to the same level as in the late 1980s (Gini of
0.45). This suggests that the economic possibilities of some countries had a much more decisive impact
on fostering telecom capacity than others, especially since the beginning of the broadband revolution.
Technologically mediated communication has also an impact on many other aspects of social life. For
example, a larger communication capacity can make the difference between life and death in the case of
disaster management (Sellnow, Seeger & Ulmer, 2001). Figure 8 shows international inequality of
technological communication capacity with respect to the number of disasters, which provides insight into
the communicative preparedness of a society in the event of a natural or human disaster. We can also
apply the indicator to the firm level or any other organizational unit, or social agent. As examples Figure
8 shows the communication capacity per internationally registered NGO in a country, which is an
indicator for the communicational capacity of civil society; as well as the national communication
capacity relative to the proportion of seats held by women in national parliaments, which can be used as
an indicator in the analysis of the political and social influence of women. Since it is claimed that ICT
play an important role in strengthening the institutions of civil society, democracy, civil liberty and
gender equality (e.g. Hilbert, 2009; 2011b), this indicator can be used to test related hypotheses (see
Figure 8).

Technological information inequality Hilbert, JASIST 2013
18
Figure 8: Gini’s coefficient for several alternative measures of the communication inequality among n countries. In optimally compressed kbps for installed telecommunication capacity.
Based on authors’ own elaboration and CRED (2010), UNDP (2010); Anheier, Glasius and Kaldor (2004); World Bank (2010).
Communication capacity can also be used as the conditioning variable for variables of social impact.
We can for example ask about the level of human capital given the installed technological communication
capacity. Figure 8 shows that the inequality in the number of school years completed by an adult per
installed kbps among 136 countries increased since the beginning of the digital age. This means that some
countries have increasingly better human capital per bit communicated than others. Human capacity per
unit of communication can be an important indicator for knowledge-based activities.
Figure 8 also shows the evolution of service export and import per kbps communication capacity in
general, and of communication and computer service expert and import in specific (all in US$). These
measures track how the available communication capacity relates to the international trade of tradable
services (many of which are nowadays digitized). It shows that some the trade concentration of
communication and computer services per kbps stayed quite constant, while some countries have made
much better use of their installed telecommunication infrastructure than others for general trade of all
kinds of services.
These are merely some illustrative examples aimed at pointing at potential kinds of questions that can
be analyzed on the basis of the methodology and statistics presented in this article. It is certainly beyond
the scope of this article to analyze each of them in detail. ICT (as all other technologies) are socially
shaped and socially embedded and their ultimate social impact depends on a wide variety of factors that
shape the particular application and general institutionalization of our tools in different areas (Williams &
Edge, 1996; DiMaggio, et al., 2001; Perez, 2004). The deliberately diverse examples of Figure 8 show
0.3
0.4
0.5
0.6
0.7
0.8
0.9
1986 1989 1992 1995 1998 2001 2004 2007 2010
[kbps] per [US$ GNI](n=172)
[kbps] per [disaster](n=88-134)
[kbps] per [% of women inparliament] (n=68)
[kbps] per [international registeredNGO] (n=137)
[school year completed] per [kbps](n=136)
[service export] per [kbps](n=129)
[ service import] per [kbps](n=129)
[communication & computerservice export] per [kbps] (n=129)
[communication & computerservice import] per [kbps] (n=129)

Technological information inequality Hilbert, JASIST 2013
19
that there are decisive differences in the level of “productivity” with which different societies put digital
communication flows to work. The same technological input does not automatically imply the same
social output. However, there might be common patterns. For example, it is frequently hypothesized that
there are marginally decreasing returns to the amount of information and that at one point, more
information is actually counter-productive (the so-called information overload). The nature of this curve
is however not yet empirically tested (simply because we have not yet started to measure information
flows directly in bits and bytes). So until now, the information overload is merely a well-established
hypothesis. The direct information metrics proposed in this article allow for analyzing the exact nature of
this and related phenomena: how many and which kinds of bits represent an “overload”?
Of course, these and other indicators can also be used as independent variables in other statistical or
econometric impact studies in future research (such as Hardy, 1980; Waverman, et al., 2005, etc.).
Additionally, different attributes of communication capacity can be distinguished and analyzed for
differential impact. For example, mobile or fixed kbps might not have the same impact; individual or
shared access can lead to different outcomes, always-on or sporadic information flows can have dissimilar
results, independent from the same amount of information flow, etc.. These are empirical questions that
are yet to be determined.
These examples underline the general idea: if we are to deepen our understanding of the social impact
of technologically mediated information and communication in society, we have to start by measuring the
amount of information that a society handles directly. Similarly to the myriad of other socio-economic
measures of social development and freedom, there is surely no one-size-fits-all indicator that captures all
aspects of a society’s communication capacity. But (conceptually quite similar to the economic capacity
of a society measured in $), the communication capacity of a society measured in bits is flexible and solid
enough to serve as an input to inform the most diverse models and policy aspirations.
Conclusion: A Moving Target
Our results leave us with a more complex, but a more detailed understanding of the effects the digital
age has on the distribution of the world’s technological capacity to communicate, store and compute
information. These findings have both practical and theoretical/methodological implications for the
conceptualization of the access, use and social impact of technologically mediated information and
communication.
On the practical side, we can see a certain level of urgency to go beyond mere inventories of the
numbers of technological devices, and start measuring technological capacity. With almost 90 % of the
people around the world having access to telecommunication (at least through a mobile phone), ICT have
become more universal than for example electricity (the global electricity penetration is 78 % in 2010,
World Bank, 2011). This has led to a remarkable increase of per capita communication capacity
worldwide and has opened up a world of opportunities for many for the first time. It is even more
important because we saw empirical evidence that the dawn of the digital age has concentrated
technological informational power among different devices in the so-called “information cloud”.
Telecommunication capacity becomes the necessary gateway to potentially access this concentrated
information storage and computation capacity. At the same time, we have shown that this increase in

Technological information inequality Hilbert, JASIST 2013
20
absolute levels did not immediately lead to a decrease in informational inequality among people. ‘More’
is an absolute and ‘more equal’ a relative measure. Our results reconfirm that there was no monotonic
transition toward more equality. We saw that the installed telecommunication capacity has first increased
among individuals worldwide and only very recently (2006-2010) reversed this trend and become more
equal on the global level and within countries.
This does not imply that this issue is solved. The opposite is the case. The evidence that the level of
informational inequality only started to decrease very recently (2006-2010) suggests that an important
part of the far-reaching social-, economic-, cultural-, and political transformations of the information
revolution are yet to come and require research attention. This laggard effect was to be expected and
follows a well-documented pattern of previous general-purpose technologies (Freeman & Louçã, 2002).
The introduction of electricity or the automobile, for example, first increased inequality among nations
and individuals, and then, once the technology matured, its innovation cycles slowed, and complementary
infrastructures got into place, social inequalities in electric power and mobility started to decrease (David,
1990). We seem to have recently reached such a level of maturity with the general-purpose technology
called ICT as the empirical evidence in this article suggests that inequality has lately started to decrease.
The analogy with previous general-purpose technologies, combined with the evidence from this
article, shows that despite maturity, the divide will not go away. Rather it will become a continuously
moving target. Even 125 years after the introduction of the automobile in society, there is no equality in
terms of motorized mobility. On the contrary, an entire supporting mechanism of continuously supported
public transportation and an entire symbolic universe of social status have emerged around the car. The
unceasing evolution of technology (Arthur, 2009) creates a perpetual gradient among those how have
more, and those who have less capacity to access, use and obtain impact from ICT. This gradient will
morph through different stages and shapes, be more or less concentrated among different leading and
lagging countries and groups of society, and have differential social impacts. Similar to the history of
inequality in social mobility, technological information inequality is becoming a constant structural
characteristic of our societies.
This implies that we have now moved into a second, more mature, and also more persistent stage of
the digital divide. The first phase consisted of a universalization of the required technological
infrastructure. The second stage consists of an endlessly evolving inequality of technological capacity
based on this more and more universalized infrastructure.
The direct tracking of information and communication capacities, such as in bits per second, has the
benefit of being independent from the technological preference of different users and policy makers and is
a sustainable indicator over time to track this continuous evolution (even if the technology changes the
indicator stays the same). Concepts like the digital divide and digital poverty can therefore be defined in
terms of an absolute number, such as: “everybody with less than X kbps can be considered to live in
informational poverty”. This absolute level can and should of course be adjusted as the technological
frontier is moving ahead, similar to continuous adjustments of other aspects of social exclusion.
On the theoretical/methodological side, the present exercise shows that it is not only statistical
feasible, but also analytically insightful to measure technologically mediated information and
communication directly in bits and bytes. We spent the majority of our empirical analysis on access, and

Technological information inequality Hilbert, JASIST 2013
21
this is well justified. Any realistic assessment of social, cultural, economic, and political change by means
of ICT must include an adequate and solid analysis of the nature and distribution of the capacity of
technologically-mediated information. Mere access to infrastructure might not be sufficient, but it is a
condition sine qua non for any potential social impact. The underlying informational inequality within the
established infrastructure frames, percusses and reverberates throughout the additional levels of inequality
on the posterior levels of social usage and impact. Any thorough understanding of the “ambiguous mix of
effects” of ICT (Calhoun, 1998: 373) needs to be footed on a solid conceptual basis, especially since the
analysis of the social impacts of ICT has traditionally been full with “utopian claims and dystopic
warnings” (DiMaggio, et al., 2001: 307). The information bit offers itself as the natural unifying
ingredient for any analysis of technological information and communication, be it on the level of access,
usage, or impact.
We have shown that the kbps measure can readily be integrated in other multivariable measures of
usage and impact. Even more sophisticated measures of the digital divide combine several variables on
both usage and impact (for example, Jung, Qiu & Kim (2001) combine the time spent online, the number
of places where a person connects, the number of tasks carried out online, with subjective evaluations on
how connectivity affect personal life, among other variables). The installed communication capacity and
the amount of bits flowing can readily complement those multivariate measures in cases where those
additional data are available.
This leads to the final conclusion of this article: the (compression-normalized) informational bit is the
natural measure of choice to capture information and communication capacity and can serve as an integral
basis to study differential access, usage and social impact of ICT. This argument has not only theoretical
weight, but also practical urgency, since the digital divide is ever more independent of the number of
technological devices and subscriptions. Measuring information and communication capacity directly we
found that we can find ways to “bridge” or “level” the communication capacity divide to socially
acceptable degrees, but that the divide will never be “closed”. The divide in the technological information
and communication capacity of individuals, groups and societies is here to stay and becomes a major
structural feature of our societies. It will become a perpetual task of social scholars to constantly monitor
and evaluate the diverse and evolving aspects of this new form of social inequality in the access, use and
impact of technologically mediated information and communication.
17 pages of Supplementary Information are attached to this paper.

Technological information inequality Hilbert, JASIST 2013
22
References Allagui, I., & Kuebler, J. (2011). The Arab Spring & the Role of ICTs: Introduction to iJoC Special
Section. International Journal of Communication, 5, 1435–1442.
Anheier, H., Glasius, M., & Kaldor, M. (Eds.). (2004). Global Civil Society 2004/5 (Center for the
Study of Global Governance (London School of Economics).). London: Sage, 2004.
Arthur, W. B. (2009). The Nature of Technology: What It Is and How It Evolves. Free Press.
Avgerou, C. (2008). Information systems in developing countries: a critical research review. Journal
of Information Technology, 23(3), 133–146.
Barnett, G., Chon, B.-S., & Rosen, D. (2001). The Structure of the Internet Flows in Cyberspace.
Networks and Communication Studies NETCOM, 15(1-2), 61–80.
Bauer, S., Clark, D., & Lehr, W. (2010). Understanding broadband speed measurements. Presented at
the 38th Research Conference on Communication, Information, and Internet Policy (TPRC),
Arlington, Virginia.
Beise, M. (2004). Lead markets: country-specific drivers of the global diffusion of innovations.
Research Policy, 33(6–7), 997–1018. doi:10.1016/j.respol.2004.03.003
Bocquet, R., Brossard, O., & Sabatier, M. (2007). Complementarities in organizational design and the
diffusion of information technologies: An empirical analysis. Research Policy, 36(3), 367–386.
Bohn, R., & Short, J. (2009). How Much Information? 2009 Report on American Consumers. San
Diego: Global Information Industry Center of University of California, San Diego.
Brecht, B. (1932). The Radio as an Apparatus of Communication. In Bertold Brecht: Gesammelte
Werke, 1967 (Vol. Band 18, pp. 127–132). Frankfurt/Main.
Brynjolfsson, E., & Hitt, L. M. (1995). Beyond Computation: IT, Organizational Transformation and
Business Performance. Journal of Economic Perspectives, 14, 23–48.
Buente, W., & Robbin, A. (2008). Trends in Internet information behavior, 2000–2004. Journal of the
American Society for Information Science and Technology, 59(11), 1743–1760.
Burgess, E. W. (1928). Communication. American Journal of Sociology, 34(1), 117–129.
Burgess, E. W. (1929). Communication. American Journal of Sociology, 34(6), 1072–1080.
Burgess, E. W. (1930). Communication. American Journal of Sociology, 35(6), 991–1001.
Cadwallader, M. L. (1959). The Cybernetic Analysis of Change in Complex Social Organizations.
American Journal of Sociology, 65(2), 154–157.
Calhoun, C. (1998). Community without Propinquity Revisited: Communications Technology and the
Transformation of the Urban Public Sphere. Sociological Inquiry, 68(3), 373–397.
Castells, M., Fernandez-Ardevol, M., Qiu, J. L., & Sey, A. (2009). Mobile Communication and
Society: A Global Perspective. The MIT Press.
Colley, A., & Maltby, J. (2008). Impact of the Internet on our lives: Male and female personal
perspectives. Computers in Human Behavior, 24(5), 2005–2013. doi:10.1016/j.chb.2007.09.002
Compaine, B. M. (2001). The digital divide: facing a crisis or creating a myth? MIT Press.
CRED (Centre for Research on the Epidemiology of Disasters). (2010). EM-DAT: International
disaster database. CRED.
David, P. A. (1990). The Dynamo and the Computer: An Historical Perspective on the Modern
Productivity Paradox. American Economic Review, 80(2), 355–61.
Technological information inequality Hilbert, JASIST 2013
23
Davis, F. D. (1989). Perceived Usefulness, Perceived Ease of Use, and User Acceptance of
Information Technology. MIS Quarterly, 13(3), 319.
DiMaggio, P., Hargittai, E., Celeste, C., & Shafer, S. (2004). From Unequal Access to Differentiated
Use : A Literature Review and Agenda for Research on Digital Inequality. In Kathryn
Neckerman (Ed.), Social Inequality (pp. 355–400).
DiMaggio, P., Hargittai, E., Neuman, W. R., & Robinson, J. P. (2001). Social Implications of the
Internet. Annual Review of Sociology, 27(1), 307–336. doi:10.1146/annurev.soc.27.1.307
Dutta, S., Lopez-Claros, A., & Mia, I. (2006). The Global Information Technology Report 2005-2006:
Leveraging ICT for Development. INSEAD, World Economic Forum, Palgrave Macmillan.
Dutton, W. H., Gillett, S. E., McKnight, L. W., & Peltu, M. (2004). Bridging broadband Internet
divides. Journal of Information Technology, 19(1), 28–38.
Enzensberger, H. M. (1970). Baukasten zu einer Theorie der Medien (Constituents of a Theory of the
Media) (20.Vol. Politische Überlegungen (1967–1973), pp. 91–128). Frankfurt: Palaver.
Firth, L., & Mellor, D. (2002). The importance of national ICT visions for information society in
South East Asia. School of Information Systems, Victoria University.
Freeman, C., & Louçã, F. (2002). As Time Goes By: From the Industrial Revolutions to the
Information Revolution. Oxford University Press, USA.
Geroski, P. . (2000). Models of technology diffusion. Research Policy, 29(4–5), 603–625.
Gini, C. (1921). Measurement of Inequality of Incomes. The Economic Journal, 31(121), 124–126.
Hardy, A. P. (1980). The role of the telephone in economic development. Telecommunications Policy,
4(4), 278–286. doi:10.1016/0308-5961(80)90044-0
Hargittai, E. (2002, April 1). Second-level digital divide. First Monday, ISSN 1396-0466. text.
Hargittai, E., & Hinnant, A. (2008). Digital Inequality Differences in Young Adults’ Use of the
Internet. Communication Research, 35(5), 602–621. doi:10.1177/0093650208321782
Hilbert, M. (2009). The Maturing Concept of E-Democracy. Journal of Information Technology &
Politics, 6(2), 87.
Hilbert, M. (2010). When is Cheap, Cheap Enough to Bridge the Digital Divide? World Development,
38(5), 756–770.
Hilbert, M. (2011a). The end justifies the definition: The manifold outlooks on the digital divide and
their practical usefulness for policy-making. Telecommunications Policy, 35(8), 715–736.
Hilbert, M. (2011b). Digital gender divide or technologically empowered women in developing
countries? Women’s Studies International Forum, 34(6), 479–489.
Hilbert, M. (2011c). Mapping the dimensions and characteristics of the world’s technological
communication capacity during the period of digitization. In Working Paper. Presented at the 9th
World Telecommunication/ICT Indicators Meeting, Mauritius: International Telecommunication
Union (ITU). Retrieved from http://www.itu.int/ITU-D/ict/wtim11/documents/inf/015INF-E.pdf
Hilbert, M. (2012). How to Measure “How Much Information”? Theoretical, methodological, and
statistical challenges for the social sciences. International Journal of Communication, 6
(Introduction to Special Section on “How to measure ‘How-Much-Information’?”), 1042–1055.
Hilbert, M. (forthcoming). How much of the global information and communication explosion is
driven by more, and how much by better technology? Journal of the American Society for
Information Science and Technology.

Technological information inequality Hilbert, JASIST 2013
24
Hilbert, M., & López, P. (2011). The World’s Technological Capacity to Store, Communicate, and
Compute Information. Science, 332(6025), 60 –65. doi:10.1126/science.1200970
Hilbert, M., & López, P. (2012a). How to Measure the World’s Technological Capacity to
Communicate, Store and Compute Information? Part I: results and scope. International Journal
of Communication, 6, 956–979.
Hilbert, M., & López, P. (2012b). How to Measure the World’s Technological Capacity to
Communicate, Store and Compute Information? Part II: measurement unit and conclusions.
International Journal of Communication, 6, 936–955.
Hilbert, M., López, P., & Vasquez, C. (2010). Information Societies or “ICT equipment societies”?
Measuring the digital information processing capacity of a society in bits and bytes. The
Information Society, 26(3).
Horkheimer, M., & Adorno, T. W. (2002). Dialectic of enlightenment: philosophical fragments. (G.
S. Noerr, Ed.). Stanford University Press.
Howard, P., Anderson, K., Busch, L., & Nafus, D. (2009). Sizing Up Information Societies: Toward a
Better Metric for the Cultures of ICT Adoption. The Information Society, 25(3), 208–219.
International Data Corporation (IDC). (2008). IDC Media Center. http://www.idc.com/about/press.jsp
Ito, Y. (1981). The Johoka Shakai approach to the study of communication in Japan. In C. Wilhoit &
H. de Bock (Eds.), Mass Communication Review Yearbook (Vol. 2, pp. 671–698). CA: Sage.
ITU (International Telecommunication Union), & UNCTAD (United Nations Conference on Trade
and Development). (2007). World Information Society Report 2007: Beyond WSIS. Geneva.
ITU (International Telecommunication Union). (2012). Measuring the Information Society 2012.
Geneva: International Telecommunication Union, ITU-D. http://www.itu.int/ITU-
D/ict/publications/idi/
James, J. (2008). Re-estimating the difficulty of closing the digital divide. Journal of the American
Society for Information Science and Technology, 59(12), 2024–2032. doi:10.1002/asi.20897
Jensen, R. (2007). The Digital Provide: Information (Technology), Market Performance, and Welfare
in the South Indian Fisheries Sector. Quarterly Journal of Economics, 122(3), 879–924.
Jorgenson, D. W., Ho, M. S., & Stiroh, K. J. (2008). A Retrospective Look at the U.S. Productivity
Growth Resurgence. Journal of Economic Perspectives, 22(1), 3–24. doi:10.1257/jep.22.1.3
Jung, J.-Y., Qiu, J. L., & Kim, Y.-C. (2001). Internet Connectedness and Inequality Beyond the
“Divide”. Communication Research, 28(4), 507–535. doi:10.1177/009365001028004006
Karshenas, M., & Stoneman, P. L. (1993). Rank, Stock, Order, and Epidemic Effects in the Diffusion
of New Process Technologies: An Empirical Model. RAND J. of Economics, 24(4), 503–528.
Katz, J. E., & Rice, R. E. (2002). Social consequences of Internet use: access, involvement, and
interaction. MIT Press.
Kelly, K. (1999). New Rules for the New Economy. Penguin (Non-Classics) online. www.kk.org
Klein, J. R. (2012). Wikileaks, Arab Uprisings, English Riots and Occupy Wall Street: Implications
for Internet Policy and Practice from a Business and Industry Outcome Perspective. Information,
Communication & Society.
Lee, S., Monge, P., Bar, F., & Matei, S. A. (2007). The Emergence of Clusters in the Global
Telecommunications Network. Journal of Communication, 57(3), 415–434.

Technological information inequality Hilbert, JASIST 2013
25
López, P., & Hilbert, M. (2012). Methodological and Statistical Background on The World’s
Technological Capacity to Store, Communicate, and Compute Information (online document).
Retrieved from http://www.martinhilbert.net/WorldInfoCapacity.html
Lyman, P., Varian, H., Swearingen, K., Charles, P., Good, N., Jordan, L., & Pal, J. (2003). How much
information? 2003. University of California, at Berkeley.
Maicas, J. P., Polo, Y., & Sese, F. J. (2009). The role of (personal) network effects and switching
costs in determining mobile users’ choice. Journal of Information Technology, 24(2), 160–171.
McCallum, J. (2002). Price-Performance of Computer Technology. In V. G. Oklobdzija (Ed.), The
Computer Engineering Handbook (pp. 136 – 153). CRC Press.
Monge, P., & Matei, S. A. (2004). The role of the global telecommunications network in bridging
economic and political divides, 1989 to 1999. Journal of Communication, 54(3), 511–531.
Mossberger, K., Tolbert, C. J., & Stansbury, M. (2003). Virtual Inequality: Beyond the Digital Divide
(1st ed.). Georgetown University Press.
Negroponte, N. (1996). Being Digital (1st ed.). New York: Vintage.
NTIA. (1995). Falling Through the Net: A Survey of the “Have Nots” in Rural and Urban America.
Washington: National Telecommunications and Information Administration, U.S. D.of Com.
OECD, (Organization for Economic Cooperation and Development). (2001). Understanding the
Digital Divide (OECD Digital Economy Papers). Paris: OECD, D. for S, T & I.
Ookla. (2011). NetIndex source data. Retrieved from http://www.netindex.com/source-data/
Partnership, U. N. (2008). The Global Information Society: a Statistical View. Geneva: ITU, OECD,
UNCTAD, UNESCO Institute for Statistics, UN Regional Commissions (UNECLAC,
UNESCWA, UNESCAP, UNECA), World Bank, EUROSTAT.
Peres, W., & Hilbert, M. (2010). Information Societies in Latin America and the Caribbean
Development of Technologies and Technologies for Development. Santiago: UN ECLAC.
Perez, C. (2004). Technological Revolutions, Paradigm Shifts and Socio-Institutional Change. In E.
Reinert (Ed.), Globalization, Economic Development and Inequality: 217–242. Edward Elgar.
Pool, I. de S. (1983). Tracking the Flow of Information. Science, 221(4611), 609–613.
doi:10.1126/science.221.4611.609
Porter, J. (2005). Disk/Trend Reports 1977-1999. California. http://www.disktrend.com/
Robinson, L. (2009). A Taste for the Necessary: A Bourdieuian Approach to Digital Inequality.
Information, Communication & Society, 12(4), 488–507. doi:10.1080/13691180902857678
Rogers, E. M. (2003). Diffusion of Innovations, 5th Edition. New York: Free Press.
Rosenblat, T. S., & Mobius, M. M. (2004). Getting Closer or Drifting Apart? Quarterly Journal of
Economics, 119(3), 971–1009. doi:10.1162/0033553041502199
Sellnow, T. L., Seeger, M. W., & Ulmer, R. R. (2001). Chaos theory, informational needs, and natural
disasters. Journal of Applied Communication Research, 30(4), 269.
Seo, H., & Thorson, S. J. (2012). Networks of Networks: Changing Patterns in Bandwidth and
Centrality in Global Information Infrastructure. Journal of Communication, 62(2), 345–358.
Shannon, C. (1948). A Mathematical Theory of Communication. Bell System Technical Journal, 27,
379–423, 623–656. doi:10.1145/584091.584093
Shapiro, C., & Varian, H. R. (1998). Information Rules: A Strategic Guide to the Network Economy
(1st ed.). Harvard Business Press.
Technological information inequality Hilbert, JASIST 2013
26
Stirling, A. (2007). A General Framework for Analysing Diversity in Science, Technology and
Society. Journal of The Royal Society Interface, 4(15), 707–719. doi:10.1098/rsif.2007.0213
UNDP (United Nations Development Programme). (2010). Human Development Report 2010. New
York: UNDP.
UPU. (2007). Postal statistics. Universal Postal Union. Retrieved from http://www.upu.int
Van Dijk, J. (2005). The Deepening Divide: Inequality in the Information Society (1st ed.). Sage
Publications, Inc.
Waples, D. (1942). Communications. American Journal of Sociology, 47(6), 907–917.
Warschauer, M. (2004). Technology and Social Inclusion: Rethinking the Digital Divide. MIT Press.
Waverman, L., Meschi, M., & Fuss, M. (2005). The Impact of Telecoms on Economic Growth in
Developing Countries | ICT Regulation Toolkit (ICT Regulation Toolkit). InfoDev, ITU.
WEF (World Economic Forum), & Accenture. (2010). Exploring the future of cloud computing:
riding the next wave of technology-driven transformation. Geneva.
Williams, R., & Edge, D. (1996). The social shaping of technology. Research Policy, 25(6), 865–899.
World Bank. (2011). World Development Indicators. World Bank. Retrieved from
http://data.worldbank.org/data-catalog
Yu, L. (2006). Understanding information inequality: Making sense of literature of the information
and digital divides. Journal of Librarianship and Information Science, 38(4), 229 –252.
1 ICT spending data suggest that above US$10 per person per month spending behavior changes from a typical
progressively spending “necessity good” to a regressively spending “luxury good” and this level is being achieved in most countries by now (Hilbert, 2010).
2 As early as 1959, Cadwallader called for the “measure the volume of mail, telegrams, telephone calls […] volume
of printed and written materials stored in the libraries and files of the system” (p. 157, italics added) .
3 Strictly speaking, the difference between the measurement of concentration and inequality is that inequality
includes zeros (without anything) and concentration only considers those above zero.
4 Generally speaking, in 1986 the world was still in the “analog age” in year 1986. Less than 1 % of the world’s
storage capacity was digital, as was less than 20 % of the world’s effectively telecommunicated information, while by 2007 the overwhelming majority of the world’s technologically mediated information were digital (94 % of storage and 99.9 % of telecommunication) (Hilbert & López, 2011).
5 The G7 is a group considered as consisting of “highly developed” countries, including Canada, France, Germany,
Italy, Japan, United Kingdom, and United States.
6 The member countries of the Organisation for Economic Co-operation and Development represent 17 % - 18 % of
the population in our sample, and include a group of self-proclaimed “industrialized” countries: Australia, Austria, Belgium, Canada, Czech Republic, Denmark, Finland, France, Germany, Greece, Hungary (joining 1996), Iceland, Ireland, Italy, Japan, Korea (Rep.) (1996), Luxemburg, Mexico (1994), Netherlands, New Zealand, Norway, Poland (1996), Portugal, Slovak Republic (2000), Spain, Sweden, Switzerland, Turkey, United Kingdom, United States.
7 For example, if two countries count have the same installed telecommunication capacity (let’s say 1 Mbps per
capita), but in one the average citizen has to spend 20 % of its income to purchase them, while in the other the same services cost only 10 % of income, we can conclude that the latter country counts with twice the economic possibilities to effectively use the respective services. In practical terms one can simply divide our installed capacity per capita by the respective price-income ratio.