technological futures - citepa · technological futures ... solar alchemy turns fumes back into...
TRANSCRIPT
TECHNOLOGICAL FUTURESand what they could mean for
air and climate change
Rob Maas, chair TFIAM,
EGTEI-meeting Marseille,23-24 November 2006

MTFR not sufficient to meet critical loads andlevels in 2020à need for new (emerging)
technologiesEffect indicator
MTFR from EU25
Base year exposure (2000/1990)
Baseline 2020 (Current legislation)
MTFR + Euro 5/6MTFR + shipping
MTFR + non EU measures
No-effect level (critical load/level)
Zero exposure
Remaining gap
Search for morecost-effective solutions
NEC 2010
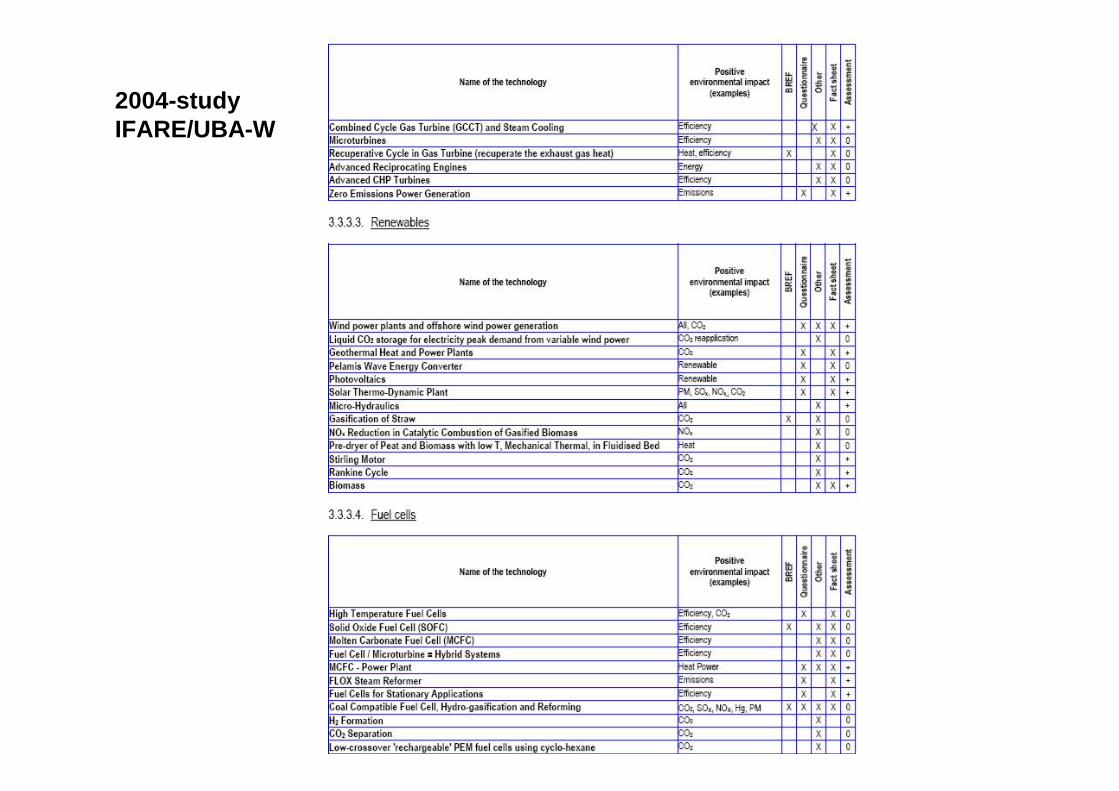
2004-studyIFARE/UBA-W

Contribution ofemerging technologiesin industryto emission reductionsin 2020
2004-study IFARE/UBA

Malthus & Meadows obsolete?Doomsday or new challenges?
How can we afford a sustainable development?
0
1
2
3
4
5
6
7
1700 1800 1900 2000 2100
global populationbillionschemical fertilizerproductionincrease of CO2Mauna Loa obsC N
HaberBosch
PapinWatt

From single abatement options to anintegrated approach
Lifestyle Conservation Fuel mix EfficiencyDemand Less air and car Insulation, low
travel, public energy appliances,transport, warmer heat recovery,
End Use clothes, less economical vehicles
consumerism
End Use More renewables, Better boilers,
Conversion gas cookers, lights, heat
pumps
Less losses
DistributionEnergy Electricity More renewables, Combined heat and
Industries HeatPrimary gas power, combined
cycleMore renewables,
Energy gas
SENCO

UK Energy flow chart: 1990SENCO GBR : TechBeh : Y1990
Trade Extraction Fuel processing Electricity and heat Delivered Sectors Useful energyEnvironment
Waste energy
Trd_E
Trd_N
Ext_G
Ext_S
Ext_L
Solid
Nuclear
Refinery Liq
Solid
Nuclear
L_FueOil
ElOnly
Gas
Solid
Elec
Liq
Biomass Food
Res_G_
Res_S_Res_E_Res_L_
Ser_G_Ser_S_Ser_E_Ser_L_
Ind_G_
Ind_S_Ind_E_
Ind_L_
Oth_G_Oth_L_
Tra(nat) E
Tra(nat) L
Tra(int) L
Mot W
Proc W
H>120C
H<12-C
Water H
Space H
Space ACCool
CO2 CO2
SENCO
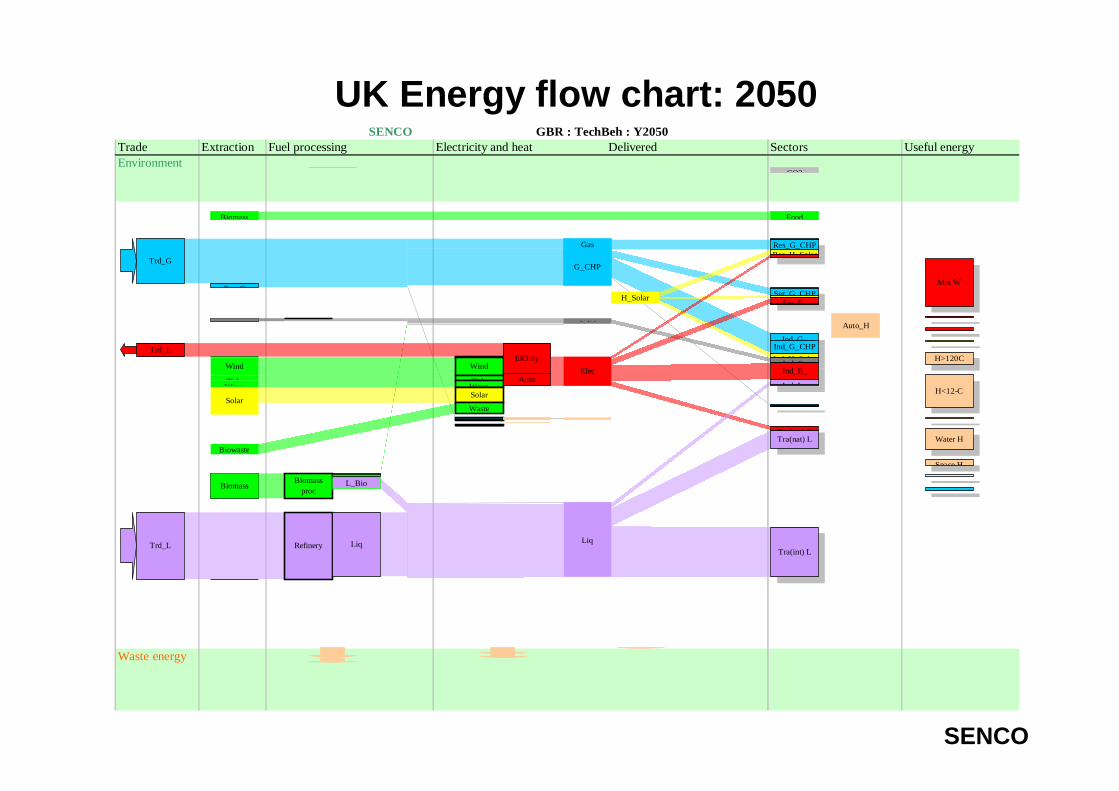
UK Energy flow chart: 2050SENCO GBR : TechBeh : Y2050
Trade Extraction Fuel processing Electricity and heat Delivered Sectors Useful energyEnvironment
Waste energy
Trd_G
Trd_E
Trd_L
Ext_G
Ext_S
Biomass
Solid
Wind
TideWave
Solar
Biowaste
BiomassBiomass
proc
Refinery
S_BioL_Bio
Liq
Wind
TideWaveSolar
Waste
CHPDHFuI
ElOnly
Auto
CHPDH_H
Auto_H
Gas
G_CHP
H_Solar
Solid
Elec
Liq
Biomass Food
Res_G_CHPRes_H_SolarRes_E_
Ser_G_CHPSer_H_SolarSer_E_
Ind_G_Ind_G_CHPInd_H_SolarInd_S_
Ind_E_
Ind_L_Ind_L_CHP
Oth_G_
Tra(nat) ETra(nat) L
Tra(int) L
Mot W
El equipProc WLight
H>120C
H<12-C
Cooking
Water H
Space H
Space ACCool
CO2
SENCO

MFR: NOx-emission UK 1990-2050
0
200
400
600
800
1000
1200
1400
1600
1800
1990
1995
2000
2005
2010
2015
2020
2025
2030
2035
2040
2045
2050
ktFue:ExtFue:ProEle:GenEle:PumEle:TraHea:PubHea:AutTra(int):Sea:IntTra(int):Air: InTra(nat):Other iTra(nat):Air: DoTra(nat):RailTra(nat):Road: FTra(nat):Road: PRes:ResSer:SerOth:othInd:AgrInd:LigInd:MetInd:CheInd:Iro
GBR: TechBeh: Air : NOx
SENCO
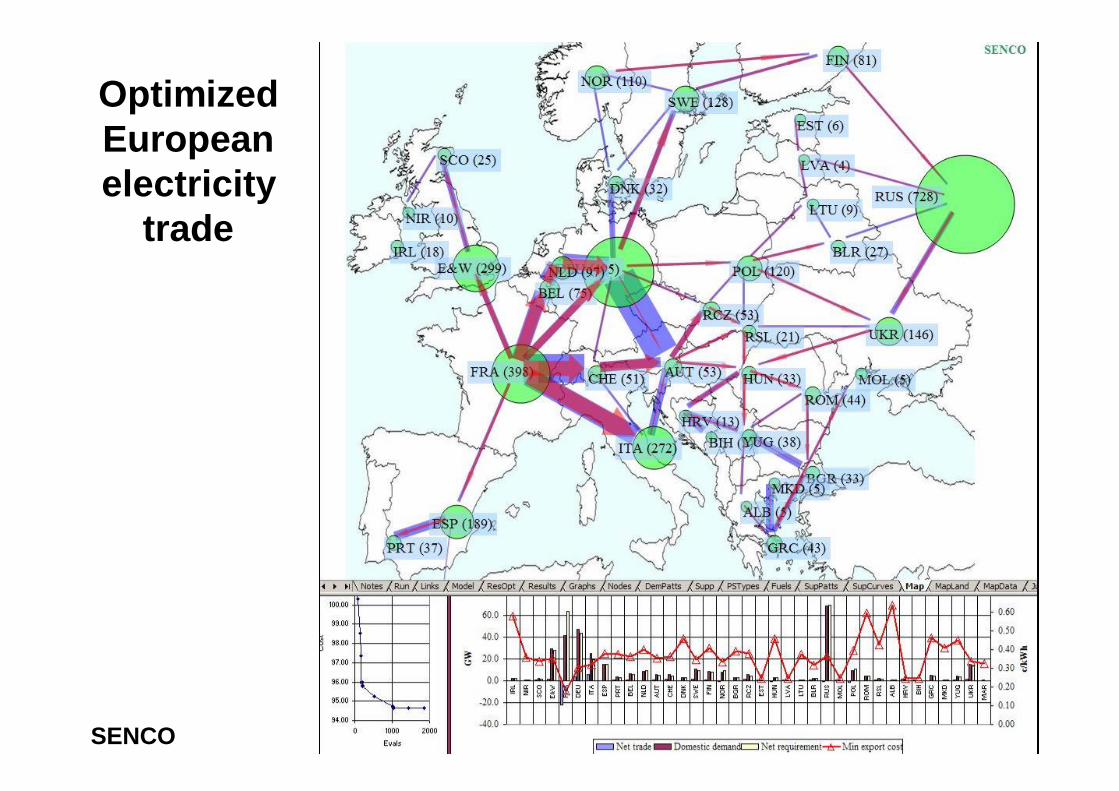
OptimizedEuropeanelectricity
trade
SENCO

Emissions from large point sources in Europe
SENCO

Mitigation measures for GHGsCumulative carbon removal, 2000-2100 [Gt C]
CO2
CH4
N2O
0 50 100 150 200 250 300
Soil cultivation
Nitric & adipic acid production
Rice cultivation
Enteric fermentation
Manure treatment
Energy sector
Waste treatment
Carbon capture
Carbon sinks
Switch to biomass
Switch to renewables
Switch to natural gas
Switch to nuclear
Stabilization for B1 Stabilization for A2
800

GAINS: GHG cost curve in 2020
GAINS-EUROPE in 2020Aggregated Marginal Cost Curve
-100
-50
-
50
100
150
200
250
300
6,000 6,500 7,000 7,500 8,000 8,500 9,000
GHG Emissions (Mt CO2eq)
Mar
gina
l Cos
t(E
UR
O/tC
O2e
q)
1990CLE
- 20%
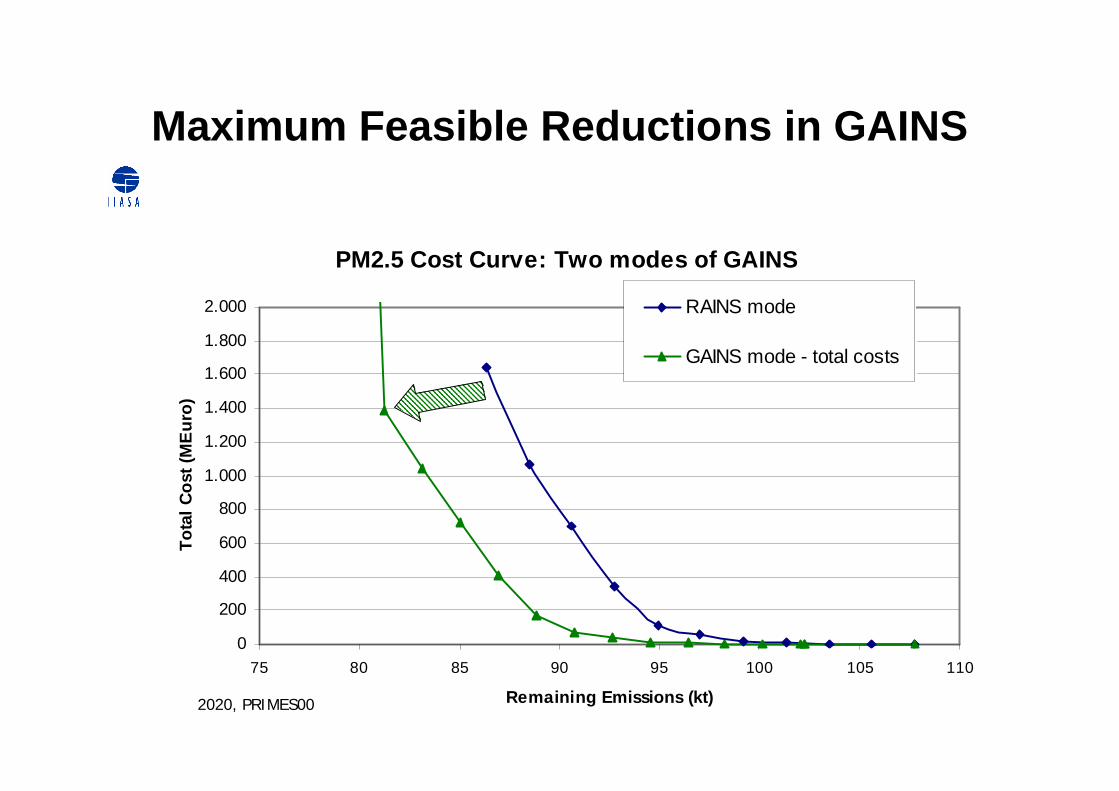
Maximum Feasible Reductions in GAINS
PM2.5 Cost Curve: Two modes of GAINS
0
200
400
600
800
1.000
1.200
1.400
1.600
1.800
2.000
75 80 85 90 95 100 105 110
Remaining Emissions (kt)
Tota
l Cos
t (M
Eur
o)
RAINS mode
GAINS mode - total costs
2020, PRIMES00

systemoptim iza tion
systemre design
functioninnova tion
tim e horizon (in yea rs)
im pro vedenvironmen ta l
e ffic iency(factor)
5 1 0 20
2
5
10+
Sustainable developmentrequires innovations
Efficientpower plants
Efficientpower plants
Cleanerfuels
Cleanerfuels
Hydrogeneconomy
Hydrogeneconomy

Innovations• No science fiction• But technological breakthroughs beyond
optimization of current technologies
Time
Embryonic,chaotic, ‘snake pit’
Growth
Saturation, maturity,senescence
Indicator ofperformance (e.g.market share,technicalperformance)

Succesful Innovation processes
• Often new combinations of existing knowledge• Drivers: R&D-investments, co-operation, urgency, future
perspectives, cross-fertilisation, serendipity, risk taking,etc.
“generate new diversity”

Global R&D expenditures, 2002
Biotechnology & Food
New materials
Nanotechnology
Geology
ICT
Space technology
(Nuclear) Energy
Medicins & Genomics
Social sciences
After 2002: more investments insecurity issues (and clean coal?)
Innovation depends onthe amount of money invested

Innovation throughco-operation & cross-fertilisation

Where to look for innovationsin Europe?

4. Climate change crop failures15. Regional war over resources.
16. Major energy shortages3. Wars re nation-states
1. Widespread criminal terrorism.
14. Environmental refugees.13A. Global epidemics, plagues
18. Crisis in food quality.2. Migration of poor to rich world.
5. Changes in ocean currents13F. Economic meltdown
13G. Magnitude 9 earthquake.8. Abrupt shift in climatic zones11. Fresh water contamination
6. Destruction of the ozone layer.10. Failure to support UN
13. Terrorist genetic agent amok.12. Technological gridlock.
17. Reverse population stabilization9. Decay of human intelligence.
13H. Breakdown of law and order7. Nuclear war.13C. Global war.
13E. Extraordinarily intense solar13B. Large asteroid collision.
13D. Deadly gamma ray burst.0 10 20 30 40 50 60 70 80
Percent
1 or 2
4 or 5
Likelihood of Some Catastrophes: Q13: Rd 1 and 2
Urgentproblemsrequiringinnovation
(perceivedurgencyamongscientists)
UN - State ofthe future,2001


Raw material Gas, Ammonia, Steel
Reformer+CO2 Sep
Air Separation
CO2Separation
CoalGas
Biomass
CO2Compression& Dehydration
Power & Heat
Power & Heat
Power & Heat
Process +CO2 Sep.
N2
N2 O2
O2
H2
N2O2
CO2
CO2
CO2
CO2
Air
Post combustion
Pre combustion
Oxyfuel
Industrial Processes
Air
Air
CoalGas
Biomass
CoalGas
Biomass
Gasification
Gas, Oil
CoalGas
Biomass
Air/O2Steam
Air/O2
Raw material Gas, Ammonia, Steel
Reformer+CO2 SepReformer+CO2 Sep
Air Separation
CO2Separation
CO2Separation
CoalGas
Biomass
CO2Compression& Dehydration
Power & HeatPower & Heat
Power & HeatPower & Heat
Power & Heat
Process +CO2 Sep.
N2
N2 O2
O2
H2
N2O2
CO2
CO2
CO2
CO2
Air
Post combustion
Pre combustion
Oxyfuel
Industrial Processes
Air
Air
CoalGas
Biomass
CoalGas
Biomass
GasificationGasification
Gas, Oil
CoalGas
Biomass
Air/O2Steam
Air/O2
Figure TS.3. Overview of capture processes and systems.
Figure 1, The Mitka-vehicle (May 2001)


Solar alchemy turns fumes back into fuelsIt is the biggest contributor to climate change. Now chemists are hoping to convertcarbon dioxide into a useful fuel, with a little help from the sun. If they succeed, it willbe possible to recycle the greenhouse gas produced by burning fossil fuels. The workcould also lead to a way for future Mars missions to generate fuel for their returnjourney from carbon dioxide in the planet's atmosphere.
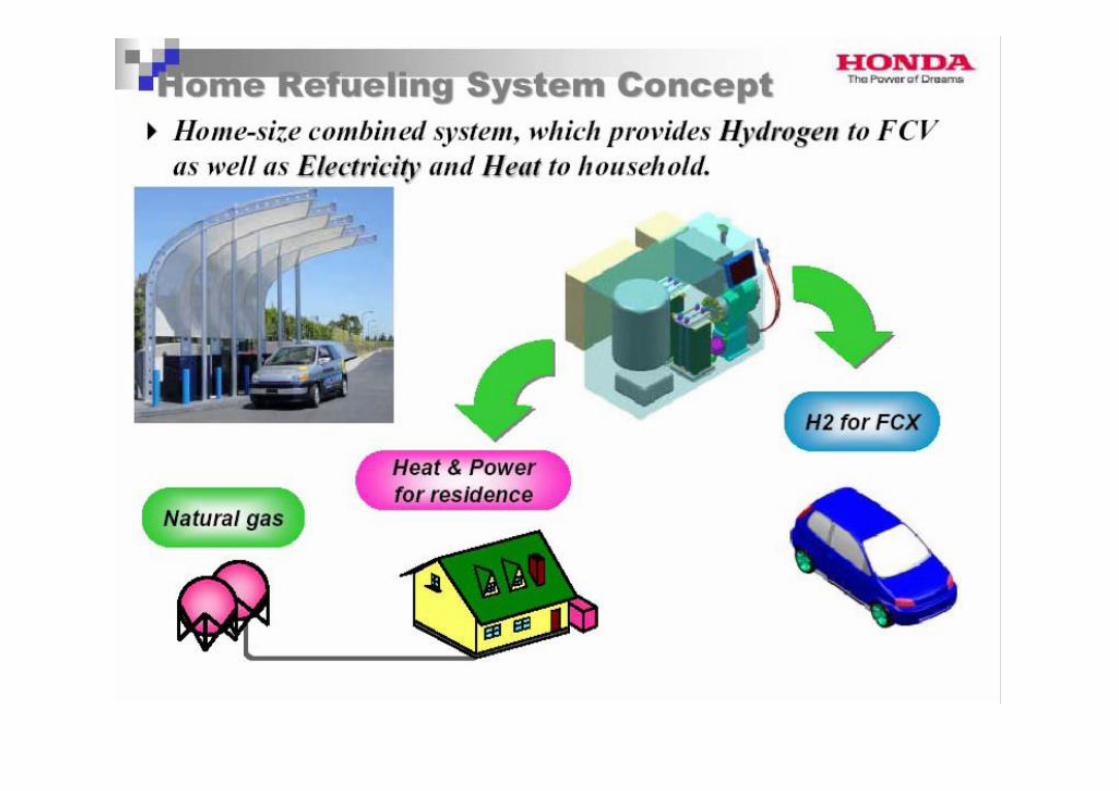
Hydrogen Economy moves up a gear with5 billion Euro industrial investment
Bioethanol valorization forincorporation in diesel fuelblends
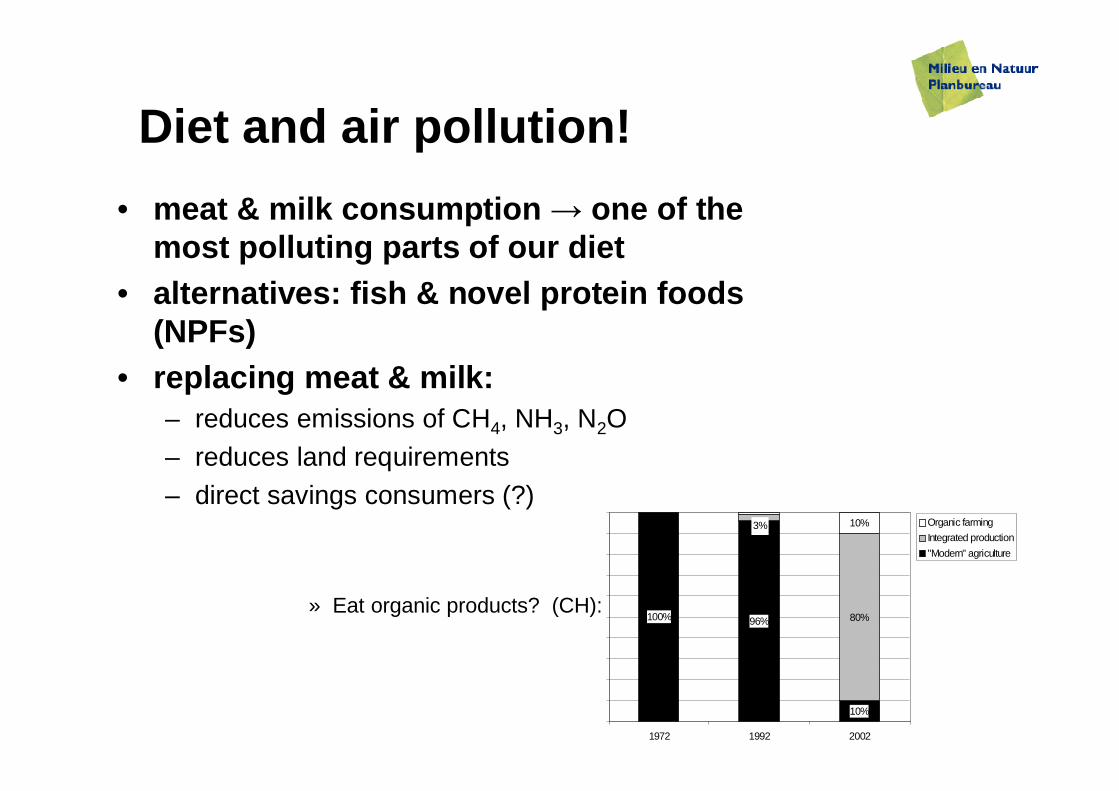
Diet and air pollution!• meat & milk consumption one of the
most polluting parts of our diet• alternatives: fish & novel protein foods
(NPFs)• replacing meat & milk:
– reduces emissions of CH4, NH3, N2O– reduces land requirements– direct savings consumers (?)
» Eat organic products? (CH):100% 96%
10%
80%
10%3%
1972 1992 2002
Organic farmingIntegrated production"Modern" agriculture

0.0
0.5
1.0
1.5
0 1 2 3 4 5 6 7 8 9 10 11 12 13 14 15Number of doublings (installed capacity)
Cos
t ind
ex ($
/kW
)
0.0
0.5
1.0
1.5
Nuclear Reactors France 1977-2000
PVs Japan1976-1995
0.1%
0.1%
50% interval
90% interval
mean learning rate(115 case studies):-20% per doubling
What are the costs?Learning and market growth reduce costs

How to assess new technologies?
• Organize EGTEI-meetings which are achallenge for innovative experts
• Look beyond 2020• Assess potentials for 2050 and beyond• Assess costs incl. learning rates• Feed information to POLES, PRIMES, CAPRI,
TREMOVE and GAINS• Design optimal reduction strategies – balancing
costs of short term regulation and investmentsin long term innovations

Take the future into account
Be the engine behindsustainable development
Thank you !