technische universität münchen an interactive … universität münchen an interactive method to...
TRANSCRIPT

Technische Universität München
An interactive method to predict warm conveyor belt occurrence for aircraft-based field campaigns
Marc Rautenhaus(1), Christian Grams(2), Michael Kern(1), Andreas Schäfler(3) and Rüdiger Westermann(1)
(1) Computer Graphics and Visualization Group, TU München(2) Institute for Atmospheric and Climate Science, ETH Zürich(3) Institut für Physik der Atmosphäre, DLR Oberpfaffenhofen
17 August 2014, WWOSC 2014, Montréal

Marc Rautenhaus – 3D probability of Warm Conveyor Belts
Context: 3D ensemble visualization for forecasting
Flights are expensive and need to be planned multiple days in advance: Improve planning by use of ensemble uncertainty information and advanced 3D exploration techniques.
Met.3D – 3D forecast tool developed due to lack of a suitable tool to interactively explore forecast data for research flight planning.
→ Met.3D can be used for all kinds of campaigns. Example here: T-NAWDEX.

Marc Rautenhaus – 3D probability of Warm Conveyor Belts
Application: Predict Warm Conveyor Belts
Use ECMWF ensemble forecast to predict WCBs.
→ Where will, in 3-7 days and within aircraft range, be the highest probability that a WCB will occur?
→ Where is the WCB located in relation to cyclone, fronts, … ?
→ Demonstrated here with T-NAWDEX-Falcon case, intended for T-NAWDEX 2016 (and further campaigns)
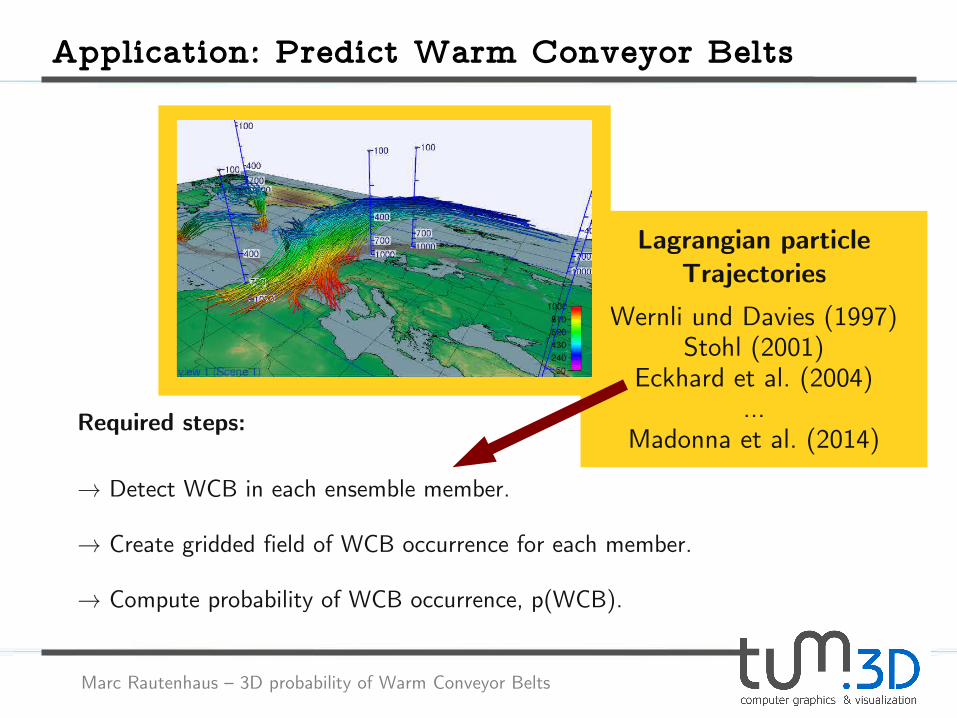
Required steps:
→ Detect WCB in each ensemble member.
→ Create gridded field of WCB occurrence for each member.
→ Compute probability of WCB occurrence, p(WCB).
Marc Rautenhaus – 3D probability of Warm Conveyor Belts
Application: Predict Warm Conveyor Belts
Required steps:
→ Detect WCB in each ensemble member.
→ Create gridded field of WCB occurrence for each member.
→ Compute probability of WCB occurrence, p(WCB).
Lagrangian particleTrajectories
Wernli und Davies (1997)Stohl (2001)
Eckhard et al. (2004)...
Madonna et al. (2014)

Marc Rautenhaus – 3D probability of Warm Conveyor Belts
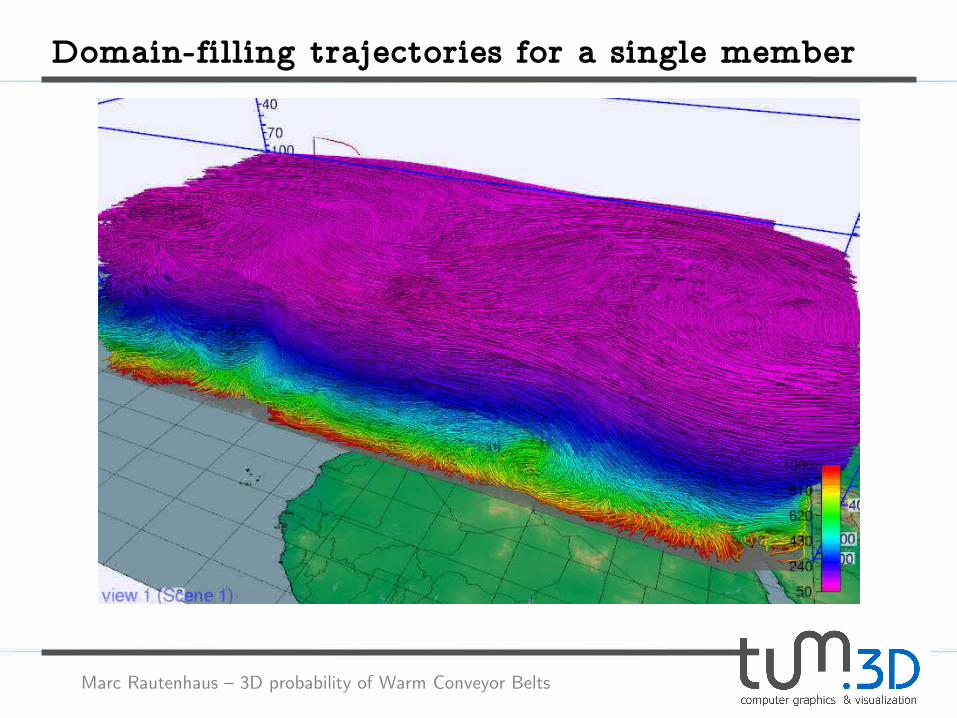
48 h forward48 h backward
For each ensemble member:
Domain-filling trajectories with LAGRANTO (Wernli und Davies, 1997)
Domain-filling trajectories

Marc Rautenhaus – 3D probability of Warm Conveyor Belts
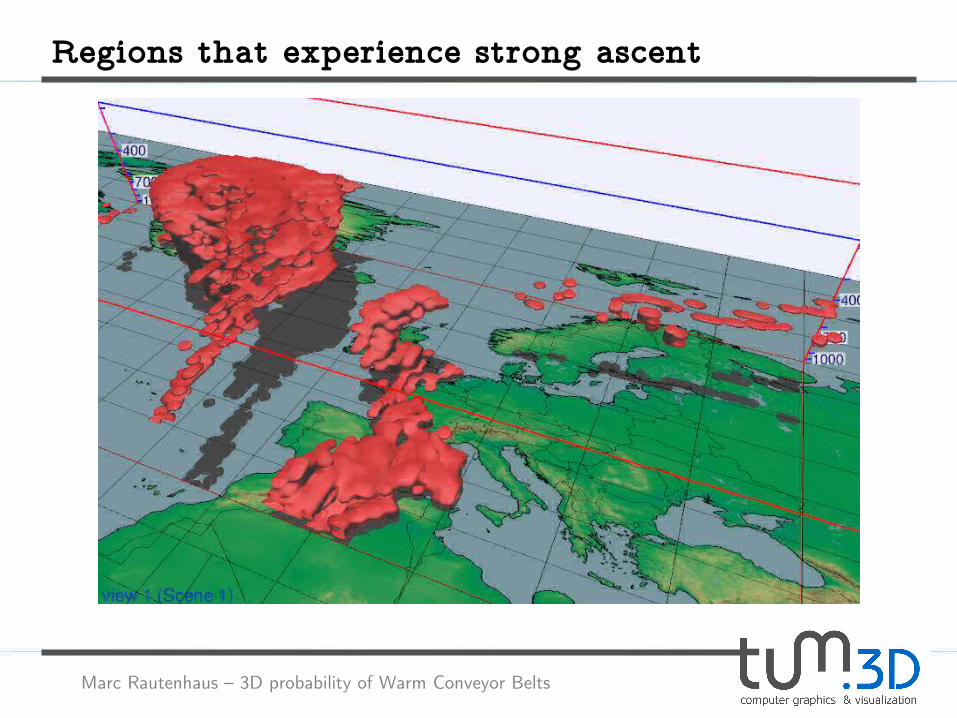
Select according to ascent:
e.g. 500-600 hPa in 48 hours
Domain-filling trajectories

Marc Rautenhaus – 3D probability of Warm Conveyor Belts
Mark the corresponding grid points.
Trajectories with strong ascent (500hPa/48h)

Marc Rautenhaus – 3D probability of Warm Conveyor Belts
For each ensemble-member:
Binary volume that stores WCB events.
Grid points in regions of strong ascent
Marc Rautenhaus – 3D probability of Warm Conveyor Belts
Domain-filling trajectories for a single member

Marc Rautenhaus – 3D probability of Warm Conveyor Belts
Trajectories with strong ascent (500hPa/48h)

Marc Rautenhaus – 3D probability of Warm Conveyor Belts
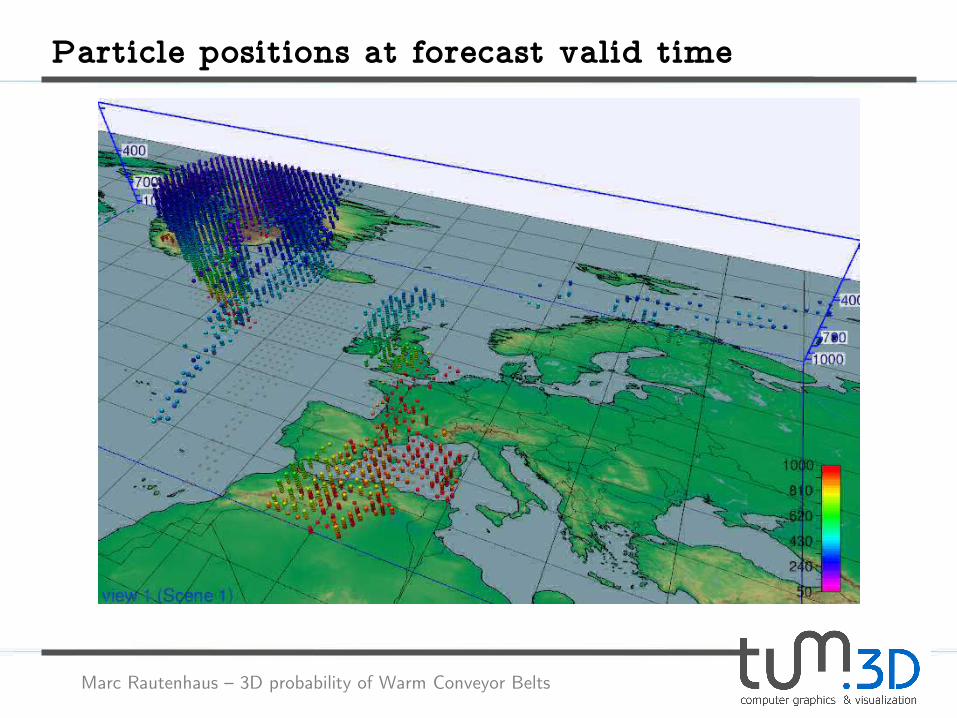
Particle positions at forecast valid time
Marc Rautenhaus – 3D probability of Warm Conveyor Belts
Particle positions at forecast valid time
Marc Rautenhaus – 3D probability of Warm Conveyor Belts
Regions that experience strong ascent

Marc Rautenhaus – 3D probability of Warm Conveyor Belts
Probability of WCB occurrence
19 October 2012 18 UTC

Marc Rautenhaus – 3D probability of Warm Conveyor Belts
Challenges
→ Flexible ascent criterion (dp/dt) → interactive specification in Met.3D.
→ Suitable 3D visualization.
→ Interpretation of results.

Marc Rautenhaus – 3D probability of Warm Conveyor Belts
10% probability30% probability
Why are the probabilities so low?

Marc Rautenhaus – 3D probability of Warm Conveyor Belts
19 October 2012: 85% of members „contribute“

Marc Rautenhaus – 3D probability of Warm Conveyor Belts
Demonstration
Video:
→ Forecast of Monday, October 15, 2012 for Friday, October 19, 2012.
→ Explore p(WCB) product.

Marc Rautenhaus – 3D probability of Warm Conveyor Belts
Summary
p(WCB)Met.3D Interactive visual analysis of p(WCB)
Gridded trajectories allow computation of 3D p(WCB).
Interactive 3D exploration quickly shows structure.
Region contribution important for interpretation.
Interactive 3D visualization of ensemble forecaststo improve flight planning.

Marc Rautenhaus – 3D probability of Warm Conveyor Belts
Summary
p(WCB)Met.3D Interactive visual analysis of p(WCB)
Continuing work:
Other selection criteria.
Improvements of 3D exploration.
Improvements of flight planning functionality.
Gridded trajectories allow computation of 3D p(WCB).
Interactive 3D exploration quickly shows structure.
Region contribution important for interpretation.
Interactive 3D visualization of ensemble forecaststo improve flight planning.

Marc Rautenhaus – 3D probability of Warm Conveyor Belts
Summary
Thank you!
p(WCB)Met.3D Interactive visual analysis of p(WCB)
Continuing work:
Other selection criteria.
Improvements of 3D exploration.
Improvements of flight planning functionality.
Gridded trajectories allow computation of 3D p(WCB).
Interactive 3D exploration quickly shows structure.
Region contribution important for interpretation.
Interactive 3D visualization of ensemble forecaststo improve flight planning.

Marc Rautenhaus – 3D probability of Warm Conveyor Belts
Additional slides

Marc Rautenhaus – 3D probability of Warm Conveyor Belts
Rafael
Jet
WCB
T-NAWDEX-Falcon case: ET, through and WCB
19 October 2012 12 UTC

Marc Rautenhaus – 3D probability of Warm Conveyor Belts
WCB trajectories started in lower atmosphere
48 h forward
800 hPa
Marc Rautenhaus – 3D probability of Warm Conveyor Belts
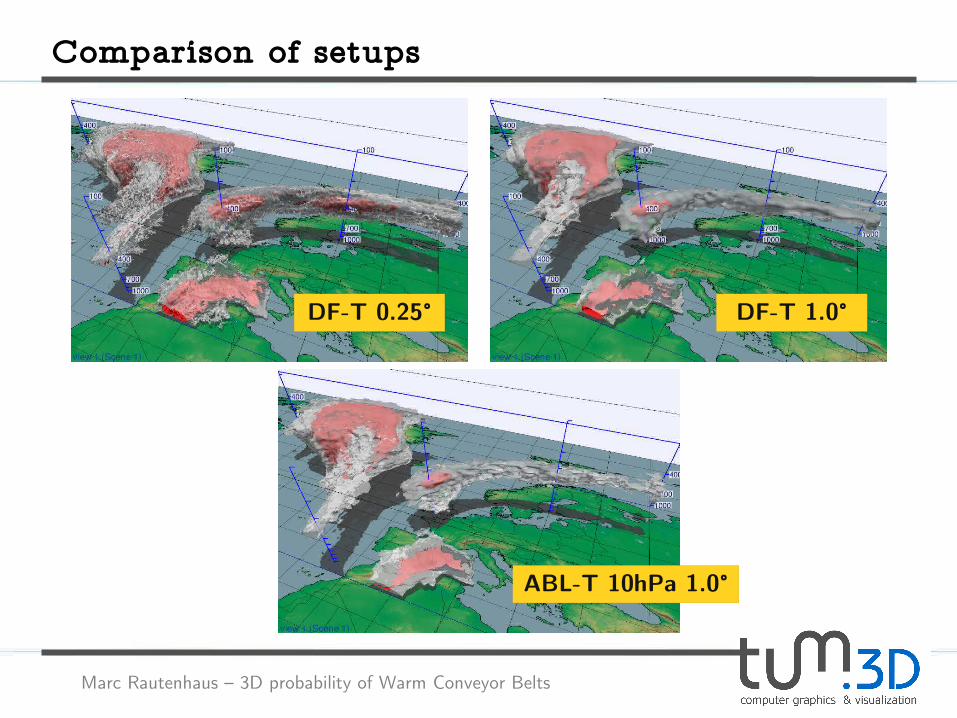
Comparison of setups
DF-T 0.25° DF-T 1.0°
ABL-T 10hPa 1.0°
Marc Rautenhaus – 3D probability of Warm Conveyor Belts
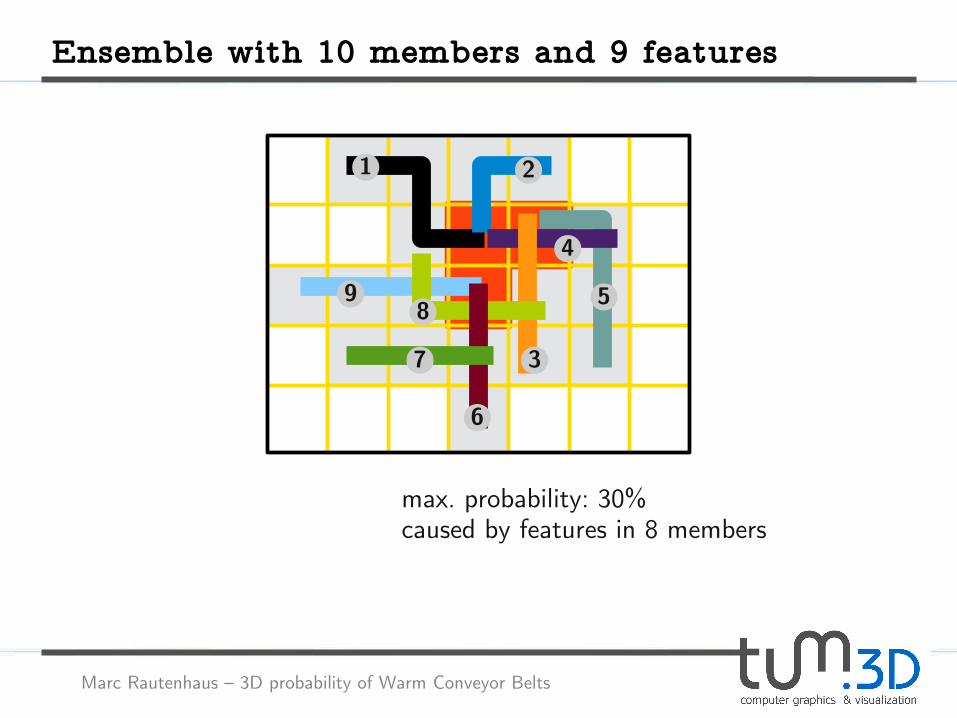
1 2
3
4
5
6
7
89
max. probability: 30%caused by features in 8 members
Ensemble with 10 members and 9 features

Marc Rautenhaus – 3D probability of Warm Conveyor Belts
Visual sampling along normal curves

Marc Rautenhaus – 3D probability of Warm Conveyor Belts
Find the highest probability in 3D

Marc Rautenhaus – 3D probability of Warm Conveyor Belts
Find the highest probability in 3D