technical workshops on monterey peninsula water supply project a.12-04-019 july 26 & 27, 2012
TRANSCRIPT
Technical Workshops onMonterey Peninsula Water Supply Project
A.12-04-019
July 26 & 27, 2012
Disclaimer
• This presentation contains material that are for discussion purposes.
• Various graphics contains numerous estimates which are beyond our control and subject to change.
• These graphics are for illustration purposes only.
2
3
Topics for July 26-27, 2012 Technical Workshop
1. Demand Projections
2. Available Water Supply
3. Project sizing, costs and ratepayer impacts
4. Project governance
5. Contingency planning in light of possible impediments to project completion and to meeting the December 2016 deadline

4
Demand Projections
• What are the current, short-term and long-term demand projections for the Monterey District?
• How do the demand projections compare with various filings at the Commission?
• What assumptions concerning growth, conservation, infrastructure improvements and better management of non-revenue producing water underlie the demand projections?
• How might changes in demand projections affect the sizing of the Monterey Peninsula Water Supply Project?
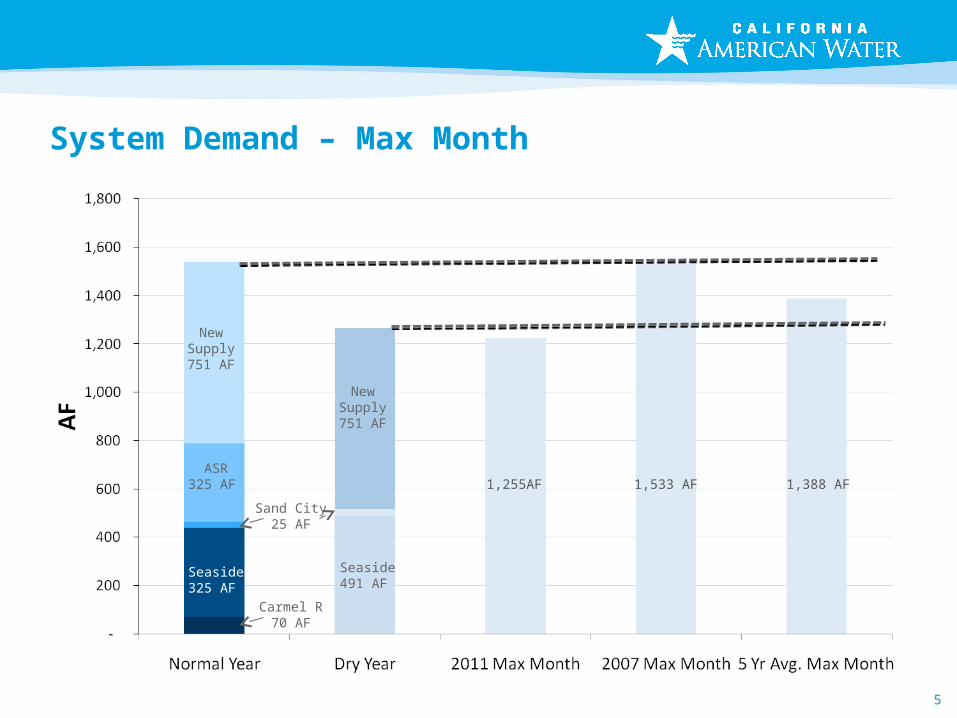
System Demand – Max Month
5
NewSupply751 AF
ASR325 AF
18,100 AFY
1,533 AF 1,388 AF1,255AF
NewSupply751 AF
Seaside491 AF
Seaside325 AF
Sand City25 AF
Carmel R70 AF
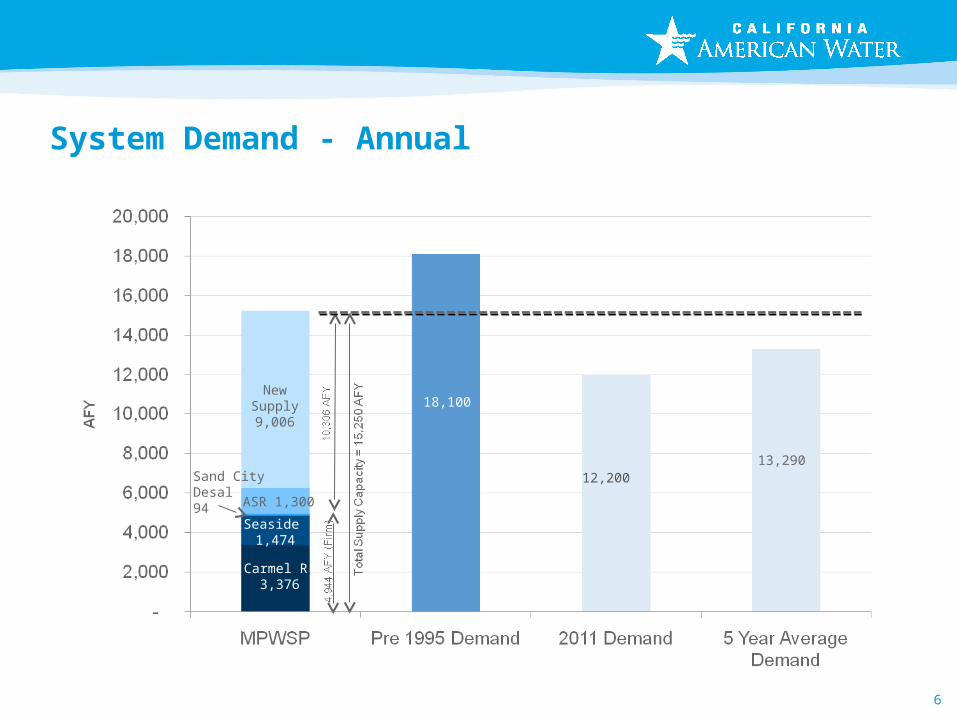
System Demand - Annual
NewSupply9,006
Carmel R 3,376
Seaside 1,474
ASR 1,300
Sand City Desal94
18,100
12,200 13,290
6
7
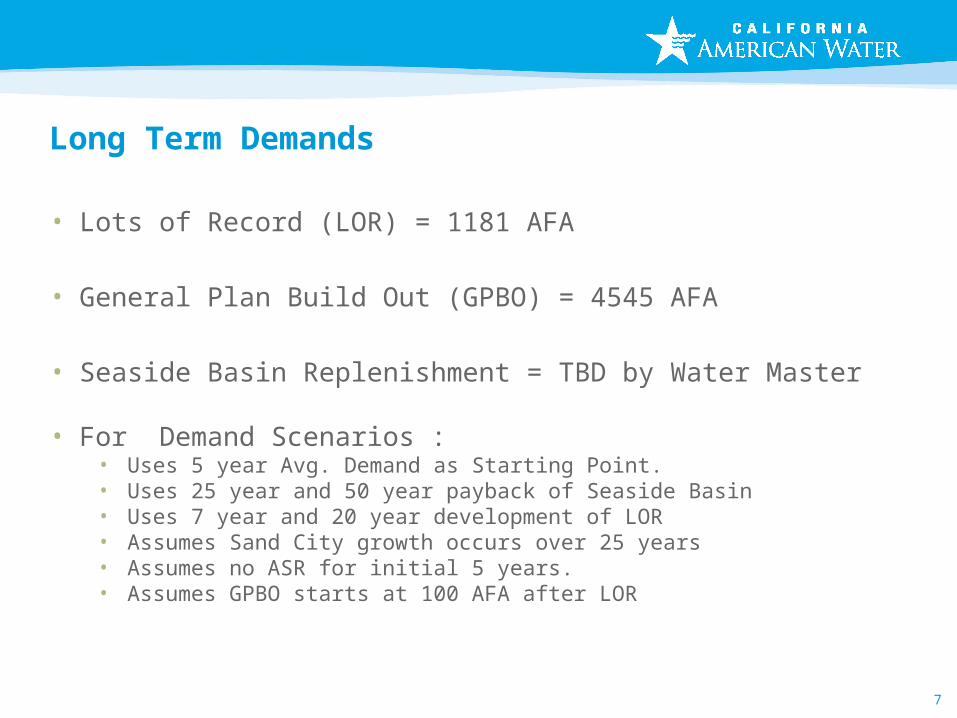
Long Term Demands
• Lots of Record (LOR) = 1181 AFA
• General Plan Build Out (GPBO) = 4545 AFA
• Seaside Basin Replenishment = TBD by Water Master
• For Demand Scenarios :• Uses 5 year Avg. Demand as Starting Point.• Uses 25 year and 50 year payback of Seaside Basin• Uses 7 year and 20 year development of LOR• Assumes Sand City growth occurs over 25 years• Assumes no ASR for initial 5 years.• Assumes GPBO starts at 100 AFA after LOR
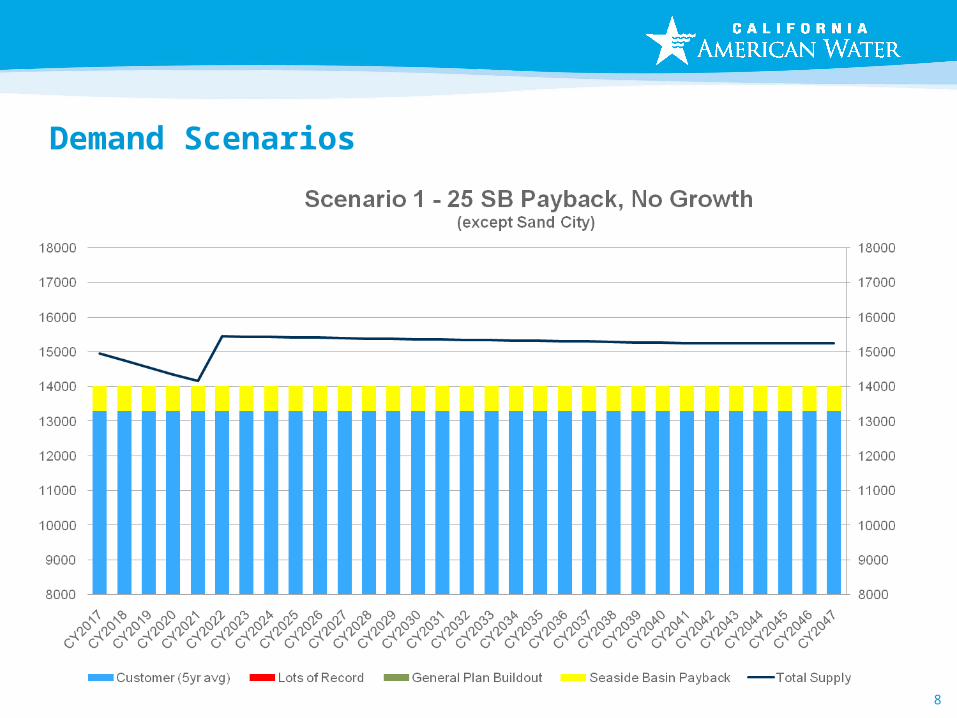
Demand Scenarios
8
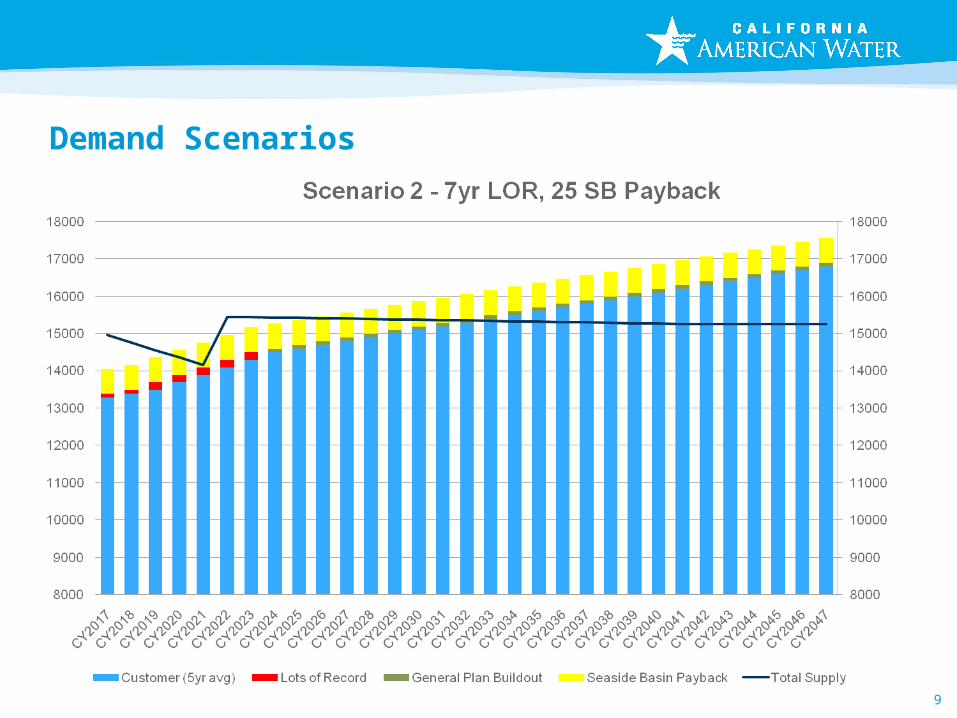
Demand Scenarios
9
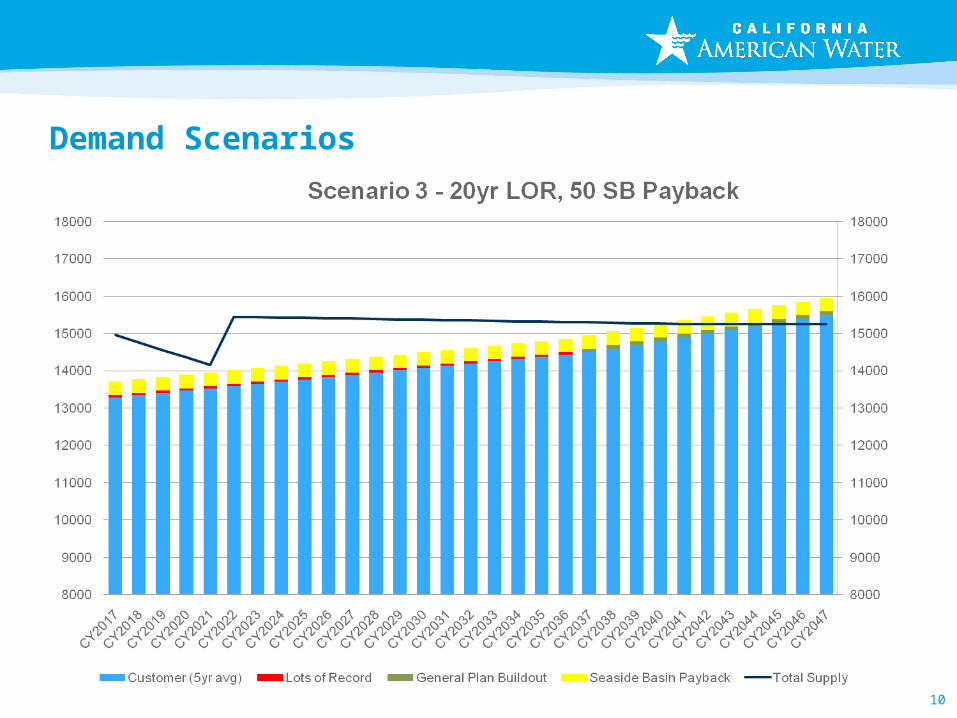
Demand Scenarios
10
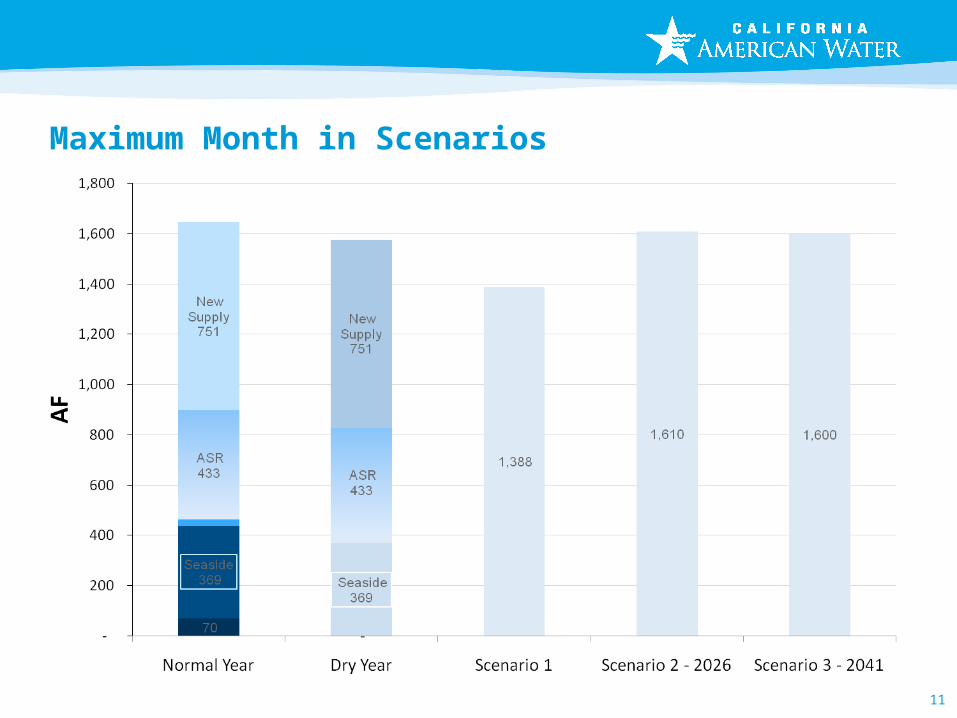
Maximum Month in Scenarios
11
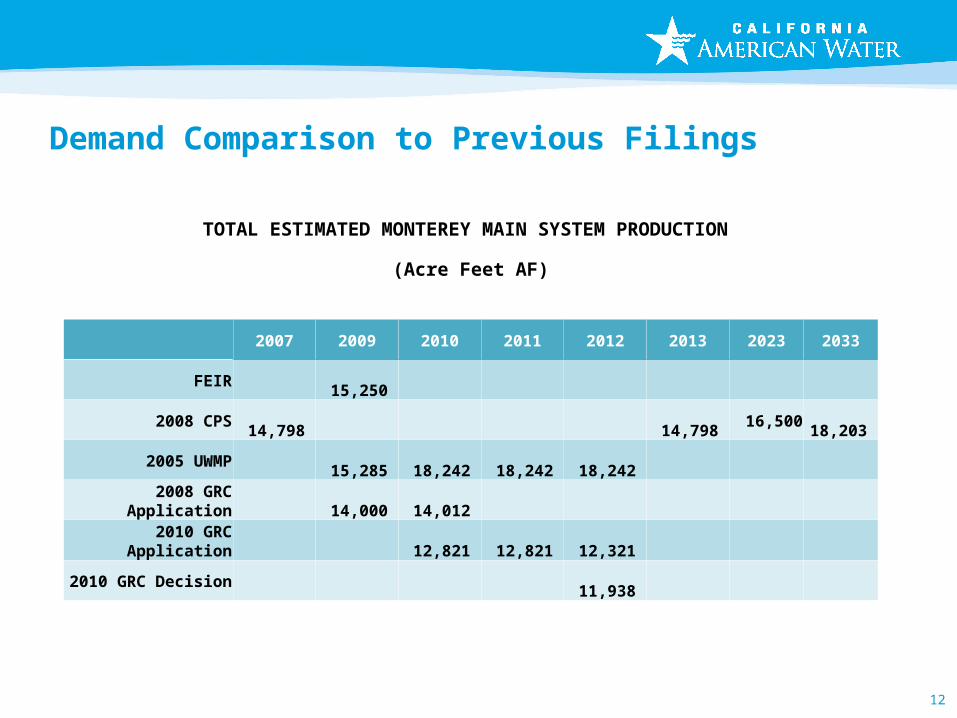
Demand Comparison to Previous Filings
12
TOTAL ESTIMATED MONTEREY MAIN SYSTEM PRODUCTION
(Acre Feet AF)
2007 2009 2010 2011 2012 2013 2023 2033
FEIR 15,250
2008 CPS 14,798 14,798 16,500 18,203
2005 UWMP 15,285 18,242 18,242 18,242
2008 GRC Application 14,000 14,012
2010 GRC Application 12,821 12,821 12,321
2010 GRC Decision 11,938
13
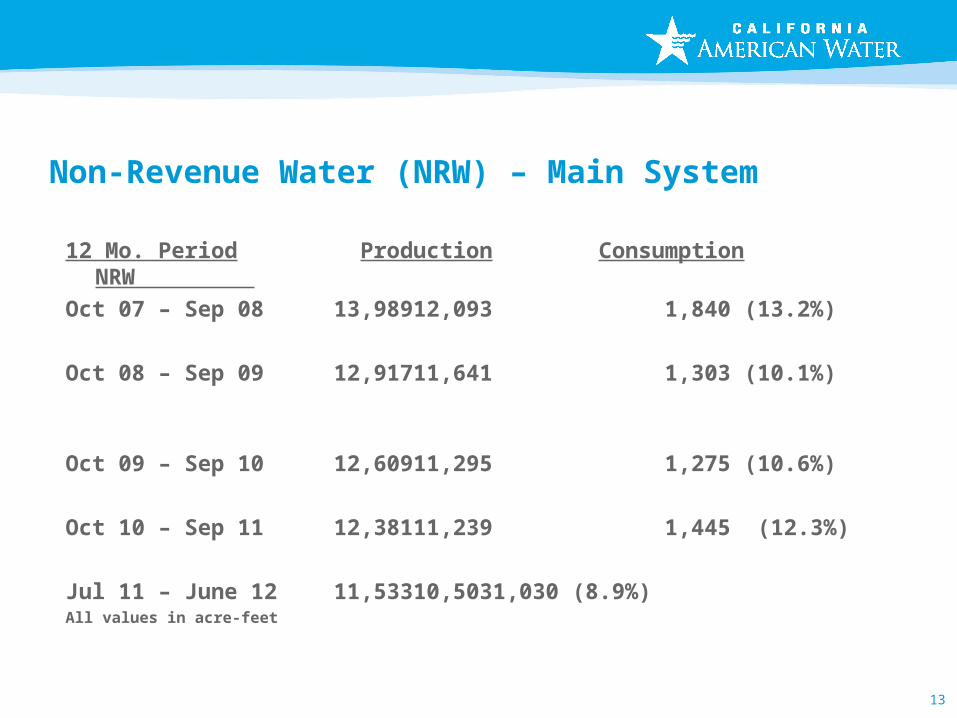
Non-Revenue Water (NRW) – Main System
12 Mo. Period Production Consumption NRW
Oct 07 – Sep 08 13,989 12,093 1,840 (13.2%)
Oct 08 – Sep 09 12,917 11,641 1,303 (10.1%)
Oct 09 – Sep 10 12,609 11,295 1,275 (10.6%)
Oct 10 – Sep 11 12,381 11,239 1,445 (12.3%)
Jul 11 – June 12 11,533 10,503 1,030 (8.9%)All values in acre-feet
14
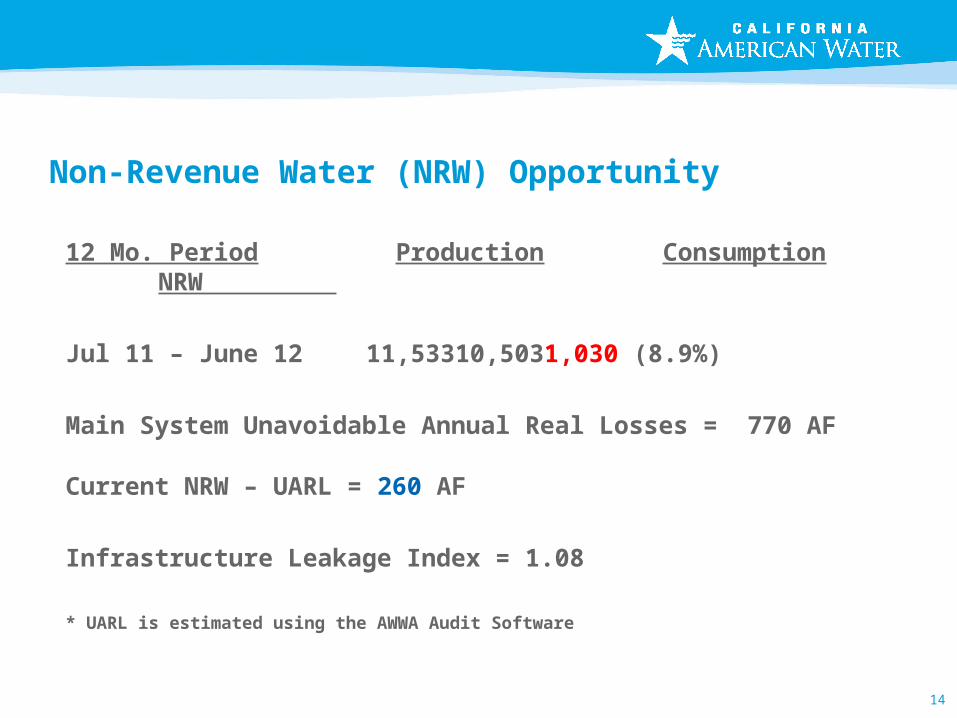
Non-Revenue Water (NRW) Opportunity
12 Mo. Period Production Consumption NRW
Jul 11 – June 12 11,533 10,503 1,030 (8.9%)
Main System Unavoidable Annual Real Losses = 770 AF
Current NRW – UARL = 260 AF
Infrastructure Leakage Index = 1.08
* UARL is estimated using the AWWA Audit Software
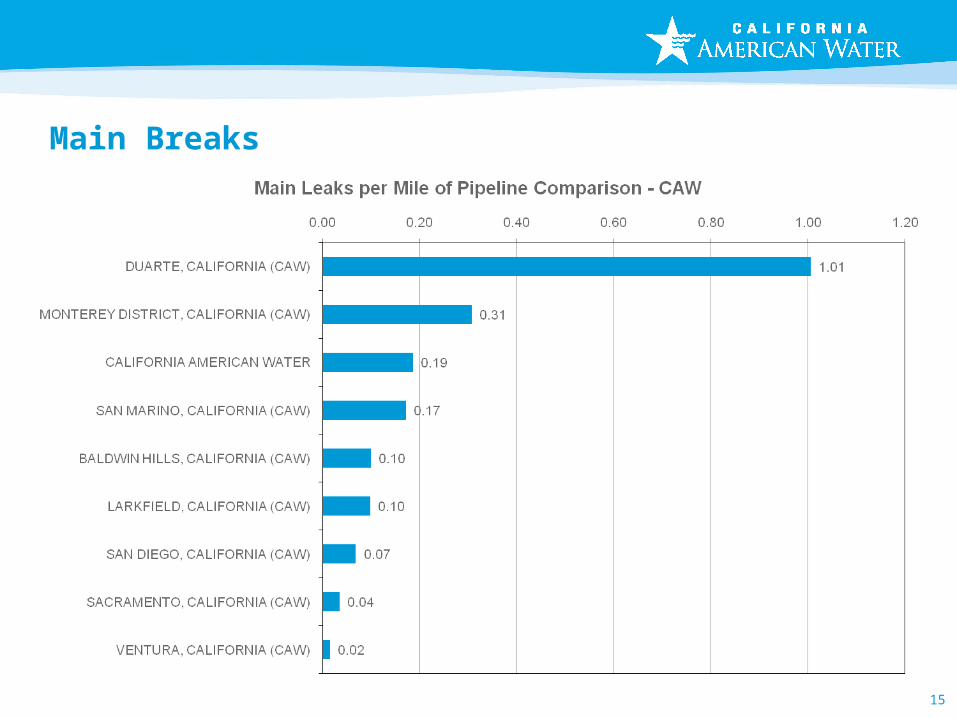
Main Breaks
15
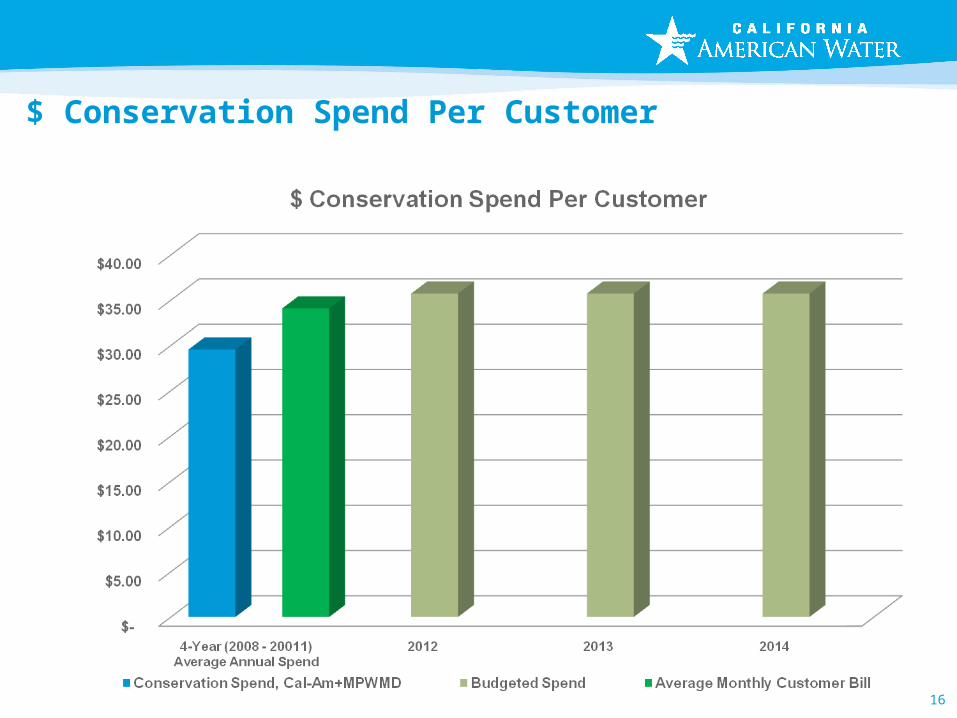
$ Conservation Spend Per Customer
16
17
Available Water Supply
• What possible impediments lie in the path of receiving water, on a dependable basis, from the following sources:
• Recycled water
• Aquifer Storage Recovery (ASR) Replenishment
• Sand City Desalination Plant
• Slant Wells
• California-American Water Company (Cal-Am) owned Desalination plant facilities
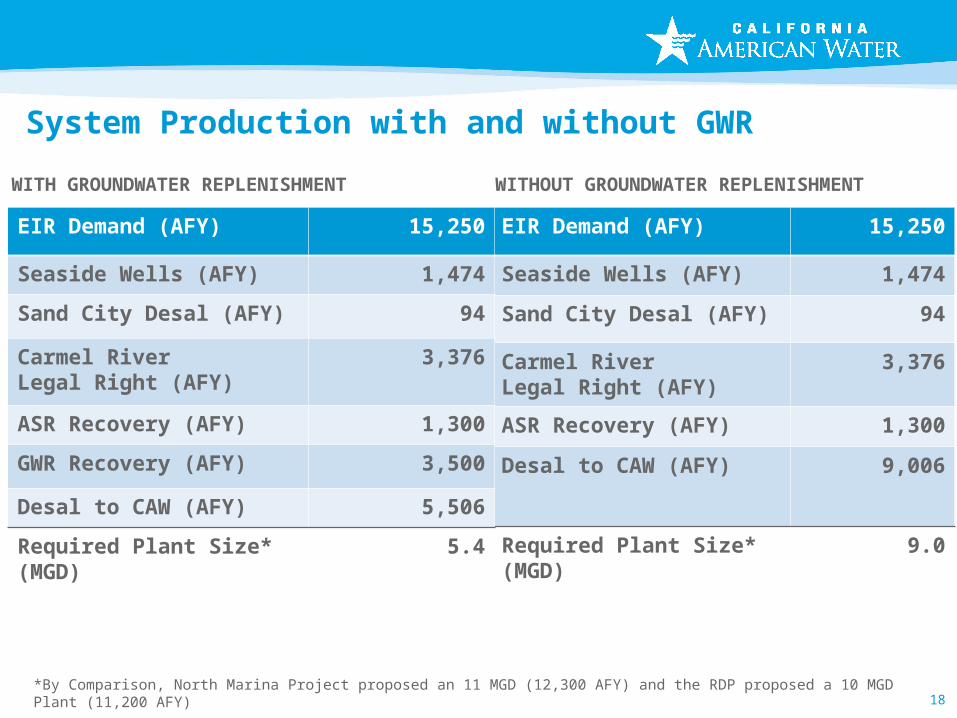
System Production with and without GWR
EIR Demand (AFY) 15,250
Seaside Wells (AFY) 1,474
Sand City Desal (AFY) 94
Carmel River Legal Right (AFY)
3,376
ASR Recovery (AFY) 1,300
Desal to CAW (AFY) 9,006
Required Plant Size* (MGD) 9.0
*By Comparison, North Marina Project proposed an 11 MGD (12,300 AFY) and the RDP proposed a 10 MGD Plant (11,200 AFY)
EIR Demand (AFY) 15,250
Seaside Wells (AFY) 1,474
Sand City Desal (AFY) 94
Carmel River Legal Right (AFY)
3,376
ASR Recovery (AFY) 1,300
GWR Recovery (AFY) 3,500
Desal to CAW (AFY) 5,506
Required Plant Size* (MGD) 5.4
WITH GROUNDWATER REPLENISHMENT WITHOUT GROUNDWATER REPLENISHMENT
18
19

20
Project Sizing, Costs and Ratepayer Impacts
• Based on the net demand and available supply, what is the optimal size of the project and estimated cost of the total project and Cal-Am only facilities?
• Normal practice would be to size Facilities to meet a 19,795 AFA demand and initially operate them at less than 50% of capacity.
• Connection Fee should be collected to supply water over 15,250 AFA
• Estimated Cost of facilities are as follows:
9.0 MGD Plant = $260M5.4 MGD Plant = $213M
Cal-Am Facilities = $107M
Total Cost range: $320M - $367M
Project Sizing, Costs and Ratepayer Impacts (continued)
• What is the cumulative impact on ratepayers if all current Cal-Am requested rate increases were approved by the Commission?
21
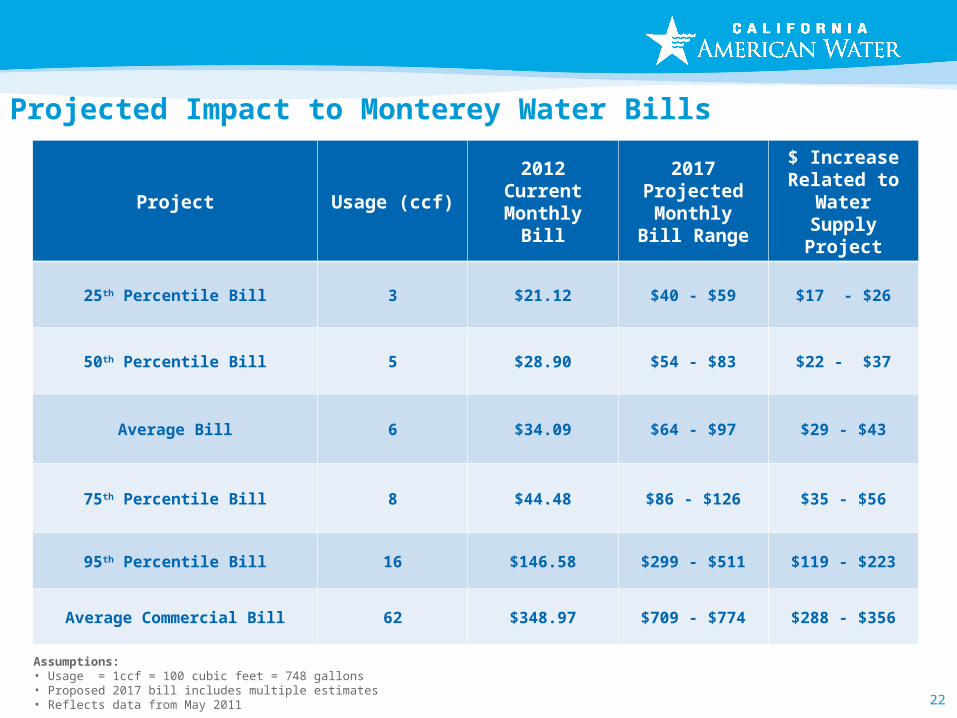
Assumptions:• Usage = 1ccf = 100 cubic feet = 748 gallons• Proposed 2017 bill includes multiple estimates• Reflects data from May 2011 22
Projected Impact to Monterey Water Bills
Project Usage (ccf)2012 Current Monthly Bill
2017 Projected
Monthly Bill Range
$ Increase Related to
Water Supply Project
25th Percentile Bill 3 $21.12 $40 - $59 $17 - $26
50th Percentile Bill 5 $28.90 $54 - $83 $22 - $37
Average Bill 6 $34.09 $64 - $97 $29 - $43
75th Percentile Bill 8 $44.48 $86 - $126 $35 - $56
95th Percentile Bill 16 $146.58 $299 - $511 $119 - $223
Average Commercial Bill 62 $348.97 $709 - $774 $288 - $356
23
Project Governance
• What are Cal-Am’s plans for governance-related issues on the project?
• How will project oversight and governance ensure participation by ratepayers?
• What possible impediments face Cal-Am’s proposed governance structure?
24
Contingency Planning in Light of Possible Impediments to Project Completion and to Meeting December 2016 Deadline
What are potential issues that could delay or derail the project?
• What are Cal-Am’s contigency plans, and related cost and scheduling implications, if:o State Revolving Funds are not available or are significantly limited or
delayed?o ASR replenishment water is significantly limited or not available?o Grey water is not available for recycling?o Slant wells do not meet project technical criteria?o Environmental issues require relocation of desalination facilities or slant
wells?o Capacity or availability of outfall is insufficient?o Amended Ocean Plan sets brine disposal standards that are
incompatible with the project as proposed?o Dynamics of sea water intrusion change in unexpected manner?o Project delays occur due to water rights-related issues; ownership-
related issues; permitting; acquisition of land for desalination facilities

Questions?
25