technical standards and safety authority annual … state of public safety report 2016 edition...
TRANSCRIPT

Annual State of Public Safety Report 2016 Edit ion
Technical Standards and Safety Authority
Annual State of Public Safety Report
2016 Edition

Annual State of Public Safety Report 2016 Edit ion
Acknowledgement
The TSSA would like to express gratitude to its inspectors and engineers for collecting and documenting valuable pieces of information and
data through their inspections and investigations that has been used to develop this report, as well as its Information Services team
for providing the tools and advice for extracting data.
The TSSA would like to especially acknowledge the Public Safety Risk Management (PSRM) team for producing this report.
In particular, the TSSA is thankful to Public Safety Performance Analyst Kavitha Ravindran, Public Safety Risk Advisors Dr. Robert Wiersma, Dwight Reid and Jorge Larez
for helping in the analysis and development of the report, and to Public Safety Risk Advisor Supraja Sridharan for leading the project.
The TSSA would like to thank Project Coordinator, Christine Ho for conducting quality assurance on wording in the report.
The TSSA would like to acknowledge Chief Safety and Risk Officer, Dr. Daniel Hoornweg
and Greg Paoli of Risk Sciences International for their ongoing advice and independent review
and input into various aspects of the report and its preparation.
Annual State of Public Safety Report 2016 Edit ion
List of Acronyms
AD Amusement Devices Program Area
ALARP As Low as Reasonably Practicable
BPV CO
Boilers and Pressure Vessels Program Area Carbon monoxide
ED Elevators Program Area
EM Escalators and Moving Walks Program Area
FE/mpy Fatality-Equivalent(s)/million people/year
FS Fuels Safety Program
MIACC Major Industrial Accidents Council of Canada
OE PCU
Operating Engineers Program Area Passenger Carrying Unit
PSRM RBS
Public Safety Risk Management Risk-Based Scheduling
RIDM Risk-Informed Decision-making
SL Ski Lifts Program Area
The Act [1] Technical Standards and Safety Act
TSSA Technical Standards and Safety Authority
USA Upholstered and Stuffed Articles Program

Annual State of Public Safety Report 2016 Edit ion

Annual State of Public Safety Report 2016 Edit ion
Enhancements to the Annual State of Public Safety Report In line with its commitment to continuous improvement and based on feedback from stakeholders, the TSSA continues to enhance the structure and style of reporting. Based on new information and data, the TSSA also enhances its processes and methodologies in analysis and reporting. Changes to this year's ASPR affecting the results of analysis are discussed herewith. Structural changes are not identified as they are considered as enhancements to the readability of the report and do not impact the analysis.
Characterisation of Non-Compliance TSSA uses a rolling five-year period for measurement and reporting of non-compliance information for this version of the report. For more details on statistical methods, please refer to Appendix A. As part of this year’s report, the TSSA has incorporated a historic non-compliance dashboard as a visual representation of the state of non-compliance as measured through periodic inspections over the time-period of 2012-2016. In framing the state of non-compliance in this dashboard, the TSSA has strived to communicate the extent of high-risk non-compliance, which is indicative of potential safety issues, as well as the value of periodic inspections in proactively identifying non-compliances before their potential manifestation into occurrences with health impacts. The dashboard presents three key measures to characterise the nature of non-compliance observed in each of the regulated program areas. Firstly, the annual non-compliance rate is presented, which indicates the percentage of periodic inspections that were conducted where non-compliances of varying levels of risk were identified. Secondly, a compliance-risk spectrum is presented, which visually represents the nature of non-compliances that were observed during inspections. The spectrum uses a colour scheme from dark green to dark red. The dark green segment represents inspections where no non-compliances were identified (i.e., compliant) or where non-compliances were identified that carried no potential safety risks. Please refer to Appendix B for additional details regarding the TSSA’s assessment of non-compliances issued through periodic inspections. Colour segments beyond dark green represent increasing levels of risk associated with non-compliances ultimately leading to the dark red segment, which represents inspections with observed non-compliance that demonstrate an unacceptable level of risk. Finally, based on the outcomes of these inspections and using TSSA’s patented risk-informed inspection model, the dashboard provides a glimpse of the risk profile of the inventory of technologies/plants across the province.
This report also has an updated version of Appendix C relating to additional high-profile occurrences that underwent detailed causal analysis during 2016. Additionally, this report contains two new appendices. For reference purposes, Appendix D contains overall state of safety data (i.e., occurrences, injuries and observed injury burden) in tabular format. These tables provide the numerical counts of activity in BPV and OE, as well as the indicators graphically portrayed in Figures AD-1, ED-1, EM-1, SL-1 and FS-1. Appendix E contains descriptions and the applications of the TSSA’s Risk-Based Inspection Scheduling model.

Annual State of Public Safety Report 2016 Edit ion
Assumptions and Sources of Uncertainty It is important to note that analysis on compliance trends has been provided over a rolling five-year period, in alignment with the TSSA’s strategic planning process, which typically sets safety strategies within a five-year horizon. This allows for appropriate measurement and reporting on the effectiveness of these strategies. Trend analysis on occurrences is based on an indefinite period, limited by the nature and quality of information available in the TSSA’s database. This will help in better understanding the changing risk profile over extended periods of time. In producing this report, the TSSA makes every effort to ensure a high level of data integrity and continuously works toward improving the integrity of all data collected for the purposes of reporting. To this effect, the TSSA takes every precaution to ensure the accuracy and quality of data presented in the Annual State of Public Safety Report. As such, the TSSA has implemented a Quality Management System (QMS) to ensure accurate presentation of public safety information. The QMS is based on ISO 9001:2008 principles and requirements to assure transparency, data integrity and quality of the information in the report. Occasionally, it is necessary to make restatements to results reported in previous years, typically a result of timeframe factors such as information received subsequent to the issuance of the report, localized reporting lags for periodic data, and other issues. Analysis involving prediction of health impacts and those conducted as part of safety risk assessments have identified and quantitatively accounted for additional sources of uncertainties. Explicitly stated predictions in this report typically represent expected values after accounting for such known sources of uncertainties. In line with its commitment to transparency, the TSSA also began reporting on the range of expected values associated with these measures to give readers a better idea on the uncertainty surrounding these estimates. Analysis involving reported and inspected occurrences may be significantly impacted by reporting biases, defined in Appendix F. Due to the varied nature of reporting across the different regulated sectors, the TSSA is currently unable to quantify the level of reporting bias and is therefore not currently in a position to account for this uncertainty.

Annual State of Public Safety Report 2016 Edit ion
Glossary of Terms
Code Adoption Document (CAD)
The default regulatory instrument for mandatory requirements of general application, such as the adoption of codes and standards. This instrument is used to change or modify TSSA-specific requirements.
Director’s Order A regulatory decision made by a Statutory Director under the powers given to him/her as per the Act.
Director’s Order, Limited Use (s. 27)
Places limits on the operation of a thing that is found to be defective or to not comply with the conditions of its authorization after the thing is fabricated or installed. 27. A director may, (a) establish the limits of operation and use of things that are found to be defective or do not conform with its authorization after fabrication or installation; (b) permit the operation and use of such thing within such limits as are prescribed, or if there are no such limits, as the director considers safe. [1]
Director’s Order, Public Safety (s. 31) Used only where there is or may be a demonstrable threat to public safety and the subject matter has not otherwise been provided for in the Act or regulations. It can require regulation, use or disuse of specified things.
31. In cases where there is or may be a demonstrable threat to public safety, a director may make an order with respect to the following matters if they have not otherwise been provided for in this Act, the regulations or a Minister’s order:
1. Requiring and establishing the form and location of notices, markings or other forms of identification to be used in conjunction with equipment or other things that are prescribed.
2. Regulating, governing and providing for the authorization of the design, fabrication, processing, handling, installation, operation, access, use, repair, maintenance, inspection, location, construction, removing, alteration, service, testing, filling, replacement, blocking, dismantling, destruction, removal from service and transportation of any thing, whether new or used, or a part of a thing and any equipment or attachment used in connection with it. [1]
Disability-Adjusted Life Year (DALY)
A DALY of 1.0 is the loss of one year of healthy life of a single person due to an injury. Please see Appendix F for a full description.
Injury Burden
Quantified health impact determined by integrating injuries and fatalities observed across the population exposed to TSSA-regulated devices/technologies over a period of time. The DALY metric is used to combine injuries and fatalities into a single metric. The injury burden is expressed in the units of fatality-equivalents per exposed population per year. Please refer to Appendix F for additional details.
Door Closing A consequence that could result when elevator doors close and impact a user who is entering or exiting a lift, or attempting to prevent the doors from closing.
Entanglement A consequence that could result when a user’s ski equipment become crossed causing them to lose balance.
Entrapment A consequence that could result when a user’s clothing, footwear or other accessories become caught in the moving parts of a device. Applies to AD, ED, EM and SL.

Annual State of Public Safety Report 2016 Edit ion
External Factors Safety impact related to failures associated with factors outside the direct control of the safety system (e.g. behaviour of users/consumers of technologies and devices in lieu of their intended use, environmental/weather conditions, utility failures). Please refer to Appendix G for additional details.
Fatality-Equivalent A unit of measure obtained by integrating quantified health impacts into a single count of equivalent fatalities for benchmarking and decision-making purposes. Injury burden and Risk of Injury or Fatality are expressed in terms of Fatality-Equivalents. Please refer to Appendix F for additional details.
Fiscal Year Represents the TSSA’s fiscal year (May 1 – April 30)
e.g., 2012 represents fiscal year 2012 (1 May 2011 – 30 April 2012)
Health Impact Refers qualitatively to injuries or fatalities sustained by the public exposed to TSSA regulated devices/ technologies. A health impact could be one of fatal, permanent or non-permanent injuries
Permanent Injury
An injury sustained by an individual that partially or permanently impairs the normal abilities of that individual for the rest of his/her expected remaining life. Please refer to Appendix F for additional details.
Non-Permanent Injury
The consequence of an incident occurrence wherein there was an observed health impact that was estimated to be non-permanent based on the nature of the injury and its associated severity using a methodology developed by the World Health Organization (WHO). A non-permanent injury has no significant impact on the individual's life expectancy at the time of injury. Please refer to Appendix F for additional details.
Inspection An official examination of a device, system or procedure conducted by an inspector under the Act in accordance with Section 17 of the Act [1].
Levelling A consequence that could result when an elevator does not level at the floor landing thereby creating a tripping hazard.
Non-Compliance Rate The percentage of inspections conducted by TSSA inspectors where non-compliances (hazards) with the Technical Standards and Safety Act, 2000 (the Act) [1] and associated regulations are found. Please refer to Appendix A for additional details.
Non-Compliance with the Regulatory System
Safety impact associated with the violation of established regulatory controls (e.g., TSSA-enforced regulations). Please refer to Appendix G for additional details
Occurrence The realisation of a hazard which results in, or has the potential to result in, a consequence to people or property.
Incident An occurrence involving a system/device/component under TSSA’s jurisdiction, whereby a hazard is exposed resulting in a consequence to people or property
Near-miss
An occurrence involving a system/device/component under TSSA’s jurisdiction, whereby a hazard is exposed demonstrating an instance of elevated exposure to risk, while in this particular instance resulting in no consequence to people or property.

Annual State of Public Safety Report 2016 Edit ion
Operational Risk Potential risk of injury or fatality associated with the operation and maintenance of things or class of things regulated under the Act and does not account for sources of risks manifested during the design and installation stages.
Operational Risk considers only those risks that can be observed during an inspection and can be addressed through the issuance of inspection orders.
High, Medium, Low Operational Risk
Potential risk of injury or fatality associated with operation and maintenance of things or class of things that may reach unacceptable levels within timeframes defined by the Statutory Director of each regulated program.
Order The authority to issue an order comes from Section 21 of the Act and is served by an inspector to one who contravenes and/or who corrects a contravention to the Act or associated regulations. Under this section, an inspector may also seal any thing with respect to amusement devices, boilers and pressure vessels, elevating devices, fuels, operating engineers and upholstered or stuffed articles, as referred to in the regulations. Where there is or may be a demonstrable threat to public safety, whether or not the thing is subject to an authorization, an inspection order includes the specific nature of identified contravention, the conditions and actions to be taken to correct the contravention and the allowable time to comply for each identified contravention.
Orders can be classified into high, medium, and low risk bins, which Statutory Directors can define to suit the needs of their program area. With the exception of Operating Engineers, the classifications are defined below. Please see Appendix B for additional details.
High Risk Inspection Order Issued where non-compliance is identified and warrants an inspection order for immediate action within 0 to 10 days, for time to compliance to regulatory requirements.
Medium Risk Inspection Order Issued where non-compliance is identified and warrants an inspection order for action within 11 to 60 days, for time to compliance to regulatory requirements.
Low Risk Inspection Order Issued where a non-compliance is identified and warrants an inspection order for action within 90 days, for time to compliance to regulatory requirements.
Periodic Inspection An inspection conducted at such intervals as may be determined by the Statutory Director, Risk-based scheduling (where applicable), or required by code or regulation for the purpose of ensuring the safe operation of the device/facility.
Physical Impact A consequence that could result when a user of a device comes into contact with the device (e.g. falling roof tiles on an elevator car). Applies to AD, ED, EM and SL.
Potential Gaps in Regulatory System
Safety impact associated with gaps in the regulatory system or where no regulatory control exists. Please refer to Appendix G for additional details.
Prediction Interval A prediction interval is an estimate of an interval into which a new observation will fall, with a certain probability, given what has already been observed. In this report, the prediction interval covers between the 5th and 95th percentiles of the measured data. Observations for those indicators lying outside the prediction intervals are made with a 95% confidence level. Please refer to Appendix A for additional details.

Annual State of Public Safety Report 2016 Edit ion
Risk The combination of the probability of occurrence of harm from a thing or a class of things under Section 2 of the Act and the severity of that harm [1].
Risk of Injury or Fatality
The injury burden predicted using a simulation model to combine the probability of occurrence of harm (estimated as occurrence rates) to someone interacting or exposed to TSSA-regulated devices/technologies and severity of that harm. The Risk of Injury or Fatality metric is expressed in fatality-equivalents per exposed population per year.
This measure of risk accounts for historic occurrences while taking into consideration the uncertainties and variability inherent in the involved parameters such as the occurrence rate, number of victims, age of each victim and types of injuries sustained. Please refer to Appendix F for additional details.
Composite Risk of Injury or Fatality
A single quantified measure of risk of injury or fatality across TSSA-regulated sectors in Ontario. The estimate is only for reporting purposes and may be used for benchmarking.
Safety Order A regulatory decision made by a Statutory Director under the powers given to him/her as per Section 14 of the Act.
Director’s Safety Order (s. 14) [1] Issued to specific persons or classes of persons, to require that specified things not be used or only used in a particular way. The order can also authorize inspectors to address any imminent hazard.
Root Cause The most basic reason (underlying cause) for an occurrence that can be reasonably identified. Please refer to Appendices C and G for additional details.
Trend A statistically representative measure for the noticeable tendency or movement toward or in a particular direction over a measured period of time (e.g. positive trend, negative trend and no significant quarterly trend). Please refer to Appendix A for additional details.
Trip or Fall A consequence that could result when a user of a device stumbles or falls upon entry into or exit from a device. Applies to AD, ED, EM and SL.
Water Exposure A consequence that could result when a device is impacted by water damage. Applies to AD, ED, EM and SL.

Annual State of Public Safety Report 2016 Edit ion
Table of Content
I. Message on the State of Public Safety from Srikanth Mangalam, the Chief Advisor,
Public Safety Risk Management ................................................................................... 1
I.1 State of Safety Highlights ........................................................................................................................3
II. Introduction ..................................................................................................................... 9
II.1 Reducing Risk of Injury or Fatality – Understanding and Managing Causes and Behaviours ........9
III. Program-Specific State of Safety and Compliance and TSSA Strategies ............... 12
III.1 Boilers and Pressure Vessels .............................................................................................................. 12 III.1.1 Risk Assessment ............................................................................................................................. 12 III.1.2 Risk Management – Message from Mike Adams, Statutory Director of BPV and OE .................... 13
III.2 Operating Engineers ............................................................................................................................. 14 III.2.1 Risk Assessment ............................................................................................................................. 14 III.2.2 Risk Management – Message from Mike Adams, Statutory Director of BPV and OE .................... 14
III.3 Amusement Devices .............................................................................................................................. 16 III.3.1 Risk Assessment ............................................................................................................................. 16 III.3.2 Risk Management – Message from Roger Neate, Statutory Director, AD Safety Program ............ 20
III.4 Elevators ................................................................................................................................................. 22 III.4.1 Risk Assessment ............................................................................................................................. 22 III.4.2 Risk Management – Message from Roger Neate, Statutory Director, ED Safety Program ............ 26
III.5 Escalators and Moving Walks .............................................................................................................. 28 III.5.1 Risk Assessment ............................................................................................................................. 28 III.5.2 Risk Management – Message from Roger Neate, Statutory Director of EM Safety Program ........ 31
III.6 Passenger Ropeways (Ski Lifts) .......................................................................................................... 33 III.6.1 Risk Assessment ............................................................................................................................. 33 III.6.2 Risk Management – Message from Roger Neate, Statutory Director of SL Safety Program ......... 36
III.7 Fuels Safety ............................................................................................................................................ 38 III.7.1 Risk Assessment ............................................................................................................................. 38 III.7.2 Risk Management – Message from John Marshall, Statutory Director of Fuels Safety Program ... 57
III.8 Upholstered and Stuffed Articles ......................................................................................................... 62 III.8.1 Risk Assessment ............................................................................................................................. 62 III.8.2 Risk Management – Message from the Statutory Director, USA Program ..................................... 63
IV. References .................................................................................................................... 64
V. Appendix ....................................................................................................................... 65
Appendix A – Statistical Methods .................................................................................................................... 65 Appendix B – Risk-Informed Inspection Order Management ........................................................................ 66 Appendix C – High Profile Root Cause Analysis ............................................................................................ 70 Appendix D – Overall State of Safety Measures for 2008 – 2016 .................................................................. 81 Appendix E – Risk-Based Inspection Scheduling .......................................................................................... 85 Appendix F – Risk of Injury or Fatality Metric ................................................................................................. 87 Appendix G – Causal Analysis Categories ..................................................................................................... 93
Annual State of Public Safety Report 2016 Edit ion

Annual State of Public Safety Report 2016 Edit ion
1 | P a g e
I. Message on the State of Public Safety from Srikanth Mangalam, the Chief Advisor, Public Safety Risk Management
Observations on the Current State of Public Safety
As reported in the 2015 report, the following sources of risk of injury or fatality to Ontarians continue to be observed:
The composite risk of injury or fatality to Ontarians continues to remain below the risk acceptability criteria (i.e., 1.00 fatality/million people/year);
Failure of regulated technologies continue to be below the risk acceptability criteria and are reducing over time;
Technologies periodically inspected by the TSSA remain low and have reduced compared to 2015; and
Lack of, or improper maintenance and inappropriate use of fuel burning appliances in private dwellings continue to be the largest contributor to the risk of injury or fatality, and continue to demonstrate a level of risk beyond acceptable levels.
As of 2016 report, the following new observations are noted:
Fuel-related risks at institutions housing sensitive subpopulations have reduced and now demonstrate an acceptable level of risk; and
Carbon Monoxide (CO) exposures at multi-unit residential dwellings now demonstrate a level of risk beyond acceptable levels.
When exposed to TSSA-regulated technologies and devices, since 2008, Ontario has observed 53 fatalities, 389 permanent injuries and 8,437 non-permanent injuries, resulting in a nine-year average injury burden of approximately 0.45 fatality equivalents/million people/year (FE/mpy)1. Using a predictive approach developed by the TSSA [2], it is estimated that the composite risk of injury or fatality to Ontarians2 or the expected injury burden is approximately 0.86 FE/mpy3. The composite risk of injury or fatality as of 2015 was approximately 0.89 FE/mpy. The change compared to last year is within the limits of uncertainty and cannot considered as significant. While there is no significant change in the estimated risk of injury or fatality, increasing trends continue to be observed in the number of occurrences, permanent injuries and non-permanent injuries with respective rates of 6% per year, 7% per year and 5% per year. These increases are largely as a result of continued improvements in reporting from the amusement device sector and increases in the number of injury occurrences due to carbon monoxide exposures at residential locations. Measures representing the overall state of safety4 are represented graphically in Figure 1 below.
1 Fatality-equivalent/million people/year is a unit of measure obtained by integrating quantified health impacts into a single count of equivalent fatalities for benchmarking and decision-making purposes. 2Readers are cautioned that composite risk of injury or fatality has been established for reporting and benchmarking purposes only. Sections
provided for the individual safety programs help gain an understanding of the significant causes, and more importantly, strategies for
monitoring and managing risk to Ontarians. 3 Represents expected estimate of a simulated distribution, 5th and 95th percentiles are 0.46 and 1.32 FE/mpy respectively. 4 Readers may refer to Appendix D for numerical representations

Annual State of Public Safety Report 2016 Edit ion
2 | P a g e
Figure 1: State of safety of regulated program areas over the last nine years.
0.00
0.50
1.00
1.50
2.00
2.50
0
500
1000
1500
2000
2500
3000
3500
2008 2009 2010 2011 2012 2013 2014 2015 2016
Ob
serv
ed
In
jury
Bu
rden
(FE
/mp
y)
Nu
mb
er
Fiscal Year
Number of Occurrences Number of Fatalities
Number of Permanent Injuries Number of Non-Permanent Injuries
Observed Injury Burden (FE/mpy)

Annual State of Public Safety Report 2016 Edit ion
3 | P a g e
I.1 State of Safety Highlights The TSSA uses a risk-informed approach to understand the state of safety across its regulated sectors, identify safety issues and establish priorities. The state of safety is described using a risk metric, known as risk of injury or fatality that is measured in terms of FE/mpy. This measure helps compare against international benchmarks and risk acceptability criteria, and to set internal thresholds for decision-making. The TSSA has adopted the risk acceptability criteria established by the MIACC as shown in Figure 2 below for comparison purposes. Specifically, the TSSA uses criterion of 1.0 fatality/million people/year for evaluating risk to the general population of Ontario and a criteria of 0.3 fatalities/million people/year for evaluating risks to sensitive sub-populations.
Figure 2: MIACC risk acceptability criteria.
Additionally, for the purposes of better understanding the sources of risk and establishing priorities, the TSSA has adapted the use of ALARP principles [3], which was originally created in the UK and is widely used to assist in decision-making. As shown in Figure 3 below, ALARP helps mapping risks into regions or zones ranging from unacceptable, tolerable to acceptable.
Figure 3: TSSA adaptation of ALARP principles for classifying risk sources.
Acceptable Risk(<50% of Risk Acceptability
Criteria)
Tolerable Risk(≥ 50% of Risk Acceptability
Criteria)
Unacceptable Risk(≥ Risk Acceptability Criteria)

Annual State of Public Safety Report 2016 Edit ion
4 | P a g e
Sources of risk identified as being in the unacceptable (red) zone are considered to exceed the acceptability levels defined in the MIACC criteria. These sources of risk exceed the risk acceptability criteria for the general population or for sensitive subpopulations and are deemed to be unacceptable. The TSSA identifies these sources of risk as immediate safety priorities. The TSSA has chosen to use a criteria equivalent to or greater than 50% of the risk acceptability criteria to represent the tolerable (yellow) zone also known as the ALARP zone. These sources of risk are below the risk acceptability criteria for the general public or for sensitive subpopulations, and are deemed to be tolerable. The TSSA considers these sources of risk as potentially emerging areas of risk and are monitored and/or addressed through mitigation strategies. As suggested under ALARP principles, decisions to address these sources of risk will take into account factors such as cost-benefit, stakeholder points of view, effectiveness, etc. Sources of risk less than 50% of the risk acceptability criteria are identified to fall under the acceptable (green) zone. Those sources of risk are deemed to be within broadly acceptable levels and do not require immediate mitigation strategies. While the TSSA considers these sources as not being of immediate concern, it continues to monitor and oversee these sources using the various regulatory tools available. Figure 4 below provides a more comprehensive view of the risk of injury or fatality across the different TSSA-regulated safety sectors.
Figure 4: Risk of Injury or Fatality across TSSA-regulated program areas.
Figure 5 below provides an illustration of the sources of risk using ALARP principles. Observations and significant highlights based on this view of risk profile, including those areas seeing a risk reduction, and those areas that are of potential concern as compared to the previous year are discussed further below.
0
0.2
0.4
0.6
0.8
1
1.2
1.4
Ski
Lif
ts
Esc
ala
tors
&M
ov
ing
Wa
lks
Am
us
em
en
tD
evic
es
Ele
vato
rs
Fu
els
Safe
ty
Ris
k o
f In
jury
or
Fa
tali
ty(F
ata
lity
-Eq
uiv
ale
nts
/mil
lio
n p
eo
ple
/ye
ar)
Risk Sources
Risk Acceptability Criteria (General Public)

Annual State of Public Safety Report 2016 Edit ion
5 | P a g e
Figure 5: The TSSA’s sources of risk and priorities.
Sources of Risk of Injury or Fatality in Unacceptable Zone The following sources of risk within TSSA-regulated sectors have been identified to be unacceptable, as they exceed the defined threshold levels. These sources of risk are the TSSA’s most significant safety priorities.
1. Risk of Injury or Fatality at Private Dwellings due to Fuel Burning Appliances
The risk of injury or fatality due to poor installation and/or lack of maintenance and improper use of fuel burning appliances such as furnaces, water heaters, and boilers at private dwellings is predicted as 1.78 FE/mpy. Exposure to unacceptable levels of CO formed due to improper combustion of fuel used by heating appliances at private dwellings continues to remain the single largest source of risk across all TSSA-regulated sectors. CO is an odourless gas that, at unacceptable levels, can cause health impacts ranging from nausea to death. Fires and explosions, while secondary in impact to CO poisonings, have also been observed resulting from aforementioned causes. The TSSA continues to consider CO exposures at private dwellings as its primary safety concern and a broader public health issue. As part of a renewed CO risk mitigation strategy, the TSSA has begun establishing partnerships with partners including public health agencies, industry, non-profit groups etc. at provincial, national and global levels to share a common understanding and address an emerging global public health issue.
2. Risk of Injury or Fatality due to CO exposures at Multi-Unit Residential Locations
The risk of injury or fatality due to CO poisoning at multi-unit residential locations is predicted as 1.10 FE/mpy. In particular, there is an increasing trend in the number of occurrences of 7% per year. Additionally, the levels of risk are the highest at community housing locations and apartments. The risk of injury or fatality is driven by inadequate maintenance, particularly with venting components. This increase is primarily due to improved reporting practices. The investigations for a large number of occurrences and associated injuries that took place in previous years were completed during 2016 and contributed to the increase.

Annual State of Public Safety Report 2016 Edit ion
6 | P a g e
Sources of Risk of Injury or Fatality in Tolerable Zone: As indicated above, these sources of risk are within the tolerable zones and are identified as emerging risks that require either monitoring and/or addressing to prevent them from becoming unacceptable in the future.
3. Risk of Injury or Fatality due to external factors including unsafe passenger behaviour on Elevators
The risk of injury or fatality resulting from external factors including unsafe behaviour on elevators is predicted as 0.64 FE/mpy. Occurrences are increasing by 18% per year and are largely taking place at residential locations involving rental and condominium units, which on their own accounted for over 35% of occurrences related to elevators. Additionally, occurrences involving passengers being struck by closing doors are increasing by 10% per year. Factors such as distracted users are identified as primary causes for such occurrences. The TSSA continues to analyze these occurrences further to determine if device-related issues may have contributed to such occurrences in addition to user behaviour.
4. Risk of Injury or Fatality due to fuel-burning appliances at Commercial Establishments
The risk of injury or fatality at commercial establishments is predicted as 0.52 FE/mpy. There continues to be an increasing trend in the number of occurrences of 8% per year. The greatest risks were observed at food service locations, such as restaurants and bakeries. Related occurrences involved poor maintenance practices of appliances, such as stove and ovens, resulting in grease fires, and explosions resulting from delayed ignition.
Sources of Risk in Acceptable Zone: Sources of risk that demonstrate low levels of risk of injury or fatality fall into this category. In general, sources of risk caused by operation and maintenance of technologies periodically inspected by the TSSA continue to remain within acceptable levels and have decreased since last year.
5. Reduction in Risk of Injury or Fatality due to Fuel-Burning Appliances at Institutions at Locations with Sensitive Sub-Populations
The risk of injury or fatality due to poor installation, maintenance or use of fuel-burning appliances at institutions, such as hospitals, nursing homes, retirement homes, schools etc., housing Ontario’s vulnerable population was identified as an area of concern in the 2012 Annual Safety Public Report. The acceptability threshold at these locations5 [4] is recognized to be lower than that of the general population [5, 6] of exposure, as the ability to evacuate the residents at these locations during emergencies is more challenging. The risk of injury or fatality at these locations as a group has reduced compared to last year and remains below the more stringent threshold. However, the risk due to fuel burning appliances specifically at academic locations is estimated to be 0.24 FE/mpy, which demonstrates a tolerable level of risk. Occurrences at academic locations represent 63% of the occurrences that took place in institutions. While no major incidents have taken place at these locations, the TSSA continues to monitor such occurrences and is working collaboratively with Ontario school boards to gain a better understanding of the issues and address it using a partnership approach.
5 0.3 x 10⁻⁶ according to the PSM Division, CSChE. Major Industrial Accidents Council of Canada (MIACC) Criteria for land-use planning
(2008).

Annual State of Public Safety Report 2016 Edit ion
7 | P a g e
Risk-Informed Decision-Making at the TSSA The TSSA’s RIDM framework, initiated in 2007, is an evidence-based, scientific approach to identifying, analyzing, measuring and managing risk of injury or fatality to Ontarians caused through interaction with TSSA-regulated technologies, devices and products. It is a framework to assist in the effective use of available regulatory tools under the Act, through efficient allocation of the TSSA’s resources, and leveraging partnerships with stakeholders. This report acts a primary source of information for risk-informed decision-making. The TSSA’s RIDM framework continues to assist statutory directors across all safety programs in making regular day-to-day decisions while helping tackle larger and more complex strategic regulatory decisions. The TSSA’s RIDM framework is also beginning to be recognized and used for addressing broader public policy issues. Work is underway towards the development of a national guideline on Managing Risks in the Public Interest, a vision that was put forward by the TSSA and successfully accepted by national and international bodies. Some key highlights of RIDM-based work during the past fiscal year have included:
1. Regulators Workshop
The TSSA organized an international workshop entitled "Future of Risk-Informed Resource Allocation - A Workshop for Science Based Regulators", in Toronto on November 11 and 12, 2015. The workshop, which was the first of its kind in Canada, was organized for regulators and government agencies from Canada, USA and Finland to foster discussion on risk-informed regulatory decision-making with particular emphasis on recognizing challenges in implementation and opportunities for collaboration. The workshop was a success with 40 participants in attendance. High-level outcomes included:
Providing support to the development of a National Public Risk Guideline being led by Standards Council of Canada and Underwriters Laboratories on behalf of the TSSA and other provincial regulators, by directly participating on the committee and/or indirectly contributing by reviewing the document prior to publication; and
Consensus by all participants for the need to formalise a collaborative network such as a centre for risk excellence for continued discussions, sharing of ideas and best practices, data and resources.
2. Risk-Informed Carbon Monoxide Risk Mitigation Strategy
Health risks associated with CO poisoning resulting from fuel-burning appliances in private and multi-residential dwellings continues to remain the primary source for concern for the TSSA. The TSSA continues to work towards reducing this source of risk by the application of a variety of strategies including regulatory, public education and stakeholder partnerships with some progress. While the TSSA continues to be seen as a leader in its public education and research intervention approaches, it is becoming clear that, on its own, the TSSA may not be able to achieve an aspirational goal of zero fatalities and injuries with respect to CO poisonings. The overall reduction in risk would require a more collaborative effort and innovative methods to better characterize, communicate and manage the risk as a public health burden. An international collaborative network (Canada [TSSA], USA, England, France, Italy) has been formed which met at an international summit organized by the US Centre of Disease Control in January 2016 with the following objectives:
To identify and establish means for sharing global data on mortality and injury rates associated with CO;
To identify common standards for analysis of risk factors and causal information associated with CO exposures; and
To share best practices on intervention methods used to manage and reduce public health burden associated with CO poisonings.

Annual State of Public Safety Report 2016 Edit ion
8 | P a g e
Amongst many results arising from this meeting, the following key action items were identified:
The US Centre for Disease Control and Prevention will foster a partnership between the TSSA and the Northern States in the US to begin sharing data, information and best practices on CO risks and interventions including the TSSA’s approaches to risk assessment, public education and research;
International Conference on Assessment and Management of Carbon Monoxide Risks will be organized in Toronto in November 2016, which will bring together multi-disciplinary international experts to discuss CO risks and identify mitigation solutions; and
TSSA will interact with various Canadian agencies including Public Health Ontario, Parachute Canada, Canadian Association of Poison Control Centres, and Health Canada to leverage resources and efforts and position CO as a significant public health issue in Ontario and Canada.
3. Risk-Informed Innovative Solutions to Mitigating Risk of Injury or Fatality In response to ongoing safety issues such as CO exposures, door-closing occurrences on elevators, and fuel oil leaks from residential oil tanks, the TSSA, in partnership with external stakeholders, academia, expert groups and agencies, has begun research and development efforts evaluating the possible applications of innovative technologies. Applications such as smart sensors would assist in real-time detection and response to potential technical/product failures and prevent occurrences proactively. In addition to reducing risks, such applications provide other ancillary benefits including reduction of regulatory burden (e.g., smarter allocation of resources for inspections), create incentives for industry and owners and position the TSSA to better address emerging technologies. Future versions of this document will reflect outcomes of these efforts.
4. Risk-Informed Approaches to Modernization of Regulations
In line with the government of Ontario drive towards reduction of regulatory burden while continuing to ensure high levels of public safety and in the wake of emerging new technologies, the TSSA positions itself as a leader to tackle such challenges using its RIDM approach. In particular, during the course of the year and moving forward, such approaches are being proposed as most effective solutions as part of the regulatory enhancements for the Operating Engineers regulation, and for addressing emerging Liquefied Natural Gas storage and dispensing facilities in in Ontario. RIDM solutions were also provided and are being considered while addressing the following regulatory policy challenges:
Presence of US-based recreational vehicles fitted with propane burning appliances without Ontario permits;
Mobile fuel dispensing facilities; and
Accessibility provisions on amusement rides for persons with disabilities.

Annual State of Public Safety Report 2016 Edit ion
9 | P a g e
II. Introduction Statutory Directors appointed by the TSSA have regulatory powers and obligations to effectively administer the Technical Standards and Safety Act (the Act) [1] and its associated regulations to ensure the safety of Ontarians. The Chief Advisor, Public Safety Risk Management is responsible for providing strategic advice and information to the Statutory Directors for them to make risk-informed decisions to reduce the risk of injury of fatality to Ontarians. The Annual State of Public Safety Report (ASPR) is a key component of the TSSA’s risk-informed decision-making (RIDM) framework and provides information on the state of safety of Ontarians interacting with TSSA-regulated technologies. The ASPR is also a public facing document that describes the safety strategies established by the Statutory Directors and those responsible for preventative and educational tools to enhance safety and reduce risk of injury or fatality to Ontarians. This year’s version of the ASPR, while presenting the current state of safety for a nine-year period ending April 30, 2016, continues to focus on providing a deeper understanding of the causes and behaviours contributing to the overall level of risk. Throughout this report, all references to specific years refer to the TSSA’s fiscal year which runs from May 1st to April 30th.
II.1 Reducing Risk of Injury or Fatality – Understanding and Managing Causes and Behaviours The risk of injury or fatality to Ontarians across the different TSSA-regulated sectors is estimated primarily using information gathered through reported and investigated occurrences (incidents and near-misses), and complemented with information collected through the TSSA’s inspections and other regulatory oversight tools. The information collected allows the TSSA to analyze the primary causes associated with occurrences, and helps Statutory Directors establish and implement strategies aimed at reducing risks. This two-stage process of assessing and managing risks depicts the public safety risk management framework that can best be illustrated using Figure 6 shown below.

Annual State of Public Safety Report 2016 Edit ion
10 | P a g e
Figure 6: Public Safety Risk Management Framework.
The three primary causal categories identified in Figure 6, and as defined in Appendix G that lead to occurrences include the following. II.1.1 Potential Gaps in Regulatory System Advancements in regulated sectors including emerging technologies lacking adequate regulatory oversight including, codes and standards, form one aspect of this category. Risks in such cases are typically unknown or may not be estimated due to limited data availability. However, the potential hazards with such technologies may be known or ascertained. Another subset of this category involves safety gaps that are inadequately addressed by the current regulatory system. Examples include technologies designed to older codes and standards that may be prone to fail over time.
Non-Compliance with
Regulatory systemPotential Gaps in
Regulatory system
Emerging Issues(e.g., new technologies
with no standards)
Significant Causes(Design, Installation, Operation and Maintenance)
Fatalities
RISK ASSESSMENT
RISK ASSESSMENT METRICS
Director’s Orders/
Code Adoption Amendments/
Regulation Changes
Issued Orders
RISK MANAGEMENT
Risk Based Periodic Inspections
and
Enforcement/Engineering
Reviews
Issued Orders Trend
RISK MANAGEMENT METRICS
Risk of Injury or Fatality
(Safety Program-Specific)
Known Safety Gaps
External Factors
User Behaviour and
Interaction with
Technology
Other(weather, sabotage, etc.)
Other TSSA Regulated
TechnologyTSSA Periodically
Inspected Technology
Risk
Observed Injury Burden Risk of Injury or Fatality
Safety Trends
Injuries Occurrences
Audits and
Targeted InspectionsSafety Orders
User Behaviour
Research and Public Education
Compliance Inspections and OrdersUser Behaviour
Research and Public Education
Recall RateCompliance Rate
Trend
Risk-Based
Inventory ProfileCompliance Rate
Permanent Non-Permanent

Annual State of Public Safety Report 2016 Edit ion
11 | P a g e
In both above-mentioned cases, the TSSA may be able to address the gaps through interim tools such as Director’s Orders. In certain instances, the TSSA may recommend the need to effect changes to regulations. II.1.2 Non-Compliance with Regulatory System This category of occurrences results from actions not compliant with the regulatory requirements by those statutorily responsible for the design, manufacture, installation, operation and/or maintenance of TSSA-regulated technologies and devices. The level of understanding, education, required skills and training of these regulated stakeholders or responsible parties, such as owners of technologies, installation and maintenance technicians, along with their intent to comply, affects this category of risks. The level and type of the TSSA’s regulatory oversight of these activities varies from program to program. In most instances, the regulatory expectations of the TSSA are specified in the Act [1] and its associated regulations. A key oversight function involves the TSSA conducting initial and periodic inspections of devices before and during their operation. Risks falling in this category are identified and reduced through the introduction and/or enhancement of the TSSA’s existing regulatory oversight tools. Increasing levels of risk in this category may require the introduction, expansion or modification of existing TSSA regulatory oversight powers such as inspections and audits. Another important regulatory tool to manage significant risks involves the use of Director’s Orders, and in certain instances regulatory changes may also be recommended. The TSSA may also use advocacy tools and form collaborative partnerships with relevant stakeholders such as other government agencies, regulated sectors and affected parties, to raise awareness and influence organizational behavioral change and compliance. II.1.3 External Factors Occurrences take place despite the presence of an adequate regulatory management system. Risks in this category are typically caused due to the use of technologies and devices by users, such as members of the public in lieu of their intended purpose. A comprehensive understanding of user behaviour helps the TSSA set up appropriate public education tools through collaborative partnerships with stakeholders including consumer advocacy groups, regulated sectors, public education organizations etc. to reduce risk in this category. Other reasons under this category may include environmental factors such as weather, deliberate intent or sabotage, occurrences involving TSSA-regulated technologies but due to factors outside of the TSSA’s jurisdiction etc. Typically in such cases, other regulatory agencies may take on primary investigation and management of the risks with the TSSA’s technical support and expertise. In rare circumstances, changes may be made to the TSSA’s regulatory tools to address the risk.

Annual State of Public Safety Report 2016 Edit ion
12 | P a g e
III. Program-Specific State of Safety and Compliance and TSSA Strategies
III.1 Boilers and Pressure Vessels The Boilers and Pressure Vessels Safety Program area operates within a strong regulatory and standards infrastructure, which provides effective protection for the public from any incidents involving pressure vessels. The TSSA is involved in all aspects of the lifecycle of pressure vessels: from design, to manufacture, to installation, to operation and maintenance, to decommissioning – plus the certification of all boiler inspections. Boilers and pressure vessels include equipment that produce and distribute hot water, steam, compressed air, and other compressed liquids and gases used in commerce and industry. The TSSA is responsible for regulating all pressure retaining components manufactured or used in Ontario, with a commitment to ensuring the safety of boilers, pressure vessels and piping systems. The TSSA conducts periodic inspections on uninsured boilers and pressure vessels in Ontario. The remaining insured boilers and pressure vessels are inspected by insurance companies licensed to underwrite boiler and machinery insurance. The TSSA is responsible for the certification of the inspectors employed by the insurance companies. Incidents involving this type of equipment and associated piping are infrequent. Nevertheless, cracked and corroded vessels or piping can leak or rupture, producing a variety of safety problems, including poisonings, suffocations, fires or explosions. Ruptures can be catastrophic and may immediately threaten life and property. The safe design, installation, operation, and maintenance of pressure vessels, in accordance with appropriate codes and standards, are essential to public safety. The TSSA’s activities help ensure that safeguards are in place for the lifecycle of this type of equipment. III.1.1 Risk Assessment There were 19 occurrences, four permanent injuries and one non-permanent injury attributed to regulated boilers, pressure vessels and piping systems in the province over the last nine years. Measures representing the overall state of safety6 have been detailed in this section. In 2016, there were five occurrences that were reported and had their inspection investigations completed for which the details have been included below:
a compressed argon leak in a warehouse
an explosion involving a conventional boiler, which was caused due to lack of maintenance procedures. The occurrence resulted in flying debris, and a worker was injured.
a piping system failure resulting in a leak, which was caused due to a lack of installation procedures. The occurrence resulted in a worker becoming injured.
a reactor or piping leak in an industrial plant, which was caused due to insufficient maintenance procedures
a delayed ignition involving a boiler in an office location, which resulted in an explosion. The occurrence was caused due to defective or failed components.
Additionally, there were two occurrences that were reported in previous years and had their inspection investigations completed in 2016, for which the details have been included below:
a pressure boundary failure of a safety valve that was connected to an air receiver. The occurrence was caused due to insufficient installation procedures
an occurrence that resulted in an ammonia vapour release. The occurrence involved the sight glass shattering on the evaporator freezer.
Due to limited data on occurrences and health impacts, estimates of risk or trends associated with occurrences cannot be currently established.
6 Readers may refer to Appendix D for numerical representations

Annual State of Public Safety Report 2016 Edit ion
13 | P a g e
III.1.2 Risk Management – Message from Mike Adams, Statutory Director of BPV and OE The TSSA conducts periodic inspections of uninsured boilers and pressure vessels to determine the level of compliance in the province of Ontario. The frequency of those inspections is specified in the Code Adoption Document associated with the Ontario Regulation 220/01 (Boilers and Pressure Vessels). The TSSA deals with non-compliance by requiring the owners/operators to address observed non-conformances within an appropriate timeframe through the issuance of inspection orders. This periodic inspection process contributes to the preventative management of risk associated with boilers and pressure vessels. The non-compliance rate measured over the last five years is 1%7 and does not demonstrate any significant trend. The top non-compliances that were identified through periodic inspections related to requirements for an owner or any other party to do what is necessary for an inspector to conduct a proper inspection, and requirements for an owner to ensure that equipment is maintained in a safe operating condition and operated safely. The predominant non-compliance involves pressure relief valves not being served with the required five-year interval. Regarding safety-related performance targets, BPV now compares the TSSA BPV periodic inspection compliance results with the National Board’s Violations Tracking KPI. The National Board records periodic inspection results from 33 BPV jurisdictions in North America, representing 628,031 periodic inspections over a 12-month period, with a 90.7% compliance rate, or a 9.3% non-compliance rate. The TSSA non-compliance rate varies from 0% to 7%. The BPV target is to get as close to 0% non-compliance as practical, but to always be better than the National Board results.
7 Represents median of five-year distribution; lower and upper bounds are 0% and 7% respectively.

Annual State of Public Safety Report 2016 Edit ion
14 | P a g e
III.2 Operating Engineers Operating engineers, also known as power engineers in jurisdictions outside Ontario, are certified professional power plant operators who oversee the provision of energy, climate control, electric power or other utilities for thermal-electric generating stations, industrial processes and facilities. They manage, operate and maintain boilers, steam turbines and engines, gas compression plants, refrigeration plants, and associated mechanical and electrical systems in power generation, industrial processes and environmental system plants.
Depending upon the size of a specific facility, operating engineers may also manage, operate and maintain all physical facility operations. Large power plants have several operating engineers for each shift, designated as shift engineers and assistant shift engineers. In all cases, a chief operating engineer is responsible for the entire plant management, operation and maintenance. The Operating Engineers Safety Program area is responsible for registering, inspecting and regulating the safety of approximately 3,200 plants in Ontario, as well as examining and certifying nearly 12,700 operating engineers and operators to confirm their qualifications. These activities ensure that all operating engineers and operators in Ontario have the skills and knowledge to safely manage, operate and maintain registered power plants. III.2.1 Risk Assessment
There were nine occurrences, one fatality, three permanent and three non-permanent injuries reported over the past nine years. Measures representing the overall state of safety8 have been detailed in this section. In 2016, there were two reported occurrences, for which their inspection investigations were completed. The occurrence details have been included below. The first occurrence involved a mechanic removing a pipe plug from a refrigeration plant, which resulted in an ammonia release into the surrounding area. The cause of the occurrence was attributed to improper and negligent work practices on the part of the operator. This occurrence resulted in a fatality and two permanent injuries. The second occurrence involved equipment failure at a high-pressure low water volume power plant. The cause of the occurrence was attributed to a defective or failed component including safety devices. One non-permanent injury was sustained. Due to limited data, estimates of risk of injury or fatality or trends based on past occurrences cannot be currently established involving registered operating plants.
III.2.2 Risk Management – Message from Mike Adams, Statutory Director of BPV and OE
The TSSA conducts periodic inspections of approximately 3,200 registered operating plants in Ontario. These periodic inspections assist in maintaining a low to negligible risk of injury or fatality to Ontarians that may result from non-compliance with the regulatory requirements. The TSSA uses a risk-based inspection scheduling process [7] to determine the frequency of inspections of all registered plants. Data collected through these inspections helps prioritize frequency of inspections and to proactively manage risk of injury or fatality.
Figure OE-1 provides information on key indicators associated with the results of the periodic inspections. No RBS profiles were estimated for 2015 and therefore that information is not available.
8 Readers may refer to Appendix D for numerical representations

Annual State of Public Safety Report 2016 Edit ion
15 | P a g e
Figure OE-1: Dashboard of key indicators of outcomes of periodic inspections conducted on operating plants (2012-2016).
Figure OE-1 indicates that the observed percentage of non-compliant inspections ranges from 56% to 63% over the measured period. The median non-compliance rate observed over the measured period is 58%9, and there is no demonstrable trend in the non-compliance rate. While the non-compliance rate provides an outcome of the periodic inspection (e.g., pass or fail), the compliance-risk spectrum (shown as pie charts for the past five years) portrays the potential safety risks associated with non-compliances found during the inspection. The spectrum indicates that less than 1% (0.1 – 0.4%) of all inspections conducted in all the past five years pose unacceptable levels of risk and, as indicated by the dark red segment. The TSSA deals with observed non-compliances by issuing inspection orders to the owner/operator to address these non-compliances within an appropriate timeframe. This periodic inspection process contributes to the preventative management of risk of injury or fatality associated with operating plants. Using a risk-based approach (i.e., RBS), the entire inventory is inspected at least once over a two-year period. The RBS model, described in Appendix E in detail, is based on a historic profile of the nature and significance of non-compliances found at the plants. The RBS profile of operating plants in Ontario has shifted from medium to low risk suggesting an improving level of safety at these locations. This is commensurate with the outcomes of inspections over the past five years (indicated by the compliance-risk spectrum) despite a flat trend with the non-compliance rate. As of 2016 snapshot, there are 120 high-risk facilities out of a total of 3,06910 plants. In particular, refrigeration plants accounted for 33% of high risk facilities. These locations represent 40% of the total provincial inventory of assessed OE plants. Additionally, plants at public service and manufacturing buildings respectively accounted for 31% and 19% of high-risk facilities. These locations respectively represent 35% and 14% of the total provincial inventory of assessed OE plants.
9 Represents median of five-year distribution; lower and upper bounds are 50% and 72% respectively. 10 This number changes on a daily basis, as new plants are added and old plants are decommissioned. The number here is as of 18 July,
2016, and may be different from the previous number reported which is from a different time stamp.

Annual State of Public Safety Report 2016 Edit ion
16 | P a g e
III.3 Amusement Devices The TSSA regulates approximately 2,240 permitted amusement devices in Ontario by ensuring all rides conform to the Act and applicable regulations, codes and standards. The TSSA reviews and registers rides, issues permits for each ride in the current operating season, licenses operators, conducts inspections and incident investigations, and delivers public awareness campaigns throughout the province. Amusement devices under the TSSA’s jurisdiction include: roller coasters, Ferris wheels, merry-go-rounds (and other circular motion rides), water slides, flume rides, dry slides, go-karts, bumper carts, inflatables (inflatable bouncers), bungee devices, bungee-assisted bounces, zip lines (track and cable rides), and other generic spinning and whirling rides. The trend analysis presented in this section considers the predominantly seasonal nature of the operation of these devices. The trend analysis confirms and takes into account seasonality while establishing historical patterns of safety and compliance performance. III.3.1 Risk Assessment General Overview There have been 2,969 occurrences, no fatalities, 136 permanent injuries and 2,684 non-permanent injuries reported for which occurrence inspections were completed. Measures representing the overall state of safety11 are represented graphically in Figure AD-1 below. Based on actual injuries observed over the measured period, the average rate of injury is 24.1 injuries/million people/year. Using the TSSA’s approach to integrating injuries and fatalities, this corresponds to a nine-year average injury burden of approximately 0.03 FE/mpy, representing no change from last year. Based on the 2,240 devices in the province, this translates to an observed injury burden of 2.00 x 10⁻⁴ fatality-equivalents/device/year. Based on all occurrences over the past nine years, the TSSA’s predictive [2] model estimates the risk of injury or fatality to Ontarians using amusement devices to be 0.11 FE/mpy12. Based on the 2,240 devices in the province, this translates to a risk of 6.50 x 10⁻⁴ fatality-equivalents/device/year. There are increasing trends in the number of occurrences, permanent injuries and non-permanent injuries of 8%, 9% and 7% respectively. Figure AD-2 illustrates the top issues related to amusement devices in terms of the primary causal pathway. As indicated in the pie chart in Figure AD-2, approximately 95% of the risk caused over the past nine years is due to factors external to the regulatory environment.
11 Readers may refer to Appendix D for numerical representations 12 Represents expected estimate of a simulated distribution; 5th and 95th percentiles are 0.03 and 0.26 FE/mpy respectively.

Annual State of Public Safety Report 2016 Edit ion
17 | P a g e
Figure AD-1: State of safety across amusement devices over the last nine years.
0.00
0.20
0.40
0.60
0.80
1.00
0
200
400
600
800
1000
2008 2009 2010 2011 2012 2013 2014 2015 2016
Ob
serv
ed
In
jury
Bu
rden
(FE
/mp
y)
Nu
mb
er
Fiscal YearNumber of Occurrences Number of Fatalities
Number of Permanent Injuries Number of Non-Permanent Injuries
Observed Injury Burden (FE/mpy)

Annual State of Public Safety Report 2016 Edit ion
18 | P a g e
Figure AD-2: Causal pathway of amusement device safety issues (based on period ending 2016).

Annual State of Public Safety Report 2016 Edit ion
19 | P a g e
Risk of Injury or Fatality due to External Factors As indicated in Figure AD-2, risks due to factors external to the regulatory environment continue to represent the largest source of risk in amusement devices. There is an increasing trend in the number of occurrences of 10% per year. In particular, 96% of all amusement device occurrences were due to user behaviour. Based on available data, the most predominant consequences of amusement device occurrences over the past seven years were physical impacts, and trips or falls sustained by riders. Physical Impacts Physical impact occurrences accounted for over 40% of external factor occurrences on amusement devices and 10% of related observed injury burden. There is an increasing trend in the number of related occurrences of 10% per year. Coaster rides accounted for 15% of related occurrences and 35% of related observed injury burden. These occurrences primarily took place in the PCU area of the device. In particular, head injuries were sustained by patrons in 50% of these occurrences. Circular rides accounted for 12% of related occurrences and 3% of related observed injury burden. These occurrences primarily took place in the PCU area of the device. In particular, head injuries were sustained by patrons in 50% of these occurrences. Waterslides accounted for 23% of related occurrences and 15% of related observed injury burden. These occurrences primarily took place in the flume and PCU areas of the waterslide. In particular, head injuries were predominant and resulted in nearly 50% of the waterslide occurrences and nearly 75% of associated observed injury burden. Zip lines accounted for 22% of related occurrences and 27% of related observed injury burden. These occurrences primarily took place in the landing area of the zip line, or involved pulleys. Though head injuries accounted for 8% of the zip line occurrences, they accounted for over 80% of observed injury burden. Hand injuries were predominant and resulted in nearly 35% of the zip line occurrences. Trips or Falls Trip or fall occurrences accounted for over 20% of external factor occurrences on amusement devices and nearly 70% of related observed injury burden. There is an increasing trend in the number of related occurrences of 5% per year. Waterslides accounted for over 45% of related occurrences and 95% of observed injury burden. These occurrences primarily took place in the flume area of the waterslide. In particular, head injuries accounted for nearly 60% of occurrences on waterslides and nearly 44% of related observed injury burden. Circular rides accounted for over 15% of related occurrences and 0.2% of observed injury burden. These occurrences primarily took place in the loading or unloading areas of the circular ride. In particular, head injuries accounted for nearly 40% of the circular ride occurrences and over 40% of related observed injury burden. Coaster rides accounted for over 10% of related occurrences and 2% of observed injury burden. These occurrences primarily took place in the loading or unloading areas of the coaster ride. In particular, head injuries accounted for nearly 30% of the coaster ride occurrences and over 90% of related observed injury burden.

Annual State of Public Safety Report 2016 Edit ion
20 | P a g e
III.3.2 Risk Management – Message from Roger Neate, Statutory Director, AD Safety Program
Managing Risks on Amusement Devices due to External Factors Increasing trends in the number of occurrences and injuries reported to the TSSA are primarily due to better reporting by major operators during the past three years resulting from ongoing communication and dialogue between the TSSA and industry. With the continued trend of a majority of incidents being related to unsafe human behaviour, the TSSA has implemented a new behaviour checklist that will be utilized by inspectors to gain a better understanding of what happened during the occurrence and how the user interacted with the device. Insights gathered from the data from these checklists will help drive our mitigation strategies in future years. The TSSA is also working with industry partners to increase the level of awareness in the industry with regard to making amusement rides accessible to persons with disabilities. Together with industry, we are seeking to change the mindset such that designers and operators of rides clearly state what abilities are needed to ride safely as opposed to excluding people based on disabilities. Ensuring Compliance on Amusement Devices through Regulatory Inspections and Oversight The TSSA conducts periodic inspections of all amusement devices annually to oversee and manage the state of compliance across approximately 2,240 permitted amusement devices in the province of Ontario. Amusement device operations are generally seasonal in nature with a few devices operating all year round. The TSSA deals with non-compliances by requiring the owner/operator to address observed failures within an appropriate timeframe through the issuance of inspection orders. This periodic inspection process contributes to the preventative management of risk associated with amusement devices as evidenced by the low number of observed occurrences due to non-compliances.
For amusement devices, the ride operators perform an important role in ensuring that the users are adhering to the rules for safe riding. Part of the TSSA’s inspection is to witness the operation of the ride and verify that operating procedures are being followed, thus managing the risk of non-compliance.
Figure AD-3 provides information on key indicators associated with the results of the periodic inspections. This figure indicates that the observed percentage of non-compliant inspections ranges from 33% to 41% over the measured period. The median non-compliance rate observed over the measured period is 35%13, and there is no demonstrable trend in the non-compliance rate. While the percentage non-compliance provides an outcome of the periodic inspection (e.g., pass/fail), the compliance-risk spectrum (shown as pie charts for the past three years) portrays the potential safety risks associated with non-compliances found during the inspection. The spectrum indicates that 4% to 6% of all inspections conducted in each of the past three years pose unacceptable levels of risk, and are indicated in the dark red segment. The non-compliances identified through these inspections, which contributed to this observed safety risk pertained to ensuring that all aspects of lap bar restraints are fully operational, ensuring that PCUs are smooth and free of sharp edges and adhering to minimum fencing distance from moving parts of AD. Using a risk-based approach, an RBS profile has been generated for the entire inventory for the first time in this report. The RBS profile indicates that as of 2016 snapshot, there are no high-risk devices. Nearly 80% of medium risk devices were generic amusement devices. These generic amusement devices comprise one-third of the entire qualified inventory.
13 Represents median of five-year distribution; lower and upper bounds are 0% and 93% respectively.

Annual State of Public Safety Report 2016 Edit ion
21 | P a g e
Figure AD-3: Dashboard of key indicators of outcomes of periodic inspections conducted on amusement devices (2012-2016).

Annual State of Public Safety Report 2016 Edit ion
22 | P a g e
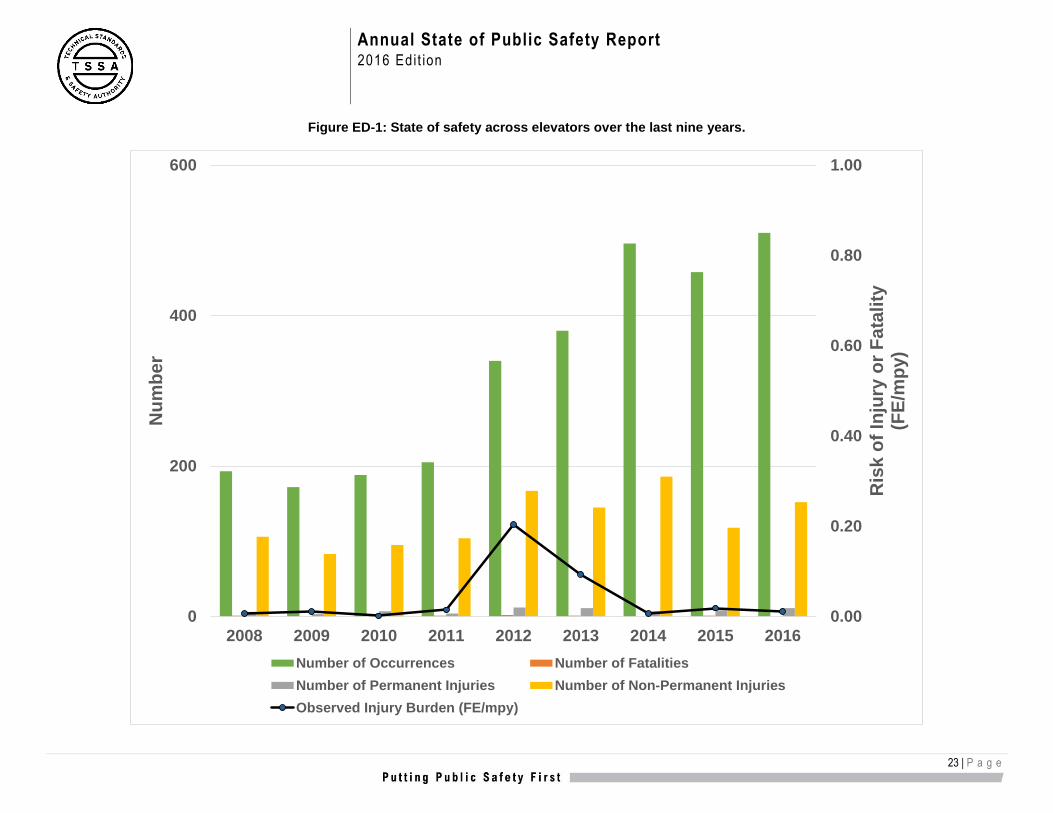
III.4 Elevators The TSSA regulates over 55,200 elevators in Ontario to ensure all devices conform to the Act, and applicable regulations, codes and standards. The TSSA reviews and registers elevating devices, issues licences, conducts inspections and performs incident investigations. These devices include elevators (passenger, freight, hand-powered, observation, sidewalk, temporary elevators, and limited use/limited application elevators), dumbwaiters, material and freight platform lifts (type A and B), lifts for persons with physical disabilities, man-lifts, construction hoists, incline lifts, stage lifts, and parking garage lifts. III.4.1 Risk Assessment General Overview There have been 2,942 occurrences, six fatalities, 69 permanent injuries and 1,156 non-permanent injuries reported for which occurrence inspections were completed. Measures representing the overall state of safety14 are represented graphically in Figure ED-1 below. Based on actual injuries observed over the measured period, the average rate of injury is 10.5 injuries/million people/year. Using the TSSA’s approach to integrating injuries and fatalities, this corresponds to a nine-year average injury burden of approximately 0.04 FE/mpy. Based on the 55,200 devices in the province, this translates to an observed injury burden of 9.57 x 10⁻⁶ fatality-equivalents/device/year. Based on all occurrences over the past nine years, the TSSA’s predictive [2] model estimates the risk of injury or fatality to Ontarians using elevators to be 0.75 FE/mpy15. Based on the 55,200 devices in the province, this translates to a risk of 1.77 x 10⁻⁴ fatality-equivalents/device/year There are increasing trends in the number of occurrences, permanent injuries and non-permanent injuries of 14%, 8% and 6% respectively. Figure ED-2 illustrates the top issues related to elevators in terms of the primary causal pathway. As indicated in this pie chart, approximately 78% of the risk caused over the past nine years is due to factors external to the regulatory environment.
14 Readers may refer to Appendix D for numerical representations 15 Represents expected estimate of a simulated distribution; 5th and 95th percentiles are 0.36 and 1.20 FE/mpy respectively.
Annual State of Public Safety Report 2016 Edit ion
23 | P a g e
Figure ED-1: State of safety across elevators over the last nine years.
0.00
0.20
0.40
0.60
0.80
1.00
0
200
400
600
2008 2009 2010 2011 2012 2013 2014 2015 2016
Ris
k o
f In
jury
or
Fata
lity
(FE
/mp
y)
Nu
mb
er
Number of Occurrences Number of Fatalities
Number of Permanent Injuries Number of Non-Permanent Injuries
Observed Injury Burden (FE/mpy)

Annual State of Public Safety Report 2016 Edit ion
24 | P a g e
Figure ED-2: Causal pathway of elevators safety issues
(based on period ending 2016).

Annual State of Public Safety Report 2016 Edit ion
25 | P a g e
Risk of Injury or Fatality on Elevators due to External Factors As indicated in Figure ED-2, risks due to factors external to the regulatory environment continue to represent the largest source of risk in elevators. There is an increasing trend in the number of occurrences of 18% per year. Water Exposure Elevator occurrences caused by damage due to water exposure accounted for 35% of all external factor related occurrences. The increase in the number of these occurrences is due to improved reporting of these occurrences to the TSSA by elevator contractors and industry. While no health impacts were observed, these occurrences involved water getting into elevators and elevator shafts, causing damage, and carried the potential of carrying injuries due to electrical and physical hazards. Unsafe User Behaviour In particular, 75% of all elevator occurrences were due to unsafe user behaviour. Based on available data, the most predominant consequences of elevator occurrences over the past seven years was due to elevator car doors closing on passengers and leveling. Elevator Doors Closing on Passengers Door closing occurrences accounted for 28% of external factor occurrences and 60% of associated observed injury burden. Office locations accounted for 25% of related occurrences and 3% of associated observed injury burden. Mercantile locations accounted for 17% of all related occurrences and 6% of associated observed injury burden. Despite accounting for only 18% of related occurrences, 84% of associated observed injury burden took place in rental locations. Hospitals accounted for 10% of related occurrences and 1% of associated observed injury burden. Door closing occurrences are the most predominant consequence of external factor related elevator occurrences in hospitals, and represent one third of related occurrences in hospitals. Levelling & Trip or Fall Levelling occurrences accounted for 20% of external factor occurrences and 23% of associated observed injury burden. Rental locations accounted for nearly 30% of related occurrences and 20% of associated observed injury burden. Office locations accounted for 23% of related occurrences and 25% of associated observed injury burden. Despite accounting for 16% of related occurrences, 44% of observed injury burden relating to external factor leveling occurrences took place in condominiums.

Annual State of Public Safety Report 2016 Edit ion
26 | P a g e
III.4.2 Risk Management – Message from Roger Neate, Statutory Director, ED Safety Program Managing Risks on Elevators due to External Factors In the second quarter of fiscal year 2015/2016, the TSSA implemented an enhanced version of its Risk-based Scheduling Model for periodic inspections. This innovative model utilizes standard orders with predetermined risk rankings to quantify the level of potential risk for each elevating device, which in turn drives a recommended inspection schedule between six months and five years. This model allows the TSSA make the most efficient use of its inspection resources by ensuring that devices that present more risk are subject to more frequent inspections. Please see Appendix E for more detailed description of RBS 2.5. As noted earlier, we continue to see an increasing trend in occurrences. Similar to previous years, the most prevalent occurrences are related to doors, either by impact when entering or exiting the elevator or while trying to prevent elevator doors from closing. In the coming year, the TSSA will be piloting a new user behaviour checklist to gain a better understanding of what happened during the occurrence and how the user interacted with the device. At the same time, we are also engaging industry partners to explore potential new technologies that may, in the future, be able to predict a rider’s intentions and take corrective action before a person is struck by a closing door. Ensuring Compliance on Elevators through Regulatory Inspections and Oversight
The TSSA conducts periodic inspections of all elevators on a risk-based approach to oversee and manage the state of compliance across approximately 55,200 elevators in the province of Ontario. The TSSA deals with non-compliances by requiring the owner/operator to address observed failures within an appropriate timeframe through the issuance of inspection orders. This periodic inspection process contributes to the preventative management of risk associated with elevators. Figure ED-3 provides information on key indicators associated with the results of the periodic inspections. This figure indicates that the observed percentage of non-compliant inspections ranges from 66% to 78% over the measured period. The median non-compliance rate observed over the measured period is 74%16, and there is an increasing trend in the non-compliance rate of 3% per year. Increasing trends in the non-compliance rate of a similar magnitude were observed in rental locations, offices, hospitals, industrial locations and mercantile locations. While the non-compliance rate provides an outcome of the periodic inspection (e.g., pass or fail), the compliance-risk spectrum (shown as pie charts for the past five years) portrays the potential safety risks associated with non-compliances. The spectrum indicates that 0.1% to 0.2% of all inspections conducted in each of the past three years demonstrated unacceptable levels of risk, and are indicated in the dark red segment. The non-compliances identified through these inspections, which contributed to this observed safety risk, pertained to oil loss monitoring requirements. Over 85% of these non-compliances were identified through periodic inspections conducted in hospitals. Using a risk-based approach, the RBS profile indicates that as of 2016, rental locations continue to have the largest number of high-risk devices, followed by offices and hospitals. Industrial locations, hospitals and mercantile locations have the greatest number of normalised high-risk devices.
16 Represents median of five-year distribution; lower and upper bounds are 60% and 79% respectively.

Annual State of Public Safety Report 2016 Edit ion
27 | P a g e
Figure ED-3: Dashboard of key indicators of outcomes of periodic inspections conducted on elevators (2012-2016).

Annual State of Public Safety Report 2016 Edit ion
28 | P a g e
III.5 Escalators and Moving Walks The TSSA regulates approximately 2,200 escalators and moving walks in Ontario to ensure all devices conform to the Act and applicable regulations, codes and standards. The TSSA reviews and registers escalators and moving walks, issues licences, conducts inspections and performs incident investigations. III.5.1 Risk Assessment General Overview There have been 5,044 occurrences, one fatality, 37 permanent injuries and 3,506 non-permanent injuries reported for which occurrence inspections were completed. Measures representing the overall state of safety17 are represented graphically in Figure EM-1 below. Based on actual injuries observed over the measured period, the average rate of injury is 30.3 injuries/million people/year. Using the TSSA’s approach to integrating injuries and fatalities, this corresponds to a nine-year average injury burden of approximately 0.03 FE/mpy. Based on the 2,200 devices in the province, this translates to an observed injury burden of 1.74 x 10⁻⁴ fatality-equivalents/device/year. Based on all occurrences over the past nine years, the TSSA’s predictive [2] model estimates the risk of injury or fatality to Ontarians using escalators and moving walks to be 0.08 FE/mpy18. Based on the 2,200 devices in the province, this translates to a risk of 4.67 x 10⁻⁴ fatality-equivalents/device/year. There is an increasing trend in the number of occurrences of 3%. There are no demonstrable trends in the number of permanent injuries or non-permanent injuries. Figure EM-2 illustrates the top issues related to escalators and moving walks in terms of their primary causal pathway. As indicated in the pie chart, approximately 97% of the risk caused over the past nine years is due to factors external to the regulatory environment.
17 Readers may refer to Appendix D for numerical representations 18 Represents expected estimate of a simulated distribution; 5th and 95th percentiles are 0.01 and 0.21 FE/mpy respectively.

Annual State of Public Safety Report 2016 Edit ion
29 | P a g e
Figure EM-1: State of safety across escalators and moving walks over the last nine years.
0.00
0.20
0.40
0.60
0.80
1.00
0
200
400
600
800
1000
2008 2009 2010 2011 2012 2013 2014 2015 2016
Ob
serv
ed
In
jury
Bu
rden
(FE
/mp
y)
Nu
mb
er
Fiscal Year
Number of Occurrences Number of Fatalities
Number of Permanent Injuries Number of Non-Permanent Injuries
Observed Injury Burden (FE/mpy)
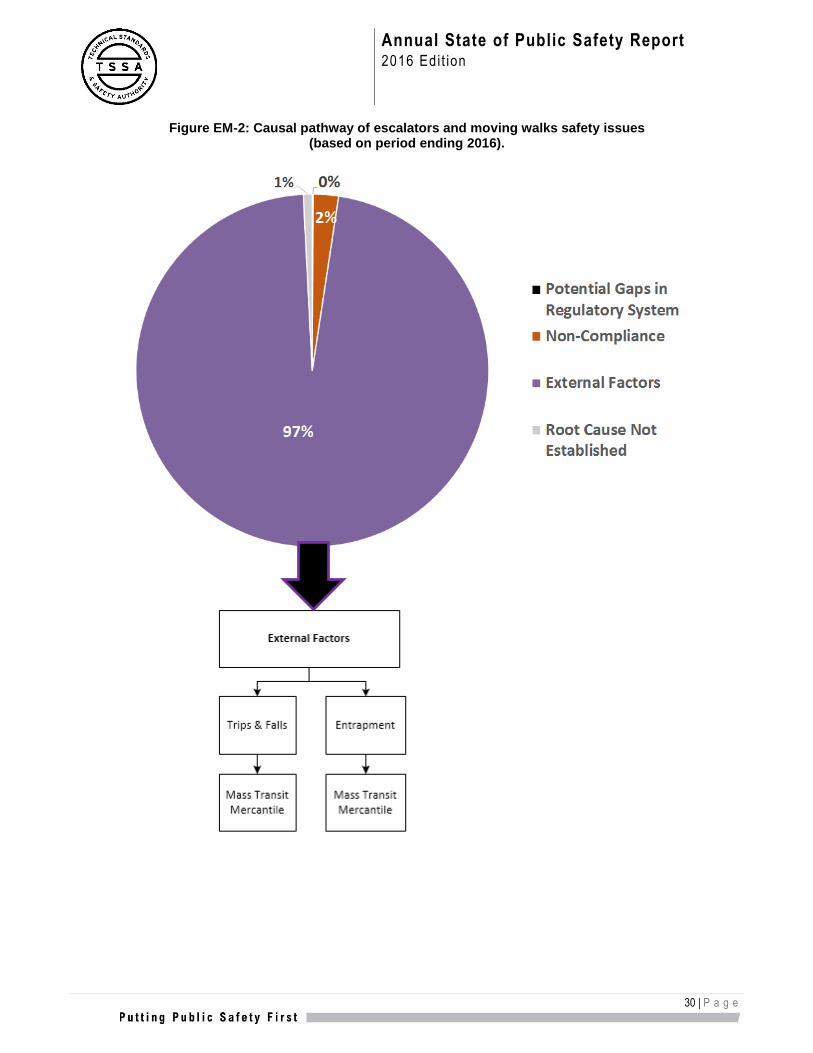
Annual State of Public Safety Report 2016 Edit ion
30 | P a g e
Figure EM-2: Causal pathway of escalators and moving walks safety issues (based on period ending 2016).

Annual State of Public Safety Report 2016 Edit ion
31 | P a g e
Risk of Injury or Fatality on Escalators & Moving Walks due to External Factors As indicated in Figure EM-2, risks due to factors external to the regulatory environment continue to represent the largest source of risk in escalators and moving walks. There is an increasing trend in the number of occurrences of 4% per year. Unsafe user behaviour continues to be the leading cause of occurrences in this category. Trips or Falls Trip or fall occurrences accounted for nearly 80% of external factor occurrences and over 90% of associated observed injury burden. There is an increasing trend in the number of these occurrences of 7% per year. Mass transportation locations accounted for nearly 60% of related occurrences and over 10% of associated observed injury burden. Over 5% of occurrences in these locations involved intoxicated patrons. Mercantile locations accounted for nearly 35% of related fall occurrences and over 85% of associated observed injury burden. Entrapment Entrapment occurrences accounted for over 5% of external factor occurrences and 0.2% of associated observed injury burden. There is no demonstrable trend in the number of occurrences. Mass transportation locations accounted for nearly 55% of related occurrences and 60% of associated observed injury burden. Over 25% of these occurrences involved patrons’ clothing getting caught in the escalator. Mercantile locations accounted for over 35% of related occurrences and over 25% of associated observed injury burden. III.5.2 Risk Management – Message from Roger Neate, Statutory Director of EM Safety Program Managing Risks on Escalators & Moving Walks due to External Factors The TSSA will continue to monitor occurrence activity involving escalators and moving walks. In the coming year, the TSSA will be piloting a new user behaviour checklist to gain a better understanding of what happened during the occurrence and how the user interacted with the device. Ensuring Compliance on Escalators & Moving Walks through Regulatory Inspections and Oversight
The TSSA conducts periodic inspections of all escalators and moving walks to oversee and manage the state of compliance across approximately 2,200 escalators and moving walks in the province of Ontario. While the current inspections intervals for all escalators has been set at two years, it is anticipated that a risk-based approach will be implemented at the end of six years (three sets of periodic inspections). The TSSA deals with non-compliances by requiring the owner/operator to address observed failures within an appropriate timeframe through the issuance of inspection orders. This periodic inspection process contributes to the preventative management of risk associated with escalators and moving walks. Figure EM-3 provides information on key indicators associated with the results of periodic inspections. This figure indicates that the observed percentage of non-compliant inspections ranges from 83% to 90% over the measured period. The median non-compliance rate observed over the measured period is 87%19, and there is no demonstrable trend in the non-compliance rate. While the non-compliance rate provides an outcome of the periodic inspection (e.g., pass or fail), the compliance-risk spectrum (shown as pie charts for the past five years) portrays the potential safety risks associated with non-compliances found during the inspection. The spectrum indicates that 0.3% to 6% of all inspections conducted in each of the past three years demonstrated the greatest safety risk, and are indicated in the dark red segment. The non-compliances identified through these inspections, which contributed to this observed safety risk
19 Represents median of five-year distribution; lower and upper bounds are 71% and 98% respectively.

Annual State of Public Safety Report 2016 Edit ion
32 | P a g e
pertained to brake torques or no loading stopping distances conforming to the indicated value on the brake data plate. Using a risk-based approach, the RBS profile indicates that as of 2016, there are no high-risk devices. Nearly 60% of all medium risk devices are located in mercantile locations. Mercantile devices comprise nearly 40% of the entire qualified provincial inventory.
Figure EM-3: Dashboard of key indicators of outcomes of periodic inspections
conducted on escalators & moving walks (2012-2016).

Annual State of Public Safety Report 2016 Edit ion
33 | P a g e
III.6 Passenger Ropeways (Ski Lifts) The TSSA regulates chair lifts, bar lifts, outdoor recreational conveyers, rope tows and tube tows, totalling over 260 ski lifts in Ontario, to ensure all devices conform to the Act and applicable regulations, codes and standards. The TSSA reviews and registers lift designs, conducts inspections, and performs incident investigations. It also licences lift devices, ensuring they conform to Ontario safety standards. In partnership with the Ontario Snow Resorts Association, the TSSA additionally provides public education throughout the province, promoting safer ski lift behaviour. The trend analysis outlined in this section considers the predominantly seasonal nature of these devices. The trend analysis confirms and takes into account seasonality, while establishing historical patterns of safety and compliance performance. III.6.1 Risk Assessment General Overview There have been 800 occurrences, no fatalities, 21 permanent injuries and 653 non-permanent injuries reported for which occurrence inspections were completed. Measures representing the overall state of safety20 are represented graphically in Figure SL-1 below. Based on actual injuries observed over the measured period, the average rate of injury is 5.8 injuries/million people/year. Using the TSSA’s approach to integrating injuries and fatalities, this corresponds to a nine-year average injury burden of approximately 1.42 x 10⁻² FE/mpy. Based on the 260 devices in the province, this translates to an observed injury burden of 6.98 x 10⁻⁴ fatality-equivalents/device/year. Based on all occurrences over the past nine years, the TSSA’s predictive [2] model estimates the risk of injury or fatality to Ontarians using ski lifts to be 0.01 FE/mpy21. Based on the 260 devices in the province, this translates to a risk of 5.15 x 10⁻⁴ fatality-equivalents/device/year There are no demonstrable trends in the number of occurrences, permanent injuries or non-permanent injuries. Figure SL-2 illustrates the top issues related to ski lifts in terms of their primary causal pathway. As indicated in the pie chart, approximately 97% of the risk caused over the past nine years is due to factors external to the regulatory environment.
20 Readers may refer to Appendix D for numerical representations 21 Represents expected estimate of a simulated distribution; 5th and 95th percentiles are 0 and 0.08 FE/mpy respectively.

Annual State of Public Safety Report 2016 Edit ion
34 | P a g e
Figure SL-1: State of Safety across ski lifts over the last nine years.
0.00
0.20
0.40
0.60
0.80
1.00
0
50
100
150
200
2008 2009 2010 2011 2012 2013 2014 2015 2016
Ob
serv
ed
In
jury
Bu
rden
(FE
/mp
y)
Nu
mb
er
Fiscal Year
Number of Occurrences Number of Fatalities
Number of Permanent Injuries Number of Non-Permanent Injuries
Observed Injury Burden (FE/mpy)

Annual State of Public Safety Report 2016 Edit ion
35 | P a g e
Figure SL-2: Risk of Injury or Fatality in ski lifts by cause
(based on period ending 2016).

Annual State of Public Safety Report 2016 Edit ion
36 | P a g e
Risk of Injury or Fatality on Ski Lifts due to External Factors Approximately 94% of the risk caused over the past nine years was due to external factors, primarily resulting from unsafe user behaviour. Falls Falls accounted for nearly 50% of external factor occurrences and 80% of associated observed health impact. Chairlifts accounted for 80% of related occurrences and 100% of associated observed health impact. Nearly two-thirds of these chairlift occurrences took place in the loading or unloading area of the chairlift. Nearly 20% of the occurrences that took place on chairlifts took place in the chair area of the ride, however represented nearly 95% of associated observed health impacts. Riders experienced leg injuries in 30% of chairlift occurrences and head injuries in 20% of chairlift occurrences. Bar lifts accounted for nearly 15% of related occurrences and 0.1% of associated observed health impact. Nearly 45% of occurrences on bar lifts took place on the bar area of the bar lift and 40% of associated observed health impacts. Riders experienced head injuries in nearly 70% of bar lift occurrences. Physical Impact Physical impact occurrences accounted for over 30% of external factor occurrences and nearly 5% of associated observed health impacts in this causal category. Chairlifts accounted for over two-thirds of related occurrences and 98% of associated observed health impacts. Nearly 55% of occurrences on chairlifts took place on the loading and/or the unloading areas of the chairlift ride and represented over 35% of associated observed health impacts on chairlifts. Over 25% of occurrences on chairlifts took place on the restraint area of the chairlift ride and represented 40% of associated observed health impacts on chairlifts. Riders experienced head injuries in over 40% of chairlift occurrences, and leg injuries in nearly 20% of chairlift occurrences. Bar lifts accounted for nearly 30% of related occurrences and 2% of associated observed health impact. Nearly 80% of occurrences on bar lifts took place on the bar area of the bar lift and represented over 70% of associated observed health impacts. Riders experienced head injuries in nearly 80% of related bar lift occurrences. Entanglement Entanglement occurrences accounted for nearly 10% of occurrences and 4% of associated observed health impacts. Chairlifts accounted for over 85% of related occurrences and nearly 90% of associated observed health impacts. Nearly 50% of occurrences on chairlifts took place on the loading and/or the unloading areas of the chairlift ride, and represented 50% of observed health impacts on chairlifts. Riders experienced leg injuries in over 60% of chairlift occurrences. III.6.2 Risk Management – Message from Roger Neate, Statutory Director of SL Safety Program Managing Risks on Ski Lifts due to External Factors The TSSA continues to use RBS for ski inspections with the inspection frequency ranging from as often as twice a season to once every two years. Persons falling from chairs continues to be a major concern for both the TSSA and industry members. The TSSA is currently exploring new technologies with industry partners that in the future may allow control systems that automatically detect persons who have failed to load properly and subsequently stop the lift.

Annual State of Public Safety Report 2016 Edit ion
37 | P a g e
Ensuring Compliance on Ski Lifts through Regulatory Inspections and Oversight The TSSA conducts periodic inspections of all ski lifts on a risk-based approach to oversee and manage the state of compliance across approximately 260 ski lifts in the province of Ontario. The TSSA deals with non-compliances by requiring the owner/operator to address observed failures within an appropriate timeframe through the issuance of inspection orders. This periodic inspection process contributes to the preventative management of risk associated with ski lifts. Figure SL-3 provides information on key indicators associated with the results of the periodic inspections. Figure SL-3 indicates that the observed percentage of non-compliant inspections ranges from 45% to 56% over the measured period. The median non-compliance rate observed over the measured period is 48%22, and there is a decreasing trend in the non-compliance rate of 3% per year. While the non-compliance rate provides an outcome of the periodic inspection (e.g., pass or fail), the compliance-risk spectrum (shown as pie charts for the past five years) portrays the potential safety risks associated with non-compliances found during the inspection. The spectrum indicates that 3% to 6% of all inspections conducted in each of the past three years pose unacceptable levels of risk, as indicated in the dark red segment. The non-compliances identified through these inspections, which contributed to this observed safety risk pertained to the adjustment of emergency brakes to provide the manufacturer-recommended braking force and permissible stopping distances related to service brakes and surfaces. Using a risk-based approach, the RBS profile indicates that as of 2016, there are 18 high-risk devices evenly distributed amongst the qualified provincial inventory. Nearly 50% of all high-risk devices are chairlifts. Chairlifts represented 52% of the qualified provincial inventory.
Figure SL-3: Dashboard of key indicators of outcomes of periodic inspections conducted on ski lifts (2012-2016).
22 Represents median of five-year distribution; lower and upper bounds are 0% and 74% respectively.

Annual State of Public Safety Report 2016 Edit ion
38 | P a g e
III.7 Fuels Safety The TSSA regulates the transportation, storage, handling and use of fuels to ensure compliance with the Act and applicable regulations, codes and standards. These fuels include: natural gas, propane, butane, hydrogen, digester gas, landfill gas, fuel oil, gasoline and diesel. The TSSA licences fuel facilities, registers contractors and certifies tradespersons who install and service equipment. Additionally, the TSSA reviews and approves facility plans for sites licensed by the TSSA, and performs custom equipment approvals and inspection services to ensure fuel is handled and used safely. The three stages of the fuels life-cycle that fall under the TSSA’s jurisdiction are:
transmission, distribution and transportation;
storage and dispensing; and
utilization (burning). III.7.1 Risk Assessment General Overview There have been 6,637 occurrences, 46 fatalities, 126 permanent injuries and 438 non-permanent injuries reported for which occurrence inspections were completed. Measures representing the overall state of safety23 are represented graphically in Figure FS-1 below. Based on actual injuries observed over the measured period, the average rate of injury is 5.2 injuries/million people/year. Using the TSSA’s approach to integrating injuries and fatalities, this corresponds to a nine-year average injury burden of approximately 0.33 FE/mpy. The TSSA’s predictive [2] model estimates the risk of injury or fatality to Ontarians using fuel-fired appliances to be 1.22 FE/mpy24. There are no demonstrable trends in the number of occurrences, permanent injuries or non-permanent injuries. Figure FS-2 illustrates the top issues related to fuel-burning appliances in terms of their primary causal pathway. As indicated in the pie chart, approximately 63% of the risk caused over the past nine years is due to non-compliance with regulatory requirements.
23 Readers may refer to Appendix D for numerical representations 24 Represents expected estimate of a simulated distribution; 5th and 95th percentiles are 0 and 5.06 FE/mpy respectively.

Annual State of Public Safety Report 2016 Edit ion
39 | P a g e
Figure FS-1: State of safety across fuels safety over the last nine years.
0.00
0.20
0.40
0.60
0.80
1.00
0
100
200
300
400
500
600
700
800
900
1000
2008 2009 2010 2011 2012 2013 2014 2015 2016
Ob
serv
ed
In
jury
Bu
rden
(FE
/mp
y)
Nu
mb
er
Fiscal Year
Number of Occurrences Number of Fatalities
Number of Permanent Injuries Number of Non-Permanent Injuries
Observed Injury Burden (FE/mpy)
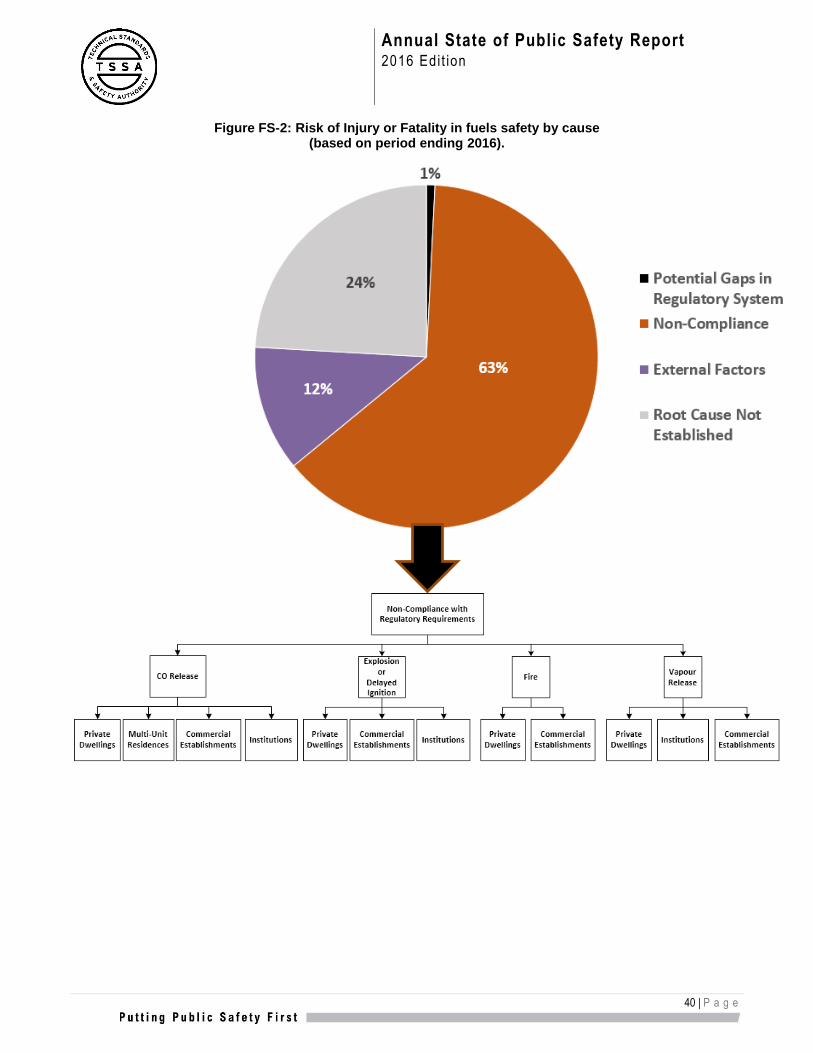
Annual State of Public Safety Report 2016 Edit ion
40 | P a g e
Figure FS-2: Risk of Injury or Fatality in fuels safety by cause (based on period ending 2016).

Annual State of Public Safety Report 2016 Edit ion
41 | P a g e
Risk of Injury or Fatality due to Non-Compliance with Regulatory System The risk of injury or fatality attributed to non-compliance with regulatory requirements accounts for 63% of the overall level of risk in the Fuels program. There is a decreasing trend in the number of occurrences related to non-compliances of 4% per year. Risk of Injury or Fatality at Private Dwellings There have been 3,364 occurrences, 38 fatalities, 73 permanent injuries and 221 non-permanent injuries reported for which occurrence inspections were completed. These occurrences resulted in CO release, fire, explosion and vapour release. Measures representing these historical observations25 are represented graphically in Figure FS-3. Based on actual injuries observed over the measured period, the average rate of injury is 2.8 injuries/million people/year. Using the TSSA’s approach to integrating injuries and fatalities, this corresponds to a nine-year average injury burden of approximately 0.25 FE/mpy. The TSSA’s predictive [2] model estimates the risk of injury or fatality to Ontarians to be 1.78 FE/mpy26. Fuel-related risks at private dwellings continue to demonstrate an unacceptable level of risk. There is an increasing trend in the number of occurrences at private dwellings of 5% per year.
Figure FS-3: State of safety across private dwellings over the last nine years.
25 Readers may refer to Appendix D for numerical representations 26 Represents expected estimate of a simulated distribution; 5th and 95th percentiles are 0.41 and 3.91 FE/mpy respectively.
0
0.2
0.4
0.6
0.8
1
0
200
400
600
800
1000
2008 2009 2010 2011 2012 2013 2014 2015 2016
Ob
serv
ed
In
jury
Bu
rden
(FE
/mp
y)
Nu
mb
er
of
Occu
rre
nces o
r In
juri
es
Fiscal Year
Number of Occurrences Number of Fatalities
Number of Permanent Injuries Number of Non-Permanent Injuries
Observed Injury Burden (FE/mpy)
Annual State of Public Safety Report 2016 Edit ion
42 | P a g e
CO Release The largest source of risk at private dwellings continues to be related to CO release and is estimated to be 4.73 FE/mpy27. The associated risk continues to be well above the internationally-accepted benchmark criteria of 1.00 FE/mpy. Additionally, CO release occurrences in private dwellings accounted for 46% of all private dwelling occurrences over the last nine years, and have resulted in 20 fatalities, and 201 injuries during this period. Moreover, there is an increasing trend in the number of CO release occurrences caused by non-compliance of 5% per year. Figure FS-4 illustrates the top issues related to CO release involving fuel-burning appliances in terms of their causal pathway.
27 Represents expected estimate of a simulated distribution; 5th and 95th percentiles are 3.55 and 6.03 FE/mpy respectively.

Annual State of Public Safety Report 2016 Edit ion
43 | P a g e
Figure FS-4 Risk of Injury or Fatality in private dwellings due to CO release by cause (based on period ending 2016).

Annual State of Public Safety Report 2016 Edit ion
44 | P a g e
As indicated by Figure FS-4, occurrences in private dwellings resulting in CO release involved boilers, furnaces and water heaters. There is an increasing trend in the number of boiler occurrences of 9% per year. These occurred due to a lack of maintenance procedures. There continue to be reports of incidents and fatalities associated with natural gas-fired natural draft boilers in residences. Occurrences involving these appliances in residences demonstrated an increasing occurrence rate over the last nine years, and represented a risk of injury or fatality of 0.76 FE/mpy. These occurrences demonstrated deficiencies due to poor installation and inadequate maintenance of boilers. There is an increasing trend in the number of furnace occurrences of 10% per year. These occurred due to defective or failed material, a failure to follow maintenance procedures and improper or negligent work practices. Examples of occurrences involving the aforementioned causes include cracked or failed heat exchangers, inadequate maintenance resulting in blocked heat exchangers and improper furnace activation respectively. There is an increasing trend in the number of occurrences involving water heaters of 29% per year. These occurred due to failure to follow installation procedures, improper or negligent work practices and defective or failed material. Several of these occurrences involved venting and/or chimneys. Fires The risk at private dwellings due to fire accounts for 3.43 FE/mpy28. The associated risk continues to exceed the internationally-accepted benchmark criteria of 1.00 FE/mpy. Additionally, fires in private dwellings accounted for 21% of all occurrences, resulting in nine fatalities and 35 injuries over the last nine years. Moreover, there was an increasing trend in the number of fire occurrences caused by non-compliance of 5% per year. Figure FS-5 illustrates the top issues related to fires in terms of their causal pathway.
Figure FS-5: Risk of Injury or Fatality in private dwellings due to fire by cause (based on period ending 2016).
As indicated by Figure FS-5, occurrences in private dwellings resulting in a fire, involved furnaces, cooking equipment and dryers.
28 Represents expected estimate of a simulated distribution; 5th and 95th percentiles are 2.45 and 4.50 FE/mpy respectively.

Annual State of Public Safety Report 2016 Edit ion
45 | P a g e
There is an increasing trend in the number of furnace occurrences of 9% per year. These occurred due to defective or failed material and improper or negligent work practices. Examples of occurrences involving the aforementioned causes include carrier circuit or control board components and fires inside the furnace respectively. There is an increasing trend in the number of occurrences involving cooking equipment of 19% per year. These occurrences primarily involved BBQs and stoves, and continue to occur due to inadequate maintenance and improper operation. Examples of occurrences involving the aforementioned causes include BBQ fires or grease fires in ovens and unattended cooking equipment respectively. Occurrences involving dryers continue to occur due to inadequate maintenance, improper or negligent work practices and defective or failed material. An example of occurrences involving improper maintenance includes fire in the lint trap. Additionally, an example of occurrences involving improper or negligent work practices includes damaged venting or chimneys. Explosions The risk at private dwellings due to explosions accounts for 1.60 FE/mpy29. The associated risk continues to exceed the internationally-accepted benchmark criteria of 1.00 FE/mpy. Additionally, explosions in private dwellings accounted for 5% of all occurrences and resulting in six fatalities and 51 injuries over the last nine years. There is no demonstrable trend in the number of explosions. Figure FS-6 illustrates the top issues related to explosions involving fuel-burning appliances in terms of their causal pathway.
Figure FS-6: Risk of Injury or Fatality in private dwellings due to explosion by cause (based on period ending 2016).
29 Represents expected estimate of a simulated distribution; 5th and 95th percentiles are 0.81 and 2.55 FE/mpy respectively.

Annual State of Public Safety Report 2016 Edit ion
46 | P a g e
As indicated by Figure FS-6, occurrences in private dwellings resulting in explosions involved fireplaces, cooking equipment and gas supply. There are no demonstrable trends in the number of explosions involving these equipment. Occurrences involving fireplaces occurred due to defective or failed equipment and component. Some of these occurrences involved shattered glass. Occurrences involving cooking equipment occurred due to defective or failed components, improper operation and improper installation. Examples of these occurrences include a propane stove explosion and BBQ regulator failure. Occurrences involving gas supply occurred due to defective or failed material, contamination of equipment and incomplete or inadequate external communication.
Vapour Releases The risk at private dwellings due to vapour releases accounts for 0.78 FE/mpy30, and demonstrates a tolerable level of risk. Additionally, vapour releases in private dwellings accounted for 28% of all occurrences and resulting in three fatalities and seven injuries over the last nine years. There is no demonstrable trend in the number of vapour release occurrences. Figure FS-7 illustrates the top issues related to vapour releases involving fuel-burning appliances in terms of their causal pathway.
Figure FS-7: Risk of Injury or Fatality in private dwellings due to vapour release by cause (based on period ending 2016).
As indicated by Figure FS-7, occurrences in private dwellings resulting in a vapour release involved gas supply equipment. There is an increasing trend in the number of vapour release occurrences involving gas supply of 11% per year. Occurrences where improper or negligent work practices was a root cause often involved the gas
30 Represents expected estimate of a simulated distribution; 5th and 95th percentiles are 0.41 and 1.19 FE/mpy respectively.

Annual State of Public Safety Report 2016 Edit ion
47 | P a g e
service or supply being damaged by a contractor or a homeowner. Occurrences where defective or failed materials or components was a root cause included damaged gas meters that cracked or failed due to corrosion. Risk of Injury or Fatality due to CO Release from Multi-Unit Residences There have been 309 occurrences, one fatality, no permanent injuries and 55 non-permanent injuries reported for which occurrence inspections were completed. These occurrences resulted in CO release and measures representing these historical observations31 are represented graphically in Figure FS-8.
Figure FS-8: State of safety due to CO release across multi-unit residences over the last nine years.
Based on actual injuries observed over the measured period, the average rate of injury is 1.56 injuries/million people/year. Using the TSSA’s approach to integrating injuries and fatalities, this corresponds to a nine-year average injury burden of approximately 4.24 x 10⁻³ FE/mpy. The TSSA’s predictive [2] model estimates the risk of injury or fatality to Ontarians to be 1.10 FE/mpy32. CO-related risks at multi-unit residences demonstrate an unacceptable level of risk. There is an increasing trend in the number of CO occurrences at multi-unit residences of 7% per year. This increase in the risk of injury or fatality, as well as the occurrence trend, was a result of the completion of investigation of a number of occurrences which were reported in previous fiscal years had their causal analysis during 2016, and have hence been included as
31 Readers may refer to Appendix D for numerical representations 32 Represents expected estimate of a simulated distribution; 5th and 95th percentiles are 0.55 and 1.76 FE/mpy respectively.
0
0.1
0.2
0.3
0.4
0.5
0.6
0.7
0.8
0.9
1
0
10
20
30
40
50
60
70
80
90
100
2008 2009 2010 2011 2012 2013 2014 2015 2016
Ob
serv
ed
In
jury
Bu
rden
(Fata
lity
-Eq
uiv
ale
nts
/millio
n p
eo
ple
/year)
Nu
mb
er
of
Occu
rre
nces o
r In
juri
es
Fiscal Year
Number of Occurrences Number of Fatalities
Number of Permanent Injuries Number of Non-Permanent Injuries
Observed Injury Burden (FE/mpy)

Annual State of Public Safety Report 2016 Edit ion
48 | P a g e
part of the analysis informing this report. Figure FS-9 illustrates the top issues related to CO release involving fuel-burning appliances in multi-unit residences in terms of their causal pathway.
Figure FS-9: Risk of Injury or Fatality due to CO release across multi-unit residences by cause.
As indicated by Figure FS-9, occurrences in multi-unit residences resulting in CO release took place in community housing locations, apartments and townhouses. The primary causes of occurrences in each of these locations involved inadequate maintenance. In particular, a number of maintenance-related occurrences translated to venting issues including blocked or broken venting or chimney blockages. Though occurrences at community housing locations represent 5% of the CO release occurrences at multi-unit residences, they have been identified as a significant location in the causal pathway indicated in Figure FS-9 based on the exposed population informing the risk of injury or fatality. Occurrences at these locations involved boilers, furnaces and water heaters. A number of these occurrences took place in the Greater Toronto Area. Occurrences at apartments and condominiums represent over 50% of the CO release occurrences at multi-unit residences. There is an increasing trend in the number of such occurrences at apartments of 9% per year. Occurrences in these locations involved boilers, furnaces, make-up air units and water heaters. In particular, there is an increasing trend in the number of boiler occurrences in apartments of 9% per year. A number of these occurrences took place in the Greater Toronto Area. Occurrences at townhouses represent 7% of the CO release occurrences at multi-unit residences. There is no demonstrable trend in the number of occurrences at these locations. Occurrences in these locations involved water heaters and furnaces. Nearly 20% of CO release occurrences at multi-unit residences involved natural draft boilers. Nearly 85% of these occurrences took place in apartments and multi-unit homes. There is an increasing trend of 9% per year in the number of occurrences. Moreover the number of occurrences reported per year has been steadily increasing over the past nine years.
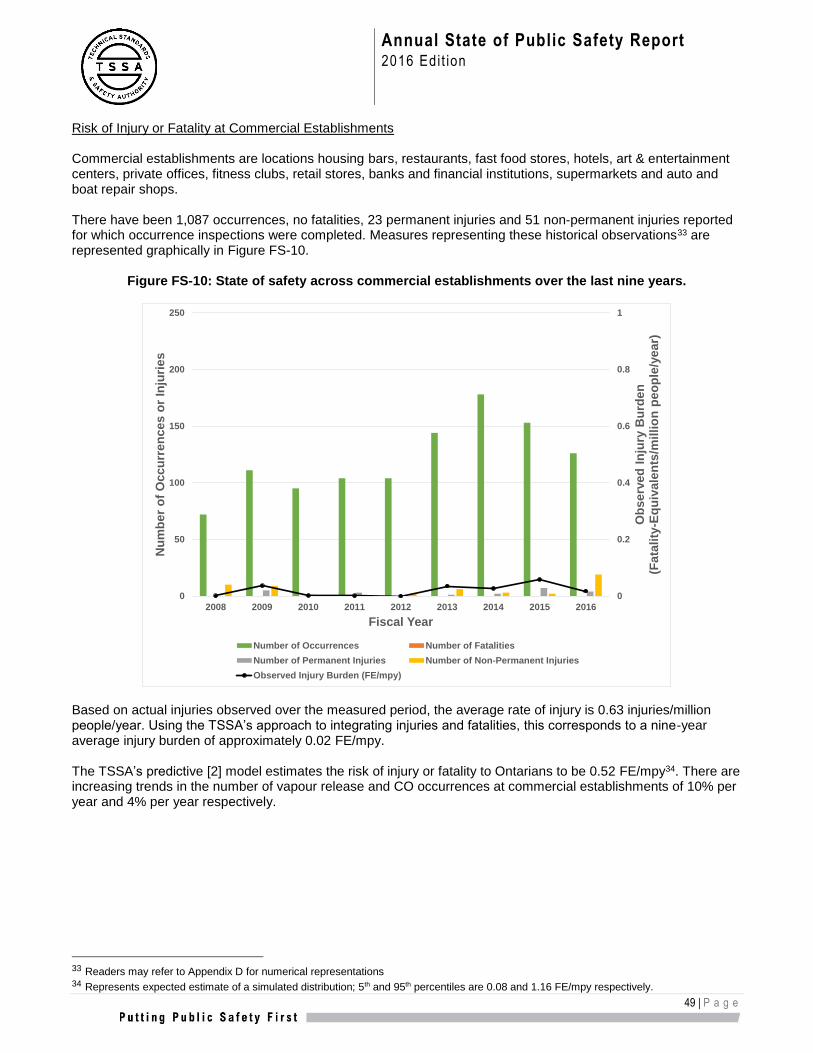
Annual State of Public Safety Report 2016 Edit ion
49 | P a g e
Risk of Injury or Fatality at Commercial Establishments Commercial establishments are locations housing bars, restaurants, fast food stores, hotels, art & entertainment centers, private offices, fitness clubs, retail stores, banks and financial institutions, supermarkets and auto and boat repair shops. There have been 1,087 occurrences, no fatalities, 23 permanent injuries and 51 non-permanent injuries reported for which occurrence inspections were completed. Measures representing these historical observations33 are represented graphically in Figure FS-10.
Figure FS-10: State of safety across commercial establishments over the last nine years.
Based on actual injuries observed over the measured period, the average rate of injury is 0.63 injuries/million people/year. Using the TSSA’s approach to integrating injuries and fatalities, this corresponds to a nine-year average injury burden of approximately 0.02 FE/mpy. The TSSA’s predictive [2] model estimates the risk of injury or fatality to Ontarians to be 0.52 FE/mpy34. There are increasing trends in the number of vapour release and CO occurrences at commercial establishments of 10% per year and 4% per year respectively.
33 Readers may refer to Appendix D for numerical representations 34 Represents expected estimate of a simulated distribution; 5th and 95th percentiles are 0.08 and 1.16 FE/mpy respectively.
0
0.2
0.4
0.6
0.8
1
0
50
100
150
200
250
2008 2009 2010 2011 2012 2013 2014 2015 2016
Ob
serv
ed
In
jury
Bu
rden
(Fata
lity
-Eq
uiv
ale
nts
/millio
n p
eo
ple
/year)
Nu
mb
er
of
Occu
rre
nces o
r In
juri
es
Fiscal Year
Number of Occurrences Number of Fatalities
Number of Permanent Injuries Number of Non-Permanent Injuries
Observed Injury Burden (FE/mpy)

Annual State of Public Safety Report 2016 Edit ion
50 | P a g e
Fires Fires represent the largest source of risk at commercial establishments, and account for 1.31 FE/mpy35. The risk is now greater than the benchmark criteria of 1.00 FE/mpy. The occurrence rate for fires has been increasing over the past nine years. Additionally, another contributing factor to the increase in risk are occurrences with permanent injuries as well as a fatality for which their causal analysis were completed in 2016. Approximately 25% of occurrences in commercial establishments resulted in fires. Over 90% of these fires took place downstream (i.e., typically inside the building involving appliances). Figure FS-11 illustrates the top issues related to fires involving fuel-burning appliances in commercial establishments in terms of their causal pathway.
Figure FS-11: Risk of Injury or Fatality due to fire across commercial establishments by cause.
As indicated by Figure FS-11, occurrences in commercial establishments resulting in fires took place in food service locations, business units and transportation & warehousing facilities. Nearly 45% of occurrences resulting in fire took place in food service locations. Occurrences involving fryers primarily occurred due to improper or negligent work practices or defective or failed materials and components. Occurrences involving stoves or ovens primarily occurred due to inadequate maintenance or improper or negligent work practices. Finally, occurrences involving water heaters primarily occurred due to inadequate maintenance, improper or negligent work practices and defective or failed equipment. Over 25% of occurrences resulting in fire took place in business units. Occurrences involving dryers primarily occurred due to improper maintenance. Occurrences involving heaters mainly took place due to improper or negligent work practices or defective or failed material. Over 10% of occurrences resulting in fire took place in transportation and warehousing facilities. Occurrences involving heaters typically involved the heater getting struck by a forklift.
35 Represents expected estimate of a simulated distribution; 5th and 95th percentiles are 0.71 and 2.01 FE/mpy respectively.

Annual State of Public Safety Report 2016 Edit ion
51 | P a g e
CO Release Risks at commercial establishments related to CO release account for 0.82 FE/mpy36. There is an increasing trend in the number of CO occurrences at commercial establishments of 4% per year. Approximately 25% of occurrences in commercial establishments resulted in CO release, and took place downstream. Figure FS-12 illustrates the top issues related to CO release involving fuel-burning appliances in commercial establishments in terms of their causal pathway.
Figure FS-12: Risk of Injury or Fatality due to CO release across commercial establishments by cause.
As indicated by Figure FS-12, occurrences in commercial establishments resulting in CO release took place in business units and food service locations. Over 45% of occurrences resulting in CO release took place in business units. Occurrences involving boilers and roof top units primarily occurred due to inadequate maintenance and defective or failed materials and components. Over 25% of occurrences resulting in CO release took place in food service locations. Occurrences involving boilers primarily occurred due to inadequate maintenance and improper or negligent work practices. Occurrences involving water heaters primarily occurred due to inadequate maintenance. Specific causal information could not be obtained regarding occurrences involving stoves and ovens.
Explosions Risks at commercial establishments related to explosions account for 0.52 FE/mpy37. There is no demonstrable trend in the number of occurrences at these locations. Approximately 5% of occurrences in commercial establishments resulted in explosions, and took place downstream. Figure FS-13 illustrates the top issues related to explosions involving fuel-burning appliances in commercial establishments in terms of their causal pathway.
36 Represents expected estimate of a simulated distribution; 5th and 95th percentiles are 0.34 and 1.38 FE/mpy respectively. 37 Represents expected estimate of a simulated distribution; 5th and 95th percentiles are 0.10 and 1.06 FE/mpy respectively.

Annual State of Public Safety Report 2016 Edit ion
52 | P a g e
Figure FS-13: Risk of Injury or Fatality due to explosions across commercial establishments by cause.
As indicated by Figure FS-13, occurrences in commercial establishments resulting in explosions primarily took place in food service locations. Approximately 45% of occurrences resulting in explosions took place in food service locations. Occurrences in these locations frequently involved ovens. Vapour Releases Risks at commercial establishments related to vapour releases accounted for 0.39 FE/mpy38. There is an increasing trend in the number of related occurrences 10% per year. Over 45% of occurrences in commercial establishments resulted in vapour releases. Nearly 75% of these vapour release occurrences took place upstream (i.e., outside of the commercial establishment). Figure FS-14 illustrates the top issues related to vapour release occurrences involving fuel-burning appliances in commercial establishments in terms of their causal pathway.
38 Represents expected estimate of a simulated distribution; 5th and 95th percentiles are 0.14 and 0.70 FE/mpy respectively.
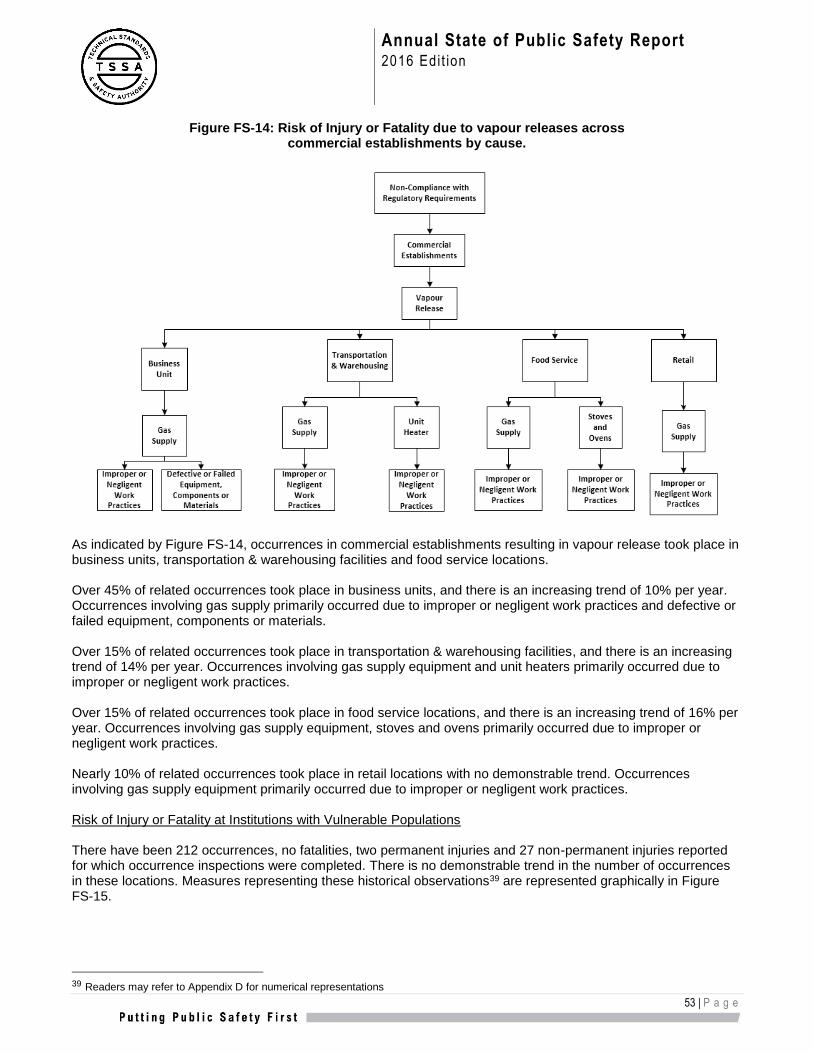
Annual State of Public Safety Report 2016 Edit ion
53 | P a g e
Figure FS-14: Risk of Injury or Fatality due to vapour releases across commercial establishments by cause.
As indicated by Figure FS-14, occurrences in commercial establishments resulting in vapour release took place in business units, transportation & warehousing facilities and food service locations. Over 45% of related occurrences took place in business units, and there is an increasing trend of 10% per year. Occurrences involving gas supply primarily occurred due to improper or negligent work practices and defective or failed equipment, components or materials. Over 15% of related occurrences took place in transportation & warehousing facilities, and there is an increasing trend of 14% per year. Occurrences involving gas supply equipment and unit heaters primarily occurred due to improper or negligent work practices. Over 15% of related occurrences took place in food service locations, and there is an increasing trend of 16% per year. Occurrences involving gas supply equipment, stoves and ovens primarily occurred due to improper or negligent work practices. Nearly 10% of related occurrences took place in retail locations with no demonstrable trend. Occurrences involving gas supply equipment primarily occurred due to improper or negligent work practices. Risk of Injury or Fatality at Institutions with Vulnerable Populations There have been 212 occurrences, no fatalities, two permanent injuries and 27 non-permanent injuries reported for which occurrence inspections were completed. There is no demonstrable trend in the number of occurrences in these locations. Measures representing these historical observations39 are represented graphically in Figure FS-15.
39 Readers may refer to Appendix D for numerical representations

Annual State of Public Safety Report 2016 Edit ion
54 | P a g e
Based on actual injuries observed over the measured period, the average rate of injury is 0.25 injuries/million people/year. Using the TSSA’s approach to integrating injuries and fatalities, this corresponds to a nine-year average injury burden of approximately 1.84 x 10⁻⁴ FE/mpy.
Figure FS-15: State of safety across institutions with vulnerable populations over the last nine years.
The TSSA’s predictive [2] model estimates the risk of injury or fatality to Ontarians to be 0.11 FE/mpy40. The acceptability threshold41 at these locations [4] due to the type of occupants is understandably much lower than normal locations [5, 6] of exposure. This risk, as well as the risk due to non-compliant installation and maintenance practices of heating appliances and associated fuel supply and venting systems at institutions with vulnerable populations has decreased to an acceptable level of risk. However, the risk of injury or fatality to Ontarians in academic locations42 is estimated to be 0.24 FE/mpy43 [8-11], which demonstrates a tolerable level of risk. Moreover, occurrences at academic locations represent 63% of the occurrences in institutions, as indicated in Figure FS-16.
40 Represents expected estimate of a simulated distribution; 5th and 95th percentiles are 0.09 and 0.32 FE/mpy respectively. 41 0.3 x 10⁻⁶ according to the PSM Division, CSChE. Major Industrial Accidents Council of Canada (MIACC) Criteria for land-use planning
(2008). 42 Includes public elementary schools, public secondary schools, Roman Catholic elementary schools, Roman Catholic secondary schools, private schools, colleges and universities. 43 Based on an exposed population of 2.8 million in academic locations [7-10]
0
0.1
0.2
0.3
0.4
0.5
0.6
0.7
0.8
0.9
1
0
5
10
15
20
25
30
35
40
45
50
2008 2009 2010 2011 2012 2013 2014 2015 2016
Ob
se
rve
d I
nju
ry B
urd
en
(Fa
tali
ty-E
qu
iva
len
ts/m
illi
on
pe
op
le/y
ea
r)
Nu
mb
er
of
Oc
cu
rre
nc
es
or
Inju
rie
s
Fiscal YearNumber of Occurrences Number of Fatalities
Number of Permanent Injuries Number of Non-Permanent Injuries
Observed Injury Burden (FE/mpy)

Annual State of Public Safety Report 2016 Edit ion
55 | P a g e
Figure FS-16: Distribution of occurrences at institutions with vulnerable populations by location
Additionally, while occurrences at long-term care and nursing homes comprise 14% of occurrences at institutions, more than 90% of the injuries associated with reported occurrences at institutions were sustained by patrons in long-term care and nursing homes. Figure FS-17 summarises top issues related to occurrences involving fuel-burning appliances in institutions housing sensitive subpopulations. The information in this table is presented in decreasing order of observed occurrences.
63%
5%
10%
14%
8% Academic Locations
Childrens Centres
Hospital
Long-Term Care &Nursing Homes
Retirement Homes
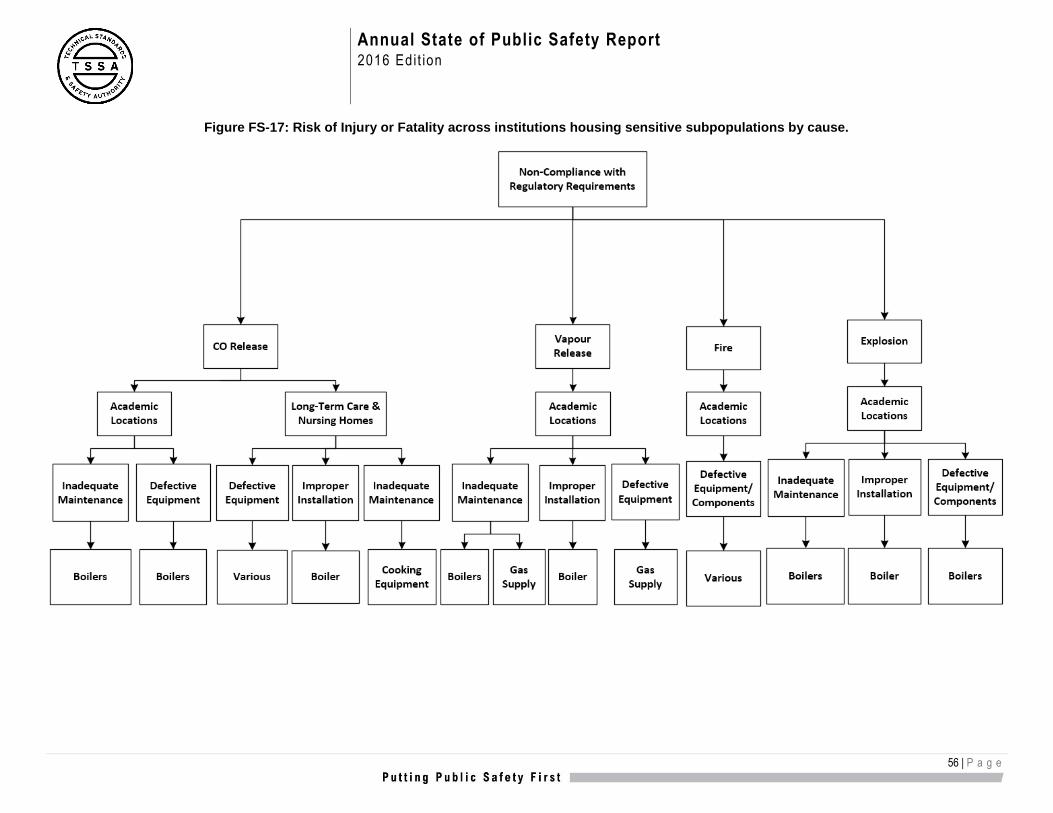
Annual State of Public Safety Report 2016 Edit ion
56 | P a g e
Figure FS-17: Risk of Injury or Fatality across institutions housing sensitive subpopulations by cause.

Annual State of Public Safety Report 2016 Edit ion
57 | P a g e
As indicated in Figure FS-17, occurrences resulting in CO release primarily took place in academic locations and long-term care or nursing homes. Occurrences in academic locations involved boilers, and were primarily caused due to inadequate maintenance or defective components, such as valves. Occurrences in long-term care or nursing homes were primarily caused by improper installation of boilers, inadequate maintenance of cooking equipment, as well as various types of defective equipment. Occurrences resulting in vapour release predominantly took place in academic locations. Occurrences in these locations involved inadequate maintenance of boiler and gas supply equipment, improper installation of boilers and defective gas supply equipment, including valves. Occurrences resulting in fire primarily took place in academic locations, and involved a wide variety of defective equipment. Occurrences resulting in explosions primarily took place in academic locations and involved boiler technology failing due to inadequate maintenance, improper installation or defective components. The majority of related occurrences involved delayed ignitions. Though vapour release occurrences were observed most often at academic locations, making up 55% of all occurrences at academic locations, the primarily safety concern and source of risk at these locations involves CO release from boilers due to inadequate maintenance or installation. Historical occurrences and similar issues with boilers in other locations (i.e., residences, commercial locations, etc.,) also substantiate this finding. As indicated by Figure FS-6, occurrences in private dwellings resulting in explosions involved fireplaces, cooking equipment and gas supply. There are no demonstrable trends in the number of explosions involving these equipment. III.7.2 Risk Management – Message from John Marshall, Statutory Director of Fuels Safety Program Managing Risks due to Non-Compliance in Regulatory System Managing Risks at Private Dwellings The TSSA’s Enhanced CO Advocacy Strategy As part of the TSSA’s enhanced 3-part advocacy strategy to raise awareness of the risks stemming from CO poisoning, the TSSA will work with global industry and regulatory stakeholders to reduce the number of CO release occurrences involving fuel-fired equipment in private dwellings. The strategy is illustrated in Figure FS-20.

Annual State of Public Safety Report 2016 Edit ion
58 | P a g e
Figure FS-20: The TSSA’s Enhanced CO Strategy
The first part of the strategy involves the positioning of CO risk as a public and global health burden. This involves the formation of an international collaborative network with partners from Canada (The TSSA), USA, England, France and Italy to share global data on causal information, injury and mortality rates associated with CO and best practices on interventions methods used to manage and reduce public health burden associated with CO poisonings. The second part of the strategy involves the TSSA establishing a three-pronged risk management (intervention) approach to reducing CO risk, which is aligned with its strategic priorities of ensuring compliance and establishing a shared responsibility for safety among key stakeholders. As part of this strategy, the TSSA has also begun pilot work examining the possibility of applying advanced sensor technologies to detect and provide early warnings to CO exposures for appropriate action to be taken by stakeholders including the homeowners. The TSSA will evaluate the effectiveness of this approach and determine appropriate next steps accordingly. In the third part of the strategy, the TSSA will continue to evaluate and report on the effectiveness of its current compliance strategies. Mitigating and Managing CO Risks in private dwellings through regulatory interventions Based on occurrences reported to the TSSA, there have been 15 occurrences reported over the past seven years wherein a CO detector alarm installed in the home sounded prompting the evacuation of residents from the dwelling. Only one injury was reported, as in all other cases the residents exited the dwelling when the alarm sounded and they did not exhibit any symptoms of CO poisoning. In response to continued reports of incidents and fatalities associated with natural gas-fired natural draft boilers in residences, The TSSA issued Director’s Orders in 2006 and 2009 to address the deficiencies with boilers installation and maintenance, which was incorporated into the Gaseous Fuels Code Adoption Document in November 2012. In particular, five occurrences (from the aforementioned 15 occurrences) have been reported to the TSSA, after Director’s order FS 156-09 was issued, wherein the CO detector alarm sounded and resulted in all residents successfully evacuating the dwelling without sustaining injuries. Director’s Order FS 156-09 mandates the installation of a CO alarm in homes [12], thus this is indicative of the positive impact of the Director’s orders on mitigating health impacts resulting from CO release.
Strategy 1:
Risk Assessment
• Ontario (Current and ongoing)
• Europe/North America Public Health (2016-2017)
• Global Burden of Disease and injury (2017-2019)
Strategy 2:
Risk Management
(Interventions)
• Regulatory policies/enforcement (Current - 2017)
• Technological innovations (2016 - 2018)
• User behaviour research and modification (Current - 2017)
Strategy 3:
Evalution and Continuous
Improvement
• Effectiveness of current strategies including user behaviour (2016-2017)
• Evaluation of future strategies (2017-)

Annual State of Public Safety Report 2016 Edit ion
59 | P a g e
Though there is no observable trend in the number of occurrences after Director’s Order FS 156-09 was issued, the annual occurrence rate has steadily increased since its issuance, indicating that this issue continues to remain a significant risk at residences with no formal maintenance program in place. As such, the TSSA will consider implementing mandatory maintenance and inspection for residential heating appliances and chimneys. Managing Risks at Multi-Unit Residential Locations The TSSA will work with industry stakeholders, including the City of Toronto, to reduce CO release occurrences involving fuel-fired equipment in community housing locations, apartments and condominiums. As part of this approach, the TSSA will strive to communicate the need for maintenance of equipment such as boilers, furnaces, make-up air units and water heaters, and provide training/awareness to address issues of inadequate maintenance or installation of equipment in these locations. The City of Toronto is currently examining a collaborative risk management framework involving multiple regulatory agencies with the objective of improving living conditions and reducing risks to tenants of rental buildings and apartments in the city. The TSSA will form an integral part of this collaborative partnership. Managing Risks at Commercial Establishments As part of the TSSA’s Commercial Building Project, the TSSA will work with fuel distributors to consider enhancements with meter barriers as a mechanism to mitigate risks associated with occurrences in upstream locations. Additionally, as part of the Commercial Building Project, the TSSA is developing a three-phase strategy to address risks in food service locations. The first phase of the strategy would focus on communicating known issues and the TSSA’s understanding of risks with public health stakeholders. The outcome of this phase would be the creation of a task force of stakeholders including public health units, the Ministry of Labour, and the Ontario Fire Marshall to collaboratively focus on reducing risks in these locations. The second phase of the strategy would focus on establishing options, such as an education awareness or targeted audits/inspections where required. Finally, the third phase of the strategy would involve the implementation of identified actions and collaborations from the first two phases. Managing Risks at Institutions Housing Vulnerable Populations In an effort to reduce the level of risk at academic institutions, the TSSA will work collaboratively with school board officials to proactively address installation and maintenance issues related to fuel-burning equipment at educational facilities. This will be achieved by developing a joint plan with school board officials to enhance communication and education on how to improve fuel equipment compliance and safety, and to explore technological solutions to detect elevated levels of CO created by fuel-burning equipment before negative effects are experienced. The TSSA has partnered with the Operations, Maintenance and Construction (OMC) committee of the Ontario Association of School Board Officials to address fuels safety risks at elementary and secondary schools in Ontario. The OMC committee members are typically managers and leaders within facilities management departments of Ontario school. The partnership includes forming a joint task force to foster an on-going relationship between OMC and the TSSA based on education and communication, and to develop a plan to address the risk that incorrectly installed or inadequately maintained fuel-fired equipment pose at academic institutions. Ensuring Compliance at Liquid Fuels Licenced Sites through Regulatory Inspections and Oversight
The TSSA conducts periodic inspections of liquid fuels storage and dispensing facilities at least once every three years to oversee and manage the state of compliance across nearly 4,300 licensed sites in Ontario. Figure FS-21 provides information on key indicators associated with the results of the periodic inspections. Figure FS-21 indicates that the observed percentage of non-compliant inspections ranges from 56% to 71% over the

Annual State of Public Safety Report 2016 Edit ion
60 | P a g e
measured period. The median non-compliance rate observed over the measured period is 66%44, and there is a decreasing trend in the non-compliance rate of 4% per year. While the non-compliance rate provides an outcome of the periodic inspection (e.g., pass or fail), the compliance-risk spectrum (shown as pie charts for the past five years) portrays the potential safety risks associated with non-compliances. The spectrum indicates that 0.2% to 2% of all inspections conducted in each of the past five years pose the greatest safety risk, and are indicated in the dark red segment. Examples of non-compliances identified through these inspections, which contributed to this observed safety risk pertained to general maintenance requirements and leak testing for tanks and piping systems. Using a risk-based approach, an RBS profile has been generated for the entire inventory for the first time in this report. The RBS profile indicates that as of 2016, there are three high-risk facilities in the qualified provincial inventory. Out of high and medium risk facilities, 42% and 30% are full serve and self-serve gas stations respectively. Full and self-serve gas stations comprise 23% and 52% of the entire qualified inventory.
Figure FS-21: Dashboard of key indicators of outcomes of periodic inspections
conducted at liquid fuels licenced sites (2012-2016)
44 Represents median of five-year distribution; lower and upper bounds are 49% and 91% respectively.

Annual State of Public Safety Report 2016 Edit ion
61 | P a g e
Ensuring Compliance at Propane Licenced Sites through Regulatory Inspections and Oversight
The TSSA conducts periodic inspections of propane facilities to oversee and manage the state of compliance across approximately 1,350 licensed sites in the province of Ontario. Figure FS-22 provides information on key indicators associated with the results of the periodic inspections. Figure FS-22 indicates that the observed percentage of non-compliant inspections ranges from 25% to 32% over the measured period. The median non-compliance rate observed over the measured period is 28%45, and there is a decreasing trend in the non-compliance rate of 2% per year. While the non-compliance rate provides an outcome of the periodic inspection (e.g., pass or fail), the compliance-risk spectrum (shown as pie charts for the past five years) portrays the potential safety risks associated with non-compliances found during the inspection. The spectrum indicates that 1% to 5% of all inspections conducted in each of the past five years pose the greatest safety risk, and are indicated in the dark red segment. Examples of non-compliances identified through these inspections, which contributed to this observed safety risk pertained to licencing requirements for container refill centres, filling plants, retail outlets, vehicle conversion centres, cylinder refill centres to be licenced prior to operation. A regulatory change made in 2014 removed annual inspection requirements for these facilities. These facilities are now inspected using a risk-informed approach. The TSSA successfully implemented a risk-informed inspection scheduling process for propane storage and dispensing facilities that has received broad stakeholder support and acceptance. This process has helped the TSSA focus its inspection efforts based on risk, while providing incentives to industry with better compliance records. Using a risk-based approach, the RBS profile indicates that as of 2016, there are no high-risk facilities in the qualified provincial inventory. There was a decrease in the number of high and medium risk facilities, for which reasons have been explained in Appendix G. Nearly two-thirds of all medium risk facilities are cylinder filling stations, which comprise 82% of the entire qualified provincial inventory.
Figure FS-22: Dashboard of key indicators of outcomes of periodic inspections
conducted at propane licenced sites (2012-2016).
45 Represents median of five-year distribution; lower and upper bounds are 15% and 58% respectively.

Annual State of Public Safety Report 2016 Edit ion
62 | P a g e
III.8 Upholstered and Stuffed Articles
The role of the Upholstered and Stuffed Articles Safety Program is to protect the public from potential hazards associated with the use of unclean or unsafe filling materials in upholstered and stuffed articles in Ontario. In addition to promoting safety, the TSSA’s aim is to protect consumers against fraud, misrepresentation of filling materials in upholstered and stuffed articles, and to provide a level playing field for the industries. Under Ontario Regulation 218/01, Upholstered and Stuffed Articles, only new clean filling materials are allowed in upholstered and stuffed articles, and all articles are required to be labelled that identify the registration number and indicate all filling materials. Such articles include toys, sporting goods, pet items, furniture, mattresses/box springs, apparel, bedding items, handbags, luggage and seasonal ornaments. The requirements for new and clean filling materials are enforced through inspections at point-of-sale and the manufacturing level.
The following stakeholders fall under the TSSA’s jurisdiction:
retailer;
manufacturer;
importer/distributor;
renovator
home hobby/craft operator; and
supplier
III.8.1 Risk Assessment
The TSSA has received reports of actual health impacts resulting from reportable occurrences. Over the past six years, there have been 28 occurrences reported to the TSSA. These occurrences took place due to non-compliance with regulatory requirements and have been described below. Incidents There have been four incidents reported with five victims. In these incidents, the victims sustained respiratory infection irritations and lacerations with superficial cuts. The incidents pertained to sofa sets and bedding material which were contaminated either by mould, fungus or vermin. The root cause attributed to all of these occurrences was contamination of equipment/material/component. Near Misses There have been 24 near-miss occurrences reported to the TSSA, of which 10 were reported through complaint inspections and 14 were reported via the TSSA’s incident reporting framework. These occurrences demonstrated instances of elevated exposure to risk, however they did not result in consequences to people or property. Most of these occurrences related to used materials and incorrect labels. The root cause attributed to all of these occurrences was defective or failed material. Eight of these occurrences were reported in the current fiscal year.

Annual State of Public Safety Report 2016 Edit ion
63 | P a g e
III.8.2 Risk Management – Message from the Statutory Director, USA Program Over the past five years, The TSSA’s Upholstered and Stuffed Articles program has conducted nearly 6,500 inspections focusing mainly on retailers as indicated in Table USA-1.
Table USA-1: Inspections by inspection type for the period 2012 – 2016.
Inspection Type
Number of Inspections Conducted
Number of Issued Number of Resolved
Orders Articles Orders Articles
Retailer 3,364 53,350 59,810 52,239 58,662
Importer/Distributor 772 15,781 43,031 15,592 36,394
Manufacturer 807 972 1,084 950 1,062
Renovator 581 436 436 406 406
Seasonal 648 10,514 27,456 10,362 27,304
Home Hobbyist/Craft Operator 74 49 49 49 49
Other 90 4,848 4,932 4,848 4,932
Supplier 37 2 2 2 2
Printer 11 2 2 2 2
3R 23 371 470 371 470
Total 6,407 86,325 137,272 84,821 129,283
In comparison with previous editions of this report, Table USA-1 now includes the number of affected or non-compliant articles that were associated with issued or resolved orders. This representation of non-compliance provides a more accurate depiction of the scale of non-compliances identified through regulatory inspections. System limitations prevented the representation of non-compliances in this format in previous versions of this report. Orders related to manufacturers not being registered in Ontario continue to represent the majority of orders issued, due to new products being sold in the marketplace and unfamiliarity with the Regulation. Additionally, measures are taken by the TSSA inspectors to educate stakeholders as required on complying with the requirements in the Regulation. The TSSA will continue to conduct inspections at independent retailers. The TSSA will develop a risk-informed approach to inspections based on information collected through incident reporting and inspections to prioritize future inspections. These inspections focus on those retailers that have a known history of selling unsafe articles and demonstrate increasing levels of non-compliance.

Annual State of Public Safety Report 2016 Edit ion
64 | P a g e
IV. References [1] Technical Standards and Safety Authority. Technical Standards and Safety Act, 2000. Retrieved on July 29, 2014 from http://www.e-laws.gov.on.ca/html/statutes/english/elaws_statutes_00t16_e.htm [2] Arun Veeramany and Srikanth Mangalam. "Application of disability-adjusted life years to predict the burden of injuries and fatalities due to public exposure to engineering technologies." Population Health Metrics 12 (2014): 1-9. [3] Health and Safety Executive. “ALARP ‘at a glance’.” Retrieved May 1, 2015 from http://www.hse.gov.uk/risk/theory/alarpglance.htm. [4] PSM Division, CSChE. Major Industrial Accidents Council of Canada (MIACC) Criteria for land-use planning (2008). [5] Jørn Vatn. "A discussion of the acceptable risk problem." Reliability Engineering & System Safety 61 (1998): 11-19. [6] Terje Aven, “Reliability & Risk Analysis.” North Holland, 1992. [7] Srikanth Mangalam, Lency Abraham Mulamootil, Arun Veeramany, David Witt, and Rene Karavas. "System and method for inspecting and assessing risk of mechanical equipment and facilities." U.S. Patent No. 13/894,812, May 15, 2013. [8] Ministry of Education. Quick Facts Ontario Schools 2010-11. Retrieved May 1, 2016 from http://www.edu.gov.on.ca [9] Office of the Auditor General of Ontario. 2013 Annual Report. Retrieved on May 1, 2016 from http://www.auditor.on.ca/en/content/annualreports/arreports/en13/2013ar_en_web.pdf [10] Ontario Council of University Libraries. Student Population Statistics by Institution, 2014. Retrieved on May 1, 2015 from http://www.ocul.on.ca/node/21 [11] Colleges Ontario. Student and Graduate Profiles, 2011. Retrieved on May 1, 2016 from http://www.collegesontario.org/research/2011_environmental_scan/2011_scan_students.pdf [12] Technical Standards and Safety Authority. FS-156-09. Natural Gas and Propane Fired Boilers with an Input less than 300 000 BTUH installed in a Residential Building Intended for One or Two Families. Retrieved on May 1, 2016 from https://www.tssa.org/corplibrary/ArticleFile.asp?Instance=136&ID=919EE1E3125248E2B2AA1D7DF2653B18

Annual State of Public Safety Report 2016 Edit ion
65 | P a g e
V. Appendix Appendix A – Statistical Methods The statistical analysis of the time-series data in this report includes:
graphical data analysis;
construction of prediction intervals; and
trend tests.
Time-series plots are used to present the data graphically, which provide insight into the data for the analysts and readership. In this year’s ASPR, these plots have been used to show how health impact and occurrence data have changed over time.
A prediction interval is an estimate of an interval into which a new observation will fall, with a certain probability, given what has already been observed. In this report, the prediction interval covers between the 5 and 95 percentiles of the measured data. Observations for those indicators lying outside the prediction intervals are made with a 95% confidence level. Prediction intervals allow indicators to be checked on a quarterly basis, verifying if they fit the behaviour of historical observations.
When presenting data, it is often desirable to know whether the measured indicator is increasing or decreasing over time. While time-series plots tempt the reader to make “by-eye” conclusions on the behaviour of variables over time, trend tests allow for rigorous statistical hypotheses testing. This has three additional advantages over graphical data analysis:
it ensures a systematic, consistent method of data analysis,
it yields a measure of the increase or decrease over time, and
it presents a measure of the strength of the evidence (the p-value). The current format of the ASPR does not include the p-value explicitly, but it is used as a step in the trend analysis.
The Mann-Kendall test is a non-parametric trend test, and does not require any assumption of normality or canonical distributions in the data. This test is robust and allows missing data to be present in the analysis. There are many instances where seasonality is the source of variation in the response variable. As such, this report uses Kruskall-Wallis statistics for testing seasonality in the time series; which done using the Minitab 16© software. The assertions of any of these tests are made with 95% confidence and if evidence is found for seasonality, then the Seasonal Mann-Kendall trend test is used instead of the Mann-Kendall test.
While the trend tests are performed on the quarterly data, this data is aggregated annually for plotting purposes. As such, it may be the case that a trend is reported as statistically significant, but is not obvious to the reader from the plot of the data and vice-versa.

Annual State of Public Safety Report 2016 Edit ion
66 | P a g e
Appendix B – Risk-Informed Inspection Order Management
1.0 Introduction Section 17 of the Technical Standards and Safety Act provides powers to TSSA inspectors to conduct inspections to ensure that “things” regulated under the Act are used, operated, installed, made, manufactured, repaired, renovated or offered for sale are in compliance with this Act and associated regulations. During an inspection, section 21 of the Act requires inspectors to issue inspection orders against non-compliances that are observed. The Act also requires inspectors to specify the time period in which the non-compliance should be addressed. This “Time to Comply” (TTC) is an essential component of the inspection process.
Consistent with RIDM principles, the TSSA has established a risk-informed inspection order policy, which provides
guidance for establishing:
o The requirements or necessary preconditions or circumstances for issuing an order pursuant to Section 21 of
the Act.
o Risk-informed criteria for deeming a thing under the Act as unsafe, as posing an immediate hazard or a
demonstrable threat to public safety (Section 21.1 and Section 21. 2 of the Act).
o Risk-informed criteria for determining time for compliance with terms of inspection order (Section 21.1(a) and
Section 21.2 of the Act).
o Minimum criteria for type and content of an inspection order issued to a contravener (Section 21.4 of the Act). In implementing this policy, the TSSA has established standardized inspection orders for the various safety program areas. Using its risk assessment methodology, the TSSA has also established the TTCs associated with these standardized inspection orders. Currently, inspectors from only the elevating and amusement devices and the operating engineers programs have the standardized inspection orders and associated TTCs available to choose from electronically during inspections. Inspectors from other programs continue to rely on pre-existing tools including manual entry processes while the TSSA is working towards creating new and enhanced tools. For the purposes of analysis and reporting, the TSSA is currently interim equivalent approaches to characterize documented inspection orders including the use of actual time to compliances issued by inspectors.
2.0 Elements of Standardized Inspection Orders 2.1 Standard Order Master List The most basic element of the standardized inspection orders framework is a list of inspection orders themselves. An inspection order master list is developed and maintained by each safety program, based on the Act, applicable regulations and codes, using a program-specific standardized format structure. An example of a standard order is the following in the case of escalators in Table B1.
Table B1: Escalators and moving walks standard order example.
Order ID Directive Text Code Reference
XE0414 Repair/replace the damaged skirt panel. CSA B44-10 (8.6.8.5) “The exposed surface of the skirt panels adjacent to the steps, if not made from, shall be treated with, a friction-reducing material. Damaged skirt or dynamic skirt panels shall be replaced or repaired.”

Annual State of Public Safety Report 2016 Edit ion
67 | P a g e
Program areas may have multiple lists, divided into the various types for things they inspect. For instance, elevating devices may have a list for dumbwaiters and a separate list for construction hoists. The final implementation of this step is completed when they are uploaded to the TSSA’s computer system and are available for use to the inspectors.
2.2 Risk Characterization – Determination of Time to Compliance
Risk Assessment Once there is an established list of orders available for an inspector, the next step to assess how much risk each order carries to determine the TTC the inspectors are recommended to issue. Recall that risk is defined by the combination of frequency of harm and the severity of that harm. The technique to determine time-to-compliance is a three step process. In the first step, frequency and severity of possible consequences (occurrences) if an inspector observed non-compliance were allowed to persist, is determined. In the second step, risk threshold is determined for each occurrence type so as to analyze the time at which the occurrence type intersects the threshold. Given the time of possible occurrence of each occurrence type posing maximum risk, the third step entails determining the time-to-compliance by choosing the time that corresponds to an occurrence type that could potentially occur at the earliest time. The TSSA assesses orders using an expert panel of inspectors, engineers, and public safety risk specialists. Initial groundwork is laid out by developing a risk assessment template, which helps guide the thinking of the panel through the process. The template, developed internally by the TSSA and shown in Figure B1 below, guides the expert panel in determining the possible outcome(s) of non-compliance, the likelihood of the outcomes, and severity of the health impacts associated with the outcomes. Evidence including past incident history is used to guide the process, if available, and to help ascertain the severity of health impacts associated with the outcomes.

Annual State of Public Safety Report 2016 Edit ion
68 | P a g e
Figure B2: TTC tool depicting failure scenarios.
This process is vetted with external stakeholders and experts as appropriate and relevant. The conceptual approach has also been presented at several conference and is patent pending the US and Canada. Orders with no conceivable health impacts are deemed to be “administrative” orders with a risk score of zero. Once the likelihoods and severities are established, a mathematical prediction model developed by the TSSA combines these quantities, in addition to observed occurrence data to derive two outputs; the risk score for each standardized inspection order, and the associated time to compliance (TTC). Additionally, this process also provides the basic inputs required for establishing inspection intervals for devices that are currently on a risk-informed periodic inspection schedule. The predicted time to compliance is made available for implementation and use including for analysis purposes using risk bins and referred to throughout this report. Table B2 provides an illustration of a risk bin for each TTC range (note that zero risk, administrative orders are low risk regardless of their TTC).
Table B2: Risk bins and corresponding TTC ranges across program areas.
Risk Bin TTC Range (Operating Engineers) TTC Range (all other programs)
High 0 – 10 days 0 – 10 days
Medium 11 – 29 days 11 – 60 days
Low More than 29 days More than 60 days
As mentioned earlier, the TSSA will continue to implement this process electronically as part of a major strategic information system upgrade initiative. In the interim, the TSSA has developed an equivalent approach to determine the risk scores for issued inspection orders using a combination of fuzzy logic searches for clause IDs

Annual State of Public Safety Report 2016 Edit ion
69 | P a g e
and inspector issued time to compliances. This interim approach helps the TSSA for analysis, reporting and inspection scheduling purposes.

Annual State of Public Safety Report 2016 Edit ion
70 | P a g e
Appendix C – High Profile Root Cause Analysis
“A director shall order such investigation as he or she considers necessary on being notified of an accident or incident,
Technical Standard and Safety Act 2000 (the Act), c. 16, s. 25.”
Introduction Technical Standard and Safety Authority (TSSA) administers this requirement in accordance with its risk-informed incident management policy and the associated Incident Management System (IMS) that facilitates a decision-making process applicable through the life cycle of an occurrence (incident or near-miss). The IMS deals with all stages starting from the time an occurrence is reported, an inspector dispatching decision is made, all the way to the determination of cause for the occurrence and any future actions including prosecutions. Information is collected and documented through the entire process using the TSSA’s unique Incident Management Information System (IMIS). A key aspect of the IMS is the determination of cause(s) for occurrences, as this helps the TSSA in addressing any potential gaps in the safety system and reducing risk to Ontarians. Inspections due to the nature of most occurrences, tend to be completed by inspectors’ basic analysis to determine cause(s). However, where a root cause cannot be determined by an inspector alone; and also depending on the nature of the reported occurrences, the level of complexity, the effort in determining cause varies. In recognition of this variability and its associated importance, the TSSA has developed a best-practice investigation methodology for occurrences that meet the criteria of the high profile. This formal approach, High Profile Root Cause Analysis (HPRCA), uses Root Cause Analysis (RCA) principles to determine and document underlying causes related to occurrences under the TSSA regulatory mandate but with additional focus and effort (see Figure C1). To this effect, the TSSA has internally developed a formal process that has significantly improved the efficiency and quality of the RCA exercise. This analysis allows for the development of strategies to prevent and/or mitigate re-occurrence of such incidents by providing useful data to assist in informing further safety decision-making.

Annual State of Public Safety Report 2016 Edit ion
71 | P a g e
Figure C1: High profile root cause analysis flowchart.
INCIDENT INFORMATION EVENT SEQUENCE
DETERMINATION
OFCAUSAL FACTORS
DEVELOPMENT OFCAUSAL FACTORS
(5 Why’s)
EVENT DIAGRAM
DETERMINATION OF
ROOT CAUSE
HPRCAOUTCOMES
CONDITIONS
ROOT CAUSEDIAGRAM
Meets HPRCA Criteria
Incident data (e.g. photos, reports notes, drawings, etc.)
Event chronology working backwards from the final event to the initial event.
Graphical representation of the event sequence
Circumstances or states (passive rather than active) that may have influenced the incident
An examination of events to determine the significant causal factors
Application of 5 Why’s Analysis, progressing from the identified causal factors to the root cause level
Cause classification from “5 Why’s Analysis” of the causal factors leading to root cause determination
HPRCA diagram detailing the graphical representation of the analysis
The HPRCA report highlightingl the significant findings of the analysis
PHASE III - DOCUMENTATION
The ultimate objective of the HPRCA process is to determine all causal factors and not to identify blame. An additional benefit of the HPRCA is that it has provided useful information to other processes (e.g., risk assessments, Director’s Orders, etc.) to enhance safety decision-making. For an occurrence to be classified as requiring a HPRCA, it has to meet the following criteria:
1. Fatality (i.e. where the health impact from an occurrence included death of a victim); and/or 2. Where regulatory non-compliance and the root cause could not be determined by the inspector alone;
and/or 3. Where the inspector and/or those involved in the occurrence inspection believes that there is a potential
for re-occurrence in the future involving similar equipment/circumstances. 4. Other reasons as determined to be appropriate by TSSA investigators including nature and magnitude of
consequences associated with the occurrence (e.g., multiple permanent injuries, disruptions, extensive media/political coverage etc.)
The HPCRA Process The HPRCA tool, developed by the TSSA, is used to document the entire analysis exercise where occurrence information is recorded in a logical manner to assist in the validation and accuracy of incident data. The HPRCA is conducted in three phases:
(a) Incident information Documentation; (b) Root Cause Analysis; and (c) Report Preparation.
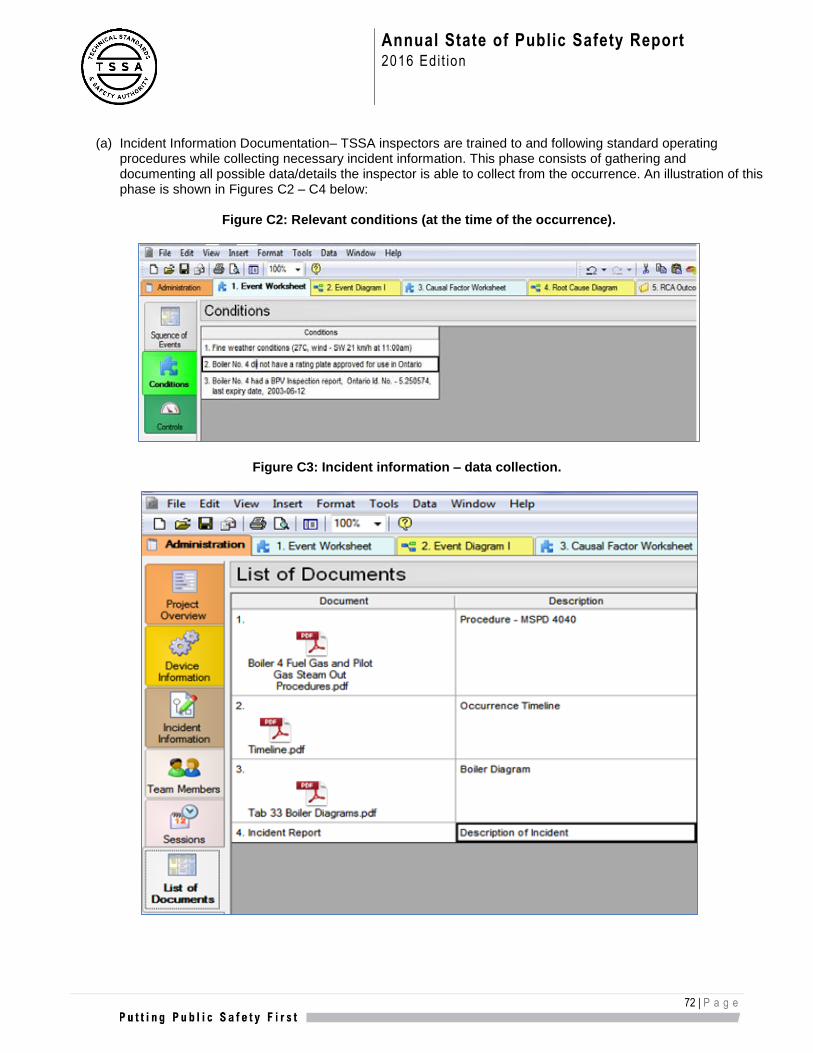
Annual State of Public Safety Report 2016 Edit ion
72 | P a g e
(a) Incident Information Documentation– TSSA inspectors are trained to and following standard operating
procedures while collecting necessary incident information. This phase consists of gathering and documenting all possible data/details the inspector is able to collect from the occurrence. An illustration of this phase is shown in Figures C2 – C4 below:
Figure C2: Relevant conditions (at the time of the occurrence).
Figure C3: Incident information – data collection.

Annual State of Public Safety Report 2016 Edit ion
73 | P a g e
Figure C4: Relevant controls (regulatory or other controls).
(b) Analysis – This phase involves the application of a best practice analysis approach to determine and evaluate significant events, conditions and causal factors. These findings are documented in a structured manner for the determination of cause based on the evidence by determining the sequence (i.e. in a chronological order) of events by working backwards and using a combination of events capable of leading to the final event (see Figures C5 and C6). The analysis of each upstream event identified or in sequence with combinations of events/ conditions, (e.g. single or in series/parallel configurations) capable of causing the final event. The determination and evaluation of identified causal factors by application of the “5 Whys Principle?” (see Figure C7 - e.g. asking why or how this could happen?) until associated causes can be determined. This procedure is followed for each causal factor chain identified until the causes are identified and the team is satisfied it has captured all related scenarios. The TSSA’s root cause analysis policy requires that a single root cause be established, if possible, for occurrences.
Figure C5: Sequence of events (chronological order).

Annual State of Public Safety Report 2016 Edit ion
74 | P a g e
Figure C6: Sequence of events – event diagram.
Figure C7: Analysis of causal factors - 5 Why’s Approach.

Annual State of Public Safety Report 2016 Edit ion
75 | P a g e
(c) Report Preparation – The final phase the HPRCA process involves preparing a report that documents the findings, provides conclusions and recommendations. The tool itself is capable of summarizing the entire exercise including, all administrative details and the documentation of evidence, analysis deliberations, graphical representation of all causal findings in the process (see Figures C8 – C10). A summary report is developed when all phases are completed by the HPRCA facilitator and submitted to the program Statutory Director including relevant recommendations and conclusions.
Figure C8: HPRCA diagram.

Annual State of Public Safety Report 2016 Edit ion
76 | P a g e
Figure C9: HPRCA outcomes.

Annual State of Public Safety Report 2016 Edit ion
77 | P a g e
Figure C10: HPRCA conclusions.
The HPRCA Team - Roles and responsibilities The HPRCA team works independently of any outside influence to ensure findings determined and evaluated purely based on the evidence collected and is made up of the following roles and responsibilities;
Facilitator The Public Safety Risk Management (PSRM) team at the TSSA provides facilitation for the HPRCA process to ensure the consistent application of the methodology and the elimination of gaps by continuously focusing the group’s attention and technical expertise on the facts and relevant issues. This also includes challenging the safety program experts on the incident details and analysis outcomes, the elimination of personal assumptions of causes and overall HPRCA management. The facilitator develops the summary report with the significant findings of the HPRCA for reporting purposes.
Safety Program Experts The safety program provides the resources required (i.e. HPRCA team – engineers, inspectors, etc.) for the execution of the HPRCA exercise. This ensures all information related to event sequencing and causal chains are determined in a systematic and consistent manner for the determination of cause.
o Investigator – Safety program lead for the analysis of the incident information collected. o Inspector – Assigned to the occurrence inspection and is responsible for the collection and reporting
of all related incident information, including the responsibility of appropriately completing and documenting the HPRCA results.
o Engineer - Technical support as technology expert (e.g. design lifecycle and operational functions, etc.) pertaining to the system/equipment/ component associated with the occurrence.
o Safety Program Technical Specialist – Additional safety program subject matter experts.

Annual State of Public Safety Report 2015 Edit ion
78 | P a g e
HPRCA – Examples at the TSSA
Below are a few examples of completed HPRCA on incidents that have provided useful information to safety programs for further safety issue management. 1. Elevator (HPRCA Criteria – Fatality) Entrapment and then self-extraction from an elevator car stopped between floors. Victim jumped from elevator onto floor landing and fell into the elevator shaft, falling six floors to the pit. Root Cause
Gaps in the regulatory management system. (No means of restricting the possibility or potential for passengers to self-extract from an elevator car, stopped away from the unlocking zone).
Conclusions It was determined that the elevator motor was operating in an overload condition at the time of the occurrence, which caused the car to stop between floors (i.e. within design specifications). The actions of the passengers could have been prevented if a physical safeguard was in place on the elevator car to prevent the passengers from opening the doors to a position where self-extraction was possible. Recommendations The TSSA completed a risk assessment to determine if there is a broader safety issue requiring attention related to the hazards of elevator self-extraction as a next step to estimate the associated risks. The focus was on older design technology, where entrapment is an acceptable feature for an elevator car stopping between floors due to the detection of an abnormal condition. Risk Assessment Outcomes The estimated risk was found to be unacceptable if both the door restrictor and apron, are either absent or inadequately fitted. It was determined that door restrictors are quite effective at reducing the frequency of successful self-extractions in an elevator; therefore, it would be best to mandate the proper functionality of either or both of door restrictors and aprons. As a result, a Director’s Order (see Figure C11) was issued on April 15, 2015 to address this issue.
Figure C11: Director’s Order – Car Platform Apron Requirements for Existing Passenger Elevators
(260/14 r1, 04/15/2015).

Annual State of Public Safety Report 2015 Edit ion
79 | P a g e
2. Elevator Serious Injury (HPRCA Criteria - Where regulatory non-compliance and the root cause could not be determined by the inspector alone)
An elderly man entered the 5th floor lobby, to descend on the elevator parked with its doors open. As he attempted to step into the elevator, the car moved away and descended with the doors open. The victim fell into the elevator shaft and was trapped between the car door header and the hoistway enclosure as the car descended to the first floor. He sustained serious injuries to his head, arms, and legs as result of this incident. An elevator mechanic was working on the elevator at the time of the incident Root Cause
Display of unsafe working practices (i.e., failure to follow maintenance procedures - activities contrary to established rules).
Conclusion It was determined that the elevator mechanic did not demonstrate proper understanding of established safety procedures and standards applicable to the device on which he undertakes to perform work. This included non-compliance with the various Director’s Orders issued related to the use of jumpers on elevating devices during maintenance, inspection, testing and repair. Also identified were multiple violations of the Field Employee Safety Handbook, the B44/07 codes and Ontario's Regulations for Elevating Devices. The TSSA applied appropriate regulatory sanctions against the mechanic for this incident. No additional recommendations were made for this occurrence. 3. Motor vehicle fire
(HPRCA Criteria - Where the inspector and/or those involved in the occurrence inspection believes that there is a potential for re-occurrence in the future involving similar equipment/circumstances)
Customer at a petrol station refueling a car and overfilled the tank causing a fuel spill. The spilled fuel was ignited resulting in a fire at the car as well as the fuel pump. No injuries was incurred by the customer but the car was burnt out and the pump damaged by the fire. Root Cause
Inadequate or defective management systems (e.g. hazard identification, monitoring, etc.) - Lack of proper maintenance of gas dispensing components at pump.
Conclusion It was determined that the owner of the gas station ignored previous complaints about the nozzle at the pump before the incident happened. Recommendations The TSSA will continue to monitor similar incidents and complete a risk assessment as a next step to determine if there is a broader safety issue requiring attention and to estimate the risks related to gas pump nozzles failures as a component of the fuel dispensing system. High Profile Root Cause Summary – 2016 The TSSA conducted four HPRCA exercises during 2016 to determine cause and other significant causal factors related these incidents for the Elevating Device (3) and Fuels Safety programs (1). 1. Elevators
Two of the three ED occurrences were related to the known safety issue of elevators moving with doors open (unintended movement), where one resulted in a fatality and the other a near-miss. The root cause of the fatal elevator incident was not established and for the near-miss, inadequate or defective management system.

Annual State of Public Safety Report 2015 Edit ion
80 | P a g e
The third elevator incident involved a physically challenged person who fell from a chairlift platform in their wheelchair while attempting to access the device. The occurrence resulted in the user sustaining a serious injury. The root cause was inadequate management system at the location.
2. Fuel-Fired Equipment
The FS occurrence was related to the known safety issue of CO exposure that occurred at a public municipal facility (Art Gallery). The incident resulted in multiple injuries (14 children and 7 adults), and those exposed were taken to hospital for observation. The root cause was determined to be inadequate management system due to maintenance issues related to equipment and associated venting at the facility.

Annual State of Public Safety Report 2015 Edit ion
81 | P a g e
Appendix D – Overall State of Safety Measures for 2008 – 2016
Table D1: Cross-program state of safety measures for the period 2008 – 201646.
Measure Fiscal Year
2008 2009 2010 2011 2012 2013 2014 2015 2016
Occurrences 2,127 1,954 2,035 2,081 2,157 2,567 3,073 2,851 2,891
Fatalities 7 14 2 6 4 5 10 5 0
Permanent Injuries 41 39 44 18 30 35 51 58 73
Non-Permanent Injuries 723 683 588 652 912 943 1,239 1,161 1,536
Observed Injury Burden
(FE/mpy) 0.38 1.02 0.43 0.18 0.44 0.48 0.55 0.30 0.25
Occurrences not included in predicted risk47
394 359 483 482 346 466 367 262 213
Table D2: State of safety measures for boilers & pressure vessels for the period 2008 – 2016.
Measure Fiscal Year
2008 2009 2010 2011 2012 2013 2014 2015 2016
Occurrences 3 0 5 1 2 2 0 1 5
Fatalities 0 0 0 0 0 0 0 0 0
Permanent Injuries 1 0 0 0 2 0 0 0 1
Non-Permanent Injuries 0 0 0 0 0 0 0 0 1
Observed Injury Burden
(FE/mpy) 7.19E-04 0 0 0 1.03E-03 0 0 0 2.43E-03
Table D3: State of safety measures for operating plants for the period 2008 – 2016.
Measure Fiscal Year
2008 2009 2010 2011 2012 2013 2014 2015 2016
Occurrences 0 0 0 1 2 0 2 2 2
Fatalities 0 0 0 0 0 0 0 0 1
Permanent Injuries 0 0 0 0 0 0 1 1 1
Non-Permanent Injuries 0 0 0 0 0 0 0 1 2
Observed Injury Burden
(FE/mpy) 0 0 0 0 0 0 0.0002 0.0350 0.1366
46 Only considers those program areas for which composite risk can be calculated. For additional details, please refer to the program area
section. Results for previous years have also been updated, and as such, comparisons with previous versions of this report may not be appropriate. 47 Occurrences not included in the calculation of predicted risk include BPV, OE and FS occurrences resulting in leaks, spills and discovery of
petroleum product due to inadequate number of reported occurrences and/or no historic health impacts.

Annual State of Public Safety Report 2015 Edit ion
82 | P a g e
Table D4: State of safety measures for amusement devices for the period 2008 – 2016.
Measure Fiscal Year
2008 2009 2010 2011 2012 2013 2014 2015 2016
Occurrences 89 64 91 103 222 331 520 647 902
Fatalities 0 0 0 0 0 0 0 0 0
Permanent Injuries 8 10 8 3 5 11 26 24 41
Non-Permanent Injuries 70 58 75 88 215 313 452 585 828
Observed Injury Burden
(FE/mpy) 0.01 0.03 0.08 0.00 0.00 0.01 0.04 0.02 0.10
Table D5: State of safety measures for elevators for the period 2008 – 2016.
Measure Fiscal Year
2008 2009 2010 2011 2012 2013 2014 2015 2016
Occurrences 193 172 188 205 340 380 496 458 510
Fatalities 1 0 0 1 2 1 0 1 0
Permanent Injuries 6 3 7 4 12 11 7 8 11
Non-Permanent Injuries 106 83 95 104 167 145 186 118 152
Observed Injury Burden
(FE/mpy) 0.01 0.01 0.00 0.01 0.20 0.09 0.01 0.02 0.01
Table D6: State of safety measures for escalators & moving walks for the period 2008 – 2016.
Measure Fiscal Year
2008 2009 2010 2011 2012 2013 2014 2015 2016
Occurrences 538 531 481 512 522 518 641 592 709
Fatalities 0 0 1 0 0 0 0 0 0
Permanent Injuries 8 1 4 2 4 3 3 7 5
Non-Permanent Injuries 406 390 329 360 362 384 437 383 455
Observed Injury Burden
(FE/mpy) 0.03 0.03 0.14 0.00 0.01 0.00 0.00 0.02 0.03
Table D7: State of safety measures for ski lifts for the period 2008 – 2016.
Measure Fiscal Year
2008 2009 2010 2011 2012 2013 2014 2015 2016
Occurrences 98 105 85 83 132 83 83 63 68
Fatalities 0 0 0 0 0 0 0 0 0
Permanent Injuries 6 4 3 1 0 0 3 2 2
Non-Permanent Injuries 76 87 74 66 117 70 62 50 51
Observed Injury Burden
(FE/mpy) 0.01 0.00 0.10 0.00 0.00 0.00 0.00 0.00 0.00

Annual State of Public Safety Report 2015 Edit ion
83 | P a g e
Table D8: State of safety measures for fuels safety for the period 2008 – 2016.
Measure Fiscal Year
2008 2009 2010 2011 2012 2013 2014 2015 2016
Occurrences 1,209 1,082 1,190 1,178 941 1,255 1,333 1,091 702
Fatalities 6 14 1 5 2 4 10 4 0
Permanent Injuries 13 21 22 8 9 10 12 17 14
Non-Permanent Injuries 65 65 15 34 51 31 102 25 50
Observed Injury Burden
(FE/mpy) 0.32 0.95 0.10 0.16 0.17 0.37 0.53 0.24 0.10
Occurrences not included in predicted risk48
391 359 478 480 342 464 365 259 206
Table D9: State of safety measures for fuels safety49 in private dwellings for the period 2008 – 2016.
Measure Fiscal Year
2008 2009 2010 2011 2012 2013 2014 2015 2016
Occurrences 267 318 392 298 338 456 555 487 253
Fatalities 4 12 1 3 2 4 9 3 0
Permanent Injuries 9 11 19 2 7 7 6 5 7
Non-Permanent Injuries 48 48 12 17 24 12 28 12 20
Observed Injury Burden
(FE/mpy) 0.18 0.75 0.10 0.08 0.13 0.34 0.36 0.19 0.07
Table D10: State of safety measures for CO in multi-unit residences for the period 2008 – 2016.
Measure Fiscal Year
2008 2009 2010 2011 2012 2013 2014 2015 2016
Occurrences 29 28 16 27 35 30 56 54 34
Fatalities 0 0 0 0 0 0 0 1 0
Permanent Injuries 0 0 0 0 0 0 0 0 0
Non-Permanent Injuries 4 2 3 4 9 6 11 11 5
Observed Injury Burden
(FE/mpy) (x10-5) 2.77 5.24 7.87 0.56 6.57 16.57 3.89 1120.42 5.52
48 Occurrences not included in the calculation of predicted risk include leaks, spills and discovery of petroleum product due to an inadequate
number of reported occurrences and/or no historic health impacts. 49 Includes occurrences resulting CO release, fire, explosion and vapour release

Annual State of Public Safety Report 2015 Edit ion
84 | P a g e
Table D11: State of safety measures for fuels safety50 in commercial establishments for the period 2008 – 2016.
Measure Fiscal Year
2008 2009 2010 2011 2012 2013 2014 2015 2016
Occurrences 72 111 95 104 104 144 178 153 126
Fatalities 0 0 0 0 0 0 0 0 0
Permanent Injuries 0 5 1 3 0 1 2 7 4
Non-Permanent Injuries 10 9 0 0 2 6 3 2 19
Observed Injury Burden
(FE/mpy) 0 0.04 0 2.55 x 10⁻⁴ 0 0.04 0.03 0.06 0.02
Table D12: State of safety measures for fuels safety51 in institutions housing sensitive subpopulations
for the period 2008 – 2016.
Measure Fiscal Year
2008 2009 2010 2011 2012 2013 2014 2015 2016
Occurrences 10 23 20 22 26 39 41 17 14
Fatalities 0 0 0 0 0 0 0 0 0
Permanent Injuries 0 0 1 0 0 0 1 0 0
Non-Permanent Injuries 1 0 0 8 12 6 0 0 0
Observed Injury Burden
(FE/mpy) (x10-5) 0 0 8.88 1.85 15.21 0 8.51 0 0
50 Includes occurrences resulting in CO release, fire, explosion and vapour release 51 Includes occurrences resulting in CO release, fire, explosion and vapour release

Annual State of Public Safety Report 2015 Edit ion
85 | P a g e
Appendix E – Risk-Based Inspection Scheduling
Introduction TSSA conducts periodic inspections of devices and facilities administered under the Technical Standards and Safety Act based on prescribed intervals set in regulations or at the discretion of the Statutory Director responsible for the specific regulations using the Director’s powers laid out in the Act and/or the regulations. As part of TSSA’s Risk Informed Decision Making (RIDM) framework, TSSA has adopted to use a risk informed approach to scheduling the frequency of inspections when not prescribed. This scientific and evidence based approach helps TSSA to focus its resource allocation efforts on the basis of safety risk to Ontarians while ensuring objectivity, consistency, fairness and transparency. TSSA’s patented approach for risk-based scheduling (RBS) of devices and facilities is based on the non-compliances observed (hereafter “orders issued”) during inspections, as well as occurrences caused by non-compliance with regulations. Devices or facilities that have had no occurrences caused by non-compliance with regulatory requirements, and/or relatively small number of low-risk non-compliances found during inspections are likely to be inspected at longer intervals. Short inspection intervals would be recommended for devices or facilities that have many high-risk orders issued against them and/or have occurrences caused by non-compliance with regulations. Not only can the RBS method inform inspection scheduling, it gives an indication as to the estimated risk profile in a particular area of concern. In cases where the regulations specify intervals, RBS profiles can be generated exclusively for reporting purposes (e.g., Amusement Devices, Liquid Fuels).
The RBS 2.5 model The TSSA initially developed and obtain a patent for the model (RBS2.0) in 2013. However, since that time TSSA has been making enhancements to the model based on implementation in the field and new information and this appendix describes the most up-to-date version (v. 2.5). The conceptual basis for the model involves a mathematical aggregation of orders issued during inspections and enforcement actions. Risk scores are determined for all orders, drawing primarily on the standard orders risk assessment (see Appendix B); the key difference being when determining the recommended time to comply (TTC), the risk is defined as frequency x consequence while for the RBS the risk is defined as probability x consequence. In the case of the determining the TTC, the objective is to determine time by when the aggregated consequences of potential occurrences due to an observed non-compliance (if left unaddressed) reach a threshold. However, the objective of RBS is to determine time by when the probable accumulation of non-compliances would result in cumulative consequence. For orders where no risk score are currently available or were not determined (e.g. non-standard orders), the issued TTC is used as a surrogate to derive a risk score based on the median risk score of all standard orders with a similar TTC. The RBS calculation considers all orders issued over the past three periodic inspections and any other applicable inspection activities in that time interval. For instance, if device A has periodic inspections conducted in 2012, 2014, and 2016, then any additional inspections, such as enforcement actions and ad-hoc inspections, since 2012 will be included. These order scores are then summed to arrive at an inspection risk score. Devices with occurrences caused by non-compliance with regulations are additionally penalized by assigning each occurrence a DALY value based on the most likely significant consequence (or the 99.5th percentile of all injury-carrying occurrences) and added to the inspection risk score. A time weighted average of the inspection risk scores and the time duration between inspections is calculated to arrive at a device or facility risk score. It is assumed that the risk at a facility/device is close to zero immediately after a periodic inspection. It is also assumed that, in the absence of inspections, the perceived risk gradually accumulates over time due to unobserved non-compliances at a rate specific to a facility/device based on historical observations. The rate is determined based on the following factors:

Annual State of Public Safety Report 2015 Edit ion
86 | P a g e
1. Probable Occurrence Rate for Facility/device - This is determined by dividing the Facility/Device Risk Score with the average health impacts (measured in fatality-equivalents) per occurrence based on incident history across all facilities/devices and all occurrences with known health impacts.
2. Shape Factor (p) – This provides the shape of the curve that helps determine the rate of accumulation of
the perceived risk over time. It is determined by fitting an appropriate statistical distribution to observed time to occurrence since the last inspection. The shape factor is applied to all facilities/devices.
A cumulative risk curve is constructed for each facility/device based on the facility/device specific occurrence rate (described above) and the shape factor. The recommended periodic inspection interval is obtained from the curve as the time to chance of a fraction of one fatality-equivalent as determined by the statutory director. A tolerability interval is obtained from the curve as the time to chance of one fatality-equivalent. For operational reasons and to address uncertainty in the risk estimates the statutory director sets the maximum and minimum inspection intervals. (for example, statutory director for the elevators program has set the minimum and maximum intervals at 6 months and 5 years respectively). Typically, a high-risk device or facility is deemed to be one that has a minimum inspection interval, while a low risk device or facility is one that has the maximum inspection interval. A medium risk device or facility corresponds to everything in between these intervals. In addition, the statutory director may also set lower maximum intervals for devices with known inherent design issues.

Annual State of Public Safety Report 2015 Edit ion
87 | P a g e
Appendix F – Risk of Injury or Fatality Metric Disability-Adjusted Life-Year (DALY) The Risk of Injury of Fatality metric is determined using the Disability-Adjusted Life-Years (DALY) metric. The DALY is a universal health impact metric, introduced by the World Health Organization as a single measure to quantify the burden of diseases and injuries. The DALY can be thought of as equivalent years of “healthy” life lost by virtue of being in states of poor health or disability and/or due to premature fatality. A DALY of 1.0 is the loss of one year of healthy life of a single person due to an injury. For example, a DALY of 28.1 means that 28.1 years of useful life were lost for that year due to injuries arising from all the sectors that TSSA regulates. The expected health impact for a fatality is calculated based on the standard life expectancy at age of death in years and is based on age and sex (e.g., fatality of a male child aged 5 would translate to 70 DALY assuming an average life expectancy of 75 years). The expected health impact for an injury is calculated by multiplying the average duration of the injury by a weight factor that reflects the severity of the injury on a scale from 0 (being in perfect health) to 1 (being fatal). Health loss is characterized by three dominant aspects of public health:
quality of life;
quantity of life; and
social magnitude. The quality of life is measured by duration of injury and life expectancy of a victim. The quantity of life lost is expressed through disability weights, and the social magnitude is characterized by the number of people affected. The expected health impact in units of DALY can be calculated by the following equation:
(Short-term Weight * Short-term Duration) + (Fraction Long-term) * (Long-term Weight * Long-term Duration)
There are four injury types categorized in the TSSA database: i) fatality, ii) permanent injury, iii) non-permanent injury, and iv) no injury. The permanent and non-permanent injuries are further characterized by 28 specific types of injury descriptions. In the above equation, disability weights, fraction long-term and short-term durations, associated with the various injury descriptions, have been adopted and/or modified from the Australian Burden of Disease and Injury Study52. The long-term duration is the expected life expectancy at the time of injury and is applicable in the case of a permanent injury. Consider the following hypothetical example to better understand the evaluation of expected health impact. Assume a male victim sustains a spinal injury at the age of 30 years due to the malfunctioning of a regulated technology. Using the cohort life expectancy of 48.1 years for males aged 25 to 34, the equivalent healthy years lost due to the spinal injury can be calculated as 34.87 DALY by using the above equation. In this calculation, the short-term weight of 0.725 and duration of 0 years were used respectively and the fraction long-term and long-term duration parameters were taken to be 1 and 0.725 respectively. Injury Burden
The observed health impact is quantified based on each victim’s age and injury type in denominations of DALY and is then scaled by the time period under study, the median life expectancy and the exposed population to determine the injury burden in units of fatality-equivalents per exposed population per year. Note that the scaling factors are dynamic and subject to change year-over-year or once every five years during a nation-wide census update.
52Begg S, Vos T, Barker B, Stevenson C, Stanley L and Lopez A: The burden of disease and injury in Australia 2003. Cat. No. PHE 82. Canberra: AIHW 2007.

Annual State of Public Safety Report 2015 Edit ion
88 | P a g e
This version of the ASPR includes the observed injury burden expressed using actual DALYs (see below) as well as the risk of injury or fatality. The former is a reflection of the health impact experienced in a given year, while the latter is a prediction of the injury burden expected in the future based on historical data. Risk of Injury or Fatality The Risk of Injury or Fatality53 approach determines predicted injury burden by accounting for historic occurrences while taking into consideration the uncertainties and variability inherent in the involved parameters and predicts the future state of safety in terms of fatality-equivalents per exposed population per year. The rationale behind this approach is that there is a potential for some of the occurrences without health impacts to manifest themselves as incidents with injuries and fatalities in the future. A simulation approach is used to conduct the predictions based on actual observations. Parametric uncertainties are taken as probability distributions which are then input into the prediction model: (a) One major uncertainty is in the actual number of occurrences. This attribute is subject to reporting bias which
means that an unknown fraction of incidents go unreported to the TSSA. The randomness is assumed to follow a Poisson distribution with the observed occurrence rate as the input parameter.
Figure F1: Probability mass distribution of the occurrence rate.
The figure above illustrates the breadth of uncertainty in the occurrence rate when, for example, 1,600 occurrences a year are observed on average.
(b) The number of victims involved in an occurrence is assumed to be a discrete probability distribution based on historic observations. In cases where there is adequate evidence, a categorical distribution is used. An example is the determination of the TSSA composite prediction.
53 Veeramany, Arun, and Srikanth Mangalam. "Application of disability-adjusted life years to predict the burden of injuries and fatalities due to
public exposure to engineering technologies." Population health metrics 12.1 (2014): 1-9.

Annual State of Public Safety Report 2015 Edit ion
89 | P a g e
The TSSA Composite Risk of Injury or Fatality assumes that the number of victims per occurrence follows a discrete empirical probability distribution constructed from historical observations instead of the prior (FY12-13) assumption that the number of occurrences is uniformly distributed between zero and the maximum number observed in the past. This scheme ensures that extreme tail events are assigned a minimal probability, instead of assuming that they are equally likely compared to the most representative estimate. In the case of granular drill-downs where there is inadequate evidence, the number of occurrences is assumed to be equally likely between zero and the 99.9th percentile of historically observed number of victims. This ensures that unexpected or misreported events occurring as extreme outliers with large impact, are excluded from the analysis.
Figure F2: Frequency of the number of victims in an occurrence.
The above figure illustrates the victim count distribution for a typical composite TSSA State of Safety prediction. The example shows that there are no victims involved in 55% of the cases, one victim involved in 43% of the occurrences and as high as nine victims in less than 1% of the occurrences.
(c) The age of a victim is also uncertain and the range is between that of being an infant and an elderly person. It
is sampled from the most recent age-based population census estimates from Statistics Canada.
55%
43%
1% 0.18% 0.11% 0.06% 0.03% 0.01% 0.01% 0.01%0%
10%
20%
30%
40%
50%
60%
0 1 2 3 4 5 6 7 8 9
% t
imes
Ob
serv
ed
Number of Victims in an Occurrence

Annual State of Public Safety Report 2015 Edit ion
90 | P a g e
Figure F3: Age distribution for predicted risk simulation.
Ontarians aged 15-65 constitute about 70% of the population as seen in the above chart and are more likely to be victims of an occurrence than otherwise. (d) The number and type of injuries is sampled from a distribution constructed out of observations. This
distribution is dependent on the program and the specific occurrence type under consideration.
0%
2%
4%
6%
8%
10%
12%
14%
16%
18%
Fre
qu
en
cy
Age

Annual State of Public Safety Report 2015 Edit ion
91 | P a g e
Figure F4: Injury distribution for the composite risk of injury or fatality.
An injured victim is likely to sustain superficial cuts, sprains, aches and pains or no injury at all more often than a fatal injury as seen in the above figure. The distribution is for illustrative purposes only and varies depending on the regulated sector under study.
0% 5% 10% 15% 20% 25% 30%
Fatal Injury
No Injury
Aches & Pains
Amputation
Internal Hemorrhage
Burns Minor
Burns Severe
Concussion
Limb Dislocation
Electric Shock Minor
Electric Shock Severe
Carcinomatous Poison
External Bruise
Eye Injury
Fracture Major Bone
Fracture Nose Fingers Toes
Heart Attack
Injury Leading to Deafness
Laceration Deep Cut
Laceration Superficial Cut
Nausea Dizziness
Other Internal Injury
Poisoning
Respiratory Infection
Seizure
Skin Infection, Irritation
Spinal Injury
Sprained/Twisted Joints
Swelling
Whiplash
Frequency
Inju
ry T
ype

Annual State of Public Safety Report 2015 Edit ion
92 | P a g e
Figure F5: Risk of injury or fatality distribution.
The end result of a risk simulation is a frequency distribution of predicted health impacts as exemplified in the above figure. The mean value, fifth and 95th percentiles of the distribution are used for reporting purposes in the report. In the above figure, the respective estimates are 0.51, 0.91 and 1.37 fatality-equivalents/million/year. Note that the risk of injury or fatality is expected to be somewhat larger than the corresponding observed risk. This is result of the model design to consider near-misses as potential incidents and to ensure that a larger set of uncertainties are incorporated into the model that are not exhaustively captured in the actual observations. The procedure followed to determine the anticipated health impacts is shown in the flowchart below.
Figure F6: Flowchart to predict future health impacts.
0
50
100
150
200
250
300
350
400
450
500
0.1
3
0.2
1
0.2
9
0.3
7
0.4
6
0.5
4
0.6
2
0.7
0
0.7
8
0.8
6
0.9
5
1.0
3
1.1
1
1.1
9
1.2
7
1.3
5
1.4
3
1.5
2
1.6
0
1.6
8
1.7
6
1.8
4
1.9
2
2.0
1
Freq
uen
cy
Fatality-equivalents per million people per year
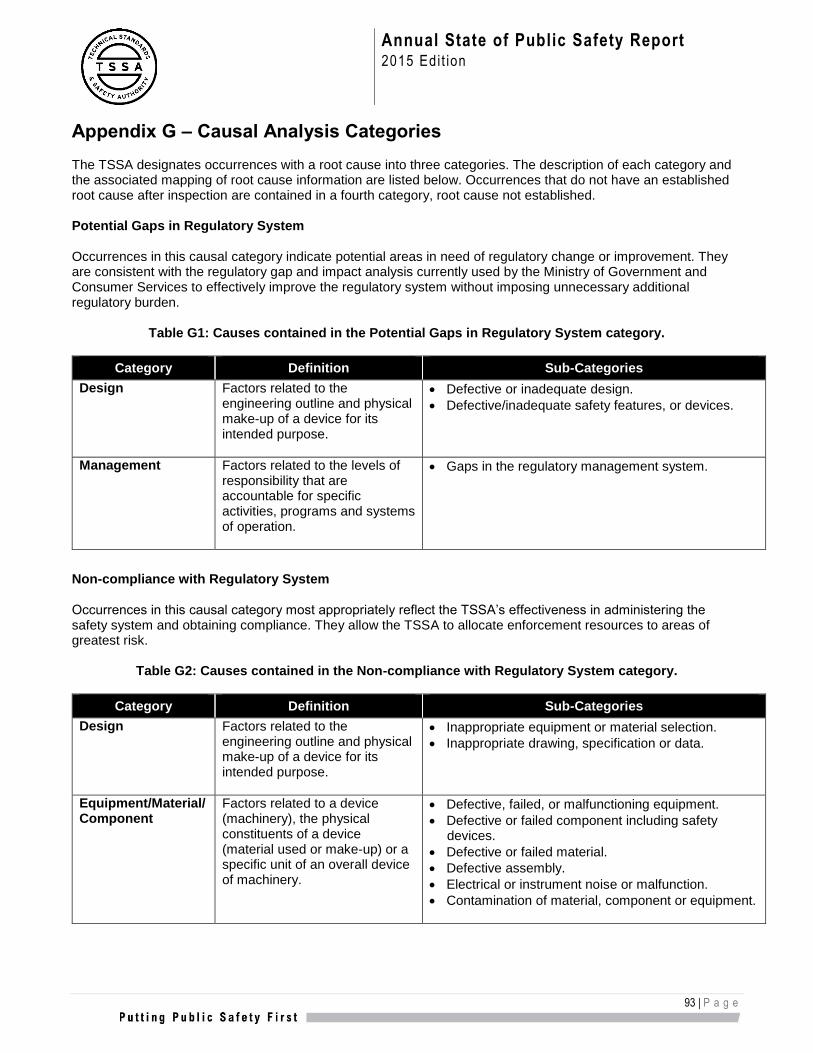
Annual State of Public Safety Report 2015 Edit ion
93 | P a g e
Appendix G – Causal Analysis Categories The TSSA designates occurrences with a root cause into three categories. The description of each category and the associated mapping of root cause information are listed below. Occurrences that do not have an established root cause after inspection are contained in a fourth category, root cause not established. Potential Gaps in Regulatory System Occurrences in this causal category indicate potential areas in need of regulatory change or improvement. They are consistent with the regulatory gap and impact analysis currently used by the Ministry of Government and Consumer Services to effectively improve the regulatory system without imposing unnecessary additional regulatory burden.
Table G1: Causes contained in the Potential Gaps in Regulatory System category.
Category Definition Sub-Categories
Design
Factors related to the engineering outline and physical make-up of a device for its intended purpose.
Defective or inadequate design.
Defective/inadequate safety features, or devices.
Management
Factors related to the levels of responsibility that are accountable for specific activities, programs and systems of operation.
Gaps in the regulatory management system.
Non-compliance with Regulatory System Occurrences in this causal category most appropriately reflect the TSSA’s effectiveness in administering the safety system and obtaining compliance. They allow the TSSA to allocate enforcement resources to areas of greatest risk.
Table G2: Causes contained in the Non-compliance with Regulatory System category.
Category Definition Sub-Categories
Design
Factors related to the engineering outline and physical make-up of a device for its intended purpose.
Inappropriate equipment or material selection.
Inappropriate drawing, specification or data.
Equipment/Material/ Component
Factors related to a device (machinery), the physical constituents of a device (material used or make-up) or a specific unit of an overall device of machinery.
Defective, failed, or malfunctioning equipment.
Defective or failed component including safety devices.
Defective or failed material.
Defective assembly.
Electrical or instrument noise or malfunction.
Contamination of material, component or equipment.
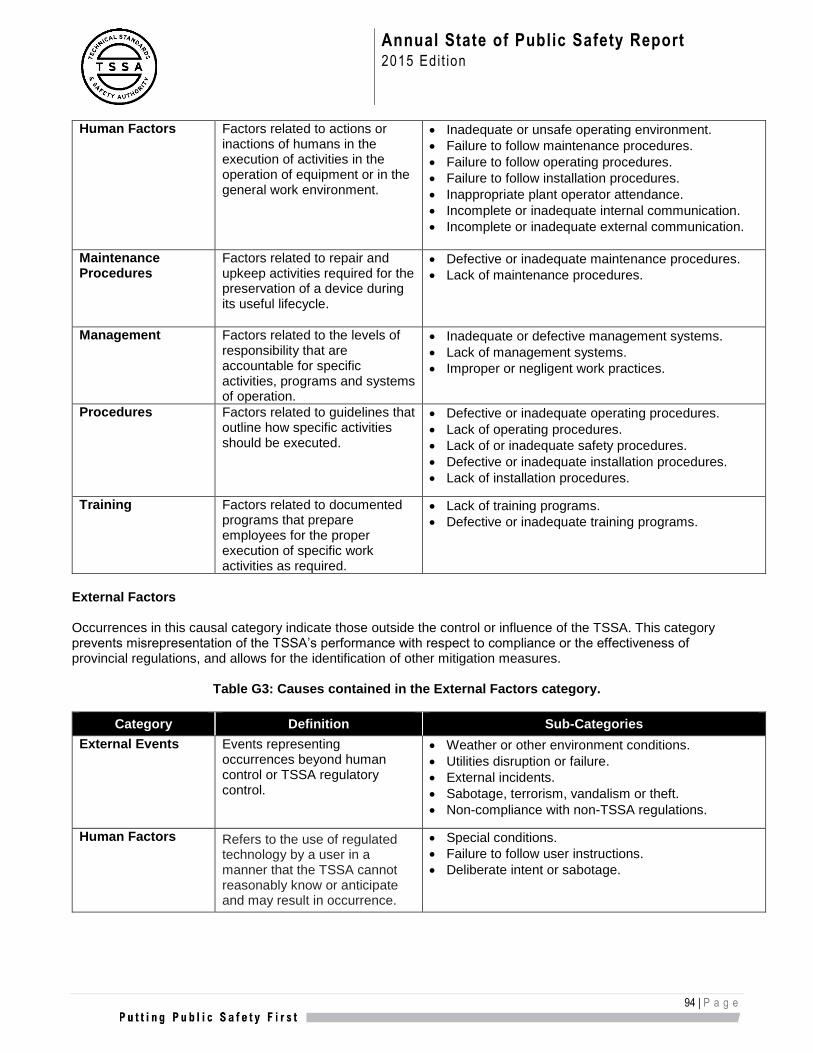
Annual State of Public Safety Report 2015 Edit ion
94 | P a g e
Human Factors
Factors related to actions or inactions of humans in the execution of activities in the operation of equipment or in the general work environment.
Inadequate or unsafe operating environment.
Failure to follow maintenance procedures.
Failure to follow operating procedures.
Failure to follow installation procedures.
Inappropriate plant operator attendance.
Incomplete or inadequate internal communication.
Incomplete or inadequate external communication.
Maintenance Procedures
Factors related to repair and upkeep activities required for the preservation of a device during its useful lifecycle.
Defective or inadequate maintenance procedures.
Lack of maintenance procedures.
Management
Factors related to the levels of responsibility that are accountable for specific activities, programs and systems of operation.
Inadequate or defective management systems.
Lack of management systems.
Improper or negligent work practices.
Procedures
Factors related to guidelines that outline how specific activities should be executed.
Defective or inadequate operating procedures.
Lack of operating procedures.
Lack of or inadequate safety procedures.
Defective or inadequate installation procedures.
Lack of installation procedures.
Training
Factors related to documented programs that prepare employees for the proper execution of specific work activities as required.
Lack of training programs.
Defective or inadequate training programs.
External Factors Occurrences in this causal category indicate those outside the control or influence of the TSSA. This category prevents misrepresentation of the TSSA’s performance with respect to compliance or the effectiveness of provincial regulations, and allows for the identification of other mitigation measures.
Table G3: Causes contained in the External Factors category.
Category Definition Sub-Categories
External Events
Events representing occurrences beyond human control or TSSA regulatory control.
Weather or other environment conditions.
Utilities disruption or failure.
External incidents.
Sabotage, terrorism, vandalism or theft.
Non-compliance with non-TSSA regulations.
Human Factors
Refers to the use of regulated technology by a user in a manner that the TSSA cannot reasonably know or anticipate and may result in occurrence.
Special conditions.
Failure to follow user instructions.
Deliberate intent or sabotage.