technical report tr06-02 january 2006 ag...
TRANSCRIPT
Technical Report TR06-02 January 2006
ricultural Ag Experiment Station
College of
Agricultural Sciences Department of
Soil and Crop Sciences Plainsman
Research Center Cooperative Extension
Plainsman Research Center 2005 Research Reports
Kevin Larson, Superintendent/Research Scientist
Plainsman Research Center
Box 477
42790 Hwy 160
Walsh, CO 81090
(719) 324-5643
Funded by the Colorado Agricultural Experiment Station
in cooperation with the Plainsman Agri-Search Foundation
• **Mention of a trademark or proprietary product does not constitute endorsement by the Colorado Agricultural Experiment Station.**
Colorado State University is an equal opportunity/affirmative action institution and complies with all Federal and Colorado State laws, regulations, and executive orders regarding affirmative action requirements in all programs. The Office of Equal Opportunity is located in 101 Student Services. In order to assist Colorado State University in meeting its affirmative action responsibilities, ethnic minorities, women, and other protected class members are encouraged to apply and to so identify themselves.

Plainsman Research Center, 2005 Research Reports Content Page Small Grains Studies Winter wheat variety performance trials 1 Dryland wheat strips for forage and grain yield 12 Long term residual P on dryland wheat study 15 Dryland wheat planting date and seeding rate study 18 Irrigated dual purpose wheat planting dates, seeding rates, and varieties 23 Long-term ripping study, 1997 to 2005 31 Sweep plow and chisel plow tillage comparison 34 Proso millet harvesting method comparison 36 Sorghum Studies Early maturing dryland grain sorghum hybrid performance trial at Walsh 37 Dryland grain sorghum hybrid performance trial at Vilas 41 Dryland grain sorghum hybrid performance trial at Walsh 45 Irrigated grain sorghum hybrid performance trial at Walsh 49 Limited sprinkler irrigated grain sorghum hybrid trial at Walsh Irrigated forage sorghum hybrid performance trail at Walsh 56 Sandbur control in grain sorghum with microencapsulated herbicides 61 Seedrow Zn on irrigated grain sorghum 63 Long-term, low rate, seedrow P on dryland grain sorghum 66 Skip row planting for dryland grain sorghum and corn 69 Strip-till for dryland grain sorghum 72 Corn Studies Strip-till and surface N comparison for irrigated corn and grain sorghum 74 Limited sprinkler irrigated corn hybrid performance at Walsh 78 Corn Borer resistant and nonresistant hybrid comparison 81 High and low input comparison for subsurface drip irrigated corn 83 New Subsurface Drip Irrigation installation at the Plainsman Farm 85 Sunflower Studies Irrigated sunflower hybrid performance trial at Walsh 86 Banded P rate for sunflower 88 Long-term N effects on wheat-sunflower-fallow rotation 90 Bindweed control for sunflower production 94 Crop Rotation Studies
Crop Rotation Sequencing Study 102 Dryland Crop Rotation Study 116
Alternative Crops Weed control in garbanzo bean 119 Dry bean trial, row crop head and hand harvest comparison 121 National winter canola variety trial 123


This research booklet is dedicated to Dennis Thompson for his 25 years of service and commitment to the Plainsman Research Center and Plainsman Agri-Search Foundation. Ed Langin hired him in March 1981 and throughout his tenure Dennis has been a loyal and productive employee of Colorado State University. This year, on Dennis’ silver anniversary, he was also honored with the 2005 Agricultural Experiment Station Support Staff Award. We thank Dennis for his support and dedication to all the growers served by the Plainsman Research Center.
2005 Plainsman Research Center Staff and Personnel with Projects Kevin Larson Superintendent, Plainsman Research Center, (719) 324-5643 Agricultural Experiment Station, Colorado State University. Dennis Thompson Technician III, Plainsman Research Center, (719) 324-5643 Agricultural Experiment Station, Colorado State University. Deborah Harn Research Associate, RWA Project, Plainsman Research (719) 324-5643 Center, Agricultural Experiment Station, Colorado State University. Calvin Thompson Farm Coordinator, Plainsman Research Center, (719) 324-5643 Agricultural Experiment Station, Colorado State University. Thia Walker Area Entomologist, RWA Project, Plainsman Research (719) 336-7734 Center, Agricultural Experiment Station, Colorado State University. Jerry Johnson Extension Crop Specialist, Crop Testing Program Leader, (970) 491-1454 Soil and Crop Sciences Department, Colorado State University. Scott Haley Professor, Soil and Crop Sciences Department (970) 491-6483 Wheat Breeder, Colorado State University. Gary Peterson Professor and Head, Soil and Crop Sciences Department, (970) 491-6501 Colorado State University. Dwayne Westfall Professor, Sustainable Dryland Agroecosystem Manage- (970) 491-6149 ment Project Leader, Soil and Crop Sciences Department, Colorado State University. Neil Hansen Associate Professor, Sustainable Dryland Agroecosystem (970) 491-6804 Management Project Leader, Soil and Crop Sciences Department, Colorado State University. Mark Brick Professor, Bean Breeder, Soil and Crop Sciences (970) 491-6551 Department, Colorado State University. Scott Brase Cropping System Specialist, Cooperative Extension (719) 336-7734 Southeast Area, Colorado State University.
PLAINSMAN AGRI-SEARCH FOUNDATION BOARD 2007 2005 Paul Hinds Norman Smith 12785 Road 34 21715 Road 51 Campo, CO 81029 Walsh, CO 81090 James Hume Bill Brooks 21491 Road 55 37701 Road V Walsh, CO 81090 Walsh, CO 81090 Tom Jacobs Troy Bishop 27300 Road 25 5/10 27351 Road 25 5/10 Springfield, CO 81073 Springfield, CO 81073 Don Wood (Vice President) Calvin Melcher 36663 Road UU 300 N. Main Two Buttes, CO 81084 Holly, CO 81047 Lyndell Herron Max Smith Box 64 48940 Road X Manter, KS 67862 Walsh, CO 81090 Terrill Swanson (President) Todd Randolph 38724 Road T 53766 Road GG Walsh, CO 81090 Walsh, CO 81090 2006 Dean Sides 49681 Road X Walsh, CO 81090 Don Lohrey Box 279 Walsh, CO 81090 Jack Walker (Secretary/Treasurer) 30780 Road 51 Walsh, CO 81090 Ron Batterton 1550 Hwy 89 Holly, CO 81047 Robert Wood 721 Barkley Springfield, CO 81073 Douglas Melcher 12845 Hwy 89
Holly, CO 81047
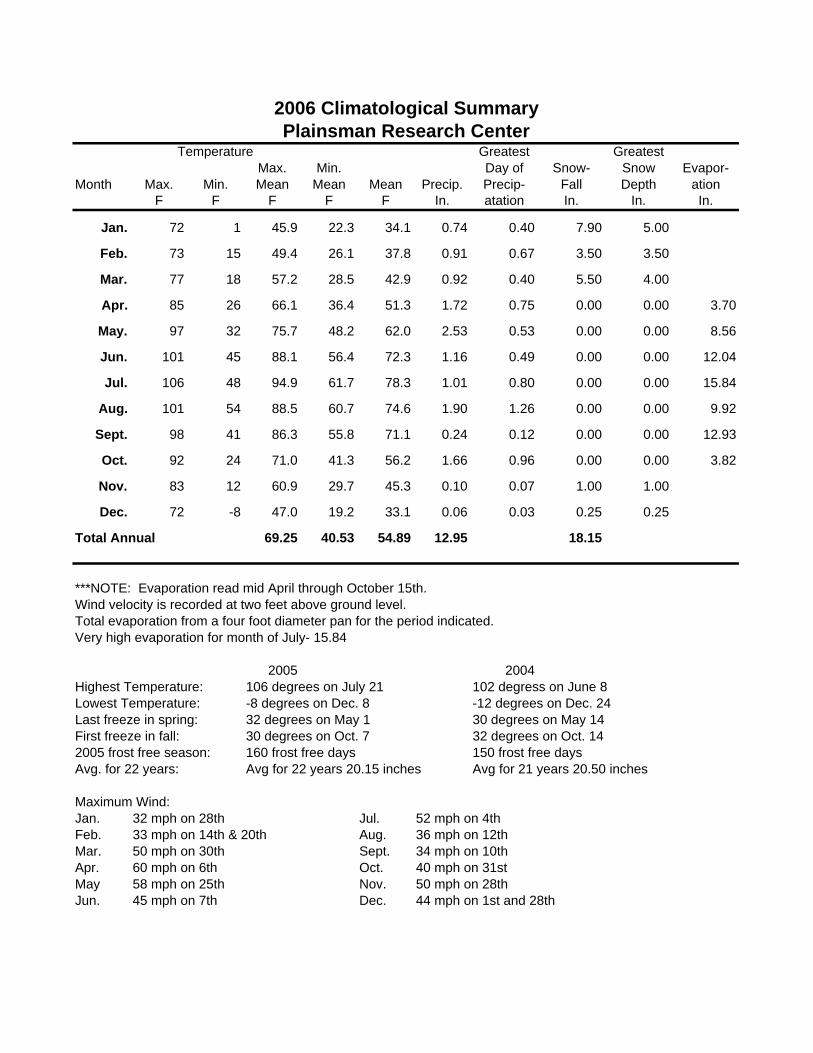
Greatest GreatestMax. Min. Day of Snow- Snow Evapor-
Month Max. Min. Mean Mean Mean Precip. Precip- Fall Depth ationF F F F F In. atation In. In. In.
Jan. 72 1 45.9 22.3 34.1 0.74 0.40 7.90 5.00
Feb. 73 15 49.4 26.1 37.8 0.91 0.67 3.50 3.50
Mar. 77 18 57.2 28.5 42.9 0.92 0.40 5.50 4.00
Apr. 85 26 66.1 36.4 51.3 1.72 0.75 0.00 0.00 3.70
May. 97 32 75.7 48.2 62.0 2.53 0.53 0.00 0.00 8.56
Jun. 101 45 88.1 56.4 72.3 1.16 0.49 0.00 0.00 12.04
Jul. 106 48 94.9 61.7 78.3 1.01 0.80 0.00 0.00 15.84
Aug. 101 54 88.5 60.7 74.6 1.90 1.26 0.00 0.00 9.92
Sept. 98 41 86.3 55.8 71.1 0.24 0.12 0.00 0.00 12.93
Oct. 92 24 71.0 41.3 56.2 1.66 0.96 0.00 0.00 3.82
Nov. 83 12 60.9 29.7 45.3 0.10 0.07 1.00 1.00
Dec. 72 -8 47.0 19.2 33.1 0.06 0.03 0.25 0.25
Total Annual 69.25 40.53 54.89 12.95 18.15
***NOTE: Evaporation read mid April through October 15th.Wind velocity is recorded at two feet above ground level.Total evaporation from a four foot diameter pan for the period indicated.Very high evaporation for month of July- 15.84
2005 2004Highest Temperature: 106 degrees on July 21 102 degress on June 8Lowest Temperature: -8 degrees on Dec. 8 -12 degrees on Dec. 24Last freeze in spring: 32 degrees on May 1 30 degrees on May 14First freeze in fall: 30 degrees on Oct. 7 32 degrees on Oct. 142005 frost free season: 160 frost free days 150 frost free daysAvg. for 22 years: Avg for 22 years 20.15 inches Avg for 21 years 20.50 inches
Maximum Wind:Jan. 32 mph on 28th Jul. 52 mph on 4thFeb. 33 mph on 14th & 20th Aug. 36 mph on 12thMar. 50 mph on 30th Sept. 34 mph on 10thApr. 60 mph on 6th Oct. 40 mph on 31stMay 58 mph on 25th Nov. 50 mph on 28thJun. 45 mph on 7th Dec. 44 mph on 1st and 28th
Temperature
2006 Climatological SummaryPlainsman Research Center

Winter Wheat Variety Selection in Colorado for Fall 2005 Jerry Johnson and Scott Haley (August 2005)
Colorado’s unpredictable climate and the occurrence of various insect, disease, and weed pests of wheat make it difficult to predict the future performance of wheat varieties based upon their performance in previous trials. Nevertheless, in the tables below we provide the information wheat producers need to make the best possible decision under our variable circumstances. Issues specific to variety selection in 2005: Stripe rust- The most common question thus far this year has been whether we will have stripe rust next year. No one knows of course because it has caused damage in three of the last five years and in 2005 appeared weeks earlier than we had seen it in previous years. On the other hand, stripe rust epidemics require a favorable environment, a susceptible variety, and presence of stripe rust spores - all three of which coincided in 2005. Many of the available varieties are susceptible to some degree, some more than others. The favorable environment last year was promoted by early planting, good moisture and good late-fall growing conditions followed by a mild winter, prolific tillering and rapid early spring growth. These environmental conditions are rare in Colorado and might not occur in 2006. The presence of spores is becoming more common in Colorado but clearly irrigated wheat production is at much greater risk than dryland wheat. White wheat- CSU personnel and the Colorado wheat industry are convinced that white wheat is most promising future for wheat production and marketing in Colorado. The white wheat varieties, Avalanche and Trego, have performed well in the past few years but Trego must have been more affected by the heat and drought stress in May than Avalanche and some of the other varieties. We remain convinced that a white wheat variety should be high on the list for variety selection in 2005. Russian wheat aphid- New forms (called "biotypes") of RWA have evolved and rendered ineffective the resistance found in all available RWA-resistant varieties. However, some of these varieties perform very well and should be considered for their yielding capability compared to other susceptible varieties. Hatcher, Bond CL, and Ankor are examples of RWA-resistant varieties that are high performance varieties for Colorado. CLEARFIELD* wheat- The variety Above is still a top performing variety but the new variety from CSU, Bond CL, has performed even better under dryland conditions over the past three years. It is important to remember that you can’t save seed of these varieties - even to plant on your own farm. The Plant Variety Protection Act and a U.S. Utility Patent protect them. Selecting your variety Dryland wheat producers: Our first suggestion is to plant more than one variety in order to spread your risk. The yield table below is based on 3-Yr average performance in our trials, a method for variety comparison shown to be more reliable than single location or single year performance. Note that varieties are alphabetically ranked within a column, rather than ranked by average yields, to stress that differences among the varieties are not statistically significant.
1
Bond CL and Hatcher are the two newcomers to the highest potential performance column and are the newest CSU releases. These two varieties will be included in the new 2005/06 Collaborative On-Farm Test program. Relative maturity, measured by heading date, might be one way to spread risk related to drought, hail, or freeze damage. Susceptibility to stripe rust might also be a criterion for variety selection in 2005 although be careful not to base variety selection on stripe rust resistance alone. Under our normal low rainfall conditions, wheat streak mosaic virus might be a more consistent threat than stripe rust and worthy of consideration when selecting a variety. Plant height and coleoptile length might be important criteria for southeastern Colorado producers. Irrigated wheat producers: Most irrigated producers plant a single variety and the most important criteria are yield and straw strength from the tables below. The Platte program has returned profit to many irrigated wheat producers through the incentive package, although some yield loss might be expected when stripe rust is a problem and is not effectively controlled with fungicides. The irrigated trials in Colorado have been very good the past three years and Jagalene, Yuma, Hatcher, and Ankor have performed very well even though Yuma and Jagalene are the only ones with above average straw strength. The newly released varieties Hatcher and Bond CL are welcome additions to our high yielding irrigated wheat varieties.
2

High Performance Varieties for Dryland Eastern Colorado
Higher Yielding Intermediate Lower Yielding Above
Avalanche Bond CL Hatcher Jagalene
Alliance Ankor
AP502 CL Jagger
Prairie Red
TAM 111 Trego Yuma Yumar
Akron Lakin
Prowers 99 Stanton
Thunderbolt High Performance Varieties for Colorado Irrigated Conditions
Higher Yielding Intermediate Excellent 2-Yr Performance Ankor
Hatcher Jagalene
Yuma
Antelope Dumas Ok102 Platte
Prairie Red Wesley
Bond CL NuHills
Stripe Rust Moderately Resistant-Resistant Intermediate Moderately Susceptible-Susceptible
Antelope Hatcher Jagalene Jagger
TAM 111 Wesley
Alliance Dumas
Prowers 99 Stanton Yuma Yumar
Above Akron Ankor
AP502 CL Avalanche Bond CL
Lakin Platte
Prairie Red Thunderbolt
Trego
Wheat Streak Mosaic Virus Moderately Resistant-Resistant Intermediate Moderately Susceptible-Susceptible
Above AP502 CL Avalanche Jagalene Jagger Lakin
Prairie Red
Stanton TAM 111
Thunderbolt Trego Yuma Yumar
Akron Alliance Ankor
Antelope Bond CL Dumas Hatcher
Platte Prowers 99
Wesley
Test Weight Highest Average Lowest
Avalanche Dumas
Jagalene Platte
Prowers 99 Stanton
TAM 111 Thunderbolt
Trego
Above Akron
Alliance Ankor
Antelope Hatcher
Jagger Lakin
Wesley Yuma Yumar
AP502 CL Bond CL
Prairie Red
Heading Date Earliest Medium Latest Above
AP502 CL Jagger
Prairie Red
Akron Alliance Ankor
Antelope Avalanche Bond CL Dumas Hatcher Jagalene
Lakin Platte
Stanton TAM 111
Trego Wesley Yuma Yumar
Prowers 99 Thunderbolt
3
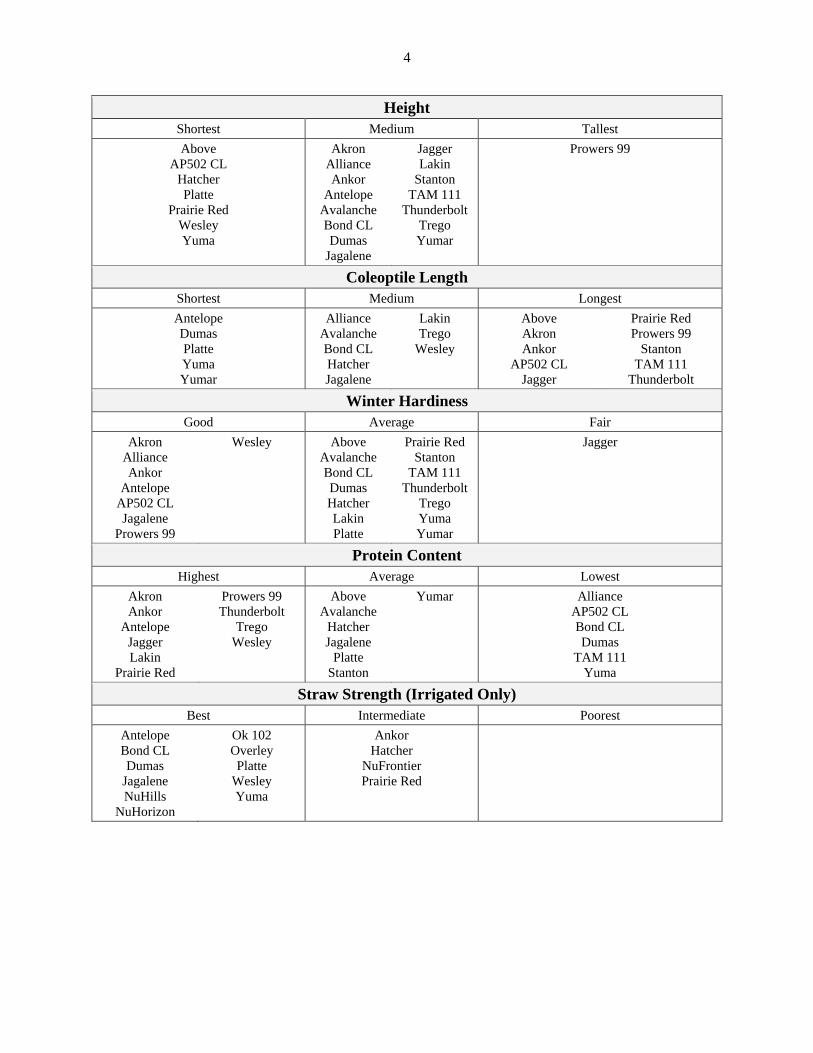
Height Shortest Medium Tallest Above
AP502 CL Hatcher Platte
Prairie Red Wesley Yuma
Akron Alliance Ankor
Antelope Avalanche Bond CL Dumas
Jagalene
Jagger Lakin
Stanton TAM 111
Thunderbolt Trego Yumar
Prowers 99
Coleoptile Length Shortest Medium Longest Antelope Dumas Platte Yuma Yumar
Alliance Avalanche Bond CL Hatcher Jagalene
Lakin Trego
Wesley
Above Akron Ankor
AP502 CL Jagger
Prairie Red Prowers 99
Stanton TAM 111
Thunderbolt
Winter Hardiness Good Average Fair
Akron Alliance Ankor
Antelope AP502 CL Jagalene
Prowers 99
Wesley Above Avalanche Bond CL Dumas Hatcher Lakin Platte
Prairie Red Stanton
TAM 111 Thunderbolt
Trego Yuma Yumar
Jagger
Protein Content Highest Average Lowest
Akron Ankor
Antelope Jagger Lakin
Prairie Red
Prowers 99 Thunderbolt
Trego Wesley
Above Avalanche
Hatcher Jagalene
Platte Stanton
Yumar Alliance AP502 CL Bond CL Dumas
TAM 111 Yuma
Straw Strength (Irrigated Only) Best Intermediate Poorest
Antelope Bond CL Dumas
Jagalene NuHills
NuHorizon
Ok 102 Overley Platte
Wesley Yuma
Ankor Hatcher
NuFrontier Prairie Red
4

Winter wheat Uniform Variety Performance Trial at Walsh in 20051
Grain Test Plant StripeVariety Yield Moisture Weight Height Rust2
bu/ac % lb/bu in 1-9Hatcher 65.0 9.0 59.0 26 5Bond CL 60.3 8.5 53.8 28 8Enhancer 57.4 8.4 57.2 31 4CO00016* 57.4 8.6 58.0 26 9TAM 111 56.7 8.2 58.9 30 2NuFrontier 55.6 8.8 58.5 31 4Yuma 54.1 8.1 56.1 24 6Harry 53.5 8.1 54.6 29 9Jagger 53.5 8.5 58.3 30 2Yumar 53.2 8.3 57.7 27 6Danby** 52.8 8.5 55.8 27 4HV9W98-143 51.7 8.1 54.4 31 2Ankor 51.1 8.8 58.6 27 7NuHorizon 51.1 8.6 59.0 25 4Jagalene 50.5 8.7 57.6 28 4Prowers 99 50.4 8.8 58.8 33 5Alliance 50.4 8.4 57.6 27 6Wahoo 49.0 8.4 56.2 28 4Overley 48.6 8.3 57.3 29 3Endurance 48.2 8.6 57.8 27 8NuHills 47.0 7.4 51.9 28 3Prairie Red 46.0 8.4 56.8 25 9GM10006 45.9 8.8 59.1 25 9Infinity CL 45.8 8.4 55.8 27 4Goodstreak 45.6 8.5 59.7 30 5Above 45.4 8.3 58.0 26 9Millennium 44.2 8.6 58.1 30 4AP502 CL 44.2 8.0 56.1 26 9Akron 43.9 8.6 57.6 27 8Avalanche 43.4 8.7 58.5 27 9Stanton 41.9 8.6 58.6 27 8Lakin 41.7 8.4 58.5 24 9Thunderbolt 41.1 8.7 59.9 26 8Trego 39.3 8.4 57.3 24 9 Average 49.6 8.5 57.4 27 6 LSD(0.30) 3.21Trial conducted at the Plainsman Research Center; seeded 9/28/04 and harvested 6/28/05.2Rating scale 1-9 with 1 = very resistant to 9 = very susceptible.*CO00016 is being advanced toward variety release in fall 2006.**"Danby" was tested by the experimental name KS02HW34.***The LSD is computed from the Analysis of Variance of all entries in the trial, including the Colorado experimental lines (performance not shown).
5

Grain Test PlantVariety Yield Moisture Weight Height
bu/ac % lb/bu inCO00016* 44.9 8.7 56.7 27Enhancer 44.0 8.5 56.1 33Harry 43.7 7.7 53.8 26Hatcher 43.5 8.4 55.9 24Alliance 41.2 8.7 57.7 25Goodstreak 41.2 8.3 55.9 24Avalanche 40.6 8.9 57.4 33Jagalene 40.3 8.4 54.9 32NuHorizon 39.6 9.0 57.4 26GM10006 38.3 8.0 54.5 30Bond CL 37.5 7.9 53.5 26Lakin 37.5 8.6 56.9 25HV9W98-143 37.4 8.1 53.2 30Infinity CL 37.3 8.4 55.1 27Wahoo 36.4 7.8 53.1 27Prowers 99 36.0 8.9 55.5 28Overley 35.6 8.3 55.2 29NuHills 35.2 7.6 50.9 31Prairie Red 35.1 8.4 55.2 26Akron 34.8 8.7 57.0 27Above 34.7 8.2 54.7 25AP502 CL 33.6 8.5 56.1 29Danby** 33.5 8.4 53.1 30Ankor 33.3 9.0 56.9 25Jagger 32.8 8.1 54.4 29TAM 111 32.4 8.7 56.2 31Yumar 32.2 8.3 53.1 26Millennium 32.0 7.8 53.2 27Trego 31.7 8.7 56.2 30NuFrontier 31.1 7.8 53.4 29Thunderbolt 30.6 8.7 56.9 28Endurance 30.4 8.7 55.7 30Yuma 28.8 8.0 53.9 23Stanton 25.9 8.8 56.5 27 Average 36.0 8.4 55.2 28 LSD(0.30) 5.31Trial conducted on the John Stulp farm; seeded 9/15/04 and harvested 6/28/05.*CO00016 is being advanced toward variety release in fall 2006.**"Danby" was tested by the experimental name KS02HW34.***The LSD is computed from the Analysis of Variance of all entries in the trial, including the Colorado experimental lines (performance not shown).
Winter wheat Uniform Variety Performance Trial at Lamar in 20051
6
Grain Test PlantVariety Yield Moisture Weight Height
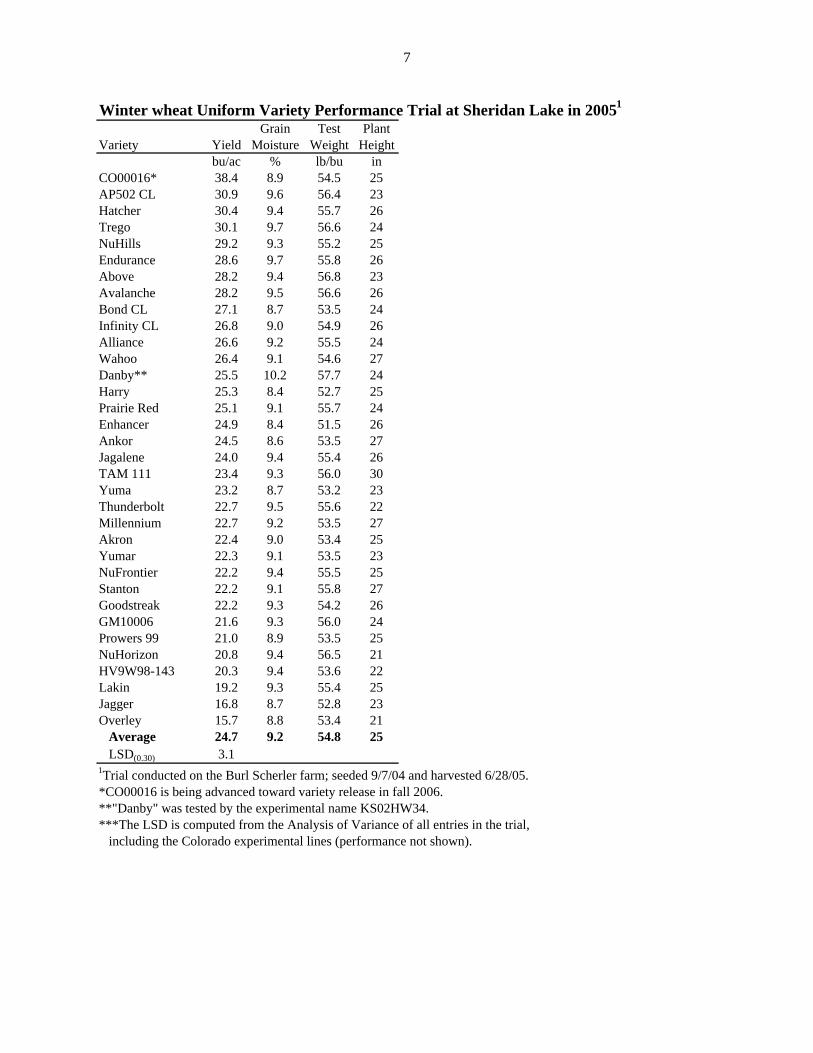
bu/ac % lb/bu inCO00016* 38.4 8.9 54.5 25AP502 CL 30.9 9.6 56.4 23Hatcher 30.4 9.4 55.7 26Trego 30.1 9.7 56.6 24NuHills 29.2 9.3 55.2 25Endurance 28.6 9.7 55.8 26Above 28.2 9.4 56.8 23Avalanche 28.2 9.5 56.6 26Bond CL 27.1 8.7 53.5 24Infinity CL 26.8 9.0 54.9 26Alliance 26.6 9.2 55.5 24Wahoo 26.4 9.1 54.6 27Danby** 25.5 10.2 57.7 24Harry 25.3 8.4 52.7 25Prairie Red 25.1 9.1 55.7 24Enhancer 24.9 8.4 51.5 26Ankor 24.5 8.6 53.5 27Jagalene 24.0 9.4 55.4 26TAM 111 23.4 9.3 56.0 30Yuma 23.2 8.7 53.2 23Thunderbolt 22.7 9.5 55.6 22Millennium 22.7 9.2 53.5 27Akron 22.4 9.0 53.4 25Yumar 22.3 9.1 53.5 23NuFrontier 22.2 9.4 55.5 25Stanton 22.2 9.1 55.8 27Goodstreak 22.2 9.3 54.2 26GM10006 21.6 9.3 56.0 24Prowers 99 21.0 8.9 53.5 25NuHorizon 20.8 9.4 56.5 21HV9W98-143 20.3 9.4 53.6 22Lakin 19.2 9.3 55.4 25Jagger 16.8 8.7 52.8 23Overley 15.7 8.8 53.4 21 Average 24.7 9.2 54.8 25 LSD(0.30) 3.11Trial conducted on the Burl Scherler farm; seeded 9/7/04 and harvested 6/28/05.*CO00016 is being advanced toward variety release in fall 2006.**"Danby" was tested by the experimental name KS02HW34.***The LSD is computed from the Analysis of Variance of all entries in the trial, including the Colorado experimental lines (performance not shown).
Winter wheat Uniform Variety Performance Trial at Sheridan Lake in 20051
7

Colorado winter wheat Uniform Variety Performance Trial summary for 2005.------------------------------------Location------------------------------------- ----------------2005 Averages-----------------
% of Trial Grain Test Plant
Variety1
Akr
on
Ara
paho
e
Ben
nett
Bur
lingt
on
Gen
oa
Jule
sbur
g
Lam
ar
Sher
idan
Lak
e
Wal
sh
Yum
a
2005
Average Moist2 Wt Ht3
-------------------------------------Yield (bu/ac) -------------------------------------- % % lb/bu in
Bond CL 33.5 30.5 41.3 34.5 66.2 28.4 37.5 27.1 60.3 30.7 39.0 125 10.1 56.4 22
CO00016* 31.3 34.6 37.3 35.0 53.1 31.9 44.9 38.4 57.4 25.0 38.9 125 10.4 56.9 23
Hatcher 26.7 24.3 35.3 14.8 66.2 33.4 43.5 30.4 65.0 18.0 35.8 115 10.6 57.6 20
Enhancer 28.6 25.7 37.6 27.1 59.4 26.0 44.0 24.9 57.4 24.5 35.5 114 10.3 55.3 25
HV9W98-143 26.6 20.9 36.9 17.6 72.5 28.1 37.4 20.3 51.7 25.1 33.7 108 10.9 56.2 24
AP502 CL 25.5 23.3 36.5 29.7 54.5 29.8 33.6 30.9 44.2 24.3 33.2 107 10.0 57.5 23
Prairie Red 26.6 25.0 40.7 25.4 57.8 32.3 35.1 25.1 46.0 17.4 33.1 106 10.3 57.6 21
Above 27.1 30.6 33.7 24.3 60.0 27.9 34.7 28.2 45.4 19.5 33.1 106 10.5 58.2 21
Jagalene 22.2 18.8 31.4 19.7 63.5 35.0 40.3 24.0 50.5 25.2 33.1 106 10.5 57.2 23
Avalanche 26.4 19.1 36.3 18.9 57.8 33.9 40.6 28.2 43.4 25.2 33.0 106 10.7 58.5 23
Jagger 31.2 25.8 26.6 19.8 66.8 28.9 32.8 16.8 53.5 25.1 32.7 105 10.2 56.4 23
GM10006 28.6 15.3 35.4 22.1 63.8 31.9 38.3 21.6 45.9 21.7 32.5 104 10.7 58.2 23
Alliance 25.1 21.1 33.8 21.0 55.2 27.4 41.2 26.6 50.4 20.7 32.2 103 10.3 57.7 22
NuHills 25.0 24.8 38.2 15.6 59.4 21.7 35.2 29.2 47.0 26.2 32.2 103 10.3 55.3 23
NuFrontier 23.5 20.3 38.1 18.4 61.5 26.9 31.1 22.2 55.6 22.2 32.0 103 10.5 57.4 24
Overley 16.9 25.9 34.1 25.6 53.7 29.9 35.6 15.7 48.6 32.8 31.9 102 10.3 56.2 24
Harry 30.0 20.1 28.4 15.7 51.8 25.7 43.7 25.3 53.5 20.0 31.4 101 9.8 54.4 22
Prowers 99 23.9 15.9 39.0 18.8 54.4 32.8 36.0 21.0 50.4 20.6 31.3 100 11.0 57.7 24
Infinity CL 26.2 23.2 32.0 17.8 57.1 27.4 37.3 26.8 45.8 17.8 31.1 100 10.3 56.6 22
Danby** 20.4 18.6 38.9 11.8 66.4 22.8 33.5 25.5 52.8 17.9 30.9 99 11.2 57.8 23
Yuma 18.9 19.6 35.4 19.3 56.0 28.8 28.8 23.2 54.1 24.2 30.8 99 10.2 56.5 20
Yumar 25.6 20.5 33.3 16.8 50.8 29.0 32.2 22.3 53.2 23.7 30.7 99 10.3 56.5 22
Endurance 17.2 22.9 29.4 23.0 61.4 25.4 30.4 28.6 48.2 20.4 30.7 98 11.1 58.0 24
Goodstreak 18.9 22.2 33.8 18.7 55.7 26.4 41.2 22.2 45.6 16.0 30.0 96 10.7 58.2 24
Ankor 22.0 21.1 38.4 9.8 55.8 27.3 33.3 24.5 51.1 14.4 29.7 95 10.5 57.1 21
TAM 111 23.0 17.0 28.3 7.1 62.4 27.4 32.4 23.4 56.7 16.6 29.4 94 11.4 57.5 25
Millennium 22.8 16.8 31.6 21.3 43.3 31.0 32.0 22.7 44.2 22.6 28.8 92 10.3 55.4 25
Thunderbolt 19.4 13.2 27.5 22.5 47.7 34.9 30.6 22.7 41.1 25.4 28.5 91 10.4 56.7 22
Akron 21.0 22.1 28.7 8.9 50.4 24.4 34.8 22.4 43.9 15.5 27.2 87 10.5 57.3 21
Wahoo 17.4 12.7 30.2 6.0 60.0 20.8 36.4 26.4 49.0 11.9 27.1 87 10.7 56.4 23
Stanton 22.3 22.5 23.7 10.5 53.8 23.0 25.9 22.2 41.9 18.6 26.4 85 9.8 58.2 22
Trego 20.0 17.3 31.7 7.8 50.2 20.4 31.7 30.1 39.3 13.1 26.2 84 10.9 58.2 22
NuHorizon 21.1 16.0 24.9 10.6 47.9 12.4 39.6 20.8 51.1 16.5 26.1 84 11.1 58.8 21
Lakin 12.2 22.3 16.5 3.8 44.1 20.3 37.5 19.2 41.7 9.6 22.7 73 10.7 58.1 22
Averages 23.7 21.5 33.1 18.2 57.1 27.5 36.0 24.7 49.6 20.8 31.2 10.5 57.1 22.6 LSD(0.30) 2.7 2.8 3.9 2.0 5.8 5.3 3.1 3.2 2.6 1.2
1Varieties in table ranked by the average yield over 10 locations in 2005. 2No moisture taken at Julesburg. 3No height notes at Burlington. *CO00016 is being advanced toward variety release in fall 2006. **"Danby" was tested by the experimental name KS02HW34. ***The LSD is computed from the Analysis of Variance of all entries in the trial, including the Colorado experimental lines (performance not shown).
8
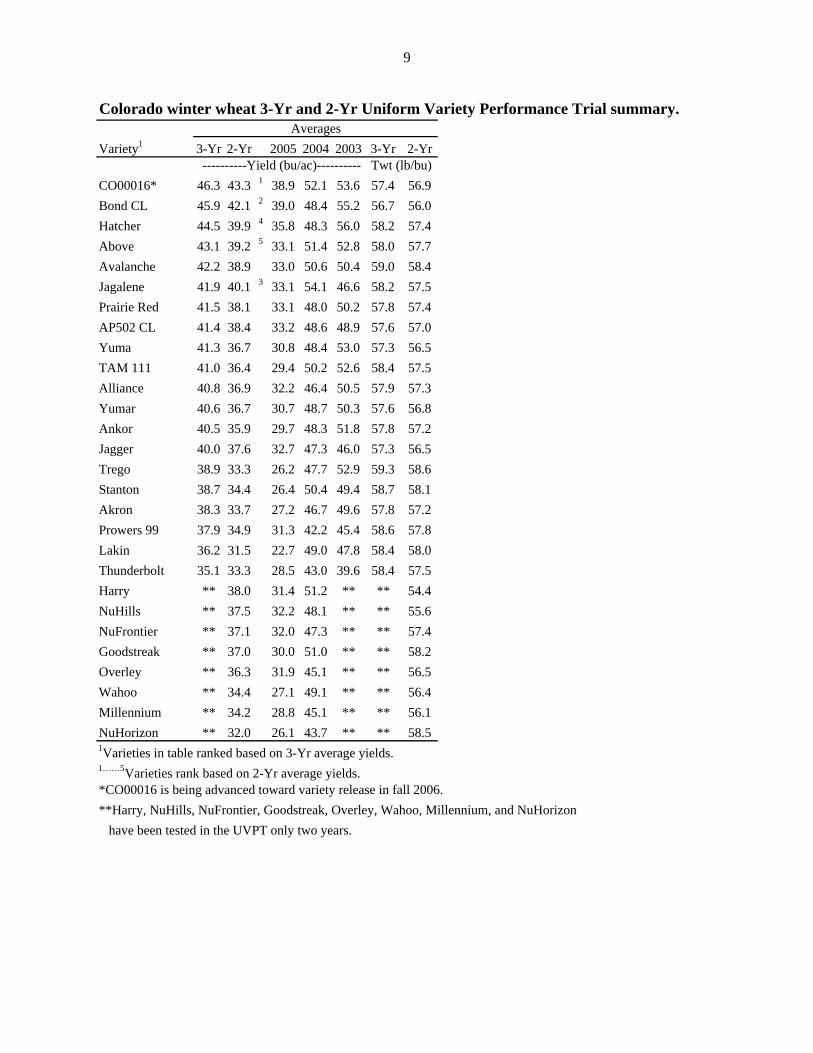
Colorado winter wheat 3-Yr and 2-Yr Uniform Variety Performance Trial summary.
Variety1 3-Yr 2-Yr 2005 2004 2003 3-Yr 2-Yr
CO00016* 46.3 43.3 1 38.9 52.1 53.6 57.4 56.9Bond CL 45.9 42.1 2 39.0 48.4 55.2 56.7 56.0Hatcher 44.5 39.9 4 35.8 48.3 56.0 58.2 57.4Above 43.1 39.2 5 33.1 51.4 52.8 58.0 57.7Avalanche 42.2 38.9 33.0 50.6 50.4 59.0 58.4Jagalene 41.9 40.1 3 33.1 54.1 46.6 58.2 57.5Prairie Red 41.5 38.1 33.1 48.0 50.2 57.8 57.4AP502 CL 41.4 38.4 33.2 48.6 48.9 57.6 57.0Yuma 41.3 36.7 30.8 48.4 53.0 57.3 56.5TAM 111 41.0 36.4 29.4 50.2 52.6 58.4 57.5Alliance 40.8 36.9 32.2 46.4 50.5 57.9 57.3Yumar 40.6 36.7 30.7 48.7 50.3 57.6 56.8Ankor 40.5 35.9 29.7 48.3 51.8 57.8 57.2Jagger 40.0 37.6 32.7 47.3 46.0 57.3 56.5Trego 38.9 33.3 26.2 47.7 52.9 59.3 58.6Stanton 38.7 34.4 26.4 50.4 49.4 58.7 58.1Akron 38.3 33.7 27.2 46.7 49.6 57.8 57.2Prowers 99 37.9 34.9 31.3 42.2 45.4 58.6 57.8Lakin 36.2 31.5 22.7 49.0 47.8 58.4 58.0Thunderbolt 35.1 33.3 28.5 43.0 39.6 58.4 57.5Harry ** 38.0 31.4 51.2 ** ** 54.4NuHills ** 37.5 32.2 48.1 ** ** 55.6NuFrontier ** 37.1 32.0 47.3 ** ** 57.4Goodstreak ** 37.0 30.0 51.0 ** ** 58.2Overley ** 36.3 31.9 45.1 ** ** 56.5Wahoo ** 34.4 27.1 49.1 ** ** 56.4Millennium ** 34.2 28.8 45.1 ** ** 56.1NuHorizon ** 32.0 26.1 43.7 ** ** 58.51Varieties in table ranked based on 3-Yr average yields.1……5Varieties rank based on 2-Yr average yields.*CO00016 is being advanced toward variety release in fall 2006.**Harry, NuHills, NuFrontier, Goodstreak, Overley, Wahoo, Millennium, and NuHorizon have been tested in the UVPT only two years.
Averages
----------Yield (bu/ac)---------- Twt (lb/bu)
9
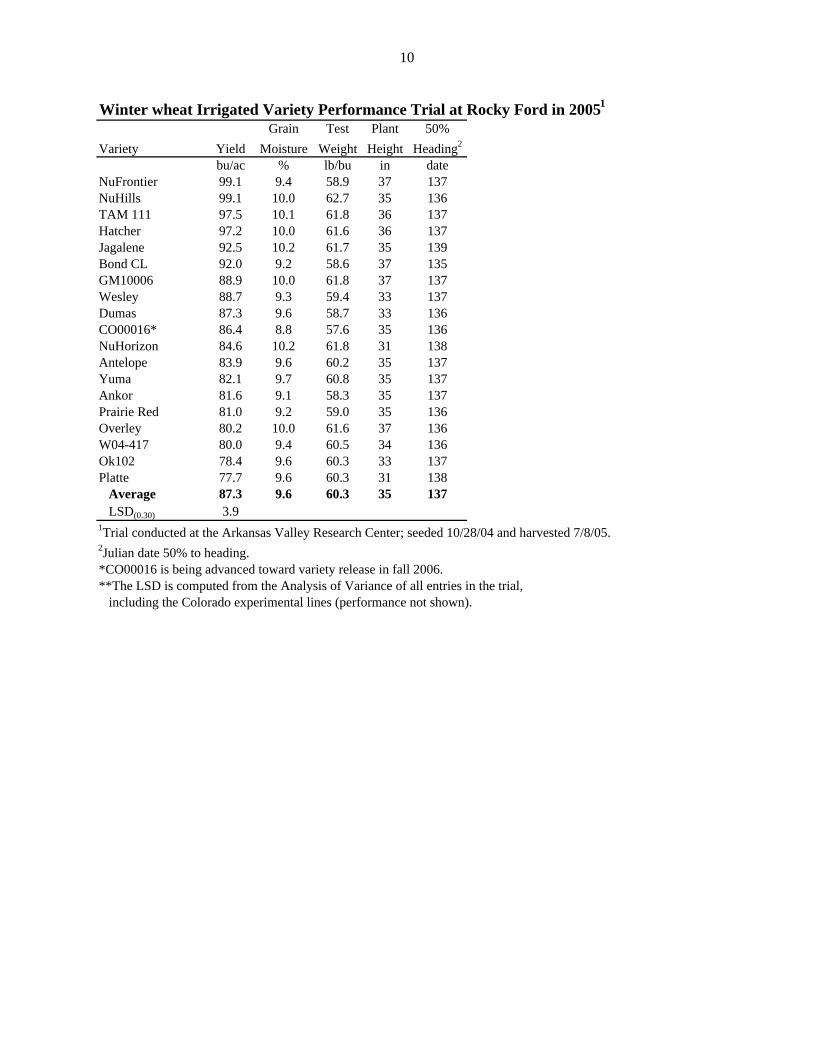
Winter wheat Irrigated Variety Performance Trial at Rocky Ford in 20051
Grain Test Plant 50%Variety Yield Moisture Weight Height Heading2
bu/ac % lb/bu in dateNuFrontier 99.1 9.4 58.9 37 137NuHills 99.1 10.0 62.7 35 136TAM 111 97.5 10.1 61.8 36 137Hatcher 97.2 10.0 61.6 36 137Jagalene 92.5 10.2 61.7 35 139Bond CL 92.0 9.2 58.6 37 135GM10006 88.9 10.0 61.8 37 137Wesley 88.7 9.3 59.4 33 137Dumas 87.3 9.6 58.7 33 136CO00016* 86.4 8.8 57.6 35 136NuHorizon 84.6 10.2 61.8 31 138Antelope 83.9 9.6 60.2 35 137Yuma 82.1 9.7 60.8 35 137Ankor 81.6 9.1 58.3 35 137Prairie Red 81.0 9.2 59.0 35 136Overley 80.2 10.0 61.6 37 136W04-417 80.0 9.4 60.5 34 136Ok102 78.4 9.6 60.3 33 137Platte 77.7 9.6 60.3 31 138 Average 87.3 9.6 60.3 35 137 LSD(0.30) 3.91Trial conducted at the Arkansas Valley Research Center; seeded 10/28/04 and harvested 7/8/05.2Julian date 50% to heading.*CO00016 is being advanced toward variety release in fall 2006.**The LSD is computed from the Analysis of Variance of all entries in the trial, including the Colorado experimental lines (performance not shown).
10

Colorado winter wheat 3-Yr and 2-Yr Irrigated Variety Performance Trial summary.
Variety1 3-Yr 2-Yr 2005 2004 2003 3-Yr 2-Yr
Jagalene 100.2 91.2 84.9 100.7 115.1 59.8 60.1Yuma 98.3 93.0 3 78.5 114.6 107.1 58.5 58.5Hatcher 97.0 94.5 2 89.7 101.6 101.4 59.2 59.6Ankor 93.3 92.7 4 81.8 108.9 94.3 57.7 58.0Antelope 92.6 87.3 78.5 100.6 101.5 58.4 58.2Wesley 91.8 82.6 71.9 98.6 107.1 57.7 57.1Prairie Red 91.7 81.7 64.4 107.6 108.5 56.9 56.8Ok102 91.1 88.1 76.1 106.1 96.2 58.9 59.5Dumas 90.4 84.4 73.4 101.0 100.3 58.8 59.0Platte 85.9 78.2 68.7 92.5 98.8 58.2 59.1Bond CL ** 99.0 1 89.8 112.9 ** ** 58.3NuHills ** 91.8 5 84.3 102.9 ** ** 59.2CO00016* ** 89.2 76.0 109.0 ** ** 57.6NuFrontier ** 88.2 79.0 101.9 ** ** 59.1Overley ** 87.1 76.8 102.7 ** ** 59.4NuHorizon ** 82.8 71.6 99.5 ** ** 59.61Varieties in table ranked based on 3-Yr average yields.1……5Varieties rank based on 2-Yr average yields.*CO00016 is being advanced toward variety release in fall 2006.**Bond CL, NuHills, CO00016, NuFrontier, Overley, and HuHorizon have been tested in the IVPT only two years.
Averages
-----------Yield (bu/ac)----------- Twt (lb/bu)
11

Dryland Wheat Strips for Forage and Grain Yield at Walsh, 2005 K. Larson, D. Thompson, D. Harn, and C. Thompson
PURPOSE: To determine which wheat varieties are best suited for forage and grain production in Southeastern Colorado. MATERIALS AND METHODS: Fifteen wheat varieties were planted on October 6, 2004 at 50 Lb Seed/A in 20 ft. by 800 ft. strips with two replications. We applied 50 Lb N/A with a sweep and seedrow applied 5 Gal/A of 10-34-0 (20 Lb P2O5, 6 Lb N/A). Ally 0.1 Oz/A and 2,4-D 0.38 Lb/A was sprayed for weed control. Two 2 ft. by 2.5 ft. forage samples were taken at jointing (March 28) and at boot (April 27). We measure the forage for fresh weight, oven-dried the samples, and recorded dry weight at 15% moisture content. There were serious infestations of both Russian Wheat Aphid and Stripe Rust. These infestations were not controlled in this study; however, the infestation levels were high enough that we applied an insecticide and a fungicide to the adjacent wheat seed fields to control these pests. We harvested the plots on June 29 with a self-propelled combine and weighed them in a digital weigh cart. Grain yields were adjusted to 12% seed moisture content. RESULTS: Heavy infestations of both Russian Wheat Aphid and Stripe Rust impacted yields of nonresistant varieties. TAM 111 produced the highest grain yield with 50 Bu/A; but its yield was not significantly higher than Hatcher, T 81, and Jagger. The top five grain producing varieties displayed high levels of resistance to Stripe Rust: TAM 111, Hatcher, T 81, Jagger, and Jagalene. Above and Jagalene produced the highest dry forage yield at jointing, averaging 2241 Lb/A, whereas Hatcher produce the most forage at boot, 5641 Lb/A. The two-year grain yield average for our study placed T 81 as the highest yielding variety, 116% of TAM 107 yield, mostly because of its outstanding yield obtain this year. Above and T 81 are the only varieties that had higher three-year grain yield averages than TAM 107. Above was the only wheat variety that for the last three years consistently produced higher yields than TAM 107. DISCUSSION: The best overall dual-purpose wheat variety was Hatcher, a new variety from CSU. It had the highest forage yield at boot, one of the highest forage yields at jointing, and the second highest grain yield. Conditions were nearly ideal for the early part of this past season, but at grain-filling Stripe Rust infestations were the worst we had ever encountered with some nonresistant varieties actually appearing overall orange. In the Wheat Strip study this year, we did not attempt to control RWA or Stripe Rust. Above in this unsprayed Wheat Strip study produced 36 Bu/A. In an adjacent seed wheat field of Above, where we controlled both RWA and Stripe Rust, we harvested 39 Bu/A, only 3 Bu/A more than from the unsprayed Above field. The cost of Stripe Rust control alone was about $20/A. There appears to be no economic advantage for controlling Stripe Rust under dryland conditions. If Stripe Rust continues to be as pervasive as it was this year, we readily recommend that growers select Stripe Rust resistant varieties.
12
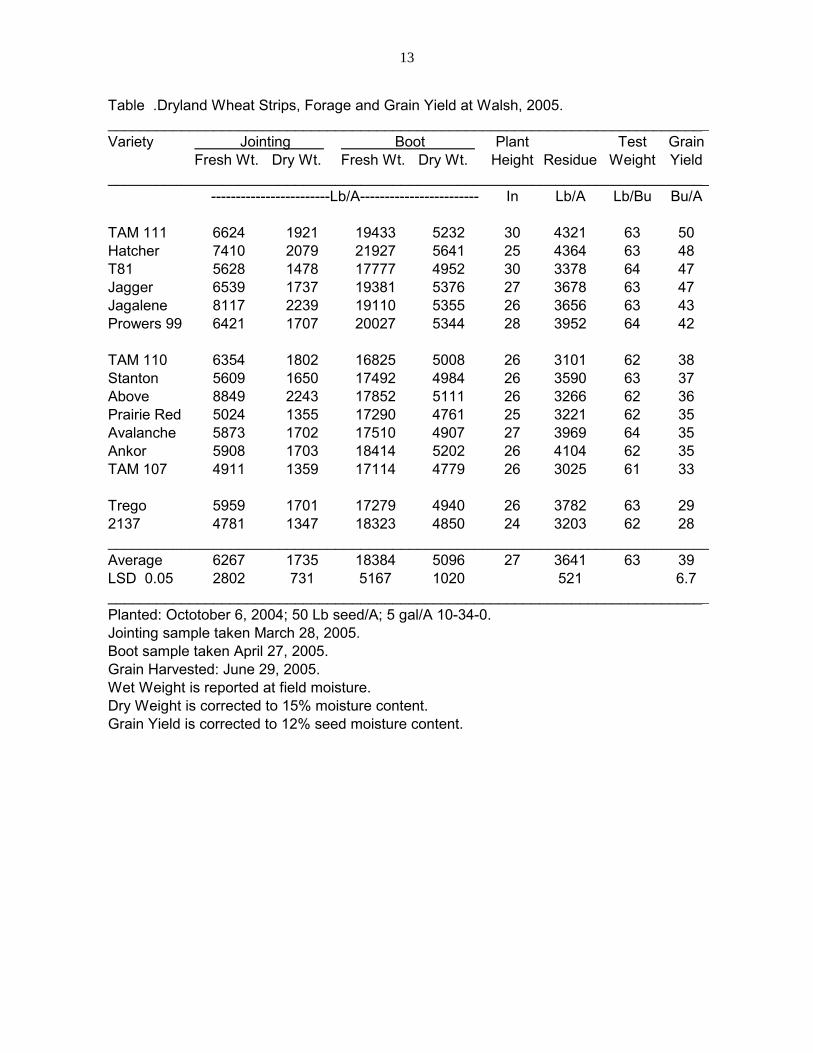
Table .Dryland Wheat Strips, Forage and Grain Yield at Walsh, 2005.__________________________________________________________________________Variety Jointing Boot Plant Test Grain
Fresh Wt. Dry Wt. Fresh Wt. Dry Wt. Height Residue Weight Yield__________________________________________________________________________
------------------------Lb/A------------------------ In Lb/A Lb/Bu Bu/A
TAM 111 6624 1921 19433 5232 30 4321 63 50Hatcher 7410 2079 21927 5641 25 4364 63 48T81 5628 1478 17777 4952 30 3378 64 47Jagger 6539 1737 19381 5376 27 3678 63 47Jagalene 8117 2239 19110 5355 26 3656 63 43Prowers 99 6421 1707 20027 5344 28 3952 64 42
TAM 110 6354 1802 16825 5008 26 3101 62 38Stanton 5609 1650 17492 4984 26 3590 63 37Above 8849 2243 17852 5111 26 3266 62 36Prairie Red 5024 1355 17290 4761 25 3221 62 35Avalanche 5873 1702 17510 4907 27 3969 64 35Ankor 5908 1703 18414 5202 26 4104 62 35TAM 107 4911 1359 17114 4779 26 3025 61 33
Trego 5959 1701 17279 4940 26 3782 63 292137 4781 1347 18323 4850 24 3203 62 28__________________________________________________________________________Average 6267 1735 18384 5096 27 3641 63 39LSD 0.05 2802 731 5167 1020 521 6.7__________________________________________________________________________Planted: Octotober 6, 2004; 50 Lb seed/A; 5 gal/A 10-34-0.Jointing sample taken March 28, 2005.Boot sample taken April 27, 2005.Grain Harvested: June 29, 2005.Wet Weight is reported at field moisture.Dry Weight is corrected to 15% moisture content.Grain Yield is corrected to 12% seed moisture content.
13
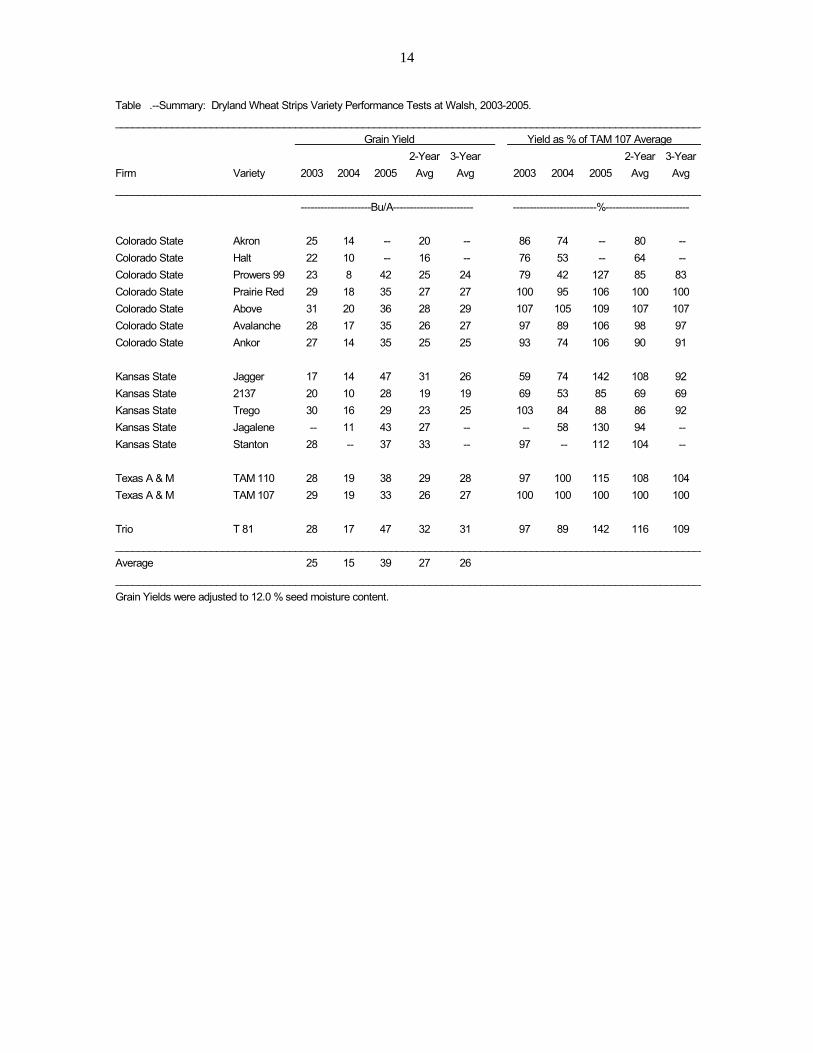
Table .--Summary: Dryland Wheat Strips Variety Performance Tests at Walsh, 2003-2005._________________________________________________________________________________________________________
Grain Yield Yield as % of TAM 107 Average 2-Year 3-Year 2-Year 3-Year
Firm Variety 2003 2004 2005 Avg Avg 2003 2004 2005 Avg Avg_________________________________________________________________________________________________________
---------------------Bu/A------------------------ -------------------------%-------------------------
Colorado State Akron 25 14 -- 20 -- 86 74 -- 80 --Colorado State Halt 22 10 -- 16 -- 76 53 -- 64 --Colorado State Prowers 99 23 8 42 25 24 79 42 127 85 83Colorado State Prairie Red 29 18 35 27 27 100 95 106 100 100Colorado State Above 31 20 36 28 29 107 105 109 107 107Colorado State Avalanche 28 17 35 26 27 97 89 106 98 97Colorado State Ankor 27 14 35 25 25 93 74 106 90 91
Kansas State Jagger 17 14 47 31 26 59 74 142 108 92Kansas State 2137 20 10 28 19 19 69 53 85 69 69Kansas State Trego 30 16 29 23 25 103 84 88 86 92Kansas State Jagalene -- 11 43 27 -- -- 58 130 94 --Kansas State Stanton 28 -- 37 33 -- 97 -- 112 104 --
Texas A & M TAM 110 28 19 38 29 28 97 100 115 108 104Texas A & M TAM 107 29 19 33 26 27 100 100 100 100 100
Trio T 81 28 17 47 32 31 97 89 142 116 109_________________________________________________________________________________________________________Average 25 15 39 27 26_________________________________________________________________________________________________________Grain Yields were adjusted to 12.0 % seed moisture content.
14
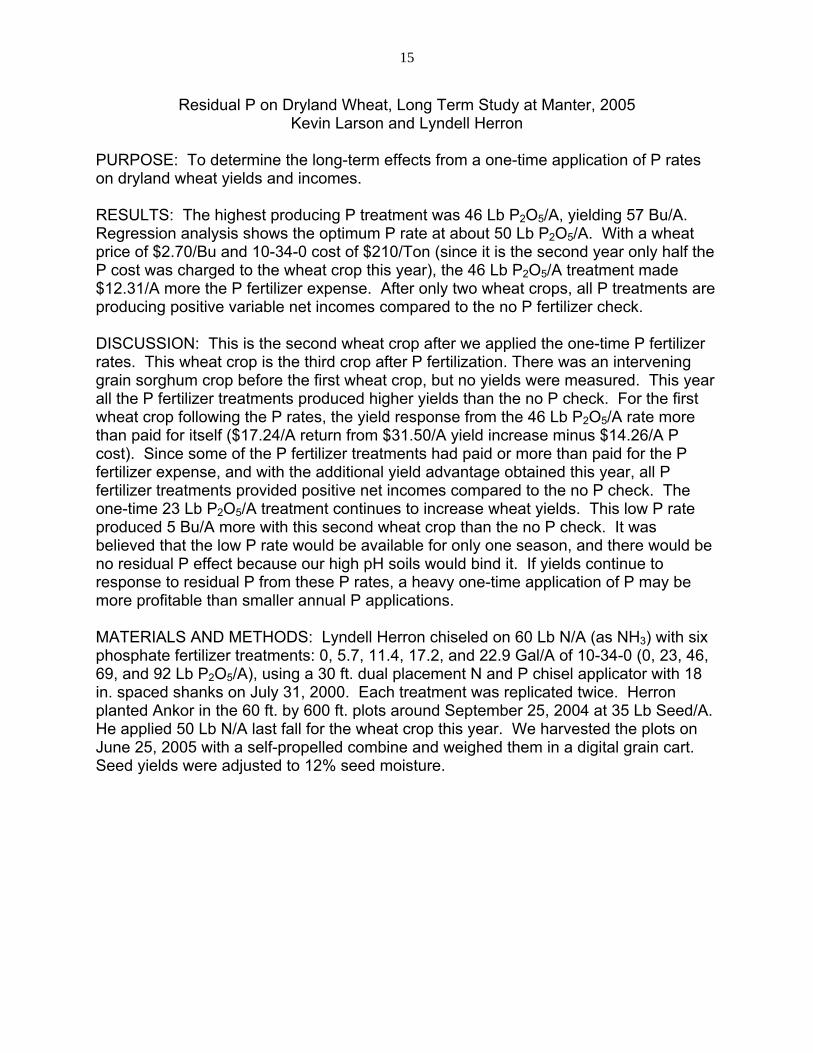
Residual P on Dryland Wheat, Long Term Study at Manter, 2005 Kevin Larson and Lyndell Herron
PURPOSE: To determine the long-term effects from a one-time application of P rates on dryland wheat yields and incomes. RESULTS: The highest producing P treatment was 46 Lb P2O5/A, yielding 57 Bu/A. Regression analysis shows the optimum P rate at about 50 Lb P2O5/A. With a wheat price of $2.70/Bu and 10-34-0 cost of $210/Ton (since it is the second year only half the P cost was charged to the wheat crop this year), the 46 Lb P2O5/A treatment made $12.31/A more the P fertilizer expense. After only two wheat crops, all P treatments are producing positive variable net incomes compared to the no P fertilizer check. DISCUSSION: This is the second wheat crop after we applied the one-time P fertilizer rates. This wheat crop is the third crop after P fertilization. There was an intervening grain sorghum crop before the first wheat crop, but no yields were measured. This year all the P fertilizer treatments produced higher yields than the no P check. For the first wheat crop following the P rates, the yield response from the 46 Lb P2O5/A rate more than paid for itself ($17.24/A return from $31.50/A yield increase minus $14.26/A P cost). Since some of the P fertilizer treatments had paid or more than paid for the P fertilizer expense, and with the additional yield advantage obtained this year, all P fertilizer treatments provided positive net incomes compared to the no P check. The one-time 23 Lb P2O5/A treatment continues to increase wheat yields. This low P rate produced 5 Bu/A more with this second wheat crop than the no P check. It was believed that the low P rate would be available for only one season, and there would be no residual P effect because our high pH soils would bind it. If yields continue to response to residual P from these P rates, a heavy one-time application of P may be more profitable than smaller annual P applications. MATERIALS AND METHODS: Lyndell Herron chiseled on 60 Lb N/A (as NH3) with six phosphate fertilizer treatments: 0, 5.7, 11.4, 17.2, and 22.9 Gal/A of 10-34-0 (0, 23, 46, 69, and 92 Lb P2O5/A), using a 30 ft. dual placement N and P chisel applicator with 18 in. spaced shanks on July 31, 2000. Each treatment was replicated twice. Herron planted Ankor in the 60 ft. by 600 ft. plots around September 25, 2004 at 35 Lb Seed/A. He applied 50 Lb N/A last fall for the wheat crop this year. We harvested the plots on June 25, 2005 with a self-propelled combine and weighed them in a digital grain cart. Seed yields were adjusted to 12% seed moisture.
15

Residual P Effect on Dryland Wheat YieldSecond Wheat Harvest after P Application
Manter, KS 2005
y = -0.27x2 + 2.67x + 50.21R2 = 0.918 (.10)
46
48
50
52
54
56
58
0 23 46 69 92P2O5 Rate, Lb P2O5/A
Grain Yield(Bu/A)
Fig. . Yield of long term P on dryland wheat, second wheat crop after P application, at Manter.
P treatment are 0,23, 46, 69, 92, and 115 Lb P2O5/A applied with a chisel with shanks 18 in. apart to a 6 in. depth on July 31, 2000. Grain yields were adjusted to 12% seed moisture content.
16

Residual P on Dryland Wheat, Manter KSNet Return from One Time P Application, 2003 and 2005
-15
-10
-5
0
5
10
15
20
25
30
35
0 23 46 69 92
P Rate (Lb P2O5/A)
Net Return ($/A)
Total Return
2003 Return
Fig. . Net return of long term P on dryland wheat, second wheat crop after P application, at
Manter. P treatment are 0,23, 46, 69, and 92 Lb P2O5/A applied with a chisel with shanks 18 in. apart to a 6 in. depth on July 31, 2000. Total return is sum from 2003 and 2005 wheat crops.
17
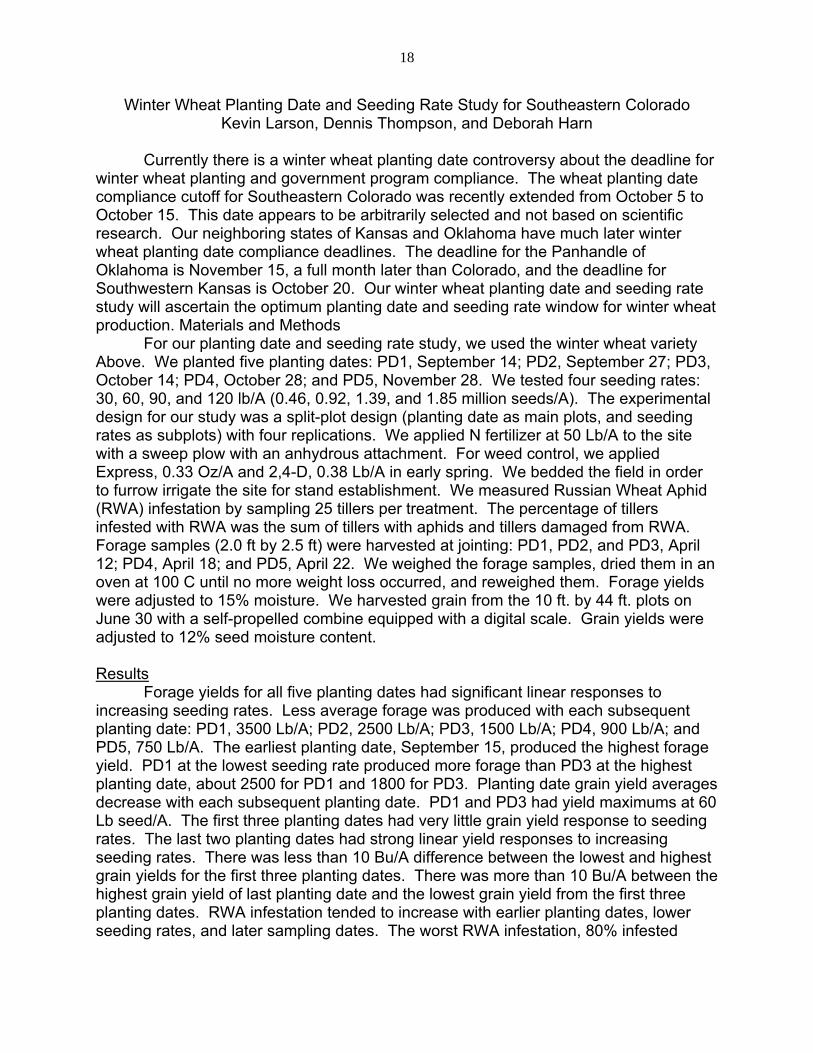
Winter Wheat Planting Date and Seeding Rate Study for Southeastern Colorado Kevin Larson, Dennis Thompson, and Deborah Harn
Currently there is a winter wheat planting date controversy about the deadline for
winter wheat planting and government program compliance. The wheat planting date compliance cutoff for Southeastern Colorado was recently extended from October 5 to October 15. This date appears to be arbitrarily selected and not based on scientific research. Our neighboring states of Kansas and Oklahoma have much later winter wheat planting date compliance deadlines. The deadline for the Panhandle of Oklahoma is November 15, a full month later than Colorado, and the deadline for Southwestern Kansas is October 20. Our winter wheat planting date and seeding rate study will ascertain the optimum planting date and seeding rate window for winter wheat production. Materials and Methods
For our planting date and seeding rate study, we used the winter wheat variety Above. We planted five planting dates: PD1, September 14; PD2, September 27; PD3, October 14; PD4, October 28; and PD5, November 28. We tested four seeding rates: 30, 60, 90, and 120 lb/A (0.46, 0.92, 1.39, and 1.85 million seeds/A). The experimental design for our study was a split-plot design (planting date as main plots, and seeding rates as subplots) with four replications. We applied N fertilizer at 50 Lb/A to the site with a sweep plow with an anhydrous attachment. For weed control, we applied Express, 0.33 Oz/A and 2,4-D, 0.38 Lb/A in early spring. We bedded the field in order to furrow irrigate the site for stand establishment. We measured Russian Wheat Aphid (RWA) infestation by sampling 25 tillers per treatment. The percentage of tillers infested with RWA was the sum of tillers with aphids and tillers damaged from RWA. Forage samples (2.0 ft by 2.5 ft) were harvested at jointing: PD1, PD2, and PD3, April 12; PD4, April 18; and PD5, April 22. We weighed the forage samples, dried them in an oven at 100 C until no more weight loss occurred, and reweighed them. Forage yields were adjusted to 15% moisture. We harvested grain from the 10 ft. by 44 ft. plots on June 30 with a self-propelled combine equipped with a digital scale. Grain yields were adjusted to 12% seed moisture content. Results Forage yields for all five planting dates had significant linear responses to increasing seeding rates. Less average forage was produced with each subsequent planting date: PD1, 3500 Lb/A; PD2, 2500 Lb/A; PD3, 1500 Lb/A; PD4, 900 Lb/A; and PD5, 750 Lb/A. The earliest planting date, September 15, produced the highest forage yield. PD1 at the lowest seeding rate produced more forage than PD3 at the highest planting date, about 2500 for PD1 and 1800 for PD3. Planting date grain yield averages decrease with each subsequent planting date. PD1 and PD3 had yield maximums at 60 Lb seed/A. The first three planting dates had very little grain yield response to seeding rates. The last two planting dates had strong linear yield responses to increasing seeding rates. There was less than 10 Bu/A difference between the lowest and highest grain yields for the first three planting dates. There was more than 10 Bu/A between the highest grain yield of last planting date and the lowest grain yield from the first three planting dates. RWA infestation tended to increase with earlier planting dates, lower seeding rates, and later sampling dates. The worst RWA infestation, 80% infested
18
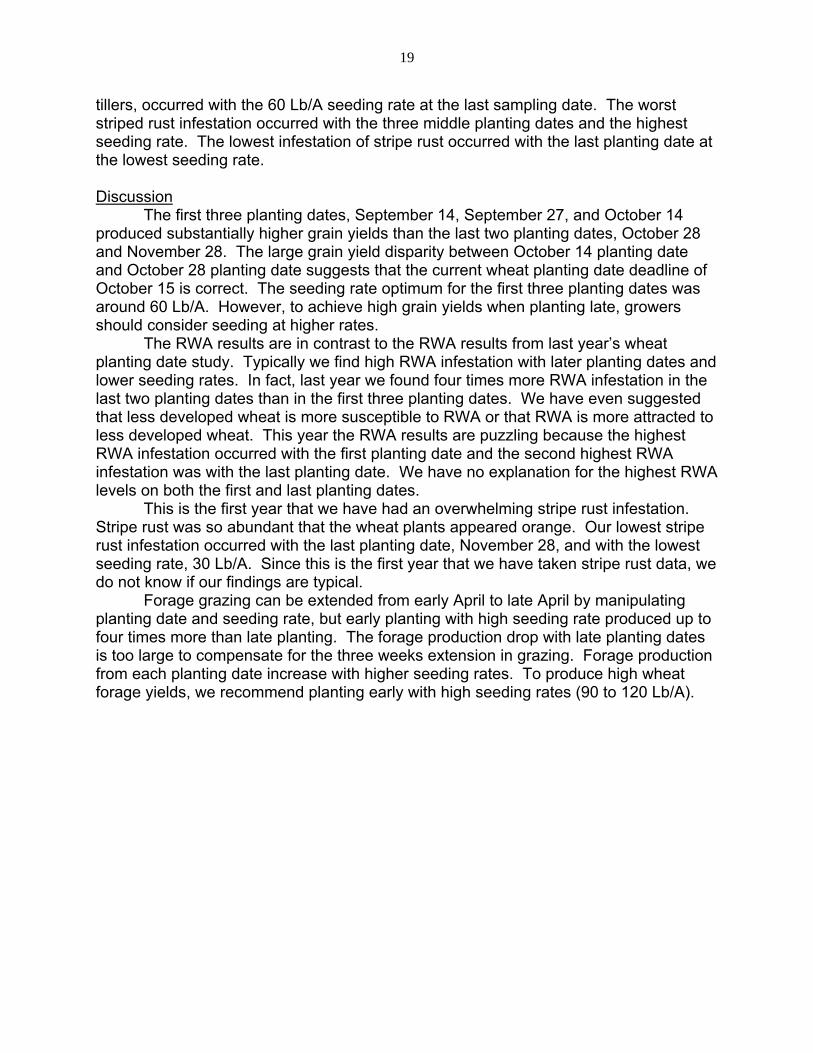
tillers, occurred with the 60 Lb/A seeding rate at the last sampling date. The worst striped rust infestation occurred with the three middle planting dates and the highest seeding rate. The lowest infestation of stripe rust occurred with the last planting date at the lowest seeding rate. Discussion
The first three planting dates, September 14, September 27, and October 14 produced substantially higher grain yields than the last two planting dates, October 28 and November 28. The large grain yield disparity between October 14 planting date and October 28 planting date suggests that the current wheat planting date deadline of October 15 is correct. The seeding rate optimum for the first three planting dates was around 60 Lb/A. However, to achieve high grain yields when planting late, growers should consider seeding at higher rates.
The RWA results are in contrast to the RWA results from last year’s wheat planting date study. Typically we find high RWA infestation with later planting dates and lower seeding rates. In fact, last year we found four times more RWA infestation in the last two planting dates than in the first three planting dates. We have even suggested that less developed wheat is more susceptible to RWA or that RWA is more attracted to less developed wheat. This year the RWA results are puzzling because the highest RWA infestation occurred with the first planting date and the second highest RWA infestation was with the last planting date. We have no explanation for the highest RWA levels on both the first and last planting dates.
This is the first year that we have had an overwhelming stripe rust infestation. Stripe rust was so abundant that the wheat plants appeared orange. Our lowest stripe rust infestation occurred with the last planting date, November 28, and with the lowest seeding rate, 30 Lb/A. Since this is the first year that we have taken stripe rust data, we do not know if our findings are typical.
Forage grazing can be extended from early April to late April by manipulating planting date and seeding rate, but early planting with high seeding rate produced up to four times more than late planting. The forage production drop with late planting dates is too large to compensate for the three weeks extension in grazing. Forage production from each planting date increase with higher seeding rates. To produce high wheat forage yields, we recommend planting early with high seeding rates (90 to 120 Lb/A).
19

Wheat Planting Date and Seeding RatesWalsh, 2005
PD 1y = -0.0006x2 + 0.122x + 35.7R2 = 0.998*
y = -0.0008x2 + 0.127x + 38.8R2 = 0.712PD 2
PD 3y = -0.0009x2 +0.137x + 33.2R2 = 0.981
PD 4y = 0.073x + 23.7R2 = 0.716 PD 5
y = 0.078x + 16.3R2 = 0.910*
15
20
25
30
35
40
45
50
30 60 90 120Seeding Rate (Lb/A)
Grain Yield(Bu/A @ 12%)
PD 2PD 1
PD 3
PD 4
PD 5
Fig. Grain yield from planting dates and seeding rates for dryland wheat at Walsh. Planting
dates were PD 1, September 14; PD 2, September 27; PD 3, October 14; PD 4, October 28; and PD 5, November 28, 2004. Seeding rates were 30, 60, 90, and 120 Lb/A, corresponding to 465,000, 931,000, 1,396,000, and 1,862,000 seeds/A.
20

Dryland Wheat Planting Date and Seeding RateWalsh, 2005
y = 17.1x + 2036R2 = 0.979*PD 1
y = 16.7x + 1181R2 = 0.980*PD 2
y = 9.5x + 701R2 = 0.896PD 3
y = 10.2x + 255R2 = 0.979*PD 4
y = 7.1x + 264R2 = 0.942*PD 5
0
500
1000
1500
2000
2500
3000
3500
4000
4500
30 60 90 120Seeding Rate (Lb/A)
Forage Yield (Lb/A @ 15%
MC)
PD 1
PD 2
PD 3
PD 4
PD 5
Fig. Forage yields at jointing from planting dates and seeding rates for dryland wheat at
Walsh. Planting dates were PD 1, September 14; PD 2, September 27; PD 3, October 14; PD 4, October 28; and PD 5, November 28, 2004. Seeding rates were 30, 60, 90, and 120 Lb/A, corresponding to 465,000, 931,000, 1,396,000, and 1,862,000 seeds/A. Jointing dates: PD 1, March 28; PD 2, April 3; PD 3, April 10; PD 4, April 14; and PD 5, April 22.
21
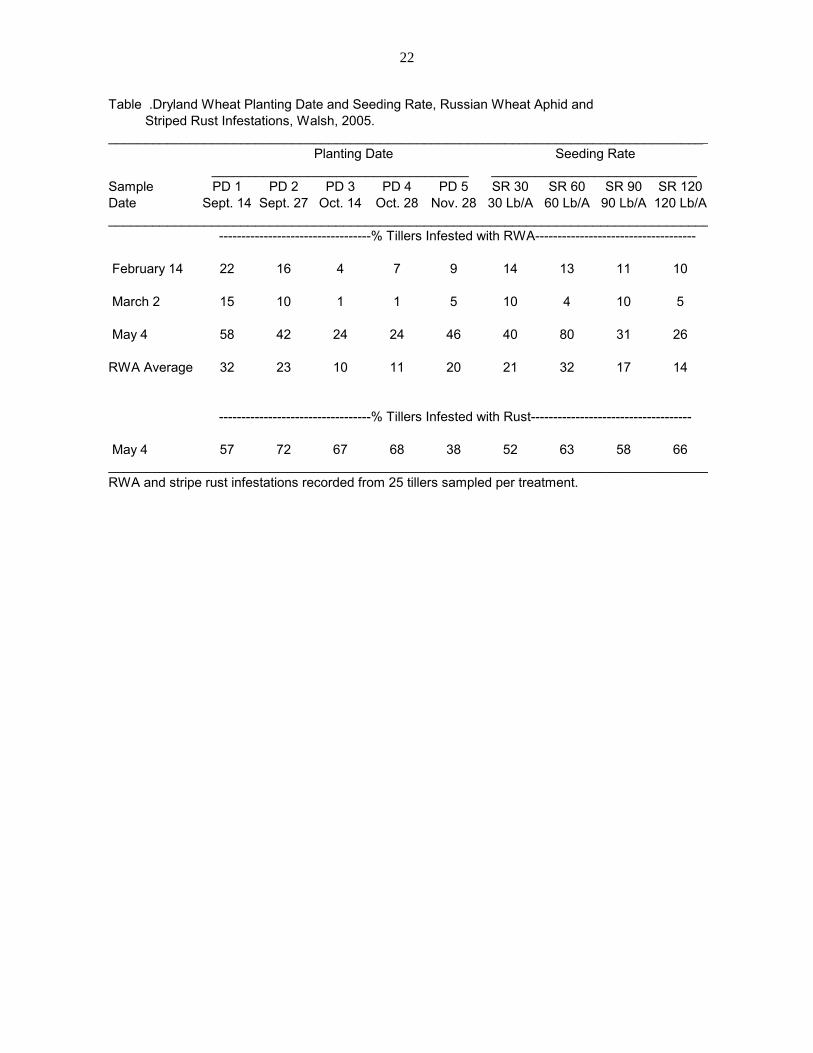
Table .Dryland Wheat Planting Date and Seeding Rate, Russian Wheat Aphid and Striped Rust Infestations, Walsh, 2005.__________________________________________________________________________________
Planting Date Seeding Rate ___________________________________ ____________________________
Sample PD 1 PD 2 PD 3 PD 4 PD 5 SR 30 SR 60 SR 90 SR 120Date Sept. 14 Sept. 27 Oct. 14 Oct. 28 Nov. 28 30 Lb/A 60 Lb/A 90 Lb/A 120 Lb/A__________________________________________________________________________________
----------------------------------% Tillers Infested with RWA------------------------------------
February 14 22 16 4 7 9 14 13 11 10
March 2 15 10 1 1 5 10 4 10 5
May 4 58 42 24 24 46 40 80 31 26
RWA Average 32 23 10 11 20 21 32 17 14
----------------------------------% Tillers Infested with Rust------------------------------------
May 4 57 72 67 68 38 52 63 58 66__________________________________________________________________________________RWA and stripe rust infestations recorded from 25 tillers sampled per treatment.
22

Irrigated Dual Purpose Wheat Planting Dates, Seeding Rates, Varieties in Southeastern Colorado, 2002 to 2004
Kevin Larson1, Eugene Krenzer, and Rick Kochenower
Dual-purpose wheats, wheats utilized for both livestock forage grazing and grain yield, are frequently grown throughout the Southern High Plains. Typically in Colorado, dual purpose wheats are raised primarily for grain and secondarily for livestock forage. Although conditions for both forage removal and grain harvest do not occur each year, livestock grazing is an added benefit and income for wheat producers during high wheat forage production years. We conducted this study to determine the effects of seeding rates, planting dates, and varieties on irrigated winter wheat forage and grain production. Materials and Methods:
We conducted this study at the Plainsman Research Center near Walsh, Colorado for three years: 2001-02, 2002-03 and 2003-04. We planted four winter wheat varieties, Custer, Intrada, Jagger, and TAM 107, at three seeding rates, 60, 120, and 180 lb/A, with an early planting date (August 24, 2001, September 4, 2002, and September 9, 2003) one treatment set for both forage and grain, and with a late planting date treatment (September 24, 2001, October 1, 2002 and September 29, 2003) one treatment set for both forage and grain and another treatment set for grain only. We planted the 5 ft. X 22 ft. plots using a four-row, 12 in. spacing drill in a randomized complete block design with four replications. We fertilized the site with 75 lb N/A as NH3 applied with a sweep plow. We hand-harvested forage samples, one meter of row from each plot end, and dried them in an oven for at least two days for forage dry weight yields. The forage plots were mowed with a finishing mower to simulate livestock grazing. To compensate for N forage removal, we surface applied liquid N from 65 to 85 lb N/A to the first planting date treatments and 19 to 25 lb N/A to the second planting date treatments. For weed control, we applied Express 0.33 oz/A and 2,4-D 0.38 lb/A in the spring. We furrow irrigated the site with about 7 to 12 A-in./A of total applied water. We harvested the plots for grain with a self-propelled combine and weighed them in a digital scale. Grain yields were adjusted to 12% moisture content. Results:
Forage yields were not significantly different between varieties and their means were pooled for forage yield analysis. For all three years of this study, the 180 lb/A seeding rate produced significantly higher forage yield than the 60 lb/A seeding for both early and late planting dates (Fig. 1). In 2002 and 2004 there were no significant forage yield differences between 180 and 120 lb/A seeding rates for both planting dates; moreover, these two seeding rates produced significantly more forage than the 60 lb/A rate (Table 1). In 2003 the 180 lb/A seeding rate produced significantly more forage than the 120 lb/A seeding rate for both planting dates. There was a significant forage yield difference between the 120 lb/A seeding rate and the 60 lb/A seeding rate for the late planting date, but not the early planting date for 2003.
23

������������������������������������������������������������������������������������������������������������
��������������������������������������������������������������������������������������������������������������������������������������������������������
������������������������������������������������������������������������������������������������������������������������������������������������������������������������������������
������������������������������������������������������������������������������������������������������������������������������������������������������������������������������������������������������������������������������������������������������������������������������������������������������������������������������������������������������������������������������������������������������������������������������������������������������������������������������������������������������������������������������������������������������������
������������������������������������������������������������������������������������������������������������������������������������������������������������������������������������������������������������������������������������������������������������������������������������������������������������������������������������������������������������������������������������������������������������������������������������������������������������������������������������������������������������������������������������������������������������������������������������������������������������������
������������������������������������������������������������������������������������������������������������������������������������������������������������������������������������������������������������������������������������������������������������������������������������������������������������������������������������������������������������������������������������������������������������������������������������������������������������������������������������������������������������������������������������������������������������������������������������������������������������������������������������������������������������������������
(Fig. 1) Irrigated Dual Purpose WheatForage Yield, Walsh 2002-2004
0
500
1000
1500
2000
2500
60 120 180Seeding Rate (lb/A)
Forage Yield (lb/A Dry Wt.)
���������������
LSD 0.05
Fig. 1. Forage yield from irrigated dual purpose wheat at Walsh, 2002 to 2004. The average for the early date of planting was September 2 and the average for the late date of planting was September 28. The seeding rates were 60, 120, and 180 lb/A.
Late PD (Sept. 28)Early PD (Sept. 2)
24

Table 1.-Irrigated Dual Purpose Wheat Forage Yields at Walsh, 2002-04.__________________________________________________________
Forage Yield Planting Date Seeding _________________ Rate
Seeding Rate Early Late Average__________________________________________________________
----------------------lb/A----------------------
---Year 2002--- Aug 24 Sept 24
60 lb/acre 2410 470 960120 lb/acre 2930 650 1193180 lb/acre 3070 800 1290
Average 2002 2800 640 1148LSD 0.05 175 152
---Year 2003---Sept 4 Oct 1
60 lb/acre 1769 193 654120 lb/acre 1699 342 680180 lb/acre 2094 512 869
Average 2003 1854 349 734LSD 0.05 341 143
---Year 2004---Seeding Rate Sept. 9 Sept. 29
60 lb/acre 1616 256 936120 lb/acre 1885 448 1167180 lb/acre 1830 477 1154
Average 2004 1777 394 1085LSD 0.05 183 113__________________________________________________________Forage yields are pooled means of varieties.Forage yields are dry weights.
25

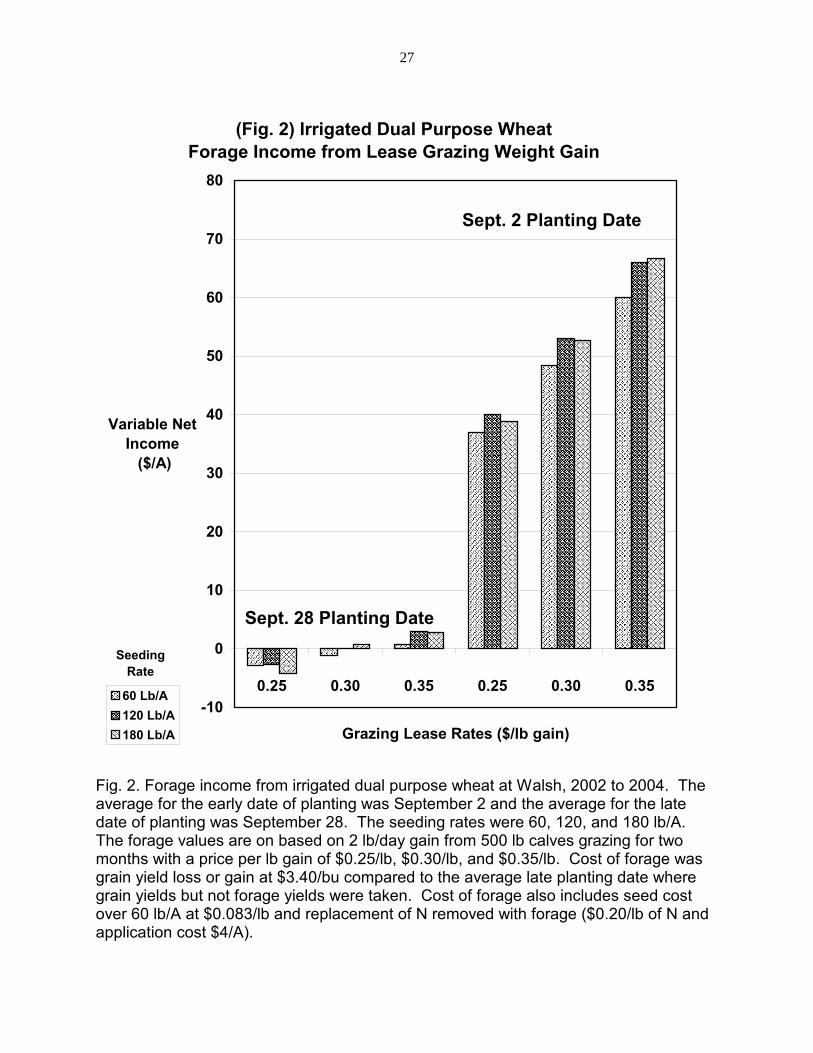
Forage variable net income for the early planting date for all three years (September 2 average) provided from $36.96 to $66.61/A more than the grain only late planting date (September 28 average) (Fig. 2). Income derived from seeding rate was dependent on grazing lease rate. At the $0.25/lb gain lease rate, the 120 lb/A seeding rate produced the highest variable net income. The incomes for the 120 lb/A and 180 lb/A seeding rates were the same at the $0.30/lb lease rate. At the $0.35/b lease rate, the 180 lb/A seeding rate produced slightly more income than the 120 lb/A seeding rate. Variable net income was negative for the late planting date when using $0.25/lb gain grazing lease rate, but slightly positive when using $0.35/lb gain grazing lease rate for all seeding rates compared to grain only late planting date. These variable net incomes include grain yield loss or gain at $3.40/bu compared to grain only late planting date yield, seed cost over 60 lb/A at $0.083/lb and replacement of N removed with forage at $0.20/lb of N and $4/A fertilizer application cost.
For two of three years, there were no significant grain yield differences between seeding rates, therefore grain yields for the seeding rates were pooled for grain yield analysis. For individual years, grain yield differences for the early planting date varied from 8 bu/A less to 3 bu/A more than grain only late planting date (Table 2). Overall, the late planting date with forage removal ranged from 4 bu/A less to 2 bu/A more than the grain only late planting date. For the three years of this study, the early planting date averaged 1 bu/A more than the grain only late planting date, and the late planting date with forage removal yielded 1 bu/A less than the grain only late planting date.
TAM 107 produced significantly more grain yield than Intrada and Jagger for all three years of this study (Table 2). Hailstorms in 2003 and 2004 greatly reduced grain yields for these years. In 2004, grain yields of TAM 107 were significantly higher than Jagger, Custer, and Intrada for both planting date treatments. In 2003, grain yields of TAM 107 and Custer were significantly higher than Jagger and Intrada for both planting dates. The higher grain yields for TAM 107 were due to less seed shattering from hail compared to Jagger, Custer, and Intrada. In 2002 of the four wheat varieties tested, TAM 107 and Custer produced significantly higher grain yield than either Intrada or Jagger. Jagger had higher plant loss from freeze damage (winter-kill) than any of the other varieties tested (data not shown). Winterkill of Jagger was more evident in the early planting date than in the late planting date. Winter damage to the early planting date caused Jagger to produce significantly less grain than TAM 107, Custer, and Intrada. Discussion:
Overall, forage yield increased with increasing seeding rates with the 180 lb/A rate producing the highest yield for both early and late planting dates. A study conducted from 2000 to 2002 at the Panhandle Research and Extension Center at Goodwell, Oklahoma (Krenzer et. al, 2003) also reported forage yields increasing with 60, 120, and 180 lb/A seeding rates.
There were no significant forage yield differences between the varieties for both planting date treatments for all three years of this study. The wheat varieties tested: TAM 107, Intrada, Custer and Jagger, produced similar amounts of forage. The study conducted at Goodwell, Oklahoma (Krenzer, et. al, 2003) found minor three-year average differences between the wheat varieties with TAM 107 and Intrada producing
26
����������������
��������������
�������
���������������������������������������������������������������������������������������������������������
�������������������������������������������������������������������������������������������������������������������������������������
�������������������������������������������������������������������������������������������������������������������������������������������������������������������������������������������������������
��������������
����������������
��������������������������������������������������������������������������������������������������������������������������������
���������������������������������������������������������������������������������������������������������������������������������������������������
���������������������������������������������������������������������������������������������������������������������������������������������������������������������������������������������
��������������
���������������������
����������������������������������������������������������������������������������������������������������������
������������������������������������������������������������������������������������������������������������������������������������������������������������������������
����������������������������������������������������������������������������������������������������������������������������������������������������������������������������������������������������������������
(Fig. 2) Irrigated Dual Purpose WheatForage Income from Lease Grazing Weight Gain
-10
0
10
20
30
40
50
60
70
80
0.25 0.30 0.35 0.25 0.30 0.35
Grazing Lease Rates ($/lb gain)
Variable Net Income ($/A)
��������������������
Seeding Rate
Sept. 28 Planting Date
Sept. 2 Planting Date
Fig. 2. Forage income from irrigated dual purpose wheat at Walsh, 2002 to 2004. The average for the early date of planting was September 2 and the average for the late date of planting was September 28. The seeding rates were 60, 120, and 180 lb/A. The forage values are on based on 2 lb/day gain from 500 lb calves grazing for two months with a price per lb gain of $0.25/lb, $0.30/lb, and $0.35/lb. Cost of forage was grain yield loss or gain at $3.40/bu compared to the average late planting date where grain yields but not forage yields were taken. Cost of forage also includes seed cost over 60 lb/A at $0.083/lb and replacement of N removed with forage ($0.20/lb of N and application cost $4/A).
60 Lb/A120 Lb/A180 Lb/A
27

Table 2.-Irrigated Dual Purpose Wheat Grain Yields at Walsh, 2002-04._________________________________________________________
Grain Yield ------------Planting Date----------- Varietal
Variety Early Late Late Average(grain only)
_________________________________________________________ ------------------------bu/A--------------------------
---Year 2002--- Aug 24 Sept 24 Sept 24
TAM 107 36 43 43 41Custer 34 42 41 39Intrada 31 39 36 35Jagger 25 39 37 34
Average 2002 31 41 39 37LSD 0.05 5 5 5
---Year 2003---Variety Sept 4 Oct 1 Oct 1
TAM 107 38 32 33 34Custer 32 32 35 33Intrada 18 19 19 19Jagger 22 18 18 19
Average 2003 28 25 26 26LSD 0.05 7 4 5
---Year 2004---Variety Sept 9 Sept 29 Sept 29
TAM 107 31 21 29 27Custer 19 15 16 17Jagger 21 13 18 17Intrada 18 12 15 15
Average 2004 22 15 19 19LSD 0.05 5 2 3_________________________________________________________Grain yields are pooled means of seeding rates.Grain yields are adjusted to 12% seed moisture content.
28
higher forage yields than Custer and Jagger, but there was no mention if these forage yield differences were significant.
The method we used to assign value for the forage was wheat forage leasing based on livestock weight gain. We consulted with David Schutz, Manager of the Eastern Colorado Research Center, who suggested using 2 lb per calf per day gain with a 3% body weight intake per day for dry wheat forage. He also stated that the standard weight gain price ranged from $0.25 to $0.35/lb. We made these assumptions for our lease grazing; we started with 500 lb calves and they grazed for two months. On average, the calves weighed 560 lb and ingested 3% of their body weight (16.8 lb/day) and they gain 2 lb/day. Our assumptions were similar to the results from a steer grazing management study reported by Oklahoma State University researchers (Horn et. al, 1999). They reported turning out 556 to 649 lb steers on winter wheat for 63 to 90 day grazing periods and the steers gained 2.1 to 2.2 lb/day while ingesting 15.2 to 16.4 lb/day of forage for their intensity early stocking (IES) grazing treatments.
For all years of this study, forage income using the lease grazing weight gain method had positive incomes for all the early planting date treatments and negative incomes for 2003 and 2004 early planting date treatments, regardless of the grazing lease ($/lb gain) rate. Income from seeding rate was dependent on grazing lease rate with 120 lb/A and 180 lb/A seeding rates providing more variable net income than the 60 lb/A seeding rate for all grazing lease rates. At the lowest lease rate ($0.25/lb gain) the 120 lb/A seeding rate produced the highest variable net income, whereas at the highest lease rate ($0.35/lb gain) the 180 lb/A seeding rate produced the highest variable net income. For the range of grazing lease rates used, there were only minor variable net income differences (around $1/A) between the 120 lb/A and 180 lb/A seeding rates. The only income advantage for the 180 lb/A seeding rate was at the highest lease rate; therefore, the 120 lb/A seeding rate was sufficient for achieving high income. Since the late planting date treatment averaged only marginal amounts of forage and provided only minimal variable net income, we found that there was insufficient forage to make grazing economically feasible especially for grazing lease rates below $0.30/lb gain. Fortunately growers would not have experienced income loss from grazing the forage produced by the late planting date because growers would not have attempted to graze the limited amount of forage produced by the late planting date. The forage income for the average early planting date treatment ranged from $36.96/A to $66.61/A more than the grain only late planting date. This extra income from forage makes lease grazing of early-planted, dual-purpose wheat a profitable activity.
For the duration of this study, there was only limited grain yield change due to forage removal, ranging from 8 bu/A less to 3 bu/A more than the grain only planting date. The average change in grain yield was plus or minus 1 bu/A difference between the grain only late planting date and the late and early planting dates with both forage and grain harvests. Therefore, forage income was not dependent on grain yield change due to forage removal. This is in contrast to the report by Oklahoma researchers (Hossain, Epplin, and Krenzer, 2003); they found late planted wheat (September 30) produced 18% more grain and 68% less forage than early planted wheat (September 10). They concluded that planting date for dual purpose wheat grazing was dependent on expected forage and grain prices.
29

Grain yields were low all three years of this study due to winterkill and hail damage. TAM 107 with its tolerance to hail and winter damage produced higher yields than Intrada and Jagger each year of this study. Under the adverse conditions of this study, TAM 107 produced the highest grain yields, and since there was no varietal difference in forage production, TAM 107 was the top ranking dual purpose wheat tested.
Grain yield can be greatly reduced by environmental stresses such as the ones encountered throughout this study. Even though grain yields were low, the early planting date forage yields remain high and profitable. Grazing wheat provides additional income not realized by solely harvesting wheat for grain. We believe that growing wheat for both forage and grain is a viable economic strategy to increase income and reduce risk of wheat harvested for grain alone. References: Horn, G.W., E.G. Krenzer, F.M. Epplin, and J. Kountz. 1999. Effect of planting date and grazing management on productivity of dual-purpose winter wheat. 1999 Animal Science Research Report, Dept. of Animal Science, Oklahoma State University, Stillwater, Oklahoma. Accessed: February 2005. http://www.ansi.okstate.edu/research/1999rr/41.htm. Hossain, I., F.M. Epplin, and E.G. Krenzer. 2003. Planting date influence on dual purpose winter wheat forage yield, grain yield, and test weight. Agron. J. 95:1179-1188. Krenzer, E.G., R. Kochenower, R. Austin, and K. Bellinghausen. 2003. Planting date and seeding rate effect on forage production at Goodwell under irrigation. Panhandle Research and Extension Center, Dept. of Plant and Soil Sciences, Div. of Ag. Sciences and Natural Resources, Oklahoma State University, Stillwater, Oklahoma. Accessed: February 2005. http://pss.okstate.edu/wheat/varietytrials/pt-03-2/pdsr.html. Kevin Larson, Research Scientist, Plainsman Research Center, Colorado State University Eugene Krenzer, Professor (Ret.), Dept. of Plant and Soil Sciences, Oklahoma State University Rick Kochenower, Area Research Agronomist and Extension Specialist, Panhandle Research and Extension Center, Oklahoma State University 1Kevin Larson is the corresponding author, email contact: [email protected] Published: March, 2005
30

Long Term Ripping Study at Walsh, 1997 to 2005 K. Larson, D. Thompson, C. Thompson, and D. Harn
PURPOSE: To evaluate the effect of ripping for dryland crop production across multiple years for a wheat-grain sorghum-fallow rotation. METHODS AND MATERIALS: A Silty Clay Loam soil with a history of wheat-fallow tillage using one-ways and sweep plows, and no history of subsoiling, was soil sampled and demonstrated a severely compacted 4 in. to 12 in. zone. The soil-compaction zone was mapped using a hand-held Dickey-John penetrameter. We performed the first ripping treatment on February 18, 1997, the second treatment on May 18, 1998, the third treatment on February 15, 2000, and the fourth treatment on May 1, 2001. For all four ripping treatments, we used a ripper with straight shanks spaced at 30 in. apart and subsoiled to a depth of 15 in. with four replications. The first cropping season we planted a grain sorghum crop on June 4, 1997 with NORTHRUP KING KS 310 at 40,000 Seeds/A. The soil test recommendation for a 45 Bu/A grain sorghum crop was 40 Lb P2O5/A and no N was needed. A seedrow application of 5 Gal/A of 10-34-0 (20 Lb P2O5/A, 6 Lb N/A) was the only fertilizer we applied to the sorghum. The soil test recommendation for a 35 Bu/A wheat crop for the second cropping season was 25 Lb N/A and 25 Lb P2O5/A. We swept in 50 Lb N/A and seedrow applied 20 Lb P2O5/A. We planted a wheat crop on September 26, 1998 with Akron at 45 Lb Seed/A. The third cropping season we grew grain sorghum. We planted CARGILL 627 at 40,000 Seeds/A on May 22, 2000. The soil test recommendation for a 45 Bu/A grain sorghum crop was 40 Lb P2O5/A and no N was needed. We applied 50 Lb N/A as anhydrous with a sweep and seedrow applied 20 Lb P2O5/A. The 2002 wheat crop that was to follow the sorghum crop was lost to drought. In 2003 we planted grain sorghum, MYCOGEN 1482, at 38,000 Seeds/A on June 15, 2003. The soil test recommended 20 Lb P2O5/A and no N was required. We seedrow applied 5 Gal/A of 10-34-0 and no N was applied. In 2005 we planted grain sorghum, MYCOGEN 1482, at 35,000 Seeds/A on June 15, 2005. The soil test recommended 20 Lb P2O5/A and 27 Lb N/A. We applied 50 Lb N/A and seedrow applied 5 Gal/A of 10-34-0. The 20 ft. by 1000 ft. plots were harvested on November 15, 1997 for sorghum (first crop), July 5, 1999 for wheat (second crop), November 9, 2000 for sorghum (third crop), November 11, 2003 for sorghum (fourth crop), and November 10, 2005 for sorghum (fifth crop) with a self-propelled combine and weighed in a digital weigh cart. Yields were moisture corrected to 14% for sorghum and 12% for wheat. RESULTS: In 2005, the fifth crop year, there was no significant difference in grain sorghum yield between the treatments. The check averaged 1 Bu/A more than any of the ripping treatments. In 2003, only the first ripping treatment (Ripped 1997) yielded more grain sorghum than the non-ripped check. For the grain sorghum crop in 2000, all three ripping treatments and the check produced the same 26 Bu/A yield. The yields from the 1999 wheat crop were significantly higher than the check for the first ripping treatment (Ripped 1997) but not for the second ripping (Ripped 1998) treatment (P > 0.05). The grain sorghum crop following the first ripping (Ripped 1997) produced significantly more yield than the non-ripped check (P > 0.10). For the five cropping
31

years, the first ripping treatment is the only ripping treatment that produced higher yields that the non-ripped check. The Ripped 97 treatment averaged 8 Bu/A more grain than the non-ripped check. All the other ripping treatments for the five crop years of this study produced less grain than the non-ripped check. DISCUSSION: This is the fifth crop of our long term ripping study. Only the first ripping treatment (Ripped 1997) produced a higher yield than the non-ripped check. The first ripping treatment yielded more than or equaled the non-ripping check for four of the five cropping years: first crop (grain sorghum) 3 Bu/A more, second crop (wheat) 5 Bu/A more, third crop (sorghum) same yield, fourth crop (sorghum) 1 Bu/A more, and the fifth crop (grain sorghum) 1 Bu/A less. Therefore, the first ripping treatment is the only ripping treatment to provide a positive variable net income, $9.98/A ($20.95/A gross crop income minus $9.00/A ripping cost with 3 Bu/A at $2.10/Bu, 5 Bu/A at $2.47/Bu, 1 Bu/A at $2.30/Bu, and 1 Bu/A less at $1.97/Bu). Overall, ripping was not a cost effective tillage treatment for dryland grain production. We expected that there would be positive yield affects from ripping for multiple years after ripping; however, only one ripping treatment (Ripped 97) produced positive yield results compared to the non-ripped check. If time of year was critical for ripping than two ripping treatments, and not just one ripping treatment, would have produced positive yield results, since two of the ripping treatments were performed in February and two in May. We have no explanation for ripping working only in 1997 and no other year.
32

Table .-Long Term Ripping Study at Walsh, 1997 to 2005.__________________________________________________________________________________
CheckRipping Soil Compaction Test Grain Yield
Ripping Treatment Performed 0-4" 4-12" 12-27" Weight Yield Difference__________________________________________________________________________________
Lb/In2 Lb/Bu Bu/A
Grain Sorghum 1997Ripped 1997 2/18/97 100 250 225 57 56 3+Non-Ripped Check None 100 350 275 57 53
Average 1997 100 300 250 57 55 3+
Wheat 1999Ripped 1997 2/18/97 60 60 5+Ripped 1998 5/18/98 59 56 1+Non-Ripped Check None 60 55
Average 1999 60 57 3+
Grain Sorghum 2000Ripped 1997 2/18/97 56 26 0Ripped 1998 5/18/98 57 26 0Ripped 2000 2/15/00 57 26 0Non-Ripped Check None 56 26
Average 2000 57 26 0
Grain Sorghum 2003Ripped 1997 2/18/97 57 63 1+Ripped 1998 5/18/98 57 60 2-Ripped 2000 2/15/00 57 59 3-Ripped 2001 5/1/01 57 58 4-Non-Ripped Check None 57 62
Average 2003 57 60 2-Orthogonal Contrast: All Ripping Treatments vs. Check NS
Grain Sorghum 2005Ripped 1997 2/18/97 58 32 1-Ripped 1998 5/18/98 57 32 1-Ripped 2000 2/15/00 57 32 1-Ripped 2001 5/1/01 57 32 1-Non-Ripped Check None 57 33
Average 2005 57 32 1-
Orthogonal Contrast: Significant Treatment above Non-Ripped Check, (Year,Treatment): 1997, Ripped 97; 1999, Ripped 97; 2000, NS; 2003, NS; 2005, NS.__________________________________________________________________________________
33

Sweep Plow and Chisel Plow Tillage on Long Term Ripping Study at Walsh, 2005 Kevin Larson and Dennis Thompson
PURPOSE: To evaluate the effects of sweep plow and chisel plow on a previously ripped site for dryland crop production. METHODS AND MATERIALS: A Silty Clay Loam soil with a history of wheat-fallow tillage using one-ways and sweep plows, and no history of subsoiling, was soil sampled and demonstrated a severely compacted 4 in. to 12 in. zone. The soil-compaction zone was mapped using a hand-held Dickey-John penetrameter. We performed the first ripping treatment on February 18, 1997, the second treatment on May 18, 1998, the third treatment on February 15, 2000, and the fourth treatment on May 1, 2001. For all four ripping treatments, we used a ripper with straight shanks spaced at 30 in. apart and subsoiled to a depth of 15 in. with four replications. In 2004, we decided to overlay two tillage treatments, sweep plow and chisel plow on the ripping study. We assigned each ripping block to either tillage treatment, results in two replications of either sweep plow or chisel plow. The first cropping season we planted a grain sorghum crop on June 4, 1997 with NORTHRUP KING KS 310 at 40,000 Seeds/A. The soil test recommendation for a 45 Bu/A grain sorghum crop was 40 Lb P2O5/A and no N was needed. A seedrow application of 5 Gal/A of 10-34-0 (20 Lb P2O5/A, 6 Lb N/A) was the only fertilizer we applied to the sorghum. The soil test recommendation for a 35 Bu/A wheat crop for the second cropping season was 25 Lb N/A and 25 Lb P2O5/A. We swept in 50 Lb N/A and seedrow applied 20 Lb P2O5/A. We planted a wheat crop on September 26, 1998 with Akron at 45 Lb Seed/A. The third cropping season we grew grain sorghum. We planted CARGILL 627 at 40,000 Seeds/A on May 22, 2000. The soil test recommendation for a 45 Bu/A grain sorghum crop was 40 Lb P2O5/A and no N was needed. We applied 50 Lb N/A as anhydrous with a sweep and seedrow applied 20 Lb P2O5/A. The 2002 wheat crop that was to follow the sorghum crop was lost to drought. In 2003 we planted grain sorghum, MYCOGEN 1482, at 38,000 Seeds/A on June 15, 2003. The soil test recommended 20 Lb P2O5/A and no N was required. We seedrow applied 5 Gal/A of 10-34-0 and no N was applied. In 2005 we planted grain sorghum, MYCOGEN 1482, at 35,000 Seeds/A on June 15, 2005. The soil test recommended 20 Lb P2O5/A and 27 Lb N/A. We applied 50 Lb N/A and seedrow applied 5 Gal/A of 10-34-0. The 20 ft. by 1000 ft. plots were harvested on November 15, 1997 for sorghum (first crop), July 5, 1999 for wheat (second crop), November 9, 2000 for sorghum (third crop), November 11, 2003 for sorghum (fourth crop), and November 10, 2005 for sorghum (fifth crop) with a self-propelled combine and weighed in a digital weigh cart. Yields were moisture corrected to 14% for sorghum and 12% for wheat. RESULTS and DISCUSSION: The sweep plow and chisel plow produced the same yield, 32.2 Bu/A. At the 2004 fall field day, we brushed the first few inches of soil away to revealed a definite, flat, tabletop-like smear layer beneath the sweep plow tillage plot and friable soil beneath the chisel plow tillage plot. Although the tillage treatments left the soil visually different, there was no yield difference between sweep plow and chisel plow treatments. There were no interactions between sweep plow and chisel plow tillage and the previously ripped treatments.
34

Table .Long Term Dryland Ripping and Tillage Study, Grain Sorghum, Walsh, 2005.___________________________________________
Ripping TillageYear Grain Tillage GrainRipped Yield Treatment Yield___________________________________________
Bu/A Bu/A
Check 33.2 Chisel Plow 32.2Feb-97 32.3 Sweep Plow 32.2May-98 32.1Feb-00 31.7May-01 32.1___________________________________________Average 32.2 32.2LSD 0.05 2.7 7.1___________________________________________Sweep plow with 5 ft. sweep blades.Chisel Plow with straight points 1.25 ft apart andsweep attachments 1.5 ft. wide.
35

Proso Millet Harvesting Method Comparison, Towner, 2005 Scott Brase and Linly Stum
Conducted at the Linly Stum Farm with the Proso millet variety Huntsman Harvested on Sept. 12, 2005 Method: Swathing / Combine w/ pick-up head Table 1. Proso Millet Harvesting
Method Comparison, 2005. _________________________ Grain Harvesting Method Yield _________________________ Bu/A Swathed and Combined with Pickup head 39.2 Combined with Conventional head 35.3 Combined with Stripper head 31.9 ________________________ Average 35.5 ________________________ Grain yields adjusted to 14% seed moisture content.
Length of test: 2,466 feet Width of test: 97 feet Test acreage: 5.49 Bushels harvested: 215.6 Yield: 39.2 bu/ac Method: Combine with stripper header Length of test: 2,466 feet Width of test: 61 feet Test acreage: 3.45 Bushels harvested: 110.2 Yield: 31.94 bu/ac Method: Combine with Conventional header Length of test: 2,466 feet Width of test: 58 feet Test acreage: 3.28 Bushels harvested: 115.9 Yield: 35.34 bu/ac Conclusion: Swathing and then using the combine will harvest the most grain and is most profitable. Swathing cost an additional $7.00/ac but the procedure nets an additional 3.86 bu/ac over conventional harvesting. This results in an additional $8.44 after swathing expense. ($4.00/bu millet x 3.86bu gain = $15.44 - $7.00 swathing exp. = $8.44/acre net gain)
36
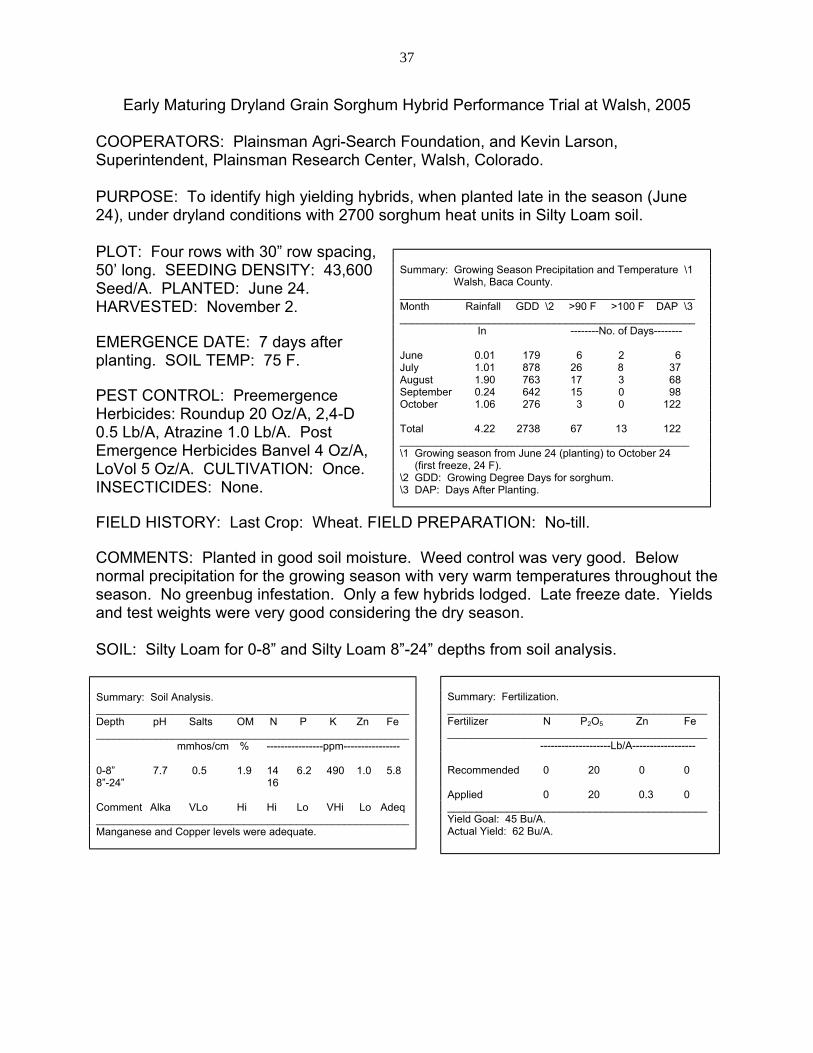
Early Maturing Dryland Grain Sorghum Hybrid Performance Trial at Walsh, 2005 COOPERATORS: Plainsman Agri-Search Foundation, and Kevin Larson, Superintendent, Plainsman Research Center, Walsh, Colorado. PURPOSE: To identify high yielding hybrids, when planted late in the season (June 24), under dryland conditions with 2700 sorghum heat units in Silty Loam soil. PLOT: Four rows with 30” row spacing, 50’ long. SEEDING DENSITY: 43,600 Seed/A. PLANTED: June 24. HARVESTED: November 2.
Summary: Growing Season Precipitation and Temperature \1 Walsh, Baca County. __________________________________________________ Month Rainfall GDD \2 >90 F >100 F DAP \3 __________________________________________________ In --------No. of Days-------- June 0.01 179 6 2 6 July 1.01 878 26 8 37 August 1.90 763 17 3 68 September 0.24 642 15 0 98 October 1.06 276 3 0 122 Total 4.22 2738 67 13 122 _________________________________________________ \1 Growing season from June 24 (planting) to October 24 (first freeze, 24 F). \2 GDD: Growing Degree Days for sorghum. \3 DAP: Days After Planting.
EMERGENCE DATE: 7 days after planting. SOIL TEMP: 75 F. PEST CONTROL: Preemergence Herbicides: Roundup 20 Oz/A, 2,4-D 0.5 Lb/A, Atrazine 1.0 Lb/A. Post Emergence Herbicides Banvel 4 Oz/A, LoVol 5 Oz/A. CULTIVATION: Once. INSECTICIDES: None. FIELD HISTORY: Last Crop: Wheat. FIELD PREPARATION: No-till. COMMENTS: Planted in good soil moisture. Weed control was very good. Below normal precipitation for the growing season with very warm temperatures throughout the season. No greenbug infestation. Only a few hybrids lodged. Late freeze date. Yields and test weights were very good considering the dry season. SOIL: Silty Loam for 0-8” and Silty Loam 8”-24” depths from soil analysis.
Summary: Fertilization. ____________________________________________ Fertilizer N P2O5 Zn Fe ____________________________________________ --------------------Lb/A------------------ Recommended 0 20 0 0 Applied 0 20 0.3 0 ____________________________________________ Yield Goal: 45 Bu/A. Actual Yield: 62 Bu/A.
Summary: Soil Analysis. _____________________________________________________ Depth pH Salts OM N P K Zn Fe _____________________________________________________ mmhos/cm % ----------------ppm---------------- 0-8” 7.7 0.5 1.9 14 6.2 490 1.0 5.8 8”-24” 16 Comment Alka VLo Hi Hi Lo VHi Lo Adeq _____________________________________________________ Manganese and Copper levels were adequate.
37

������������������������������������������������������������������������
������������������������������������������������������������������������
������������������������������������������������������������������������
������������������������������������������������������������������������
������������������������������������������������������������������������
������������������������������������������������������������������������
������������������������������������������������������������������������
��������������������������������������������������������
��������������������������������
����������������
����������������
����������������
����������������
��������������������������������������������������������������������������������
��������������������������������������������������������������������������������
��������������������������������������������������������������������������������
��������������������������������������������������������������������������������
������������������������������������������������������������������������
��������������������������������������������������������
����������������
����������������
������������������������ �������� �������� ��������
����������������
����������������
����������������
���������������� ��������
��������
��������
����������������
��������
����������������
�������� ���������������� �������� ��������
������������������������������������������������������������������������
����������������
������������������������������������������������������������������������
������������������������
��������
������������������������������������������������������������������������
����������������������������������������������������������������
����������������
������������������������ �������� ��������
�������� ��������
Available Soil Water Dryland Grain Sorghum, Early Maturing, Walsh, 2005
0
1
2
3
4
5
6
7
8
9
10
3 4 5 6 7 8 9 10 11 12 13 14 15Weeks After Planting
Available Soil Water
(in. of water/4 ft. soil depth)
������������������������
Flowering
Depth 1 ft.Depth 2 ft.Depth 3 ft.Depth 4 ft.
Fig. 1. Available soil water in dryland grain sorghum at Walsh. Gypsum block measurements taken to 4 ft. with 1 ft. increments. Total rainfall at Walsh from
planting to first freeze was 4.22 in. Any increase in available soil water between weeks is from rain.
38
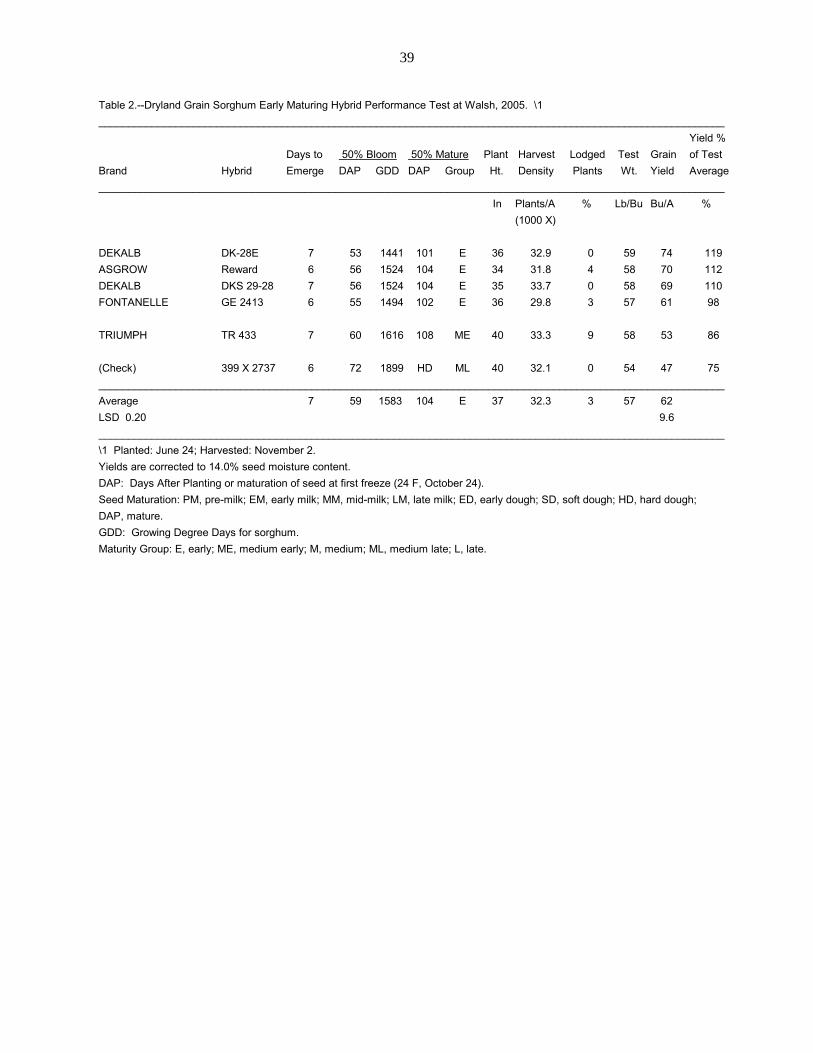
Table 2.--Dryland Grain Sorghum Early Maturing Hybrid Performance Test at Walsh, 2005. \1__________________________________________________________________________________________________________
Yield %Days to 50% Bloom 50% Mature Plant Harvest Lodged Test Grain of Test
Brand Hybrid Emerge DAP GDD DAP Group Ht. Density Plants Wt. Yield Average__________________________________________________________________________________________________________
In Plants/A % Lb/Bu Bu/A %(1000 X)
DEKALB DK-28E 7 53 1441 101 E 36 32.9 0 59 74 119ASGROW Reward 6 56 1524 104 E 34 31.8 4 58 70 112DEKALB DKS 29-28 7 56 1524 104 E 35 33.7 0 58 69 110FONTANELLE GE 2413 6 55 1494 102 E 36 29.8 3 57 61 98
TRIUMPH TR 433 7 60 1616 108 ME 40 33.3 9 58 53 86
(Check) 399 X 2737 6 72 1899 HD ML 40 32.1 0 54 47 75__________________________________________________________________________________________________________Average 7 59 1583 104 E 37 32.3 3 57 62LSD 0.20 9.6__________________________________________________________________________________________________________\1 Planted: June 24; Harvested: November 2.Yields are corrected to 14.0% seed moisture content.DAP: Days After Planting or maturation of seed at first freeze (24 F, October 24).Seed Maturation: PM, pre-milk; EM, early milk; MM, mid-milk; LM, late milk; ED, early dough; SD, soft dough; HD, hard dough;DAP, mature.GDD: Growing Degree Days for sorghum.Maturity Group: E, early; ME, medium early; M, medium; ML, medium late; L, late.
39

Table 3.--Summary: Grain Sorghum Early Maturing Hybrid Performance Tests, 2003-2005.__________________________________________________________________________________________________________
Grain Yield Yield as % of Test Average 2-Year 3-Year 2-Year 3-Year
Brand Hybrid 2003 2004 2005 Avg Avg 2003 2004 2005 Avg Avg__________________________________________________________________________________________________________
----------------------Bu/A------------------------ -------------------------%-------------------------
ASGROW Reward 123 100 70 85 98 105 116 112 114 111DEKALB DK-28E 122 93 74 84 96 104 108 119 114 110DEKALB DKS 29-28 134 97 69 83 100 114 113 110 112 112
SORGHUM PARTNERS KS 310 128 93 -- 111 74 109 108 -- 109 --SORGHUM PARTNERS K35-Y5 123 77 -- 100 67 105 89 -- 97 --SORGHUM PARTNERS 251 102 97 -- 100 66 87 113 -- 100 --(Check) 399 X 2737 88 37 47 42 57 75 43 75 59 64__________________________________________________________________________________________________________Average 117 86 62 74 88__________________________________________________________________________________________________________Grain Yields were corrected to 14.0 % seed moisture content.Irrigated at Walsh for 2003 and 2004, dryland for 2005.
40
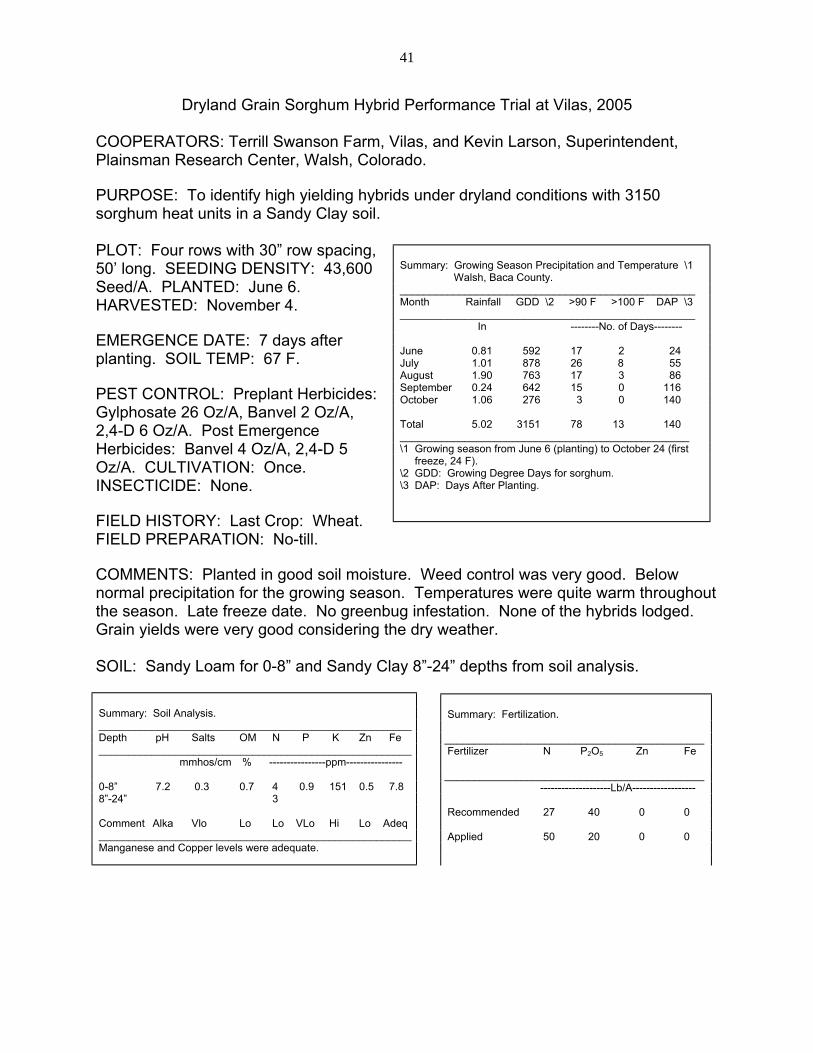
Dryland Grain Sorghum Hybrid Performance Trial at Vilas, 2005 COOPERATORS: Terrill Swanson Farm, Vilas, and Kevin Larson, Superintendent, Plainsman Research Center, Walsh, Colorado. PURPOSE: To identify high yielding hybrids under dryland conditions with 3150 sorghum heat units in a Sandy Clay soil. PLOT: Four rows with 30” row spacing, 50’ long. SEEDING DENSITY: 43,600 Seed/A. PLANTED: June 6. HARVESTED: November 4.
Summary: Growing Season Precipitation and Temperature \1 Walsh, Baca County. __________________________________________________ Month Rainfall GDD \2 >90 F >100 F DAP \3 __________________________________________________ In --------No. of Days-------- June 0.81 592 17 2 24 July 1.01 878 26 8 55 August 1.90 763 17 3 86 September 0.24 642 15 0 116 October 1.06 276 3 0 140 Total 5.02 3151 78 13 140 _________________________________________________ \1 Growing season from June 6 (planting) to October 24 (first freeze, 24 F). \2 GDD: Growing Degree Days for sorghum. \3 DAP: Days After Planting.
EMERGENCE DATE: 7 days after planting. SOIL TEMP: 67 F. PEST CONTROL: Preplant Herbicides: Gylphosate 26 Oz/A, Banvel 2 Oz/A, 2,4-D 6 Oz/A. Post Emergence Herbicides: Banvel 4 Oz/A, 2,4-D 5 Oz/A. CULTIVATION: Once. INSECTICIDE: None. FIELD HISTORY: Last Crop: Wheat. FIELD PREPARATION: No-till. COMMENTS: Planted in good soil moisture. Weed control was very good. Below normal precipitation for the growing season. Temperatures were quite warm throughout the season. Late freeze date. No greenbug infestation. None of the hybrids lodged. Grain yields were very good considering the dry weather. SOIL: Sandy Loam for 0-8” and Sandy Clay 8”-24” depths from soil analysis.
Summary: Soil Analysis. _____________________________________________________ Depth pH Salts OM N P K Zn Fe _____________________________________________________ mmhos/cm % ----------------ppm---------------- 0-8” 7.2 0.3 0.7 4 0.9 151 0.5 7.8 8”-24” 3 Comment Alka Vlo Lo Lo VLo Hi Lo Adeq _____________________________________________________ Manganese and Copper levels were adequate.
Summary: Fertilization. ____________________________________________ Fertilizer N P2O5 Zn Fe ____________________________________________ --------------------Lb/A------------------ Recommended 27 40 0 0 Applied 50 20 0 0
41
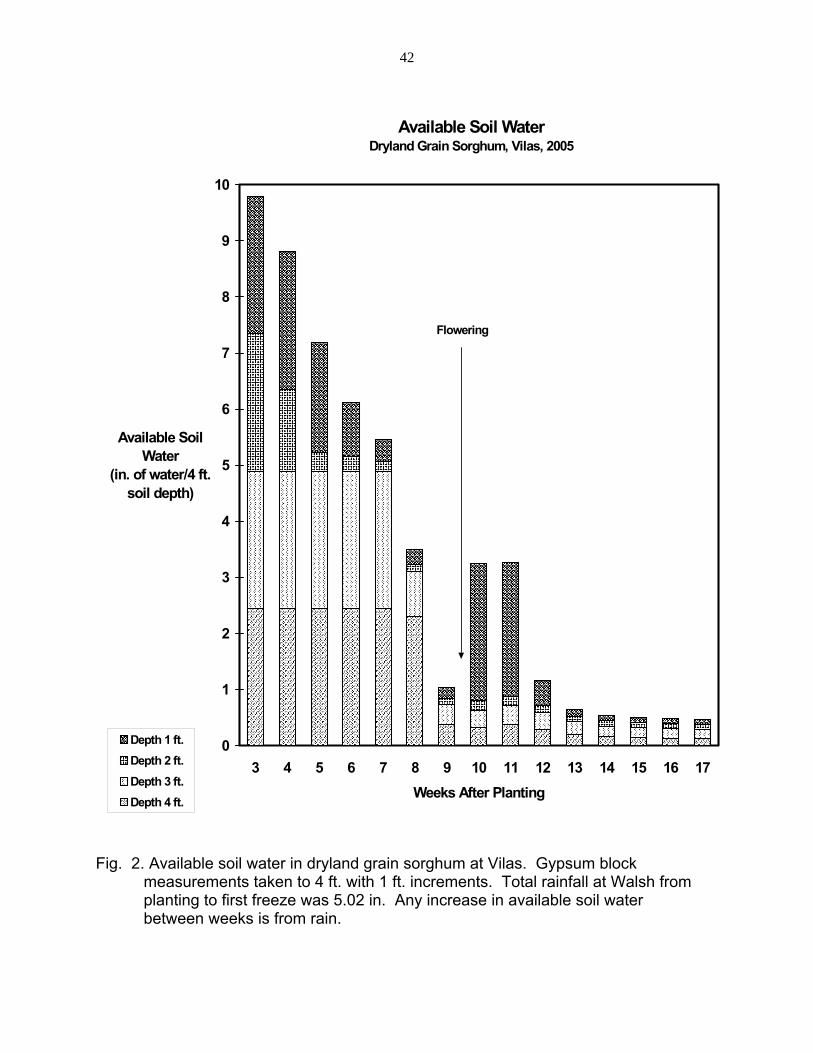
������������������������������������������������������������������������
����������������������������������������������������������������������
��������������������������������������������������������������������������������
����������������������������������������������������������������������
������������������������������������������������������������������������
���������������������������������������������������������������
����������������
��������������
����������������
�������������� �������� ������� �������� ������� ��������
������������������������������������������������������������������������
���������������������������������������������������������������
������������������������������������������������������������������������
���������������������������������������������������������������
������������������������������������������������������������������������
����������������������������
����������������
��������������
����������������
�������������� ��������
����������������������
����������������
��������������
����������������
��������������������������������������������������������������������������������
�������������������������������������������������
������������������������
��������������
����������������
�������
����������������
��������������
���������������� �������
�������� ������� �������� ������� ��������
��������������������������������������������������������������������������������
����������������������������������������������������������������������
����������������������������������������������������������������
�����������������������������������
������������������������
��������������
��������
���������������������������������������������������������������
������������������������������������������������������������������������
��������������������� ��������
���������������������� �������� ������� ��������
Available Soil WaterDryland Grain Sorghum, Vilas, 2005
0
1
2
3
4
5
6
7
8
9
10
3 4 5 6 7 8 9 10 11 12 13 14 15 16 17Weeks After Planting
Available Soil Water
(in. of water/4 ft. soil depth)
���������������
Flowering
Depth 1 ft.Depth 2 ft.Depth 3 ft.Depth 4 ft.
Fig. 2. Available soil water in dryland grain sorghum at Vilas. Gypsum block measurements taken to 4 ft. with 1 ft. increments. Total rainfall at Walsh from planting to first freeze was 5.02 in. Any increase in available soil water
between weeks is from rain.
42

Table 4.--Dryland Grain Sorghum Hybrid Performance Test at Vilas, 2005. \1__________________________________________________________________________________________________________
Yield %Days to 50% Bloom 50% Mature Plant Harvest Plants Test Grain of Test
Brand Hybrid Emerge DAP GDD DAP Group Ht. Density Lodged Wt. Yield Average__________________________________________________________________________________________________________
In Plants/A % Lb/Bu Bu/A %(1000 X)
FONTANELLE GE 3245 8 57 1551 103 E 33 22.5 0 61 66 101
FONTANELLE GE 4532 7 68 1816 113 ME 41 25.6 0 61 72 110ASGROW Seneca 7 69 1842 115 ME/M 39 25.2 0 61 71 108DEKALB DK-44 7 68 1816 114 ME/M 41 24.0 0 60 69 105DEKALB DKS 37-07 8 61 1618 110 ME 39 20.5 0 62 68 104ASGROW Pulsar 8 63 1673 108 ME 34 18.4 0 61 59 90
(Check) 399 X 2737 7 83 2259 132 ML 38 22.8 0 57 57 87__________________________________________________________________________________________________________Average 7 67 1796 114 ME 38 22.7 0 60 66LSD 0.20 5.2__________________________________________________________________________________________________________\1 Planted: June 6; Harvested: November 4.Yields are corrected to 14.0% seed moisture content.DAP: Days After Planting or maturation of seed at first freeze.Seed Maturation: EM, early milk; MM, mid milk; LM, late milk; ED, early dough; SD, soft dough; HD, hard dough; mature (DAP).GDD: Growing Degree Days for sorghum.Maturity Group: E, early; ME, medium early; M, medium; ML, medium late; L, late.
43

Table 5.--Summary: Dryland Grain Sorghum Hybrid Performance Tests at Vilas, 2003-2005.__________________________________________________________________________________________________________
Grain Yield Yield as % of Test Average 2-Year 3-Year 2-Year 3-Year
Brand Hybrid 2003 2004 2005 Avg Avg 2003 2004 2005 Avg Avg__________________________________________________________________________________________________________
-------------------Bu/A-------------------- --------------------%-----------------------
ASGROW Seneca 17 33 71 52 40 107 116 108 112 110ASGROW Pulsar 21 24 59 42 35 129 85 90 88 101DEKALB DK-44 20 31 69 50 40 124 110 105 108 113
PIONEER 85G01 26 35 -- 31 -- 159 126 -- 143 --SORGHUM PARTNERS NK 7633 20 35 -- 28 -- 122 123 -- 123 --(Check) 399 X 2737 15 15 57 20 29 94 73 87 80 85__________________________________________________________________________________________________________Average 16 28 66 47 37__________________________________________________________________________________________________________Grain Yields were corrected to 14.0 % seed moisture content.
44
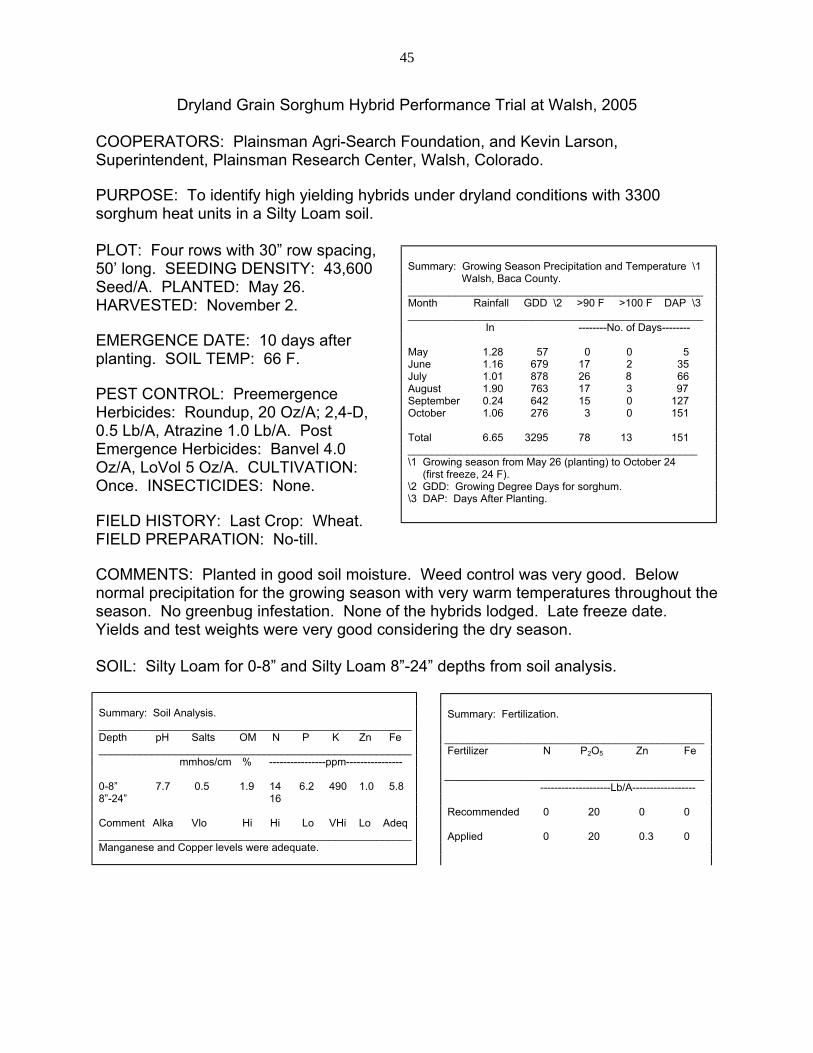
Dryland Grain Sorghum Hybrid Performance Trial at Walsh, 2005 COOPERATORS: Plainsman Agri-Search Foundation, and Kevin Larson, Superintendent, Plainsman Research Center, Walsh, Colorado. PURPOSE: To identify high yielding hybrids under dryland conditions with 3300 sorghum heat units in a Silty Loam soil. PLOT: Four rows with 30” row spacing, 50’ long. SEEDING DENSITY: 43,600 Seed/A. PLANTED: May 26. HARVESTED: November 2.
Summary: Growing Season Precipitation and Temperature \1 Walsh, Baca County. __________________________________________________ Month Rainfall GDD \2 >90 F >100 F DAP \3 __________________________________________________ In --------No. of Days-------- May 1.28 57 0 0 5 June 1.16 679 17 2 35 July 1.01 878 26 8 66 August 1.90 763 17 3 97 September 0.24 642 15 0 127 October 1.06 276 3 0 151 Total 6.65 3295 78 13 151 _________________________________________________ \1 Growing season from May 26 (planting) to October 24 (first freeze, 24 F). \2 GDD: Growing Degree Days for sorghum. \3 DAP: Days After Planting.
EMERGENCE DATE: 10 days after planting. SOIL TEMP: 66 F. PEST CONTROL: Preemergence Herbicides: Roundup, 20 Oz/A; 2,4-D, 0.5 Lb/A, Atrazine 1.0 Lb/A. Post Emergence Herbicides: Banvel 4.0 Oz/A, LoVol 5 Oz/A. CULTIVATION: Once. INSECTICIDES: None. FIELD HISTORY: Last Crop: Wheat. FIELD PREPARATION: No-till. COMMENTS: Planted in good soil moisture. Weed control was very good. Below normal precipitation for the growing season with very warm temperatures throughout the season. No greenbug infestation. None of the hybrids lodged. Late freeze date. Yields and test weights were very good considering the dry season. SOIL: Silty Loam for 0-8” and Silty Loam 8”-24” depths from soil analysis.
Summary: Soil Analysis. _____________________________________________________ Depth pH Salts OM N P K Zn Fe _____________________________________________________ mmhos/cm % ----------------ppm---------------- 0-8” 7.7 0.5 1.9 14 6.2 490 1.0 5.8 8”-24” 16 Comment Alka Vlo Hi Hi Lo VHi Lo Adeq _____________________________________________________ Manganese and Copper levels were adequate.
Summary: Fertilization. ____________________________________________ Fertilizer N P2O5 Zn Fe ____________________________________________ --------------------Lb/A------------------ Recommended 0 20 0 0 Applied 0 20 0.3 0
45

���������������������
���������������������
���������������������
���������������������
��������������
��������������
��������������
��������������
��������������
��������������
��������������
��������������
��������������
��������������
��������������
���������������������������������������������������������������
���������������������������������������������������������������
���������������������������������������������������������������
�������������������������������������������������
������� ������� ������� ������� ������� ������� ������� ������� ������� ������� �������
���������������������������������������������������������������
���������������������������������������������������������������
��������������������������������������������������������
��������������
�������������� ������� ������� ������� ������� ������� ������� ������� ������� ������� �������
��������������������������������������������������������
��������������������������������������������������������
���������������������
��������������
������� �������������� �������
���������������������������������������������������������������
�������������� ������� ������� ������� ������� ������� �������
Available Soil WaterDryland Grain Sorghum, Walsh, 2005
0
1
2
3
4
5
6
7
8
9
10
5 6 7 8 9 10 11 12 13 14 15 16 17 18 19Weeks After Planting
Available Soil Water
(in. of water/4 ft. soil depth)
������������������������
Flowering
Depth 1 ft.Depth 2 ft.Depth 3 ft.Depth 4 ft.
Fig. 3. Available soil water in dryland grain sorghum at Walsh. Gypsum block measurements taken to 4 ft. with 1 ft. increments. Total rainfall at Walsh from planting to first freeze was 6.65 in. Any increase in available soil water between weeks not attributed to applied irrigation is from rain.
46

Table 6.--Dryland Grain Sorghum Hybrid Performance Test at Walsh, 2005. \1__________________________________________________________________________________________________________
Yield %Days to 50% Bloom 50% Mature Plant Harvest Plants Test Grain of Test
Brand Hybrid Emerge DAP GDD DAP Group Ht. Density Lodged Wt. Yield Average__________________________________________________________________________________________________________
In Plants/A % Lb/Bu Bu/A %(1000 X)
FONTANELLE GE 3245 11 65 1582 108 E 32 22.5 0 59 58 101
DEKALB DKS 37-07 11 70 1743 115 ME 35 19.6 0 60 68 117DEKALB DK-44 10 72 1778 119 ME/M 36 21.9 0 60 61 105ASGROW Pulsar 11 70 1743 112 ME 32 20.3 0 60 60 104FONTANELLE GE 4532 10 73 1804 119 ME 38 26.1 0 60 58 100ASGROW Seneca 9 73 1804 120 ME/M 34 25.7 0 60 56 97
(Check) 399 X 2737 9 89 2173 138 ML 34 25.9 0 57 44 76__________________________________________________________________________________________________________Average 10 73 1804 119 ME 34 23.1 0 59 58LSD 0.20 6.2__________________________________________________________________________________________________________\1 Planted: May 26; Harvested: November 2.Yields are corrected to 14.0% seed moisture content.DAP: Days After Planting or maturation of seed at first freeze.Seed Maturation: EM, early milk; MM, mid milk; LM, late milk; ED, early dough; SD, soft dough; HD, hard dough; mature (DAP).GDD: Growing Degree Days for sorghum.Maturity Group: E, early; ME, medium early; M, medium; ML, medium late; L, late.
47
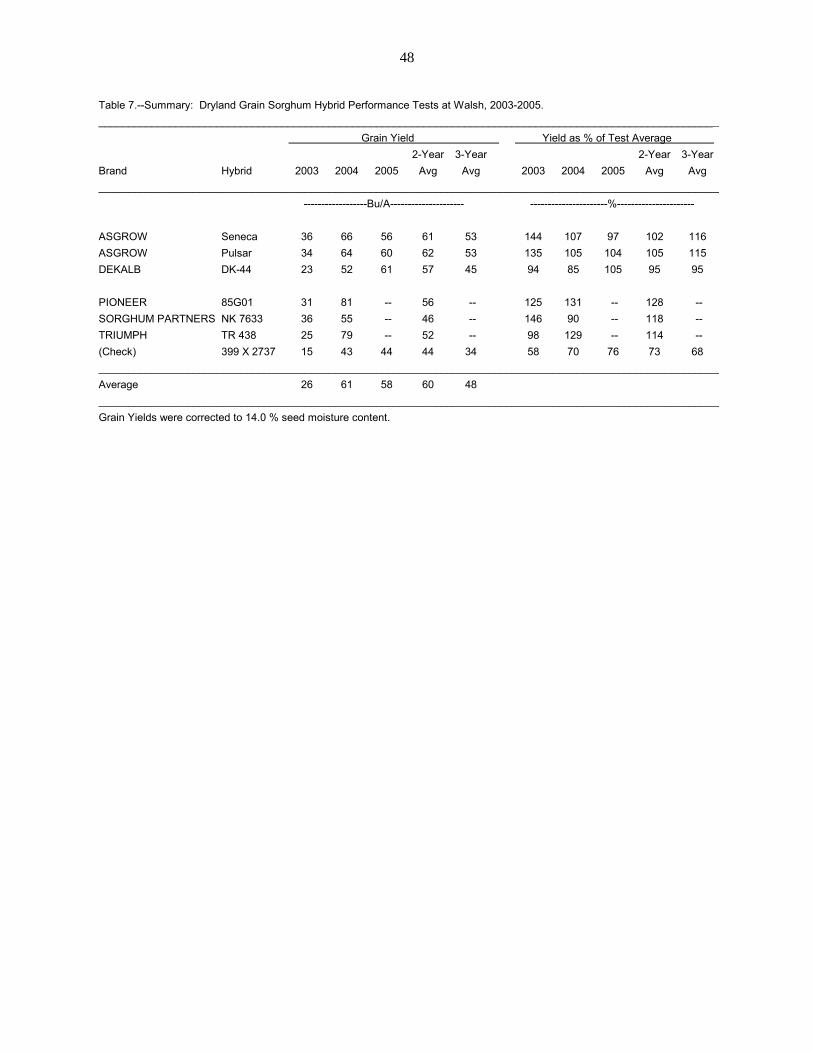
Table 7.--Summary: Dryland Grain Sorghum Hybrid Performance Tests at Walsh, 2003-2005.__________________________________________________________________________________________________________
Grain Yield Yield as % of Test Average 2-Year 3-Year 2-Year 3-Year
Brand Hybrid 2003 2004 2005 Avg Avg 2003 2004 2005 Avg Avg__________________________________________________________________________________________________________
------------------Bu/A--------------------- ----------------------%----------------------
ASGROW Seneca 36 66 56 61 53 144 107 97 102 116ASGROW Pulsar 34 64 60 62 53 135 105 104 105 115DEKALB DK-44 23 52 61 57 45 94 85 105 95 95
PIONEER 85G01 31 81 -- 56 -- 125 131 -- 128 --SORGHUM PARTNERS NK 7633 36 55 -- 46 -- 146 90 -- 118 --TRIUMPH TR 438 25 79 -- 52 -- 98 129 -- 114 --(Check) 399 X 2737 15 43 44 44 34 58 70 76 73 68__________________________________________________________________________________________________________Average 26 61 58 60 48__________________________________________________________________________________________________________Grain Yields were corrected to 14.0 % seed moisture content.
48

Irrigated Grain Sorghum Hybrid Performance Trial at Walsh, 2005
COOPERATORS: Plainsman Agri-Search Foundation, and Kevin Larson, Superintendent, Plainsman Research Center, Walsh, Colorado. PURPOSE: To identify high yielding hybrids under irrigated conditions with 3200 sorghum heat units in a Silty Loam soil. PLOT: Four rows with 30” row spacing, 50’ long. SEEDING DENSITY: 87,100 Seed/A. PLANTED: June 2. HARVESTED: November 3.
Summary: Growing Season Precipitation and Temperature \1 Walsh, Baca County. __________________________________________________ Month Rainfall GDD \2 >90 F >100 F DAP \3 __________________________________________________ In --------No. of Days-------- June 1.16 677 17 2 28 July 1.01 878 26 8 59 August 1.90 763 17 3 90 September 0.24 642 15 0 120 October 1.06 276 3 0 148 Total 5.37 3236 78 13 148 _________________________________________________ \1 Growing season from June 2 (planting) to October 24 (first freeze, 24 F). \2 GDD: Growing Degree Days for sorghum. \3 DAP: Days After Planting.
EMERGENCE DATE: 9 days after planting. SOIL TEMP: 65 F. IRRIGATION: Drip irrigated for 15 weeks with 12.6 A-in./A. PEST CONTROL: Preemergence Herbicides: Roundup 20 Oz/A, 2,4-D 0.5 Lb/A, Atrazine 1.0 Lb/A. Post Emergence Herbicides: Banvel 4 0z/A, LoVol 5 Oz/A. CULTIVATION: Once. INSECTICIDES: None. FIELD HISTORY: Last Crop: Grain sorghum. FIELD PREPARATION: Disc. COMMENTS: Planted in good soil moisture. Weed control was good. Below normal precipitation for the growing season with very warm temperatures throughout the season. Late freeze date. No greenbug infestation. None of the hybrids lodged. Grain yields were good. SOIL: Silty Loam for 0-8” and Silty Loam 8”-24” depths from soil analysis.
Summary: Soil Analysis. _____________________________________________________ Depth pH Salts OM N P K Zn Fe _____________________________________________________ mmhos/cm % ----------------ppm---------------- 0-8” 7.7 0.5 1.9 5 0.9 368 1.1 6.2 8”-24” 5 Comment Alka VLo Hi Lo VLo VHi Lo Marg _____________________________________________________ Manganese and Copper levels were adequate.
Summary: Fertilization. ____________________________________________ Fertilizer N P2O5 Zn Fe ____________________________________________ --------------------Lb/A------------------ Recommended 59 40 0 0 Applied 140 20 0.3 0
49

��������������������������������������������������������
������������������������������������������������
��������������������������������������������������������
��������������������������������������������������������
������������������������������������������������
��������������������������������������������������������
�������������������������������������������������
�������������������������������������������������
�������������������������������������������������
�������������������������������������������������
������������������������������������������
�����������������������������������
����������������������������
�����������������������������������
�����������������������������������
���������������������������������������������������������������
������������������������������������������������������
���������������������������������������������������������������
���������������������������������������������������������������
������������������������������������������������������
����������������������������
���������������������
���������������������
����������������������������
����������������������������
�����������������������������������
����������������������������
����������������������������
�����������������������������������
�������������������������������������������������
��������������������������������������������������������
������������������������������������������������
��������������
��������������������������������������������������������
������������
��������������
��������������
����������������������������
�������������������������������������������������
�������������������������������������������������
�������������������������������������������������
������������������������������������������
������������������������������������������
�������������������������������������������������
��������������������������������������������������������
���������������������������������������������������������������
������������������������������������������������������
�����������������������������������
��������������
������
���������������������
��������������
���������������������
����������������������������
���������������������
�������������� �������
�������
���������������������
�����������������������������������
Available Soil WaterIrrigated Grain Sorghum, Walsh, 2005
0
1
2
3
4
5
6
7
8
9
10
4 5 6 7 8 9 10 11 12 13 14 15 16 17 18Weeks After Planting
Available Soil Water
(in. of water/4 ft. soil depth)
������������
������������
Flowering
Depth 1 ft.Depth 2 ft.Depth 3 ft.Depth 4 ft.
Fig. 4. Available soil water in irrigated grain sorghum at Walsh. Gypsum block measurements taken to 4 ft. with 1 ft. increments. Total rainfall at Walsh from planting to first freeze was 5.37 in. Any increase in available soil water between weeks not attributed to applied irrigation is from rain.
50
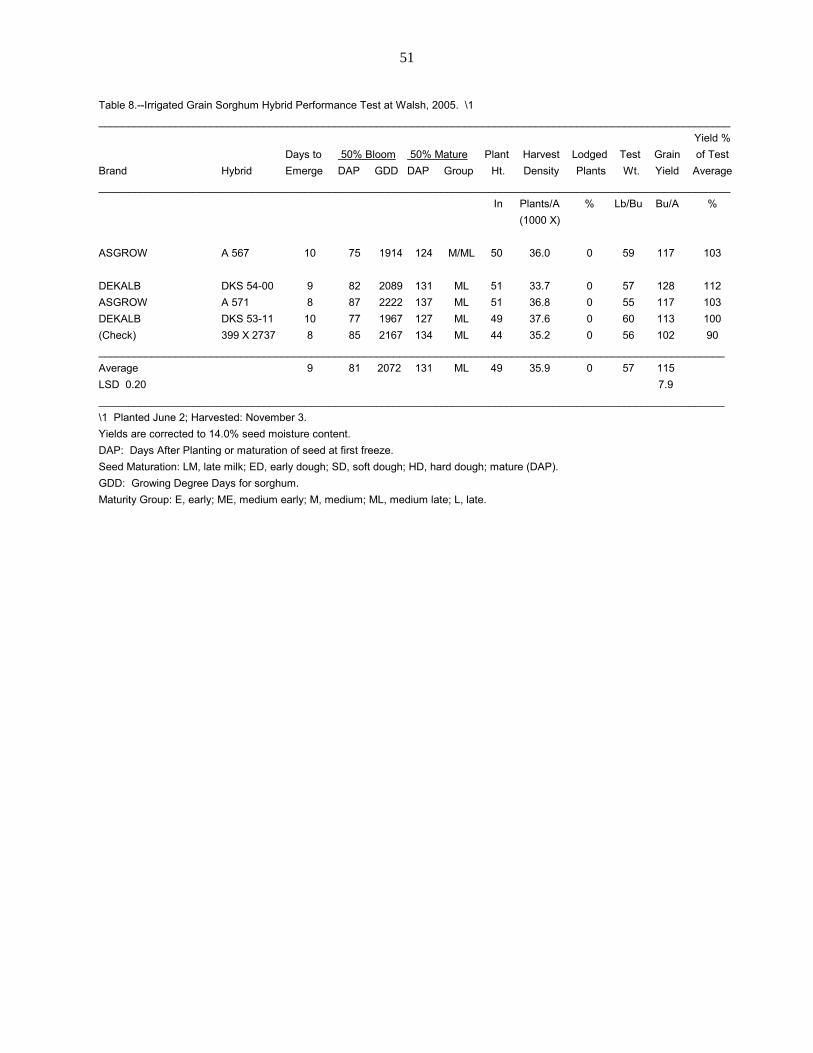
Table 8.--Irrigated Grain Sorghum Hybrid Performance Test at Walsh, 2005. \1___________________________________________________________________________________________________________
Yield %Days to 50% Bloom 50% Mature Plant Harvest Lodged Test Grain of Test
Brand Hybrid Emerge DAP GDD DAP Group Ht. Density Plants Wt. Yield Average___________________________________________________________________________________________________________
In Plants/A % Lb/Bu Bu/A %(1000 X)
ASGROW A 567 10 75 1914 124 M/ML 50 36.0 0 59 117 103
DEKALB DKS 54-00 9 82 2089 131 ML 51 33.7 0 57 128 112ASGROW A 571 8 87 2222 137 ML 51 36.8 0 55 117 103DEKALB DKS 53-11 10 77 1967 127 ML 49 37.6 0 60 113 100(Check) 399 X 2737 8 85 2167 134 ML 44 35.2 0 56 102 90__________________________________________________________________________________________________________Average 9 81 2072 131 ML 49 35.9 0 57 115LSD 0.20 7.9__________________________________________________________________________________________________________\1 Planted June 2; Harvested: November 3.Yields are corrected to 14.0% seed moisture content.DAP: Days After Planting or maturation of seed at first freeze.Seed Maturation: LM, late milk; ED, early dough; SD, soft dough; HD, hard dough; mature (DAP).GDD: Growing Degree Days for sorghum.Maturity Group: E, early; ME, medium early; M, medium; ML, medium late; L, late.
51
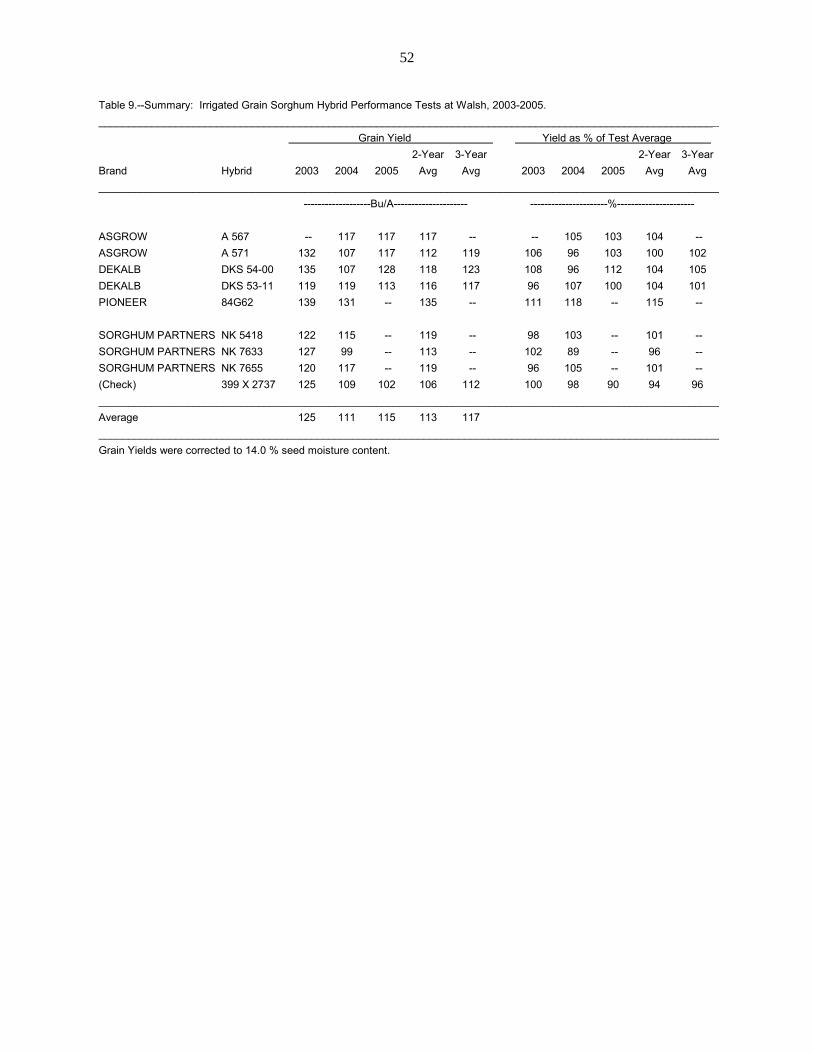
Table 9.--Summary: Irrigated Grain Sorghum Hybrid Performance Tests at Walsh, 2003-2005.__________________________________________________________________________________________________________
Grain Yield Yield as % of Test Average 2-Year 3-Year 2-Year 3-Year
Brand Hybrid 2003 2004 2005 Avg Avg 2003 2004 2005 Avg Avg__________________________________________________________________________________________________________
-------------------Bu/A--------------------- ----------------------%----------------------
ASGROW A 567 -- 117 117 117 -- -- 105 103 104 --ASGROW A 571 132 107 117 112 119 106 96 103 100 102DEKALB DKS 54-00 135 107 128 118 123 108 96 112 104 105DEKALB DKS 53-11 119 119 113 116 117 96 107 100 104 101PIONEER 84G62 139 131 -- 135 -- 111 118 -- 115 --
SORGHUM PARTNERS NK 5418 122 115 -- 119 -- 98 103 -- 101 --SORGHUM PARTNERS NK 7633 127 99 -- 113 -- 102 89 -- 96 --SORGHUM PARTNERS NK 7655 120 117 -- 119 -- 96 105 -- 101 --(Check) 399 X 2737 125 109 102 106 112 100 98 90 94 96__________________________________________________________________________________________________________Average 125 111 115 113 117__________________________________________________________________________________________________________Grain Yields were corrected to 14.0 % seed moisture content.
52

Limited Sprinkler Irrigated Grain Sorghum Hybrid Performance Trial at Walsh, 2005
COOPERATORS: Plainsman Agri-Search Foundation, and Kevin Larson, Superintendent, Plainsman Research Center, Walsh, Colorado. PURPOSE: To identify high yielding hybrids under limited sprinkler irrigated conditions with 3200 sorghum heat units in a Silty Loam soil. PLOT: Four rows with 30” row spacing, at least 1000’ long. SEEDING DENSITY: 58,000 Seed/A. PLANTED: June 2. HARVESTED: November 7.
Summary: Growing Season Precipitation and Temperature \1 Walsh, Baca County. __________________________________________________ Month Rainfall GDD \2 >90 F >100 F DAP \3 __________________________________________________ In --------No. of Days-------- June 1.16 677 17 2 28 July 1.01 878 26 8 59 August 1.90 763 17 3 90 September 0.24 642 15 0 120 October 1.06 276 3 0 148 Total 5.37 3236 78 13 148 _________________________________________________ \1 Growing season from June 2 (planting) to October 24 (first freeze, 24 F). \2 GDD: Growing Degree Days for sorghum. \3 DAP: Days After Planting.
EMERGENCE DATE: 9 days after planting. SOIL TEMP: 65 F. IRRIGATION: Sprinkler irrigated with 7.5 A-in./A, applied with five rotations. PEST CONTROL: Preemergence Herbicides: Roundup 20 Oz/A, 2,4-D 0.5 Lb/A, Atrazine 1.0 Lb/A. Post Emergence Herbicides: Banvel 4 0z/A, LoVol 5 Oz/A. CULTIVATION: Once. INSECTICIDES: None.
FIELD HISTORY: Last Crop: Corn. FIELD PREPARATION: Disc. COMMENTS: Planted in good soil moisture. Weed control was good. Below normal precipitation for the growing season with very warm temperatures throughout the season. Late freeze date. No greenbug infestation. None of the hybrids lodged. Grain yields were poor because irrigation caused late tillers to develop that did not produce mature seed. SOIL: Silty Loam for 0-8” and Silty Loam 8”-24” depths from soil analysis.
Summary: Soil Analysis. _____________________________________________________ Depth pH Salts OM N P K Zn Fe _____________________________________________________ mmhos/cm % ----------------ppm---------------- 0-8” 7.6 0.5 2.0 11 5.3 428 1.1 6.6 8”-24” 13 Comment Alka VLo Hi Hi Lo VHi Marg Adeq _____________________________________________________ Manganese and Copper levels were adequate.
Summary: Fertilization. ____________________________________________ Fertilizer N P2O5 Zn Fe ____________________________________________ --------------------Lb/A------------------ Recommended 0 20 0 0 Applied 130 40 0 0
53

�������������������������������������������������
�������������������������������������������������
�������������������������������������������������
������������������������������������������
�������������������������������������������������
�������������� ������ ������ �������
��������������
������������
������������
�������������� ������� ������
��������������������������������������������������������
��������������������������������������������������������
��������������������������������������������������������
������������������������������������������
��������������
������� ������������
������������
������� �������
������������������������������������������������
������������������������������������������
������������������������������������������ �������
������� ������
��������������������������������������������������������
��������������������������������������������������������
��������������������������������������������������������
������������������������
��������������
�������������� ������
������������
��������������
��������������������������������������������������������
������������������������������������������������
������������������������������������������������
������������������������������������������
��������������
������
�����������������������������������
�����������������������������������
��������������
������
�������
�������������
������������������������������������������
�������������������������������������������������
�������������������������������������������������
������������������������������������������ ������
������
��������������
�������������
Available Soil WaterLimited Sprinkler Irrigation Grain Sorghum, Walsh, 2005
0
1
2
3
4
5
6
7
8
9
10
4 5 6 7 8 9 10 11 12 13 14 15 16 17 18Weeks After Planting
Available Soil Water
(in. of water/4 ft. soil depth)
������������������������
FloweringIrrigation
Irrigation
Depth 1 ft.Depth 2 ft.Depth 3 ft.Depth 4 ft.
Fig. 5. Available soil water in irrigated grain sorghum at Walsh. Gypsum block measurements taken to 4 ft. with 1 ft. increments. Total rainfall at Walsh from planting to first freeze was 5.37 in. Any increase in available soil water between weeks not attributed to applied irrigation is from rain.
54

Table 10.--Limited Sprinkler Irrigated Grain Sorghum Hybrid Performance Test at Walsh, 2005. \1____________________________________________________________________________________________________
Yield %Days to 50% Bloom 50% Mature Plant Harvest Lodged Test Grain of Test
Brand Hybrid Emerge DAP GDD DAP Group Ht. Density Plants Wt. Yield Average____________________________________________________________________________________________________
In Plants/A % Lb/Bu Bu/A %(1000 X)
FONTANELLE GE 3245 9 70 1861 114 E 34 36.0 0 56 62 105
TRIUMPH TR 442 8 80 2025 126 ME 45 37.2 0 56 73 124FONTANELLE GE 4532 9 76 1937 121 ME 42 34.2 0 57 56 94MYCOGEN 1482 8 73 1890 118 ME 37 38.0 0 56 53 90MYCOGEN M 3838 9 77 1967 124 ME 40 35.0 0 57 52 87____________________________________________________________________________________________________Average 9 75 1936 121 ME 40 36.1 0 56 59LSD 0.20 2.8____________________________________________________________________________________________________\1 Planted: June 2; Harvested: November 7.Yields are corrected to 14.0% seed moisture content.DAP: Days After Planting or maturation of seed at first freeze (24 F, October 24).Seed Maturation: PM, pre-milk; EM, early milk; MM, mid-milk; LM, late milk; ED, early dough; SD, soft dough; HD, hard dough;DAP, mature.GDD: Growing Degree Days for sorghum.Maturity Group: E, early; ME, medium early; M, medium; ML, medium late; L, late.
55
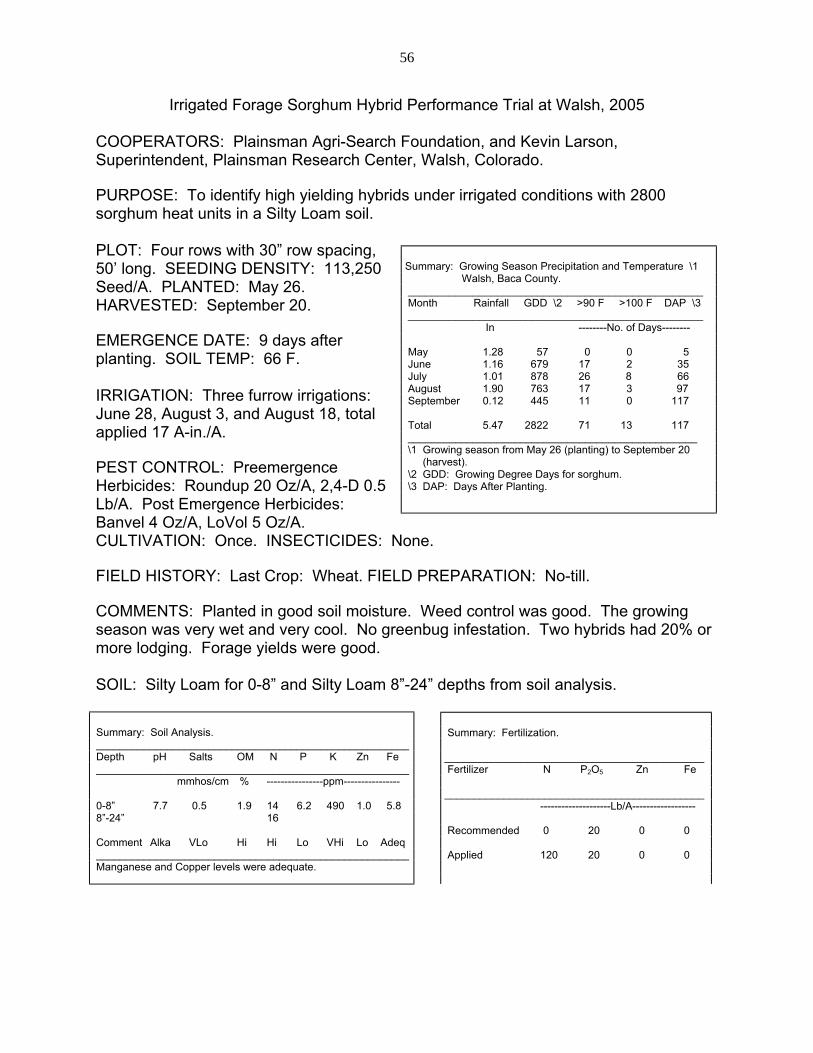
Irrigated Forage Sorghum Hybrid Performance Trial at Walsh, 2005 COOPERATORS: Plainsman Agri-Search Foundation, and Kevin Larson, Superintendent, Plainsman Research Center, Walsh, Colorado. PURPOSE: To identify high yielding hybrids under irrigated conditions with 2800 sorghum heat units in a Silty Loam soil. PLOT: Four rows with 30” row spacing, 50’ long. SEEDING DENSITY: 113,250 Seed/A. PLANTED: May 26. HARVESTED: September 20. EMERGENCE DATE: 9 days after planting. SOIL TEMP: 66 F. IRRIGATION: Three furrow irrigations: June 28, August 3, and August 18, total applied 17 A-in./A. PEST CONTROL: Preemergence Herbicides: Roundup 20 Oz/A, 2,4-D 0.5 Lb/A. Post Emergence Herbicides: Banvel 4 Oz/A, LoVol 5 Oz/A. CULTIVATION: Once. INSECTICIDES: None.
Summary: Growing Season Precipitation and Temperature \1 Walsh, Baca County. __________________________________________________ Month Rainfall GDD \2 >90 F >100 F DAP \3 __________________________________________________ In --------No. of Days-------- May 1.28 57 0 0 5 June 1.16 679 17 2 35 July 1.01 878 26 8 66 August 1.90 763 17 3 97 September 0.12 445 11 0 117 Total 5.47 2822 71 13 117 _________________________________________________ \1 Growing season from May 26 (planting) to September 20 (harvest). \2 GDD: Growing Degree Days for sorghum. \3 DAP: Days After Planting.
FIELD HISTORY: Last Crop: Wheat. FIELD PREPARATION: No-till. COMMENTS: Planted in good soil moisture. Weed control was good. The growing season was very wet and very cool. No greenbug infestation. Two hybrids had 20% or more lodging. Forage yields were good. SOIL: Silty Loam for 0-8” and Silty Loam 8”-24” depths from soil analysis. Summary: Soil Analysis. _____________________________________________________ Depth pH Salts OM N P K Zn Fe _____________________________________________________ mmhos/cm % ----------------ppm---------------- 0-8” 7.7 0.5 1.9 14 6.2 490 1.0 5.8 8”-24” 16 Comment Alka VLo Hi Hi Lo VHi Lo Adeq _____________________________________________________ Manganese and Copper levels were adequate.
Summary: Fertilization. ____________________________________________ Fertilizer N P2O5 Zn Fe ____________________________________________ --------------------Lb/A------------------ Recommended 0 20 0 0 Applied 120 20 0 0
56
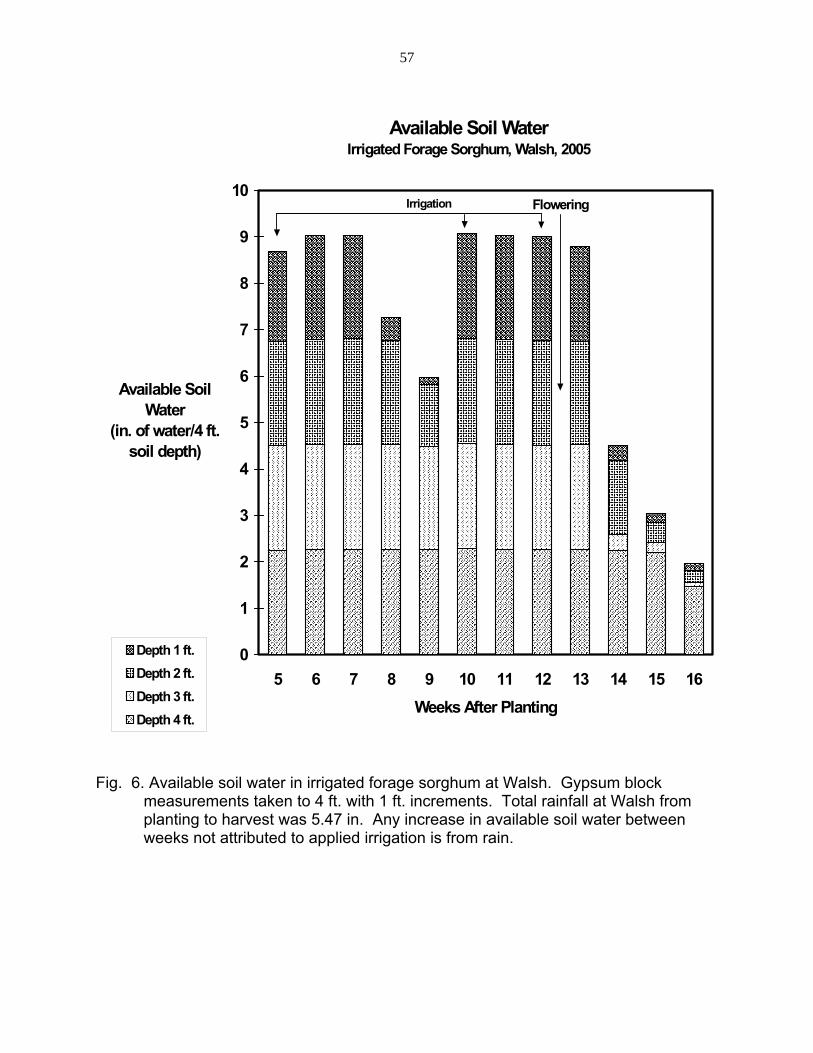
������������������������������������������������������������������������
������������������������������������������������������������������������
������������������������������������������������������������������������
����������������������������������������������������������������
����������������������������������������������������������������
����������������������������������������������������������������
������������������������������������������������������������������������
������������������������������������������������������������������������
����������������������������������������������������������������
����������������������������������������������������������������
����������������������������������������������������������������
������������������������������������������������������
������������������������������������������������������������������������
������������������������������������������������������������������������
������������������������������������������������������������������������
����������������������������������������������������������������
����������������������������������������������������������������
����������������������������������������������������������������
������������������������������������������������������������������������
������������������������������������������������������������������������
����������������������������������������������������������������
����������������
����������������
���������
������������������������������������������������������������������������
������������������������������������������������������������������������
������������������������������������������������������������������������
����������������������������������������������������������������
����������������������������������������
����������������������������������������������������������������
������������������������������������������������������������������������
������������������������������������������������������������������������
����������������������������������������������������������������
������������������������������������������������
����������������
������������������
���������������������������������������������������������������
������������������������������������������������������������������������
������������������������������������������������������������������������
����������������
����������������
����������������������������������������������������������������
������������������������������������������������������������������������
������������������������������������������������������������������������
��������������������������������������������������������
����������������
����������������
���������
Available Soil WaterIrrigated Forage Sorghum, Walsh, 2005
0
1
2
3
4
5
6
7
8
9
10
5 6 7 8 9 10 11 12 13 14 15 16Weeks After Planting
Available Soil Water
(in. of water/4 ft. soil depth)
������������������������
FloweringIrrigation
Depth 1 ft.Depth 2 ft.Depth 3 ft.Depth 4 ft.
Fig. 6. Available soil water in irrigated forage sorghum at Walsh. Gypsum block measurements taken to 4 ft. with 1 ft. increments. Total rainfall at Walsh from planting to harvest was 5.47 in. Any increase in available soil water between weeks not attributed to applied irrigation is from rain.
57
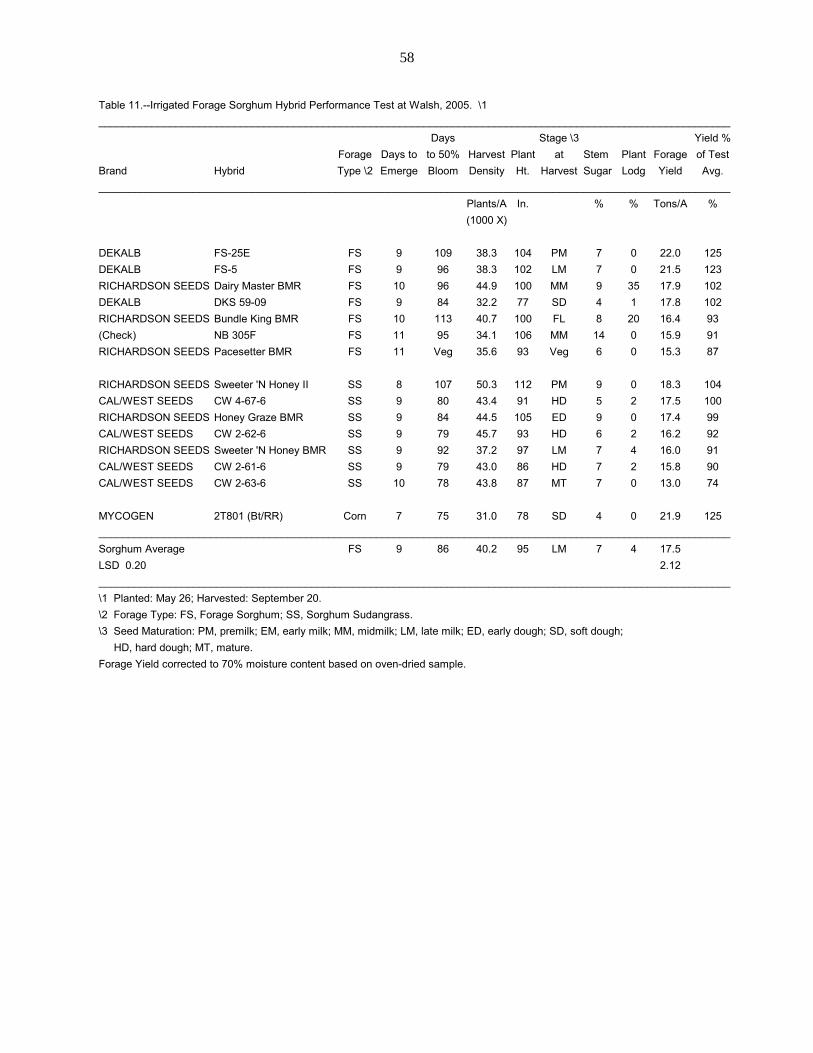
Table 11.--Irrigated Forage Sorghum Hybrid Performance Test at Walsh, 2005. \1___________________________________________________________________________________________________________
Days Stage \3 Yield %Forage Days to to 50% Harvest Plant at Stem Plant Forage of Test
Brand Hybrid Type \2 Emerge Bloom Density Ht. Harvest Sugar Lodg Yield Avg.___________________________________________________________________________________________________________
Plants/A In. % % Tons/A %(1000 X)
DEKALB FS-25E FS 9 109 38.3 104 PM 7 0 22.0 125DEKALB FS-5 FS 9 96 38.3 102 LM 7 0 21.5 123RICHARDSON SEEDS Dairy Master BMR FS 10 96 44.9 100 MM 9 35 17.9 102DEKALB DKS 59-09 FS 9 84 32.2 77 SD 4 1 17.8 102RICHARDSON SEEDS Bundle King BMR FS 10 113 40.7 100 FL 8 20 16.4 93(Check) NB 305F FS 11 95 34.1 106 MM 14 0 15.9 91RICHARDSON SEEDS Pacesetter BMR FS 11 Veg 35.6 93 Veg 6 0 15.3 87
RICHARDSON SEEDS Sweeter 'N Honey II SS 8 107 50.3 112 PM 9 0 18.3 104CAL/WEST SEEDS CW 4-67-6 SS 9 80 43.4 91 HD 5 2 17.5 100RICHARDSON SEEDS Honey Graze BMR SS 9 84 44.5 105 ED 9 0 17.4 99CAL/WEST SEEDS CW 2-62-6 SS 9 79 45.7 93 HD 6 2 16.2 92RICHARDSON SEEDS Sweeter 'N Honey BMR SS 9 92 37.2 97 LM 7 4 16.0 91CAL/WEST SEEDS CW 2-61-6 SS 9 79 43.0 86 HD 7 2 15.8 90CAL/WEST SEEDS CW 2-63-6 SS 10 78 43.8 87 MT 7 0 13.0 74
MYCOGEN 2T801 (Bt/RR) Corn 7 75 31.0 78 SD 4 0 21.9 125___________________________________________________________________________________________________________Sorghum Average FS 9 86 40.2 95 LM 7 4 17.5LSD 0.20 2.12___________________________________________________________________________________________________________\1 Planted: May 26; Harvested: September 20.\2 Forage Type: FS, Forage Sorghum; SS, Sorghum Sudangrass.\3 Seed Maturation: PM, premilk; EM, early milk; MM, midmilk; LM, late milk; ED, early dough; SD, soft dough; HD, hard dough; MT, mature.Forage Yield corrected to 70% moisture content based on oven-dried sample.
58

Table 12.--Summary: Irrigated Forage Sorghum Hybrid Performance Tests at Walsh, 2003-2005._____________________________________________________________________________________________________________
Forage Yield Yield as % of Test Average 2-Year 3-Year 2-Year 3-Year
Brand Hybrid 2003 2004 2005 Avg Avg 2003 2004 2005 Avg Avg_____________________________________________________________________________________________________________
-----------------Tons/A-------------------
AERC AERC SSH 35 19.8 7.3 -- 13.6 -- 102 48 -- 75 --BUFFALO BRAND Canex 19.8 16.4 -- 18.1 -- 102 107 -- 105 --BUFFALO BRAND Canex BMR 208 16.6 15.3 -- 16.0 -- 86 100 -- 93 --
BUFFALO BRAND Canex BMR 310 18.0 14.2 -- 16.1 -- 93 93 -- 93 --BUFFALO BRAND Canex BMR 248 19.6 14.4 -- 17.0 -- 101 94 -- 98 --BUFFALO BRAND Grazex BMR 727 20.8 13.4 -- 17.1 -- 107 88 -- 98 --
DEKALB FS-5 24.0 21.0 21.5 21.3 22.2 124 137 123 130 128DEKALB FS-25E 23.6 13.3 22.0 17.7 19.6 122 87 125 106 111DEKALB DKS 59-09 17.4 20.7 17.8 19.3 18.6 90 136 102 119 109DRUSSEL SEED DSS Dividend BMR 24.1 17.8 -- 21.0 -- 124 116 -- 120 --
SORGHUM PARTNERS NK 300 21.9 16.2 -- 19.1 -- 113 106 -- 110 --SORGHUM PARTNERS SS 405 20.6 13.1 -- 16.9 -- 106 86 -- 96 --SORGHUM PARTNERS Sordan Headless 19.9 19.7 -- 19.8 -- 103 129 -- 116 --
(Check) NB 305F 20.0 17.2 15.9 21.8 17.7 113 112 91 102 105(Check) Corn 19.3 18.7 21.9 20.3 20.0 99 122 125 124 115_____________________________________________________________________________________________________________Average 19.4 15.3 17.5 16.4 17.4_____________________________________________________________________________________________________________Forage Yields were corrected to 70% moisture content based on oven-dried sample.
59

Table 13.--Irrigated Forage Sorghum Hybrid Dry Matter Analysis at Walsh, 2005.__________________________________________________________________________________________________________
Days PlantForage to Height Net Energy
Brand Hybrid Type \1 Boot at Boot CP ADF NDF IVTD TDN RFQ Main. Gain Lact.__________________________________________________________________________________________________________
In ---------------%------------------- -----MCal/lb-----
DEKALB DKS 59-09 FS 77 53 10.7 36.8 57.4 83.0 65.0 147 0.60 0.34 0.67DEKALB FS-25E FS 100 95 10.1 37.2 58.8 80.0 62.6 134 0.60 0.34 0.64RICHARDSON SEEDS Pacesetter BMR FS Veg 96 9.3 38.3 60.3 80.7 62.1 132 0.58 0.32 0.64(Check) NB 305F FS 87 80 9.4 38.4 60.6 79.2 62.6 130 0.58 0.32 0.64RICHARDSON SEEDS Dairy Master BMR FS 88 84 5.6 40.4 64.1 79.0 63.1 128 0.54 0.29 0.65RICHARDSON SEEDS Bundle King BMR FS 103 92 6.8 38.9 62.8 78.0 62.3 125 0.57 0.31 0.64DEKALB FS-5 FS 88 80 6.2 43.2 65.5 76.3 59.6 114 0.49 0.24 0.61
RICHARDSON SEEDS Honey Graze BMR SS 77 66 10.4 37.7 57.2 82.9 64.6 147 0.59 0.33 0.66CAL/WEST SEEDS CW 2-61-6 SS 72 53 9.6 35.7 58.2 81.1 64.1 140 0.62 0.36 0.66CAL/WEST SEEDS CW 2-63-6 SS 71 58 8.2 37.1 60.4 80.4 64.7 137 0.60 0.34 0.67CAL/WEST SEEDS CW 4-67-6 SS 73 53 8.2 37.7 60.4 80.3 64.6 137 0.59 0.33 0.66RICHARDSON SEEDS Sweeter 'N Honey BMR SS 85 65 9.9 38.7 60.7 81.3 62.7 135 0.57 0.31 0.64CAL/WEST SEEDS CW 2-62-6 SS 71 59 7.8 38.1 60.9 79.8 63.4 133 0.58 0.32 0.65RICHARDSON SEEDS Sweeter 'N Honey II SS 97 89 10.2 40.7 59.4 79.0 61.3 128 0.54 0.28 0.63
MYCOGEN 2T801 (Bt/RR) Corn 71 68 10.4 36.2 59.3 77.3 61.5 124 0.61 0.35 0.63__________________________________________________________________________________________________________Sorghum Average FS 83 73 8.9 38.3 60.4 79.9 62.9 133 0.58 0.32 0.65__________________________________________________________________________________________________________\1 Forage Type: FS, Forage Sorghum; SS, Sorghum Sudangrass.Infrared analysis performed on whole plant samples taken at boot.CP, Crude Protein; ADF, Acid Detergent Fiber; NDF, Neutral Detergent Fiber; TDN, Total Digestible Nutrients;IVTD, In Vitro True Digestibility; RFQ, Relative Forage Quality; Net Energy: Maintenance, Gain, Lactation..
60

Sandbur Control, Grain Yield and Net Return of Microencapsulated Herbicides in Dryland Grain Sorghum
Kevin Larson and Dennis Thompson
Weed control is an essential component of grain sorghum production. In order to evaluate economic return of herbicide applications, it is important to consider chemical costs and grain yields. We tested three microencapsulated grass herbicides with Atrazine. Microencapsulated herbicides are advertised as providing slow release of herbicide that prolongs herbicide activity. We tested three microencapsulated grass herbicides and Atrazine on sandbur, the most prevalent grassy weed in grain sorghum in Southeastern Colorado. Materials and Methods We applied four pre-emergence herbicide treatments: Bicep Lite II Magnum 1.5 Qt/A, G-Max Lite 1.5 Qt/A, Micro-Tech 2.5 Qt/A with Atrazine 1.0 Lb/A, and Atrazine 1.0 Lb/A with three replications on Richfield Silty Loam soil. All herbicide treatments had 1.0 Lb/A of Atrazine and all were applied on June 8 at 10 Gal/A with 110o flat fan nozzles spaced 18 in. apart. We had planned to incorporate the herbicide with sprinkler irrigation immediately after spraying, but the sprinkler was down and the herbicides were not incorporated until three days later with 0.70 inches of rain. The 20 ft. by 1250 ft. plots were planted June 2 with Mycogen M3838 at 58,000 Seeds/A. To control broadleaf weeds, we sprayed Banvel 4 Oz/A and LoVol 5 Oz/A and cultivated once. Results and Discussion
All three microencapsulated herbicide treatments had significantly higher sandbur control than the Atrazine check (Table 15). Bicep Lite II Magnum was the only treatment that produced significantly higher yields than the Atrazine check (4 Bu/A more). The Atrazine check generated the highest variable net income producing at least $9.21 more than any of the microencapsulated herbicide treatments. The microencapsulated herbicide treatments cost $13.76/A to $17.68/A more than the Atrazine only treatment. The meager yield increase of the microencapsulated herbicide treatments did not justify the higher cost of these treatments compared to Atrazine alone. Since all of microencapsulated herbicide treatments produced greater sandbur control than the Atrazine check, demonstrates that not all of the herbicide was lost to the three-day incorporation delay. Herbicide efficacy would have been higher if we were able to incorporate with sprinkler irrigation immediately after herbicide application, as the Bicep II Magnum label states, “If irrigation is not possible and rain does not occur within 2 days after planting and application, weed control may be decreased.” Waiting three days after herbicide application for rain to incorporate the treatments allowed volatilization to occur and some weed control was lost. Last year when we were able to rotary-hoe incorporate after herbicide application, we produced significantly higher yields and variable net incomes than the Atrazine check (Larson, Berrada, Thompson, 2005). Literature Cited Larson, K.J., A. Berrada, D.L. Thompson. 2005. Sorghum hybrid performance trials in Colorado, 2004. Technical Report TR05-03. AES, Dept. of Soil and Crop Sciences, CSU, 49p.
61
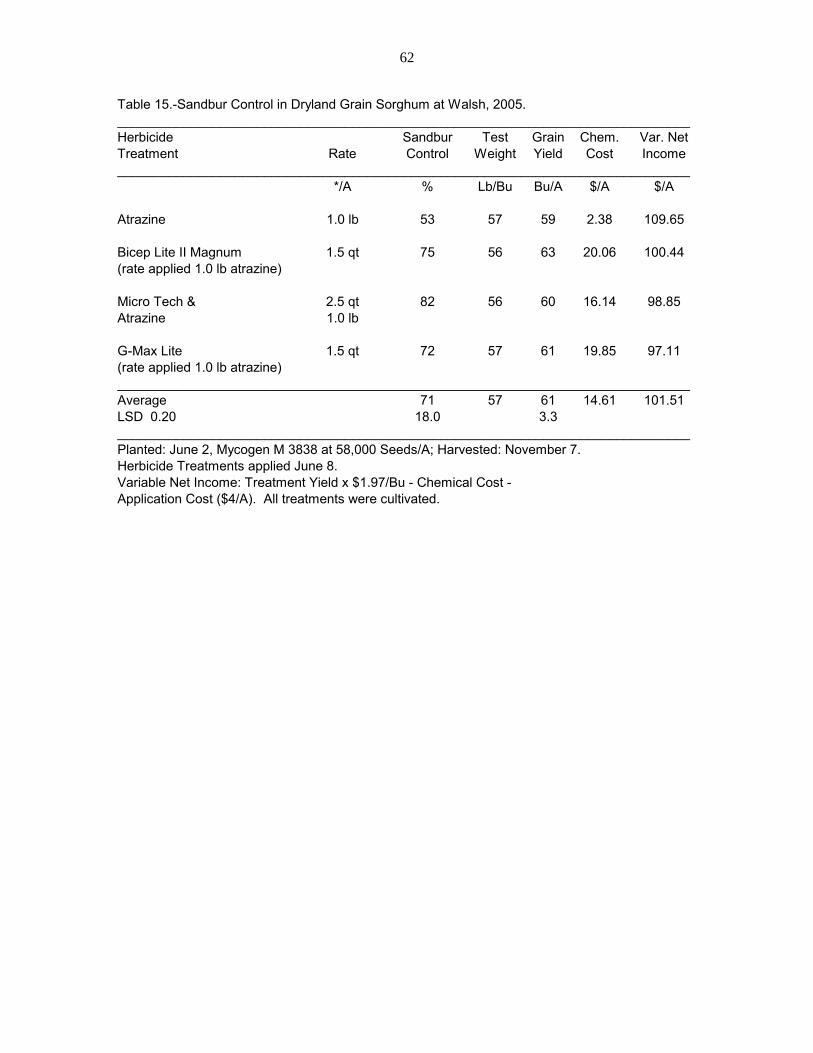
Table 15.-Sandbur Control in Dryland Grain Sorghum at Walsh, 2005.______________________________________________________________________________Herbicide Sandbur Test Grain Chem. Var. NetTreatment Rate Control Weight Yield Cost Income______________________________________________________________________________
*/A % Lb/Bu Bu/A $/A $/A
Atrazine 1.0 lb 53 57 59 2.38 109.65
Bicep Lite II Magnum 1.5 qt 75 56 63 20.06 100.44(rate applied 1.0 lb atrazine)
Micro Tech & 2.5 qt 82 56 60 16.14 98.85Atrazine 1.0 lb
G-Max Lite 1.5 qt 72 57 61 19.85 97.11(rate applied 1.0 lb atrazine)______________________________________________________________________________Average 71 57 61 14.61 101.51LSD 0.20 18.0 3.3______________________________________________________________________________Planted: June 2, Mycogen M 3838 at 58,000 Seeds/A; Harvested: November 7.Herbicide Treatments applied June 8.Variable Net Income: Treatment Yield x $1.97/Bu - Chemical Cost - Application Cost ($4/A). All treatments were cultivated.
62
Zn Fertilization of Irrigated Grain Sorghum in Southeastern Colorado Kevin Larson, Dennis Thompson, and Bill Brooks
Soil test recommendations for Southeastern Colorado typically recommend banding 2 Lb Zn/A to both dryland and irrigated grain sorghum. From our previous studies, we reported yield increases with Zn fertilization for dryland corn, but only once did dryland grain sorghum respond positively to applied Zn (Larson, Schweissing, Thompson, 2001). The one time dryland grain sorghum yields did increase with Zn fertilization was an exceptionally high rainfall, high yielding year. Since Zn increased yields under a high production environment, we decided to study the effects of Zn under irrigation. This is the fourth year of our continuing study to determine the optimum Zn rate for irrigated grain sorghum under high yielding conditions. Materials and Methods This year we tested six seedrow Zn rates: 0, 0.2, 0.4, 0.6, 0.8, and 1.0 Lb Zn/A as Zn chelate with three replications. We mixed the Zn with 5 Gal 10-34-0/A prior to application. The site was subsurface drip irrigated with 11.8 A-in./A. We planted Mycogen 1482 on June 15 at 87,100 Seeds/A. We applied 140 Lb N/A and 20 Lb P2O5/A to the site. For weed control, we sprayed Roundup 20 Oz/A, 2,4-D 0.5 Lb/A and Atrazine 1.0 Lb/A pre-emergence, and Banvel 4 Oz/A and LoVol 5 Oz/A post-emergence. We cultivated one time. The 10 ft. X 650 ft. plots were harvested with a self-propelled combine and weighed in a digital weigh cart. For each plot at harvest, we took a sample for moisture and test weight. Results and Discussion This year there was no yield response to seedrow Zn (Fig. 7). The near zero linear response indicates there was no significant yield or test weight trends with increasing Zn rates. The lack of yield and test weight response to increasing Zn rates under these high yielding irrigated production conditions suggests that there was sufficient time for the crop to mature. The test weight results from this year ranged from 57.3 to 58.2 Lb/Bu confirming that the seed fully matured. Results from our Vilas study two years ago (Larson, Schweissing, Thompson, 2004) suggested that Zn was not needed if the growing season was long enough for full seed maturation. The results from this year confirm our explanation of the role of Zn in seed maturation. Last year seedrow Zn increased both grain yield and test weight with a maximum rate of 0.8 Lb/A for grain yield and 0.6 Lb/A for test weight (Larson, Berrada, Thompson, 2005). Last year we expected a yield response to Zn because of the late planting date (July 2) and the suggested Zn role of maturity acceleration observed two years ago. In 2003, we observed maturity acceleration with increasing Zn rate; however, there was no yield response to applied Zn on irrigated grain sorghum at either of the Zn sites (Larson, Schweissing, Thompson, 2004). For the last three years of this study, we had late freeze dates (October 26, 25, and 24, respectively); however, the yield response to Zn rates varied. Planting date was the determinate factor to the response to applied Zn and seed maturation. In the years when we had a typical planting date (late May to mid June), there was no response to applied Zn. Last year when we had a late planting date (July 2) grain yields and test weights were optimized at 0.6 to 0.8 Lb Zn/A. In
63
2003, with typical planting dates (late May to mid June), we suggested that the late freeze date (October 26, 22 F) allowed all Zn rates to mature. Last year, we again had a late freeze date (October 25, 29 F), but because of our late planting date (July 2), the maturity acceleration gained with applied Zn increased both yield and test weight. The low test weights we recorded indicate that none of the Zn rates fully matured, but test weight increased with Zn rate from 51.5 Lb/Bu for the 0 lb/A Zn rate to 53.5 Lb/Bu for the 0.6 Lb/A rate. The optimum seedrow Zn rate of 0.8 Lb/A with a yield of 83 Bu/A is similar to the Zn response we recorded from the 2002 Vilas site with an optimum rate around 0.6 Lb Zn/A and a yield of 98 Bu/A (Larson, Schweissing, Thompson, 2003). This is the fourth year of our multi-year irrigated grain sorghum Zn study. The lack of Zn response we obtained this year suggests that Zn fertilizer may not be needed for high grain sorghum production when planted as late as mid June with a late first freeze date. If the growing season is long enough for full seed maturation, Zn fertilization is not necessary under high yielding irrigated conditions. If the growing season is not long enough for full maturation, seedrow Zn may increase both grain yield and test weight. In the years that we observed Zn responses, applying seedrow Zn to irrigated, high production grain sorghum produced a optimum response from 0.5 Lb/A with a typical planting date and an early first freeze date, and 0.6 to 0.8 Lb/A of Zn with a late planting date and a late first freeze date. Literature Cited Larson, K.J., F.C. Schweissing, D.L. Thompson. 2001. Sorghum hybrid performance tests in Colorado, 2000. Technical Report TR01-2. AES, Dept. of Soil and Crop Sciences, CSU, 53p. Larson, K.J., F.C. Schweissing, D.L. Thompson. 2003. Sorghum hybrid performance tests in Colorado, 2002. Technical Report TR03-1. AES, Dept. of Soil and Crop Sciences, CSU, 40p. Larson, K.J., F.C. Schweissing, D.L. Thompson. 2004. Sorghum hybrid performance trials in Colorado, 2003. Technical Report TR04-02. AES, Dept. of Soil and Crop Sciences, CSU, 51p. Larson, K.J., A. Berrada, D.L. Thompson. 2005. Sorghum hybrid performance trials in Colorado, 2004. Technical Report TR05-03. AES, Dept. of Soil and Crop Sciences, CSU, 49p.
64
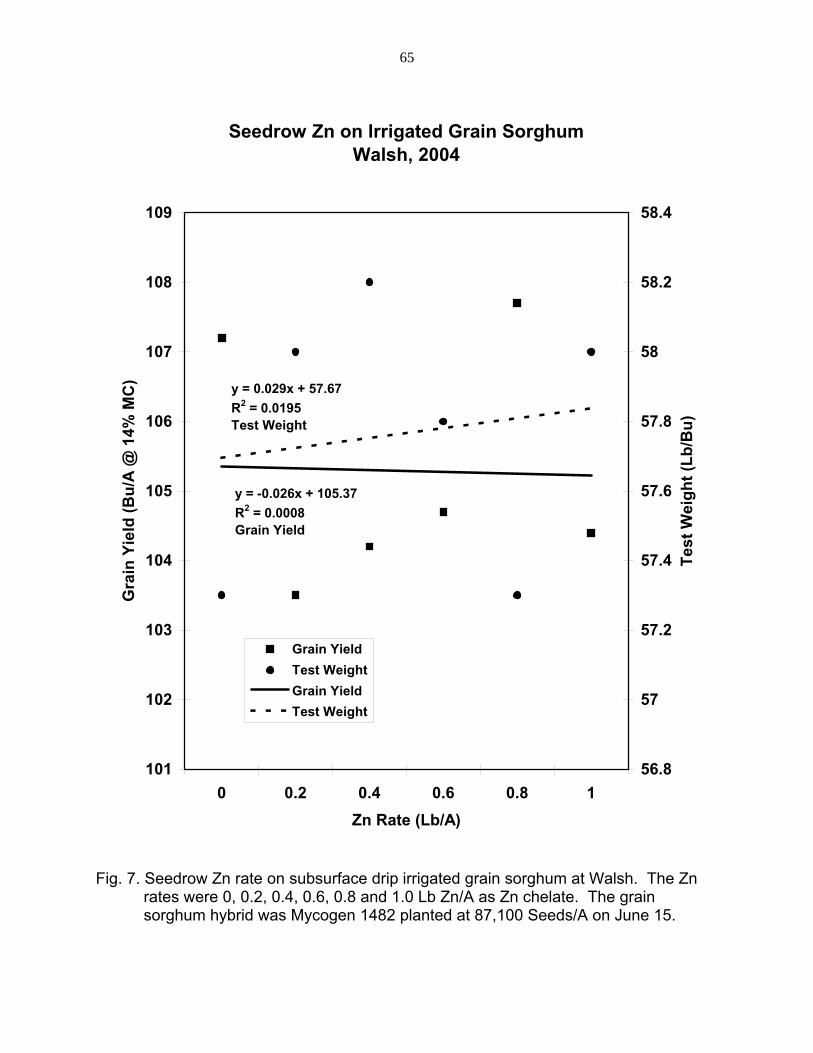
Seedrow Zn on Irrigated Grain SorghumWalsh, 2004
y = -0.026x + 105.37R2 = 0.0008Grain Yield
y = 0.029x + 57.67R2 = 0.0195Test Weight
101
102
103
104
105
106
107
108
109
0 0.2 0.4 0.6 0.8 1Zn Rate (Lb/A)
Gra
in Y
ield
(Bu/
A @
14%
MC
)
56.8
57
57.2
57.4
57.6
57.8
58
58.2
58.4
Test
Wei
ght (
Lb/B
u)
Grain YieldTest WeightGrain YieldTest Weight
Fig. 7. Seedrow Zn rate on subsurface drip irrigated grain sorghum at Walsh. The Zn rates were 0, 0.2, 0.4, 0.6, 0.8 and 1.0 Lb Zn/A as Zn chelate. The grain sorghum hybrid was Mycogen 1482 planted at 87,100 Seeds/A on June 15.
65

Long-Term, Low-Rate, Seedrow P on Dryland Grain Sorghum Kevin Larson, Dennis Thompson and Calvin Thompson
Banding P fertilizer with the seed at planting (seedrow placement) has proven to be a very effective P fertilizing method for dryland grain sorghum in the high lime, high alkaline soils of Southeastern Colorado. For these alkaline soils, the P fertilizer of choice for seedrow placement is liquid 10-34-0. The most common seedrow P rate for dryland grain sorghum is 5 Gal/A of 10-34-0 which contains 20 Lb P2O5 and 6 Lb N/A. High rates of seedrow N are reported to cause N salt toxicity, which lowers germination (Mortvedt, 1976). Nonetheless, a low to moderate, nontoxic level of seedrow N is reported to increase yields (Larson, Schweissing, Thompson, 2000). This is the third crop year of our long-term study testing low seedrow P rates to determine if low rates applied on the same site for multiple years will maintain high grain sorghum yields. Materials and Methods We tested four rates of poly ammoniated phosphate (10-34-0) fertilizer banded with the grain sorghum seed (seedrow applied) on 30 in. row spacing in an alkaline Silty Clay Loam soil. The four rates were 0, 1.25, 2.5, and 5.0 gallons of 10-34-0/A, corresponding to 0, 5, 10, and 20 Lb P2O5/A. The fertilizer was applied with a squeeze pump at 5 Gal/A and all fertilizer rates were diluted with water to their appropriate levels. These seedrow P treatments were applied to the same plot site for all three years of the study. The study was design as a continuous grain sorghum rotation; however, dry weather prevented planting during 2002 and 2004. Therefore, the study resembled a sorghum-fallow rotation because of the dry years. Prior to planting, the soil was sampled at six random locations at 0 to 8 in. (surface) and 8 to 24 in. (subsurface) depths. The soil was sent to Colorado State University Soil Testing Lab for analysis. Their soil test recommendation for all three years for 50 Bu/A yield goal was banding 20 Lb P2O5/A. For the first year, the grain sorghum hybrid was CARGILL 627 planted at 40,000 Seed/A on June 7, 2001. For the second year and third years, the grain sorghum hybrid was MYCOGEN 1482 planted at 40,000 Seed/A on June 17, 2003 or June 15, 2005. We harvested the 10 ft. by 500 ft. plots from early October to mid November with a self-propelled combine with a four-row crop header, and we weighed the grain in a digital scale cart. Grain yields were adjusted to 14% seed moisture content. Results and Discussion The first year of our long-term, low-rate seedrow P study (2001) there was no significant yield difference from any of the fertilizer treatments (Fig. ). The check, without seedrow applied P fertilizer, produced the highest yield. In fact, there was a nonsignificant trend of reduced yields with increasing seedrow P rates (R2 = 0.561 NS). The low, nonsignificant, coefficient of variation (R2) indicates a random yield response to seedrow applied P. For the second crop year (2003), all seedrow P treatments produced higher yields than the no P check (Fig. 10). There was a significant trend toward an optimum seedrow P rate of around 10 Lb P2O5/A, one half the recommended banded P rate (P > 0.10). For the third crop year (2005), there was a linear trend of increasing yield with increasing seedrow P rates (P > 0.10). By the third crop year, the
66

highest yield occurred at the highest P rate, 20 Lb P2O5/A, the recommended banded rate, which we interpreted as the end year for low P rates in maintaining highest grain sorghum yield. Results from this study suggest that applying the same P rates to the same plots provides high grain sorghum yields for two crop years with applied P rates lower than the recommended banded P rate. We found that the first crop year no seedrow P was needed, the second crop year only half the recommended banded P rate was needed, but by the third crop year the recommended P rate was needed for optimum grain sorghum yields. Throughout the three crop years of this study, there has been an increase in yield response to applied P rates (Fig. ). This P rate yield response indicates a continual decline of soil P. One of the objectives of this study was to determine how long low rates of seedrow P could maintain high grain sorghum yields. It appears that only two grain sorghum crops can produce high crop yields with seedrow P rates less than the recommended banded P rate. By the third crop year, the recommended banded P rate must be applied to maintain high crop yields. The efficacy of low P seedrow rates obtained from the first two crop years indicates that low P rates are effective, at least in the short term; however, by the third crop year, the recommended banded P rate is required for optimum grain sorghum yields. More P is removed with grain than is added from rates below 20 Lb P2O5/A level: a 40 Bu/A sorghum grain crop removes about 18 Lb P2O5/A (extrapolated from Leonard and Martin, 1963). Since more P is removed with grain than is added using these low P rates, after two crop years the use of low P rates did not maintain high yields because the available soil P pool in these low P soils was depleted. Literature Cited Larson, K.J., F.C. Schweissing, D.L. Thompson. 2000. Sorghum hybrid performance tests in Colorado, 1999. Technical Report TR00-1. AES, Dept. of Soil and Crop Sciences, CSU. 47p. Leonard, W. H. and J. H. Martin. 1963. Cereal Crops. MacMillan Publishing Co., New York, New York. pp. 789-791. Mortvedt, J. J. 1976. Band fertilizer placement - how much and how close? Fert. Solns. 20(6): 90-96.
67

Long Term Seedrow P Rates on Grain SorghumFirst, Second, and Third Crops (2001, 2003, & 2005)
y = -1.01x + 75.7R2 = 0.5612001
2003y = -2.18x2 + 11.89x + 53.98R2 = 0.836
2005y = 0.81x + 49.4R2 = 0.909
45
50
55
60
65
70
75
80
0 5 10 20P Rate (Lb P2O5/A)
Grain Yield (Bu/A @ 14% MC)
2001
2003
2005
Fig. 8. Grain yield from three crop years of long term, low seedrow P rates on a dryland
grain sorghum-fallow rotation at Walsh. The P rates were applied to the same plots all three crop years: 2001, 2003, and 2005.
68
Skip-Row Planting for Dryland Grain Sorghum and Corn Production Kevin Larson and Dennis Thompson
Skip-row planting is an old idea that is being revitalized for dryland row crop production in the drier areas of the High Plains. The two main advantages of skip-row planting compared to solid planting are reported to be late-season water availability from water stored in the skip-row (Klein, et al., 2005) and less down the row input costs (Jost and Brown, 2001). The crop emphasis for skip-row has shifted from cotton and grain sorghum to glyphosate-resistant corn and soybean crops, because the glyphosate-resistant crops provide simple weed management and moisture conservation of the skip-row area. Materials and Methods The site used for this study was previously in a wheat-grain sorghum-fallow rotation. Our three skip-row treatments were: 1) all rows planted (sorghum, 35,000 Seeds/A; corn, 16,000 Seeds/A), 2) skip row/plant row (sorghum, 17,500 Seeds/A; corn, 8,000 Seeds/A), and 3) skip row/plant two rows (sorghum, 21,900 Seeds/A; corn, 10,000 Seeds/A). We planted the corn hybrid, Mycogen 2K541, on May 17 and the grain sorghum hybrid, Mycogen M3838, on June 17. We applied N at 70 Lb/A and we seedrow applied P at 20 Lb P2O5/A to the grain sorghum and corn studies. For preplant weed control, we sprayed Roundup Ultra at 24 Oz/A and Atrazine 1.0 Lb/A to both the corn and grain sorghum sites, and for post emergence control we applied Roundup Ultra at 24 Oz/A to the corn site and Banvel 4 Oz/A and LoVol 5 Oz/A to the grain sorghum site. We harvested the grain sorghum on November 16 and the corn on September 27 with a self-propelled combine and weighed them in a digital scale cart. Grain yields were adjusted to 14% seed moisture for grain sorghum and 15.5% seed moisture for corn. Results and Discussion For sorghum, the skip row/plant two rows treatment produced significantly more yield than planting all rows, and the skip row/plant row treatment was not quite significantly higher than planting all rows (Table 20). For corn, the skip row/plant row treatment produced significantly more than planting all rows (Table 21). There was no difference between skip row/plant two rows and all rows planted for corn. Even though there was a significant difference between skipping alternate rows and planting all rows for corn, the low yield (3.2 Bu/A was the highest yield obtained for corn) would not justify harvest cost. This is contrary to the results from a dryland skip-row corn study conducted in Western Nebraska were they reported a 13 Bu/A increase with the skip two/plant two treatment compared to the all rows planted check (Klein, et al., 2005).
For our corn study, skipping alternate rows helped; however, there was insufficient moisture in July to mid August to produce a profitable grain harvest even with the additional moisture stored in the skip row. This suggests than dryland corn is dependent on July to mid August rainfall. If July to mid August rains are inadequate, then corn production suffers regardless of stored moisture at planting. There was approximately 9 to 11 inches of water available for corn growth from stored moisture and rainfall from planting through July (flowering). Apparently, corn uses approximately
69
9 to 11 inches of rain to reach its vegetative threshold since the corn crop had just enough moisture to begin grain production (11.3” if all rainfall and stored moisture is available and 9.04” if 80% of the moisture is available: May 2.22”, June 1.16”, July 1.01”; and stored estimated at 6.9”). The 20 Bu/A yield average for the grain sorghum demonstrates that grain sorghum has a lower water requirement for its vegetative threshold than corn. The moisture stored with skip-row contributed to higher grain sorghum yields: the skip row/plant two rows treatment produced 3 Bu/A more than planting all rows. Seeding density was also decrease with skip-row compared to planting all rows, 21,900 Seeds/A for skip row/plant two rows compared to 35,000 Seeds/A for all rows planted. Some of the yield increase with skip-row may be attributed to adjusting population density to moisture conditions. Seeding density manipulation may be as important as skip-row patterns for sustaining yields during dry weather. Next year we will lower the seeding densities of solid planting to the seeding densities obtained with skip-row.
Skip-row planting is not a new idea. For many years, cotton growers in Texas have used skip-row to take advantage of government programs. The skip-row area was considered set-aside acres and only the cotton in the planted rows was counted as production acres. This has caused a potential insurance problem with skip-row plantings for other row crops because only 20 inches on each side of the planted row is considered planted area (Little, 2002). Only the crop area that is considered planted is insurable; therefore, insurance coverage is dependent on growers’ skip-row planting patterns. With an alternate skip row pattern on 40 in. rows, only 50% of the field is considered planted and insurable. Before planting row crops in a skip-row pattern, we recommend that growers consult with their FSA office for further details on this issue. Literature Cited Jost, P.H. and S.M. Brown. March 2001. Skip row cotton – a cost savings concept.
Georgia Cotton Newsletter, March 28, 2001. http://www.griffin.peachnet.edu/caes/cotton/cnl32801.pdf.
Klein, R.N., J.A. Golus, D. Baltensperger, R. Elmore, S. Knezevic, D. Lyon, S. Mason,
L. Nelson, A. Pavlista, A.J. Schlegel, C. Shapiro, and M. Vigil. November 9, 2005. Skip-row corn for improved drought tolerance in rainfed corn. (Presentation and handout) Presented at the ASA-CSSA-SSSA International Annual Meetings (November 6-10, 2005), Salt Lake City, Utah. http://crops.confex.com/crops/2005am/techprogram/P3948.htm.
Little, J. (Signed). December, 2002. Skip row and strip crops. EPA Federal Register,
December, 2002. www.epa.gov/fedrgstr/EPA-IMPACT/2002/December/Day-03/i30702.htm.
70

Table 20.-Dryland Grain Sorghum Skip-Row Study, Walsh 2005._________________________________________________________________
No. of Rows Seeding Seed Test GrainSkip Row Treatment Harvested Density Moisture Weight Yield_________________________________________________________________
Seeds/A % Lb/Bu Bu/A(1000 X)
Plant all rows 8 35.0 10.6 57.0 18Skip row, plant two rows 5 21.9 12.2 59.5 21Skip row, plant row 4 17.5 12.5 60.0 20_________________________________________________________________Average 24.8 11.8 58.8 20LSD 0.20 2.1_________________________________________________________________Planted: June 17 with Mycogen M 3838; Harvested: November 16.
Table 21.-Dryland Corn Skip-Row Study, Walsh 2005._________________________________________________________________
No. of Rows Seeding Seed Test GrainSkip Row Treatment Harvested Density Moisture Weight Yield_________________________________________________________________
Seeds/A % Lb/Bu Bu/A(1000 X)
Plant all rows 8 16.0 15.1 51.0 0.4Skip row, plant two rows 5 10.0 16.1 52.2 0.6Skip row, plant row 4 8.0 16.8 52.0 3.2_________________________________________________________________Average 11.3 16.0 51.7 1.4LSD 0.20 0.22_________________________________________________________________Planted: May 17 with Mycogen 2K541; Harvested: September 27.
71

Strip-Till for Dryland Grain Sorghum Production, 2005 Kevin Larson and Dennis Thompson
Growers are converting to strip-till at a rapid rate for both irrigated and dryland row crop production in Southeastern Colorado. Strip-till is a modified no-till system where a single tillage operation is used to knife in fertilizers. Since fertilizers are inserted into the soil, anhydrous, the least expensive form of N, can be used. The deep placement of fertilizers also allows greater availability throughout the growing season for immobile nutrients such as P. We have studied the effects of strip-till placement of fertilizers on irrigated row crops, but this is our first study with strip-till on dryland row crops. Materials and Methods For the Strip-Till N and P treatment, Dick Gerber used an eight-row with 30 in. row spacing, DMI strip-till implement and applied 70 Lb N/A as anhydrous and 5 Gal/A of 10-34-0 six inches deep on March 4 into a wheat stubble field. Four strips were left untilled. To these untilled strips, we streamed on 28-0-0 at 70 Lb N/A with 18 in. spacings on March 22 and planter applied 5 Gal 10-34-0/A on March 30 to a depth of 3 to 4 inches for the Surface N and Planter P treatment. We planted the site with Mycogen 1482 at 35,000 Seeds/A on June 3. For weed control, we sprayed Atrazine 1.0 Lb/A, Banvel 3 Oz/A, LoVol 6 at 4 Oz/A, and COC 32 Oz/A and we cultivated once. We harvested the study on November 11 with a self-propelled combine and weighed the plots in a digital scale cart. We adjusted the grain yields to 14% seed moisture content. Results and Discussion The Strip-Till N and P treatment produced significantly more yield than the Surface N and Planter P treatment (P > 0.20). However, the yields for this study were very low (10 to 12 Bu/A), too low to compensate for the fertilizer expense. We cannot explain the low yields obtained in this study. This is not the first time that we have been disappointed by the production from this field. We have tried ripping with the thought that compaction was limiting production in this field. Ripping did not help. We thought that strip-till would raise the yield level in this field. It raised it some, but not enough to pay for the expense. This winter, we applied 15 tons/A of feedlot manure hoping the manure would act as the needed soil amendment and raise the production level of this field. We hope we are right; we will keep posted.
72

Table .Strip-Till N and P and Surface N and Planter P on Dryland Grain Sorghum, 2005.
________________________________________________ Test Grain
N Placement P2O5 Placement Weight Yield ________________________________________________
Lb/Bu Bu/A Strip-Till, 70 Lb/A Strip-Till, 20 Lb/A 54.8 12 Surface, 70 Lb/A Planter, 20 Lb/A 55.5 10 ________________________________________________ LSD 0.20 1.4 ________________________________________________ Grain Yield adjusted to 14% seed moisture content.
73

Strip-Till N and P and Surface N and Planter P Comparison for Sprinkler Irrigated Grain Sorghum and Corn Production
Kevin Larson and Dennis Thompson
Strip-till is a new tillage system being adopted by many row crop producers in Southeastern Colorado. It is a modified no-till system with one tillage operation used for fertilizer placement. The crop is planted into the same rows where tillage occurred and where the fertilizer was placed. In this study we compared strip-till placement of anhydrous N and liquid P to surface applied liquid N and planter P for both sprinkler irrigated grain sorghum and corn production.
Materials and Methods
The previous crop at this site was corn. We applied N at 130 Lb/A and P at 40 Lb P2O5/A to the grain sorghum, and 160 Lb N/A and 60 Lb P2O5/A to the corn for both the Strip-till N and P and Surface N and Planter P treatments. The N for the strip-till treatment was anhydrous, and for the surface-applied treatment we used liquid 32-0-0. The P treatment was applied 6 inches deep with the strip-till implement and 3 inches deep with a planter before planting. We strip-tilled the N and P for the Strip-till N and P treatment on March 4. For the Surface N and Planter P treatment, we surface applied N on March 18 in 18-inch spaced streams, and on March 30 we applied the P with a planter into the untilled strips. We planted two corn hybrids, Pioneer 33B54 and Mycogen 2T801, at 29,000 Seeds/A on May 5, and we planted two grain sorghum hybrids, Mycogen M3838 and Triumph TR 442, at 58,000 Seeds/A on June 2. For weed control, we sprayed preplant Balance 2.0 Oz/A and Atrazine 1.0 Lb/A to the corn site, and preplant Atrazine 1.0 Lb/A and post emergence Banvel 4 Oz/A and LoVol 5 Oz/A to the grain sorghum site. The site was sprinkler irrigated with the corn receiving 18.0 in./A of water and the grain sorghum receiving 7.5 in./A of water. We harvested the grain sorghum on November 8 and the corn on October 17 with a self-propelled combine and weighed them in a digital scale cart. Grain yields were adjusted to 14% seed moisture for grain sorghum and 15.5% seed moisture for corn. Results
For both grain sorghum and corn, Strip-till N and P produced significantly more yield than Surface N and Planter P (P > 0.20) (Table 16 and Table18). There was a significant yield difference between the grain sorghum hybrids (Table 17), and the corn hybrids (Table 19). There was no interaction between the hybrids and the N and P placement treatments: both the hybrids for the corn and grain sorghum responded similarly to Strip-till N and P and Surface N and Planter P treatments. Plant densities were similar between hybrids and between N and P fertilizer placements.
Discussion
The advantages of strip-till compared to no-till are the use of anhydrous N fertilizer (the least expensive form of N fertilizer), deeper and more readily available placement of immobile nutrients, potential compaction alleviation, and early planting from enhanced soil warming (Jasa, 2003). The disadvantages of strip-till compared to no-till are the horsepower and fuel use requirements for injecting fertilizers with knives
74

or subsoiler shanks and the potential of drying the soil when planting and the strip-till operations are temporally close.
This is the second year of our study on strip-till. This year we applied both N and P with a strip-till implement and compared it to surface applied N and planter applied P. Last year we investigated N only and compared strip-till placement of N to surface-applied N. Last year the strip-till N produced the same yield as surface N for grain sorghum, while corn produced more yield with surface N than with strip-till N. This year the strip-till placement of both N and P produced significantly higher yield than surface N and planter P placement for both corn and grain sorghum. Since we observed no grain sorghum yield difference between strip-till N and surface N last year and this year there was a significant yield increase with strip-till when both N and P were applied together, we conclude that the deep placement of P obtained with strip-till may be responsible for the yield increase.
Last year we believed that one of the disadvantages of strip-till, drying of the soil, caused the corn yield reduction of strip-till N compared to surface applied N. There was only about 18 in. of moisture in the soil profile at corn planting and the extra soil moisture loss from strip-tilling may have lowered corn yield. The short temporal space between the strip-till application and the corn planting date (three weeks) did not allow sufficient time and moisture to occur. A report comparing spring strip-till N, performed in April, to no-till N found no significant difference between corn yields; however, there was a significant yield difference between winter strip-till N, performed in January, to no-till N (Olsen, 2004). Last year we expected that corn and grain sorghum yields would be unaffected by N placement since N is a mobile nutrient. Therefore, it was no surprise that grain sorghum yields were identical for both strip-till N and surface applied N. The lack of yield response of grain sorghum to strip-till N and surface applied N was also reported for dryland grain sorghum in Northwest Kansas (Olsen, 2004).
The yield advantage obtained this year with deep placement of N and P using strip-till compared to surface N and planter P placement demonstrates the importance of P availability with deep placed P. With shallow P placement, such as seedrow placement, P fertilizer is only available when the surface is wet, such as after a rain or irrigation. With deep placement of P fertilizer, available moisture and thus P availability trends to be greater with soil depth. There appears to be no benefit from strip-till placement of N compared to surface applied N, but making P (and other immobile nutrients) more available throughout the season with strip-till placement appears to increase yield. Literature Cited Jasa, P.J. 2003. Conservation tillage systems. CE, University of Nebraska, Lincoln, Nebraska. 10p. Accessed: December 2004. http://agecon.okstate.edu/isct/labranza/jasa/tillagesys.doc. Olsen, B. 2004. Results from 2004 fall field day. CE, AES, Dept. of Agonomy, Kansas State University, Manhattan, Kansas. 4p. Accessed: December 2004. http://www.oznet.ksu.edu/agronomy-block2/fallfieldday2004.pdf.
75

Table 16. -Sprinkler Irrigated Grain Sorghum, Strip-Till vs. Surface N and Planter P, 2005.__________________________________________________________________________
50% Flowering Plant Test GrainN and P Placement Date Density Weight Yield__________________________________________________________________________
Plants/A Lb/Bu Bu/AX 1000
Strip-Till (knifed N and P) 19-Aug 34.7 57 65Surface N and Planter P 19-Aug 37.5 56 60__________________________________________________________________________Average 19-Aug 36.1 56.5 63LSD 0.20 2.2__________________________________________________________________________Strip-Till N (130 Lb/A) and P (40 Lb P2O5/A) applied March 4.Surface N (130 Lb/A) applied March 18; Planter P (40 Lb P2O5/A) applied March 30.Planted: June 2 at 58,000 Seeds/A; Harvested: November 8.Total applied sprinkler irrigation: 7.5 in./A.
Table 17.-Sprinkler Irrigated Grain Sorghum Response to Fertilizer Placement, 2005.__________________________________________________________________________
50% Flowering Plant Test GrainHybrid Date Density Weight Yield__________________________________________________________________________
Plants/A Lb/Bu Bu/AX 1000
TRIUMPH TR 442 21-Aug 37.2 57 74MYCOGEN M 3838 18-Aug 35.0 56 52__________________________________________________________________________Average 19-Aug 36.1 56.5 63LSD 0.20 1.1__________________________________________________________________________N at 130 Lb/A applied strip-till and surface streamed.P at 40 Lb P2O5/A applied strip-till and planter.Planted: June 2 at 58,000 Seeds/A; Harvested: November 8.Total applied sprinkler irrigation: 7.5 in./A.
76

Table 18.-Sprinkler Irrigated Corn, Strip-Till vs. Surface N and Planter P, 2005._______________________________________________________________________
50% Silking Plant Test GrainN and P Placement Date Density Weight Yield_______________________________________________________________________
Plants/A Lb/Bu Bu/AX 1000
Strip-Till (knived N and P) 24-Jul 26.0 59 125Surface N and Planter P 24-Jul 27.4 59 117_______________________________________________________________________Average 24-Jul 26.7 59 121LSD 0.20 8.3_______________________________________________________________________Strip-Till N (160 Lb N/A) and P (60 Lb P2O5/A) applied March 4.Surlace N (160 Lb N/A) applied March 18; Planter P (60 Lb P2O5/A) applied March 30.Planted: May 5 at 29,000 Plants/A; Harvested: October 17.Total applied sprinkler irrigation: 18.0 in./A.
Table 19.-Sprinkler Irrigated Corn, Hybrid Response to N and P Placement, 2005._______________________________________________________________________
50% Silking Plant Test GrainHybrid Date Density Weight Yield_______________________________________________________________________
Plants/A Lb/Bu Bu/AX 1000
PIONEER 33B54 24-Jul 26.4 60 129MYCOGEN 2T801 24-Jul 27.0 58 113_______________________________________________________________________Average 24-Jul 26.7 59 121LSD 0.20 3.8_______________________________________________________________________N at 160 Lb/A applied strip-till and surface streamed.P at 60 Lb P2O5/A applied strip-till and planter.Planted: May 5 at 29,000 Plants/A; Harvested: October 17.Total applied sprinkler irrigation: 18.0 in./A.
77
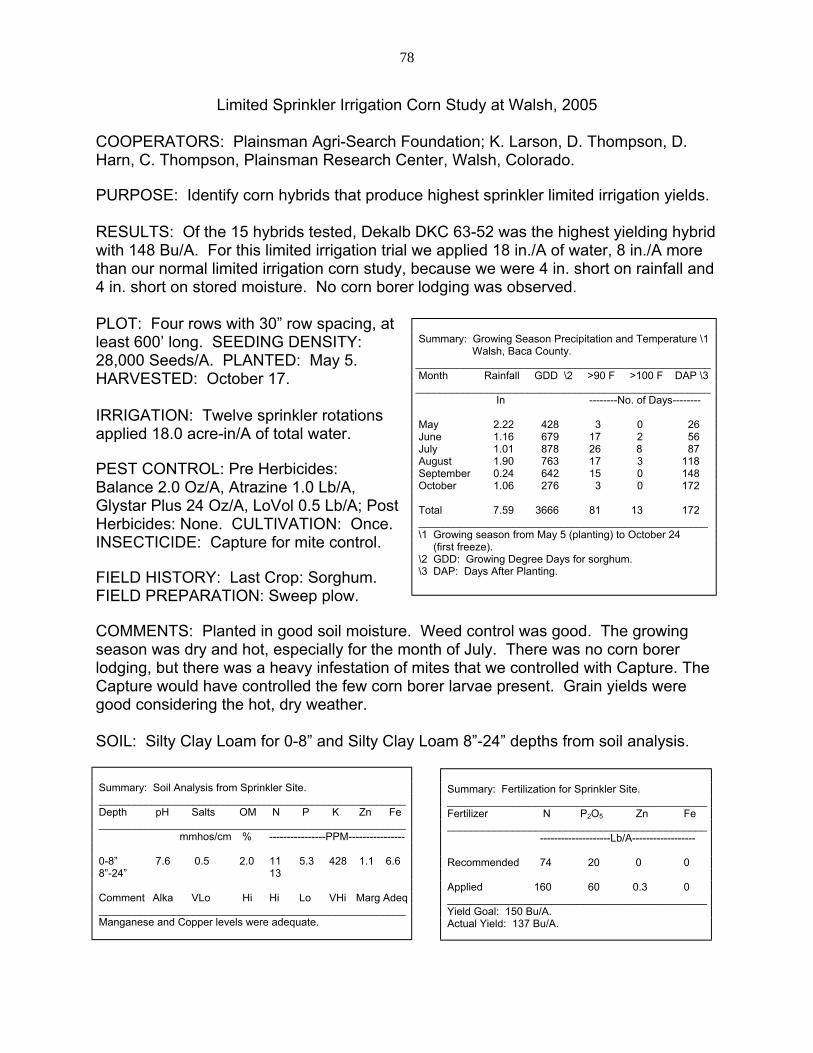
Limited Sprinkler Irrigation Corn Study at Walsh, 2005 COOPERATORS: Plainsman Agri-Search Foundation; K. Larson, D. Thompson, D. Harn, C. Thompson, Plainsman Research Center, Walsh, Colorado. PURPOSE: Identify corn hybrids that produce highest sprinkler limited irrigation yields. RESULTS: Of the 15 hybrids tested, Dekalb DKC 63-52 was the highest yielding hybrid with 148 Bu/A. For this limited irrigation trial we applied 18 in./A of water, 8 in./A more than our normal limited irrigation corn study, because we were 4 in. short on rainfall and 4 in. short on stored moisture. No corn borer lodging was observed. PLOT: Four rows with 30” row spacing, at least 600’ long. SEEDING DENSITY: 28,000 Seeds/A. PLANTED: May 5. HARVESTED: October 17.
Summary: Growing Season Precipitation and Temperature \1 Walsh, Baca County. __________________________________________________ Month Rainfall GDD \2 >90 F >100 F DAP \3 __________________________________________________ In --------No. of Days-------- May 2.22 428 3 0 26 June 1.16 679 17 2 56 July 1.01 878 26 8 87 August 1.90 763 17 3 118 September 0.24 642 15 0 148 October 1.06 276 3 0 172 Total 7.59 3666 81 13 172 _________________________________________________ \1 Growing season from May 5 (planting) to October 24 (first freeze). \2 GDD: Growing Degree Days for sorghum. \3 DAP: Days After Planting.
IRRIGATION: Twelve sprinkler rotations applied 18.0 acre-in/A of total water. PEST CONTROL: Pre Herbicides: Balance 2.0 Oz/A, Atrazine 1.0 Lb/A, Glystar Plus 24 Oz/A, LoVol 0.5 Lb/A; Post Herbicides: None. CULTIVATION: Once. INSECTICIDE: Capture for mite control. FIELD HISTORY: Last Crop: Sorghum. FIELD PREPARATION: Sweep plow. COMMENTS: Planted in good soil moisture. Weed control was good. The growing season was dry and hot, especially for the month of July. There was no corn borer lodging, but there was a heavy infestation of mites that we controlled with Capture. The Capture would have controlled the few corn borer larvae present. Grain yields were good considering the hot, dry weather. SOIL: Silty Clay Loam for 0-8” and Silty Clay Loam 8”-24” depths from soil analysis.
Summary: Soil Analysis from Sprinkler Site. ____________________________________________________ Depth pH Salts OM N P K Zn Fe ____________________________________________________ mmhos/cm % ----------------PPM---------------- 0-8” 7.6 0.5 2.0 11 5.3 428 1.1 6.6 8”-24” 13 Comment Alka VLo Hi Hi Lo VHi Marg Adeq ____________________________________________________ Manganese and Copper levels were adequate.
Summary: Fertilization for Sprinkler Site. ____________________________________________ Fertilizer N P2O5 Zn Fe ____________________________________________ --------------------Lb/A------------------ Recommended 74 20 0 0 Applied 160 60 0.3 0 ____________________________________________ Yield Goal: 150 Bu/A. Actual Yield: 137 Bu/A.
78
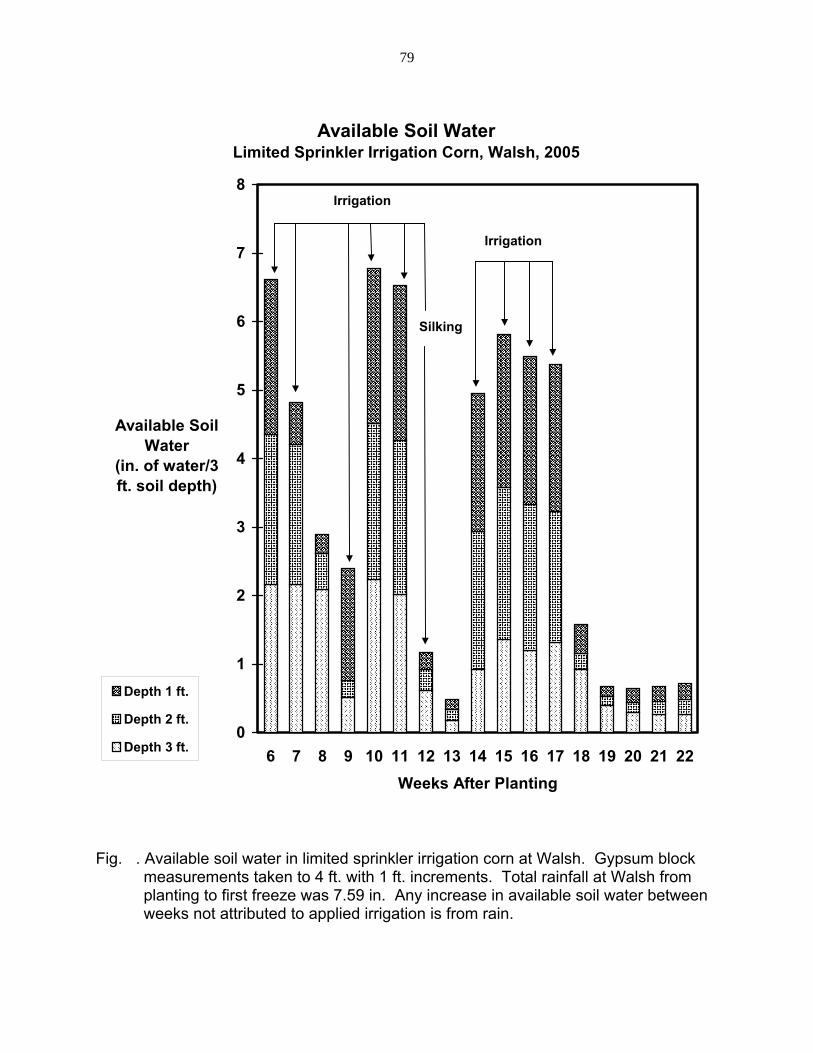
������������������������������������������������������������������
������������������������������������������������������������������
������������������������������������������������������������������
������������������������
������������������������������������������������������������������
������������������������������������������������������������
������������������������
������������
������������������������������������
������������������������������������������
������������������������������������������
������������������������������������������
������������������������������
������������������
������������������
������������������
������������������
������������������������������������������������������������������
������������������������������������������������������������
������������������
������������
������������������������������������������������������������������������
������������������������������������������������������������������
������������������
������������
������������������������������������������������������������
������������������������������������������������������������������
������������������������������������������������������������
������������������������������������������������������������ ������
������
������������ ������ ������
������������
������������������������������������������������������������������
������������������������
������������
������������������������������������������������
������������������������������������������������������������������
������������������������������������������������������������������������
������������
������������
������������������������������������������������������������
������������������������������������������������������������������
������������������������������������������������������������������
������������������������������������������������������������
������������
������ ������������
������������
������������
Available Soil WaterLimited Sprinkler Irrigation Corn, Walsh, 2005
0
1
2
3
4
5
6
7
8
6 7 8 9 10 11 12 13 14 15 16 17 18 19 20 21 22Weeks After Planting
Available Soil Water
(in. of water/3 ft. soil depth)
�������������������������
Silking
Irrigation
Irrigation
Depth 1 ft.
Depth 2 ft.
Depth 3 ft.
Fig. . Available soil water in limited sprinkler irrigation corn at Walsh. Gypsum block
measurements taken to 4 ft. with 1 ft. increments. Total rainfall at Walsh from planting to first freeze was 7.59 in. Any increase in available soil water between weeks not attributed to applied irrigation is from rain.
79
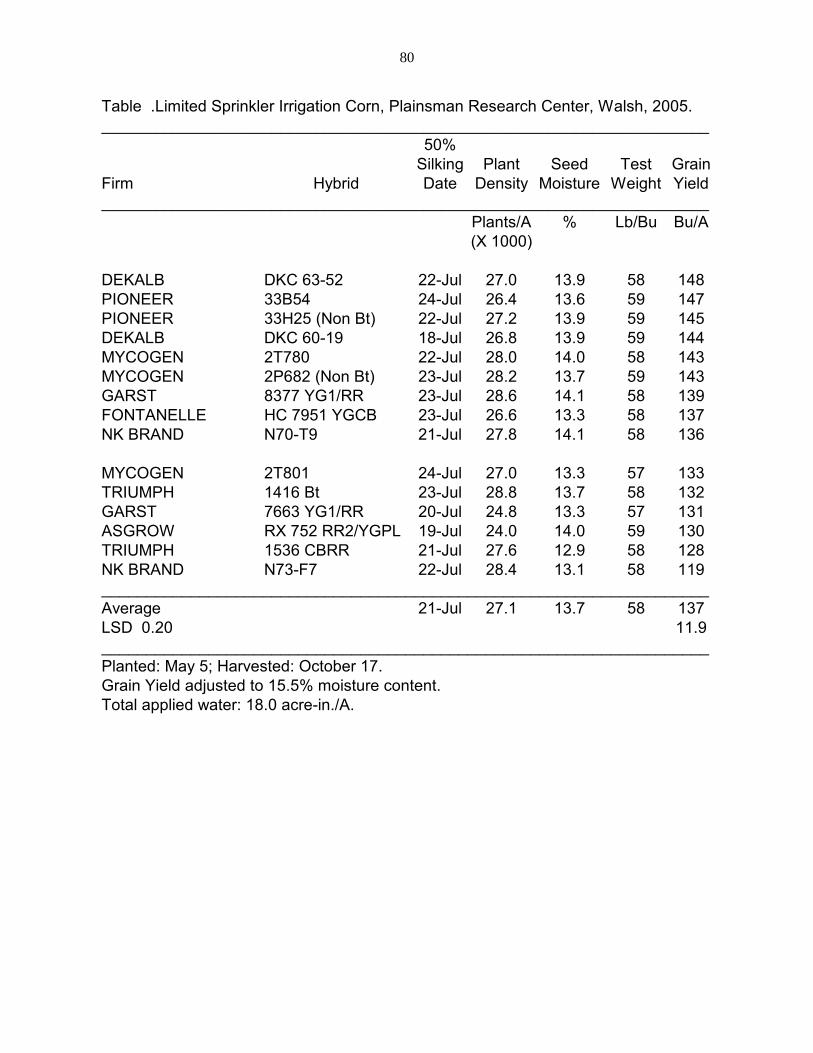
Table .Limited Sprinkler Irrigation Corn, Plainsman Research Center, Walsh, 2005.____________________________________________________________________
50%Silking Plant Seed Test Grain
Firm Hybrid Date Density Moisture Weight Yield____________________________________________________________________
Plants/A % Lb/Bu Bu/A(X 1000)
DEKALB DKC 63-52 22-Jul 27.0 13.9 58 148PIONEER 33B54 24-Jul 26.4 13.6 59 147PIONEER 33H25 (Non Bt) 22-Jul 27.2 13.9 59 145DEKALB DKC 60-19 18-Jul 26.8 13.9 59 144MYCOGEN 2T780 22-Jul 28.0 14.0 58 143MYCOGEN 2P682 (Non Bt) 23-Jul 28.2 13.7 59 143GARST 8377 YG1/RR 23-Jul 28.6 14.1 58 139FONTANELLE HC 7951 YGCB 23-Jul 26.6 13.3 58 137NK BRAND N70-T9 21-Jul 27.8 14.1 58 136
MYCOGEN 2T801 24-Jul 27.0 13.3 57 133TRIUMPH 1416 Bt 23-Jul 28.8 13.7 58 132GARST 7663 YG1/RR 20-Jul 24.8 13.3 57 131ASGROW RX 752 RR2/YGPL 19-Jul 24.0 14.0 59 130TRIUMPH 1536 CBRR 21-Jul 27.6 12.9 58 128NK BRAND N73-F7 22-Jul 28.4 13.1 58 119____________________________________________________________________Average 21-Jul 27.1 13.7 58 137LSD 0.20 11.9____________________________________________________________________Planted: May 5; Harvested: October 17.Grain Yield adjusted to 15.5% moisture content.Total applied water: 18.0 acre-in./A.
80
Corn Borer Resistant and Nonresistant Hybrid Comparisons, Walsh, 2005 K. Larson, D. Thompson, D. Harn, C. Thompson
PURPOSE: To evaluate corn borer resistant hybrids (Bt gene insertion) and nonresistant hybrids under limited sprinkler irrigation. RESULTS: Only the nonresistant corn borer hybrids displayed any corn borer damage. The only corn borer damage observed was first generation shot hole damage and it was very minor. There was no second-generation damage on any of the hybrids. This is the first year that we have observed no stock holes or corn borer lodging on any of the hybrids. The application of Capture to control a late infestation of mites, no doubt, contributed to the absence of second-generation corn borer damage. One of the nonresistant hybrids, Pioneer 33H25, was the third highest yielding hybrid tested, which confirms that Southwest Corn Borer was not a yield limiting factor. We recorded high levels of lodging that were not caused by corn borer damage. While investigating some of this non corn borer lodging, we found that stock rot was present in many of the lodged plants. Non corn borer lodging apparently did not affect yield extensively, since the hybrid with the highest level of lodging, Dekalb DKC 63-52, also produced the high yield.
DISCUSSION: All 13 Bt hybrids tested showed excellent resistance to corn borer. However, there was only mild first generation corn borer damage observed and no second-generation corn borer damage was observed on the nonresistant hybrids. The mild first generation infestation may be attributed to extensive area-wide use of Bt hybrids. The lack of second-generation damage is undoubtedly attributed to an application of Capture to control a late outbreak of mites. Although corn borer was not a yield limiting factor this year (probably because our Capture application controlled both mites and corn borers), corn borer resistant Bt hybrids continue to be a very effective tool against corn borer damage. Therefore, to keep Bt hybrids effective in controlling corn borer, always remember to plant nonresistant hybrids as a mating refuge to help delay corn borer resistance to the Bt events. Non corn borer lodging appeared severe; however, lodging up to 55% apparently did not lower grain yield significantly. The hybrid with the highest lodging also had the highest yield. This non corn borer lodging, tentatively identified as stock rot, did not lower yields like lodging associated with Southwestern Corn Borer. Southwestern Corn Borer often girdle the corn stocks causing the plant to detach and lay flat, making harvest of lodged plants difficult and yield limiting. On the other hand, with the non corn borer lodging plants remained attached and harvestable. Harvesting non corn borer lodged plants slowed harvest, but yields remained high.
81

Table .Limited Sprinkler Irrigated Corn, Corn Borer Ratings, Plainsman Research Center, 2005.____________________________________________________________________________________
Non50% 1st Gen 2nd Gen 2nd Gen Corn
Silking Plant Shot Stock Plant Borer Test GrainFirm Hybrid Date Density Holes Holes Lodging Lodging Wt. Yield____________________________________________________________________________________
Plants/A % % % % Lb/Bu Bu/A(X 1000)
DEKALB DKC 63-52 22-Jul 27.0 0 0 0 55 58 148PIONEER 33B54 24-Jul 26.4 0 0 0 8 59 147PIONEER 33H25 (Non Bt) 22-Jul 27.2 5 0 0 0 59 145DEKALB DKC 60-19 18-Jul 26.8 0 0 0 18 59 144MYCOGEN 2T780 22-Jul 28.0 0 0 0 30 58 143MYCOGEN 2P682 (Non Bt) 23-Jul 28.2 3 0 0 0 59 143GARST 8377 YG1/RR 23-Jul 28.6 0 0 0 0 58 139FONTANELLE HC 7951 YGCB 23-Jul 26.6 0 0 0 0 58 137NK BRAND N70-T9 21-Jul 27.8 0 0 0 10 58 136
MYCOGEN 2T801 24-Jul 27.0 0 0 0 0 57 133TRIUMPH 1416 Bt 23-Jul 28.8 0 0 0 0 58 132GARST 7663 YG1/RR 20-Jul 24.8 0 0 0 15 57 131ASGROW RX 752 RR2/YGPL 19-Jul 24.0 0 0 0 0 59 130TRIUMPH 1536 CBRR 21-Jul 27.6 0 0 0 0 58 128NK BRAND N73-F7 22-Jul 28.4 0 0 0 13 58 119____________________________________________________________________________________Average 21-Jul 25.5 1 0 0 10 58 137LSD 0.20 2.0 9.6 11.9____________________________________________________________________________________Planted: May 5; Harvested: October 17.Grain Yield corrected to 15.5% moisture content.Twelve sprinkler rotations applied a total of 18.0 acre-in./A of water.The lack of 2nd generation corn borer damage may be attributed to an application of Capture to control a late outbreak of mites.Some of the non corn borer lodging was vistually identified as stock rot.
82

High and Low Input Comparison for Subsurface Drip Irrigated Corn Kevin Larson and Dennis Thompson
Subsurface drip irrigation is a new irrigation technology for Colorado. Water use efficiency (lb of grain produced/in. of water applied) of grain sorghum is reported to be15% to 30% higher with subsurface drip compared to center pivot sprinkler and furrow irrigation (Dainello, Stein, Valdez, and White, 2002). In this irrigated study, we tested high and low inputs on Subsurface Drip Irrigated corn. Materials and Methods
We planted corn, Mycogen 2T801, on May 11 at 27,000 Seeds/A for the low input treatment and 34,000 Seeds/A for the high input treatment, under subsurface drip irrigation. The subsurface drip lines are 60 inches apart with emitters every foot and buried 12 in. to 14 in. deep. Our 25 gpm well supplies each zone with 0.12 in. per day when equally distributed to all zones. We fully irrigated the high input treatment with 16 in./A and apply 30% less irrigation to the low input treatment (11 in./A). The soil test recommendation for 200 Bu/A crop was 180 Lb N/A and 40 Lb P2O5/A. We planter applied 48 Lb P2O5/A with 0.5 Lb Zn/A for the high input treatment and 24 Lb P2O5/A with 0.25 Lb Zn/A for the low input treatment. We injected 200 Lb N/A for the high input treatment and 140 Lb N/A to the low input treatment through the drip system during the growing season. We applied Balance 2 Oz/A and Atrazine 1.0 Lb/A for pre-emergence weed control and two applications of Roundup Ultra Max 20 Oz/A for postemergence weed control. We harvested the 10 ft. by 650 ft. plots on October 18 with a self-propelled combine and weighed them in a digital scale cart. Grain yields were adjusted to 15.5% seed moisture content. Results and Discussion
The high input yield average was 160 Bu/A and the low input yield average was 148 Bu/A. Nonetheless, the low input treatment produced significantly higher income than the high input treatment, $58.78/A more (P > 0.20).
Even though the low input treatment yielded significantly less than the high input treatment, the cost savings from lowering inputs of seed, fertilizer, and irrigation gave the low input treatment the income advantage. As a general rule, when input expenses are high and commodity prices are low, low input will be more profitable than high input. This rule is reversed when commodity prices are high. This year, however, the corn price would have to be $6.25/Bu before the high input became more profitable. Increasing income by lowering inputs may not get you coffee shop bragging rights, but it does make economic sense. Literature Cited Dainello, F.J., L. Stein, M. Valdez, and K. White. 2002. Irrigation and rainfall water management and conservation. Dept of Horticultural Sciences, Texas A & M Univ. College Station, Texas.
http://www.trwi.tamu.edu/soil_water_grants/2001-02/dainello_report.pdf. 4p.
83

Table .-Drip Irrigated Corn, High and Low Input Comparison, Walsh 2005.__________________________________________________________________
Variable Plant Silking Grain Test Grain Net
Treatment Density Date Moisture Weight Yield Income__________________________________________________________________
Plants/A % Lb/Bu Bu/A $/A(X1000)
High Input 33.0 5-Aug 14.6 59 160 67.51Low Input 26.2 5-Aug 14.2 59 148 126.29__________________________________________________________________Average 29.6 5-Aug 14.4 59 154 96.90LSD 0.20 4.6 2.89__________________________________________________________________Planted: May 11 with Mycogen 2T801; Harvested: October 18.Low Input received 27,000 Seeds/A and 11 in./A of water.High Input received 34,000 Seeds/A and 16 in./A of water.Low Input fertilizer: 140 Lb N/A, 6 gal 10-34-0/A (24 Lb P2O5/A), 0.25 Lb Zn/A.High Input fertilizer: 200 Lb N/A, 12 gal 10-34-0/A (48 Lb P2O5/A), 0.5 lb Zn/A.Seed cost $1.50/1000 seeds; water cost $8/in.; N cost $0.38/lb; Zn cost $8/Lb;10-34-0 cost $1.44/gal. Variable Net Income: grain yield x corn price ($2.15/bu) - seed cost - watercost - fertilizer cost.
84
The New Subsurface Drip Irrigation Installation at the Plainsman Research Center Kevin Larson
Many people have heard reports that we had a crop failure with our new drip system at the Plainsman Research Center. This rumor is true. Our corn crop failed with our new drip system. This does not mean that Subsurface Drip Irrigation is a failure. Instead, the crop failure indicates that our design was flawed. Our most glaring design flaw was the lack of a contingency plan in case the capacity of our well dropped. Our drip system was designed for our 60 gpm well with all the water from the well going to one zone at a time. I was confident that our well would maintain at least 60 gpm even in the middle of the irrigation season since our sprinkler was nozzled for 60 gpm and it maintained adequate pressure throughout the irrigation season. I was wrong. In the middle of the irrigation season, our well capacity dropped to 40 gpm. Our drip system would have pressured up with as little as 53 gpm, but 40 gpm was not enough water to uniformly open the emitters. There was insufficient water getting to the corn plants at pollination. The weather during this critical developmental stage was hot and dry, further stressing the corn plants. This caused pollen shed and silking to become out-of-sync. About a week after pollen shed, the corn plants began to silk. Without adequate pollination, there was no grain development.
It is difficult to adapt a Subsurface Drip Irrigation system when well capacity drops below its design parameters and all the water goes to a single zone. With a sprinkler, when the well capacity drops, you can simply renozzle the sprinkler or eliminate towers. With a subsurface drip system, where all the water goes to a single zone at a time, the options to solve a drop in well capacity are severe and expensive. To solve this well capacity drop, we could: 1) make the zones shorter by cutting the field in half and eliminate the bottom half of the field, 2) make the zones narrower by retrofitting valves in the center of the zone supply lines, or 3) find additional water from another well to offset the water drop.
To avoid these expensive and radical solutions, we suggest having a contingency plan in case of well capacity decline. The easiest plan is to have multiple zones, instead of a single zone, irrigated at a time. If the well capacity drops, then open up fewer zones.
Again, the crop failure was not the fault of drip irrigation; it was my shortsightedness.
85

Irrigated Sunflower Hybrid Performance Trial at Walsh, 2005 COOPERATORS: Plainsman Agri-Search Foundation, and Kevin Larson, Superintendent, Plainsman Research Center, Walsh, Colorado. PURPOSE: To identify high yielding hybrids under irrigated conditions with 2700 sorghum heat units in a Silty Loam soil. PLOT: Four rows with 30” row spacing, 650’ long. SEEDING DENSITY: 24,000 Seed/A. PLANTED: June 24. HARVESTED: October 28.
Summary: Growing Season Precipitation and Temperature \1 Walsh, Baca County. __________________________________________________ Month Rainfall GDD \2 >90 F >100 F DAP \3 __________________________________________________ In --------No. of Days-------- June 0.10 149 6 2 6 July 1.01 878 26 8 37 August 1.90 763 17 3 68 September 0.24 642 15 0 98 October 1.06 276 3 0 122 Total 4.31 2708 67 13 122 _________________________________________________ \1 Growing season from June 24 (planting) to October 24 (first freeze, 24 F). \2 GDD: Growing Degree Days for sorghum. \3 DAP: Days After Planting.
IRRIGATION: Subsurface Drip Irrigated: total water applied 10.9 A-in./A. PEST CONTROL: Preemergence Herbicides: Glyphosate 20 Oz/A, Select 8 Oz/A, Spartan 2.0 Oz/A, Prowl 48 Oz/A. Post Emergence Herbicides: None. CULTIVATION: Once. INSECTICIDES: None. FIELD HISTORY: Last Crop: Corn. FIELD PREPARATION: Disc. COMMENTS: Planted in good soil moisture. Weed control was good. The growing season was dry and hot, especially for the month of July. No insecticides were applied to control head moth because of the late planting date. Seed yields were good. SOIL: Silty Loam for 0-8” and Silty Loam 8”-24” depths from soil analysis.
Summary: Soil Analysis. _____________________________________________________ Depth pH Salts OM N P K Zn Fe _____________________________________________________ mmhos/cm % ----------------ppm---------------- 0-8” 7.7 0.5 1.9 5 0.9 368 1.1 6.2 8”-24” 5 Comment Alka VLo Hi Lo VLo VHi Marg Adeq _____________________________________________________ Manganese and Copper levels were adequate.
Summary: Fertilization. ____________________________________________ Fertilizer N P2O5 Zn Fe ____________________________________________ --------------------Lb/A------------------ Recommended 115 40 0 0 Applied 130 40 0 0 ____________________________________________ Yield Goal: 2500 Lb/A. Actual Yield: 2268 Lb/A.
86

Table .-Drip Irrigated Sunflower, NuSun Variety Trial, PRC, Walsh, 2005.____________________________________________________________________
50% Plant Plant Test Seed OilFirm Hybrid Flowering Density Ht. Wt. Oil Yield Yield____________________________________________________________________
Date Plants/A In Lb/Bu % Lb/A Lb/A(X1000)
MYCOGEN 8N352 8/19 21.6 55 32 40.6 2371 963TRIUMPH S-675 8/22 19.6 37 32 39.2 2370 929FONTANELLE 902 NS 8/19 21.2 58 29 38.5 2303 887TRIUMPH S-672 8/20 21.2 38 31 38.8 2200 854MYCOGEN 8377 NS 8/18 22.4 61 30 36.5 2157 787PIONEER 63M91 8/19 19.2 65 31 35.6 2208 786____________________________________________________________________Average 8/19 20.9 52 31 38.2 2268 868LSD 0.20 97.6 37.4____________________________________________________________________Planted: June 24; Harvested: October 28.Seed Yield adjusted to 10% seed moisture content.Total water applied with subsurface drip irrigation was 10.9 in.
87

Banded P Rate for Dryland Sunflower Production Kevin Larson and Dennis Thompson
Banding P fertilizer is the recommended fertilizing method for crops in the high lime, high alkaline soils of Colorado. For these alkaline soils, the P fertilizer of choice is liquid 10-34-0. A common P banded range for dryland crops is 5 to 10 Gal/A of 10-34-0, which supplies 20 to 40 Lb P2O5/A and 6 to 12 Lb N/A. High P fertilization may be required for high oil yields in sunflowers, since P is needed to produce phospholipids. However, high rates of seedrow N are reported to cause N salt toxicity, which lowers germination (Mortvedt, 1976); moreover, we have found that applying even a low rate of P with seedrow 10-34-0 caused sunflower stand loss. To provide sufficient P for high oil yields of sunflower, we used banded placement of P and not seedrow placement of P. This study was conducted to determine the optimum P rate of banded 10-34-0 for dryland sunflower. Materials and Methods We tested four rates of poly ammoniated phosphate (10-34-0) fertilizer banded with a planter prior to planting on 30 in. row spacing in an alkaline Silty Clay Loam soil. The four rates were 0, 5, 10, and 15 gallons of 10-34-0/A, corresponding to phosphate levels of 0, 20, 40, and 60 Lb P2O5/A with nitrogen levels of 0, 6, 12, and 18 Lb N/A, respectively. We applied the P rates on June 24 and planted Mycogen 8377NS at 18,000 Seeds/A on June 28. We harvested the 10 ft. by 300 ft. plots on October 25 with a self-propelled combine equipped with a four-row crop header. Seed yields were adjusted to 10% seed moisture content. Results and Discussion The highest seed yield was obtained with the highest banded P rate, 15 Gal 10-34-0/A. There was very little yield response to increasing P rates until the highest P rate. Even at the highest P rate, there was only a 25 Lb/A seed yield increase by increasing the P rate from 10 to 15 Gal/A of 10-34-0. The meager yield increase was insufficient to offset the cost of the P fertilizer (5 Gal/A of 10-34-0 costs $7.20/A and 25 Lb/A of sunflower seed is worth $2.30/A at the loan rate of $9.19/cwt). There was no response of seed oil content with increasing P rate. The seed oil content response was flat and low, averaging only 19.5%, the lowest seed oil content we have ever recorded. This first year of banding P rates on dryland sunflower indicates that P fertilizer is not required for dryland sunflower production. Moreover, results from our N rates on wheat-sunflower-fallow rotation study suggest that N is not required for dryland sunflower production. Sunflowers are such good miners of soil nutrients that fertilization may not be needed for dryland sunflower production. The role of sunflowers in our dryland crop rotations may be to extract residual nutrients left by other crops. Single year economics of sunflower production is good, however, having sunflowers in dryland crop rotations is problematic. Results from our Crop Rotation Sequencing study suggest that sunflower leaves little residual moisture for subsequent crops. Literature Cited Mortvedt, J. J. 1976. Band fertilizer placement - how much and how close? Fert. Solns. 20(6): 90-96.
88
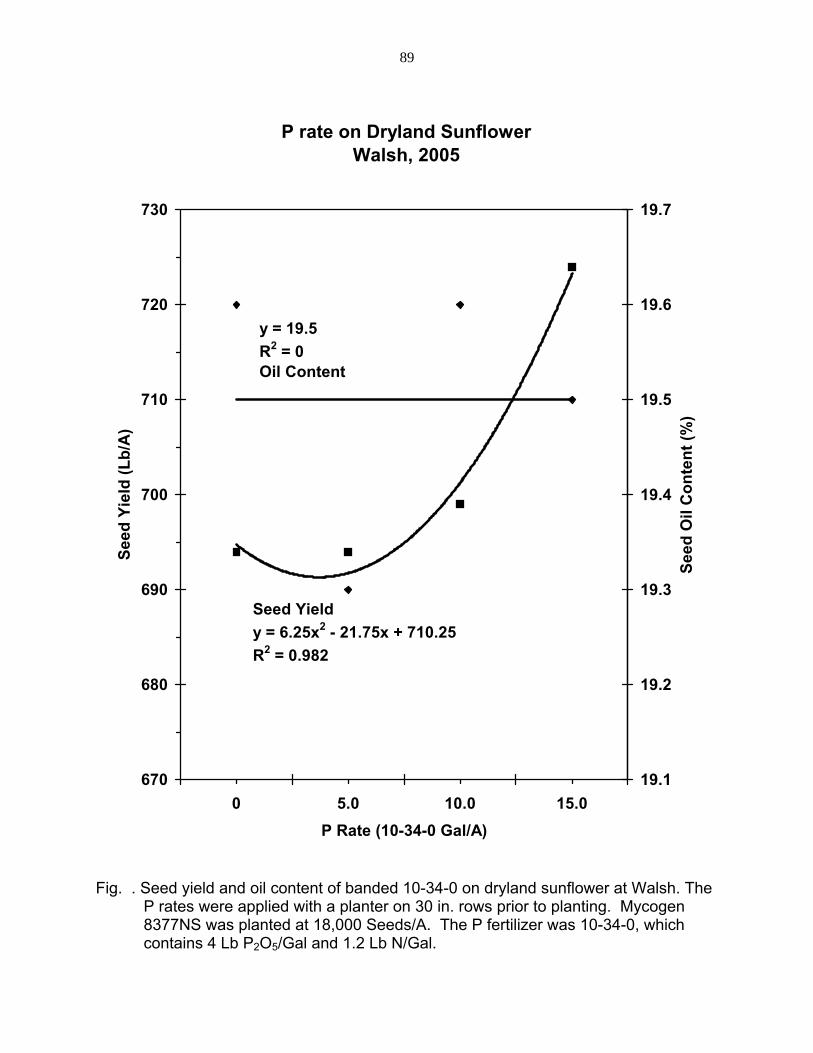
P rate on Dryland SunflowerWalsh, 2005
y = 19.5R2 = 0Oil Content
Seed Yieldy = 6.25x2 - 21.75x + 710.25R2 = 0.982
670
680
690
700
710
720
730
0 5.0 10.0 15.0P Rate (10-34-0 Gal/A)
Seed
Yie
ld (L
b/A
)
19.1
19.2
19.3
19.4
19.5
19.6
19.7
Seed
Oil
Con
tent
(%)
Fig. . Seed yield and oil content of banded 10-34-0 on dryland sunflower at Walsh. The
P rates were applied with a planter on 30 in. rows prior to planting. Mycogen 8377NS was planted at 18,000 Seeds/A. The P fertilizer was 10-34-0, which contains 4 Lb P2O5/Gal and 1.2 Lb N/Gal.
89
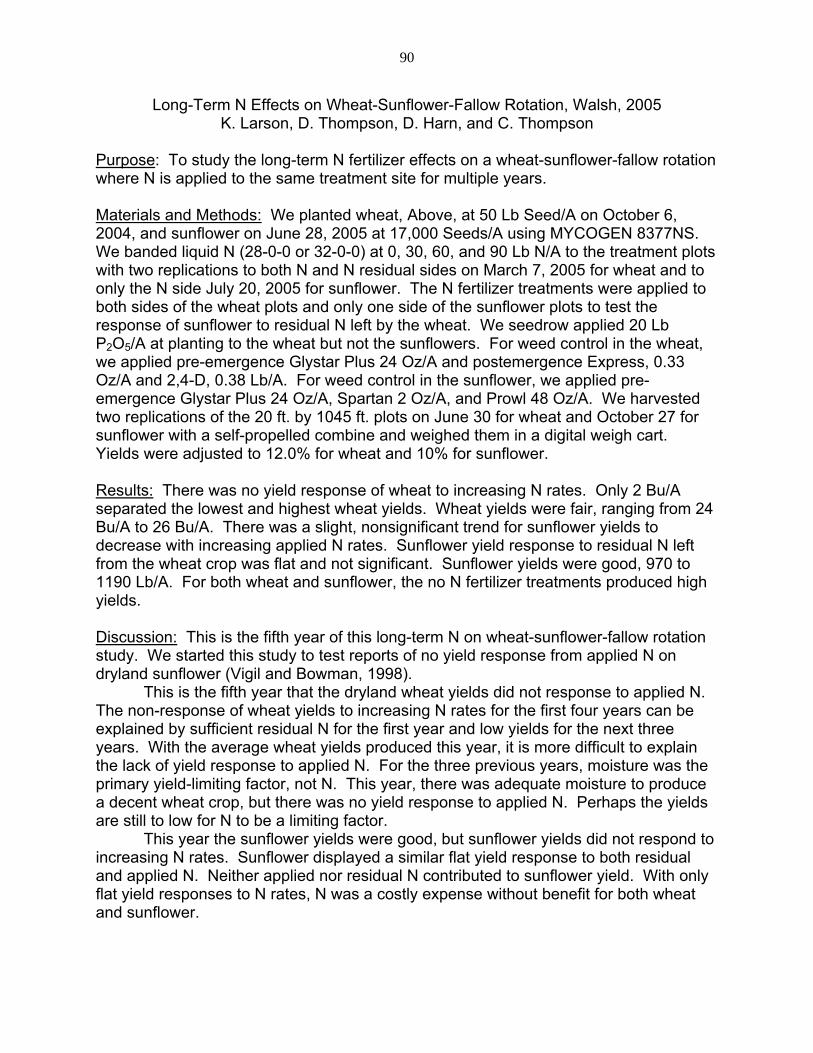
Long-Term N Effects on Wheat-Sunflower-Fallow Rotation, Walsh, 2005 K. Larson, D. Thompson, D. Harn, and C. Thompson
Purpose: To study the long-term N fertilizer effects on a wheat-sunflower-fallow rotation where N is applied to the same treatment site for multiple years. Materials and Methods: We planted wheat, Above, at 50 Lb Seed/A on October 6, 2004, and sunflower on June 28, 2005 at 17,000 Seeds/A using MYCOGEN 8377NS. We banded liquid N (28-0-0 or 32-0-0) at 0, 30, 60, and 90 Lb N/A to the treatment plots with two replications to both N and N residual sides on March 7, 2005 for wheat and to only the N side July 20, 2005 for sunflower. The N fertilizer treatments were applied to both sides of the wheat plots and only one side of the sunflower plots to test the response of sunflower to residual N left by the wheat. We seedrow applied 20 Lb P2O5/A at planting to the wheat but not the sunflowers. For weed control in the wheat, we applied pre-emergence Glystar Plus 24 Oz/A and postemergence Express, 0.33 Oz/A and 2,4-D, 0.38 Lb/A. For weed control in the sunflower, we applied pre-emergence Glystar Plus 24 Oz/A, Spartan 2 Oz/A, and Prowl 48 Oz/A. We harvested two replications of the 20 ft. by 1045 ft. plots on June 30 for wheat and October 27 for sunflower with a self-propelled combine and weighed them in a digital weigh cart. Yields were adjusted to 12.0% for wheat and 10% for sunflower. Results: There was no yield response of wheat to increasing N rates. Only 2 Bu/A separated the lowest and highest wheat yields. Wheat yields were fair, ranging from 24 Bu/A to 26 Bu/A. There was a slight, nonsignificant trend for sunflower yields to decrease with increasing applied N rates. Sunflower yield response to residual N left from the wheat crop was flat and not significant. Sunflower yields were good, 970 to 1190 Lb/A. For both wheat and sunflower, the no N fertilizer treatments produced high yields. Discussion: This is the fifth year of this long-term N on wheat-sunflower-fallow rotation study. We started this study to test reports of no yield response from applied N on dryland sunflower (Vigil and Bowman, 1998). This is the fifth year that the dryland wheat yields did not response to applied N. The non-response of wheat yields to increasing N rates for the first four years can be explained by sufficient residual N for the first year and low yields for the next three years. With the average wheat yields produced this year, it is more difficult to explain the lack of yield response to applied N. For the three previous years, moisture was the primary yield-limiting factor, not N. This year, there was adequate moisture to produce a decent wheat crop, but there was no yield response to applied N. Perhaps the yields are still to low for N to be a limiting factor. This year the sunflower yields were good, but sunflower yields did not respond to increasing N rates. Sunflower displayed a similar flat yield response to both residual and applied N. Neither applied nor residual N contributed to sunflower yield. With only flat yield responses to N rates, N was a costly expense without benefit for both wheat and sunflower.
90

We have reported no wheat yield response to N rate since establishing this wheat-sunflower-fallow rotation study. For the previous three years, wheat yields in this rotation were very low, 6 to 15 Bu/A and this last season they were fair. The low to fair wheat yields can be attributed to the lack of moisture remaining after sunflower extracted all available soil water and little soil water replenishment due to dry conditions during fallow. For wheat production in this wheat-sunflower-fallow rotation, moisture was probably the limiting factor, not N. Most years sunflower yields increased with increasing N rates; however the yield response failed to offset the cost of the N fertilizer. The no N fertilizer treatment produced the highest income every year of sunflower production (there was no sunflower crop in 2002 because of drought). This year, the no fertilizer treatment produced sunflower yields only a few pounds less than the highest yield obtained with applied N. This lack of N response suggests that N fertilizer is not needed for dryland sunflower production if the expected yield is 1200 Lb/A or less.
Seed oil content tends to decrease with increasing N rates. Results from seed analysis in 2004 demonstrate this decline: 39.7%, 37.8%, 38.7%, and 35.9% for 0, 30, 60, and 90 Lb N/A, respectively. This negative correlation of oil content with N rate has been previously reported (Vigil and Bowman, 1998). Literature Cited Vigil, M.F., R.A. Bowman. 1998. Nitrogen response and residue management of sunflowers in a dryland rotation. 1998 Annual Report, Central Great Plains Research Station. ARS, USDA.
91
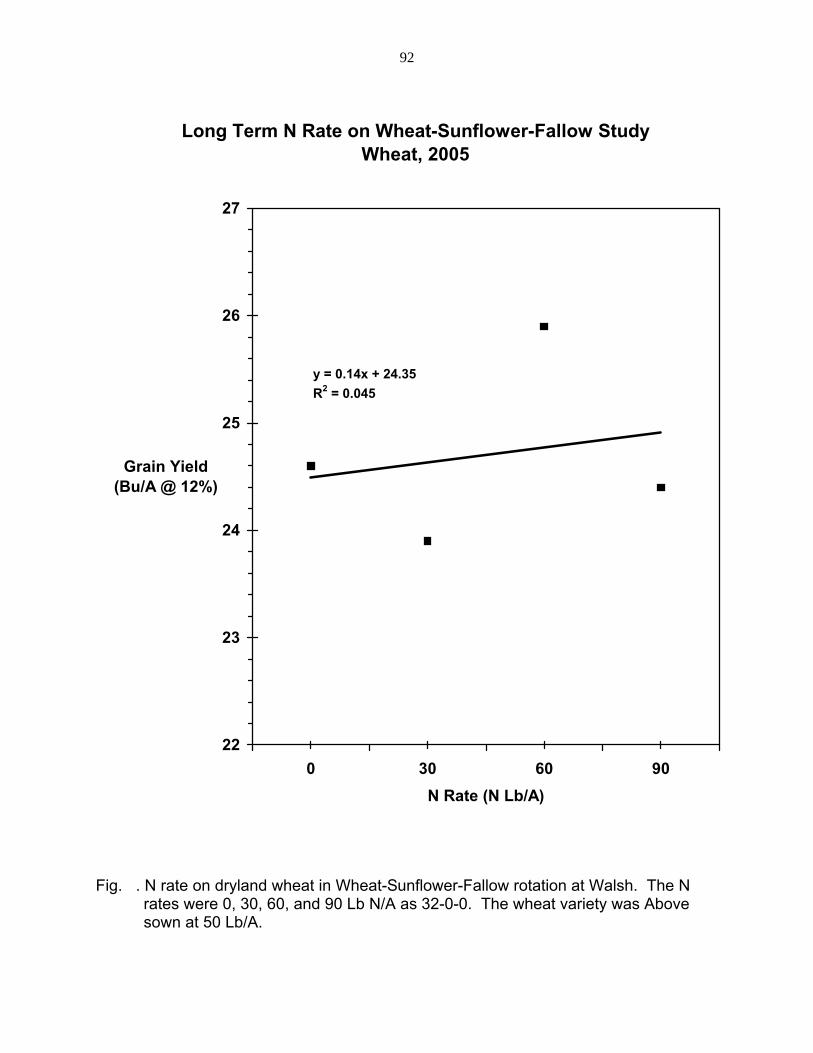
Long Term N Rate on Wheat-Sunflower-Fallow StudyWheat, 2005
y = 0.14x + 24.35R2 = 0.045
22
23
24
25
26
27
0 30 60 90N Rate (N Lb/A)
Grain Yield (Bu/A @ 12%)
Fig. . N rate on dryland wheat in Wheat-Sunflower-Fallow rotation at Walsh. The N rates were 0, 30, 60, and 90 Lb N/A as 32-0-0. The wheat variety was Above sown at 50 Lb/A.
92

Long Term N on Wheat-Sunflower-Fallow StudySunflower, Walsh, 2005
y = -25x + 1209.5R2 = 0.59Applied N
y = 12.5x + 1063R2 = 0.031Residual N
800
850
900
950
1000
1050
1100
1150
1200
1250
1300
0 30 60 90N Rate (Lb N/A)
Seed Yield (Lb/A @ 10%)
Fig. . N rate on dryland sunflower in Wheat-Sunflower-Fallow rotation at Walsh. The N rates were 0, 30, 60, and 90 Lb N/A as 32-0-0. Applied N is N applied to the sunflowers in the current season. Residual N is N applied to the wheat the previous season. The sunflower hybrid was MYCOGEN 8377NS planted at 17,000 Seeds/A.
93

Bindweed Control in Sunflower, 2005 Kevin Larson, Calvin Thompson, and Dennis Thompson
Bindweed has become a serious production problem in many fields. Recently, bindweed appears more prevalent with larger more numerous areas. The recent drought may have contributed to the bindweed infestations. Even in the very dry year of 2002 when crops and most weeds failed to grow, bindweed continued to thrive. We conducted this study to increase crop production and income of bindweed infested sunflower fields. We tested preplant herbicides to control bindweed in sunflower. To determine residual effects of the herbicide treatments on sunflower with bindweed and without bindweed interference, we applied the herbicide treatments to both a bindweed infested site and a non-bindweed site. To determine residual longevity of the herbicide treatments on sunflower, we planted both bindweed and non-bindweed sites with multiple planting dates. Materials and Methods
The study was conducted on a 25-acre, Silty Clay Loam field with a history of heavy bindweed infestation in the middle of the field (bindweed site) and with very little bindweed on the north side of the field (non-bindweed site). We applied nine herbicide treatments: Hi Dep (16 oz/A) 0.5 lb/A, LandMaster BW 54 oz/A, 2,4-D LoVol 6 (16 oz/A) 0.75 lb/A, Banvel 8 oz/A, Spartan 2 oz/A, Paramount 5.33 oz/A and COC 32 oz/A, Starane 16 oz/A, Saber (16 oz/A) 0.5 lb/A, and control (no bindweed herbicide) with a 40 ft. boom sprayer at 10 gal/A on June 8, 2005 to both sites. Before the bindweed herbicide treatments were applied, we sprayed the entire field with glyphosate 24 oz/A and Prowl 48 oz/A. We planted sunflower (Mycogen 8N352) at 18,000 seeds/A on five planting dates: June 9, June 17, June 27, July 6, and July 18 (the July 18 planting date had very poor emergence and was abandoned). Bindweed control ratings were performed on June 22, July 8, July 27, and August 5. Percentage of plant stand was taken for each planting date as an indication of residual damage (crop injury) from herbicide treatments. The 20 ft. by 40 ft. plots were harvested on October 24 and 25 with a self-propelled combine equipped with a digital scale. Yields were adjusted to 10% seed moisture content. Results All herbicide treatments in the bindweed site produced significantly higher sunflower yields and incomes than the no herbicide control (P > 0.20). Hi Dep produced significantly higher income in the bindweed site than all the other herbicide treatments, except Saber. Hi Dep and Saber are both 2,4-D amines. In fact, the four highest incomes were from herbicide treatments were forms of 2,4-D or had 2,4-D as one of the main components: Hi Dep, Saber, LoVol, and LandMaster BW. These four herbicide treatments had the highest initial and seasonal bindweed control ratings of the nine treatments tested. For each individual planting date, these four 2,4-D herbicide treatments were consistently the top four highest income producers. The planting date income rankings for the bindweed site were: PD2 and PD1 > PD3 > PD4. There was a large yield and income drop between PD3 and PD4.
94

For the non-bindweed site, only LandMaster BW produced significantly more net income than the no herbicide control (P > 0.20). Starane produced significantly less net income than the control. The herbicide treatments that produced the highest net incomes also had high pigweed control ratings, except Spartan. Spartan had a high pigweed control rating, but its net income was only a few cents higher than the control. For each individual planting date, none of the herbicide treatments were consistently high ranking for net income between planting dates. There were no significant income differences between the planting dates for the non-bindweed site; only $5.60/A separated the highest and lowest planting date incomes.
Discussion Bindweed control was absolutely crucial for sunflower production. There was almost no yield and income without bindweed control. In fact, there was less than $2/A difference in net income between the bindweed and non-bindweed sites when the control is not included. The poor yields and incomes from the last planting dates in the bindweed site may be attributed to bindweed regrowth and subsequent utilization of water and nutrients. The first two planting dates averaged 22% higher bindweed control than the last two planting dates. Moreover, the planting delay between the first two planting dates and the last two planting dates provided an average of 14 days growth of bindweed which, no doubt, lowered water and nutrient levels. For bindweed control in sunflower, the four treatments containing 2,4-D (Hi Dep, Saber, LoVol, and LandMaster BW) produced the highest initial control and the highest residual control of bindweed. These four herbicides produced significantly higher net incomes than the other four herbicide treatments and control. The herbicides containing 2,4-D had low sunflower injury (high plant stands) and high short and long term efficacy on bindweed. LandMaster BW was the only treatment in the non-bindweed site that significantly produced higher net income than the no herbicide control. The primary weed in the non-bindweed site was pigweed. The LandMaster BW treatment completely controlled the pigweed even up to 49 days after application. On the other hand, Starane had only slightly better pigweed control than the no herbicide control and had significantly lower net income than the control. This suggests that residual pigweed control was important for high yields and incomes in the non-bindweed site. There was no significant seed yield difference between the planting dates in the non-bindweed site. The lack of seed yield difference suggests that dryland sunflower has a large planting window for achieving high yields.
It took only 9 days after application for 8 oz/A of Banvel (1.1 days per oz) to produce higher yield and income than the control. Nine days after application Banvel had the same plant stand as the control. Typically, we expect to delay planting 3 to 4 days per ounce of Banvel applied. For Banvel at 8 oz/A, we expected a sunflower planting delay between 24 and 32 days. This year, the reason Banvel had such a short residual crop injury period this was probably due to rains occurring shortly after herbicide application that diluted herbicide concentrations.
We found that sunflower production was almost nonexistent without bindweed control. Controlling bindweed with herbicides containing 2,4-D provided high yields and incomes comparable to sunflower yields and incomes produced from non-bindweed areas.
95
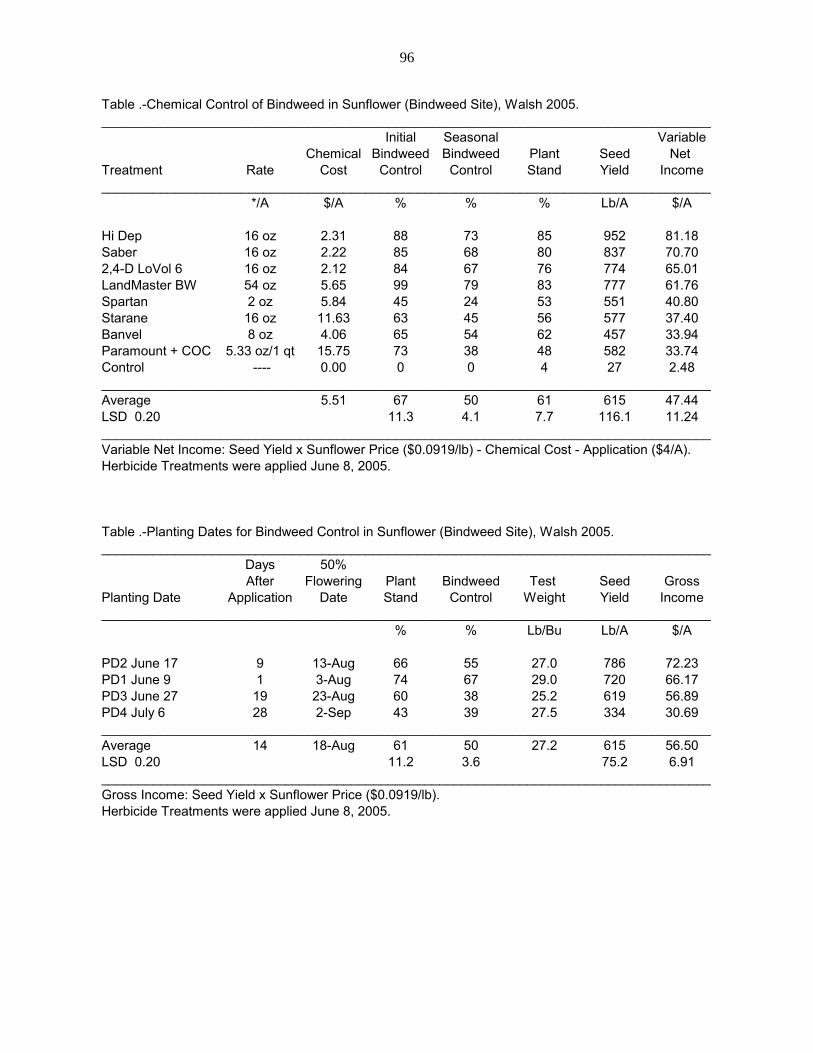
Table .-Chemical Control of Bindweed in Sunflower (Bindweed Site), Walsh 2005.___________________________________________________________________________________
Initial Seasonal VariableChemical Bindweed Bindweed Plant Seed Net
Treatment Rate Cost Control Control Stand Yield Income___________________________________________________________________________________
*/A $/A % % % Lb/A $/A
Hi Dep 16 oz 2.31 88 73 85 952 81.18Saber 16 oz 2.22 85 68 80 837 70.702,4-D LoVol 6 16 oz 2.12 84 67 76 774 65.01LandMaster BW 54 oz 5.65 99 79 83 777 61.76Spartan 2 oz 5.84 45 24 53 551 40.80Starane 16 oz 11.63 63 45 56 577 37.40Banvel 8 oz 4.06 65 54 62 457 33.94Paramount + COC 5.33 oz/1 qt 15.75 73 38 48 582 33.74Control ---- 0.00 0 0 4 27 2.48___________________________________________________________________________________Average 5.51 67 50 61 615 47.44LSD 0.20 11.3 4.1 7.7 116.1 11.24___________________________________________________________________________________Variable Net Income: Seed Yield x Sunflower Price ($0.0919/lb) - Chemical Cost - Application ($4/A).Herbicide Treatments were applied June 8, 2005.
Table .-Planting Dates for Bindweed Control in Sunflower (Bindweed Site), Walsh 2005.___________________________________________________________________________________
Days 50%After Flowering Plant Bindweed Test Seed Gross
Planting Date Application Date Stand Control Weight Yield Income___________________________________________________________________________________
% % Lb/Bu Lb/A $/A
PD2 June 17 9 13-Aug 66 55 27.0 786 72.23PD1 June 9 1 3-Aug 74 67 29.0 720 66.17PD3 June 27 19 23-Aug 60 38 25.2 619 56.89PD4 July 6 28 2-Sep 43 39 27.5 334 30.69___________________________________________________________________________________Average 14 18-Aug 61 50 27.2 615 56.50LSD 0.20 11.2 3.6 75.2 6.91___________________________________________________________________________________Gross Income: Seed Yield x Sunflower Price ($0.0919/lb).Herbicide Treatments were applied June 8, 2005.
96
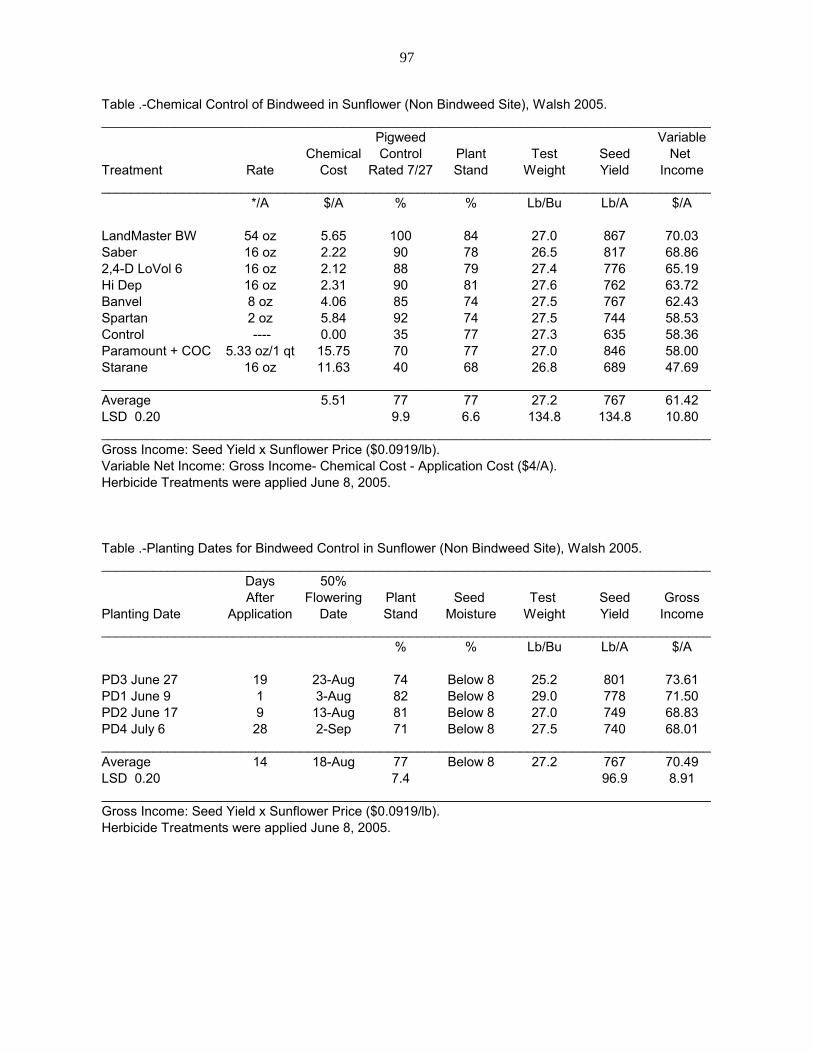
Table .-Chemical Control of Bindweed in Sunflower (Non Bindweed Site), Walsh 2005.___________________________________________________________________________________
Pigweed VariableChemical Control Plant Test Seed Net
Treatment Rate Cost Rated 7/27 Stand Weight Yield Income___________________________________________________________________________________
*/A $/A % % Lb/Bu Lb/A $/A
LandMaster BW 54 oz 5.65 100 84 27.0 867 70.03Saber 16 oz 2.22 90 78 26.5 817 68.862,4-D LoVol 6 16 oz 2.12 88 79 27.4 776 65.19Hi Dep 16 oz 2.31 90 81 27.6 762 63.72Banvel 8 oz 4.06 85 74 27.5 767 62.43Spartan 2 oz 5.84 92 74 27.5 744 58.53Control ---- 0.00 35 77 27.3 635 58.36Paramount + COC 5.33 oz/1 qt 15.75 70 77 27.0 846 58.00Starane 16 oz 11.63 40 68 26.8 689 47.69___________________________________________________________________________________Average 5.51 77 77 27.2 767 61.42LSD 0.20 9.9 6.6 134.8 134.8 10.80___________________________________________________________________________________Gross Income: Seed Yield x Sunflower Price ($0.0919/lb).Variable Net Income: Gross Income- Chemical Cost - Application Cost ($4/A).Herbicide Treatments were applied June 8, 2005.
Table .-Planting Dates for Bindweed Control in Sunflower (Non Bindweed Site), Walsh 2005.___________________________________________________________________________________
Days 50%After Flowering Plant Seed Test Seed Gross
Planting Date Application Date Stand Moisture Weight Yield Income___________________________________________________________________________________
% % Lb/Bu Lb/A $/A
PD3 June 27 19 23-Aug 74 Below 8 25.2 801 73.61PD1 June 9 1 3-Aug 82 Below 8 29.0 778 71.50PD2 June 17 9 13-Aug 81 Below 8 27.0 749 68.83PD4 July 6 28 2-Sep 71 Below 8 27.5 740 68.01___________________________________________________________________________________Average 14 18-Aug 77 Below 8 27.2 767 70.49LSD 0.20 7.4 96.9 8.91___________________________________________________________________________________Gross Income: Seed Yield x Sunflower Price ($0.0919/lb).Herbicide Treatments were applied June 8, 2005.
97
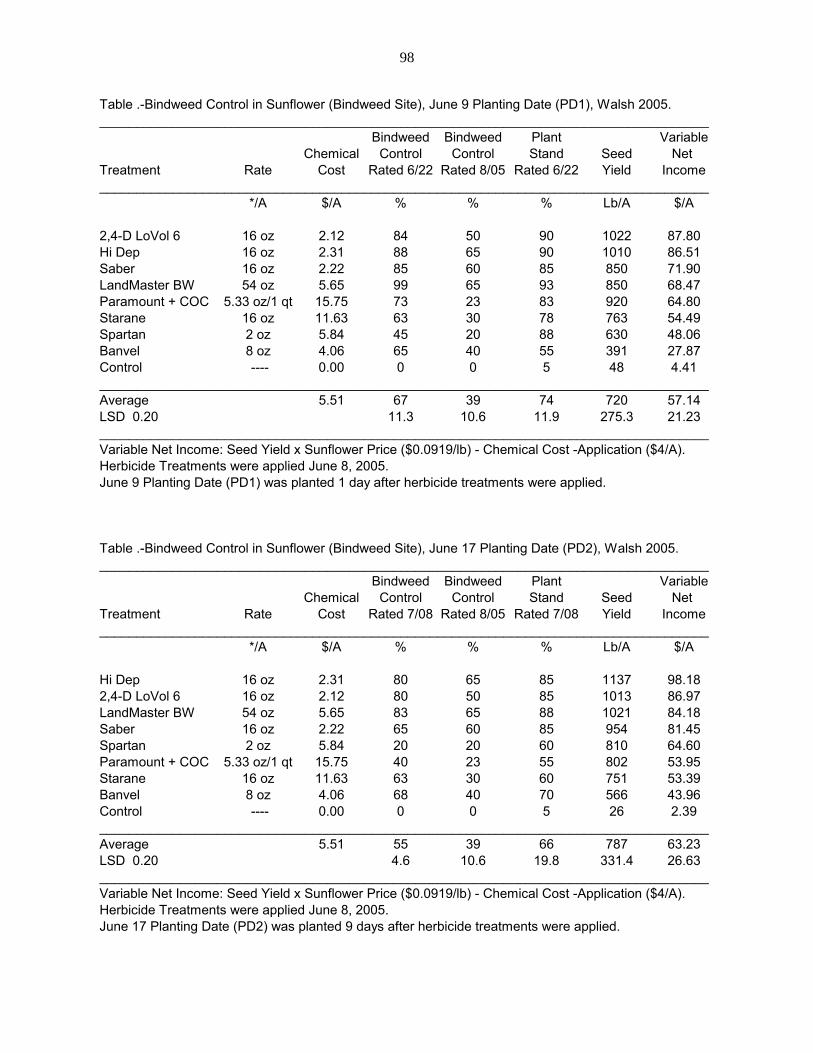
Table .-Bindweed Control in Sunflower (Bindweed Site), June 9 Planting Date (PD1), Walsh 2005.___________________________________________________________________________________
Bindweed Bindweed Plant VariableChemical Control Control Stand Seed Net
Treatment Rate Cost Rated 6/22 Rated 8/05 Rated 6/22 Yield Income___________________________________________________________________________________
*/A $/A % % % Lb/A $/A
2,4-D LoVol 6 16 oz 2.12 84 50 90 1022 87.80Hi Dep 16 oz 2.31 88 65 90 1010 86.51Saber 16 oz 2.22 85 60 85 850 71.90LandMaster BW 54 oz 5.65 99 65 93 850 68.47Paramount + COC 5.33 oz/1 qt 15.75 73 23 83 920 64.80Starane 16 oz 11.63 63 30 78 763 54.49Spartan 2 oz 5.84 45 20 88 630 48.06Banvel 8 oz 4.06 65 40 55 391 27.87Control ---- 0.00 0 0 5 48 4.41___________________________________________________________________________________Average 5.51 67 39 74 720 57.14LSD 0.20 11.3 10.6 11.9 275.3 21.23___________________________________________________________________________________Variable Net Income: Seed Yield x Sunflower Price ($0.0919/lb) - Chemical Cost -Application ($4/A).Herbicide Treatments were applied June 8, 2005.June 9 Planting Date (PD1) was planted 1 day after herbicide treatments were applied.
Table .-Bindweed Control in Sunflower (Bindweed Site), June 17 Planting Date (PD2), Walsh 2005.___________________________________________________________________________________
Bindweed Bindweed Plant VariableChemical Control Control Stand Seed Net
Treatment Rate Cost Rated 7/08 Rated 8/05 Rated 7/08 Yield Income___________________________________________________________________________________
*/A $/A % % % Lb/A $/A
Hi Dep 16 oz 2.31 80 65 85 1137 98.182,4-D LoVol 6 16 oz 2.12 80 50 85 1013 86.97LandMaster BW 54 oz 5.65 83 65 88 1021 84.18Saber 16 oz 2.22 65 60 85 954 81.45Spartan 2 oz 5.84 20 20 60 810 64.60Paramount + COC 5.33 oz/1 qt 15.75 40 23 55 802 53.95Starane 16 oz 11.63 63 30 60 751 53.39Banvel 8 oz 4.06 68 40 70 566 43.96Control ---- 0.00 0 0 5 26 2.39___________________________________________________________________________________Average 5.51 55 39 66 787 63.23LSD 0.20 4.6 10.6 19.8 331.4 26.63___________________________________________________________________________________Variable Net Income: Seed Yield x Sunflower Price ($0.0919/lb) - Chemical Cost -Application ($4/A).Herbicide Treatments were applied June 8, 2005.June 17 Planting Date (PD2) was planted 9 days after herbicide treatments were applied.
98

Table .-Bindweed Control in Sunflower (Bindweed Site), June 27 Planting Date (PD3), Walsh 2005.___________________________________________________________________________________
Bindweed Bindweed Plant VariableChemical Control Control Stand Seed Net
Treatment Rate Cost Rated 7/27 Rated 8/05 Rated 7/27 Yield Income___________________________________________________________________________________
*/A $/A % % % Lb/A $/A
Hi Dep 16 oz 2.31 60 65 88 946 80.63Saber 16 oz 2.22 58 60 78 858 72.632,4-D LoVol 6 16 oz 2.12 58 50 75 757 63.45LandMaster BW 54 oz 5.65 68 65 83 794 63.32Spartan 2 oz 5.84 13 20 50 619 47.05Banvel 8 oz 4.06 43 40 68 555 42.94Paramount + COC 5.33 oz/1 qt 15.75 15 23 45 538 29.69Starane 16 oz 11.63 25 30 48 473 27.84Control ---- 0.00 0 0 8 34 3.12___________________________________________________________________________________Average 5.51 38 39 60 619 47.85LSD 0.20 7.2 10.6 13.8 164.7 12.73___________________________________________________________________________________Variable Net Income: Seed Yield x Sunflower Price ($0.0919/lb) - Chemical Cost -Application ($4/A).Herbicide Treatments were applied June 8, 2005.June 27 Planting Date (PD3) was planted 19 days after herbicide treatments were applied.
Table .-Bindweed Control in Sunflower (Bindweed Site), July 6 Planting Date (PD4), Walsh 2005.___________________________________________________________________________________
Bindweed Bindweed Plant VariableChemical Control Control Stand Seed Net
Treatment Rate Cost Rated 8/05 Rated 6/22 Rated 8/05 Yield Income___________________________________________________________________________________
*/A $/A % % % Lb/A $/A
Hi Dep 16 oz 2.31 65 88 78 717 59.58Saber 16 oz 2.22 60 85 73 686 56.82LandMaster BW 54 oz 5.65 65 99 68 442 30.972,4-D LoVol 6 16 oz 2.12 50 84 53 307 22.09Banvel 8 oz 4.06 40 65 55 316 20.98Starane 16 oz 11.63 30 63 38 321 13.87Spartan 2 oz 5.84 20 45 15 146 3.58Control ---- 0.00 0 0 0 0 0.00Paramount + COC 5.33 oz/1 qt 15.75 23 73 10 68 -13.50___________________________________________________________________________________Average 5.51 39 67 43 334 21.60LSD 0.20 10.6 11.3 19.3 186.9 12.73___________________________________________________________________________________Variable Net Income: Seed Yield x Sunflower Price ($0.0919/lb) - Chemical Cost -Application ($4/A).Herbicide Treatments were applied June 8, 2005.July 6 Planting Date (PD4) was planted 28 days after herbicide treatments were applied.
99

Table .Sunflower (Non Bindweed Site), June 9 Planting Date (PD1), Walsh 2005._________________________________________________________________________
Plant Pigweed VariableChemical Stand Control Seed Net
Treatment Rate Cost Rated 6/22 Rated 7/27 Yield Income_________________________________________________________________________
*/A $/A % % Lb/A $/A
2,4-D LoVol 6 16 oz 2.12 88 88 839 70.98LandMaster BW 54 oz 5.65 85 100 847 68.19Control ---- 0.00 97 35 757 65.57Paramount + COC 5.33 oz/1 qt 15.75 80 70 906 63.51Banvel 8 oz 4.06 63 85 765 62.24Spartan 2 oz 5.84 88 92 757 59.73Saber 16 oz 2.22 75 90 681 56.36Hi Dep 16 oz 2.31 78 90 681 56.27Starane 16 oz 11.63 85 40 768 54.95_________________________________________________________________________Average 5.51 82 77 778 61.98LSD 0.20 7.8 9.9 173.2 13.80_________________________________________________________________________Variable Net Income: Seed Yield x Sunflower Price ($0.0919/lb) - Chemical Cost.Herbicide Treatments were applied June 8, 2005.June 9 Planting Date (PD1) was planted 1 day after herbicide treatments were applied.
Table .Sunflower (Non Bindweed Site), June 17 Planting Date (PD2), Walsh 2005._________________________________________________________________________
Plant Pigweed VariableChemical Stand Control Seed Net
Treatment Rate Cost Rated 7/08 Rated 7/27 Yield Income_________________________________________________________________________
*/A $/A % % Lb/A $/A
Saber 16 oz 2.22 83 90 861 72.91Spartan 2 oz 5.84 80 92 887 71.68LandMaster BW 54 oz 5.65 83 100 797 63.59Paramount + COC 5.33 oz/1 qt 15.75 78 70 889 61.95Banvel 8 oz 4.06 80 85 735 59.492,4-D LoVol 6 16 oz 2.12 85 88 678 56.19Starane 16 oz 11.63 75 40 746 52.93Hi Dep 16 oz 2.31 88 90 630 51.59Control ---- 0.00 80 35 521 43.88_________________________________________________________________________Average 5.51 81 77 749 59.35LSD 0.20 13.1 9.9 196.7 13.80_________________________________________________________________________Variable Net Income: Seed Yield x Sunflower Price ($0.0919/lb) - Chemical Cost.Herbicide Treatments were applied June 8, 2005.June 17 Planting Date (PD2) was planted 9 days after herbicide treatments were applied.
100

Table .Sunflower (Non Bindweed Site), June 27 Planting Date (PD3), Walsh 2005._________________________________________________________________________
Plant Pigweed VariableChemical Stand Control Seed Net
Treatment Rate Cost Rated 7/08 Rated 7/27 Yield Income_________________________________________________________________________
*/A $/A % % Lb/A $/A
Hi Dep 16 oz 2.31 80 90 979 83.662,4-D LoVol 6 16 oz 2.12 78 88 929 79.26Saber 16 oz 2.22 83 90 900 76.49LandMaster BW 54 oz 5.65 83 100 872 70.49Control ---- 0.00 70 35 721 62.26Banvel 8 oz 4.06 70 85 720 58.11Spartan 2 oz 5.84 78 92 723 56.60Starane 16 oz 11.63 55 40 667 45.67Paramount + COC 5.33 oz/1 qt 15.75 70 70 695 44.12_________________________________________________________________________Average 5.51 74 77 801 64.07LSD 0.20 13.2 9.9 219.1 17.53_________________________________________________________________________Variable Net Income: Seed Yield x Sunflower Price ($0.0919/lb) - Chemical Cost.Herbicide Treatments were applied June 8, 2005.June 27 Planting Date (PD3) was planted 19 days after herbicide treatments were applied.
Table .Sunflower (Non Bindweed Site), July 6 Planting Date (PD4), Walsh 2005._________________________________________________________________________
Plant Pigweed VariableChemical Stand Control Seed Net
Treatment Rate Cost Rated 8/05 Rated 7/27 Yield Income_________________________________________________________________________
*/A $/A % % Lb/A $/A
LandMaster BW 54 oz 5.65 88 100 951 77.75Saber 16 oz 2.22 70 90 828 69.87Banvel 8 oz 4.06 85 85 847 69.78Hi Dep 16 oz 2.31 78 90 757 63.26Paramount + COC 5.33 oz/1 qt 15.75 80 70 895 62.502,4-D LoVol 6 16 oz 2.12 68 88 659 54.44Spartan 2 oz 5.84 50 92 608 46.04Control ---- 0.00 63 35 540 45.63Starane 16 oz 11.63 55 40 574 37.12_________________________________________________________________________Average 5.51 71 77 740 58.49LSD 0.20 19.8 9.9 134.1 10.60_________________________________________________________________________Variable Net Income: Seed Yield x Sunflower Price ($0.0919/lb) - Chemical Cost.Herbicide Treatments were applied June 8, 2005.July 6 Planting Date (PD4) was planted 28 days after herbicide treatments were applied.
101
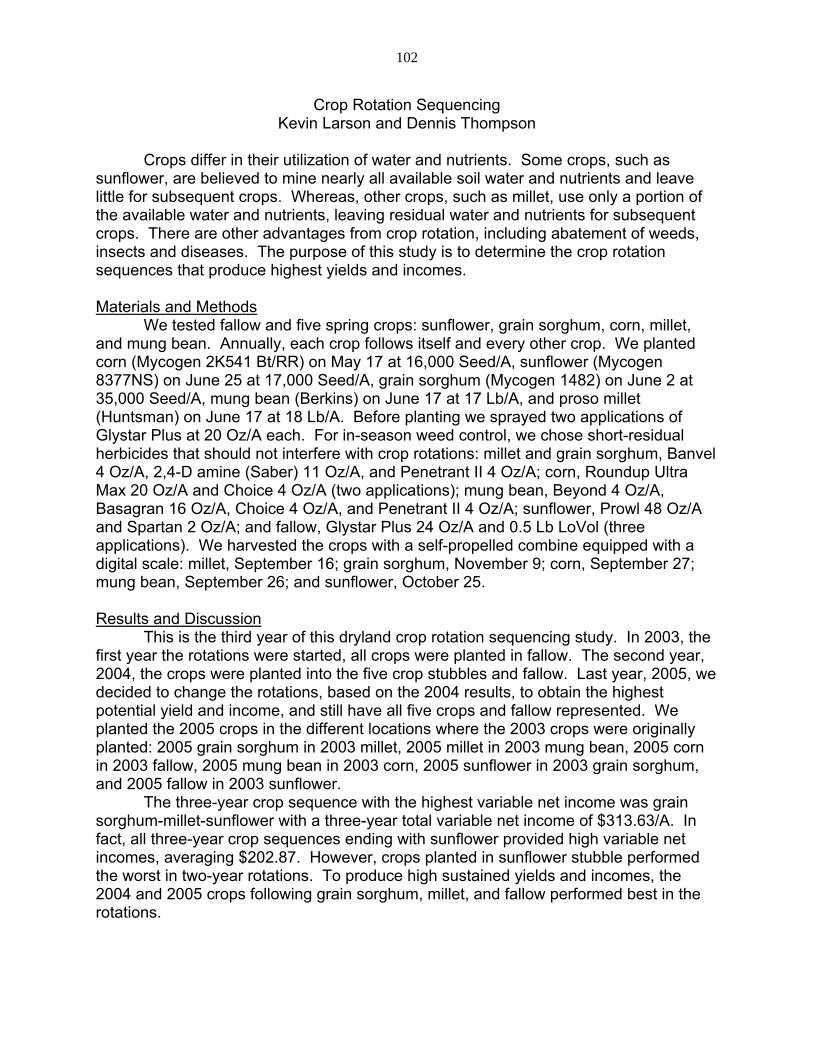
Crop Rotation Sequencing Kevin Larson and Dennis Thompson
Crops differ in their utilization of water and nutrients. Some crops, such as sunflower, are believed to mine nearly all available soil water and nutrients and leave little for subsequent crops. Whereas, other crops, such as millet, use only a portion of the available water and nutrients, leaving residual water and nutrients for subsequent crops. There are other advantages from crop rotation, including abatement of weeds, insects and diseases. The purpose of this study is to determine the crop rotation sequences that produce highest yields and incomes. Materials and Methods We tested fallow and five spring crops: sunflower, grain sorghum, corn, millet, and mung bean. Annually, each crop follows itself and every other crop. We planted corn (Mycogen 2K541 Bt/RR) on May 17 at 16,000 Seed/A, sunflower (Mycogen 8377NS) on June 25 at 17,000 Seed/A, grain sorghum (Mycogen 1482) on June 2 at 35,000 Seed/A, mung bean (Berkins) on June 17 at 17 Lb/A, and proso millet (Huntsman) on June 17 at 18 Lb/A. Before planting we sprayed two applications of Glystar Plus at 20 Oz/A each. For in-season weed control, we chose short-residual herbicides that should not interfere with crop rotations: millet and grain sorghum, Banvel 4 Oz/A, 2,4-D amine (Saber) 11 Oz/A, and Penetrant II 4 Oz/A; corn, Roundup Ultra Max 20 Oz/A and Choice 4 Oz/A (two applications); mung bean, Beyond 4 Oz/A, Basagran 16 Oz/A, Choice 4 Oz/A, and Penetrant II 4 Oz/A; sunflower, Prowl 48 Oz/A and Spartan 2 Oz/A; and fallow, Glystar Plus 24 Oz/A and 0.5 Lb LoVol (three applications). We harvested the crops with a self-propelled combine equipped with a digital scale: millet, September 16; grain sorghum, November 9; corn, September 27; mung bean, September 26; and sunflower, October 25. Results and Discussion This is the third year of this dryland crop rotation sequencing study. In 2003, the first year the rotations were started, all crops were planted in fallow. The second year, 2004, the crops were planted into the five crop stubbles and fallow. Last year, 2005, we decided to change the rotations, based on the 2004 results, to obtain the highest potential yield and income, and still have all five crops and fallow represented. We planted the 2005 crops in the different locations where the 2003 crops were originally planted: 2005 grain sorghum in 2003 millet, 2005 millet in 2003 mung bean, 2005 corn in 2003 fallow, 2005 mung bean in 2003 corn, 2005 sunflower in 2003 grain sorghum, and 2005 fallow in 2003 sunflower.
The three-year crop sequence with the highest variable net income was grain sorghum-millet-sunflower with a three-year total variable net income of $313.63/A. In fact, all three-year crop sequences ending with sunflower provided high variable net incomes, averaging $202.87. However, crops planted in sunflower stubble performed the worst in two-year rotations. To produce high sustained yields and incomes, the 2004 and 2005 crops following grain sorghum, millet, and fallow performed best in the rotations.
102

In 2004, millet following grain sorghum had the highest total variable net income for the 2003 and 2004 crops, $281/A. A close second was millet following millet (continuous millet) with a two-year total net variable income of $275/A. In 2003, the first year of this dryland crop rotation sequencing study, all the crops followed fallow. The first year millet produced the highest viable net income, $126.83/A. After the first year, we stated that rotations with millet would have an economic advantage. After reviewing the results from 2004, we decided that the 2005 grain sorghum crop would be planted in the 2003 millet location. This sequence change provided yield and income advantages to grain sorghum. The sunflower crop was also given a yield and economic advantage by planting the 2005 sunflower crop in the 2003 grain sorghum location.
The growing season for 2005 was very dry, particularly in for the month of July. Lack of adequate moisture in July and early August produced very low grain yields for corn. The best corn yield occurred following double summer fallow; however, the yield was only 3 Bu/A. Crops that were able to utilize the stored soil moisture, such as millet, grain sorghum, and sunflower performed well. The crop stubbles and fallow with the highest stored soil moisture were fallow, grain sorghum, and millet. These are the same three crops that produce high sustained yields and incomes in the crop rotations.
Table .-Stored Soil Moisture of Crop Rotation Sequence Study Prior to Planting from Soil Probe, Walsh, 2005.
____________________________________________ Depth of
Soil Moisture Previous Crop Probe ____________________________________________ ft.
Fallow 5.5 Grain Sorghum 4.5 Millet 4.3 Bean 4.0 Corn 3.0 Sunflower 2.5
____________________________________________ Average 4.0 ____________________________________________
103
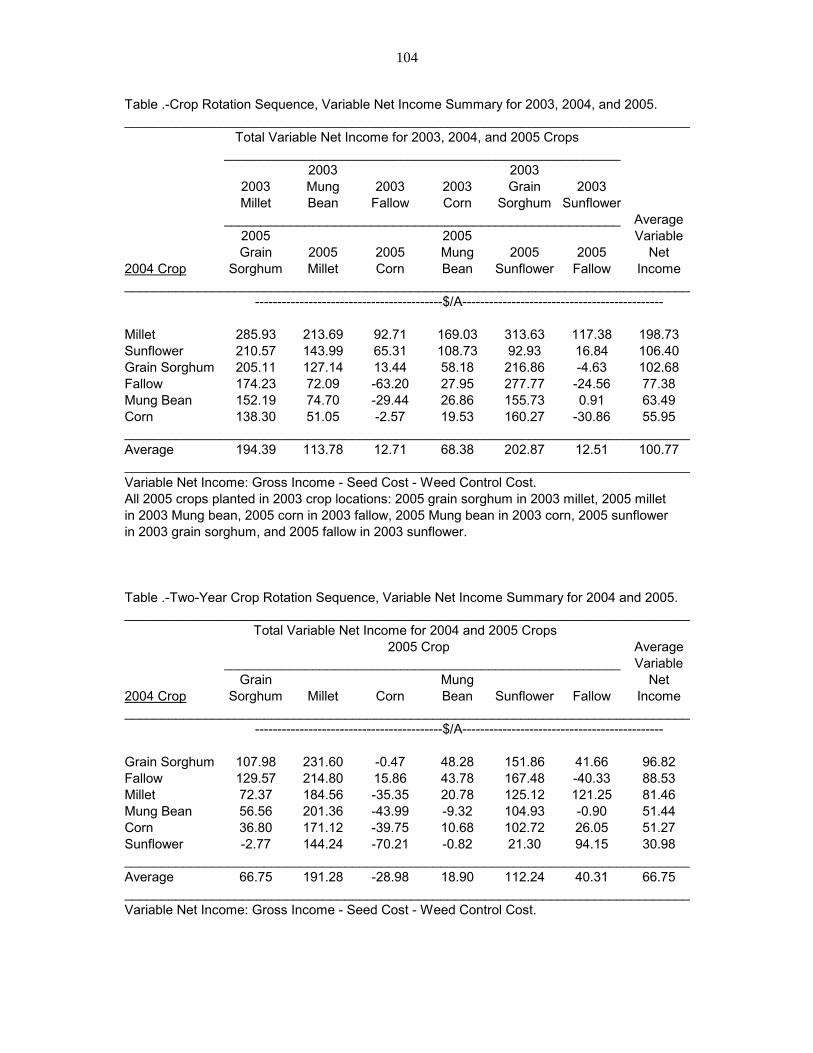
Table .-Crop Rotation Sequence, Variable Net Income Summary for 2003, 2004, and 2005._____________________________________________________________________________
Total Variable Net Income for 2003, 2004, and 2005 Crops______________________________________________________
2003 20032003 Mung 2003 2003 Grain 2003Millet Bean Fallow Corn Sorghum Sunflower
______________________________________________________ Average2005 2005 VariableGrain 2005 2005 Mung 2005 2005 Net
2004 Crop Sorghum Millet Corn Bean Sunflower Fallow Income_____________________________________________________________________________
------------------------------------------$/A---------------------------------------------
Millet 285.93 213.69 92.71 169.03 313.63 117.38 198.73Sunflower 210.57 143.99 65.31 108.73 92.93 16.84 106.40Grain Sorghum 205.11 127.14 13.44 58.18 216.86 -4.63 102.68Fallow 174.23 72.09 -63.20 27.95 277.77 -24.56 77.38Mung Bean 152.19 74.70 -29.44 26.86 155.73 0.91 63.49Corn 138.30 51.05 -2.57 19.53 160.27 -30.86 55.95_____________________________________________________________________________Average 194.39 113.78 12.71 68.38 202.87 12.51 100.77_____________________________________________________________________________Variable Net Income: Gross Income - Seed Cost - Weed Control Cost.All 2005 crops planted in 2003 crop locations: 2005 grain sorghum in 2003 millet, 2005 milletin 2003 Mung bean, 2005 corn in 2003 fallow, 2005 Mung bean in 2003 corn, 2005 sunflowerin 2003 grain sorghum, and 2005 fallow in 2003 sunflower.
Table .-Two-Year Crop Rotation Sequence, Variable Net Income Summary for 2004 and 2005._____________________________________________________________________________
Total Variable Net Income for 2004 and 2005 Crops 2005 Crop Average
______________________________________________________ VariableGrain Mung Net
2004 Crop Sorghum Millet Corn Bean Sunflower Fallow Income_____________________________________________________________________________
------------------------------------------$/A---------------------------------------------
Grain Sorghum 107.98 231.60 -0.47 48.28 151.86 41.66 96.82Fallow 129.57 214.80 15.86 43.78 167.48 -40.33 88.53Millet 72.37 184.56 -35.35 20.78 125.12 121.25 81.46Mung Bean 56.56 201.36 -43.99 -9.32 104.93 -0.90 51.44Corn 36.80 171.12 -39.75 10.68 102.72 26.05 51.27Sunflower -2.77 144.24 -70.21 -0.82 21.30 94.15 30.98_____________________________________________________________________________Average 66.75 191.28 -28.98 18.90 112.24 40.31 66.75_____________________________________________________________________________Variable Net Income: Gross Income - Seed Cost - Weed Control Cost.
104
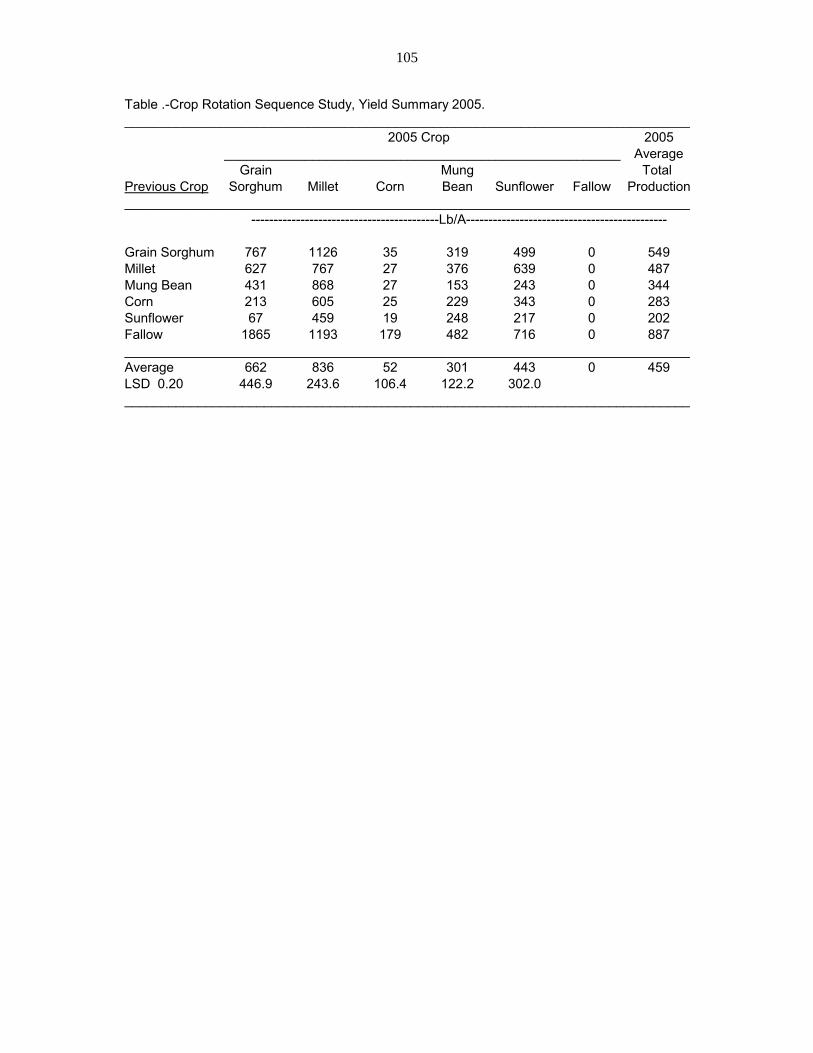
Table .-Crop Rotation Sequence Study, Yield Summary 2005._____________________________________________________________________________
2005 Crop 2005______________________________________________________ Average
Grain Mung Total Previous Crop Sorghum Millet Corn Bean Sunflower Fallow Production_____________________________________________________________________________
------------------------------------------Lb/A---------------------------------------------
Grain Sorghum 767 1126 35 319 499 0 549Millet 627 767 27 376 639 0 487Mung Bean 431 868 27 153 243 0 344Corn 213 605 25 229 343 0 283Sunflower 67 459 19 248 217 0 202Fallow 1865 1193 179 482 716 0 887_____________________________________________________________________________Average 662 836 52 301 443 0 459LSD 0.20 446.9 243.6 106.4 122.2 302.0_____________________________________________________________________________
105
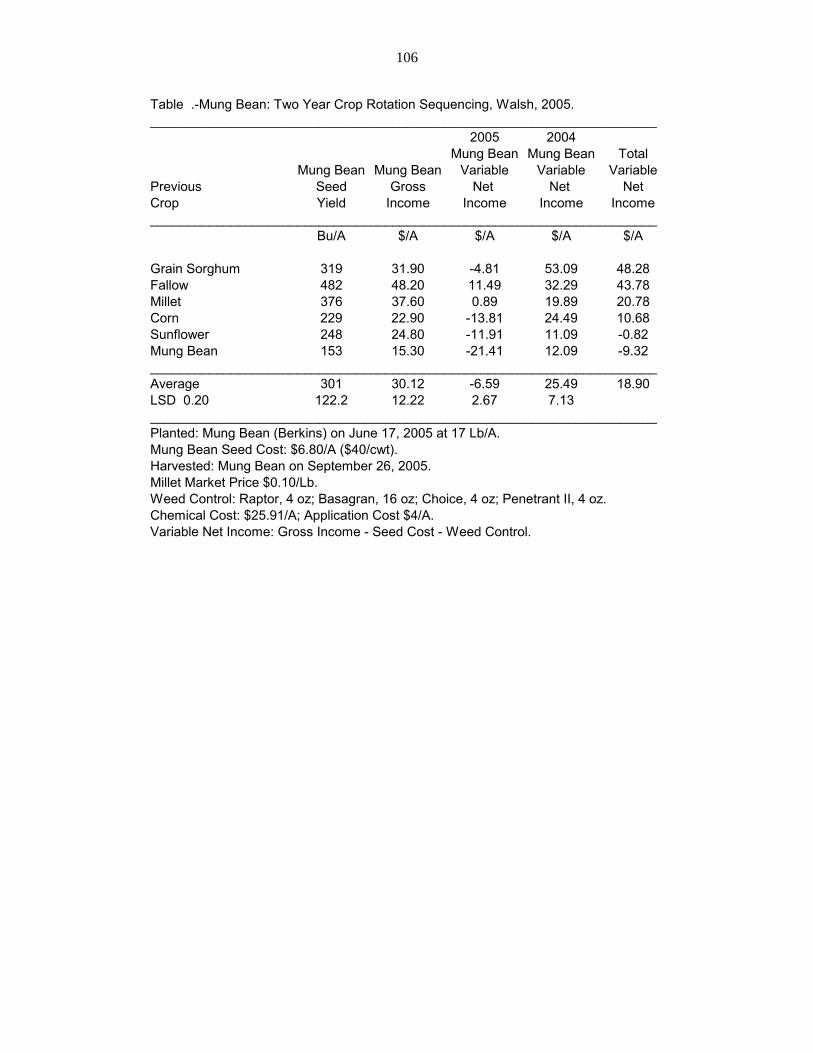
Table .-Mung Bean: Two Year Crop Rotation Sequencing, Walsh, 2005._____________________________________________________________________
2005 2004Mung Bean Mung Bean Total
Mung Bean Mung Bean Variable Variable VariablePrevious Seed Gross Net Net NetCrop Yield Income Income Income Income_____________________________________________________________________
Bu/A $/A $/A $/A $/A
Grain Sorghum 319 31.90 -4.81 53.09 48.28Fallow 482 48.20 11.49 32.29 43.78Millet 376 37.60 0.89 19.89 20.78Corn 229 22.90 -13.81 24.49 10.68Sunflower 248 24.80 -11.91 11.09 -0.82Mung Bean 153 15.30 -21.41 12.09 -9.32_____________________________________________________________________Average 301 30.12 -6.59 25.49 18.90LSD 0.20 122.2 12.22 2.67 7.13_____________________________________________________________________Planted: Mung Bean (Berkins) on June 17, 2005 at 17 Lb/A. Mung Bean Seed Cost: $6.80/A ($40/cwt).Harvested: Mung Bean on September 26, 2005.Millet Market Price $0.10/Lb.Weed Control: Raptor, 4 oz; Basagran, 16 oz; Choice, 4 oz; Penetrant II, 4 oz. Chemical Cost: $25.91/A; Application Cost $4/A.Variable Net Income: Gross Income - Seed Cost - Weed Control.
106

Table .-Mung Bean: Three-Year Crop Rotation Sequencing Study, Walsh, 2005._____________________________________________________________________________
2005Mung Bean 2004
in 2004 Crop inCrop Corn 2003
2005 2005 Stubble Stubble Corn TotalMung Bean Mung Bean Variable Variable Variable Variable
2004 Seed Gross Net Net Net NetCrop Yield Income Income Income Income Income_____________________________________________________________________________
Bu/A $/A $/A $/A $/A $/A
Millet 376 37.60 0.89 144.36 23.78 169.03Sunflower 248 24.80 -11.91 96.86 23.78 108.73Grain Sorghum 319 31.90 -4.81 39.21 23.78 58.18Mung Bean 153 15.30 -21.41 24.49 23.78 26.86Fallow 482 48.20 11.49 -14.38 23.78 20.89Corn 229 22.90 -13.81 9.56 23.78 19.53_____________________________________________________________________________Average 301 30.12 -6.59 50.02 23.78 67.20LSD 0.20 122.2 12.22 2.67 7.13_____________________________________________________________________________Planted: Mung Bean (Berkins) on June 17, 2005 at 17 Lb/A. Mung Bean Seed Cost: $6.80/A ($40/cwt).Harvested: Mung Bean on September 26, 2005.Millet Market Price $0.10/Lb.Weed Control: Raptor, 4 oz; Basagran, 16 oz; Choice, 4 oz; Penetrant II, 4 oz. Chemical Cost: $25.91/A; Application Cost $4/A.Variable Net Income: Gross Income - Seed Cost - Weed Control.The 2005 bean crop was planted in the 2003 corn location: for millet the rotationwas corn-millet-bean.
107
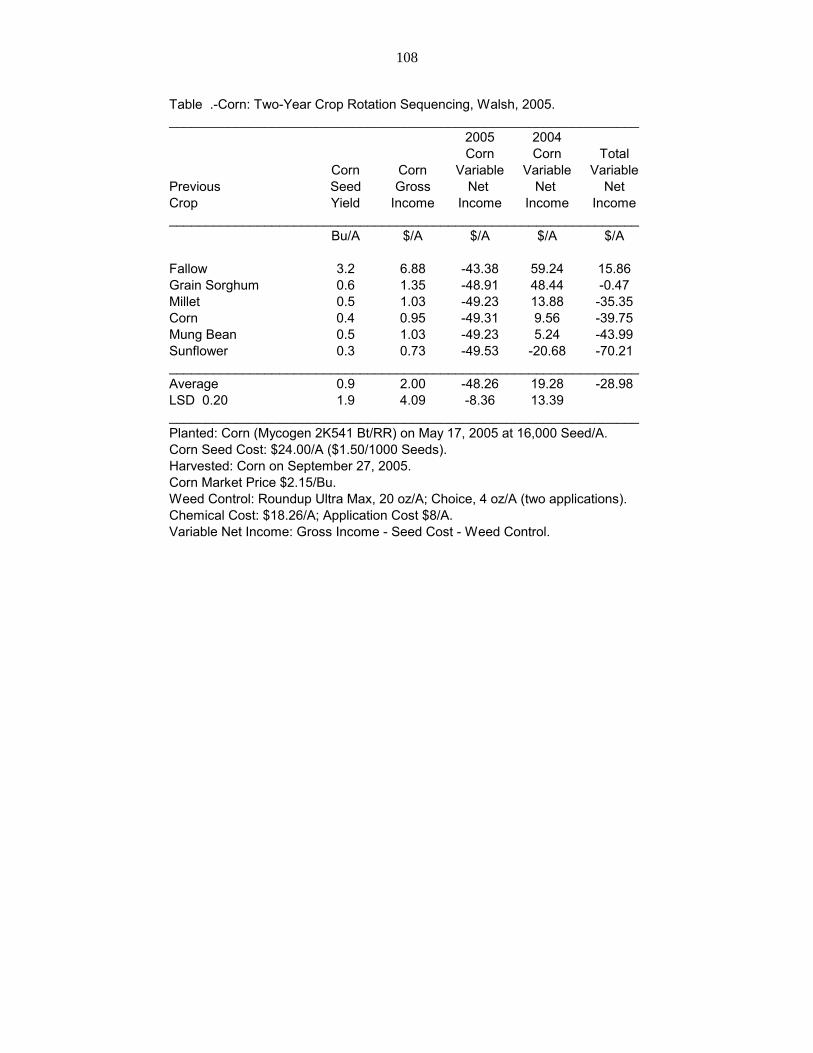
Table .-Corn: Two-Year Crop Rotation Sequencing, Walsh, 2005.________________________________________________________________
2005 2004Corn Corn Total
Corn Corn Variable Variable VariablePrevious Seed Gross Net Net NetCrop Yield Income Income Income Income________________________________________________________________
Bu/A $/A $/A $/A $/A
Fallow 3.2 6.88 -43.38 59.24 15.86Grain Sorghum 0.6 1.35 -48.91 48.44 -0.47Millet 0.5 1.03 -49.23 13.88 -35.35Corn 0.4 0.95 -49.31 9.56 -39.75Mung Bean 0.5 1.03 -49.23 5.24 -43.99Sunflower 0.3 0.73 -49.53 -20.68 -70.21________________________________________________________________Average 0.9 2.00 -48.26 19.28 -28.98LSD 0.20 1.9 4.09 -8.36 13.39________________________________________________________________Planted: Corn (Mycogen 2K541 Bt/RR) on May 17, 2005 at 16,000 Seed/A. Corn Seed Cost: $24.00/A ($1.50/1000 Seeds).Harvested: Corn on September 27, 2005.Corn Market Price $2.15/Bu.Weed Control: Roundup Ultra Max, 20 oz/A; Choice, 4 oz/A (two applications). Chemical Cost: $18.26/A; Application Cost $8/A.Variable Net Income: Gross Income - Seed Cost - Weed Control.
108
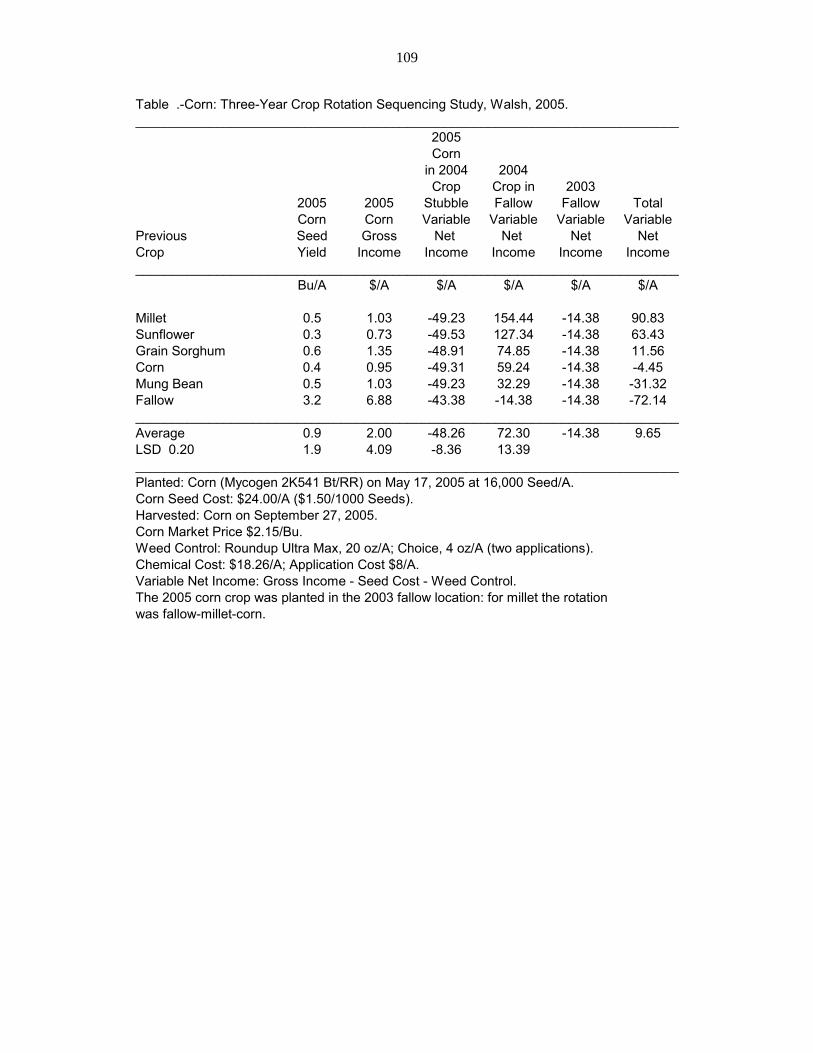
Table .-Corn: Three-Year Crop Rotation Sequencing Study, Walsh, 2005.__________________________________________________________________________
2005Corn
in 2004 2004Crop Crop in 2003
2005 2005 Stubble Fallow Fallow TotalCorn Corn Variable Variable Variable Variable
Previous Seed Gross Net Net Net NetCrop Yield Income Income Income Income Income__________________________________________________________________________
Bu/A $/A $/A $/A $/A $/A
Millet 0.5 1.03 -49.23 154.44 -14.38 90.83Sunflower 0.3 0.73 -49.53 127.34 -14.38 63.43Grain Sorghum 0.6 1.35 -48.91 74.85 -14.38 11.56Corn 0.4 0.95 -49.31 59.24 -14.38 -4.45Mung Bean 0.5 1.03 -49.23 32.29 -14.38 -31.32Fallow 3.2 6.88 -43.38 -14.38 -14.38 -72.14__________________________________________________________________________Average 0.9 2.00 -48.26 72.30 -14.38 9.65LSD 0.20 1.9 4.09 -8.36 13.39__________________________________________________________________________Planted: Corn (Mycogen 2K541 Bt/RR) on May 17, 2005 at 16,000 Seed/A. Corn Seed Cost: $24.00/A ($1.50/1000 Seeds).Harvested: Corn on September 27, 2005.Corn Market Price $2.15/Bu.Weed Control: Roundup Ultra Max, 20 oz/A; Choice, 4 oz/A (two applications). Chemical Cost: $18.26/A; Application Cost $8/A.Variable Net Income: Gross Income - Seed Cost - Weed Control.The 2005 corn crop was planted in the 2003 fallow location: for millet the rotationwas fallow-millet-corn.
109

Table .-Grain Sorghum: Two-Year Crop Rotation Sequencing, Walsh, 2005.________________________________________________________________
2005 2004Grain Grain
Grain Grain Sorghum Sorghum TotalSorghum Sorghum Variable Variable Variable
Previous Seed Gross Net Net NetCrop Yield Income Income Income Income________________________________________________________________
Bu/A $/A $/A $/A $/A
Fallow 33 65.01 54.72 74.85 129.57Grain Sorghum 14 27.58 17.29 90.69 107.98Millet 11 21.67 11.38 60.99 72.37Mung Bean 8 15.76 5.47 51.09 56.56Corn 4 7.88 -2.41 39.21 36.80Sunflower 1 1.97 -8.32 5.55 -2.77________________________________________________________________Average 12 23.31 13.02 53.73 66.75LSD 0.20 8.0 15.76 8.80 20.65________________________________________________________________Planted: Grain Sorghum (Mycogen 1482) on June 2, 2005 at 35,000 Seed/A. Grain Sorghum Seed Cost: $2.50/A ($1.00/lb).Harvested: Grain Sorghum November 9, 2005.Grain Sorghum Market Price $1.97/Bu.Weed Control: Banvel, 4 oz; Saber, 11 oz; Penetrant II, 4 oz. Chemical Cost: $3.79/A; Application Cost $4/A.Variable Net Income: Gross Income - Seed Cost - Weed Control.
110

Table .-Grain Sorghum: Three-Year Crop Rotation Sequencing Study, Walsh, 2005.__________________________________________________________________________
2005Grain
Sorghum 2004in 2004 Crop in
2005 2005 Crop Millet 2003Grain Grain Stubble Stubble Millet Total
Sorghum Sorghum Variable Variable Variable Variable2004 Seed Gross Net Net Net NetCrop Yield Income Income Income Income Income__________________________________________________________________________
Bu/A $/A $/A $/A $/A $/A
Millet 11 21.67 11.38 147.72 126.83 285.93Sunflower 1 1.97 -8.32 92.06 126.83 210.57Grain Sorghum 14 27.58 17.29 60.99 126.83 205.11Fallow 33 65.01 54.72 -14.38 126.83 167.17Mung Bean 8 15.76 5.47 19.89 126.83 152.19Corn 4 7.88 -2.41 13.88 126.83 138.30__________________________________________________________________________Average 12 23.31 13.02 53.36 126.83 193.21LSD 0.20 8.0 15.76 8.80 20.65__________________________________________________________________________Planted: Grain Sorghum (Mycogen 1482) on June 2, 2005 at 35,000 Seed/A. Grain Sorghum Seed Cost: $2.50/A ($1.00/lb).Harvested: Grain Sorghum November 9, 2005.Grain Sorghum Market Price $1.97/Bu.Weed Control: Banvel, 4 oz; Saber, 11 oz; Penetrant II, 4 oz. Chemical Cost: $3.79/A; Application Cost $4/A.Variable Net Income: Gross Income - Seed Cost - Weed Control.The 2005 grain sorghum crop was planted in the 2003 millet location: for millet the rotation was millet-millet-grain sorghum.
111
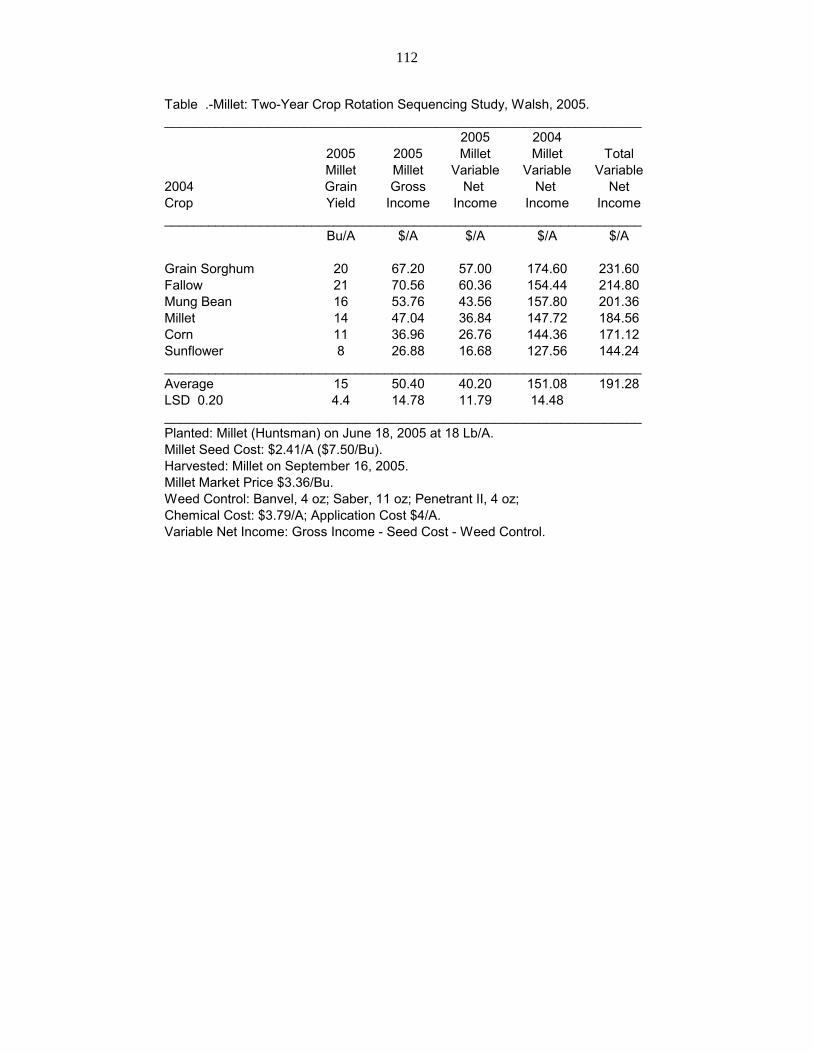
Table .-Millet: Two-Year Crop Rotation Sequencing Study, Walsh, 2005._________________________________________________________________
2005 20042005 2005 Millet Millet TotalMillet Millet Variable Variable Variable
2004 Grain Gross Net Net NetCrop Yield Income Income Income Income_________________________________________________________________
Bu/A $/A $/A $/A $/A
Grain Sorghum 20 67.20 57.00 174.60 231.60Fallow 21 70.56 60.36 154.44 214.80Mung Bean 16 53.76 43.56 157.80 201.36Millet 14 47.04 36.84 147.72 184.56Corn 11 36.96 26.76 144.36 171.12Sunflower 8 26.88 16.68 127.56 144.24_________________________________________________________________Average 15 50.40 40.20 151.08 191.28LSD 0.20 4.4 14.78 11.79 14.48_________________________________________________________________Planted: Millet (Huntsman) on June 18, 2005 at 18 Lb/A. Millet Seed Cost: $2.41/A ($7.50/Bu).Harvested: Millet on September 16, 2005.Millet Market Price $3.36/Bu.Weed Control: Banvel, 4 oz; Saber, 11 oz; Penetrant II, 4 oz; Chemical Cost: $3.79/A; Application Cost $4/A.Variable Net Income: Gross Income - Seed Cost - Weed Control.
112

Table .-Millet: Three-Year Crop Rotation Sequencing Study, Walsh, 2005.____________________________________________________________________________
2005Millet 2004
in 2004 Crop inCrop Mung Bean 2003
2005 2005 Stubble Stubble Mung Bean TotalMillet Millet Variable Variable Variable Variable
2004 Seed Gross Net Net Net NetCrop Yield Income Income Income Income Income____________________________________________________________________________
Bu/A $/A $/A $/A $/A $/A
Millet 14 47.04 36.84 157.80 19.05 213.69Sunflower 8 26.88 16.68 108.26 19.05 143.99Grain Sorghum 20 67.20 57.00 51.09 19.05 127.14Mung Bean 16 53.76 43.56 12.09 19.05 74.70Fallow 21 70.56 60.36 -14.38 19.05 65.03Corn 11 36.96 26.76 5.24 19.05 51.05____________________________________________________________________________Average 15 50.40 40.20 53.35 19.05 112.60LSD 0.20 4.4 14.78 11.79 14.48____________________________________________________________________________Planted: Millet (Huntsman) on June 18, 2005 at 18 Lb/A. Millet Seed Cost: $2.41/A ($7.50/Bu).Harvested: Millet on September 16, 2005.Millet Market Price $3.36/Bu.Weed Control: Banvel, 4 oz; Saber, 11 oz; Penetrant II, 4 oz; Chemical Cost: $3.79/A; Application Cost $4/A.Variable Net Income: Gross Income - Seed Cost - Weed Control.The 2005 millet crop was planted in the 2003 bean location: for corn the rotationwas bean-corn-millet.
113
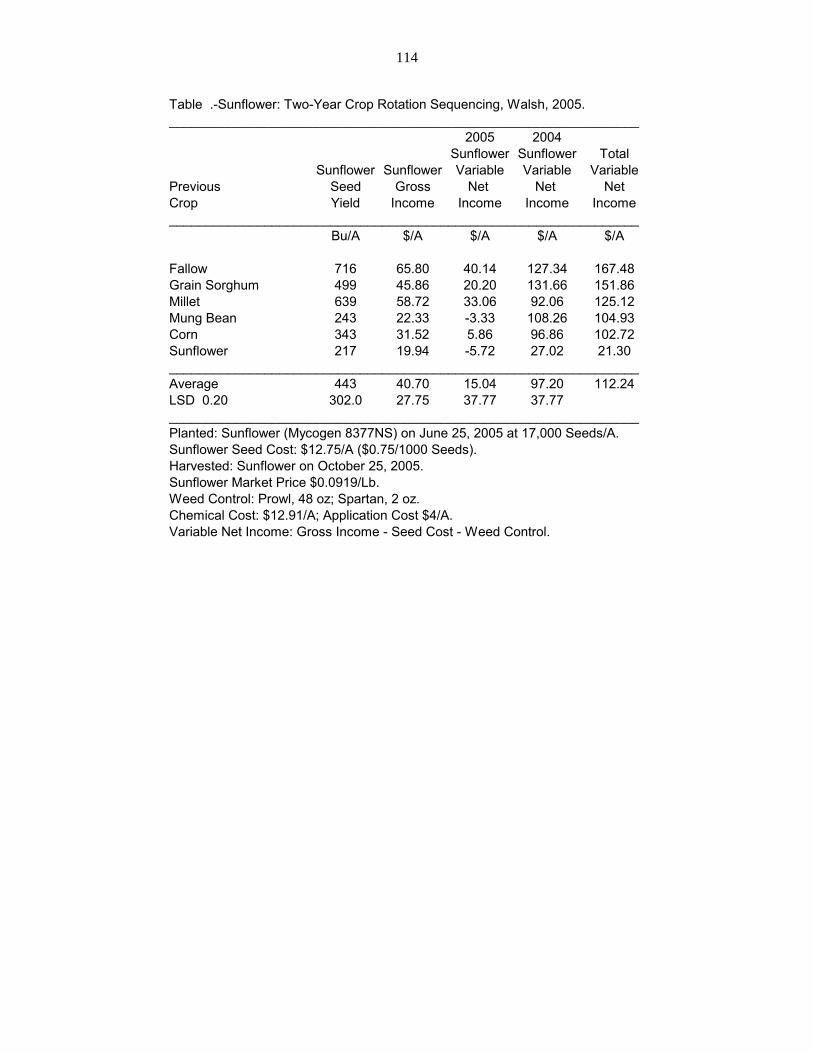
Table .-Sunflower: Two-Year Crop Rotation Sequencing, Walsh, 2005.________________________________________________________________
2005 2004Sunflower Sunflower Total
Sunflower Sunflower Variable Variable VariablePrevious Seed Gross Net Net NetCrop Yield Income Income Income Income________________________________________________________________
Bu/A $/A $/A $/A $/A
Fallow 716 65.80 40.14 127.34 167.48Grain Sorghum 499 45.86 20.20 131.66 151.86Millet 639 58.72 33.06 92.06 125.12Mung Bean 243 22.33 -3.33 108.26 104.93Corn 343 31.52 5.86 96.86 102.72Sunflower 217 19.94 -5.72 27.02 21.30________________________________________________________________Average 443 40.70 15.04 97.20 112.24LSD 0.20 302.0 27.75 37.77 37.77________________________________________________________________Planted: Sunflower (Mycogen 8377NS) on June 25, 2005 at 17,000 Seeds/A. Sunflower Seed Cost: $12.75/A ($0.75/1000 Seeds).Harvested: Sunflower on October 25, 2005.Sunflower Market Price $0.0919/Lb.Weed Control: Prowl, 48 oz; Spartan, 2 oz. Chemical Cost: $12.91/A; Application Cost $4/A.Variable Net Income: Gross Income - Seed Cost - Weed Control.
114
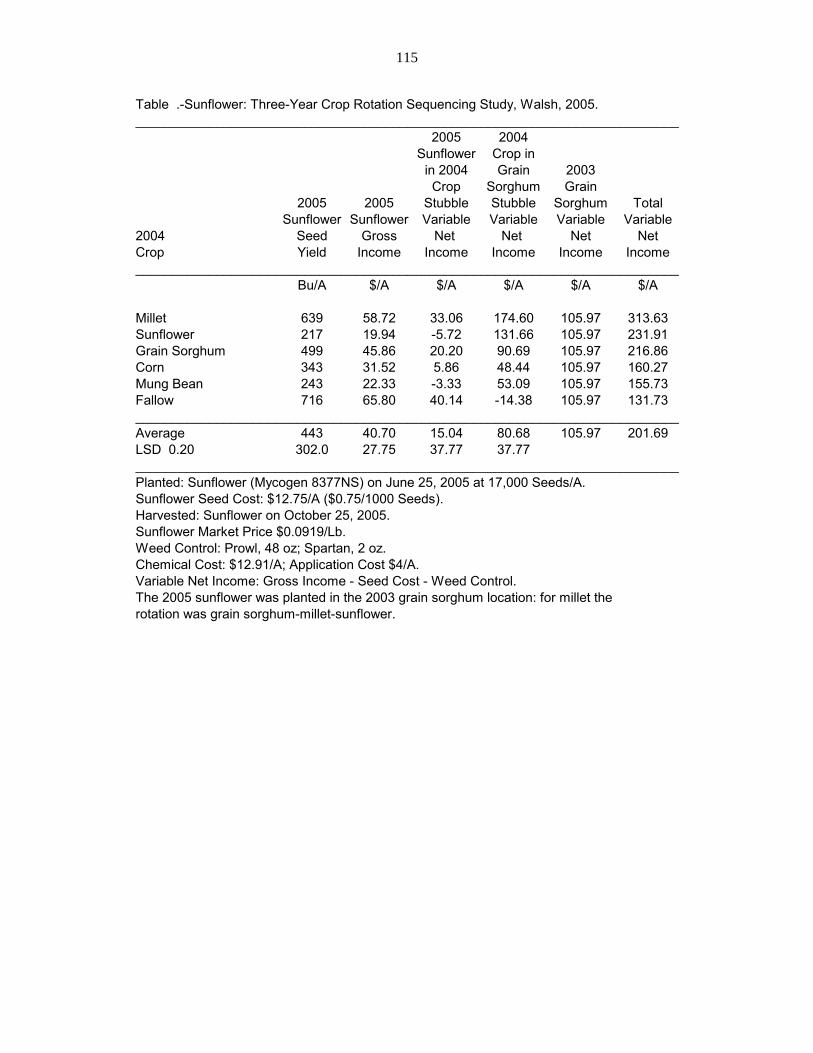
Table .-Sunflower: Three-Year Crop Rotation Sequencing Study, Walsh, 2005.__________________________________________________________________________
2005 2004Sunflower Crop in
in 2004 Grain 2003Crop Sorghum Grain
2005 2005 Stubble Stubble Sorghum TotalSunflower Sunflower Variable Variable Variable Variable
2004 Seed Gross Net Net Net NetCrop Yield Income Income Income Income Income__________________________________________________________________________
Bu/A $/A $/A $/A $/A $/A
Millet 639 58.72 33.06 174.60 105.97 313.63Sunflower 217 19.94 -5.72 131.66 105.97 231.91Grain Sorghum 499 45.86 20.20 90.69 105.97 216.86Corn 343 31.52 5.86 48.44 105.97 160.27Mung Bean 243 22.33 -3.33 53.09 105.97 155.73Fallow 716 65.80 40.14 -14.38 105.97 131.73__________________________________________________________________________Average 443 40.70 15.04 80.68 105.97 201.69LSD 0.20 302.0 27.75 37.77 37.77__________________________________________________________________________Planted: Sunflower (Mycogen 8377NS) on June 25, 2005 at 17,000 Seeds/A. Sunflower Seed Cost: $12.75/A ($0.75/1000 Seeds).Harvested: Sunflower on October 25, 2005.Sunflower Market Price $0.0919/Lb.Weed Control: Prowl, 48 oz; Spartan, 2 oz. Chemical Cost: $12.91/A; Application Cost $4/A.Variable Net Income: Gross Income - Seed Cost - Weed Control.The 2005 sunflower was planted in the 2003 grain sorghum location: for millet therotation was grain sorghum-millet-sunflower.
115

Dryland Crop Rotation Study Kevin Larson and Dennis Thompson
We have found from our Crop Rotation Sequencing Study that crops differ in their utilization of water and nutrients. Some crops, such as sunflower, mine nearly all available soil water and nutrients and leave little for subsequent crops. Whereas, other crops, such as millet, use only a portion of the available water and nutrients, leaving residual water and nutrients for subsequent crops. One of the problems with our Crop Rotation Sequencing Study is that only spring crops are included in the rotations. Winter wheat, one of the primary dryland crops in our area, was not included in the sequencing study. We established this dryland crop rotation study in order to study winter wheat in the crop rotations and compare them to a grain sorghum-millet rotation, a sequence that has performed quite well in our studies. The purpose of this study is to determine the crop rotations that produce highest yields and incomes. Materials and Methods This is our establishment year in testing the following rotations: Wheat-Sorghum-Fallow, Wheat-Sunflower-Fallow, and Grain Sorghum-Millet. We planted millet, Huntsman, at 18 Lb/A on June 17, 2005; grain sorghum, Mycogen 1482, at 35,000 Seeds/A on June 2, 2005; and sunflower, Mycogen 8377NS, at 17,000 Seeds/A on June 28, 2005. We applied 70 Lb N/A to the study site. Before planting we sprayed two applications of Glystar Plus at 20 Oz/A each. For in-season weed control, we chose short-residual herbicides that should not interfere with crop rotations: millet and grain sorghum, Banvel 4 Oz/A, Saber 11 Oz/A, and Penetrant II 4 Oz/A; sunflower, Prowl 48 Oz/A and Spartan 2 Oz/A; and fallow, Glystar Plus 24 Oz/A and LoVol 0.5 Lb/A two times. We harvested the crops with a self-propelled combine equipped with a digital scale: millet, September 16; grain sorghum, November 11; and sunflower, October 25. We recorded cost of production and yields in order to determine rotation revenues. Results and Discussion This is the first year of this dryland crop rotation study; therefore, all the crops followed wheat. Millet produced the highest viable net income, $63.72/A. The high variable net income of millet is due to low seed cost ($2.41/A), low weed control cost ($7.79/A), moderate yield (22 Bu/A), and a good crop price ($3.36/Bu). Therefore the millet-grain sorghum rotation already has an economic advantage. Millet is known for its low water use. The grain sorghum crop following millet should have higher available soil water and nutrients that should increase its yield and income. One problem we encountered after setting up these rotations was the lack of crop uniformity between crop locations and replications. This was most evident with the grain sorghum crop. The crops were planted south to north and every 20 ft. strip a different crop or crop rotation phase was assigned to that location. The grain sorghum strip on the west side of the study produced 41 Bu/A, the grain sorghum strips about 100 ft. to the east in the middle of the study averaged 24 Bu/A, and the grain sorghum strip about another 100 ft. further east on the east edge of the study averaged 11 Bu/A. Since this is the first year of these rotations, all the crops followed wheat and therefore we expected similar grain sorghum yields. We do not have an explanation for the lack
116
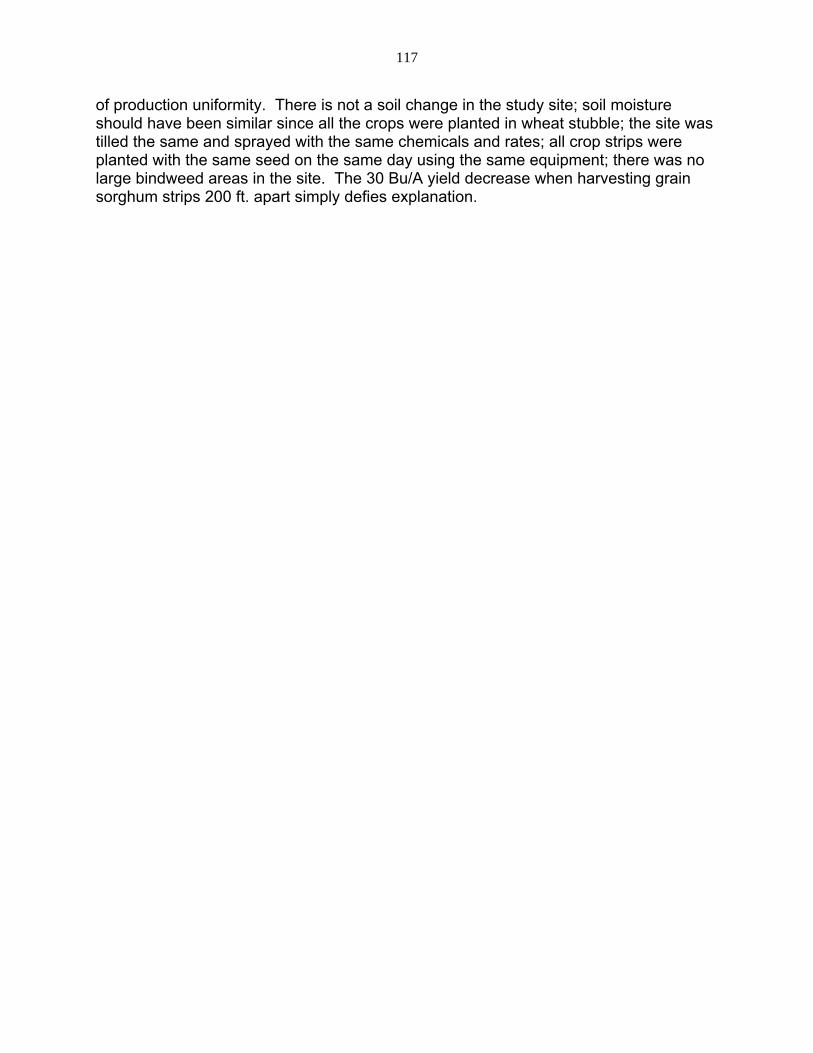
of production uniformity. There is not a soil change in the study site; soil moisture should have been similar since all the crops were planted in wheat stubble; the site was tilled the same and sprayed with the same chemicals and rates; all crop strips were planted with the same seed on the same day using the same equipment; there was no large bindweed areas in the site. The 30 Bu/A yield decrease when harvesting grain sorghum strips 200 ft. apart simply defies explanation.
117

Table .-Dryland Crop Rotation Study, Walsh, 2005._______________________________________________________________________________
Weed VariableSeeding Seed Control Crop Gross Net
Crop Density Cost Cost Yield Price Income Income_______________________________________________________________________________
*/A $/A $/A */A $/* $/A $/A
Millet 18 lb 2.41 7.79 22 bu 3.36/bu 73.92 63.72Grain Sorghum 35,000 seeds 2.50 7.79 25 bu 1.97/bu 49.25 38.96Sunflower 17,000 seeds 12.75 16.91 390 lb 0.0919/lb 35.84 6.18Fallow --- --- 17.30 --- --- -17.30 -17.30_______________________________________________________________________________Average 12.45 35.43 22.89_______________________________________________________________________________Planted: Grain Sorghum Mycogen 1482 at 35,000 Seeds/A on June 2; Millet, Huntsman at 18 Lb/A on June 17; and Sunflower Mycogen 8377NS at 18,000 Seeds/A on June 28.Harvested: Millet, September 16; Sunflower, October 25; and Grain Sorghum, November 11.Weed control cost is herbicide cost and $4/A application cost for each application.
118

Garbanzo Bean Weed Control Study, Walsh, 2005 Kevin Larson and Dennis Thompson
PURPOSE: To test pre-emergence Pursuit and post emergence Spartan as potential herbicides for garbanzo bean production. MATERIALS and METHODS: We applied Pursuit at 1.08 oz/A (preemergence) on March 18, 2005 and Spartan at 2.0 oz/A (when garbanzo beans and most broadleaf weeds were 5 in. tall) on May 28, 2005. We inoculated Dwelley, a Kabuli type garbanzo bean, with Rhizobium at 1 lb. to 300 lb. of seeds. We planted the beans on March 17 at 80 Lb Seed/A in 30 in. row spacings. Before garbanzo bean emergence, we sprayed 24 Oz/A of Roundup Ultra to control emerged weeds. No fertilizer was applied. The study site was cultivated once. Using a row crop head, we harvested the 10 ft. by 300 ft. plots on August 9 and weighed the seed with a digital scale. RESULTS: Pursuit produced significantly higher yields (P > 0.20) than Spartan. Pursuit controlled pigweed (mainly prostrate pigweed) better than Spartan; whereas, Spartan controlled Kochia better than Pursuit. Pursuit completely controlled foxtail, the main grass present, while Spartan did not control grasses. DISCUSSION: Weed control is a serious production problem for garbanzo beans. All too frequently, garbanzo bean fields are unharvestable because of weeds. We could find only three herbicides, Dual, Goal, and Pursuit, which specifically mention garbanzo beans on their labels; however, Treflan is registered for use on dry beans, and in my opinion garbanzo bean is a dry bean. Spartan is not registered for use on garbanzo beans. Spartan is labeled for use on peanuts and sunflower. Pursuit is much better at controlling problem broadleaf weeds than Dual, Goal, or Treflan. Pursuit by itself caused only minor crop injury and controlled most of the broadleaf and grass weeds. Spartan had the same low crop injury level as Pursuit. However, Spartan controlled some of the broadleaf weeds better than Pursuit, and Spartan can be applied post emergence. Pursuit applied preemergence controlled most broadleaf weeds and grasses present in our garbanzo bean study; however, some broadleaf weeds escaped. If Spartan was registered for use in garbanzo beans, our study results suggest that Spartan may be effective when applied post emergence in controlling the broadleaf weeds missed by Pursuit alone. Nonetheless, it is still important to choose a clean, weed free site so that the beans have less competition from weeds and can be cultivated. Garbanzo bean yields were low. The growing conditions were quite good until the pod-filling period when conditions became hot and dry.
119

Table .Garbanzo Bean Weed Control Study, Walsh, 2005.___________________________________________________________________
Application Pigweed Kochia Foxtail Crop Test SeedHerbicide Rate Timing Control Control Control Injury Weight Yield___________________________________________________________________
*/A % % % % Lb/Bu Lb/A
Spartan 2.0 oz Post 80 60 0 10 55.5 241
Pursuit 1.08 oz Pre 100 40 100 10 55.0 252___________________________________________________________________Average 90 50 50 10 55.3 247LSD 0.20 9.3___________________________________________________________________Planted: Dwelley at 80 Lb/A on March 17; Harvested: August 9 with row crop head.Applied Pursuit at 1.08 Oz/A on March 18.Applied Spartan at 2.0 Oz/A on May 28, crop and most broadleaf weeds 5 in. tall.
120
Dry Bean Trial, Row Crop Head and Hand Harvest Comparison, Walsh, 2005 Kevin Larson and Mark Brick
PURPOSE: To test the suitability of dry bean varieties (7 pinto beans and 2 black beans) for direct row crop head harvesting. MATERIALS and METHODS: We planted 7 pinto bean varieties and 2 black bean varieties into a dryland site previously in a wheat-sorghum-fallow rotation. For our plot design, we used a RCBD with four replications. We fertilized the site with 70 Lb N/A as 32-0-0. We planted the beans on May 26 at 20,000 Seeds/A, except Fisher and Vision we planted at 22,000 Seeds/A because of low germination lot. To control weeds, we applied Pursuit at 1.08 Oz/A, and cultivated once. We hand harvested a 2 ft. by 5 ft. area in each plot on October 14. We machine harvested the remaining 10 ft. by 44 ft. plot using a row crop head on October 28. RESULTS: The hand harvesting produced 279 Lb/A more seed than the row crop head harvesting. There was no significant difference between the top yielding hand harvested variety, Cahone, and the two black bean varieties, 27864 and Jaguars (P > 0.05). There was no significant difference between the highest yielding row crop harvested variety, 27864, the next two highest producing pinto bean varieties, Cahone and Vision. Cahone and 27864 were the highest yielding bean varieties for both the hand harvesting and row crop harvesting methods. DISCUSSION: This is the first edible dry bean trial that we have had at Plainsman since 1993. The renewed interest in dry beans occurred because of price drops in our commonly grown commodities and recent better-than-average prices for dry beans. The reason we tested direct head harvest was to minimize soil loss. Dry beans leave little residue to protect against wind erosion, even before undercutting which leaves soils especially venerable. From our results, it is obvious that there was considerable yield loss from direct harvesting with a row crop head. Nonetheless, we were encouraged by the black beans nonshattering, bush type plant architecture, which with more development promises the possibility of direct harvest.
Although the yield of the dry beans was low, depending on the dry bean price, it may be competitive with good to very good yielding grain sorghum crop. Our hand harvest dry bean average yield of 434 Lb/A would provide the same gross income as a 44 Bu/A grain sorghum crop with a bean price of $20/cwt, 55 Bu/A grain sorghum crop with a bean price of $25/cwt, or a 66 Bu/A grain sorghum crop with a bean price of $30/cwt (based on grain sorghum loan rate of $1.97/Bu).
121

Table .Dryland Dry Bean Trial, Walsh, 2005._______________________________________
Hand Row HeadBean Harvested Harvested
Variety Type Yield Yield_______________________________________
Lb/A Lb/A
Cahone Pinto 666 21127864 Black 646 248Jaguars Black 562 175Vision Pinto 487 196Grand Mesa Pinto 483 177GTS 900 Pinto 458 10496731 Pinto 283 140Fisher Pinto 176 71Buster Pinto 145 69_______________________________________Average 434 155LSD 0.05 171.6 58.2_______________________________________Planted: May 26 at 20,000 Seeds/A (Buster, Fisher, and Vision at 22,000 Seeds/A)Weed Control: Pursuit, 1.08 Oz/A.Hand Harvested: October 14, 2.5 ft X 5 ft.Row Head Harvested: October 28, 10 ft X 44 ft.
122
National Winter Canola Variety Performance Trial, Walsh 2005 Kevin Larson, Kraig Rooseboom, and Dennis Thompson
Purpose: To identify the best adapted, highest yielding varieties of winter canola. Results and Discussion
All of the plants of winter canola varieties survived the winter. The 100% winter survival is indicative of a mild winter. Severe winter can cause large stand losses. Typically, selecting winter canola varieties with high winter survival is a wise choice for our environment.
Canola would be a good candidate as a limited irrigated crop. We furrow irrigated the study with an irrigation in the fall and an irrigation in the spring. This year, we had poor soil moisture at planting. The lack of soil moisture at planting is a common scenario. Because we frequently have dry conditions at planting, and recommend maximum planting depth for canola is only 1.5 in., irrigating after planting is a good way to assure a stand.
Flowering dates are an important consideration because they reflect timeliness of harvest and flower sensitive freeze dates. The earlier flowering varieties are ready for harvest before the later flowering varieties. This could be important because the timing of wheat and canola harvests could clash. Remember, canola is one of the worst crops for shattering; do not delay harvest when it is ready for harvest. Varieties that flower early risk late-season frost damage. The earliness of some canola varieties may help avoid harvesting conflicts with wheat, but costly freeze damage on early flowering varieties may negate the harvest scheduling benefit. Materials and Methods
We planted 28 winter canola varieties for the National Winter Canola Trial on September 9, 2004. The trial was planted at 5 Lb Seed/A with a 12 in. row-spaced drill to a depth of 1.5 inches in dry soil. We furrow irrigated the site on 5 ft. beds until the moisture soaked across the bed. We fertilized the site with 75 Lb N/A using a sweep plow prior to planting. No other fertilizers were applied. The soil test was: N, 14 ppm; P, 6.2 ppm; and K, 490 ppm. For weed control, we applied Treflan 24 Oz/A prior to planting. We furrow irrigated once in the fall and once in the spring with about 8 to 10 in./A of total water applied for the winter canola trial. We harvested the winter canola variety trial on June 28. We harvested using a small grain head attached to a self-propelled combine (direct harvest) equipped with a digital scale.
123

National Canola Variety Trial: Walsh, CO, 2005._______________________________________________________
Winter Flowering Plant SeedVariety Stand Survival Date Height Yield_______________________________________________________
(0-10) (0-10) In. lb/acre
NPZ 0326 8.3 10 20-Apr 67 2482Kronos 5.7 10 19-Apr 61 2462ARC2189-1 5.2 10 19-Apr 60 2409Baldur 4.2 10 18-Apr 59 2402Wichita 4.7 10 17-Apr 57 2366ARC92007-2 7.0 10 19-Apr 63 2290Abilene 4.3 10 19-Apr 63 2129KS9135 5.7 10 20-Apr 64 2125KS2064 4.2 10 18-Apr 58 2109KS2169 5.0 10 18-Apr 56 2092ARC2180-1 8.5 10 19-Apr 68 2033Rasmus 3.5 10 18-Apr 58 2000KS9124 4.5 10 20-Apr 58 1941Titan 3.8 10 18-Apr 60 1881Jetton 6.2 10 20-Apr 59 1875Casino 2.5 10 20-Apr 61 1862VSX-2 5.3 10 19-Apr 60 1808ARC92004-1 5.5 10 20-Apr 61 1775Baros 6.3 10 17-Apr 57 1703KS2098 4.8 10 21-Apr 68 1689KS7436 4.0 10 19-Apr 58 1676Plainsman 3.7 10 21-Apr 68 1617KS2185 3.2 10 17-Apr 54 1610KS7436-055 2.3 10 19-Apr 52 1599Virginia 2.3 10 20-Apr 52 1544Sumner 4.2 10 16-Apr 53 1518KS3018 4.3 10 18-Apr 63 1300Ceres 0.5 10 20-Apr 52 436_______________________________________________________Mean 4.6 10 18-Apr 60 1883LSD 0.05 2.92 531.7_______________________________________________________Planted: September 9, 2004; Harvested: June 28, 2005.Limited furrow irrigated with about 10 in. of total water applied.
124