technical report – noise and vibration -...
TRANSCRIPT

Technical Report – Noise and Vibration Eagle Mine and Humboldt Mill Prepared for: Eagle Mine, LLC 4547 County Road 601 Champion, MI 49814 Date: August 8, 2014 TriMedia Project Number: 2014-083

Table of Contents 1.0 Introduction ..................................................................................................................... 1
1.1 Background ........................................................................................................... 1
1.2 Purpose ................................................................................................................. 2
1.3 Procedures and Equipment ................................................................................... 2
2.0 Standards and Guidelines .............................................................................................. 5
2.1 Noise ..................................................................................................................... 5
U.S. Environmental Protection Agency (EPA) ....................................................... 5
The U.S. Department of Housing and Urban Development .................................. 5
2.2 Vibration ................................................................................................................ 6
3.0 Noise Measurements and Results ................................................................................. 7
3.1 Humboldt Mill ......................................................................................................... 7
South Location ...................................................................................................... 7
West Location ........................................................................................................ 7
North West Location .............................................................................................. 7
North East Location ............................................................................................... 8
Off Site Control ...................................................................................................... 8
3.2 Eagle Mine ............................................................................................................ 8
Mine West Location ............................................................................................... 8
Mine East Location ................................................................................................ 9
Mine North Location .............................................................................................. 9
4.0 Octave Band Analysis .................................................................................................. 10
4.1 Humboldt Mill ....................................................................................................... 10
4.2 Eagle Mine .......................................................................................................... 13
5.0 Vibration Measurements and Results ......................................................................... 14
6.0 Conclusions and Recommendations .......................................................................... 17
APPENDICES APPENDIX A Tables APPENDIX B Photographic Documentation APPENDIX C GIS Maps APPENDIX D Equipment Calibration Records

1.0 INTRODUCTION
1.1 BACKGROUND
There are many metrics for which sound pressure levels (noise) are measured and
quantified. The most common metric uses the decibel (dB) scale. The logarithmic
decibel scale accommodates the wide range of sound intensities found in the
environment, but it is not altogether intuitive, as sound does not follow a linear
relationship. For example, the addition of two equivalent sounds does not equate to a
doubling in actual sound pressure level. So if a sound of 50 dB is added to another
sound of 50 dB, the increase in sound pressure is only 3-decibels (not 100 dB).
Therefore, as a rule of thumb, every 3 dB change in sound level represents a doubling or
halving of sound energy. This is important to remember as sound changes less than 3-
decibels are imperceptible to the human ear.
Sound level is typically measured by a sound level meter or noise dosimeter. Both are
standardized instruments that can measure in several different weighting scales. These
scales adjust the frequency response of the instrument to approximate that of the human
ear under various environmental conditions. The scale commonly used for community
noise monitoring is the A-weighted scale. The A-weighted scale approximates how the
human ear perceives sound at various frequencies by emphasizing those heard between
1000-2000 hertz (hz), or the middle-ranged frequency. Sounds detected on a sound
level meter or dosimeter on the A-weighted scale are reported in decibels and denoted
as “dBA”. Further, the average sound level measured over a defined period of time is
referred to the Leq. It is important to recall that sound is measured on the logarithmic
scale of decibels, so simply adding the levels and dividing by the number of samples
measured over time will not yield a true average. The purpose of the Leq is to avoid
skewing from instantaneous (or short duration) high and low levels of sound. Leq is
defined as the equivalent noise level that accounts for noise level variations over a
period of time. The formula used to calculate Leq is provided below:
1

Leq = equivalent continuous sound pressure level
p0 = reference pressure level = 20μPa
pA= acquired sound pressure in Pa
t1 = start time for measurement
t2 = end time for measurement
1.2 PURPOSE TriMedia has prepared this Technical Report –Noise and Vibration to document baseline
noise monitoring results, baseline vibration monitoring results, and to provide a summary
of our conclusions and recommendations. The objective of this assessment was to
establish baseline noise and vibrations levels three months prior to the transition from a
construction phase to an operational phase at the Humboldt Mill and Eagle Mine sites.
The evaluated areas include selected sites in and around both the mine and mill
locations.
1.3 PROCEDURES AND EQUIPMENT
Data collection activities included both noise and vibration monitoring using industry
standard equipment. Equipment included weatherized 3M SoundPro DL Sound Level
Meters with data logging and octave band analyses capabilities and Instantel MicroMate
III vibration monitors. Each SoundPro DL was equipped with a cable-attached
microphone, environmental case, wind screen, and data logging device. The meters
were calibrated on-site prior to deployment using a Quest QC ‐ 10 sound calibrator. The
meters used had the capability of performing octave band analysis; the setup
parameters can be seen below in Table 1: Sensor Parameters. The equipment was set
to log sound pressure levels in one minute intervals using the Z-weighted (flat) scale.
This scale was selected in order to evaluate for all potential noise sources, providing a
complete picture of the total noise at the site. However the Z-weighting scale does not
accurately define on how noise is perceived by the human ear. For this purpose the
2

noise measurements were converted to the A-weighted scale using the correction
factors found in Table 2: A-Scale Correction Factors. Reporting the noise data in the
dBA scale will allow for direct comparison to established noise regulations. To
accomplish this, readings from nine different frequencies were adjusted using the
correction factors in effort to mimic the ear’s response to these noise levels. The use of
both the dBZ and dBA scale provide useful data on the total noise at a site verse the
amount of noise that can be perceived by the human ear.
The noise measuring techniques and produces used in this study are consistent with
those outlined in the American National Standards Institute (ANSI) S12.9-1993/Part 3. At
each monitoring location, without endangering data quality, the equipment was placed in
such a manner that would limit tampering from personnel or wildlife. All meters were left
to monitor noise levels for a total of 24-hours and were picked up in good working order.
Table 1: Sensor Parameters
Sensor Weighting Z Scale
Exchange Rate 3 dB Response Time Slow
Bandwidth 1/3 Interval 1 min
Table 2: A-Scale Correction Factors Octave Band Center
Frequency (Hz) A-Scale Correction Factor
(dB) 31.5 -39 63 -26 125 -16 250 -9 500 -3
1,000 0 2,000 +1 4,000 +1 8,000 -1
Source: OSHA Noise and Hearing Conservation Technical Manual
3

The Instantel MicroMate III monitors used for the vibration analysis complied with the
“Performance Specifications for Blasting Seismographs” document published by the
International Society of Explosives Engineers (ISEE). Both the operation and use of this
equipment was consistent with the procedures outlined in the ISEE’s “ISEE Field
Practice Guidelines for Blasting Seismographs”.
Each MicroMate was equipped with a tri-axial transducer, an air overpressure
microphone to record linear-weighted noise levels corresponding to each vibration event,
and data logging capabilities. Each transducer measured velocities on three mutually
perpendicular axes (Vx, Vy, Vz) corresponding to a radial, transverse, and vertical
component. The data acquisition equipment simultaneously recorded each geophone, in
digital format, time-domain data for each of the three mutually perpendicular axes at
each of the four radial distances. The blasting analysis software provided features for
graphical output of the wave forms in each of the three axes and comparison of the
measured peak particle velocities (PPVs) and frequency content with various accepted
standards developed by the U.S. Bureau of Mines.
4

2.0 STANDARDS AND GUIDELINES
2.1 NOISE
Currently there are no federal, state or local (Humboldt and Powell Townships of
Marquette County) standards that can be used to evaluate the results of this study.
However in this case it is common to utilize multiple guidelines and recommendations
set forth by other governing bodies. The use of these values can help to evaluate the
noise conditions seen at the selected sites.
U.S. Environmental Protection Agency (EPA)
As described in the EPA document titled “Information on Levels of Environmental Noise
Requisite to Protect Public Health and Welfare with an Adequate Margin of Safety.” The
recommended 24-hour noise exposure level that will prevent any measurable hearing
loss over a lifetime is 70 dBA. This document furthers describes that an outdoor noise
level of 55 dBA and an indoor level of 45 dBA provide a suitable upper noise limit that
will prevent activity interference and annoyance. The U.S. Department of Housing and Urban Development
The U.S. Department of Housing and Urban Development (HUD) provides both a
standard and a recommended exterior noise level for their communities. HUD
recommends that exterior noise levels should not exceed a day-night average sound
level (Ldn) of 55 dBA. While the recommendations should always be taken into account
the actual standard set by HUD indicates that the Ldn should not exceed 65 dBA. The
day-night average sound level is calculated by using the equation below:
Ld = Sound pressure level during day time hours (0700 to 2200 hours). Ln = Sound pressure level during night time hours (2200 to 0700 hours).
5
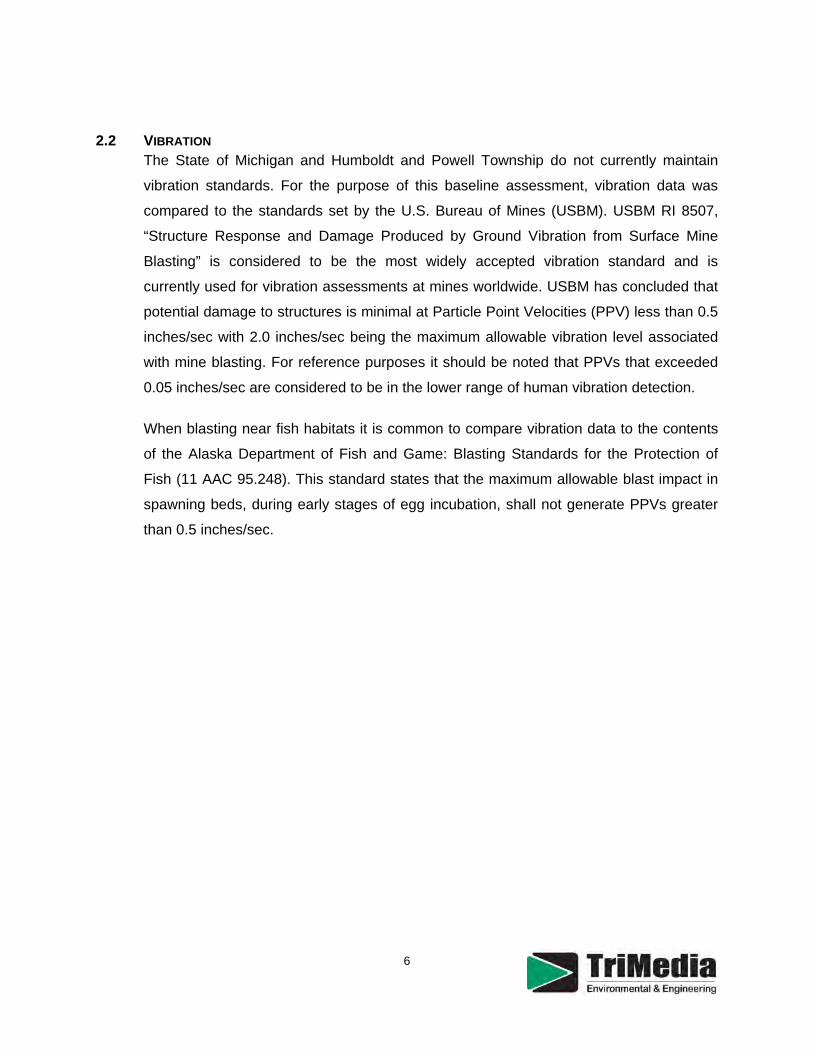
2.2 VIBRATION The State of Michigan and Humboldt and Powell Township do not currently maintain
vibration standards. For the purpose of this baseline assessment, vibration data was
compared to the standards set by the U.S. Bureau of Mines (USBM). USBM RI 8507,
“Structure Response and Damage Produced by Ground Vibration from Surface Mine
Blasting” is considered to be the most widely accepted vibration standard and is
currently used for vibration assessments at mines worldwide. USBM has concluded that
potential damage to structures is minimal at Particle Point Velocities (PPV) less than 0.5
inches/sec with 2.0 inches/sec being the maximum allowable vibration level associated
with mine blasting. For reference purposes it should be noted that PPVs that exceeded
0.05 inches/sec are considered to be in the lower range of human vibration detection.
When blasting near fish habitats it is common to compare vibration data to the contents
of the Alaska Department of Fish and Game: Blasting Standards for the Protection of
Fish (11 AAC 95.248). This standard states that the maximum allowable blast impact in
spawning beds, during early stages of egg incubation, shall not generate PPVs greater
than 0.5 inches/sec.
6

3.0 NOISE MEASUREMENTS AND RESULTS
3.1 HUMBOLDT MILL
TriMedia mobilized to the Humboldt Mill site on both 6/24/14 and 6/25/14 to deploy a
total four 3M SoundPro DL Sound Level Meters as described previously in this report.
Equipment was deployed in three of the four cardinal directions with two meters located
on the northern edge of the mill property. The results of the noise monitoring activities
indicate that noise levels at all the mine sites were below the EPA and HUD
recommended levels. A complete summary of the sound level data recorded at the Mill
site can be seen in Table 3: Sound Pressure Levels –Humboldt Mill.
South Location
Situated along the side of County Road 601, the monitoring equipment was placed
between the tree line and fence approximately 15 meters away from the road and
approximately 470 meters away from the center of the mill complex. The distant sounds
of both heavy traffic and equipment, occasional light traffic on County Road 601, wind,
nature, and groups of people walking were all observed at this location. At this site the
24-hour Leq was 31.3 dBA, the calculated Ldn for this location was found to be 35.3 dBA.
West Location
Equipment was placed between fence line of the mill property and the state recreation
trail approximately 250 meters north of County Road 601 and 870 meter northwest of the
mill complex. Multiple vehicles with trailers were parked near the trail, possibly for trail
access. Along the fence line on the inside of the mill property (1-2 meters away) was an
access road for the mill. The sounds of distant heavy traffic, nearby local traffic, and
nature were all observed at the site. At this site the 24-hour Leq was 34.3 dBA, the
calculated Ldn for this location was found to be 37.2 dBA.
North West Location
This site was located approximately 240 meters south of US 41 and 1,300 meters away
from the Mill complex. The 24-hour Leq was 30.3 dBA, the calculated Ldn for this location
was found to be 36.9 dBA.
7

North East Location
Equipment at this site was placed approximately 80-90 meters south of US 41 and
approximately 1,300 meters northeast of the mill complex. Highway traffic, heavy
equipment operation, and sounds of nature were observed during the noise monitoring
activities. During the monitoring period heavy equipment (bulldozer, dump trucks, and a
backhoe) was used to complete a house demolition approximately 230 meters away
from the site. The 24-hour Leq was 43.4 dBA, the calculated Ldn for this location was
found to be 47.2 dBA.
Off Site Control
At the intersection of US 41 and State Road 95, two concurrent 15-minute
measurements of sound pressure levels were taken at 2:03 pm and 2:22pm on 6/24/14.
Located approximately 2,200 meters from the center of the mill complex this site served
as a noise source control. Heavy traffic from both US 41 and State Road 95 were
observed, during the monitoring period several large heavy trucks passed by the
equipment along State Road 95. The monitored Leq ranged from 47.0 to 48.3 dBA at this
site.
3.2 EAGLE MINE TriMedia mobilized to the Eagle Mine site on 6/26/14 to deploy a total of three 3M
SoundPro DL sound level meters as described previously in this report. Equipment was
deployed in three locations west of the mine complex. The results of the noise
monitoring activities indicated that noise levels at all the mine sites were below the
recommended levels established by the EPA and HUD. A complete summary of the
sound level data recorded at the Mill site can be seen in Table 4: Sound Pressure Levels
–Eagle Mine.
Mine West Location
Equipment at this site was placed approximately 1,300 meters from the center of the
mine complex along the Salmon-Trout River over the ore body. The 24-hour Leq was
45.5 dBA, the calculated Ldn for this location was found to be 52.0 dBA. No substantial
8

9
noise sources were noted or observed at this location. During blasting operations, no
noticeable increases in noise levels were observed. The 30-minute Leq surrounding the
blast time (15 minutes before and 15 minutes after the scheduled blast time) was found
to be 45.6 dBA with a maximum sound pressure level recorded at 46.2 dBA.
Mine East Location
Equipment was placed approximately 530 meters from the center of the mine complex
directly west of the mine portal entrance. The 24-hour Leq was 31.8 dBA, the calculated
Ldn for this location was found to be 39.0 dBA. No substantial noise sources were noted
or observed at this location. During blasting operations, no noticeable increases in noise
levels were observed. The 30-minute Leq surrounding the blast time was found to be 26.5
dBA with a maximum sound pressure level recorded at 29.2 dBA.
Mine North Location
Equipment was placed approximately 830 meters from the center of the mine complex
across Triple A Road from the main vent air raise. The 24-hour Leq was 36.3 dBA, the
calculated Ldn for this location was found to be 43.0 dBA. No substantial noise sources
were noted or observed at this location. During blasting operations, no noticeable
increases in noise levels were observed. The 30-minute Leq surrounding the blast time
was found to be 28.7 dBA with a maximum sound pressure level recorded at 31.4 dBA.

4.0 OCTAVE BAND ANALYSIS
4.1 HUMBOLDT MILL The human ear is more sensitive to noise levels in the higher frequency range of 2,000
to 8,000 Hz while sounds occurring in the lower frequency range are not as easily
perceived by an observer. This type of response is best described when measuring
sound levels on the dBA scale. The dBA scale was developed to represent how an
overall noise level would be perceived by the human ear. The opposite is true for noise
levels recorded in the dBZ or flat scale. The use of the dBZ scale represents the total
amount of noise present and does not take into account how the levels are perceived by
a human observer. This concept can be illustrated in the information provided in the
figure below (Figure 1).
Using data collected at the Humboldt Mill South monitoring location, the difference in the
total noise level (dBZ scale) at the site and the perceived noise level (dBA scale) can be
illustrated. Figure 1 shows that sound pressure levels measured in the dBZ scale
indicate an overall increase in noise levels (Leq = 56.2 dBZ). However when the sound
levels are adjusted to represent how noise is perceived by the human ear using the dBA
scale, a decrease is seen, predominantly in the lower frequency levels (Leq = 31.3 dBA).
The majority of the noise levels generated at this site are in the low undetectable
frequencies. This shows that while there are increased levels of noise, it cannot be
detected by the human ear.
10
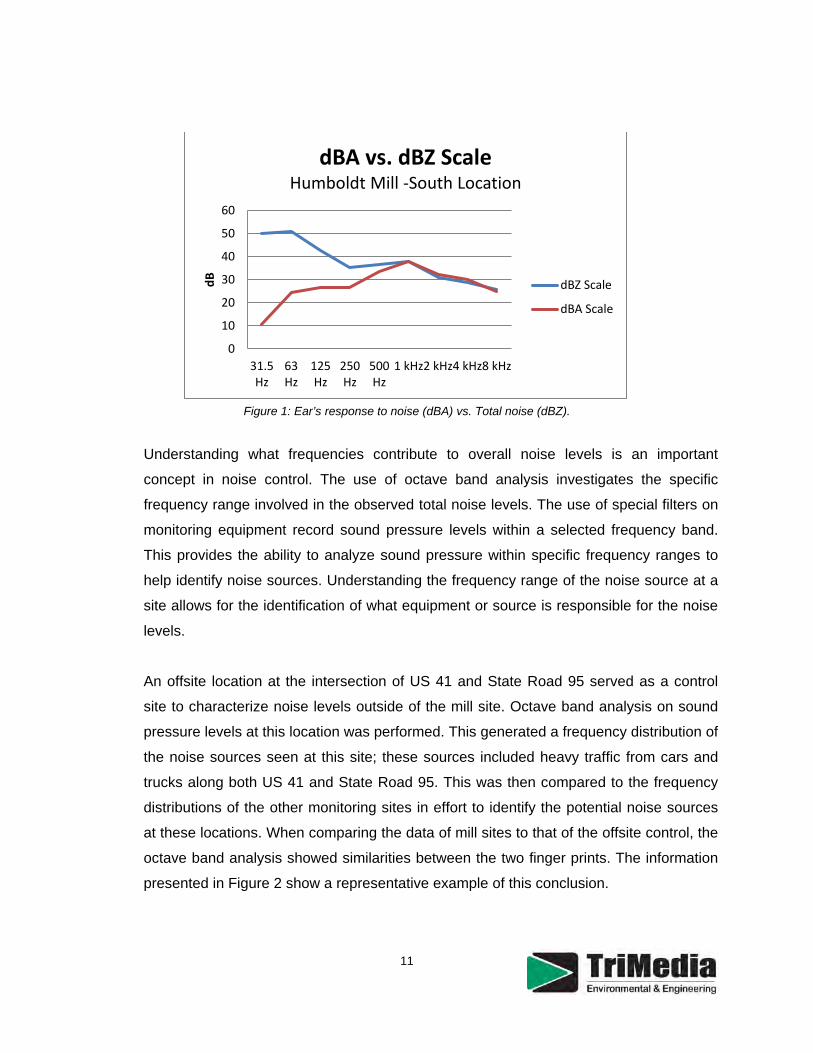
Figure 1: Ear’s response to noise (dBA) vs. Total noise (dBZ).
Understanding what frequencies contribute to overall noise levels is an important
concept in noise control. The use of octave band analysis investigates the specific
frequency range involved in the observed total noise levels. The use of special filters on
monitoring equipment record sound pressure levels within a selected frequency band.
This provides the ability to analyze sound pressure within specific frequency ranges to
help identify noise sources. Understanding the frequency range of the noise source at a
site allows for the identification of what equipment or source is responsible for the noise
levels.
An offsite location at the intersection of US 41 and State Road 95 served as a control
site to characterize noise levels outside of the mill site. Octave band analysis on sound
pressure levels at this location was performed. This generated a frequency distribution of
the noise sources seen at this site; these sources included heavy traffic from cars and
trucks along both US 41 and State Road 95. This was then compared to the frequency
distributions of the other monitoring sites in effort to identify the potential noise sources
at these locations. When comparing the data of mill sites to that of the offsite control, the
octave band analysis showed similarities between the two finger prints. The information
presented in Figure 2 show a representative example of this conclusion.
0
10
20
30
40
50
60
31.5Hz
63Hz
125Hz
250Hz
500Hz
1 kHz2 kHz4 kHz8 kHz
dB
dBA vs. dBZ Scale Humboldt Mill -South Location
dBZ Scale
dBA Scale
11

Figure 2: Octave band analysis for the Off Site Control, Mill South, and Mill West locations.
The information presented in Figure 2 illustrates the total noise versus frequency
distribution recorded during octave band analysis at the Off Site Control, Mill South, and
Mill West monitoring site. The results above indicate what was generally seen at the
other noise monitoring locations. The octave band analysis at the mill sites match that of
the offsite control in shape and distribution, indicating that the sources of the sound
pressure levels are related in composition. The magnitudes of the sound pressure levels
at the Off Site control location are also greater than those at the other sites. This also
provides the necessary evidence to suggest that common road noise is the major
contributing source of noise at these sites.
In general as the distance increases from a noise source, the magnitude of the sound
pressure level decreases. This is a phenomenon represented by the Inverse Square
Law which states, assuming optimal conditions, that the intensity of the noise is inversely
proportional to the square of the distance from the source. It is TriMedia’s opinion that
the majority of the noise sources seen at the monitored sites are that of typical common
noise associated with the area traffic on the local roads and highways around the site.
01020304050607080
12.5
Hz
25 H
z
50 H
z
100
Hz
200
Hz
400
Hz
800
Hz
1.60
kHz
3.15
kHz
6.30
kHz
12.5
0 kH
z
dB
Octave Band Analysis - Mill
Off Site Control
Mill South
Mill West
12

4.2 EAGLE MINE It was noted during the noise monitoring activities that the Mine West (Ldn 52.0 dBA) site
experienced higher noise levels then the Mine East and North location (Ldn 39.0 dBA and
Ldn 43.0 dBA, respectively). An octave band analysis of the noise data collected at these
locations was performed. The information presented in Figure 3 illustrate that the
majority of the noise levels observed at the Mine West site occurred in the high
frequency range. While the other two locations (Mine East and Mine North) had lower
high frequency noise levels.
It is TriMedia’s opinion that during the monitoring period, the increase in high frequency
noise levels at the Mine West site are directly related to the surrounding natural
environment. The sounds of nature (insects, animals, wind, etc.) generally occur in the
higher frequency ranges, it is believed that the remoteness of this particular location
contributed to the increased activity of the surrounding natural environment.
Figure 3: Octave band analysis of the Mine West, East, and North locations.
0
10
20
30
40
50
60
12.5
Hz
20 H
z31
.5 H
z50
Hz
80 H
z12
5 Hz
200
Hz31
5 Hz
500
Hz80
0 Hz
1.25
kHz
2.00
kHz
3.15
kHz
5.00
kHz
8.00
kHz
12.5
0 kH
z20
.00
kHz
dB
Octave Band Analysis - Eagle Mine
Mine West
Mine East
Mine North
13

5.0 VIBRATION MEASUREMENTS AND RESULTS
TriMedia mobilized to the Eagle Mine site on both 6/26/14 and 6/30/14 to deploy a total
four Instantel MicroMate III vibration monitors as described previously in this report.
Equipment was deployed in preselected area to correspond with planned blasting
activities at the mine site. The ground at each monitoring site was leveled prior to
placement of the monitors. Ground spikes were attached to provide the necessary
ground contact. Before each blasting event the vibration monitors had a sensor check
performed to ensure data accuracy.
Data was recorded both before and after the blast event to measure for ground
movement. For the purpose of this baseline assessment, vibration data was compared to
the U.S. Bureau of Mines standards. USBM has concluded that potential damage to
structures is minimal at PPVs less than 0.5 inches/sec and that 2.0 inches/sec is the
maximum allowable vibration level associated with mine blasting. Analysis of the data
showed that all ground vibration levels were well below the U.S. Bureau of Mines
standards. The data also suggests that vibration levels in the nearby fish habitat from the
monitored blast events are also below the limits set by the Alaskan Department of Fish
and Game. The results of the vibration analysis are summarized in Figures 4 through
Figure 7 below.
14

Figure 4: Recorded event PPVs (inches/sec) at the East Mine Location around the blast time.
Figure 5: Recorded event PPVs (inches/sec) at the South Mine Location around the blast time.
0.000
0.010
0.020
0.030
0.040
0.050
0.060
16:4
9:19
16:4
9:40
16:4
9:58
16:5
0:19
16:5
0:40
16:5
0:58
16:5
1:19
16:5
1:40
16:5
1:58
16:5
2:19
16:5
2:40
16:5
2:58
16:5
3:19
16:5
3:37
16:5
3:40
16:5
3:43
16:5
3:58
16:5
4:19
16:5
4:40
16:5
4:58
Peak
Par
ticle
Vel
ocity
(PPV
) East Mine Location
Scheduled Blast Time: 16:50:00
0
0.05
0.1
0.15
0.2
0.25
Peak
Par
ticle
Vel
ocity
(PPV
)
South Mine Location Scheduled Blast Time: 18:00:00
15

Figure 6: Recorded event PPVs (inches/sec) at the West Mine Location around the blast time.
Figure 7: Recorded event PPVs (inches/sec) at the Northwest Mine Location around the blast time.
No recordable seismic events were detected between 16:01:52 and 18:14:01.
00.020.040.060.08
0.10.120.140.160.18
0.2
Peak
Par
ticle
Vel
ocity
(PPV
) West Mine Location Scheduled Blast Time: 18:00:00
0
0.05
0.1
0.15
0.2
0.25
Peak
Par
ticle
Vel
ocity
(PPV
)
Northwest Mine Location Scheduled Blast Time: 18:00:00
16

17
6.0 CONCLUSIONS AND RECOMMENDATIONS
Overall, the results from this baseline assessment indicate that noise levels at both the
Humboldt Mill and Eagle Mine are within applicable regulatory standards. There were no
exceedances of the EPA or HUD noise standards or recommendations. Also onsite
blasting activities at the Eagle Mine were not a source of vibration impacts to the
adjacent area and surrounding community. The current results suggest that the
monitored blasting activities did not generate a harmful environment to the local fish
habitat.
Background noise levels measured at the Off Site Control location at the intersection of
US 41 and State Road 95 were higher than the other monitored locations. The results of
the octave band analysis also indicated that a vast majority of the noise levels heard at
the mill and mine sites were that of distant road noise. Construction work related to a
house demolition during the monitoring period near the Northeast Mill site produced
atypical results for that location. However measured noise levels at this site were still
below both the EPA and HUD recommendations during this time period. It should also
be mentioned that the two noise sites that were closest to the Humboldt Mill (South
Location) and Eagle Mine (East Location), both had the lowest calculated Ldn for each
site. This represents that current activities at both the mine and the mill do not place an
excess noise burden on the surround community. TriMedia does not believe any actions
are necessary to mitigate noise or vibration sources at either the Humboldt Mill or Eagle
Mine in relation to community noise levels and blasting activities.

APPENDICES Appendix A Tables Appendix B Photographic Documentation Appendix C GIS Maps Appendix D Equipment Calibration Records

Appendix A Tables

Monitoring Location South West North West North East Offsite ControlLatitude 46.479529 46.488449 46.495351 46.494288 46.495693
Longitude -87.898188 -87.907526 -87.902367 -87.890448 -87.920012Date 6/24/2014 6/24/2014 6/25/2014 6/24/2014 6/24/2014
Start Time 12:47 PM 1:05 PM 1:41 PM 1:20 PM 2:00 PMDuration 24 Hours 24 Hours 24 Hours 24 Hours 15 Minute
15-Minute Noise Level (dBA)Leq 31.3 34.3 30.3 43.4 47.7Ld 32.6 35.9 30.2 44.7 NALn 27.8 28.9 30.6 39.7 NALdn 35.3 37.2 36.9 47.2 NA
EPA* 55.0 55.0 55.0 55.0 55.0HUD** 55.0 55.0 55.0 55.0 55.0
Notes:*U.S. Environmental Protection Agency recommended 24-hour outdoor noise level. (Leq)**U.S. Department of Housing and Urban Development recommended day-night average sound level. (Ldn)Leq = Equivalent Continuous Sound LevelLd = Sound pressure level during day time hours (0700 to 2200 hours).Ln = Sound pressure level during night time hours (2200 to 0700 hours).NA - indicates no applicable criteria exist for the constituent.Bold indicates levels that exceeds the recommendations.All results are presented in dBA.
Table 3: Sound Pressure Levels - Humboldt Mill
24-Hour Noise Levels (dBA)

Monitoring Location East North WestLatitude 46.746483 46.748552 46.747665
Longitude -87.889034 -87.893029 -87.897882Date 6/26/2014 6/26/2014 6/26/2014
Start Time 4:58 PM 4:45 PM 2:35 PMDuration 24 Hours 24 Hours 24 Hours
Leq 31.8 36.3 45.5Ld 31.1 35.9 45.6Ln 32.9 36.8 45.6Ldn 39.0 43.0 52.0
EPA* 55.0 55.0 55.0HUD** 55.0 55.0 55.0
Notes:*U.S. Environmental Protection Agency recommended 24-hour outdoor noise level. (Leq)**U.S. Department of Housing and Urban Development recommended day-night average sound level. (Ldn)Leq = Equivalent Continuous Sound LevelLd = Sound pressure level during day time hours (0700 to 2200 hours).Ln = Sound pressure level during night time hours (2200 to 0700 hours).Bold indicates levels that exceeds the recommendations.All results are presented in dBA.
Table 4: Sound Pressure Levels - Eagle Mine
24-Hour Noise Levels (dBA)

Appendix B Photographic Documentation

NOISE AND VIBRATION EAGLE MINE AND HUMBOLDT MILL
Description: East Noise Site – Eagle Mine Date: 06/26/14 Photo #: 1
Description: North Noise Site – Eagle Mine Date: 06/26/14 Photo #: 2
Description: West Noise Site and West Vibration Site (Salmon-Trout River) – Eagle Mine
Date: 06/26/14 Photo #: 3
Photo Log Page 1 of 3 Noise and Vibration TriMedia Project 2014-083

NOISE AND VIBRATION EAGLE MINE AND HUMBOLDT MILL
Description: West Noise Site – Humboldt Mill Date: 06/24/14 Photo #: 4
Description: South Noise Site – Humboldt Mill Date: 06/24/14 Photo #: 5
Description: North West Vibration Site – Eagle Mine Date: 06/26/14 Photo #: 6
Description: East Vibration Site – Eagle Mine Date: 06/26/14 Photo #: 7
Photo Log Page 2 of 3 Noise and Vibration TriMedia Project 2014-083

NOISE AND VIBRATION EAGLE MINE AND HUMBOLDT MILL
Description: North East Noise Site – Humboldt Mill Date: 06/24/14 Photo #: 7
Description: North West Noise Site – Humboldt Mill Date: 06/25/14 Photo #: 8
Photo Log Page 3 of 3 Noise and Vibration TriMedia Project 2014-083

Appendix C GIS Maps

Eag
le M
ine
DESIGNED: RRLDRAWN: KDLCHECKED: JPGAPPROVED: JPG
JOB NUMBER2014-083
FIGURE NUMBER:
8
DATE
DESC
RIPT
ION:
Eagle MineMine SiteNoise &Vibration
Monitoring Locations
NORTH
Min
e S
iteN
oise
and
Vib
ratio
n M
onito
ring
Loca
tions
Eag
le M
ine,
Big
Bay
, MI
TRIMEDIA
FIGURE TITLE:
10/1
3/14
Rep
ort
0 400 800200Feet
1 inch = 400 feet
Pat
h: P
:\Pro
ject
s\20
14-0
83 E
agle
Min
e N
oise
& V
ibra
tion\
GIS
\F1
Eag
le M
ine,
Min
e S
ampl
eing
Loc
atio
ns.m
xd
Latitude Longitude46.746483 -87.88903446.748552 -87.89302946.747665 -87.89788246.745726 -87.885817
46.7495 -87.89918146.747472 -87.894012
Sample ID Noise EastNoise North Noise West Vibration East Vibration Northwest Vibration South Vibration West
46.747693 -87.898088
Blast Latitude LongitudeBlast Location 1 46.748227 -87.894847Blast Location 2 46.748314 -87.895667Blast Location 3 46.748499 -87.897241Blast Location 4 46.748099 -87.894901Blast Location 5 46.749159 -87.896201

Eag
le M
ine
DESIGNED: RRLDRAWN: KDLCHECKED: JPGAPPROVED: RRL
JOB NUMBER2014-083
FIGURE NUMBER:
9
DATE
DESC
RIPT
ION:
Eagle MineHumboldt Mill
Noise
Locations
NORTH
Hum
bold
t Mill
Site
Noi
se M
onito
ring
Loca
tions
H
umbo
ldt M
ill, C
ham
pion
, MI
TRIMEDIA
FIGURE TITLE:
8/8/
14R
epor
t
0 800 1,600400Feet
1 inch = 800 feet
Pat
h: P
:\Pro
ject
s\20
14-0
83 E
agle
Min
e N
oise
& V
ibra
tion\
GIS
\F1
Eag
le M
ine,
Min
e S
ampl
eing
Loc
atio
ns.m
xd
Sample ID Latitude LongitudeSouth Site 46.479529 -87.898188West Site 46.488449 -87.907526Off Site Control 46.495693 -87.920012North West Site 46.495351 -87.902367North East Site 46.494288 -87.890448
Monitoring

Appendix D Equipment Calibration Records