technical report - lhncbc.nlm.nih.gov · 5.1.2 multimedia database tool ... this work involves...
TRANSCRIPT

THE LISTER HILL NATIONAL CENTER FOR BIOMEDICAL COMMUNICATIONS
A research division of the U.S. National Library of Medicine
TECHNICAL REPORT
Biomedical Imaging Research and DevelopmentKnowledge from Images in the Medical Enterprise September 2006 George R. Thoma, Ph.D.L. Rodney LongSameer Antani, Ph.D.
U.S. National Library of Medicine, LHNCBC
8600 Rockville Pike, Building 38A Bethesda, MD 20894
ii
Table of Contents GLOSSARY .................................................................................................................................................................1 1 INTRODUCTION AND BACKGROUND......................................................................................................2
1.1 BIOMEDICAL IMAGING AT CEB: A RETROSPECTIVE ...................................................................................3 1.2 PROLOG TO CURRENT WORK ......................................................................................................................9
2 PROJECT SIGNIFICANCE...........................................................................................................................10 3 PROJECT OBJECTIVES...............................................................................................................................11 4 STATUS REPORT ..........................................................................................................................................15 5 METHODS AND PROCEDURES FOR BIOMEDICAL IMAGE INFORMATICS................................15
5.1 MULTIMEDIA DATA MANAGEMENT: ENABLING APPLICATIONS FOR NEAR-TERM IMPACT...........................16 5.1.1 Boundary Marking Tool.......................................................................................................................16 5.1.2 Multimedia Database Tool ..................................................................................................................17 5.1.3 Virtual Microscope ..............................................................................................................................18 5.1.4 Teaching Tool ......................................................................................................................................19
5.2 ADVANCED TECHNIQUES FOR BIOMEDICAL IMAGE KNOWLEDGE EXTRACTION..........................................20 5.2.1 Global feature CBIR ............................................................................................................................22
5.2.1.1 Classification of images using SECC......................................................................................................... 22 5.2.1.2 Enabling interaction with other global CBIR Systems............................................................................... 25
5.2.2 Local feature CBIR ..............................................................................................................................26 5.2.2.1 Image segmentation ................................................................................................................................... 27 5.2.2.2 Shape similarity research in spine x-rays ................................................................................................... 35 5.2.2.3 Color and spatial similarity in uterine cervix images ................................................................................. 40 5.2.2.4 Relevance feedback ................................................................................................................................... 41
5.2.3 Evaluation of image-derived graphical knowledge .............................................................................45 5.2.3.1 Expert data acquisition............................................................................................................................... 45
5.2.3.1.1 Spine x-rays .......................................................................................................................................... 45 5.2.3.1.2 Uterine Cervix images .......................................................................................................................... 46
5.2.3.2 Algorithm and Human Performance Evaluation ........................................................................................ 46 5.2.3.2.1 STAPLE ............................................................................................................................................... 46 5.2.3.2.2 Comparative algorithm analysis ........................................................................................................... 48
5.3 OTHER TECHNOLOGICAL CONTRIBUTIONS................................................................................................53 5.3.1 Image compression ..............................................................................................................................53 5.3.2 Quality control for digital data acquisition .........................................................................................53
6 EVALUATION APPROACH .........................................................................................................................54 7 PROJECT SCHEDULE ..................................................................................................................................54 8 SUMMARY AND NEXT STEPS....................................................................................................................54 APPENDIX A CBIR PRIMER.........................................................................................................................57 APPENDIX B OVERVIEW OF PRIOR CBIR R&D...................................................................................59 APPENDIX C RELEVANCE FEEDBACK IN CBIR: LITERATURE SURVEY ....................................61 REFERENCES ..........................................................................................................................................................63

1
Glossary
AAM Active Appearance Modeling ACS Active Contour Segmentation ALTS ASCUS-LSIL Triage Study AO Anterior Osteophytes ASCCP American Society for Colposcopy and Cervical Pathology ASCUS Atypical Squamous Cells of Undetermined Significance ASM Active Shape Modeling AW Acetowhite Lesions BMT Boundary Marking Tool CBIR Content-Based Image Retrieval CE Columnar Epithelium CEB Communications Engineering Branch CIN Cervical Intraepithelial Neoplasia CLEF Cross Language Evaluation Forum CCV Color Coherence Vector DP Dynamic Programming DSN Disc Space Narrowing ECOC Error-Correcting Output Codes GHT Generalized Hough Transform GIFT GNU Image Finding Tool GMM Gaussian Mixture Model HREB Hormonal and Reproductive Epidemiology Branch ImageCLEF Medical Image Retrieval extension to CLEF IRMA Image Retrieval for Medical Applications LSIL Low-grade Squamous Intra-epithelial Lesion MDT Multimedia Database Tool MedGIFT GIFT modified for medical image retrieval NCI National Cancer Institute NHANES National Health and Nutrition Examination Surveys NLM National Library of Medicine NN Neural Networks PACS Picture Archiving and Communications Systems PATH Program for Appropriate Technology in Health PSM Partial Shape Matching RF Relevance Feedback ROI Region of Interest SCJ Squamo-Columnar Junction SE Squamous Epithelium SECC Semantic Error-Correcting output Codes SPIRS Spine Pathology and Image Retrieval System SR Specular Reflection STAPLE Simultaneous Truth and Performance Level Evaluation WSM Whole Shape Matching
2
Biomedical Imaging Research and Development KNOWLEDGE FROM IMAGES IN THE MEDICAL ENTERPRISE
1 Introduction and Background
The importance of images as a knowledge resource within the medical enterprise is universally acknowledged, and despite decades of effort toward integrating images into seamless workflows for the clinician and medical researcher, many obstacles still remain. Research at the Communications Engineering Branch (CEB) that addresses these challenges in significant ways may be understood as three interrelated efforts:
(1) Imaging R&D focusing on systems integration of existing technologies to create novel applications and solutions for high impact medical information problems. a. The problems addressed include those in image storage, display, network transmission, integration with other knowledge sources, incorporation into training and education systems, and image-based medical knowledge collection, including graphical knowledge. b. The R&D emphasis is on novel systems integration techniques, and systems integration applied to novel medical application domains. c. The fundamental methods used for image indexing, organization, and retrieval in these applications are mostly well-established.
(2) R&D into advanced methods for knowledge exploitation by directly using image content. a. The emphasis here is on advanced, state-of-the-art or experimental algorithmic development for indexing, organizing, and retrieving images by the direct use of image content, including properties such as color, texture, shape, and geometric arrangement of objects in the images. b. The work also addresses the critical issue of incorporating user feedback on query results in order to refine and improve the quality of the system response relative to the user’s retrieval goals, and hence, to reduce the semantic gap between desired and achieved query results.
(3) R&D into evaluation of imaging solutions.
a. This work involves establishing datasets and methodologies for the evaluation of image-derived knowledge from multiple observers. b. The work is primarily to address several related problems widely recognized in the medical image processing community: the need for techniques to evaluate the segmentations of objects in medical images that are obtained from multiple observers; how to obtain “truth” segmentations; and the fundamental issue of how to exploit “truth segmentation” in a way that is both meaningful and of practical value.
Following a retrospective of work conducted at the CEB in biomedical imaging (Section 1.1), and a description of a new image collection from the National Cancer Institute that motivates

3
much of our current work (Section 1.2), we discuss the significance and objectives of this project. Section 4 outlines our response to recommendations by the Board in 2002. In Section 5 we describe tools being developed in collaboration with NCI, and techniques that exploit image content for the indexing and retrieval of biomedical images (Content-Based Image Retrieval or CBIR.) In Sections 6, 7 and 8, we outline our approach to evaluate the techniques and tools, a project schedule and a summary, respectively. 1.1 Biomedical Imaging at CEB: A Retrospective
The long standing interest in biomedical imaging research at the Communications Engineering Branch spans several image types, but originates in an effort a decade and a half ago to preserve a collection of spine x-rays acquired as part of a periodic nationwide survey of public health conditions called the National Health and Nutrition Examination Survey (NHANES). The U.S. National Center for Health Statistics (NCHS) conducts this survey by setting up mobile Medical Examination Centers appropriately equipped and staffed at selected locations throughout the U.S. Data is gathered on a sampling of the population at each site. The second such survey, NHANES II, yielded a broad spectrum of information on each of 25,286 participants, of whom 20,322 were both interviewed and examined [1]. The data taken included medical examination data, demographic information, and blood chemistry analyses. In addition, a subset of the participants received a detailed examination that included radiographs of the cervical and lumbar spine. This resulted in a collection of approximately 17,000 films. The third survey, NHANES III [2], produced an additional 10,000 films of hands, wrists and knees.
Apart from these x-rays, the image sets of interest in our research also include the Visible Human color cryosections as well as recent collections of uterine cervix and histological images from the National Cancer Institute. Nevertheless, these x-rays provided the opportunity to begin investigating a wide range of problems related to the archiving, compression, transmission, indexing, access, retrieval and dissemination of digital biomedical images.
Since an original objective was to investigate the technologies for archiving and disseminating these x-rays, the 10,000 cervical and 7,000 lumbar spine radiographs were digitized at 146 dpi using a Lumisys laser scanner. Stored originally in a large optical disk jukebox, they currently reside in a 24 TB mass storage device, from which they are publicly accessible for FTP transfer. In addition, lower resolution versions of the images are accessed in response to queries to the WebMIRS system (described below). As mentioned, along with the x-ray images, the NHANES II survey also included information on demographics, health questionnaire responses and physician's examination results. Over 2,000 fields of such information were collected on each surveyed person, providing a large body of textual information, most of which is also publicly available through the WebMIRS system. Since the availability of metadata and successful migration from obsolete media to newer ones are key requirements for preservation, the original goal of preserving the images was met by the unique linking of the textual information (metadata) to the images, and the subsequent migrations.
The NHANES image set and the associated text have been used in several CEB projects whose objectives include: (a) the classification of the images for biomedical researchers, in particular the osteoarthritis research community - a long-standing goal for us as well as our collaborators at

4
NCHS and the National Institute of Arthritis and Musculoskeletal and Skin Diseases (NIAMS); (b) the capability to retrieve images based on geometric characteristics of the vertebrae - of interest to the vertebral morphometry community; and (c) the development of automated or computer-assisted classification and retrieval methods, highly desirable to offset the high cost of manual classification by medical experts. To address the medical, statistical, and technological issues related to the use of digitized versions of the NHANES II spine x-rays, two NIH workshops were convened: Digitized Radiographic Images: Challenges and Opportunities, held June 2-3, 1993; and Digitized Radiographic Images: Computer and Internet Access to Radiographic Images from Population Surveys, held May 9, 1995. These workshops identified 25 biomedical features of interest in the NHANES II spine x-ray images, viz., anterior osteophytes, disk space narrowing, subluxation in the cervical spine and spondylolisthesis in the lumbar spine, posterior osteophytes, plate erosion or sclerosis, vacuum phenomenon, abnormalities, ankylosing spondylititis, apophyseal OA, congenital/developmental disease, DISH, evidence of surgery, fracture, infection, disc calcification, neuropathic spine, osteopenia, Paget's disease, rheumatoid arthritis, spondyloarthropathy, spondylosis deformans, anterior ligamentous calcification, congenital fusion, and tumor. However, the workshops identified only 3 features that could be reliably and consistently detected, viz., anterior osteophytes, disc space narrowing, and subluxation for the cervical spine and spondylolisthesis for the lumbar spine. Consequently, we have concentrated the automated classification and Content-based Image Retrieval (CBIR) efforts on these features.
The CEB projects using the NHANES II x-ray images as the principal image data were favorably reviewed at numerous times by the Board of Scientific Counselors, and are summarized below.
Reviewed by the BSC in 1991 and 1995, the DXPNET Project (Digitized X-ray Prototype workstations linked via InterNET), a collaborative effort among NLM, NIAMS and NCHS, developed systems for the collection of controlled radiological interpretations of the NHANES II digitized x-ray images by multiple readers (domain experts) in the distributed environment of the Internet [3]. In this project CEB accomplished: the software development and system integration necessary to allocate images to multiple, geographically-distributed readers; multisocket transmission techniques to efficiently deliver images from CEB to the readers [4]; software to display images on high-resolution (2Kx2.5K) Megascan monitors hosted by Sun workstations at reader sites; acquiring image interpretations through an onscreen template (designed in collaboration with NIAMS domain experts); collecting these interpretations at a central database maintained by CEB; and development of Quality Control Workstations for content experts to verify image quality.
DXPNET led to several research activities toward improving public access to the NHANES images and collateral data, including the development of WebMIRS (which evolved from an initial non-Web, Sun workstation-based, Medical Information Retrieval System), the FTP x-ray Archive, and the Digital Atlas of the Cervical and Lumbar Spine. One technical accomplishment related to the DXPNET project, in collaboration with NCHS domain experts, was to establish the level of digitization to be used for the 5,000 hand x-ray films collected by the NHANES III survey, conducted 1988-1994. A multiple-reader data collection was carried out at the CEB site, using high-resolution Megascan monitors, display and data collection software developed by CEB. The study used 49 hand radiographs collected from the Pima Indian population. Each

5
radiograph was digitized at three different resolutions: 2001x1634, 3000x2400, and 4900x3000, all with a pixel depth of 12 bits. Two radiologists independently graded each of the three sets of digital images for degree of bone erosions. A pre-existing grading of the original film by a different group of radiologists was used as a reference. Based on the outcome of the study, the NCHS elected to digitize the NHANES III x-ray films at the medium resolution (3000x2400), striking a balance between effective image quality and storage and transmission requirements [5].
The development of WebMIRS (Web-based Medical Information Retrieval System), reviewed by the BSC in 1998, provided Web access to the x-rays and associated data to a broad user community from academia, corporations, hospitals and elsewhere. Reported uses include research in epidemiology and rheumatology, computer science work in algorithmic development and image processing research, and graduate education in the classroom.
(a) (b)
(c) (d) Figure 1.1: Related CEB Projects: (a) WebMIRS Query Results Screen, Image View (b) Atlas Images for CSPINE Anterior Osteophytes (c) Spine x-ray Multimedia Database Implemented with Microsoft Access (d) Visible Human Image Downloading Application Using Lossless Compression
6
WebMIRS capabilities included:
• Database access through standard Java-enabled Web browsers (Netscape/Internet Explorer), on PCs, Sun Solaris machines, and potentially any platform providing the same level of Java support;
• Optimum GUI design for relational database query capability; • Retrieval of the x-ray images as well as the associated text in response to queries; • User capability to save results for subsequent review and documentation; • User capability to export results to standard statistical tools (SAS, SUDAAN) for
research and analysis; • Access to multiple databases; • Access to coarse-level segmentation data marked by medical experts for a subset of the
images for use in image processing research.
A view of the WebMIRS query results screen, in the optional ``Image View'' mode, is shown in Figure 1.1(a). Retrieved in response to a query, the textual data in the bottom window corresponds to the highlighted x-ray image of a particular survey subject. Two databases are supported by the WebMIRS system; these databases have been created from the data in NHANES II and III surveys. The WebMIRS NHANES II database contains demographic, anthropometric, adult health questionnaire and physical examination data for 20,322 NHANES II survey participants. The WebMIRS NHANES III database contains demographic, adult health questionnaire, youth health questionnaire, and laboratory data for all of the approximately 30,000 NHANES III survey participants. The 17,000 cervical and lumbar spine images collected during NHANES II are available for display through WebMIRS, in low-resolution form, in addition to this text survey data. For both databases, the statistical weights and survey design variables are available for proper analysis of the data.
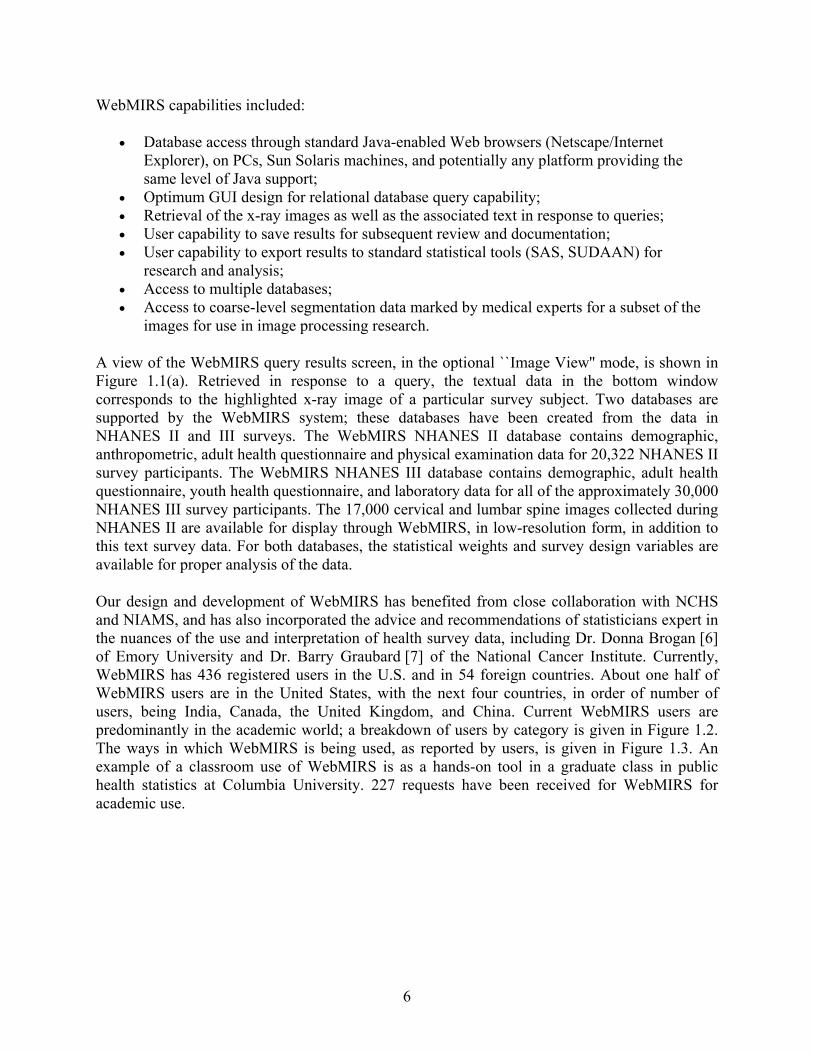
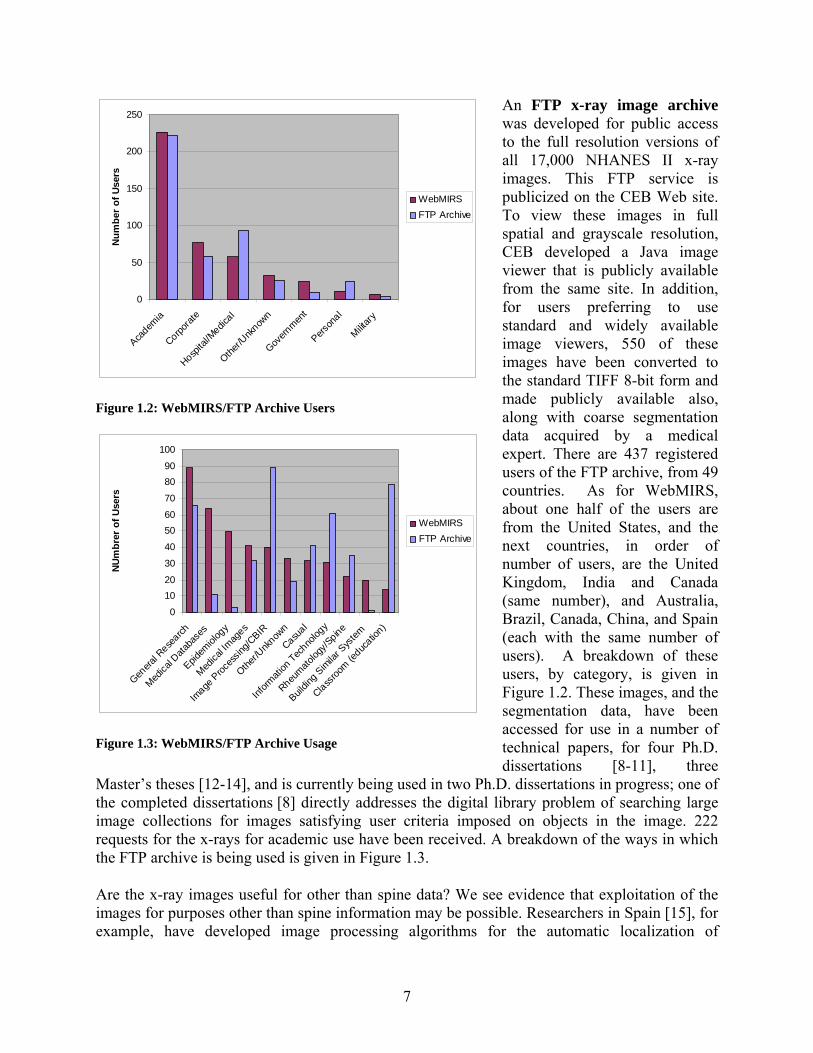
Our design and development of WebMIRS has benefited from close collaboration with NCHS and NIAMS, and has also incorporated the advice and recommendations of statisticians expert in the nuances of the use and interpretation of health survey data, including Dr. Donna Brogan [6] of Emory University and Dr. Barry Graubard [7] of the National Cancer Institute. Currently, WebMIRS has 436 registered users in the U.S. and in 54 foreign countries. About one half of WebMIRS users are in the United States, with the next four countries, in order of number of users, being India, Canada, the United Kingdom, and China. Current WebMIRS users are predominantly in the academic world; a breakdown of users by category is given in Figure 1.2. The ways in which WebMIRS is being used, as reported by users, is given in Figure 1.3. An example of a classroom use of WebMIRS is as a hands-on tool in a graduate class in public health statistics at Columbia University. 227 requests have been received for WebMIRS for academic use.
7
An FTP x-ray image archive was developed for public access to the full resolution versions of all 17,000 NHANES II x-ray images. This FTP service is publicized on the CEB Web site. To view these images in full spatial and grayscale resolution, CEB developed a Java image viewer that is publicly available from the same site. In addition, for users preferring to use standard and widely available image viewers, 550 of these images have been converted to the standard TIFF 8-bit form and made publicly available also, along with coarse segmentation data acquired by a medical expert. There are 437 registered users of the FTP archive, from 49 countries. As for WebMIRS, about one half of the users are from the United States, and the next countries, in order of number of users, are the United Kingdom, India and Canada (same number), and Australia, Brazil, Canada, China, and Spain (each with the same number of users). A breakdown of these users, by category, is given in Figure 1.2. These images, and the segmentation data, have been accessed for use in a number of technical papers, for four Ph.D. dissertations [8-11], three
Master’s theses [12-14], and is currently being used in two Ph.D. dissertations in progress; one of the completed dissertations [8] directly addresses the digital library problem of searching large image collections for images satisfying user criteria imposed on objects in the image. 222 requests for the x-rays for academic use have been received. A breakdown of the ways in which the FTP archive is being used is given in Figure 1.3.
Are the x-ray images useful for other than spine data? We see evidence that exploitation of the images for purposes other than spine information may be possible. Researchers in Spain [15], for example, have developed image processing algorithms for the automatic localization of
0
50
100
150
200
250
Academ
ia
Corporat
e
Hospita
l/Medic
al
Other/U
nknow
n
Govern
ment
Person
al
Military
Num
ber o
f Use
rs
WebMIRSFTP Archive
Figure 1.2: WebMIRS/FTP Archive Users
0
1020
30
40
5060
70
8090
100
Genera
l Rese
arch
Medica
l Data
base
s
Epidem
iolog
y
Medica
l Imag
es
Image
Proc
essin
g/CBIR
Other/U
nknow
n
Casual
Inform
ation
Techno
logy
Rheumato
logy/S
pine
Buildin
g Sim
ilar S
ystem
Classroo
m (educ
ation)
NUm
brer
of U
sers
WebMIRSFTP Archive
Figure 1.3: WebMIRS/FTP Archive Usage
8
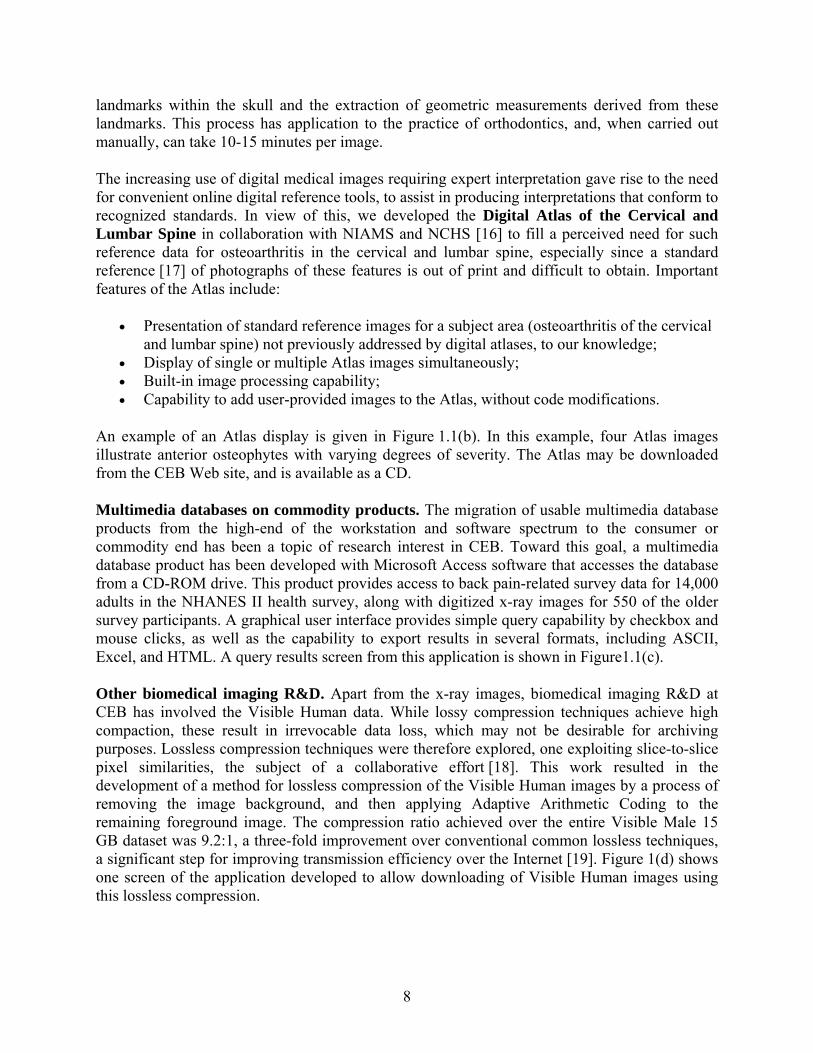
landmarks within the skull and the extraction of geometric measurements derived from these landmarks. This process has application to the practice of orthodontics, and, when carried out manually, can take 10-15 minutes per image.
The increasing use of digital medical images requiring expert interpretation gave rise to the need for convenient online digital reference tools, to assist in producing interpretations that conform to recognized standards. In view of this, we developed the Digital Atlas of the Cervical and Lumbar Spine in collaboration with NIAMS and NCHS [16] to fill a perceived need for such reference data for osteoarthritis in the cervical and lumbar spine, especially since a standard reference [17] of photographs of these features is out of print and difficult to obtain. Important features of the Atlas include:
• Presentation of standard reference images for a subject area (osteoarthritis of the cervical and lumbar spine) not previously addressed by digital atlases, to our knowledge;
• Display of single or multiple Atlas images simultaneously; • Built-in image processing capability; • Capability to add user-provided images to the Atlas, without code modifications.
An example of an Atlas display is given in Figure 1.1(b). In this example, four Atlas images illustrate anterior osteophytes with varying degrees of severity. The Atlas may be downloaded from the CEB Web site, and is available as a CD.
Multimedia databases on commodity products. The migration of usable multimedia database products from the high-end of the workstation and software spectrum to the consumer or commodity end has been a topic of research interest in CEB. Toward this goal, a multimedia database product has been developed with Microsoft Access software that accesses the database from a CD-ROM drive. This product provides access to back pain-related survey data for 14,000 adults in the NHANES II health survey, along with digitized x-ray images for 550 of the older survey participants. A graphical user interface provides simple query capability by checkbox and mouse clicks, as well as the capability to export results in several formats, including ASCII, Excel, and HTML. A query results screen from this application is shown in Figure1.1(c).
Other biomedical imaging R&D. Apart from the x-ray images, biomedical imaging R&D at CEB has involved the Visible Human data. While lossy compression techniques achieve high compaction, these result in irrevocable data loss, which may not be desirable for archiving purposes. Lossless compression techniques were therefore explored, one exploiting slice-to-slice pixel similarities, the subject of a collaborative effort [18]. This work resulted in the development of a method for lossless compression of the Visible Human images by a process of removing the image background, and then applying Adaptive Arithmetic Coding to the remaining foreground image. The compression ratio achieved over the entire Visible Male 15 GB dataset was 9.2:1, a three-fold improvement over conventional common lossless techniques, a significant step for improving transmission efficiency over the Internet [19]. Figure 1(d) shows one screen of the application developed to allow downloading of Visible Human images using this lossless compression.
9
In addition, AnatQuest, a system analogous to MapQuest, makes VH images easily available to a large constituency. It is a Web interface with a viewport into the anatomy so that a user may: navigate in 3 dimensions, along z- as well as x- and y-axes; zoom to navigate through high resolution images; display both raw image slices (sagittal, coronal, axial), as well as rendered organs (one by one, or streaming video, depending on user bandwidth available); show anatomic labels to identify structures; dissect rendered images to reveal internal structure. The AnatQuest viewer fetches desired images from a database server, and transfer mechanisms accommodate low bandwidth connections by transferring only portions sufficient to fill the display frame of the viewer. For high bandwidth connections, streaming video gives continuous motion display of organs. The system is based on Java Advanced Imaging (JAI: Java 3D) released for Web, which possesses image processing features, e.g., contrast enhancement, scaling, cropping.
1.2 Prolog to Current Work
Significant challenges remain in finding the best ways to archive, compress, transmit, index, access, retrieve and disseminate digital biomedical images. Automated indexing by image content features through CBIR techniques is a particular interest. We have summarized much of our past and recent work in [20]. While we continue to use our x-ray collection to tackle these problems, much of our current focus is on new image collections from NCI, as described in this report.
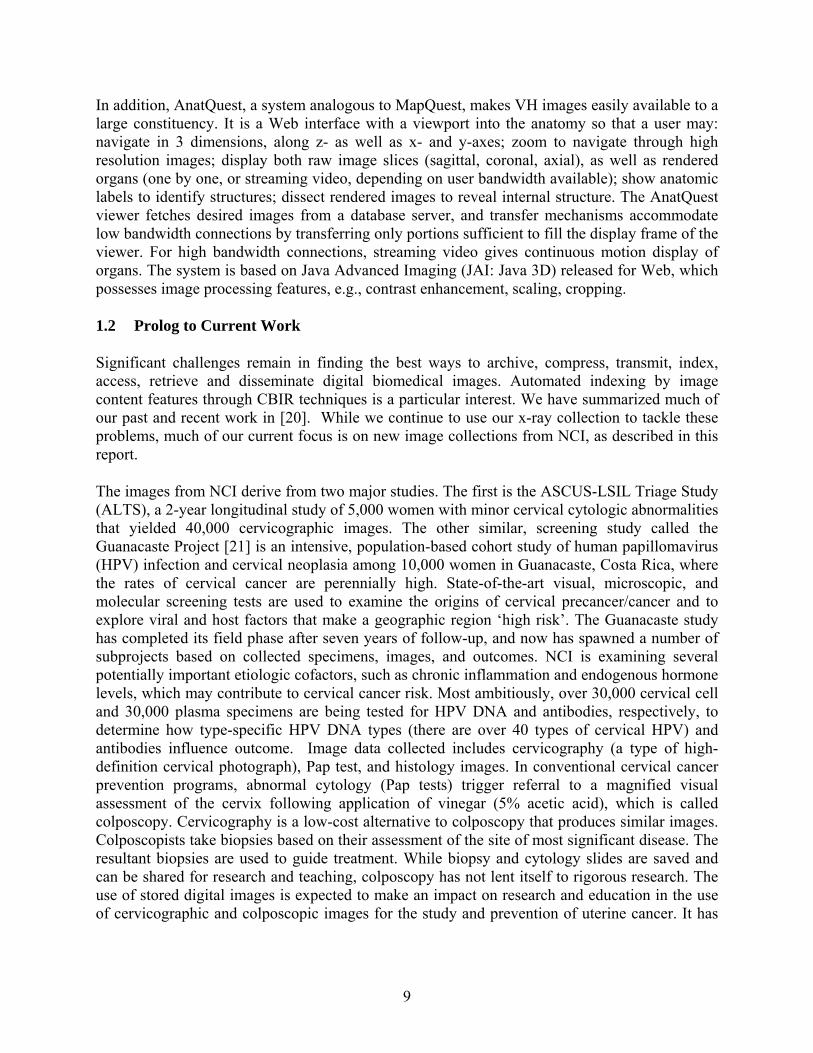
The images from NCI derive from two major studies. The first is the ASCUS-LSIL Triage Study (ALTS), a 2-year longitudinal study of 5,000 women with minor cervical cytologic abnormalities that yielded 40,000 cervicographic images. The other similar, screening study called the Guanacaste Project [21] is an intensive, population-based cohort study of human papillomavirus (HPV) infection and cervical neoplasia among 10,000 women in Guanacaste, Costa Rica, where the rates of cervical cancer are perennially high. State-of-the-art visual, microscopic, and molecular screening tests are used to examine the origins of cervical precancer/cancer and to explore viral and host factors that make a geographic region ‘high risk’. The Guanacaste study has completed its field phase after seven years of follow-up, and now has spawned a number of subprojects based on collected specimens, images, and outcomes. NCI is examining several potentially important etiologic cofactors, such as chronic inflammation and endogenous hormone levels, which may contribute to cervical cancer risk. Most ambitiously, over 30,000 cervical cell and 30,000 plasma specimens are being tested for HPV DNA and antibodies, respectively, to determine how type-specific HPV DNA types (there are over 40 types of cervical HPV) and antibodies influence outcome. Image data collected includes cervicography (a type of high-definition cervical photograph), Pap test, and histology images. In conventional cervical cancer prevention programs, abnormal cytology (Pap tests) trigger referral to a magnified visual assessment of the cervix following application of vinegar (5% acetic acid), which is called colposcopy. Cervicography is a low-cost alternative to colposcopy that produces similar images. Colposcopists take biopsies based on their assessment of the site of most significant disease. The resultant biopsies are used to guide treatment. While biopsy and cytology slides are saved and can be shared for research and teaching, colposcopy has not lent itself to rigorous research. The use of stored digital images is expected to make an impact on research and education in the use of cervicographic and colposcopic images for the study and prevention of uterine cancer. It has

10
been remarked by an expert in the field of gynecology that colposcopy research has lagged behind other fields that have taken advantage of advances in computerization [22]. Our work in collaboration with NCI is to develop methods to permit exploration of visual aspects of HPV and cervical neoplasia. In etiologic studies NCI researchers will relate the numbers of infecting viral types with numbers and positions of lesions. They will be able to follow the topographic progression and regression of lesions. For screening research NCI will be able to use 60,000 digitized uterine cervix images from the Guanacaste Project to optimize and standardize visual screening of the cervix. Along with developing supporting technologies, we assume the role of developing a suite of open source applications for the purpose of exploiting extensive longitudinal study data collected on subjects from the ALTS and Guanacaste projects.
2 Project Significance
Both NLM and NIH expert advisory groups in past years have explicitly placed high importance on incorporating image use into medical knowledge, research and practice [23, 24]. The matrix below illustrates the relationship of our project work to current NLM long-range goals, as elaborated in the updated 2006 NLM Long Range Plan [25].
Project work Applicable 2006 NLM Long Range Plan elements
Imaging R&D focusing on systems integration for novel solutions to high impact medical information problems
• Data mining tools and algorithms for knowledge discovery • Support integration of public health data…into clinical informatics • Develop…public health information by supporting training and research • Develop and promulgate … model programs that server underserved
populations at home and abroad • Develop open-source, translational research tools and resources,
including data collection tools. • Interact closely with…the work of other individual institutes
R&D for advanced imaging solutions by use of image contents
• Data mining tools and algorithms for knowledge discovery • Develop computational algorithms and tools that can extract information
from multiple biological sources…and integrate them into coherent data models
• Develop open-source, translational research tools and resources, including data collection tools
R&D into evaluation of imaging solutions
• Data mining tools and algorithms for knowledge discovery • Play a leading role in encouraging…criteria for quality in clinical
databases • Develop computational algorithms and tools that can extract information
from multiple biological sources…and integrate them into coherent data models
• Interact closely with…the work of other individual institutes
11
3 Project Objectives
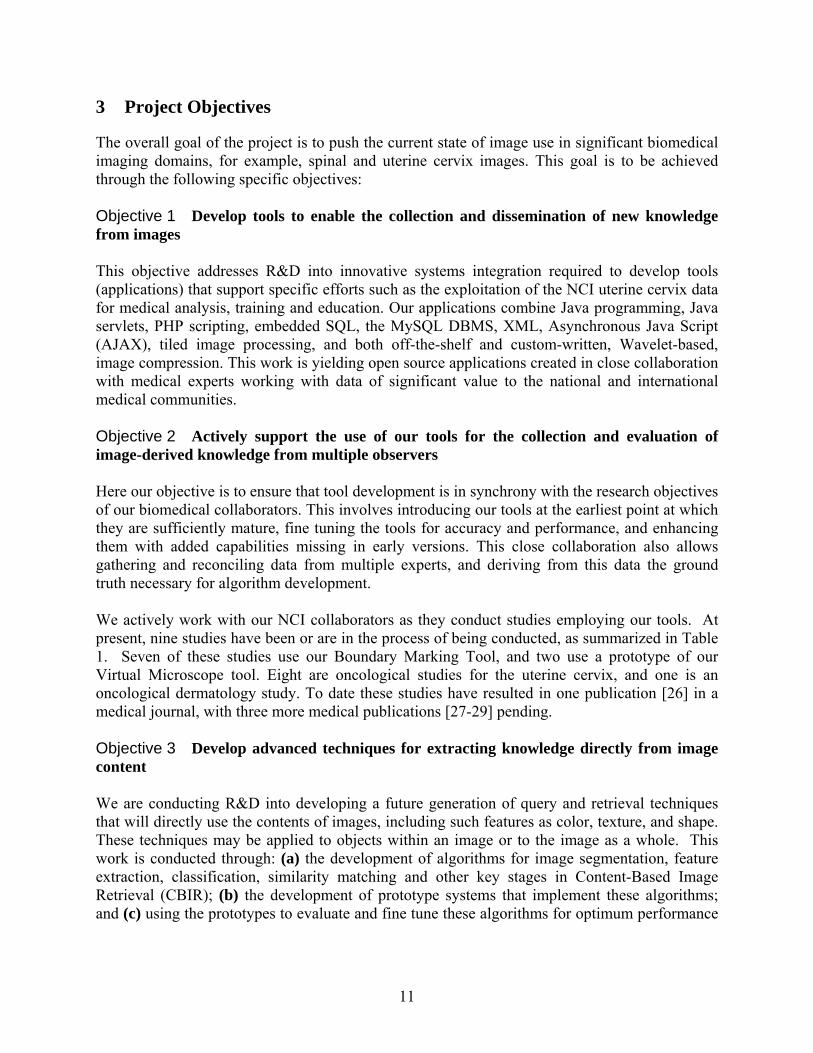
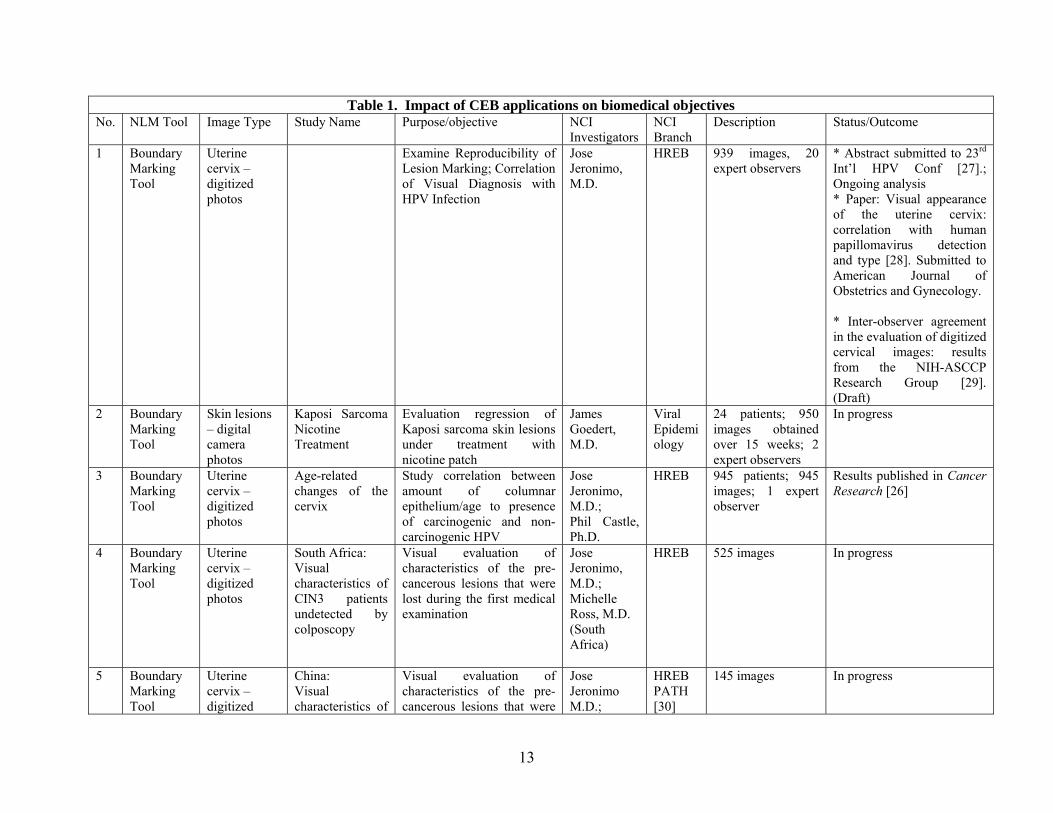
The overall goal of the project is to push the current state of image use in significant biomedical imaging domains, for example, spinal and uterine cervix images. This goal is to be achieved through the following specific objectives: Objective 1 Develop tools to enable the collection and dissemination of new knowledge from images This objective addresses R&D into innovative systems integration required to develop tools (applications) that support specific efforts such as the exploitation of the NCI uterine cervix data for medical analysis, training and education. Our applications combine Java programming, Java servlets, PHP scripting, embedded SQL, the MySQL DBMS, XML, Asynchronous Java Script (AJAX), tiled image processing, and both off-the-shelf and custom-written, Wavelet-based, image compression. This work is yielding open source applications created in close collaboration with medical experts working with data of significant value to the national and international medical communities. Objective 2 Actively support the use of our tools for the collection and evaluation of image-derived knowledge from multiple observers Here our objective is to ensure that tool development is in synchrony with the research objectives of our biomedical collaborators. This involves introducing our tools at the earliest point at which they are sufficiently mature, fine tuning the tools for accuracy and performance, and enhancing them with added capabilities missing in early versions. This close collaboration also allows gathering and reconciling data from multiple experts, and deriving from this data the ground truth necessary for algorithm development. We actively work with our NCI collaborators as they conduct studies employing our tools. At present, nine studies have been or are in the process of being conducted, as summarized in Table 1. Seven of these studies use our Boundary Marking Tool, and two use a prototype of our Virtual Microscope tool. Eight are oncological studies for the uterine cervix, and one is an oncological dermatology study. To date these studies have resulted in one publication [26] in a medical journal, with three more medical publications [27-29] pending. Objective 3 Develop advanced techniques for extracting knowledge directly from image content We are conducting R&D into developing a future generation of query and retrieval techniques that will directly use the contents of images, including such features as color, texture, and shape. These techniques may be applied to objects within an image or to the image as a whole. This work is conducted through: (a) the development of algorithms for image segmentation, feature extraction, classification, similarity matching and other key stages in Content-Based Image Retrieval (CBIR); (b) the development of prototype systems that implement these algorithms; and (c) using the prototypes to evaluate and fine tune these algorithms for optimum performance

12
for targeted image collections. CBIR is expected to play a significant role in data mining and knowledge discovery from images in the future. Objective 4 Maintain a strong publication policy and publicly disseminate the applications developed Our work has been, and will continue to be, published in the open literature. Further, all software will continue to be distributed as open source material, and commercial dependencies (sometimes necessary in early prototypes) will be eliminated to enable widespread use.
13
Table 1. Impact of CEB applications on biomedical objectives No. NLM Tool Image Type Study Name Purpose/objective NCI
Investigators NCI Branch
Description Status/Outcome
1 Boundary Marking Tool
Uterine cervix – digitized photos
Examine Reproducibility of Lesion Marking; Correlation of Visual Diagnosis with HPV Infection
Jose Jeronimo, M.D.
HREB 939 images, 20 expert observers
* Abstract submitted to 23rd Int’l HPV Conf [27].; Ongoing analysis * Paper: Visual appearance of the uterine cervix: correlation with human papillomavirus detection and type [28]. Submitted to American Journal of Obstetrics and Gynecology. * Inter-observer agreement in the evaluation of digitized cervical images: results from the NIH-ASCCP Research Group [29]. (Draft)
2 Boundary Marking Tool
Skin lesions – digital camera photos
Kaposi Sarcoma Nicotine Treatment
Evaluation regression of Kaposi sarcoma skin lesions under treatment with nicotine patch
James Goedert, M.D.
Viral Epidemiology
24 patients; 950 images obtained over 15 weeks; 2 expert observers
In progress
3 Boundary Marking Tool
Uterine cervix – digitized photos
Age-related changes of the cervix
Study correlation between amount of columnar epithelium/age to presence of carcinogenic and non-carcinogenic HPV
Jose Jeronimo, M.D.; Phil Castle, Ph.D.
HREB 945 patients; 945 images; 1 expert observer
Results published in Cancer Research [26]
4 Boundary Marking Tool
Uterine cervix – digitized photos
South Africa: Visual characteristics of CIN3 patients undetected by colposcopy
Visual evaluation of characteristics of the pre-cancerous lesions that were lost during the first medical examination
Jose Jeronimo, M.D.; Michelle Ross, M.D. (South Africa)
HREB 525 images In progress
5 Boundary Marking Tool
Uterine cervix – digitized
China: Visual characteristics of
Visual evaluation of characteristics of the pre-cancerous lesions that were
Jose Jeronimo M.D.;
HREB PATH [30]
145 images In progress

14
Table 1. Impact of CEB applications on biomedical objectives No. NLM Tool Image Type Study Name Purpose/objective NCI
Investigators NCI Branch
Description Status/Outcome
photos CIN2+ patients undetected by colposcopy
lost during the first medical examination
John Sellors, M.D.
6 Boundary Marking Tool
Uterine cervix – digitized photos
Multinational evaluation of a new approach for cervical cancer screening and treatment
A new approach for cervical cancer prevention based on HPV-DNA testing followed by visual inspection to be tested with physicians and nurses from USA, Peru, Costa Rica, Nicaragua, and South Africa.
Julia Gage; Jose Jeronimo, M.D.
HREB 721 images In progress
7 Boundary Marking Tool
Uterine cervix – digitized photos
Multi-expert evaluation and consensus in the evaluation of digitized cervigrams to be used for training purposes
Selection of images to be used for training in colposcopy, by consensus among expert colposcopists.
Jose Jeronimo, M.D.; Dennis O’Connor M.D; Alan Waxman M.D.
HREB ASCCP
100 In progress
8 Virtual Microscope
Uterine cervix – digitized biopsy (histology) slides
Evaluate virtual microscope for cell counting
Mark Schiffman, M.D.; Melinda Butch-Kovacic, Ph.D.
HREB 500 images; 1 observer
In progress
9 Virtual Microscope
Uterine cervix – digitized biopsy (histology) slides
Evaluate reproducibility of physical microscope study with digital tools
Jose Jeronimo, M.D.
HREB 600 patients; 1200 images; 5 expert observers
In progress

15
4 Status Report
Reviewing our early work in Content-Based Image Retrieval in 2002, the BSC stated that this research program has significance in that it is central to the mission of the National Library of Medicine as a global archive for important classes and examples of biomedical images associated with human health and disease. With this in mind, the Board made insightful recommendations that have since been incorporated in this project. The first recommendation, that our research should be extended to an additional test collection, was met with the addition of large sets of uterine cervix images collected by the NCI. Future projects using the clinical Lung Image Data Consortium and other images in their archive are also under discussion with NCI collaborators. A second recommendation was to include similarity measures for the text accompanying the images in addition to the similarity measures used for image features. While our work uses text descriptors for the cervix and spinal images, comparisons are made on the exact matching of text since the text descriptors do not readily lend themselves to similarity measurements. A pilot project is under way to investigate the challenges of mapping image-associated text to uniform medical terms for similarity comparisons. In line with another recommendation, steps were taken to review visualization work in other labs, focusing particularly on tools. Examples are the SPIRE project at the Pacific Northwest Labs, and work at the University of Maryland’s Human Computer Interface Laboratory. The Board also recommended a survey of researchers using NHANES data with a view to determining the role of CBIR. It was found that the literature contains numerous instances of the use of NHANES II images for image analysis and informatics research, though specific efforts toward CBIR are relatively rare. However, three board certified radiologists consulted were very encouraging about the value of CBIR in these and other images. Such favorable feedback has influenced our research direction and work in CBIR. In particular, it has informed the design of data validation tools and techniques to reflect user needs and process workflows that better accommodate requirements in a biomedical research setting. The Board finally recommended expanding the community of researchers in CBIR for biomedical images through small contracts. In this regard, we have assembled a small group of university collaborators with the goal of furthering the state of the art in image analysis, enhancement, compression, feature extraction, image similarity measures, combining image and text retrieval, and relevance feedback for use in CBIR research.
5 Methods and Procedures for Biomedical Image Informatics
In this section we present an overview of ongoing and future work in two broad categories: multimedia data management, where we have emphasized systems integration R&D in order to create applications with near-term biomedical impact in data mining, integration of public health data into clinical informatics, and supporting training and research for public health improvement; and advanced algorithmic R&D into new methods of knowledge extraction from biomedical images for data mining, knowledge discovery, and the development of computational

16
algorithms and tools that can extract information from multiple sources, both text and images, and integrate them into coherent data models. All tools developed are intended to be open source, including those for data collection and information sharing, for both the research community and the general public. The tools are developed in collaboration with the National Cancer Institute (uterine cervix applications) or with individual biomedical experts (spine applications). 5.1 Multimedia data management: enabling applications for near-term impact CEB work in developing informatics applications in collaboration with the National Cancer Institute are expected to have near-term impact in the field of colposcopy. This work was the subject of an editorial in the national journal of the American Society for Colposcopy and Cervical Pathology (ASCCP), which stated:
In the archive that NCI staff have prepared in collaboration with experts at the National Library of Medicine (NLM), images have been digitized and correlated with digitized photographs of biopsy material as well as with patient demographics and risk factors, including type-specific human papillomavirus results. Thanks to the generosity of the National Institutes of Health (NIH), ASCCP has begun to explore opportunities for collaborative uses of this archive in research and teaching. Colposcopy research has lagged behind other fields that have taken advantage of advances in computerization. Most colposcopy research has been conducted at single institutions or small consortia, limiting generalizability and scope. The ASCCP, NCI, and NLM have developed a panel of colposcopists who will be assessing research questions in colposcopy through the Internet by marking up hundreds of colposcopic images using NIH-based servers and statistical techniques. This collaboration would allow us to address issues important to all colposcopists, including how closely the range of colposcopic findings correlates with high-grade disease and how interobserver and intraobserver variability impacts the accuracy of colposcopic assessment. [31]
5.1.1 Boundary Marking Tool The Boundary Marking Tool (BMT) [32, 33], shown in Figure 5.1, provides capability to manually draw regions on the cervicography image and to record region labels and expert interpretative information. Regions that may be marked to correspond to tissue types or anatomical features are acetowhite lesions, invasive cancer, squamous metaplasia, Nabothian cysts, cervical borders, os, and polyps. In addition, the squamocolumnar boundary may be marked, as well as two frequently-obscuring features: blood and mucus. Detailed labeling may be recorded for some of these features. For example, for the acetowhite lesions, the expert may classify the lesion boundary shape characteristics using a standard Reid scale, may classify the color of the lesion, and may record the presence of certain detail features (punctation, mosaicism, vasculature). The BMT is a mature tool, primarily for data collection, that has already supported multiple studies (See Section 3) for NCI researchers, including one published result [26]; additional medical publications are pending [28-30]. A recent NCI data collection with the BMT used cervicography from 939 women and 20 expert colposcopist evaluators at geographically-distributed sites. Each evaluator marked cervix boundaries and acetowhite lesions on the images and provided a clinical diagnosis, ranging from normal, through low- and high-grade lesion, to

17
invasive cancer. Multiple studies are under way on this data, including assessment of reproducibility of colposcopic diagnosis, accuracy of the visual evaluation, and visual patterns in the cervices of HPV-infected and non-HPV-infected women. Future BMT studies will investigate patterns of appearance and disappearance of precancerous lesions, and inter-observer agreement on biopsy placement.
Although the BMT was designed for use with the uterine cervix we expect it to be useful for collecting region-based data from additional image types. Figure 5.1 shows initial work to use the BMT in a dermatology study that will measure the effects of nicotine patch treatment on Kaposi sarcoma lesions. The BMT is designed as a Java client application which interfaces to a server MySQL database; tunneling software (JDBTunnel) is currently used to allow the client to communicate to the database by using only HTTP messages to the Web server. This avoids communications problems frequently encountered when users deploy the BMT client behind firewalls at their local sites. In further development of this tool, to eliminate the firewall problem without this commercial software dependency, we plan to replace the tunneling software with a servlet architecture.
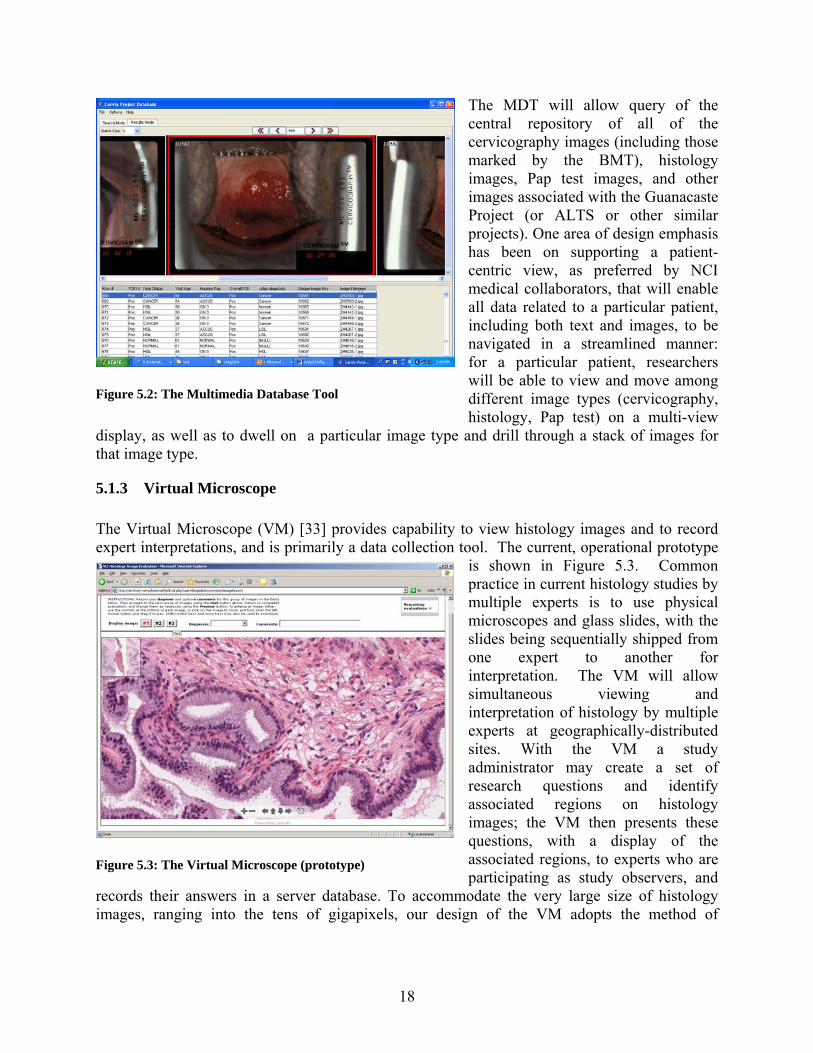
5.1.2 Multimedia Database Tool The Multimedia Database Tool (MDT) [33, 34], shown in Figure 5.2, represents the next generation of the Web-based Medical Information Retrieval System [35], described in Section 1.1, with which NLM has been distributing spine x-ray images and health survey data for several years. The MDT will serve as the central database tool for accessing the Guanacaste and ALTS Project data, and will provide the capability to query on any of the text data in these databases, and retrieve not only text, but associated images.
Uterine cervix Dermatology (Kaposi sarcoma study) Figure 5.1: The Boundary Marking Tool
18
The MDT will allow query of the central repository of all of the cervicography images (including those marked by the BMT), histology images, Pap test images, and other images associated with the Guanacaste Project (or ALTS or other similar projects). One area of design emphasis has been on supporting a patient-centric view, as preferred by NCI medical collaborators, that will enable all data related to a particular patient, including both text and images, to be navigated in a streamlined manner: for a particular patient, researchers will be able to view and move among different image types (cervicography, histology, Pap test) on a multi-view
display, as well as to dwell on a particular image type and drill through a stack of images for that image type.
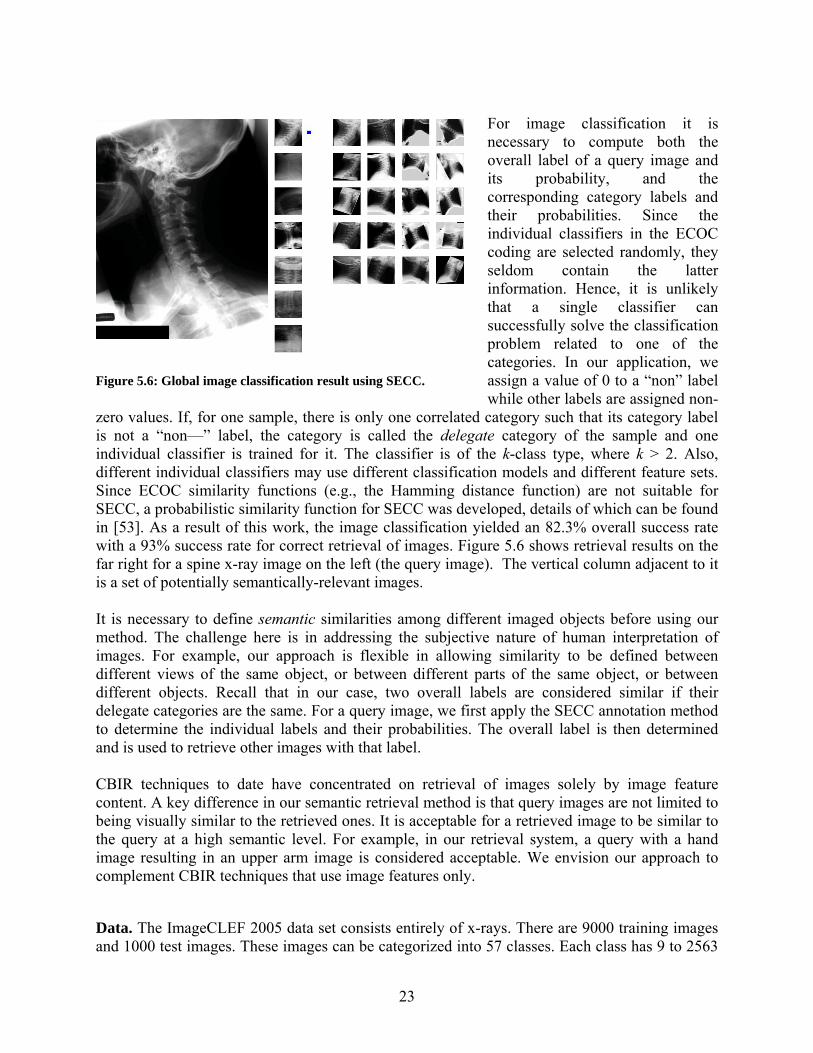
5.1.3 Virtual Microscope The Virtual Microscope (VM) [33] provides capability to view histology images and to record expert interpretations, and is primarily a data collection tool. The current, operational prototype
is shown in Figure 5.3. Common practice in current histology studies by multiple experts is to use physical microscopes and glass slides, with the slides being sequentially shipped from one expert to another for interpretation. The VM will allow simultaneous viewing and interpretation of histology by multiple experts at geographically-distributed sites. With the VM a study administrator may create a set of research questions and identify associated regions on histology images; the VM then presents these questions, with a display of the associated regions, to experts who are participating as study observers, and
records their answers in a server database. To accommodate the very large size of histology images, ranging into the tens of gigapixels, our design of the VM adopts the method of
Figure 5.2: The Multimedia Database Tool
Figure 5.3: The Virtual Microscope (prototype)

19
displaying the images as tiles which are dynamically assembled into the current view panned by the user. Prototypes of the VM have been developed as browser-based applications based on the Zoomify [36] tiling technology incorporated in a Web server system with PHP and Java servlets. Figure 5.3 shows the screen from one of these prototypes. A key NCI study under way is to evaluate the reliability of virtual microscope technology in diagnosis of pre-malignant uterine cervix disease. In this study digitized slides from 600 patients are viewed by five expert observers, who record a diagnosis ranging from normal, through CIN 1/2/3, to invasive cancer. (“CIN” or cervical intraepithelial neoplasia refers to abnormal cell growth within the “skin” of the cervix; the terms “CIN 1, 2, 3” refer to increasing grades of abnormality [37].) The study results will be compared to a study previously carried out with the same data, using conventional microscope/glass slide protocol. The next generation VM system is being designed with Java support for image tiling and handling, to eliminate dependency on the commercial Zoomify product, and to allow more flexibility for future modification.
5.1.4 Teaching Tool The Teaching Tool (TT) [33], shown in Figure 5.4, will provide training and teaching in the interpretation of cervicography images for development of precancer. It is intended for use in training experts in the use of cervicography and colposcopy images for screening patients for pre-cancerous conditions. The TT allows a study administrator to create training materials, in the form of images and related questions, for which immediate feedback may be provided; or certification examinations, which also present images and related questions, but with student responses being collected, scored, and sent to the study administrator, with statistical summaries
of results provided by the tool. An example question from a certification exam might present images of both a Pap test and cervicography and ask, “Based on your overall impression, what is the worst diagnosis?”, where multiple choice answers ranging from HPV infection to carcinoma are provided. Other questions may present histology images showing two biopsy results and similarly ask for a multiple-choice diagnosis, then ask in a follow-up question for clinical management options. In its first version, the TT has been developed as a PHP-driven Web browser application. This version
Figure 5.4: The Teaching Tool.

20
was reviewed by NCI and ASCCP experts who produced requirements for the second implementation, which is expected to be deployed for actual training and testing. The TT serves both data dissemination (by training) and data collection (by testing) functions. 5.2 Advanced techniques for biomedical image knowledge extraction Knowledge extraction from biomedical images is an essential activity in development of multimedia databases and management of large image and text archives. With this motivation we are conducting advanced algorithmic R&D in Content-Based Image Retrieval (CBIR) to develop new methods of knowledge extraction from biomedical images for data mining, knowledge discovery, and the development of computational algorithms and tools that can extract information from multiple sources, both text and images, and integrate them into coherent data models. In concept, CBIR is a collection of enabling techniques for the extraction, assimilation, and dissemination of knowledge from images. In practice, however, it is extremely challenging to assemble an effective system with these functions. However, addition of metadata such as supporting text which could be extracted from patient records, physician’s notes, published literature, and imaging parameters, could assist in significantly boosting the utility of such a system. The potential pay-off from medical imaging informatics and CBIR, in particular, is highly significant. According to a 2001 technical review [38] of the field, CBIR is critical in digital libraries for patient care, clinical diagnosis and decision making in large-scale clinical trials, managing large-scale protein image databases, and in biomedical education. A primer on CBIR is provided in Appendix A. As mentioned earlier, two NLM Long Range Planning panels have recommended research into extraction of knowledge from image data. As far back as 1986, an earlier panel noted that “In the area of non-textual signals, the field most in need of initiative by the NLM is that of the handling of images which are important to the biological community” [23]. Another NIH workshop sponsored by the National Cancer Institute was convened in 1993 to explore medical image databases and arrived at specific recommendations [24] for future research that included development of image indexing and retrieval techniques with advanced non-textual query capability using image features; relating image features to disease; and cohesive unification of data from various sources. These goals are addressed through our research into CBIR, an area of open, but promising and popular, work [39-41]. All these goals require development of imaging tools and techniques for automatic segmentation, labeling and organization of normal and abnormal anatomy for retrieval, analysis and classification which constitute basic steps into development of CBIR systems. Our approach in the development of CBIR systems reflects many recommendations made by these long range panels and in NIH workshops. Our vision of CBIR as a biomedical informatics tool A problem faced in many current approaches to CBIR for medical images is that they operate on the image as a whole, i.e., they compute global image features such as a color histogram measured on the entire image. For some purposes, this global approach is adequate. An instructor looking for an example of lateral view lumbar spine x-rays within a PACS system of

21
images that are heterogeneous with respect to data acquisition modality, viewing aspect, and gross anatomical feature may be quite satisfied with a data retrieval system that can make these large-scale distinctions based on the indexing of global image characteristics. A typical biomedical image archive, however, is unlikely to be limited to only one type of images as with the NHANES II spine x-rays or the NCI uterine cervix image collection. To be useful as a biomedical informatics tool, CBIR techniques must also be able to retrieve images relevant to queries on specific local image characteristics, such as acetowhite lesions in uterine cervix images or for small masses in breast or lung tissue. Developing generalized CBIR techniques and systems with this two-level view has been our long-term goal.
In our CBIR work, we have taken steps in a systematic manner to address these challenges and are making good progress toward the development of a practical system. Because we recognize the potential for CBIR as a biomedical informatics tool for use across image domains, we seek to implement generalized capabilities, where practical, for possible use on other medical image
types and modalities. Our two-tier view of a practical CBIR system is shown in Figure 5.5 in which we posit the image repository to be similar to a PACS containing a heterogeneous collection of images which vary by modality, view, or anatomy. This information along with globally computed image features can be used to identify image groups relevant to a user query. At the next tier CBIR techniques pertinent to a consistent collection selected from the heterogeneous global repository are applied. Here, local aspects of the visual query such as shape or regional color or texture, if any, are then applied to query particular features on this image subset to identify relevant images that exhibit these features. This architecture also allows support for user feedback using local features or global features. In addition, we include use of textual metadata for enriching the queries. CBIR: Prior work In our approach to addressing the challenges of developing a CBIR system, we have adopted a strategy in opposite sequence to that indicated in Figure 5.5, i.e., investigate local CBIR first. This is because pre-existing uniform image collections, such as the NHANES II digitized spine x-ray images, and challenges posed by need for local CBIR for their analysis presented the opportunity to develop techniques in shape based retrieval for these images. Prior work in this area, detailed in the report to the Board of Scientific Counselors in 2002 [42], included steps in segmentation, metadata collection, feature extraction, shape similarity, and vertebra pathology classification. Our segmentation work then focused on development of Active Contour Segmentation [10, 43], Generalized Hough Transform [44] and Active Shape Modeling [9, 13,
HeterogeneousImage
Collection
Classify by:Modality,
View,Anatomy
Global / High LevelSimilarity
Spine
UterineCervix
...
Local ImageFeature Match
Response toText QueryComponent
Local / Low LevelSimilarity
User
Local Feedback Loop
Global FeedbackLoop
Figure 5.5: Two-tier CBIR view.

22
45]. For feature extraction and shape similarity, we explored 2D geometrical features, Fourier Descriptors, and Polygon Approximation [46, 47]. In vertebra pathology classification, we developed methods for automatic classification/detection of anterior osteophytes, disc space narrowing, and subluxation in the cervical spine and spondylolisthesis in the lumbar spine [48, 49]. Results from these efforts are highlighted in Appendix B.
5.2.1 Global feature CBIR To complement encouraging results achieved in local CBIR through shape-based retrieval of spine x-ray images, we conducted experiments in global CBIR to evaluate the state of the art and identify research directions. In the process, we developed a novel global image classification algorithm which achieved significant results in comparison to other published techniques tested on a common database (Section 5.2.1.1). Following this success, we have initiated collaboration with one other group which has also obtained significant results in global CBIR and maintains a Web interface. This effort is aimed at evaluation of the two-tier CBIR design described above through a Web-based system (Section 5.2.1.2).
5.2.1.1 Classification of images using SECC In our investigation of global CBIR techniques, we have conducted pilot experiments on a heterogeneous collection of 10,000 x-ray images obtained from the ImageCLEF [50] collection. ImageCLEF is an extension to the European initiative on cross-language studies that focuses on the retrieval of medical images along with medical text. Our experiments framed image retrieval as an image annotation and classification problem, i.e., classifying a given image into one of several pre-defined labels. Annotation typically generates a large number of possible labels, e.g., the ImageCLEF dataset has 57 different labels. Error-Correcting Output Codes (ECOC) [51, 52] was identified as a useful model to solve the classification problem with a large number of possible labels by first solving a set of 2-class classification problems and then combining the classification results from these 2-class classifiers. Our approach, which introduced Semantic Error-Correcting output Codes (SECC), and described in [53], extended the conventional ECOC to a semantic ECOC. The criterion for ECOC coding is that the differences between the codes of different overall labels should be large, usually measured using the Hamming distance function. Typically, the individual classifiers are randomly selected and a greater number of these yields higher accuracy in overall classification. ECOC classification is solved by finding the code whose distance to the query code is the minimum. A typical overall label for ImageCLEF 2005 annotation data set, however, is elbow image, sagittal view, plain radiography, and musculoskeletal. We denote each individual part of an overall label as a category and the possible values for this category among all the overall labels as category labels. For example, a category ARM can have as possible labels: forearm, elbow, and non-arm, similarly, FOOT can have as possible labels: foot and non-foot, and VIEW can have as possible labels: axial, sagittal, and coronal. Some independent categories do not depend on others, e.g., the VIEW category is in general independent of other categories. In contrast, categories that are statistically correlated with other categories are called correlated categories, e.g., the ARM and FOOT categories are correlated such that if the ARM category assumes a label forearm or elbow, the FOOT category must then be non-foot. In general, a “non—” category label indicates that the imaged anatomy does not belong to that category.
23
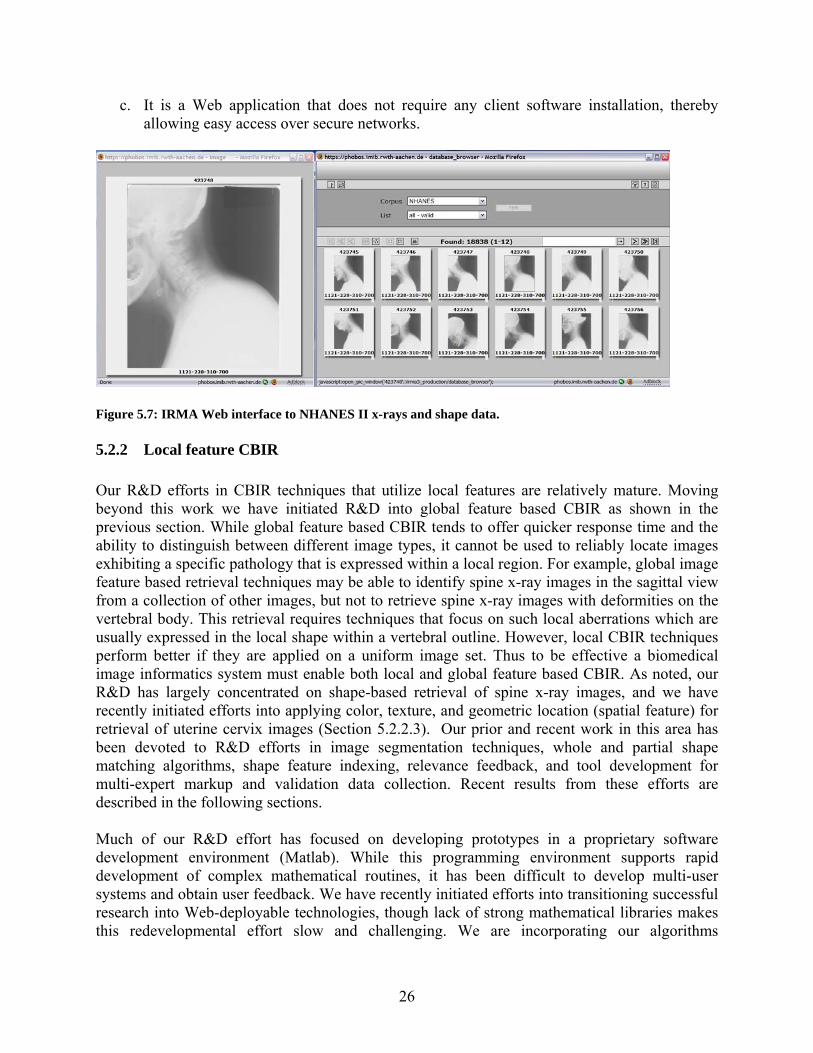
For image classification it is necessary to compute both the overall label of a query image and its probability, and the corresponding category labels and their probabilities. Since the individual classifiers in the ECOC coding are selected randomly, they seldom contain the latter information. Hence, it is unlikely that a single classifier can successfully solve the classification problem related to one of the categories. In our application, we assign a value of 0 to a “non” label while other labels are assigned non-
zero values. If, for one sample, there is only one correlated category such that its category label is not a “non—” label, the category is called the delegate category of the sample and one individual classifier is trained for it. The classifier is of the k-class type, where k > 2. Also, different individual classifiers may use different classification models and different feature sets. Since ECOC similarity functions (e.g., the Hamming distance function) are not suitable for SECC, a probabilistic similarity function for SECC was developed, details of which can be found in [53]. As a result of this work, the image classification yielded an 82.3% overall success rate with a 93% success rate for correct retrieval of images. Figure 5.6 shows retrieval results on the far right for a spine x-ray image on the left (the query image). The vertical column adjacent to it is a set of potentially semantically-relevant images. It is necessary to define semantic similarities among different imaged objects before using our method. The challenge here is in addressing the subjective nature of human interpretation of images. For example, our approach is flexible in allowing similarity to be defined between different views of the same object, or between different parts of the same object, or between different objects. Recall that in our case, two overall labels are considered similar if their delegate categories are the same. For a query image, we first apply the SECC annotation method to determine the individual labels and their probabilities. The overall label is then determined and is used to retrieve other images with that label. CBIR techniques to date have concentrated on retrieval of images solely by image feature content. A key difference in our semantic retrieval method is that query images are not limited to being visually similar to the retrieved ones. It is acceptable for a retrieved image to be similar to the query at a high semantic level. For example, in our retrieval system, a query with a hand image resulting in an upper arm image is considered acceptable. We envision our approach to complement CBIR techniques that use image features only. Data. The ImageCLEF 2005 data set consists entirely of x-rays. There are 9000 training images and 1000 test images. These images can be categorized into 57 classes. Each class has 9 to 2563
Figure 5.6: Global image classification result using SECC.

24
training images. We define 11 categories for the data set: CRANIUM(C), SPINE(C), ARM(C), LEG(C), VIEW(I), ADIOGRAPHY(I), FUNCTION(I), CHEST(C), ABDOMEN(C), PELVIS(C), and BREAST(C), where C or I represents a correlated category or an independent category. Each category has between 2 and 6 labels. Evaluation approach. Each image is first normalized to 16x16 pixel size. We evaluated three features: intensity, Haar wavelet, and Gabor wavelet, and determined intensity as adequate for combining the computational efficiency and retrieval effectiveness of each on a sample of the image data. The training procedure is performed on 9000 training images. The annotation is tested on 1000 test images. A test image is deemed to be successfully annotated if the annotated overall label is the same as the ground truth overall label.
Table 2: ECOC vs. SECC Coding Method (#Classifiers) Error Rate %
SECC (11) 18.7 ECOC (10) 32.6 ECOC (50) 25.7
ECOC (100) 19.5 ECOC (200) 15.1
Results. Table 2 documents the comparisons between SECC and ECOC with varying number of classifiers. A higher number of classifiers requires greater computational resources and is not preferred. It is clear from Table 2 that for comparable error rates, SECC requires far fewer classifiers than ECOC. We also compare the accuracy of our SECC method with 12 other annotation methods that use the same training and test data and were reported in ImageCLEF 2005. The error rates ranged from the lowest of 12.6% to the highest error rate of 55.7% with a median error rate of 21.4%. Our method with 18.7% ranks fourth among these.
Table 3. Comparison between different retrieval methods Method (# Classifiers) Experiment 1 (% Precision) Experiment 2 (% Precision)
SECC (11) 94.1 93.8 ECOC (10) 77.3 45.3 ECOC (50) 83.5 47.1 ECOC (100) 87.8 49.9 ECOC (200) 91.6 53.6
MedGIFT 65.6 27.3 Retrieval evaluation. We conducted two experiments in which images in the test database were used as query images. Their results are reported in Table 3. We evaluated image retrieval on three techniques, the SECC, the ECOC with varying number of classifiers, and MedGIFT [54]. MedGIFT is an image retrieval tool developed for medical images and is sourced from the GNU Image Finding Tool (GIFT). MedGIFT image retrieval relies solely on extracted image features, does not use any classification techniques, and yields a precision of only 65.6% and 27.3%, respectively. In this experiment it serves as a baseline against which other techniques may be compared, showing the performance gain that can be expected by combining SECC with image feature content-based retrieval systems.

25
In Experiment 1, the retrieved image is required to have the same overall label as the query image label. It is clear that the precision of the SECC retrieval (with only 11 classifiers) is higher than that of the ECOC (200) retrieval. It is interesting to note that although ECOC with 200 classifiers marginally outperforms SECC with 11 classifiers in automatic annotation (Table 2), its classification results are poorer (Table 3). This is because SECC uses the delegate category labels that are at a finer granularity than the category labels available to ECOC. In Experiment 2, the retrieved images are similar only at a high level with the query image. All the methods except our SECC method show a significant precision decrease with respect to Experiment 1.
5.2.1.2 Enabling interaction with other global CBIR Systems In addition to conducting our own R&D into global CBIR, it is important that our methods be enabled for interaction with global CBIR research being conducted elsewhere. One such research center is at the Aachen University of Technology in Aachen, Germany. Their project, Image Retrieval for Medical Applications (IRMA) [55], aims to develop and implement high-level methods for CBIR, including a prototype application for medical diagnostic tasks using a radiological image archive. Their long-term goals include performing semantic and formalized queries on the medical image database which includes intra- and inter-individual variance in disease assessment. Example tasks are the staging of a patient's therapy or the retrieval of images with similar diagnostic findings from large electronic archives. Formal content-based queries also take into account the technical conditions of the examination and the image acquisition modalities. The IRMA system is designed to classify and register radiological images in a general way without restriction to particular diagnostic problems or questions, and therefore may be considered to be a global CBIR system. Methods of pattern recognition and structural analysis are used to describe the image content in a feature-based, formal and generalized way. The formalized and normalized description of the images is then used as a means to compare images in the archive, achieving fast and reliable retrieval. Automatic classification and indexing in IRMA allows conventional radiographs to be inserted into the system without human interaction, and therefore without the labor burden of large-scale manual text entry. As a result of our collaboration, the IRMA database now also hosts our spine x-ray images and extracted vertebra shape features. The initial database view of these images is now available on the IRMA Web site [56] and is shown in Figure 5.7. We have proposed a project in which a user would be able to select spine x-ray images in the IRMA system by specifying text parameters or, alternatively, by supplying an example image. At this stage the interface will allow the user to pick a particular vertebral shape for similarity search. The IRMA system will then transmit this shape query to a CEB server hosting local shape matching algorithms. Images ranked in order of similarity to the input image will be returned to the user via IRMA host servers. Although the current implementation is limited to grayscale medical images, it is readily extensible to color images. This effort is unique in the following ways:
a. It supports our development of the two-tier system to a significant extent, with planned support for global as well as local relevance feedback.
b. It supports a distributed image knowledge management technique.
26
c. It is a Web application that does not require any client software installation, thereby allowing easy access over secure networks.
Figure 5.7: IRMA Web interface to NHANES II x-rays and shape data.
5.2.2 Local feature CBIR Our R&D efforts in CBIR techniques that utilize local features are relatively mature. Moving beyond this work we have initiated R&D into global feature based CBIR as shown in the previous section. While global feature based CBIR tends to offer quicker response time and the ability to distinguish between different image types, it cannot be used to reliably locate images exhibiting a specific pathology that is expressed within a local region. For example, global image feature based retrieval techniques may be able to identify spine x-ray images in the sagittal view from a collection of other images, but not to retrieve spine x-ray images with deformities on the vertebral body. This retrieval requires techniques that focus on such local aberrations which are usually expressed in the local shape within a vertebral outline. However, local CBIR techniques perform better if they are applied on a uniform image set. Thus to be effective a biomedical image informatics system must enable both local and global feature based CBIR. As noted, our R&D has largely concentrated on shape-based retrieval of spine x-ray images, and we have recently initiated efforts into applying color, texture, and geometric location (spatial feature) for retrieval of uterine cervix images (Section 5.2.2.3). Our prior and recent work in this area has been devoted to R&D efforts in image segmentation techniques, whole and partial shape matching algorithms, shape feature indexing, relevance feedback, and tool development for multi-expert markup and validation data collection. Recent results from these efforts are described in the following sections. Much of our R&D effort has focused on developing prototypes in a proprietary software development environment (Matlab). While this programming environment supports rapid development of complex mathematical routines, it has been difficult to develop multi-user systems and obtain user feedback. We have recently initiated efforts into transitioning successful research into Web-deployable technologies, though lack of strong mathematical libraries makes this redevelopmental effort slow and challenging. We are incorporating our algorithms

27
developed in Matlab into a client-server framework that uses standard Web technologies such as PHP, Java Applets, Java applications, and Java servlets. Spine Pathology and Image Retrieval System (SPIRS). Screenshots of a Web-based interface of the Spine Pathology and Image Retrieval System (SPIRS) implemented in the client-server framework are shown in Figure 5.8 (query screen) and Figure 5.9 (results screen). In this system we have implemented whole and partial shape retrieval from coordinate and metric tree indexed vertebral shapes using embedded shape space techniques [10, 57-59]. The SPIRS system will be extended to include other shape similarity techniques [20, 60-63] techniques developed earlier.
5.2.2.1 Image segmentation Image segmentation is a critical step in the extraction, analysis, and visualization of knowledge from images. It is also an extremely challenging task highly dependent on imaging modality, spatial and color
resolution, quality, and nature of the imaged anatomy. Reliable automated operation can be defined as the goal for a successful image segmentation technique. The results from segmentation are image features that can then be represented in various forms such as those useful for CBIR. Practical CBIR systems for biomedical images require subsystems to index these images by image content. Depending on the image type, image indexing would rely on color, texture, shape, or some combination of these. For the spine x-ray images, vertebral shape is an image characteristic of high significance, while for uterine cervix images the cervix region boundary and within it color or texture of AW lesions would be important. Thus the nature and number of segmentations can vary according to image type and its expected use. In the rest of this section (5.2.2.1) we discuss our recent work in two segmentation techniques for x-ray images (Orthogonal Active Contour Segmentation and LiveWire), summarize the performance of other techniques investigated (Active Shape Model and our enhancements to it),
Figure 5.8: Vertebra shape query selection in SPIRS.
Figure 5.9: Partial shape query retrieval results in SPIRS.

28
describe our current development of a Generalized Shape Segmentation Toolbox and a Web-based Segmentation Service, and discuss our initial steps in segmenting uterine cervix images.
(a) (b) (c)
Figure 5.10: (a) Active Contour Segmentation with intersecting grid lines, (b) nonintersecting orthogonal curves define the search grid used in Active Contour Segmentation; (c) resulting segmentation
Orthogonal Active Contour Segmentation (ACS). Our initial ACS algorithm was implemented as a constrained form of the classical snake model. The segmentation is performed one vertebra at a time and a priori information about the anatomy and expected neighboring edge interference is used to apply a search constraint on the contour. The algorithm constrains solution contours to lie on a grid between an ‘inner contour’, inside the template, and an ‘outer contour’, outside the template. The algorithm minimizes an objective function by seeking a contour with maximized gradients along normals to the contour, and minimized contour length (‘maximum edge strength and maximum smoothness’). The objective function has heuristically-determined weights for these two factors. The initial contour is a template created by averaging manually-segmented vertebral shapes. This earlier implementation used a grid created by simple normal line segments; however, in cases where the vertebra has a narrow protrusion, these normal line segments can be self-intersecting, shown in Figure 5.10 (a), resulting in bad segmentations in many cases. A novel feature in our orthogonal active contour segmentation is that the grid lines are nonintersecting ‘orthogonal curves’, shown in Figure 5.10 (b), calculated by numerically solving a boundary-value partial differential equation. This approach is described in [20, 64]. A resulting segmentation from this approach is shown in Figure 5.10 (c). LiveWire Segmentation. Another approach to segmentation that integrates user interaction with an algorithm for object segmentation is LiveWire or Intelligent Scissors [65]. It is an interactive segmentation method. LiveWire allows the following: 1) the user controls the appearance of the final boundary through piecewise specification; and 2) the approach is less sensitive to noise. The user selects boundary points, and the algorithm completes the segmentation between the selected points. LiveWire provides advantages over other segmentation techniques such as speed, accuracy, and reproducibility but requires greater user interaction. For image sequence applications (e.g., a CT study with multiple images), the algorithms integrated with LiveWire can also be trained rapidly using reference image data.

29
(a) (b) Figure 5.11: LiveWire segmentation prototype tool (a) initialization screen (b) results screen.
In our R&D, two LiveWire implementations were investigated, including: 1) complete initial boundary selection LiveWire algorithm, presented earlier [42] and 2) an updated point-wise boundary selection LiveWire algorithm. Screen shots from our prototype segmentation tool are shown in Figure 5.11. Earlier, the LiveWire algorithm from [65] was extended for application to the spine x-ray segmentation. Specifically, the LiveWire algorithm utilized a discrete cosine transform (DCT) based watershed approach. The complete initial boundary selection LiveWire algorithm provides the user the capability to select points along the boundary to be connected in generating a closed vertebra boundary. After inputting the initial boundary points, the user must wait for the boundary to be generated, which may take several minutes. The delay can be primarily attributed to the watershed and dynamic programming algorithms and tends to detract the user from interaction in the segmentation process. The second algorithm enhances the original LiveWire algorithm to one using point-wise boundary selection. This also provides the user the capability to select points along the boundary to be connected in generating a closed vertebra boundary. But this algorithm performs image preprocessing operations and applies a path determination algorithm to speed up the user/program interaction. Summary of image segmentation approaches to date. A goal of our segmentation work has been to develop a suite of segmentation tools representing leading segmentation techniques for research and comparative evaluation. Previous NLM work has included the development of several segmentation approaches for the spine x-rays. These include Active Contours, Active Shape Models (ASM), the Generalized Hough Transform (GHT), Active Appearance Models (AAM), LiveWire segmentation and, currently in progress, segmentation by Level Sets (LS). Technical descriptions of these methods appear in the literature in references [[12-14, 20, 43-46,]. Each method investigated represents a significant advance beyond heuristic, edge detection methods (which have yielded very little promise of success in segmenting irregular, noisy images) into the domain of model-based approaches, including deformable template methods, with some of these incorporating statistical models. Upon achieving significant maturity in the development of an algorithm we conduct a performance evaluation to study its value in a practical setting. A formal evaluation of

30
orthogonal active contours and LiveWire algorithms is forthcoming. However, they have been found sufficiently useful and efficient in an informal evaluation with collaborating radiologists. They are now being put to use to obtain segmentations on a large number of our spine x-ray images. These segmentations will be validated by experts using our pathology validation tool (PathVa) described in Section 5.2.3.1.1. A more formal evaluation was conducted for the template “family” of algorithms and results are presented in Table 4. In each case the results were evaluated against reference or “truth” segmentations created by engineers. Row 1 shows the performance of the Generalized Hough Transform (GHT) when used alone. Successful results for this case were judged by subjective, visual criteria, by making a judgment about whether the converged solution lies near enough to the target vertebrae to be segmented, so that the output would be useful in initializing a subsequent algorithm, such as ASM or AAM, to finalize the segmentation. Row 2 shows results for the Zamora hierarchical segmentation algorithm, which combines the GHT with ASM and a deformable model (DM) algorithm customized for deforming around the corners of vertebrae to capture the shape of bone spurs (osteophytes). The “success criteria” are given in terms of the average pixel error from the “truth” segmentation. The success rates are shown after application of the GHT only, after application of the GHT with ASM, and after the GHT with ASM and DM, so that the improvement added by each step may be understood. Row 3 shows results for the Howe hierarchical segmentation, which combines the GHT with AAM step applied to the entire set of vertebrae in the spine being segmented, plus AAM again applied to each individual vertebra, to complete each vertebral segmentation without effects from neighboring vertebrae. The testing followed the “leave one out” methodology, where the algorithm was trained on 99 images, then tested on an image outside of the training set. This process was repeated for each of the 100 c-spine and l-spine images in turn. This “leave one out” approach models the expected behavior of our algorithm on new image data. The success criteria were tightened for this test, as shown.

31
Table 4: Performance evaluation results for template “family” of algorithms Interactivity Method Concept Initial After GHT
Test Method Success Criteria
Success rates:
1 GHT Ballard formulation of Generalized Hough Transform, adapted for vertebrae
None Choose among 3 best solutions.
473 c-spine images; 472 l-spine images; GHT run without user input; at convergence, best of 3 solutions was chosen; solutions were judged “acceptable” by visual inspection, if they appeared to give good initializations for ASM
Subjective: is GHT result accurate enough to successfully initialize ASM?
c-spine: 85% l-spine: 85%
2 Zamora Zamora hierarchical segmentation: a combination of the GHT (for initialization), ASM, and a final “deformable model” (DM) step to adjust the vertebrae corner for osteophyte shape capture
None Choose among 5 best solutions
100 c-spine images; 100 l-spine images;
c-spine: 20 pixels l-spine: 50 pixels
c-spine: GHT: 65% GHT+ASM: 75% GHT+ASM+DM: 75% l-spine: GHT: 40% GHT+ASM: 47% GHT+ASM+DM: 49%
3 Howe Howe hierarchical segmentation: a combination of the GHT, AAM applied to the entire spine (AAM1), and, finally, AAM applied to each individual vertebrae (AAM2)
None Choose among 3 best solutions
100 c-spine images; 100 l-spine images; Testing was “leave one out”. AAM model was built using 99 images, tested against 1 image. This process was repeated for each of the 100 c-spine (l-spine) images.
c-spine: 10 pixels l-spine: 25 pixels
c-spine: GHT: 10% GHT+AAM1: 60% GHT+AAM1+AAM2: 65% l-spine: GHT:21% GHT+AAM1: 67% GHT+AAM1+AAM2: 8%
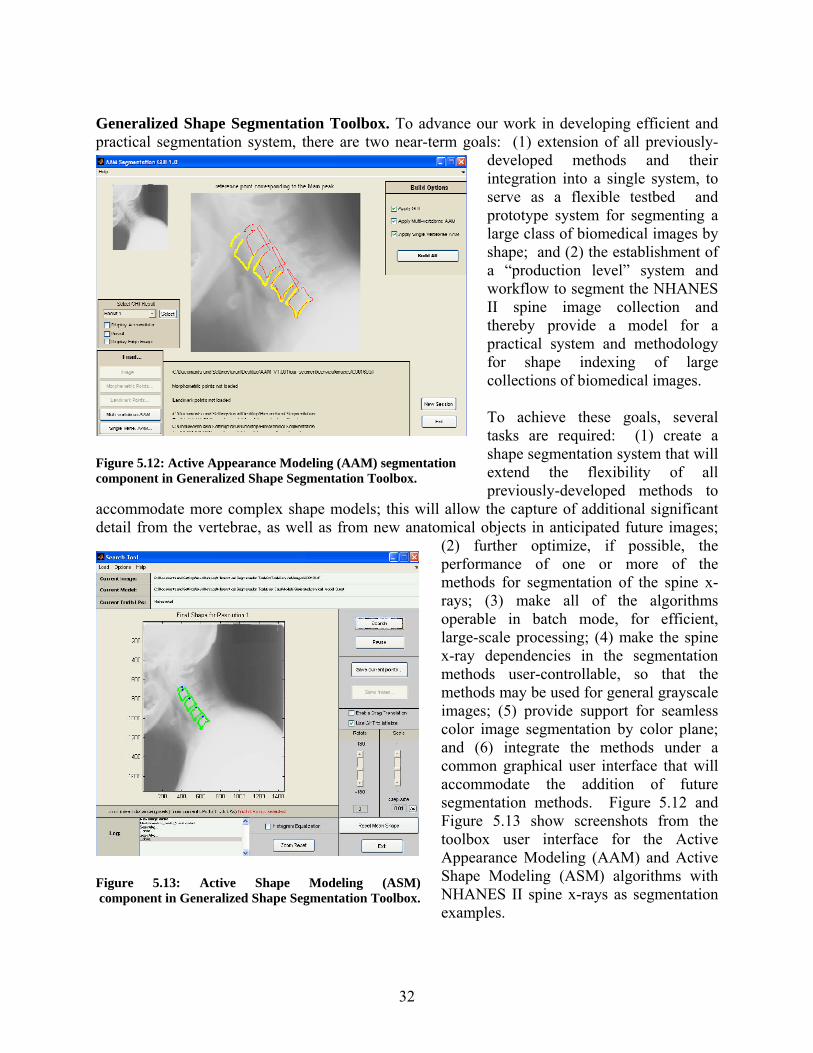
32
Generalized Shape Segmentation Toolbox. To advance our work in developing efficient and practical segmentation system, there are two near-term goals: (1) extension of all previously-
developed methods and their integration into a single system, to serve as a flexible testbed and prototype system for segmenting a large class of biomedical images by shape; and (2) the establishment of a “production level” system and workflow to segment the NHANES II spine image collection and thereby provide a model for a practical system and methodology for shape indexing of large collections of biomedical images. To achieve these goals, several tasks are required: (1) create a shape segmentation system that will extend the flexibility of all previously-developed methods to
accommodate more complex shape models; this will allow the capture of additional significant detail from the vertebrae, as well as from new anatomical objects in anticipated future images;
(2) further optimize, if possible, the performance of one or more of the methods for segmentation of the spine x-rays; (3) make all of the algorithms operable in batch mode, for efficient, large-scale processing; (4) make the spine x-ray dependencies in the segmentation methods user-controllable, so that the methods may be used for general grayscale images; (5) provide support for seamless color image segmentation by color plane; and (6) integrate the methods under a common graphical user interface that will accommodate the addition of future segmentation methods. Figure 5.12 and Figure 5.13 show screenshots from the toolbox user interface for the Active Appearance Modeling (AAM) and Active Shape Modeling (ASM) algorithms with NHANES II spine x-rays as segmentation examples.
Figure 5.12: Active Appearance Modeling (AAM) segmentation component in Generalized Shape Segmentation Toolbox.
Figure 5.13: Active Shape Modeling (ASM) component in Generalized Shape Segmentation Toolbox.

33
Web-based Segmentation Service. In light of the critical role of image segmentation in CBIR, a goal for us is to distribute the knowledge acquired through our R&D. While we develop a generalized image segmentation tool providing capabilities for segmenting color and grayscale images through orthogonal active contour segmentation, LiveWire, ASM, AAM, and others, we are simultaneously studying methods to make these segmentation approaches currently implemented in Matlab available as a Web service. Such a service, once developed, would provide a two-fold benefit. It would enable remote users, possibly experts, to provide image segmentations and expert markup for image collections hosted at NLM, and in addition enrich the science by allowing users to segment their own images.
As an initial step in this direction, we have developed a client-server service for the point-wise LiveWire algorithm, shown in Figure 5.14. This service operates under the fold of the pathology validation and collection tool (PathVa), which is described later in Section 5.2.3.1.1. In this initial step, its use is limited to spine x-ray images. It communicates with a modified Matlab LiveWire routine operating as a server through a Java servlet. Since it is currently limited to our spine x-ray images, no image data is exchanged between the client and the server. The server loads the appropriate image file from the local image archive. Image coordinates through mouse-clicks are communicated to the server which responds
with the next segment. Through implementation of our own session management routines, we are able to provide “Undo” capability. The client also allows the user to submit a 36-point vertebral boundary segmentation as an adequate candidate for a single-pass version of the LiveWire method. In addition to this Web-based LiveWire service, we are also exploring implementation of orthogonal active contours as a Web service using Java applets. Uterine Cervix Segmentation. Described here is our initial R&D toward effective segmentation algorithms for the uterine cervix cervicography images. Figure 5.15 shows an example of one of these images with several significant visual features indicated. These are the columnar epithelium (CE), which is the glandular tissue near the cervix center, the squamous epithelium (SE), which is smooth-textured and surrounds the CE, an acetowhite lesion (AW), and specular reflections (SR), caused by camera flash. All of these features lie within the cervix region-of-interest (ROI), which must be detected prior to attempting to extract other features.
Figure 5.14: Web-based LiveWire segmentation.

34
Figure 5.16 illustrates some of the processing stages used in the cervix ROI detection. Two features are used in the algorithm to detect this area. These are the a channel in Lab color space [66], which corresponds to colors in the red end of the spectrum, and distance d from the center of the image. This feature pair (a,d) is calculated for each pixel in the image. The image is modeled as a Gaussian Mixture Model (GMM) [67] with two 2D Gaussian distributions, one to model the cervix ROI, and the
other to model the background. Parameters for the models are computed iteratively, using the expectation-maximization method. The model yielding the highest a mean and the lowest d mean (more red, more centrally located) determines the cervix ROI. An additional step is being added [68] which takes the boundary of this cervix ROI as the initialization to an active contour algorithm to further refine the curve.
(a) (b) (c) Figure 5.16: (a) Uterine cervix image; (b) Smoothed “a” color channel in Lab color space; (c) Automatically detected cervix region-of-interest, using “a” color channel and distance from image center as pixel features. Figure 5.17 illustrates a further segmentation step for the uterine cervix images. After the cervix ROI has been determined, all further processing is restricted to that region. The approach for CE segmentation is similar to that used for the cervix ROI. Again, two features are used: the b channel from Lab color space and a scale-sensitive texture feature, referred to as texture-contrast. CE pixels are observed to have a significant content of yellow hue, which motivates the use of the b color channel. Again, a GMM with two Gaussians is used, expectation-maximization is applied to find parameters of the GMM, and the CE region is determined by the Gaussian having the highest b mean and highest texture-contrast mean. This approach is to be extended to identify other features of interest in these images.
Figure 5.15: Significant regions on a uterine cervix cervicographic image.
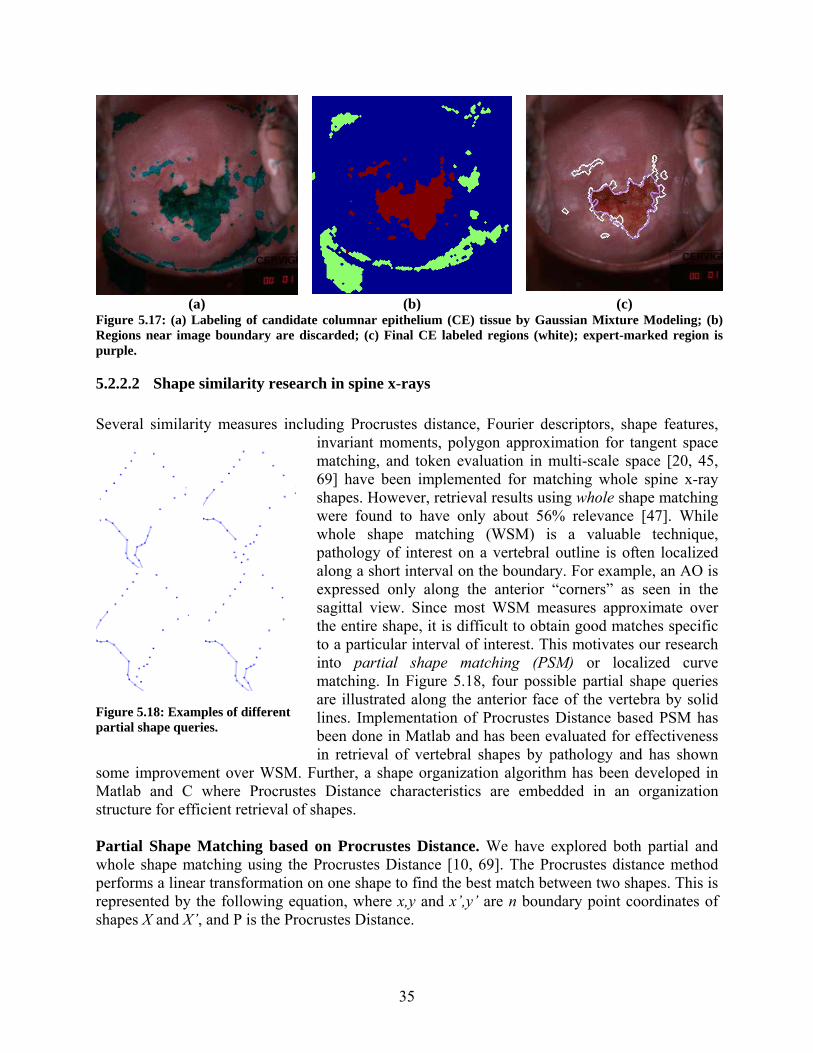
35
(a) (b) (c)
Figure 5.17: (a) Labeling of candidate columnar epithelium (CE) tissue by Gaussian Mixture Modeling; (b) Regions near image boundary are discarded; (c) Final CE labeled regions (white); expert-marked region is purple.
5.2.2.2 Shape similarity research in spine x-rays Several similarity measures including Procrustes distance, Fourier descriptors, shape features,
invariant moments, polygon approximation for tangent space matching, and token evaluation in multi-scale space [20, 45, 69] have been implemented for matching whole spine x-ray shapes. However, retrieval results using whole shape matching were found to have only about 56% relevance [47]. While whole shape matching (WSM) is a valuable technique, pathology of interest on a vertebral outline is often localized along a short interval on the boundary. For example, an AO is expressed only along the anterior “corners” as seen in the sagittal view. Since most WSM measures approximate over the entire shape, it is difficult to obtain good matches specific to a particular interval of interest. This motivates our research into partial shape matching (PSM) or localized curve matching. In Figure 5.18, four possible partial shape queries are illustrated along the anterior face of the vertebra by solid lines. Implementation of Procrustes Distance based PSM has been done in Matlab and has been evaluated for effectiveness in retrieval of vertebral shapes by pathology and has shown
some improvement over WSM. Further, a shape organization algorithm has been developed in Matlab and C where Procrustes Distance characteristics are embedded in an organization structure for efficient retrieval of shapes. Partial Shape Matching based on Procrustes Distance. We have explored both partial and whole shape matching using the Procrustes Distance [10, 69]. The Procrustes distance method performs a linear transformation on one shape to find the best match between two shapes. This is represented by the following equation, where x,y and x’,y’ are n boundary point coordinates of shapes X and X’, and P is the Procrustes Distance.
Figure 5.18: Examples of different partial shape queries.

36
∑=
′⎥⎥⎥
⎦
⎤
⎢⎢⎢
⎣
⎡′′
−⎥⎥⎥
⎦
⎤
⎢⎢⎢
⎣
⎡
⎥⎥⎥
⎦
⎤
⎢⎢⎢
⎣
⎡ −⋅=
n
iX
i
i
X
i
i
Y
X
yx
yx
TSTS
P1
2
11100cos.sinsincos
θθθθ
The matching process translates shape X by TX,TY such that the center of gravity of the two shapes coincide. Next, the shape X is scaled by S and rotated by θ for the minimum sum of
squared distances between the boundary points of the two shapes. The subtraction represents the Euclidean distance measure between two points. In the context of shape space theory, this method finds the closest chord distance between two shapes. We extend this approach to include partial shapes [10]. Sample results screen shot is shown in Figure 5.19. This method was then used to examine use of PSM for retrieval of specific types and severities of
anterior osteophytes on a collection of 206 expert marked images [70].
Dataset. The data set (a total of 888 shapes) for this experiment was generated from a total of 206 spinal x-ray images (106 cervical and 100 lumbar images) selected from the NHANES II collection. Each vertebral shape boundary is composed of 36 points consistently segmented with the first point at the posterior superior “corner” of the vertebra as seen in the sagittal view. Two classification schemes for AOs were chosen to establish the ground truth. One is the Macnab classification [71-73]. Two types of osteophytes are adapted from the Macnab classification: claw and traction. A claw spur rises from the vertebral rim and curves toward the adjacent disk. It is often triangular in shape and curved at the tips. A traction spur protrudes horizontally, is moderately thick, does not curve at the tips, and never extends across the inter-vertebral disk space. The second classification is a severity grading system which was defined by a medical expert consistent with reasonable criteria for assigning severity levels to AO. Three severity levels of AO are defined as slight, moderate, and severe. The criteria listed in Table 5 were developed based on [70]. By combining the two classification schemes above, six categories of pathology can be established. For each shape, both the anterior inferior and superior parts are classified and recorded separately. As with any medical diagnosis, the classification must be regarded as an opinion. While necessary for our evaluation, caution must be taken in considering this set as a gold standard. Ideally, a ground truth set should be developed through some form of consensus from multiple experts and reflect observer variability, and the development of such ground truth is a goal for us. Evaluation Results. We present a summary of results and analysis of algorithm performance through charts and result tables. Four perspectives were obtained on the aggregate results. The results indicate the proportion of retrieved vertebra that matches particular criteria of the query shape. These criteria are:
a) Severity of pathology depicted in the query shape, shown in Figure 5.20 (a); b) Macnab’s classification indicated on the query shape, shown in Figure 5.20 (b); and c) Severity combined with Macnab’s classification indicated on the query shape, shown
in Figure 5.20 (c)
Figure 5.19: Example of retrieval by partial shape
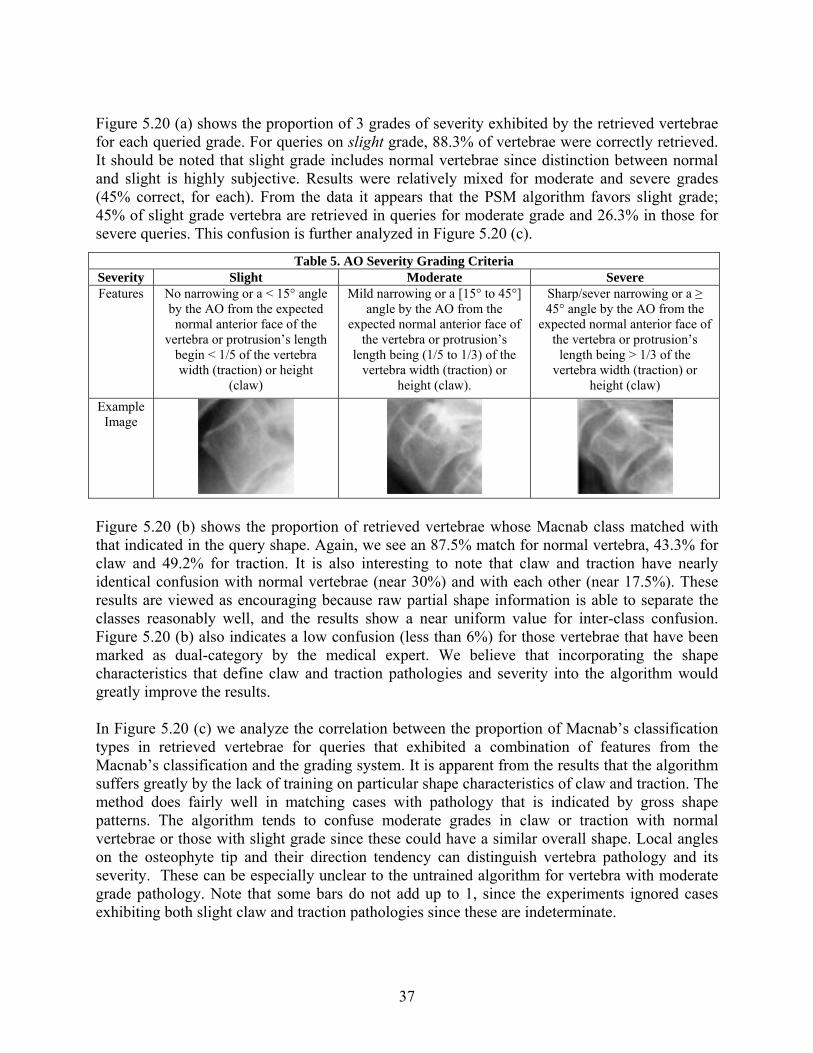
37
Figure 5.20 (a) shows the proportion of 3 grades of severity exhibited by the retrieved vertebrae for each queried grade. For queries on slight grade, 88.3% of vertebrae were correctly retrieved. It should be noted that slight grade includes normal vertebrae since distinction between normal and slight is highly subjective. Results were relatively mixed for moderate and severe grades (45% correct, for each). From the data it appears that the PSM algorithm favors slight grade; 45% of slight grade vertebra are retrieved in queries for moderate grade and 26.3% in those for severe queries. This confusion is further analyzed in Figure 5.20 (c).
Figure 5.20 (b) shows the proportion of retrieved vertebrae whose Macnab class matched with that indicated in the query shape. Again, we see an 87.5% match for normal vertebra, 43.3% for claw and 49.2% for traction. It is also interesting to note that claw and traction have nearly identical confusion with normal vertebrae (near 30%) and with each other (near 17.5%). These results are viewed as encouraging because raw partial shape information is able to separate the classes reasonably well, and the results show a near uniform value for inter-class confusion. Figure 5.20 (b) also indicates a low confusion (less than 6%) for those vertebrae that have been marked as dual-category by the medical expert. We believe that incorporating the shape characteristics that define claw and traction pathologies and severity into the algorithm would greatly improve the results. In Figure 5.20 (c) we analyze the correlation between the proportion of Macnab’s classification types in retrieved vertebrae for queries that exhibited a combination of features from the Macnab’s classification and the grading system. It is apparent from the results that the algorithm suffers greatly by the lack of training on particular shape characteristics of claw and traction. The method does fairly well in matching cases with pathology that is indicated by gross shape patterns. The algorithm tends to confuse moderate grades in claw or traction with normal vertebrae or those with slight grade since these could have a similar overall shape. Local angles on the osteophyte tip and their direction tendency can distinguish vertebra pathology and its severity. These can be especially unclear to the untrained algorithm for vertebra with moderate grade pathology. Note that some bars do not add up to 1, since the experiments ignored cases exhibiting both slight claw and traction pathologies since these are indeterminate.
Table 5. AO Severity Grading Criteria Severity Slight Moderate Severe Features No narrowing or a < 15° angle
by the AO from the expected normal anterior face of the
vertebra or protrusion’s length begin < 1/5 of the vertebra width (traction) or height
(claw)
Mild narrowing or a [15° to 45°] angle by the AO from the
expected normal anterior face of the vertebra or protrusion’s
length being (1/5 to 1/3) of the vertebra width (traction) or
height (claw).
Sharp/sever narrowing or a ≥ 45° angle by the AO from the
expected normal anterior face of the vertebra or protrusion’s
length being > 1/3 of the vertebra width (traction) or
height (claw) Example
Image

38
Indexing shapes for efficient retrieval. In a CBIR system features captured from an object of visual interest are stored as a feature vector. A similar feature vector extracted from the query image needs to be compared with every equivalent vector in the database to identify similar images. For large image archives, such as ours, this could run into hundreds of thousands of comparisons for each query. For example, a single spine x-ray can result in 6 to 8 feature vectors which for a collection of 17,000 images could result in over 120,000 comparisons in a brute force search. This linear search is impractical and underscores the need for an organizational structure for image indexing.
(a) (b)
Figure 5.21: Illustration of (a) coordinate and (b) metric search spaces for a range query and their organization in index tree structures.
In general, there are two common forms of graphical queries: a range query in which the database retrieves all images that have features u satisfying D(q,u) ≤ T, where q is a query feature, D is a feature distance, and T>0 is a user defined threshold. Related to this is the k-nearest neighbor query in which the database retrieves k closest features to q, where proximity is evaluated by D. Both queries can be satisfied by brute force search through the database. The computational cost of this approach, however, grows linearly with the size of the database. To speed up the response, the database needs to be organized by indexing trees [10]. Such indexes have been commonly used for text databases, but are less used in practical image retrieval systems.
Grades of Retrieved Vertebral Shapes
0.883
0.450
0.263
0.108
0.450
0.288
0.0080.100
0.450
0.000
0.100
0.200
0.300
0.400
0.500
0.600
0.700
0.800
0.900
1.000
Slight Moderate Severe
Query Grades
Prop
ortio
n Re
triev
ed
Slight Moderate Severe
Macnab Classes of Retrieved Vertebral Shapes
0.875
0.3500.275
0.000
0.433
0.175
0.1000.183
0.492
0.025 0.033 0.058
0.000
0.100
0.200
0.300
0.400
0.500
0.600
0.700
0.800
0.900
1.000
Normal Claw Traction
Macnab Query Types
Prop
ortio
n Re
triev
ed
Normal Claw Traction Claw-Traction
Macnab Classes of Retrieved Vertebral Shape
0
0.2750.35
00.1
0.1
0.125 0.3250.55
0.50.875
0.60.375 0.075 0.55
0.1250.15
0.275 0.25
0.425 0.425
00.1
0.20.30.40.5
0.60.70.8
0.91
norm al slightclaw
m oderateclaw
severeclaw
slighttraction
m oderatetraction
severetraction
Grade / Macnab Class
Prop
ortio
n R
etrie
ved
claw traction normal
(a) Proportion of 3 grades of severity exhibited by the retrieved vertebrae for each queried grade
(b) Proportion of retrieved vertebrae with their Macnab class correctly matching that indicated in the query shape.
(c) Correlation between the proportion of Macnab’s classification types in retrieved vertebrae for queries that exhibited a combination of features from Macnab’s classification and the grading system.
Figure 5.20: Result charts of PSM Analysis

39
Broadly speaking, there are two classes of indexing trees: one class assumes that the indexed features belong to a vector space, called coordinate trees since they exploit the coordinate structure of vector spaces, and the other assumes that the features belong to a metric space. The latter are less useful since they cannot be used to index and retrieve data with other metrics. Since shape space has a metric, metric trees are most suitable for indexing shapes. But, because coordinate trees are more efficient, it is desirable to embed these shape spaces into coordinate trees. These structures are illustrated in Figure 5.21. Evaluation of indexing performance. The efficiency of the indexing scheme using the kD-tree after shape embedding was compared with a metric tree in the original metric space. 2812 shapes were randomly sampled into sets of size 434, 902, 1654, and 2812. Each set was indexed in the original shape space by a metric tree and after embedding by a kD-tree. Every shape in the database was used as a query shape and k-nearest neighbor vertebral images were retrieved using Euclidean shape distance for k=10 and 20 nearest neighbors. We recorded the average number of node tests per query (NT), which represents the computational burden of indexing, and the average number of surviving leaf nodes (DA), which measures disk access performance. The performance measures are computed as a function of the database size and k for the kD-tree and metric tree and are expressed as absolute numbers and as a fraction of the database size, where:
• FNT = NT/DB_size is NT expressed as a fraction of the database size • FDA = DA/DB_size is DA expressed as a fraction of the database size
The fractions should remain constant for an indexing scheme with linear complexity, and should decrease with the size of the database for sub-linear complexity, the desirable case. Plots of the fractions FNT and FDA for k = 10 are shown in Figure 5.22. It is clear from the figure that our indexing algorithms are sub-linear in complexity.
Figure 5.22: Comparison of indexing performance
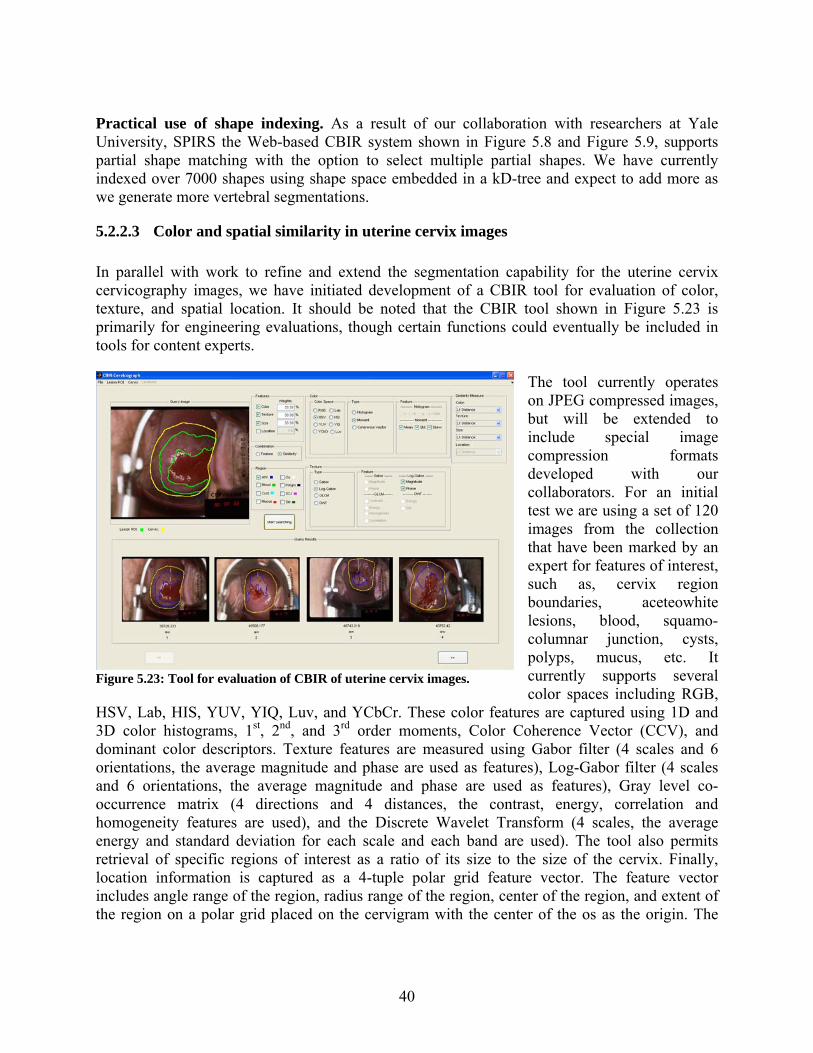
40
Practical use of shape indexing. As a result of our collaboration with researchers at Yale University, SPIRS the Web-based CBIR system shown in Figure 5.8 and Figure 5.9, supports partial shape matching with the option to select multiple partial shapes. We have currently indexed over 7000 shapes using shape space embedded in a kD-tree and expect to add more as we generate more vertebral segmentations.
5.2.2.3 Color and spatial similarity in uterine cervix images In parallel with work to refine and extend the segmentation capability for the uterine cervix cervicography images, we have initiated development of a CBIR tool for evaluation of color, texture, and spatial location. It should be noted that the CBIR tool shown in Figure 5.23 is primarily for engineering evaluations, though certain functions could eventually be included in tools for content experts.
The tool currently operates on JPEG compressed images, but will be extended to include special image compression formats developed with our collaborators. For an initial test we are using a set of 120 images from the collection that have been marked by an expert for features of interest, such as, cervix region boundaries, aceteowhite lesions, blood, squamo-columnar junction, cysts, polyps, mucus, etc. It currently supports several color spaces including RGB,
HSV, Lab, HIS, YUV, YIQ, Luv, and YCbCr. These color features are captured using 1D and 3D color histograms, 1st, 2nd, and 3rd order moments, Color Coherence Vector (CCV), and dominant color descriptors. Texture features are measured using Gabor filter (4 scales and 6 orientations, the average magnitude and phase are used as features), Log-Gabor filter (4 scales and 6 orientations, the average magnitude and phase are used as features), Gray level co-occurrence matrix (4 directions and 4 distances, the contrast, energy, correlation and homogeneity features are used), and the Discrete Wavelet Transform (4 scales, the average energy and standard deviation for each scale and each band are used). The tool also permits retrieval of specific regions of interest as a ratio of its size to the size of the cervix. Finally, location information is captured as a 4-tuple polar grid feature vector. The feature vector includes angle range of the region, radius range of the region, center of the region, and extent of the region on a polar grid placed on the cervigram with the center of the os as the origin. The
Figure 5.23: Tool for evaluation of CBIR of uterine cervix images.

41
orientation of the cervix marked by the expert is used as the reference axis with the angle measured in the clockwise direction. The tool supports query by user sketch in which the user identifies the region of interest using the mouse or could use existing markup as a query. In the future, this will be extended to allow use of segmentation methods described previously, when mature. The tool is unique in supporting feature weighting, normalization, and combination at the feature level or the similarity level, i.e., the combined similarity results from each feature can be obtained through a single composite weighted feature vector, or similarity results from each individual feature are obtained and then combined using the weights. Several similarity distance measure are implemented currently with scope for additional measures. Current measures include L1 distance, Euclidean distance, earth mover distance, histogram intersection, match distance, Jeffery divergence, quadratic-form distance, and bit difference.
After a detailed evaluation of these features and distance measures, a small set will be judiciously selected and developed into a usable CBIR system for our NCI collaborators and other content experts.
5.2.2.4 Relevance feedback As noted, substantial research effort has been devoted to exploiting image features such as color, shape, and texture for CBIR [34]. These techniques attempt to determine perceived or “high level” visual characteristics in the query to identify similar candidate images through computed similarity of these image or “low level” features. Inevitably, this results in a “gap” caused either by erroneous determination of the query semantics or limitations in the CBIR technique. Such a gap is observed in global CBIR using medGIFT when compared with semantic label retrieval, as shown in Table 3. While semantic labeling can address some of this, the gap limits the performance of most CBIR systems using image feature based similarity alone. This issue becomes more evident in medical image retrieval since medical images of the same anatomy but with different pathology often exhibit very subtle differences which can lead to different and subjective opinions even among experts. It is critical, therefore, that a CBIR system applied to medical images be less susceptible to this gap. Traditionally user interactivity has helped in minimizing similar problems with text retrieval and user feedback has often been analyzed and employed to improve retrieval relevance. Such feedback, often referred to as relevance feedback (RF), has also been used in CBIR [74-79]. Very few, however, have applied it to medical images, especially on local CBIR features. Appendix C offers an overview of the RF methods in the literature. To be useful, a CBIR system must capture not only the differentiating visual characteristics between images, but also those on which meaningful queries can be posed. Our R&D efforts in CBIR techniques for spine x-ray images have broadly focused on WSM and PSM techniques. While this work has provided fairly promising results, it has operated on the implicit assumption that a single query shape / image is sufficient to express desired query parameters. Use of RF is a natural expansion of our earlier work. A linear weight-updating RF approach was initially proposed and applied to spine x-ray image retrieval [80] in which like most other RF approaches,
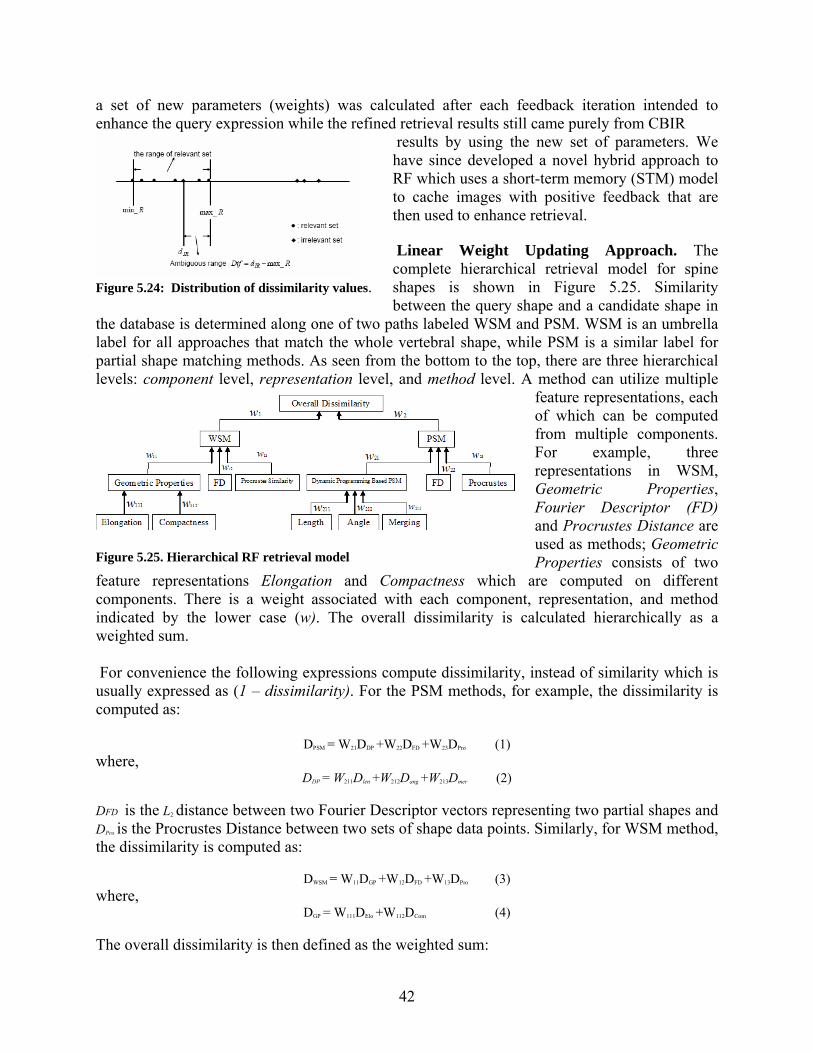
42
a set of new parameters (weights) was calculated after each feedback iteration intended to enhance the query expression while the refined retrieval results still came purely from CBIR
results by using the new set of parameters. We have since developed a novel hybrid approach to RF which uses a short-term memory (STM) model to cache images with positive feedback that are then used to enhance retrieval. Linear Weight Updating Approach. The complete hierarchical retrieval model for spine shapes is shown in Figure 5.25. Similarity between the query shape and a candidate shape in
the database is determined along one of two paths labeled WSM and PSM. WSM is an umbrella label for all approaches that match the whole vertebral shape, while PSM is a similar label for partial shape matching methods. As seen from the bottom to the top, there are three hierarchical levels: component level, representation level, and method level. A method can utilize multiple
feature representations, each of which can be computed from multiple components. For example, three representations in WSM, Geometric Properties, Fourier Descriptor (FD) and Procrustes Distance are used as methods; Geometric Properties consists of two
feature representations Elongation and Compactness which are computed on different components. There is a weight associated with each component, representation, and method indicated by the lower case (w). The overall dissimilarity is calculated hierarchically as a weighted sum. For convenience the following expressions compute dissimilarity, instead of similarity which is usually expressed as (1 – dissimilarity). For the PSM methods, for example, the dissimilarity is computed as:
DPSM = W21DDP +W22DFD +W23DPro (1) where,
DDP = W211Dlen +W212Dang +W213Dmer (2) DFD is the L2 distance between two Fourier Descriptor vectors representing two partial shapes and DPro is the Procrustes Distance between two sets of shape data points. Similarly, for WSM method, the dissimilarity is computed as:
DWSM = W11DGP +W12DFD +W13DPro (3) where,
DGP = W111DElo +W112DCom (4)
The overall dissimilarity is then defined as the weighted sum:
Figure 5.24: Distribution of dissimilarity values.
Figure 5.25. Hierarchical RF retrieval model
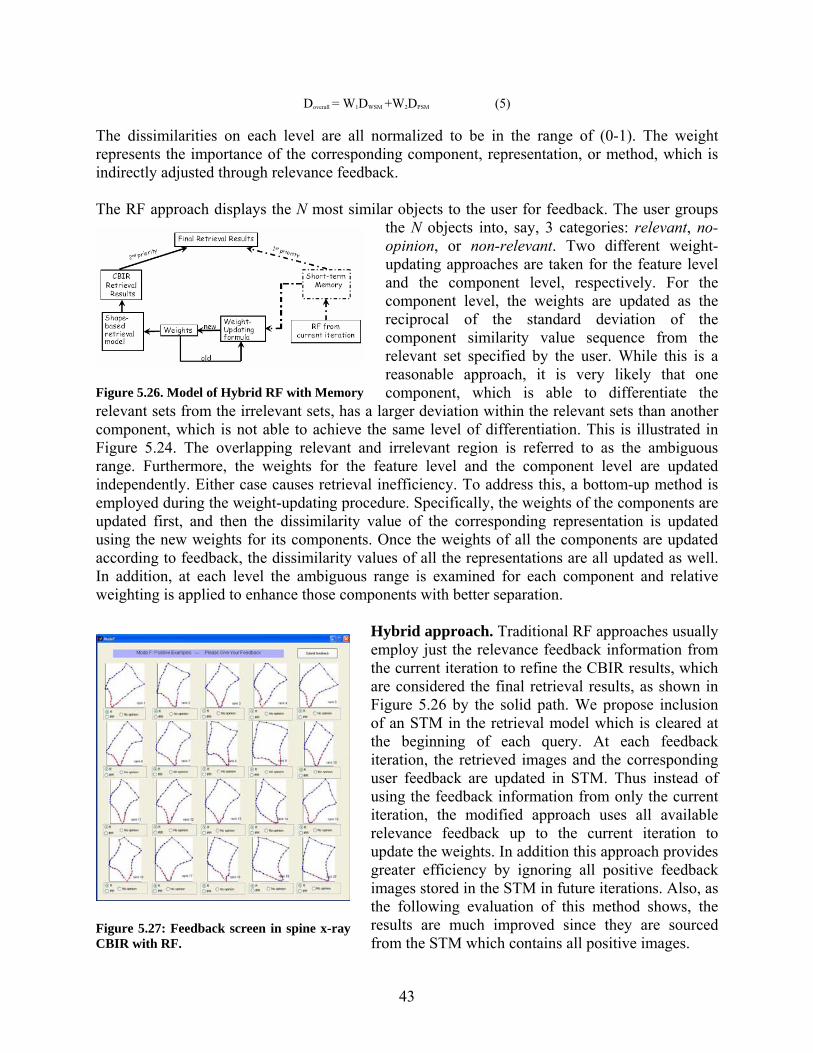
43
Doverall = W1DWSM +W2DPSM (5) The dissimilarities on each level are all normalized to be in the range of (0-1). The weight represents the importance of the corresponding component, representation, or method, which is indirectly adjusted through relevance feedback. The RF approach displays the N most similar objects to the user for feedback. The user groups
the N objects into, say, 3 categories: relevant, no-opinion, or non-relevant. Two different weight-updating approaches are taken for the feature level and the component level, respectively. For the component level, the weights are updated as the reciprocal of the standard deviation of the component similarity value sequence from the relevant set specified by the user. While this is a reasonable approach, it is very likely that one component, which is able to differentiate the
relevant sets from the irrelevant sets, has a larger deviation within the relevant sets than another component, which is not able to achieve the same level of differentiation. This is illustrated in Figure 5.24. The overlapping relevant and irrelevant region is referred to as the ambiguous range. Furthermore, the weights for the feature level and the component level are updated independently. Either case causes retrieval inefficiency. To address this, a bottom-up method is employed during the weight-updating procedure. Specifically, the weights of the components are updated first, and then the dissimilarity value of the corresponding representation is updated using the new weights for its components. Once the weights of all the components are updated according to feedback, the dissimilarity values of all the representations are all updated as well. In addition, at each level the ambiguous range is examined for each component and relative weighting is applied to enhance those components with better separation.
Hybrid approach. Traditional RF approaches usually employ just the relevance feedback information from the current iteration to refine the CBIR results, which are considered the final retrieval results, as shown in Figure 5.26 by the solid path. We propose inclusion of an STM in the retrieval model which is cleared at the beginning of each query. At each feedback iteration, the retrieved images and the corresponding user feedback are updated in STM. Thus instead of using the feedback information from only the current iteration, the modified approach uses all available relevance feedback up to the current iteration to update the weights. In addition this approach provides greater efficiency by ignoring all positive feedback images stored in the STM in future iterations. Also, as the following evaluation of this method shows, the results are much improved since they are sourced from the STM which contains all positive images.
Figure 5.26. Model of Hybrid RF with Memory
Figure 5.27: Feedback screen in spine x-ray CBIR with RF.
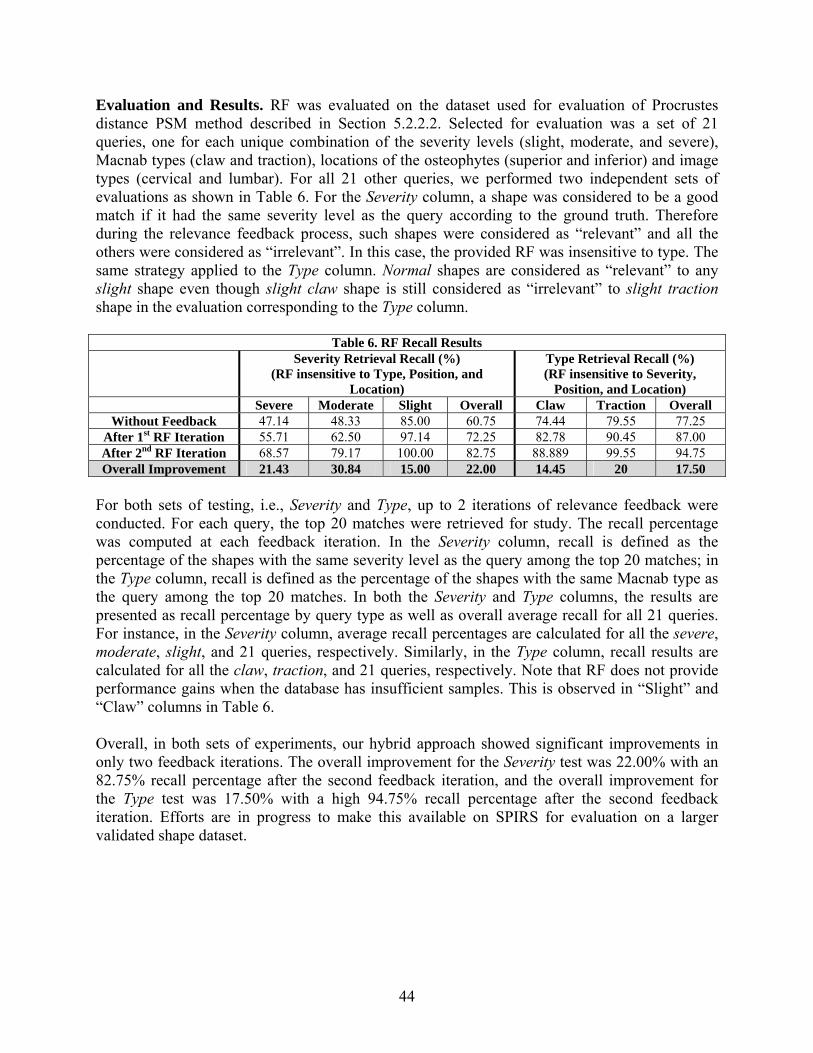
44
Evaluation and Results. RF was evaluated on the dataset used for evaluation of Procrustes distance PSM method described in Section 5.2.2.2. Selected for evaluation was a set of 21 queries, one for each unique combination of the severity levels (slight, moderate, and severe), Macnab types (claw and traction), locations of the osteophytes (superior and inferior) and image types (cervical and lumbar). For all 21 other queries, we performed two independent sets of evaluations as shown in Table 6. For the Severity column, a shape was considered to be a good match if it had the same severity level as the query according to the ground truth. Therefore during the relevance feedback process, such shapes were considered as “relevant” and all the others were considered as “irrelevant”. In this case, the provided RF was insensitive to type. The same strategy applied to the Type column. Normal shapes are considered as “relevant” to any slight shape even though slight claw shape is still considered as “irrelevant” to slight traction shape in the evaluation corresponding to the Type column.
Table 6. RF Recall Results Severity Retrieval Recall (%)
(RF insensitive to Type, Position, and Location)
Type Retrieval Recall (%) (RF insensitive to Severity,
Position, and Location) Severe Moderate Slight Overall Claw Traction Overall
Without Feedback 47.14 48.33 85.00 60.75 74.44 79.55 77.25 After 1st RF Iteration 55.71 62.50 97.14 72.25 82.78 90.45 87.00 After 2nd RF Iteration 68.57 79.17 100.00 82.75 88.889 99.55 94.75 Overall Improvement 21.43 30.84 15.00 22.00 14.45 20 17.50
For both sets of testing, i.e., Severity and Type, up to 2 iterations of relevance feedback were conducted. For each query, the top 20 matches were retrieved for study. The recall percentage was computed at each feedback iteration. In the Severity column, recall is defined as the percentage of the shapes with the same severity level as the query among the top 20 matches; in the Type column, recall is defined as the percentage of the shapes with the same Macnab type as the query among the top 20 matches. In both the Severity and Type columns, the results are presented as recall percentage by query type as well as overall average recall for all 21 queries. For instance, in the Severity column, average recall percentages are calculated for all the severe, moderate, slight, and 21 queries, respectively. Similarly, in the Type column, recall results are calculated for all the claw, traction, and 21 queries, respectively. Note that RF does not provide performance gains when the database has insufficient samples. This is observed in “Slight” and “Claw” columns in Table 6. Overall, in both sets of experiments, our hybrid approach showed significant improvements in only two feedback iterations. The overall improvement for the Severity test was 22.00% with an 82.75% recall percentage after the second feedback iteration, and the overall improvement for the Type test was 17.50% with a high 94.75% recall percentage after the second feedback iteration. Efforts are in progress to make this available on SPIRS for evaluation on a larger validated shape dataset.
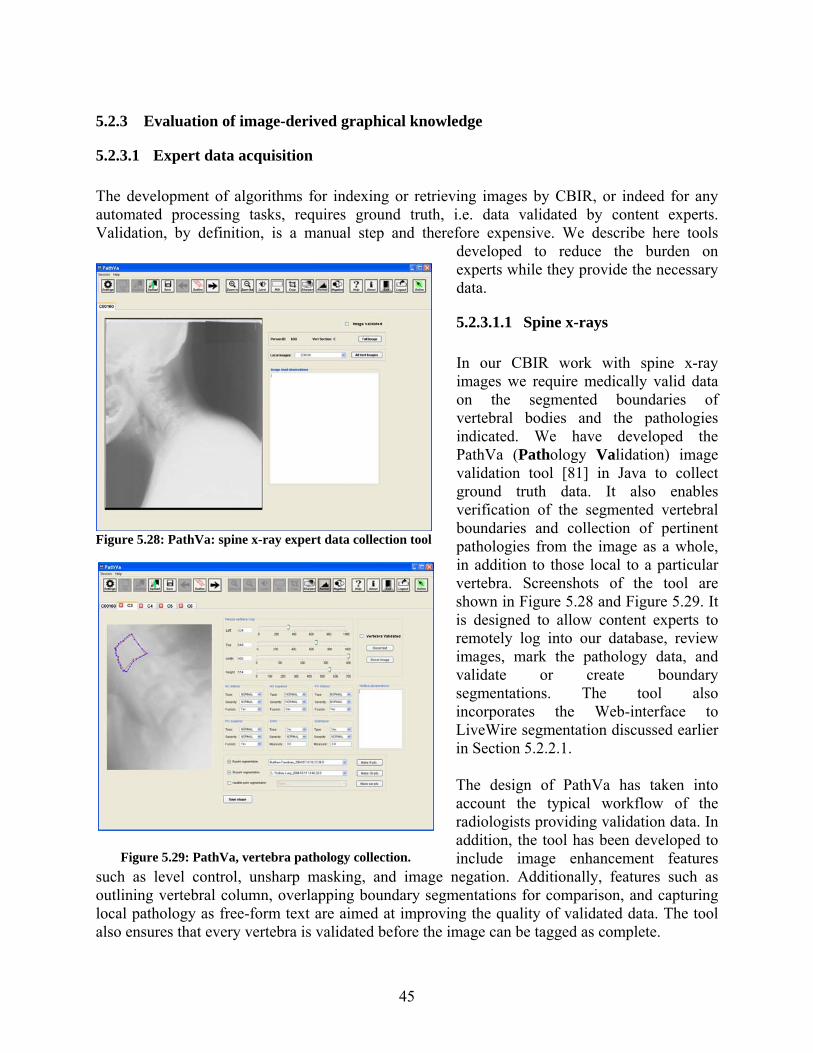
45
5.2.3 Evaluation of image-derived graphical knowledge
5.2.3.1 Expert data acquisition The development of algorithms for indexing or retrieving images by CBIR, or indeed for any automated processing tasks, requires ground truth, i.e. data validated by content experts. Validation, by definition, is a manual step and therefore expensive. We describe here tools
developed to reduce the burden on experts while they provide the necessary data.
5.2.3.1.1 Spine x-rays In our CBIR work with spine x-ray images we require medically valid data on the segmented boundaries of vertebral bodies and the pathologies indicated. We have developed the PathVa (Pathology Validation) image validation tool [81] in Java to collect ground truth data. It also enables verification of the segmented vertebral boundaries and collection of pertinent pathologies from the image as a whole, in addition to those local to a particular vertebra. Screenshots of the tool are shown in Figure 5.28 and Figure 5.29. It is designed to allow content experts to remotely log into our database, review images, mark the pathology data, and validate or create boundary segmentations. The tool also incorporates the Web-interface to LiveWire segmentation discussed earlier in Section 5.2.2.1. The design of PathVa has taken into account the typical workflow of the radiologists providing validation data. In addition, the tool has been developed to include image enhancement features
such as level control, unsharp masking, and image negation. Additionally, features such as outlining vertebral column, overlapping boundary segmentations for comparison, and capturing local pathology as free-form text are aimed at improving the quality of validated data. The tool also ensures that every vertebra is validated before the image can be tagged as complete.
Figure 5.28: PathVa: spine x-ray expert data collection tool
Figure 5.29: PathVa, vertebra pathology collection.

46
Until recently the anterior osteophytes, disc space narrowing, subluxation, and spondylolisthesis were our primary focus for shape-based spine image retrieval. Our use of image enhancement techniques in this tool has helped a group of board certified radiologists to find other pathologies such as spinal stenosis caused by posterior osteophytes. Correlating these pathology labels to segmented image features and the corresponding health survey data can be used to build knowledge models and further enhance our multimedia database. These steps not only enhance the value of CBIR, but could also provide tools to assist research and education in medicine.
5.2.3.1.2 Uterine Cervix images Expert data for the uterine cervix has been acquired through use of the Boundary Marking Tool described in Section 5.1.1. An example of the graphical data acquired is Study 1, where, for 939 images, the cervix region-of-interest and acetowhite lesions were manually drawn on the images and a visual diagnosis was entered for the patient (see Table 1).
5.2.3.2 Algorithm and Human Performance Evaluation Technical evaluations have been carried out for several purposes, including (1) to make a contribution to the challenging problem of assessing human and algorithm performance in image segmentation, in view of the large intra- and inter-observer variability that is known to exist; the difficulty of rationally interpreting and deriving knowledge from segmentations by multiple expert observers, and the related problem of evaluating segmentation algorithms with reference to this derived knowledge, have presented challenges to the image processing community for years and are a recurring topic in published research [82-85]; (2) to contribute to the establishment of “truth sets” of image segmentation that incorporate this variability among experts; (3) to make intelligent choices among competing algorithms for image processing; and (4) to make intelligent choices among parameters to be used for image digitizing and compression.
5.2.3.2.1 STAPLE To evaluate the performance of content experts we use the Simultaneous Truth and Performance Level Estimation (STAPLE) [86] procedure. STAPLE is a method for producing a probabilistic map of segmentation ground truth, based on a set of segmentations created by multiple observers, simultaneously with estimates of the performance of those observers relative to the output truth segmentation. Performance for each observer is characterized as a (sensitivity, specificity) pair, denoted (p,q). Inputs to the algorithm are (1) the set of segmentations from the observers, (2) initial performance estimates for each observer, and (3) a priori characterization of the segmentation. Figure 5.30 provides illustrations of STAPLE output. Figure 5.30 (a) and (b) show multiple observer segmentations of acetowhite tissue, for two different images. For the first image, there were 10 observers (i.e., experts) and, for the second image, 20 observers. Figure 5.30 (c) and (d) show the respective probabilistic “truth segmentations” output by STAPLE for the segmentations in (a) and (b), with the redder colors corresponding to pixels with a higher probability for being in the truth segmentation. We infer that a standard entropy calculation for these probabilistic segmentations is an indicator of the complexity of the
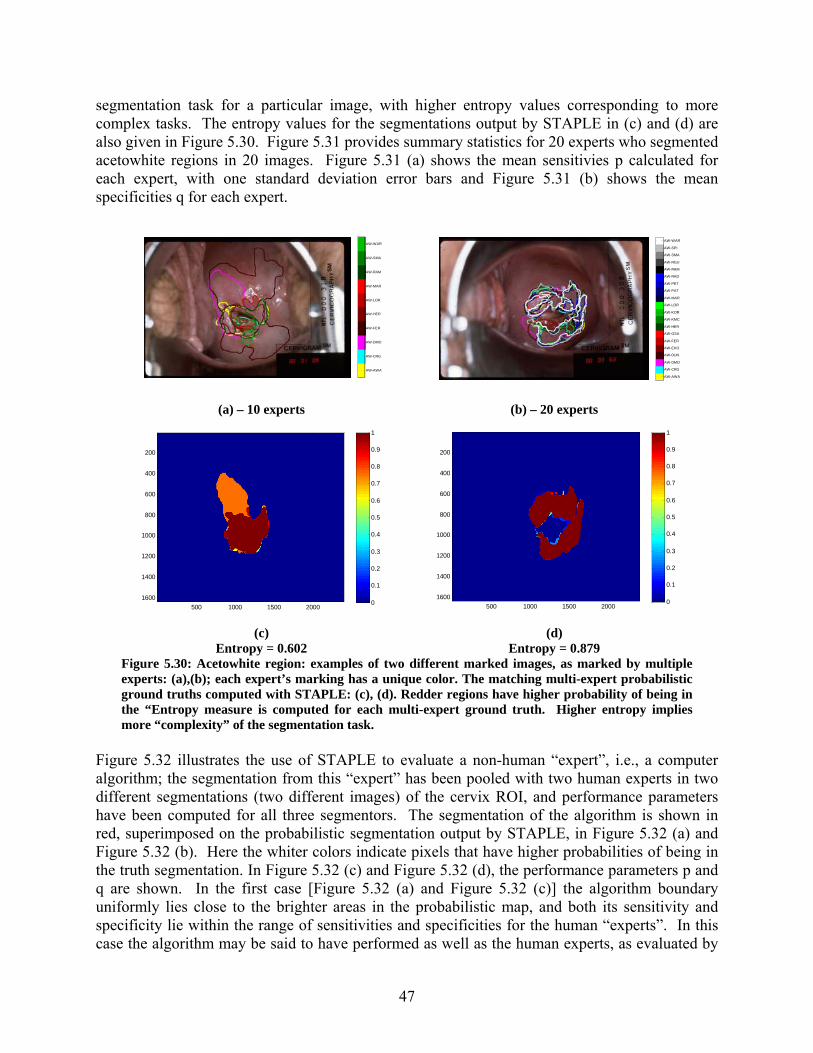
47
segmentation task for a particular image, with higher entropy values corresponding to more complex tasks. The entropy values for the segmentations output by STAPLE in (c) and (d) are also given in Figure 5.30. Figure 5.31 provides summary statistics for 20 experts who segmented acetowhite regions in 20 images. Figure 5.31 (a) shows the mean sensitivies p calculated for each expert, with one standard deviation error bars and Figure 5.31 (b) shows the mean specificities q for each expert.
AW-AWA
AW-CRG
AW-DMO
AW-FER
AW-HER
AW-LOR
AW-MAR
AW-RAM
AW-SMA
AW-WAR
AW-AWA
AW-CRG
AW-DMO
AW-DUN
AW-EKO
AW-FER
AW-GSA
AW-HER
AW-KMC
AW-KOR
AW-LOR
AW-MAR
AW-PAT
AW-PET
AW-RAD
AW-RAM
AW-RGU
AW-SMA
AW-SPI
AW-WAR
(a) – 10 experts (b) – 20 experts
500 1000 1500 2000
200
400
600
800
1000
1200
1400
16000
0.1
0.2
0.3
0.4
0.5
0.6
0.7
0.8
0.9
1
500 1000 1500 2000
200
400
600
800
1000
1200
1400
16000
0.1
0.2
0.3
0.4
0.5
0.6
0.7
0.8
0.9
1
(c) (d) Entropy = 0.602 Entropy = 0.879
Figure 5.30: Acetowhite region: examples of two different marked images, as marked by multiple experts: (a),(b); each expert’s marking has a unique color. The matching multi-expert probabilistic ground truths computed with STAPLE: (c), (d). Redder regions have higher probability of being in the “Entropy measure is computed for each multi-expert ground truth. Higher entropy implies more “complexity” of the segmentation task.
Figure 5.32 illustrates the use of STAPLE to evaluate a non-human “expert”, i.e., a computer algorithm; the segmentation from this “expert” has been pooled with two human experts in two different segmentations (two different images) of the cervix ROI, and performance parameters have been computed for all three segmentors. The segmentation of the algorithm is shown in red, superimposed on the probabilistic segmentation output by STAPLE, in Figure 5.32 (a) and Figure 5.32 (b). Here the whiter colors indicate pixels that have higher probabilities of being in the truth segmentation. In Figure 5.32 (c) and Figure 5.32 (d), the performance parameters p and q are shown. In the first case [Figure 5.32 (a) and Figure 5.32 (c)] the algorithm boundary uniformly lies close to the brighter areas in the probabilistic map, and both its sensitivity and specificity lie within the range of sensitivities and specificities for the human “experts”. In this case the algorithm may be said to have performed as well as the human experts, as evaluated by

48
STAPLE outputs. In the second case [Figure 5.32 (b) and Figure 5.32 (d)], the algorithm boundary deviates considerably from the brighter areas in the probabilistic map in at least one area, and its specificity q lies outside the specificities of the human experts. This illustrates the use of STAPLE to evaluate the performance of automated segmentation algorithms, relative to a pool of human experts.
(a) (b)
Figure 5.31: Performance of 20 experts for marking acetowhite regions, over a 20-image set. Mean sensitivity p for each expert (a). Mean specificity q for each expert (b).
(a) (b)
p q 1st expert 0.998 0.945 2nd expert 0.775 0.999 Automated Algorithm
0.914 0.959
p q 1st expert 0.623 1 2nd expert 1 0.937 AutomatedAlgorithm
0.958 0.91
(c) (d) Figure 5.32: Human expert versus computer marking of the cervix boundary. Levels of gray correspond to the probabilistic “truth” segmentation output by STAPLE: (a), (b); whiter areas have greater probability of being in the truth segmentation. Algorithm boundary marking is shown in red. Performance measures p and q (sensitivity and specificity, respectively), as output by STAPLE for each expert (and the algorithm) are given in (c), (d).
5.2.3.2.2 Comparative algorithm analysis In this section we discuss a comparative performance analysis of cervix ROI extraction and Specular Reflection (SR) removal algorithms [68, 87] for uterine cervix image indexing. Within
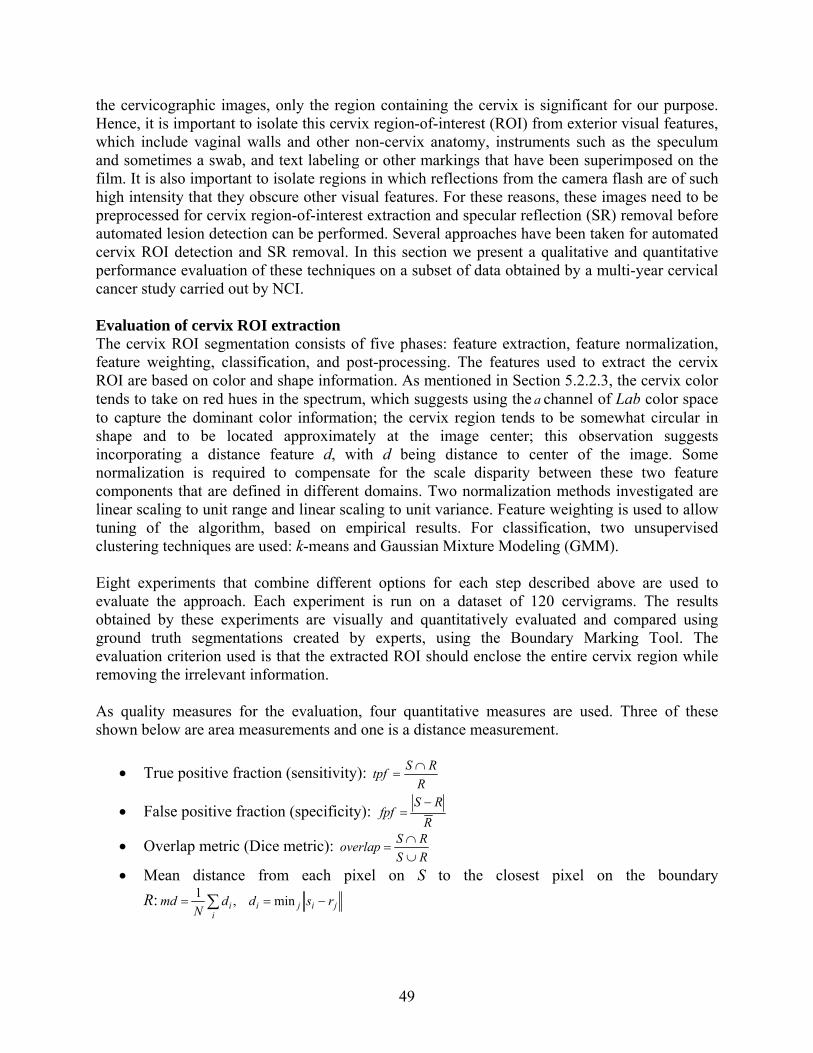
49
the cervicographic images, only the region containing the cervix is significant for our purpose. Hence, it is important to isolate this cervix region-of-interest (ROI) from exterior visual features, which include vaginal walls and other non-cervix anatomy, instruments such as the speculum and sometimes a swab, and text labeling or other markings that have been superimposed on the film. It is also important to isolate regions in which reflections from the camera flash are of such high intensity that they obscure other visual features. For these reasons, these images need to be preprocessed for cervix region-of-interest extraction and specular reflection (SR) removal before automated lesion detection can be performed. Several approaches have been taken for automated cervix ROI detection and SR removal. In this section we present a qualitative and quantitative performance evaluation of these techniques on a subset of data obtained by a multi-year cervical cancer study carried out by NCI. Evaluation of cervix ROI extraction The cervix ROI segmentation consists of five phases: feature extraction, feature normalization, feature weighting, classification, and post-processing. The features used to extract the cervix ROI are based on color and shape information. As mentioned in Section 5.2.2.3, the cervix color tends to take on red hues in the spectrum, which suggests using the a channel of Lab color space to capture the dominant color information; the cervix region tends to be somewhat circular in shape and to be located approximately at the image center; this observation suggests incorporating a distance feature d, with d being distance to center of the image. Some normalization is required to compensate for the scale disparity between these two feature components that are defined in different domains. Two normalization methods investigated are linear scaling to unit range and linear scaling to unit variance. Feature weighting is used to allow tuning of the algorithm, based on empirical results. For classification, two unsupervised clustering techniques are used: k-means and Gaussian Mixture Modeling (GMM). Eight experiments that combine different options for each step described above are used to evaluate the approach. Each experiment is run on a dataset of 120 cervigrams. The results obtained by these experiments are visually and quantitatively evaluated and compared using ground truth segmentations created by experts, using the Boundary Marking Tool. The evaluation criterion used is that the extracted ROI should enclose the entire cervix region while removing the irrelevant information. As quality measures for the evaluation, four quantitative measures are used. Three of these shown below are area measurements and one is a distance measurement.
• True positive fraction (sensitivity): R
RStpf ∩=
• False positive fraction (specificity): R
RSfpf
−=
• Overlap metric (Dice metric): RSRSoverlap
∪∩
=
• Mean distance from each pixel on S to the closest pixel on the boundary R: jiji
ii rsdd
Nmd −== ∑ min,1

50
where R denotes the cervix region marked by experts, R denotes its complement, S denotes the cervix ROI generated by automatic approach, ( Nsss ,...,, 21 ) denote the pixels on the boundary of S, and ( Nrrr ,...,, 21 ) denote the pixels on the boundary of R. The true positive fraction (sensitivity) is the fraction of the true cervix region that is included in the extracted ROI region. A value of 1.0 indicates that all cervix pixels are included in the segmented region. The false positive fraction, overlap metric and mean distance measure the amount of irrelevant regions that are included. Higher value of overlap metric and lower values of false positive fraction and mean distance indicate better performance. Cervix ROI extraction: preliminary results and discussion As mentioned, by choosing different methods for feature normalization, feature weighting, and clustering, we devised eight experiments to apply to the entire data set. In these experiments, performance is evaluated by visual inspection and by quantitative analysis using the four measures defined above. The mean values of the four quality measures yielded by the experiments are shown in Table 7.
With regard to feature weighting, we observed that, while weighting the ‘a’ color feature more than the ‘d’ distance feature improves overall accuracy of segmentation results especially in cases where the cervix region is off-center in the image. There were several cases (in which the
cervix color is similar to its surrounding tissues) where the segmented ROI is much larger than the true cervix region. In a few cases when a swab placed across the cervix boundary is imaged, a higher weighted ‘a’ feature may result in a ROI where part of the boundary is the edge of the swab; this conflicts with the expert-marked ground truth. With regard to feature normalization, we observed that, for most cases, when tested without feature weighting (i.e., features were weighted equally), Gaussian normalization (linear scaling by unit variance) performs better or comparable to linear normalization (linear scaling by unit range). With regard to classification (clustering) methods, we similarly observed that the performance of k-means clustering is better for linear normalization, but the performance of the two clustering methods is comparable for Gaussian normalization. Based on both visual evaluation and quantitative assessment, the results suggest that the preferred combination of choices of methods is (features: a-d feature set; normalization: Gaussian normalization; weighting: none; clustering: k-means). This approach appears to yield best accuracy, and also has some possible advantages in robustness and simplicity. Figure 5.33 (a) shows the original cervigram with the cervix boundary marked by an expert, and Figure 5.33 (b) depicts one example of a cervix ROI extraction obtained by our automated approach, using this combination of methods.
Table7. Quantitative evaluation of cervix ROI extractionExperiments
Measure 1 2 3 4 5 6 7 8 mean(tpf) 0.9968 0.9998 0.9892 0.9898 0.9998 0.9994 0.9996 0.9992 mean(fpf) 0.3684 0.3632 0.3913 0.3941 0.3487 0.3736 0.3498 0.3946
mean(overlap) 0.3829 0.4025 0.3776 0.3944 0.4050 0.3972 0.4103 0.3924 mean(md) 75.38 74.65 78.74 79.77 72.21 77.35 72.17 80.30
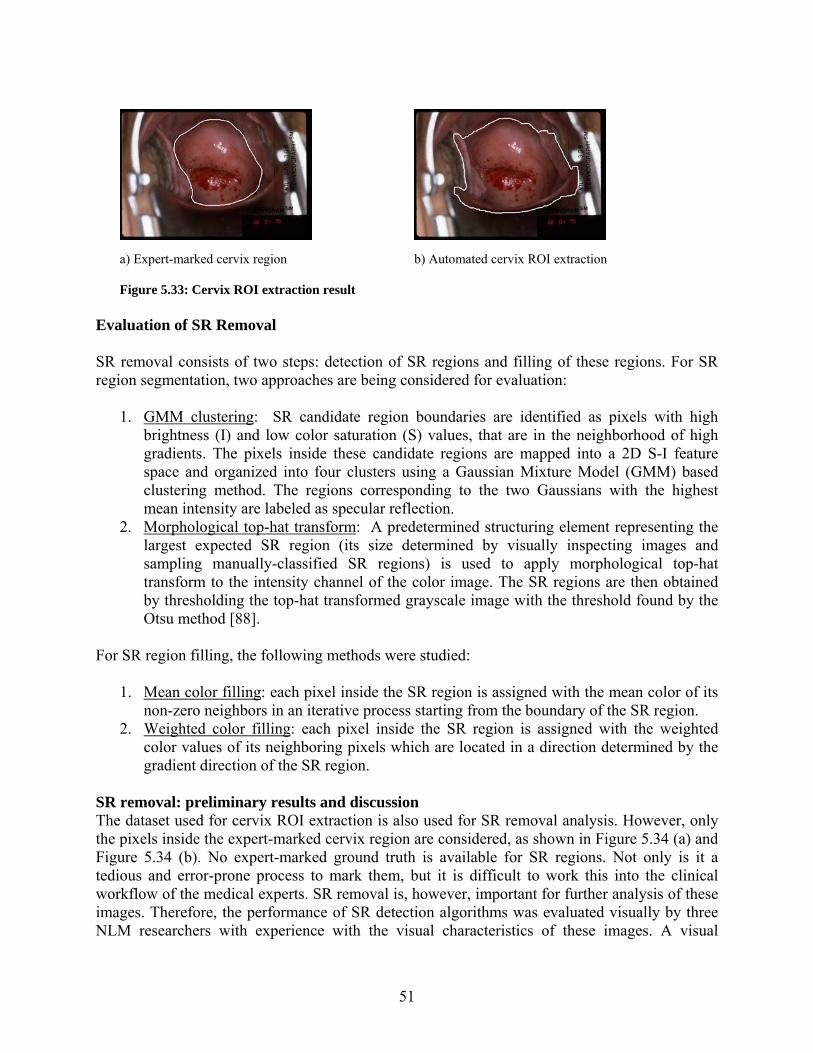
51
a) Expert-marked cervix region b) Automated cervix ROI extraction
Figure 5.33: Cervix ROI extraction result
Evaluation of SR Removal SR removal consists of two steps: detection of SR regions and filling of these regions. For SR region segmentation, two approaches are being considered for evaluation:
1. GMM clustering: SR candidate region boundaries are identified as pixels with high brightness (I) and low color saturation (S) values, that are in the neighborhood of high gradients. The pixels inside these candidate regions are mapped into a 2D S-I feature space and organized into four clusters using a Gaussian Mixture Model (GMM) based clustering method. The regions corresponding to the two Gaussians with the highest mean intensity are labeled as specular reflection.
2. Morphological top-hat transform: A predetermined structuring element representing the largest expected SR region (its size determined by visually inspecting images and sampling manually-classified SR regions) is used to apply morphological top-hat transform to the intensity channel of the color image. The SR regions are then obtained by thresholding the top-hat transformed grayscale image with the threshold found by the Otsu method [88].
For SR region filling, the following methods were studied:
1. Mean color filling: each pixel inside the SR region is assigned with the mean color of its non-zero neighbors in an iterative process starting from the boundary of the SR region.
2. Weighted color filling: each pixel inside the SR region is assigned with the weighted color values of its neighboring pixels which are located in a direction determined by the gradient direction of the SR region.
SR removal: preliminary results and discussion The dataset used for cervix ROI extraction is also used for SR removal analysis. However, only the pixels inside the expert-marked cervix region are considered, as shown in Figure 5.34 (a) and Figure 5.34 (b). No expert-marked ground truth is available for SR regions. Not only is it a tedious and error-prone process to mark them, but it is difficult to work this into the clinical workflow of the medical experts. SR removal is, however, important for further analysis of these images. Therefore, the performance of SR detection algorithms was evaluated visually by three NLM researchers with experience with the visual characteristics of these images. A visual

52
comparison of the results is facilitated by recording the number of SR pixels labeled by each approach and generating a color-coded difference image. The color codes are defined in Table 8. For almost all the 120 cervigrams, both SR detection approaches are found to be effective, reliable, accurate and comparable based on the judgment of the three experienced researchers. The result for one example of SR region detection and its corresponding difference image are shown in Figure 5.34 (c) to Figure 5.34 (e). It is found that for a few cases, the SR region is unsatisfactorily over-segmented. In this experiment, the filling quality is quantitatively assessed by considering the effect of SR elimination on intensity gradients. The measure used is the gradient index (gi) which is the mean value of the Sobel gradient map of the intensity of the extracted cervix ROI region:
)( Gmeangi ∇= , 22
⎟⎟⎠
⎞⎜⎜⎝
⎛∂∂
+⎟⎠⎞
⎜⎝⎛∂∂
=∇yI
xIG
This evaluation criterion is based on the idea that a good SR filling algorithm should reduce the strong gradients associated with the SR, while preserving the original texture. The lower the value of gi, the smoother is the filled image. It should be noted, however, that a low value of gi does not always indicate better performance because it is affected by the accuracy of SR detection: if the SR regions are over-segmented heavily, gi might be low. So, the reliability of the gi index depends on the accuracy of the SR segmentation. To evaluate the SR filling algorithm, we use the more accurate SR detection result among the two approaches (GMM clustering and Morphological top-hat transform) as the input for SR filling. Since the SR segmentation result is accurate enough, gi is a reliable index for measuring the filling performance from the viewpoint of reducing strong gradients associated with the SR. Table 9 lists the mean gradient index of the whole data set for both filling approaches. Both approaches attenuate the effect of SR on the gradients in the image based on the index values and visual inspection.
(a) Cropped image (b) Cervix mask (c) SR mask
(approach 1) (d) SR mask (approach 2)
(e) Difference image
Figure 5.34: SR detection results
Table 8: Color code definitions for difference images in SR classification Pixel color Indicates Blue SR pixels labeled by both approaches Green SR pixels labeled by GMM method but not by the morphological method Red SR pixels labeled by the morphological method but not by GMM Black Pixels not labeled as SR by both methods.
53
Table 9: SR filling evaluation Original Approach 1 Approach 2 mean(gi) 16.86 13.46 13.68
As noted earlier, it is difficult to quantitatively evaluate the SR segmentation and filling quality. Since the removal of SR regions is a first step to further image analysis, we propose a future study to evaluate performance of subsequent segmentation stages as a function of SR removed images. 5.3 Other Technological Contributions
5.3.1 Image compression In collaboration with CEB, researchers at Texas Tech University have developed a new Wavelet-based compression method [11]. This new “TTC” compression/decompression algorithm (or “codec”) incorporates both vector and scalar quantization, along with a new method for coding Wavelet tree coefficients which allows significant speed-up in decompression times. Figure 5.35 illustrates both grayscale and color images compressed/decompressed with this method and compared to the original and to images similarly processed with JPEG2000.
Cervical Spine X-Ray Uterine Cervix Cervicography Image
Figure 5.35: TTC Compression/Decompression Comparisons. Upper Left: Original; Upper Right: TTC. Lower Right: JPEG 2000.
5.3.2 Quality control for digital data acquisition The NCI Guanacaste image data included 60,000 35 mm color slides that were digitized with a Nikon Coolscan scanner. In collaboration with NCI researchers, we conducted small sample human observer studies [89] to acquire multiple expert judgments on image quality as a function of scanning level (DPI—dots per inch) for the purpose of guiding the selection of the final scanning level used. The selected scanning level (2000 DPI) was used to digitize the 60,000 Guanacaste cervicogrpahy images and is being used for the current digitization of the 40,000 cervicography images from the NCI ALTS project.

54
6 Evaluation Approach
We are approaching the evaluation of the effectiveness of the tools and technologies being developed by (1) developing working relationships with end-users and content experts within the fields of oncological gynecology (for the uterine cervix related work) and osteoarthritis/degenerative disc disease/spine morphometry (for the spine x-ray related work), (2) soliciting incremental, informal evaluations of testbed algorithm and system implementations to guide our development while it is in progress, and (3) working with these experts to identify medical sites and participants willing to provide more systematic and formal system evaluations for problems of importance in routine medical research or clinical practice.
7 Project Schedule
We anticipate a series of releases of software tools for the collection, dissemination, and analysis of the uterine cervix images in fiscal years (FY) 2007-2008. These will include the Boundary Marking Tool, the Multimedia Database Tool, the Virtual Microscope, and the Teaching Tool. Concomitantly, we expect to release and update our Web-based CBIR tools, beginning with Web-based CBIR for spine x-rays, and continuing with CBIR for uterine cervix images. We project that our basic research work to continue in FY 2007-2010 period.
8 Summary and Next steps
NLM is recognized worldwide for the quality and value of its information services to biomedical research and practice. We have the opportunity to advance the value of these and future services, possibly augmented by biomedical images, by conducting the required research and development toward: (1) integrating existing technologies to make images more readily available, along with associated descriptive information, within integrated multimedia management systems, and to allow the collection of interpretive information (including graphical information) from these images; and (2) creating advanced methods for indexing, classifying, and retrieving images, based not only on what has been recorded about the images, but on the image contents themselves. Toward this goal, our planned next steps include the following: For Multimedia Data Management, we will continue the development of the tools described in this report, continue engagement with NCI in support of biomedical studies with these tools, and expand our working databases to include all of the image and clinical data provided by NCI. The tools being developed are at various levels of maturity. For example, the Boundary Marking Tool is mature with respect to the original requirements for uterine cervix data collection, but it requires some generalization for easy adaptation to studies with varying workflow requirements on the observers, and for studies with non-uterine cervix data (such as lesion studies for dermatology images). These factors motivate the work under way to generalize the specific fields collected and the workflow supported by BMT. For the Multimedia Database Tool, we will incorporate multi-modality image display for all of the NCI image types: cervigrams, histology, and Pap test images; in addition, we are
55
implementing a level-of-privileges capability for access to individual fields and tables in its database; and we are streamlining the procedures for a database administrator when adding new databases containing additional datasets of text and images. The current image sets being used by the Multimedia Database Tool are only a fraction (several thousand) of the images being made available by NCI. In the near term, we will make available all 100,000 cervigrams, as well as all the histology and Pap test images, in the databases served by the MDT. Virtual Microscope work in the near future consists largely of implementing a custom-written Java application to eliminate its current dependence on the commercial Zoomify product. Finally, in the Teaching Tool, we will implement fine-grained test reporting capability, including reporting performance at the individual question level; also, the TT will be made operationally compatible with the training and testing infrastructure of the ASCCP. In addition to this development work, we will evaluate these tools as they are used by NCI collaborators for multi-observer, Web-based biomedical research for cancer understanding and prevention. Our evaluation (and enhancement) of these tools relies in large part on direct feedback from medical experts using the tools in their studies. In the area of Advanced Techniques for Biomedical Image Knowledge Extraction, the near-term work includes: continued research and development in image segmentation, which is crucial for image indexing; creating new CBIR capability for indexing and retrieval of uterine cervix images; opening up our CBIR work to a broader research community by providing Web access; and continued work to create sets of reference or “truth” data for the design and evaluation of image processing algorithms, as well as research into methods to intelligently interpret and use such data, given that it originates in high-variability sources, i.e., human observers. Our contribution to image segmentation research includes the development of a shape segmentation toolkit, to make available in one source a variety of algorithms, including the Generalized Hough Transform, ASM, AAM, Active Contours, and LiveWire. This toolkit will retain specialized functionality for segmentation of spine x-rays, but will also contain broader capability for shape segmentation of general grayscale or color images. In addition, work will continue toward the segmentation of columnar tissue and acetowhite lesions in uterine cervix images by color and texture. As this new segmentation capability for the uterine cervix matures, we will apply it to index these images for retrieval by the color and texture characteristics of tissue regions, and add this retrieval capability to our uterine cervix CBIR tool described in Section 5.2.2.3. In addition to these planned new algorithm capabilities, we are working to make current capabilities available over the Web. One of these efforts is the planned linkage between the IRMA system of Aachen University (Germany) and our facility to retrieve vertebrae by shape. With this linkage in place, a Web user will be able to do a shape query by accessing the IRMA system, and have the query served by a request from IRMA to a shape segmentation server running at NLM. Not only will this add local-feature based CBIR to the global-feature based IRMA system, it will also enable us to gain research experience with a combined system that supports both types of CBIR. A second Web effort is our continued development of SPIRS, the first Web-based CBIR system that will operate at NLM.

56
To increase our repositories of reference or “truth” data from biomedical images, we will continue to collect uterine cervix boundary data and associated interpretations with the BMT, and vertebral data and associated interpretations with the PathVa tool. We are studying several methods for analyzing these multi-observer segmentation data, and using them to evaluate algorithms that perform automated or computer-assisted segmentation. In particular, we plan to investigate the STAPLE method as a potentially effective approach to evaluate both human and machine performance relative to a group of expert observers.

57
Appendix A CBIR Primer
Content-Based Image Retrieval [90] refers to the retrieval of images that are indexed by descriptors (features) derived “directly” from the image pixels. CBIR also implies novel query methods for retrieval, such as finding images similar to an example image, or to a sketch. CBIR descriptors may include texture, boundaries of objects, geometric relationships among objects, grayscale or color histograms, as well as more abstract descriptors, such as Fourier or Wavelet transform coefficients, or transformed and reduced boundary coordinates. CBIR is different from conventional image retrieval systems in two ways: first, in the methods used to index (a conventional system has a human indexer enter text that describes image contents), and secondly, in the methods used to retrieve (conventionally, retrieval of images is by relational database queries on the text used to index the image.) CBIR research is highly technical and mathematical, and requires the exploration of numerous alternative technical solutions. To maximize chances of success, alternatives may be pursued in parallel, with little a priori knowledge of the outcomes. For example, we have pursued several parallel strategies for x-ray segmentation, as will be shown. In addition, we have found it advantageous to conduct research activity in an order that may be logically out-of-sequence. For example, we have investigated the classification of vertebral shapes (by using manual segmentations of vertebrae) before solving the computer-assisted segmentation problem.
Figure A.1: Overview of CBIR Indexing and Retrieval Phases CBIR comprises both indexing and retrieval phases, as shown in Figure A.1. The indexing phase involves the computer-assisted extraction of relevant image features and subsequent data reduction of the mathematical feature into a comparable entity. All these features are then

58
organized to assist in efficient retrieval since traditional text-based databases are not adequate for this purpose. Expert markup, text, and basic feature data are still indexed in traditional databases. The retrieval phase, on the other hand, covers the user interaction to retrieve desired images from the database. The user can specify a query image and allow the system to automatically extract relevant features in a query-by-image-example paradigm or specify the feature on the image, as a sketch for example, in a query-by-image-feature paradigm. These features are then matched using specific similarity computation methods as distances between these computed features. In a way, the relevant information contained in the image is assumed to be coherently indicated by these features. The results from the feature comparison are then presented to the user. If the user specified additional query parameters, such as text, the results from these searches are combined before the results are presented.

59
Appendix B Overview of prior CBIR R&D
Our prior work has addressed several of the steps above and was detailed in the report to the Board of Scientific Counselors in 2002 [42]. These steps are highlighted below to place recent work described in this report in context. All previous work was limited to the NHANES spine x-ray images. Current work expands on this with a focus on generalizing segmentation methods to different features extendible to a wider variety of images.
• Segmentation: The segmentation problem has been recognized as one of the most urgent problems in digital imaging and remains as one of the grand challenges of the field. This implies a dearth of robust segmentation tools that are applicable generally to biomedical images. Instead, the most reliable and robust tools available are those developed for specific classes of biomedical images. Since there is no a priori knowledge of which specific techniques would prove most fruitful for our images, we have conducted several efforts in parallel. Our previous work in this area focused on the following:
o Manual 9-point Segmentation: Coarse segmentations by medical experts acquired
as reference data for validating segmentation algorithms. o Active Contour Segmentation: Computer-assisted semi-automated segmentation
by mathematical energy model [43, 46]. o Active Shape Modeling (ASM): segmentation by deformable template created by
statistical samples [19, 20, 45, 46]. o Generalized Hough Transform (GHT): segmentation by template matching using
Hough bin counting [12, 20, 44]. o Computer-assisted “dense” (more than 9 points) manual segmentation:
segmentation by manual point selection, edge detection, and spline curve fitting.
• Feature extraction: The segmentation step, in the case of spine x-ray images, results in a vertebra shape boundary. These boundaries may be treated as closed polygons and qualify as valid features. But other techniques that can capture additional shape semantics are valuable for responding to user queries for “vertebral fracture”, “disc compression”, “Anterior Osteophytes of grade 3”, etc. Shape representation techniques express a shape boundary in a form suitable for archiving, indexing, and similarity matching. In this effort, earlier work included Polygon Approximation, Fourier Descriptors, and Geometric Shape Properties [42, 91].
• Classification: Automated classification of NHANES II images for biomedical features
by shape has been investigated in [48, 49, 92], using artificial neural networks and clustering techniques. In [92] we have investigated the application of artificial neural networks to the discrimination of lumbar spine vertebrae for the presence of anterior osteophytes. Four geometric features were derived and tested individually. The most successful was obtained by first finding the exclusive-OR of a vertebral area and the area within the convex hull of the vertebra; and, for this region, finding the area of the largest connected component on the anterior side of the vertebra. In [49] we have applied k-means and self-organizing map clustering techniques to the task of scoring adjacent vertebrae for disc space narrowing on a 0–3 scale, representing normality (0) to

60
maximum abnormality (3). Features were derived by first computing an separator curve equidistant between adjacent vertebrae and then measuring various quantities relative to this separator, such as minimum Euclidean distance from the separator to a vertebra, and normalizing the quantities to obtain features that are intended to be invariant with respect to vertebral size. Interactivity: None. Performance: For the lumbar spine anterior osteophyte discrimination, 572 vertebrae were used for training, with half known to be normal and half abnormal; 108 different vertebrae were used for testing, half normal and half abnormal. Twenty individual test and training sets where generated by randomly selecting 572/108 vertebrae from among the available vertebral data. The neural network used had a 4×4×1 architecture (four input nodes for the four features; one hidden layer; one output node), with sigmoid function at input and hidden layer nodes, and a linear transfer function at the output. The vertebrae were manually segmented, using the nine-point radiologist marks as a guide. Results were as follows: the mean correct classification of normal vertebrae in the test set was 88.6%; the mean correct classification of abnormal vertebrae was 90.5%. For the work in classifying disc space narrowing by grade, 294 adjacent vertebral pairs (‘interfaces’) of the cervical spine were used. Twenty runs were made; for each run 80% of the data was randomly assigned to the training set, and the remaining 20% to the test set. The mean percentages of correct classifications over the 20 runs were, for grades 0–3, respectively, 90.4, 85.2, 93.8, and 82.1%.
• User query formulation: We have developed techniques for query-by-sketch and query-
by-image-example on target and category search paradigms for spine x-ray images with simple text filtering. This work has subsequently been extended to partial shape queries.
• Similarity Matching: Similarity matching techniques tend to be closely related to the
feature vectors captured during the indexing process. Similarity between two shapes is a function of the distance between their computed feature vectors. Earlier work covered what we now refer to as whole shape matching through application of Fourier Descriptors, Polygon Approximation, and Geometric Shape Properties. With these methods, the entire vertebral shape was matched with others without particular focus on intervals along the boundary where pathology may exist. Thee methods were applied to 9-point and 36-point vertebral boundary shape descriptions. 9-point boundary comprises of landmarks made by radiologists and the 36-point boundary can be considered as an interpolation of that. The latter, however, deforms to fit the vertebral edge.
61
Appendix C Relevance feedback in CBIR: Literature survey
Since the mid-90s, Relevance Feedback (RF) has been proposed to address the gap between low-level image features and high-level human visual perception [74-77]. The fundamental concept of RF is to establish an interaction between the user and the retrieval system and to refine the retrieval results based on feedback provided by the user. The two major aspects of RF are (1) image selection strategy: the method of selecting images on which the user provides feedback and (2) learning strategy: the way in which relevance feedback is used to refine the retrieval results. In the literature, Neural Network (NN) and statistical approaches comprise the majority of RF learning schemes. NN-based approaches require an appropriate training set, and RF is performed during the network training process [75, 93, 94], making such approaches unsuitable for rapid refinement of the retrieval results. In most statistical approaches, however, RF occurs when the user is not satisfied with the retrieval results and desires to refine them. In this scenario, an image selection strategy is used to decide which images to show to the user for relevance feedback, and iterations on this interactive processing are typical. Our study has shown that the image selection strategy, a subject that has not received sufficient attention in the literature, is actually crucial to the performance of RF. In most prior work, only the images that are most similar to the user query are retrieved by the system and selected for feedback. However, if the retrieval accuracy for one specific query increases from iteration to iteration, there will be a large overlap between the image sets that are selected at each step. Such methods possess low efficiency and can possibly lead to “over-learning”. They also ignore the useful information that can be obtained from negative feedback, i.e., the irrelevant images retrieved by the system. The image selection strategies can be different for target search and category search retrieval systems. A target search system such as [95, 96] searches for a specific target image in the database. A category search system searches for a certain number of images that are most similar to the query, i.e. it retrieves images most similar to the query's ``class'', e.g. pathology, type, or modality, etc. The display updating scheme for the target search retrieval system in [95] decides how to choose DN images for the next display to the user, a process which essentially serves the same purpose as the image selection strategies in RF. In an attempt to minimize the number of iterations required to search for the target, a Maximum Entropy method was employed for display in [95, 96]; it claims to maximize and fully utilize the information possibly elicited from the user and is referred to as the ``most-informative scheme''. A Monte Carlo approach was implemented as an alternate solution because of the high level of complexity of this approach. Although it appears to be an optimal display scheme, the most-informative approach is far too complicated (consider alternative wording for “far too complicated”) for category search retrieval systems such as our spine x-ray image retrieval system. Compared to algorithms for image selection, more research effort has been devoted to learning strategies that use both positive and negative samples identified by the user [97, 98]. Besides NN approaches which as mentioned earlier are not suitable for online RF, there are various statistical approaches for RF learning. For example, Rui et al have proposed a straightforward and effective method based on hierarchical weight updating [74]. However, there are some evident deficiencies with this method which are addressed in detail in Section III. Probability-estimating approaches have also gained considerable research interest [77, 95, 96]. In the target search

62
retrieval system proposed in [95], a Bayesian rule was used to estimate the probability of each image being the user's query, i.e., the target. The probability is conditioned on all the feedback history from the user and is updated globally at each feedback iteration. The resulting system is quite sophisticated, but the updating process is computationally expensive and proportional to the size of the image database. In addition, this Bayesian retrieval system is for target search only, and it is based on the assumption that the target is in the database. This assumption may not be applicable to medical image retrieval since most medical image retrieval systems require category search; i.e. the query is usually not in the database. Unlike the non-parametric-based Bayesian approach [95], Expectation Maximization (EM) has also been used to estimate the statistical parameters, i.e., the mean and variance of the user's target distribution, given a Gaussian distribution assumption [96]. The EM algorithm is applied to a maximum likelihood function chosen to make most images appear in the medium likelihood area. This method was only compared with Rui's method on synthetic data. An integrated probability function for calculating the similarity between images was introduced in [77]. It is based on a posterior probability estimator and a weight-updating scheme. RF from the user is used to update the weight and re-estimate the posterior probability. This method was tested on trademark images and demonstrated a retrieval performance improvement from 75% to 95% after two RF iterations. Optimal adaptive learning is another approach for relevance feedback that has appeared in the literature. In [99], adaptive filters were used to imitate the human vision system. Least Mean Square (LMS) and Recursive Least Square (RLS) algorithms were both proposed to approximate the optimal Wiener filter solution. The user's feedback is used as the ground truth to guide the algorithm to the optimal solution. These methods have been tested on real images and showed promising performance. RF methods have also been adapted and employed to derive semantics from the images [78, 100, 101]. For example, in [101] a user feedback log was established to record the user's feedback information over time to learn both explicit and implicit semantics. Although learning semantics sounds appealing, it obviously requires a large amount of feedback input from the user, which is contrary to the efficiency goal of refinement based on fast retrieval results needed for an online system. The semantics may be overestimated when attempting to build a semantic relationship between any two images; on the other hand the accuracy achieved by low-level image features is often overlooked, which violates the initial intent of exploring CBIR instead of text-annotated image retrieval. Few existing RF methods have been applied to medical image databases. However, in order to provide subjectively accurate medical image retrieval information, RF becomes a necessary and indispensable part of an online medical image retrieval system. El-Naqa et. al. described a relevance feedback approach incorporated into a similarity learning-based framework for digital mammography in [102]. With the focus on similarity learning, a simple updating formula is employed to recompute the Similarity Coefficient. In their earlier paper [79], incremental learning was proposed to incorporate each of the user's feedback responses into an existing Support Vector Machine. However, the method was only tested on similarity data from experienced radiologists rather than extracted low-level image features.
63
References
1. Plan and Operation of the Second National Health and Nutrition Examination Survey 1976-80, Programs and collection procedures, Series 1, No. 15, DHHS Publication No. (PHS) 81-1317, National Center for Health Statistics, Hyattsville, MD, July 1981.
2. Plan and Operation of the Third National Health and Nutrition Examination Survey 1988-94. National Center for Health Statistics. Vital Health Stat 1994; 3(32).
3. Long LR, Ostchega Y, Goh GH, Thoma GR. Distributed data collection for a set of radiological x-ray interpretations. Proceedings of SPIE Storage and Retrieval for Image and Video Databases V. 1997; 3022:228–237.
4. Long LR, Berman LE, Neve L, Roy G, Thoma GR. An application-level technique for faster transmission of large images on the internet. Proceedings of SPIE Multimedia Computing and Networking. 1995;2417:116–129.
5. Ostchega Y, Long LR, Goh GH, Hirsch R, Ma LD, Scott WWJ, Johnson W, Thoma GR. Establishing the level of digitization for wrist and hand radiographs for the third national health and nutrition examination survey. Journal of Digital Imaging. 1998;11(3):116–120.
6. Brogan D. Software for sample survey data, misuse of standard packages. Encyclopedia of Biostatistics, P Armitage, T Colton, eds., vol. 5. John Wiley & Sons, New York. 1998; 4167–4174.
7. Korn EL, Graubard BI. Analysis of Health Surveys. Wiley-Interscience. 1999. 8. Ghebreab S. Strings and Necklaces: On Learning and Browsing Medical Image Segmentations. Intelligent
Sensory Information Systems Group, University of Amsterdam, Amsterdam, Netherlands. 2002. 9. Zamora-Camarena G. Dissertation for the degree of doctor of philosophy, Dept. of Elect. Eng., Texas Tech
Univ, Dec. 2002. 10. Qian X. Shape indexing and its optimization in medical image databases, Dissertation for the degree of doctor
of philosophy, Yale Univ, Dec. 2005. 11. Guo J. Dissertation for the degree of doctor of philosophy, Dept. of Elect. Eng., Texas Tech Univ, Dec. 2005. 12. Tezmol A. Customized Hough Transform for robust segmentation of cervical vertebrae from x-ray images.
M.S. Thesis, Dept. of Elect. Eng., Texas Tech Univ., Dec. 2001. 13. Gururajan A. Coarse segmentation of cervical and lumbar vertebrae using a customized version of the
Generalized Hough Transform, M.S. Thesis, Dept. of Elect. Eng., Texas Tech Univ., Dec. 2003. 14. Howe B. Segmentation of cervical and lumbar vertebrae in x-ray images using Active Appearance Models
and extensions, M.S. Thesis, Dept. of Elect. Eng.,Texas Tech Univ., Dec 2003. 15. Grau V, Alcaniz M, Juan MC, Monserrat C, Knoll C. Automatic localization of cephalometric landmarks.
Journal of Biomedical Informatics. 2001;34(3):146–156. 16. Long LR, Pillemer S, Goh GH, Berman LE, Neve L, Thoma GR, Premkuman A, Ostchega Y, Lawrence R,
Altman RD, Lane ND, Scott Jr WW. A digital atlas for spinal x-rays. Proceedings of SPIE Medical Imaging: PACS Design and Evaluation. 1997;3035:586–594.
17. The Epidemiology of Chronic Rheumatism, vol. II of Atlas of Standard Radiographs of Arthritis. F. A. Davis Company, Philadelphia, PA. 1963.
18. Meadows S, Thoma GR, Long LR, Mitra S. Entropy encoding of difference images from adjacent visible human digital color photographic slices for lossless compression. Proceedings of SPIE Medical Imaging: Image Processing. 1997;3031:749–755.
19. Zamora G, Wilson M, Mitra S, Thoma G. An innovative web-based system for high lossless compression and fast, interactive transmission of visible human color images. The Third Visible Human Conference Proceedings. 2000; CDROM.
20. Long LR, Antani SK, Thoma GR. Image informatics at a national research center. Computerized Medical Imaging and Graphics 29 (2005) 171-193.
21. Herrero R, Schiffman MH, et al. Design and methods of a population-based natural history study of cervical neoplasia in a rural province of Costa Rica: the Guanacaste Project. Pan American Journal of Public Health, 1(15), 1997, 362-375.
22. Jeronimo J, Schiffman M. Colposcopy at a crossroads. Am J Obstet Gynecol. (In press). 23. National Library of Medicine Long Range Plan: Obtaining factual information from databases. Tech. rep.,
National Library of Medicine. 1986 June.

64
24. Zink S, Jaffe CC. Medical imaging databases: A National Institutes of Health workshop. Investigative Radiology. 1993;28(4):366–372.
25. NLM Long Range Plan, 2006 update. 26. Castle PE, Jeronimo J, Schiffman M, Herrero R, Rodriguez AC, Bratti MC, Hildesheim A, Wacholder S,
Long LR, Neve L, Pfeiffer R, Burk RD. Age-related changes of the cervix influence human papillomavirus type distribution. Cancer Research 66, Jan 15, 2006, 1218-1224.
27. Jeronimo J, Massad S, Wheeler C, Long R, Schiffman M. Colposcopic appearance of the cervix of HPV-infected and HPV non-infected women. 23rd International Papillomavirus Conference and Clinical Workshop, Sep 1-7, 2006, Prague, Czech Republic.
28. Jeronimo J, et. al. Visual appearance of the uterine cervix: correlation with human papillomavirus detection and type. Submitted (2006) to American Journal of Obstetrics and Gynecology.
29. Jeronimo J, et. al. Inter-observer agreement in the evaluation of digitized cervical images: results from the NIH-ASCCP Research Group. (Draft, August 2006).
30. PATH Web site: http://www.path.org. 31. Massad LS. American Society for Colposcopy and Cervical Pathology and the National Institutes of Health
explore research collaboration. Journal of Lower Genital Tract Disease, Jan 2006, 10(1):1-2. 32. Jeronimo J, Long LR, Neve L, Bopf M, Antani S, Schiffman M. Digital Tools for Collecting Data from
Cervigrams for Research and Training in Colposcopy. Journal of Lower Genital Tract Disease, 2006, 10(1):16-25.
33. Long LR, Antani S, Jeronimo, Schiffman M, Bopf, Neve L, Cornwell C, Budihas SR, Thoma GR. Technology for medical education, research, and disease screening by exploitation of biomarkers in a large collection of uterine cervix images. Proc. 19th International Symposium on Computer-Based Medical Systems (CBMS 2006), June 2006, Salt Lake City, Utah; 826-31.
34. Bopf M, Coleman T, Long LR, Antani S, Thoma GR, Jeronimo J, Schiffman M. An architecture for streamlining the implementation of biomedical text/image databases on the Web. Proc. 17th IEEE Symposium on Computer-Based Medical Systems. Los Alamitos CA: IEEE Computer Society. June 2004, 563-69.
35. Long LR, Pillemer SR, Lawrence RC, Goh G-H, Neve L, Thoma GR. WebMIRS: Web-based medical information retrieval system. Proc. SPIE Storage and Retrieval for Image and Video Databases IV, San Jose, CA, January 24-30, 1998, SPIE Vol., 3312,. 392-403.
36. Zoomify Corporation Web site: http://www.zoomify.com. 37. Cervix disease terminology: http://gynalternatives.com. 38. Wang JZ. Wavelets and imaging informatics: A review of the literature. Journal of Biomedical Informatics.
2001;34:129–141. 39. Smeulders AWM,Worring M, Santini S, Gupta A, Jain R. Content-based image retrieval at the end of the
early years. IEEE Transactions on Pattern Analysis and Machine Intelligence. 2000 December;22(12):1349–1380.
40. Antani S, Kasturi R, Jain R. A survey on the use of pattern recognition methods for abstraction, indexing and retrieval of images and video. Pattern Recognition. 2002;35(4):945–965.
41. Rui Y, Huang TS, Change SF. Image retrieval: Current techniques, promising directions, and open issues. Journal of Visual Communications and Image Representation. 1999;10(1):39–62.
42. Thoma GR, Long LR, Antani S. Content-Based Image Retrieval (CBIR) of Biomedical Images. Report to the NLM/LHC Board of Scientific Counselors, September 2002.
43. Kass M, Witkin A, Terzopolous D. Snakes: active contour models. International Journal of Computer Vision 1, 1988, 321-331.
44. Ballard DH. Generalizing the Hough Transform to detect arbitrary shapes, Pattern Recognition, 1981, 13(2), 111-122.
45. Cootes TF, Taylor CJ. Statistical models of appearance for computer vision. Tech. rep., University of Manchester, Wolfson Image Analysis Unit, Imaging Science and Biomedical Engineering, University of Manchester, Manchester, M12 9PT, U.K. 2001 February.
46. Long LR, Antani S, Lee DJ, Krainak DM, Thoma GR. Biomedical information from a national collection of spine x-rays: film to content-based retrieval. Proceedings of SPIE Medical Imaging: PACS and Integrated Medical Information Systems, 15-20 February 2003, San Diego, CA, SPIE Vol. 5033: 70-84.
47. Antani S, Lee DJ, Long LR, Thoma GR. Evaluation of shape similarity measurement methods for spine x-ray images. Journal of Visual Communication and Image Representation Special issue: Multimedia Database Management Systems - Edited by Y. Li, J. R. Smith, T. Zhang and S.-F. Chang: 15(2004):285-302.

65
48. Stanley RJ, Seetharaman S, Long LR, Antani S, Thoma G, Downey E. Image analysis techniques for the automatic evaluation of subaxial subluxation in cervical spine x-ray images. Proc. Of 17th IEEE Symposium on Computer-Based Medical Systems (CBMS2004), 204-209.
49. Chamarthy P, Stanley RJ, Cizek G, Long R, Antani S, Thoma G. Image analysis techniques for characterizing disc space narrowing in cervical vertebrae interfaces. Computerized Medical Imaging and Graphics, 2004, 28(1-2):39-50.
50. Clough P, Müller H, Deselaers T, Grubinger M, Lehmann TM, Jensen J, Hersh W. The CLEF 2005 cross-language image retrieval track. In: Peters C, Quochi V (eds): Results of the CLEF 2005 Cross-Language System Evaluation Campaign - Electronic Working Notes for the CLEF 2005 Workshop, 21-23 September, Vienna, Austria, 2005.
51. T. Diettrich and G. Bakiri. Solving multiclass learning problems via error-correcting output codes. Journal of Artificial Intelligence Research, 2:263–286, 1995.
52. R. Ghani. Using error-correcting codes for text classification. In International Conference on Machine Learning, 2000.
53. Yao J, Antani S, Long R, Thoma G, Zhang Z. Automatic medical image annotation and retrieval using SECC. Proc. 19th International Symposium on Computer-Based Medical Systems (CBMS 2006), June 2006, Salt Lake City, Utah; 820-5.
54. MedGIFT Web site: http://www.sim.hcuge.ch/medgift. 55. Lehmann TM, Deselaers T, Schubert H, Güld MO, Thies C, Fischer B, Spitzer K. IRMA – a content-based
approach to image retrieval in medical applications. In: Khosrow-Pour M (ed): Emerging Trends and Challenges in Information Technology Management. Proceedings of the 2006 Information Resources Management Association International Conference 2006; 911-2,
56. IRMA Web site: http://www.irma-project.org. 57. Qian X, Tagare HD. Optimal embedding for shape indexing in medical image databases. Med Image Comput
Comput Assist Interv Int Conf Med Image Comput Comput Assist Interv. 2005;8(Pt 2):377-84. 58. Tagare HD, Qian X, Fulbright R, Long R, Antani S. Shape Based Retrieval in NHANES II. Proc. 12th ACM
International Conference on Multimedia, Oct. 2004, NY 776-9. 59. Qian X, Tagare HD, Fulbright R, Long R, Antani S. Shape Indexing in Medical Image Databases using Pre-
Shape Embedding. Proc. Distributed Databases and processing in Medical Image Computing, MICCAI, pp. 36-44, Sept. 2004.
60. Lee DJ, Antani SK, Xu X, Long LR. Design and evaluation of a curve matching- based spine x-ray image retrieval system Proc. SPIE Medical Imaging, February 2005, San Diego, CA, vol. 5748:365-373.
61. Xu X, Lee DJ, Antani S, Long LR. Curve Matching for Spine x-ray Image Retrieval using Dynamic Programming. In: Callaos N, Chambah M, Gaburro Z, Loutfi M, editors. SCI 2004. Proc. 8th World Multiconference on Systemics, Cybernetics and Informatics; 2004 Jul 18-21; Orlando, FL. Vol. 12, Applications of Cybernetics and Informatics in Optics, Signals, Science and Engineering. Orlando (FL): International Institute of Informatics and Systemics; c2004. p. 172-6.
62. Xu X, Lee DJ, Antani S, Long LR. Partial shape matching of spine x-ray shapes using dynamic programming. Proc. 17th IEEE Symposium on Computer-Based Medical Systems. Los Alamitos CA: IEEE Computer Society. June 2004, 97-102.
63. Antani S, Xu X, Long LR, Thoma GR. Partial Shape Matching for CBIR of Spine X- ray Images. Proceedings IS&T/SPIE Electronic Imaging - Storage and Retrieval Methods and Applications for Multimedia 2004. San Jose, CA; January 2004; SPIE Vol. 5307:1-8.
64. Tagare H. Deformable 2-D template matching using orthogonal curves. IEEE Transact Med Imaging 1997;16(1):108–17.
65. Barrett WA, Mortensen EN. Interactive live-wire boundary extraction. Medical Image Analysis 1(4):331-341, 1997.
66. Color spaces: http://www.color.org. 67. Bishop CM. Neural Networks for Pattern Recognition. Oxford University Press, 1995. 68. Greenspan H, Gordon S, Zimmerman G, Jeronimo J, Antani S, Long R. Content analysis of uterine cervix
images: initial steps towards content based indexing and retrieval of cervigrams. (Submitted to IEEE Transactions on Image Processing, July 2006).
69. Dryden IL, Mardia KV. Statistical Shape Analysis. John Wiley & Sons, Inc. 1998. 70. Shou J, Antani S, Long LR. Thoma GR. Evaluating partial shape queries for pathology-based retrieval of
vertebra. Proc. of the 8th World Multiconference on Systemics, Cybernetics and Informatics, 12:155–60, July 18-21, 2004.
66
71. Heggeness M, Doherty B. Morphologic study of lumbar vertebral osteophytes. Southern Medical Journal, vol. 91(2):187–9, Feb. 1998.
72. Pate D, Goobar J, Resnick D, Haghighi P, Sartoris D, Pathria M. Traction osteophytes of the lumbar spine: Radiographic-pathologic correlation. Radiology. 166(3):843–6, March 1988.
73. Macnab I. The traction spur: An indicator of segmental instability. Bone and Joint Surgery. 53(4): 663–70, June 1971
74. Rui Y, Huang T, Ortega M, Mehrotra S. Relevance feedback: A power tool for interactive content-based image retrieval. IEEE Transactions on Circuits and Systems for Video Technology, vol. 8, pp. 644–655, Sept. 1998.
75. Guo G-D, Jain A, Ma W-Y, Zhang H-J. .Learning similarity measure for natural image retrieval with relevance feedback. IEEE Transactions on Neural Networks, vol. 13, pp. 811–820, July 2002.
76. Cox IJ, Miller ML, Omohundro SM, Yianilos PM. Pichunter: Bayesian relevance feedback for image retrieval. International Conference on Pattern Recognition, vol. 3, pp. 362–369, 1996.
77. King I, Jin Z. Integrated probability function and its application to content-based image retrieval by relevance feedback. Pattern Recognition, 36(9):2177–86, Sept. 2003.
78. Lu Y, Zhang H, Liu W, Hu C. Joint semantics and feature based image retrieval using relevance feedback. IEEE Transactions on Multimedia, vol. 5:339–47, Sept. 2003.
79. E1-Naqa I, Yang Y, Galatsanos N, Wernick M. Relevance feedback based on incremental learning for mammogram retrieval. International Conference on Image Processing, vol. 1:729–32, Sept. 14-17, 2003.
80. Xu X, Lee DJ, Antani S, Long LR. A hybrid approach for online spine x-ray image retrieval based on CBIR and relevance feedback. IEEE Transactions on Information Technology in Biomedicine, Nov 2005, 1-10.
81. Antani S, Cheng J, Long J, Long LR, Thoma GR. Medical Validation and CBIR of Spine x-ray Images over the Internet. Proc. IS&T/SPIE Electronic Imaging Science and Technology 2006: Internet Imaging VII. San Jose. CA Jan 15-19, 2006, SPIE Vol. 6061 pp. 60610J (1-9).
82. Haralick RM. Validating image processing algorithms. Proceedings of SPIE medical imaging, February 12–18, vol. 3979; 2000. p. 2–16.
83. Yoo TS, Ackerman MJ, Vannier M. Toward a common validation methodology for segmentation and registration algorithms. Medical image computing and computer-assisted intervention, lecture notes in computer science. vol. 1935. Berlin: Springer; 2000, pp. 422–31.
84. Chalana V, Kim Y. A methodology for evaluation of boundary detection algorithms on medical images. Proceedings of SPIE medical imaging, vol. 2710; 1996.
85. Udupa JK, LeBlanc VR et al. A methodology for evaluating image segmentation algorithms. Proceedings of SPIE medical imaging, vol. 4684, February 24–28; 2002. p. 266–277.
86. Warfield SK, Zou KH, Wells WM. Simultaneous truth and performance level estimation (STAPLE): an algorithm for the validation of image segmentation. IEEE Transactions on Medical Imaging, Jul 2004, 23(7), 903-921.
87. Srinivasan Y, Nutter B, Mitra S, Phillips B, Sinzinger E. Classification of cervix lesions using filter bank-based texture models. Proc. 19th International Symposium on Computer-Based Medical Systems (CBMS 2006), June 2006, Salt Lake City, Utah; 832-837.
88. Otsu N. A threshold selection method from gray level histograms. IEEE Transactions on Systems, Man and Cybernetics. Mar 1979 (9), 62-66.
89. Jeronimo J, Long R, Neve L, Ferris D, Noller K, Spitzer M, Mitra S, Guo J, Nutter B, Castle P, Herrero R, Rodriguez AC, Schiffman M. Preparing Digitized Cervigrams for Colposcopy Research and Education: Determination of Optimal Resolution and Compression Parameters. Journal of Lower Genital Tract Disease, Jan 2006, 10(1):39-44.
90. CBIR overview: http://en.wikipedia.org/wiki/CBIR. 91. Stanley RJ, Seetharaman S, Long LR, Antani S, Thoma G, Downey E. Image analysis techniques for the
automatic evaluation of subaxial subluxation in cervical spine x-ray images. Proc. Of 17th IEEE Symposium on Computer-Based Medical Systems (CBMS2004), 204-209.
92. Cherukuri M, Stanley RJ, Long R, Antani S, Thoma G. Anterior osteophyte discrimination in lumbar vertebrae using size-invariant features. Comput Med Imaging Graphics 2004;28:99–108.
93. Muneesawang P, Guan L. A neural network approach for learning image similarity in adaptive CBIR. IEEE Fourth Workshop on Multi- media Signal Processing, pp. 257–62, Oct. 3-5, 2001.
94. Breen C, Khan L, Ponnusamy A. Image classification using neural networks and ontologies. The 13th International Workshop on Database and Expert Systems Applications, pp. 98–102, Sept. 2-6, 2002.
67
95. Cox I, Miller M, Minka T, Papathomas T, Yianilos P. The Bayesian image retrieval system, Pichunter: Theory, implementation, and psychophysical experiments. IEEE Transactions on Image Processing, 9:20–37, Jan. 2000.
96. Sia K, King I. Relevance feedback based on parameter estimation of target distribution. International Joint Conference on Neural Networks, 2:1974–9, May 12-17, 2002.
97. Franco A, Lumini A, Maio D. A new approach for relevance feedback through positive and negative samples. Proc. 17th International Conference on Pattern Recognition, 4:23–6, Aug. 2004.
98. Kherfi M, Ziou D, Bernardi A. Learning from negative example in relevance feedback for content-based image retrieval. Proc.16th International Conference on Pattern Recognition, 2: 933–6, Aug. 11-15, 2002.
99. Wang T, Rui Y, Hu S-M. Optimal adaptive learning for image retrieval. IEEE Computer Society Conference on Computer Vision and Pattern Recognition (CVPR). 1:I–1140–7, Dec. 8-14, 2001.
100. Han J, Li M, Zhang H, Guo L. A memorization learning model for image retrieval. International Conference on Image Processing. 3:605–8, Sept. 14-17, 2003.
101. Han J, Ngan K, Li M, Zhang H. Learning semantic concepts from user feedback log for image retrieval. IEEE International Conference on Multimedia and Expo. 2:995–8, June 27-30, 2004.
102. El-Naqa I, Yang Y, Galatsanos N, Nishikawa R, Wernick M. A similarity learning approach to content-based image retrieval: application to digital mammography. IEEE Transactions on Medical Imaging. 23(10)1233–44, October 2004.