technical report and resource estimate on alto … · minerals advisory group, llc 3 uranium energy...
TRANSCRIPT

1 URANIUM ENERGY CORP – Technical Report and Resource Estimate on Alto Paraná Project Date: Aug 11, 2017
TECHNICAL REPORT AND RESOURCE ESTIMATE ON ALTO PARANÁ PROJECT
Alto Paraná Paraguay
PREPARED FOR URANIUM ENERGY CORP
Report for NI 43-101
Final
Qualified Persons:
Martin C. Kuhn, PhD, PE
David M. Brown, P. Geo.
Date: 8/11/17

MINERALS ADVISORY GROUP, LLC
2 Error! No text of specified style in document. – Technical Report and Resource Estimate on Alto Paraná Project Date: Aug 4, 2017
Date and Signature Page Report Control Form Document Title Technical Report and Resource Estimate on Alto Paraná
Project
Client Name & Address
Uranium Energy Corp 500 N Shoreline, Suite 800N Corpus Christi, TX78401
Document Reference
Status & Issue No.
Version
Issue Date 8/11/17
Lead Author
Martin C. Kuhn QP Signed
8/11/17
Geology, Resource, Reserve Author
David M. Brown
QP Signed
8/11/17
Project Director Approval
Martin C. Kuhn
QP Signed 8/11/17
Report Distribution Name No. of Copies
Client
Minerals Advisory Group, LLC 1 (project box)
Minerals Advisory Group, LLC 2524 W. Ruthrauff, STE 4
Tucson, Arizona USA 85705 Tel: (520) 887-7357
office @magintucson.com [email protected]
www.magintucson.com

MINERALS ADVISORY GROUP, LLC
3 URANIUM ENERGY CORP – Technical Report and Resource Estimate on Alto Paraná Project Date: Aug 11, 2017
TABLE OF CONTENTS
PAGE
1 SUMMARY ..................................................................................................................... 7
2 INTRODUCTION .......................................................................................................... 20
3 RELIANCE ON OTHER EXPERTS ............................................................................. 25
4 PROPERTY DESCRIPTION AND LOCATION ............................................................ 25
5 ACCESSIBILITY, CLIMATE, LOCAL RESOURCES, INFRASTRUCTURE AND PHYSIOGRAPHY ........................................................................................................... 36
6 HISTORY ..................................................................................................................... 41
7 GEOLOGICAL SETTING AND MINERALIZATION ..................................................... 41 geological setting ...................................................................................................... 41 Regional Geology ...................................................................................................... 41 Local and property Geology ...................................................................................... 46 Mineralization ............................................................................................................ 53
8 DEPOSIT TYPES ......................................................................................................... 55
9 EXPLORATION ............................................................................................................ 57
10 DRILLING ................................................................................................................... 62
11 SAMPLE PREPARATION, ANALYSES AND SECURITY ......................................... 63
12 DATA VERIFICATION ............................................................................................... 75
13 MINERAL PROCESSING AND METALLURGICAL TESTING .................................. 87 mineral processing .................................................................................................... 87 smelter test work ..................................................................................................... 101
14 MINERAL RESOURCE ESTIMATES ...................................................................... 117
15 MINERAL RESERVE ESTIMATES .......................................................................... 125
16 MINING METHODS ................................................................................................. 126
17 RECOVERY METHODS .......................................................................................... 127
18 PROJECT INFRASTRUCTURE .............................................................................. 128
19 MARKET STUDIES AND CONTRACTS .................................................................. 129
20 ENVIRONMENTAL STUDIES, PERMITTING AND SOCIAL OR COMMUNITY IMPACT ......................................................................................................................... 130
21 CAPITAL AND OPERATING COSTS ...................................................................... 131
22 ECONOMIC ANALYSIS ........................................................................................... 132
23 ADJACENT PROPERTIES ...................................................................................... 133
24 OTHER RELEVANT DATA AND INFORMATION ................................................... 134

MINERALS ADVISORY GROUP, LLC
4 URANIUM ENERGY CORP – Technical Report and Resource Estimate on Alto Paraná Project Date: Aug 11, 2017
transportation .......................................................................................................... 134
25 INTERPRETATION AND CONCLUSIONS .............................................................. 138
26 RECOMMENDATIONS ............................................................................................ 143
27 REFERENCES ......................................................................................................... 145
28 DATE AND SIGNATURE PAGE .............................................................................. 148
ILLUSTRATIONS
LIST OF TABLES
PAGE
Table 1-1 Magnetic Concentrate Comparison-Lab vs. Pilot Plant Results ................... 10 Table 1-2 2017 UEC RESOURCE ESTIMATE ............................................................ 17 Table 1-3 Budget …...……………………………………………………………..……….…19 Table 4-2 CIC Resources Property Coordinates ………………………………………….31 Table 7-1 Stratigraphy of Eastern Paraguay ................................................................. 44 Table 9-1 Exploration Program Summer …………………………………………………59 Table 12-1 Due Diligence Samples Comparison Pit Samples…………………………….77 Table 12-2 Due Diligence Samples ................................................................................. 83 Table 12-3 Particle Size Analysis – Due Diligence Samples .......................................... 84 Table 13-1 Typical Laterite Chemical and Mineralogical Analysis .................................. 88 Table 13-2 Particle Size Analysis .................................................................................... 89 Table 13-3 Magnetic Separation Test Results, 50 KG Sample ....................................... 92 Table 13-4 Pilot Plant Mass Balance – Typical Result ................................................... 97 Table 13-5 Magnetic Concentrate Comparison – Lab vs Pilot Plant Results .................. 98 Table 13-6 Feed Compositions Used in Smelting Modeling ......................................... 102 Table 13-7 Simulation Results ...................................................................................... 103 Table 13-8 Predicted Mass and Energy Balance Summary for 35% TiO2 Concentrate ...................................................................................................................................... 104 Table 13-9 Mass and Energy Balance for 35% TiO2 Concentrate at Various % FeO in Slag ............................................................................................................ 105 Table 13-10 Concentrate Assays for 5 KG Smelting Tests .......................................... 106 Table 13-11Pig Iron Assay Values ………………………………..………………………..109 Table 13-12 Pre-reduced Concentrate Model Results……………………………...........107 Table 14-1 Bulk Density/Specific Gravity Determinations ............................................. 118 Table 14-2 2015 MYNM Resource Estimate ................................................................ 121 Table 14-3 2017 UEC Resource Estimate …………………………………………….......121 Table 24-1 Barge Restrictions on Paraguay and Paraná Rivers .................................. 136 Table 25-1 2017 UEC Resource Estimate ................................................................... 139 Table 25-2 Magnetic Concentrate Comparison – Lab vs Pilot Plant Results ................ 140 Table 26-1 Estimated Budget ……………………………………………………………….143

MINERALS ADVISORY GROUP, LLC
5 URANIUM ENERGY CORP – Technical Report and Resource Estimate on Alto Paraná Project Date: Aug 11, 2017
LIST OF FIGURES PAGE Figure 1-1 Mintek Pilot Plant Smelter Results ................................................................. 11 Figure 1-2 Shrinkage of Paraná Tailings in In-situ Columns ........................................... 12 Figure 1-3 Shrinkage and Drying of Tailings in an Open Pit ........................................... 12 Figure 1-4 Growth of Wheat on Plant Tailings……………………….………………….…..13 Figure 4-1 UEC Organization Chart ………………………………………………………….26 Figure 4-2 Location Map ................................................................................................ .27 Figure 4-3 Map of UEC Concessions .............................................................................. 28 Figure 4-4 UEC Concession by Block …… ……………………………………………..…..33 Figure 4-5 CIC Resources Pilot Plant Area ..................................................................... 34 Figure 7-1 Regional Geology .......................................................................................... 42 Figure 7-2 Mineral Occurrences in Paraguay ................................................................. 43 Figure 7-3 Property Terrain, Drainage & Infrastructure ................................................... 47 Figure 7-4 Property Geology …….……………………………………………………………48 Figure 7-5 Geologic Cross Section Locations ................................................................ 49 Figure 7-6 Transverse Cross Section ............................................................................ 50 Figure 7-7 Logitudinal Cross Section ............................................................................. 51 Figure 7-8 Laterite Profile ................................................................................................ 53 Figure 9-1 Hand Auger Drill for Shallow Sampling ......................................................... 58 Figure 9-2 TiO2 Grade Distribution .................................................................................. 60 Figure 11-1 Typical Deep Pit Sampling ........................................................................... 62 Figure 11-2 Sample Preparation Procedure ................................................................... 64 Figure 12-1 Location of Verification Samples. ................................................................ 76 Figure 12-2 Particle Size Distribution ...................................................................... ..…..86 Figure 12-3 Assays by Size Fraction and Depth ………………………..……………...85-86 Figure 13-1 Micrograph of Panned Heavy Mineral Sample ............................................ 89 Figure 13-2 Typical Concentrate Particle Size Analysis ................................................. 90 Figure 13-3 Ilmenite Head Grade vs Particle Size …………………………………………90 Figure 13-4 Particle Size distribution of Eluted Fines From Cleaned Concentrate ......... 91 Figure 13-5 Laboratory Tailings Thickening Test ............................................................ 93 Figure 13-6 Pilot Plant Mine and Tailings Pond .............................................................. 94 Figure 13-7 CIC Resources Pilot Plant ........................................................................... 95 Figure 13-8 Simplified Block Flow Diagram and Projected Mass Balance ..................... 96 Figure 13-9 Magnetics Products Particle Size Distributuion – Laboratory Results ....... 100 Figure 13-10 Magnetics Products Particle Size Distribution – Pilot Plant Results ........ 100 Figure 13-11 Pilot Plant Smelter Results ...................................................................... 108 Figure 13-12 Slag Tap from Pilot Plant Furnace ........................................................... 108 Figure 13-13 Iron Metal Tap from Pilot Plant Furnace .................................................. 109 Figure 13-14 Slag and Pig Iron Products ...................................................................... 109 Figure 13-15 Expansion of Tails as a Function of Percent Solids Theoretical (Blue) Paraná Tails Samples (Red) ……………………………………………………………….111 Figure 13-16 Expansion as Function of Percent Solids, Theoretical and Paraná Samples ...................................................................................................................................... 111 Figure 13-17 Settling and Shrikage in Test Columns 1-5 ............................................. 112 Figure 13-18 Average Column Settling from Day 161 to Day 800 ................................ 113 Figure 13-19 Shrinkage in Tailings Pond ...................................................................... 114 Figure 14-1 CIC 2015 Polygon Resource Estimate ...................................................... 120 Figure 14-2 UEC 2017 Polygon Resource Estimate ……………………………………..123

MINERALS ADVISORY GROUP, LLC
6 URANIUM ENERGY CORP – Technical Report and Resource Estimate on Alto Paraná Project Date: Aug 11, 2017
Figure 24-1 Draft Limitations on Paraguay and Paraná Rivers ..................................... 135 Figure 25-1 Pilot Plant Smelter Results ........................................................................ 142

MINERALS ADVISORY GROUP, LLC
7 URANIUM ENERGY CORP – Technical Report and Resource Estimate on Alto Paraná Project Date: Aug 11, 2017
1 SUMMARY
INTRODUCTION
Minerals Advisory Group LLC (“MAG”) was retained by Uranium Energy Corp (“UEC”), to
prepare an independent Technical Report and Resource Estimate on the Alto Paraná
project near Ciudad del Este, Paraguay. In concept, the project consists of a proposed
mining operation, beneficiation of the material to produce an ilmenite/titanomagnetite
concentrate and smelting in a DC electric arc furnace to produce a high quality titanium
slag and high quality pig iron products. The titanium slag would be sold as a feedstock for
the production of titanium dioxide pigment. The pig iron would be sold to the iron and steel
industry as a source of high quality iron units for the production of steel or to the foundry
industry for the production of high quality ductile iron castings.
Uranium Energy Corp is a publicly listed company undertaking exploration and
development work for a range of metals and minerals. The Alto Paraná project is a mineral
project located in Eastern Paraguay in Alto Paraná province approximately 100 km north
of Ciudad del Este. On July 10, 2017 UEC exercised its option to acquire all of the issued
and outstanding shares of CIC Resources (Paraguay) Inc. (“CIC”). CIC owns 100% of
Paraguay Resources Inc. (Cayman) which owns and controls Metálicos y No Metálicos
S.R.L. (“MYNM”), the holder of 70,528 has of property (claim blocks) approved for
prospecting and exploration. Additionally, CIC owns 100% of JDL Resources Inc.
(Cayman), which owns 100% of Trier S.A. (Paraguay) (“Trier”). Trier S.A. controls 100%
of the pilot plant and owns 30 has upon which the Alto Paraná project pilot plant resides.
The Alto Paraná resource is atypically high in titanium values when compared to most
beach sand deposits. High iron laterite hosts heavy minerals containing high iron and
titanium values as ilmenite, titanomagnetite and magnetite. Minerals Advisory Group, LLC
of Tucson, Arizona, USA developed processing technology enabling the successful
recovery of the heavy mineral components utilizing known and proven unit processes.
MINERALS ADVISORY GROUP, LLC
8 URANIUM ENERGY CORP – Technical Report and Resource Estimate on Alto Paraná Project Date: Aug 11, 2017
Prior to UEC acquiring rights to Alto Paraná properties, CIC identified mineralized laterite
high in TiO2 extending over 321,980 has in Paraguay. CIC controlled the mineralized area
through their subsidiary MYNM. UEC has acquired MYNM properties and received
Paraguayan Governmental approval to reduce the original land holdings to a total area of
70,498 has.
Previous work on the project included an extensive program of pitting and auger drilling,
development of a test pit for tailings impoundment, construction of a pilot plant to evaluate
the proposed beneficiation flow sheet, tailings handling, sedimentation and remediation,
bench scale smelting tests, and production of approximately 108 tons of concentrate for a
large scale smelting test.
GEOLOGY, MINERALIZATION AND EXPLORATION
Mineralization on the property consists of laterite containing ilmenite, titanomagnetite and
magnetite derived from Early Cretaceous tholeitic basalts of the Paraná Basin and
associated gabbro intrusions. The basalts and gabbros have been weathered to laterite to
an average depth of approximately 7 m over a very extensive area. Kaolinite is the
dominant mineral, representing 60% - 75% of the mineral assemblage. Ilmenite, magnetite
and titanomagnetite are present in the laterite as discrete minerals ranging in particle size
from <40 to 350 µm with average particle sizes in the 135 μm to 165 μm range. The grade
of TiO2 in the laterite ranges up to approximately 11% but is typically in the 5% to 9% TiO2.
UEC proposes to further develop the project to eventually produce high quality titanium
slag for use as feedstock in chloride process titanium dioxide pigment manufacture. A high
quality pig iron co-product will also be produced. The pig iron is used in the manufacture
of high quality ductile iron castings for automotive and machinery applications. Due to an
apparent favorable-negotiated power cost averaging about $0.04/kW-hr from the
Paraguayan Government (Source: CIC), a smelting operation envisions direct ilmenite
feed to electric arc furnaces. Consideration of a pre-reduction roast versus no roast is
recommended at the PEA or PES level of project analysis.

MINERALS ADVISORY GROUP, LLC
9 URANIUM ENERGY CORP – Technical Report and Resource Estimate on Alto Paraná Project Date: Aug 11, 2017
Exploration work on the property was initiated by CIC in 2009 with a program of
widespread hand-dug pits consisting of channel samples at approximate 1 m vertical
intervals. Samples were collected only in the laterite zone, which is the highly leached
and texture lacking clay and iron oxide interval between the base of the soil surface and
the top of the saprolite (decomposed bedrock) zone. The initial phase of pitting and
sampling was followed up by more closely spaced deep pitting and shallow (1 m) auger
drilling in 2010 and 2011. Sample spacing for the pits varies from approximately 1 km x 1
km to more than 4 km. There is only limited deep pit sampling on spacing at less than 1
km x 1 km. In total, 4,432 samples from deep pits and 2,992 1 m auger samples have
been collected and analyzed. Most of the exploration activity was directed to the original
Metálicos y No Metálicos S.R.L. concessions. The purpose of exploration work was to
evaluate the original 321,980 ha project area in order to determine the area(s) of best
grade and thickness. Based on this exploration work, CIC determined to reduce the
original concession area to its current size.
METALLURGY AND PILOT PLANT OPERATIONS
CIC conducted extensive process development work with the objective of a viable process
flow sheet for beneficiation of the heavy minerals from a kaolinite matrix. This work has
included design, construction and operation of a 1.5 t/hour pilot plant in Paraguay. The
process development work was very successful. The pilot plant produced approximately
108 tonnes of concentrate over a three-month period. During the operation of the pilot
plant, significant process improvements were identified and implemented which result in
significant reductions in reagent usage and the capacity to produce tailings at 38-40+%
solids with paste thickener technology. Mass recovery of concentrate in the pilot plant
operation was approximately 16.9% on 8% TiO2 feed grade material, which compared well
with laboratory test work. The concentrate produced during pilot plant operations
demonstrated excellent quality. Table 1-1 illustrates the average results for 84t of
concentrate and a comparison to the laboratory results.

MINERALS ADVISORY GROUP, LLC
10 URANIUM ENERGY CORP – Technical Report and Resource Estimate on Alto Paraná Project Date: Aug 11, 2017
TABLE 1-1: MAGNETIC CONCENTRATE COMPARISON – LABORATORY VS
PILOT PLANT RESULTS (SOURCE: MAG, 2012)
Concentrate Barrels Al2O3 BaO CaO Cr2O3 Fe2O3 K2O MgO MnO Na2O P2O5 SiO2 SrO TiO2 LOI
Number % % % % % % % % % % % % % %
HIMS 90 0.95 0.014 0.017 0.011 50.14 0.005 1.10 0.53 0.031 0.015 1.76 0.002 46.38 2.92
LIMS 94 1.68 0.008 0.015 0.026 67.06 0.003 0.60 0.49 0.031 0.028 0.86 0.003 29.07 1.72
TOTAL 184 1.32 0.011 0.016 0.019 58.78 0.004 0.85 0.51 0.031 0.021 1.30 0.003 37.53 2.31
Laboratory Result, Combined Product
Concentrate Assay
Al2O3 BaO CaO Cr2O3 Fe2O3 K2O MgO MnO Na2O P2O5 SiO2 SrO TiO2 LOI
% % % % % % % % % % % % % %
1.31 0.01 0.04 0.04 59.13 0.01 0.81 0.52 0.02 0.022 1.18 n.r. 36.89 0.01
CIC shipped about 108 tonnes of concentrate in January, 2012 to MINTEK in South Africa
for smelting in a MINTEK pilot plant. This work was completed during the last week of
March, 2012 and was highly successful. The pilot plant operation demonstrated the
following key MINTEK conclusions:
Slag fluidity was excellent and much better than comparable ilmenite feeds;
Slag quality was excellent, with slag assays consistently better than 85%
and often exceeding 90%;
Pig iron quality was excellent, with the Fe assay exceeding 97%;
Energy requirements for both coal and electricity were well within the
calculated requirement; and
Furnace arc stability and heat transfer were excellent and much better than
prior experience with other ilmenite feed stocks.
Figure 1-1 illustrates the evolution of the furnace performance during the course of the
pilot plant test work.

MINERALS ADVISORY GROUP, LLC
11 URANIUM ENERGY CORP – Technical Report and Resource Estimate on Alto Paraná Project Date: Aug 11, 2017
FIGURE 1-1: MINTEK PILOT PLANT SMELTER RESULTS
(SOURCE, MINTEK, 2014)
Graph of TiO2, FeO and MgO concentrations in slag from furnace start up to 2 weeks into a 2 1/2 week pilot DC arc smelter test (Data to 3/27/2011)
TAILINGS STUDY
Continued study and characterization of Alto Paraná plant tails has been reported in a
Minerals Advisory Group report entitled “Report of Investigation Paraná Tailings #2 and
#3”, February 2014 and March 2015. The in-situ tailings columns were placed in the
lateritic ground and filling began on November 2, 2012 with the intent to allow tailings
settling and compaction for an extended period of time in order to ascertain the in-place
volume of tailings after deposition into a tailings impoundment. The decrease in tailings
volume was monitored by measuring the drop-in tailings elevation in the columns and
drilling samples from the columns for percent solids determination. The decrease in
volume shown in Figure 1-2 was determined through shrinkage measurements as a
function of percent solids. Average shrinkage in the columns was measured over a 775
day period and the rate of shrinkage projected to 800 days was compared to shrinkage as
determined from drilling samples from the columns and determining average percent
solids and converting from percent solids to degree of shrinkage. Figure 1-2 gives the
data, the projected shrinkage and measured shrinkage for 664 and 775 days. The
measured shrinkage is shown above the projected line.
Water jacket repair break

MINERALS ADVISORY GROUP, LLC
12 URANIUM ENERGY CORP – Technical Report and Resource Estimate on Alto Paraná Project Date: Aug 11, 2017
FIGURE 1-2 (SOURCE: MAG, 2015)
SHRINKAGE OF PARANÁ TAILINGS IN IN-SITU COLUMNS
Alto Paraná tailings deposited in an open pit and allowed to settle and dewater
demonstrated greater shrinkage than in the column program. Shrinkage in the open pit is
given in Figure 1-3.
FIGURE 1-3 (SOURCE: MAG, 2014)
SHRINKAGE AND DRYING OF TAILINGS IN AN OPEN PIT
R² = 0.9965R² = 0.9965
1.00
1.50
2.00
2.50
3.00
3.50
0 100 200 300 400 500 600 700 800 900
Exp
ansi
on
Tai
ls V
olu
me/
Min
e P
it M
olu
me
Settling Time (Days)Expansion of Equal Wt Tails/Mine Volumes

MINERALS ADVISORY GROUP, LLC
13 URANIUM ENERGY CORP – Technical Report and Resource Estimate on Alto Paraná Project Date: Aug 11, 2017
Apparent from Figure 1-3 is the return of tailings to the pit in layers of 3.5 meters, which
allows shrinkage equal to the volume of material removed from the pit in about 600 days.
These tailings would average about 63% solids and in MAG’s opinion have demonstrated
sustained agricultural production. The reason the layered tails decrease in volume better
than the full column material is due to evaporation, since unlike the in-situ columns the
tailings pond surface is exposed to the sun and wind. In either case the columns and the
experimental tailings impoundment were subjected to water incursion from rain events.
Testing on site of plant tails covered by grub and clear organic rich laterite from stripping
of the mine surface (20-30 cm) has demonstrated crop growth similar to undisturbed
laterite. See Figure 1-4.
FIGURE 1-4
GROWTH OF WHEAT ON PLANT TAILINGS
PROPERTY DESCRIPTION AND LOCATION
The Alto Paraná project is located in eastern Paraguay in the departments of Alto Paraná
and Canindeyu (Figures 4-1 and 4-2). The initial project area covered a total of 321,980
has and was held through CIC’s Paraguayan registered subsidiary Metálicos y No
Metálicos Paraguay S.R.L. The UEC permits are held as and exploration permits and
confer subsurface exploration rights.

MINERALS ADVISORY GROUP, LLC
14 URANIUM ENERGY CORP – Technical Report and Resource Estimate on Alto Paraná Project Date: Aug 11, 2017
The center of the property is located approximately 100 km north of Ciudad del Este.
Ciudad del Este has a population of approximately 300,000 and is the second largest city
in Paraguay. Ciudad del Este is the major commercial center for eastern Paraguay and is
connected to the city of Foz do Iguaçu in Brazil via a bridge crossing the Paraná River.
The Pan-American Highway connects Ciudad del Este to the capital, Asuncion, which is
approximately 300 km to the east.
LAND TENURE
UEC’s mineral properties are held as exploration permits. The coordinates of the individual
ten (10) blocks of property are detailed in Table 4-2. There is sufficient land available
within the Alto Paraná property holdings to provide for a required mine, process plant,
tailings storage, and related infrastructure requirements. All MYNM and Trier properties
are in good standing.
EXISTING INFRASTRUCTURE
Local infrastructure in the area is excellent. A paved national highway leading north from
Ciudad del Este bisects the major portion of the property. The highway is paralleled by
two high voltage lines, one of 66 KV and one of 220 KV, as well as lower voltage electric
power lines. There is a major sub-station located at Itakary, approximately 20 km south of
the current location of the pilot plant. This sub-station connects 220 KV and 66 KV power
lines from the Itaipu Dam. A 500 KV line, the construction of which concluded at the end
of 2013, follows the right-of-way of the 220 KV line. Local access and farm roads provide
a well-developed network of access throughout the property.
Water transport on the Paraná River using barges is available for movement of bulk
commodities from a network of ports located below the Itaipu dam near Ciudad del Este.
This barge system provides for access to ocean ports in Uruguay and Argentina. The
maximum allowable draft is approximately 3.6 m at Encarnaçion. This decreases to
approximately 2.7 m at the ports located near Ciudad del Este. The Paraguay River is
navigable for much of its length and Handysize ocean going vessels (25,000 dwt) are able
to navigate to Asuncion. Barge transport and smaller size vessels are able to transit the
river as far as Puerto Bahia Negra near the Brazilian border.

MINERALS ADVISORY GROUP, LLC
15 URANIUM ENERGY CORP – Technical Report and Resource Estimate on Alto Paraná Project Date: Aug 11, 2017
The Pan-American Highway crosses Paraguay from Ciudad del Este to Asuncion, with
bridge connections to Brazil between Ciudad del Este and Foz de Iguacu and from
Asuncion to Argentina. There is also a road connection between Encarnaçion and
Rosadas in Argentina. The national system of highways is reasonably well developed and
connects the major cities in Paraguay. A rail line connects Asuncion to Buenos Aires
through a crossing from Encarnaçion to Rosadas. The rail line within Paraguay is in a state
of disrepair. International airports are located at Asuncion and Ciudad del Este with direct
connections to Chile, Argentina, Brazil, and Bolivia.
There are a number of small to mid-size towns within the property. Local supplies and
services are available. UEC’s predecessor, CIC, constructed a small pilot plant near the
town of Minga Pora. This plant is connected to the local power grid. A test pit and water
well for process water have been constructed. Local manual labour is generally available
from the surrounding communities, while skilled labour and heavy construction equipment
is sourced from Ciudad del Este. There are two aggregate crushing operations nearby,
which can provide sufficient aggregate for construction purposes.
HISTORY
Prior to CIC’s exploration efforts, no previous exploration for titanium bearing heavy
minerals has been recorded.
GEOLOGY AND MINERALIZATION
Paraguay’s geological framework consists of three cratons ranging in age from 3,800 to
2.7 Ma, composed of gneisses, granulites, and greenstone belts, and surrounded by 950
to 550 Ma old metamorphic rocks broadly referred to as the Brazilian Shield. These rocks
are covered by intra-cratonic red beds of Carboniferous and Permian age, the Coronel
Oveido Formation and Independencia Group (Table 7-1).
The sedimentary rocks of the basin are intruded by two rift related mafic units, the Alto
Paraná Magmatic Suite and the Sapuci Magmatic Suite. Both units intrude as dikes and
sills and outcrop as extrusive rocks along northwest regional structures. The Sapuci Group
is alkali and consists of carbonatites, tephrites, nepheline syenites, shonkonites,
malignites, phonolites, essexites, kimberlites and alkaline trachytes. The Alto Paraná Suite

MINERALS ADVISORY GROUP, LLC
16 URANIUM ENERGY CORP – Technical Report and Resource Estimate on Alto Paraná Project Date: Aug 11, 2017
consists of tholeitic and alkalic basalts and lamprophides. The basalts are of early
Cretaceous age and represent flows derived from the initial opening of the South Atlantic.
Small areas of metamorphosed gabbro sills and dykes that cut the layered basalts are
also present. These are also thought to be of Cretaceous-Jurassic age. Overlying the
basalts and gabbros is a laterite plateau. The plateau is nearly flat with gently rolling
terrain. (Gonzalez Nunez and Cubas Villalba, 2001; Fulfaro, 1996).
All of the higher TiO2 grade occurrences are spatially related and are probably underlain
by gabbro. The gabbro appears to contain more TiO2, Ni, Sr, V and Zr than the basalt.
Residual enrichment occurred at approximately constant volume during breakdown of
silicate minerals from the mafic rocks. Weathering is also critical for TiO2 enrichment. Iron
is progressively leached from ilmenite during weathering. A representative section shows
the following:
0.10 to 0.30 m thick surface lateritic soil with about 20% organic matter and concentration of Fe oxides, mainly magnetite. TiO2 content for this zone is usually high and varies between 4% to 11% TiO2;
5 m to 10 m thick zone of reddish brown laterite comprised predominantly
of kaolin clay with hematite, limonite and SiO2. Typically averages 3% to 11% TiO2 but, in best zones, ±8% TiO2. Fe oxide nodules 1 cm to 3 cm in diameter are commonly found at the base of the main laterite horizon. Kaolinite content varies from 50% to 75%. Small and irregular lenses of bauxite also occur close through this horizon. The water table is typically close to the saporlite/laterite interface; and
1 m to 3 m yellow-red saporlite with lower TiO2, which grades downward
into gabbro and basalts.
EXPLORATION STATUS
The property is classified as an Exploration Property. Additional exploration work will be
required to advance the property to the next stage of development. Blocks A, C and D are
up to date in the fulfilment of their obligations under the Mining Law. Blocks B and E may
be subject to MOPC future requests to move from the exploration stage to an exploitation
stage. (Source-Florio, Cardaozo & Alvarado-August 7, 2017).
MINERAL RESOURCES
MINERALS ADVISORY GROUP, LLC
17 URANIUM ENERGY CORP – Technical Report and Resource Estimate on Alto Paraná Project Date: Aug 11, 2017
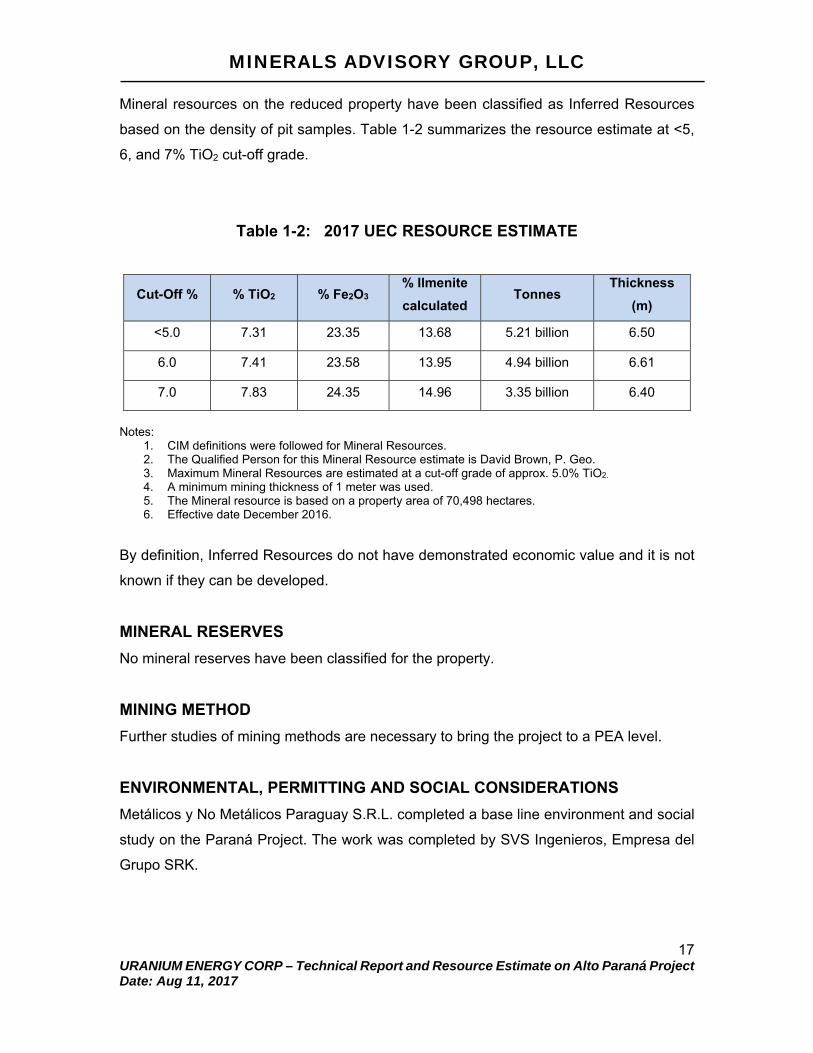
Mineral resources on the reduced property have been classified as Inferred Resources
based on the density of pit samples. Table 1-2 summarizes the resource estimate at <5,
6, and 7% TiO2 cut-off grade.
Table 1-2: 2017 UEC RESOURCE ESTIMATE
Cut-Off % % TiO2 % Fe2O3 % Ilmenite
calculated Tonnes
Thickness
(m)
<5.0 7.31 23.35 13.68 5.21 billion 6.50
6.0 7.41 23.58 13.95 4.94 billion 6.61
7.0 7.83 24.35 14.96 3.35 billion 6.40
Notes:
1. CIM definitions were followed for Mineral Resources. 2. The Qualified Person for this Mineral Resource estimate is David Brown, P. Geo. 3. Maximum Mineral Resources are estimated at a cut-off grade of approx. 5.0% TiO2. 4. A minimum mining thickness of 1 meter was used. 5. The Mineral resource is based on a property area of 70,498 hectares. 6. Effective date December 2016.
By definition, Inferred Resources do not have demonstrated economic value and it is not
known if they can be developed.
MINERAL RESERVES
No mineral reserves have been classified for the property.
MINING METHOD
Further studies of mining methods are necessary to bring the project to a PEA level.
ENVIRONMENTAL, PERMITTING AND SOCIAL CONSIDERATIONS
Metálicos y No Metálicos Paraguay S.R.L. completed a base line environment and social
study on the Paraná Project. The work was completed by SVS Ingenieros, Empresa del
Grupo SRK.

MINERALS ADVISORY GROUP, LLC
18 URANIUM ENERGY CORP – Technical Report and Resource Estimate on Alto Paraná Project Date: Aug 11, 2017
UEC will be required to submit a detailed environmental impact assessment (Evaluación
de Impacto Ambiental) (“EIA”) for the project prior to obtaining a permit for mine
development and construction of the processing and smelting facilities in accordance with
Law 294/93. The EIA must cover all aspects of the project and detail to prevailing
environmental conditions with respect to water, flora and fauna, air, noise, social and other
factors and the expected impacts of the project on the physical and social environment,
as well as any mitigating measures. The EIA must be prepared and submitted to SEAM
by a locally registered and approved environmental consultant. No water or environmental
laws have been passed in 2017 (Source: Victor Fernandez-UEC)
Permits to take water from either underground or surface sources for industrial purposes
will be required in accordance with Law 3239/2007. Hydrogeological studies of the impact
of water withdrawal on the subsurface aquifer and on surface water drainage patterns will
be required. Permits will also be required for discharge of treated water to any receiving
streams and for the disposal of tailings which could release water to the surrounding
surface or subsurface environment. Characterization studies of tailings discharges will be
required. Permits for taking potable water and for sewage disposal will be required under
Law 1614/00.
Law 3239/2007 provides for a setback of 100 meters from the banks of any stream.
Accordingly, mining activity is prohibited within the setback boundaries. Community
consultations and approvals will be required as part of the environmental assessment
process. The current status of such consultations is not known. No definitive mine closure
requirements are contained within the current mining law. Mining companies are required
to post a bond or hold insurance policies in the amount of 5% of the investment to cover
the costs of reclamation.
CONCLUSIONS
The Alto Paraná resource represents a potential large and sustainable business
opportunity for the production of high quality TiO2 slag and pig iron. Due to the apparent
low cost of power, Paraguay could become a major player in the heavy minerals industry.

MINERALS ADVISORY GROUP, LLC
19 URANIUM ENERGY CORP – Technical Report and Resource Estimate on Alto Paraná Project Date: Aug 11, 2017
The Alto Paraná resource appears to be homogeneous and much higher grade than
existing mineral sands deposits. Further work on particle size distribution of the
ilmenite/titanomagnetite fractions and variable laterite bulk density as a function of depth
will help better define the resource.
Metallurgical processing of Alto Paraná materials at the pilot plant in Paraguay
demonstrated successful recovery of +40µ heavy minerals into a combined high and low
intensity magnetic concentrate for large scale electric smelting test work.
Large scale electric arc smelting of Alto Paraná high intensity/low intensity magnetic
concentrate at MINTEK in South Africa demonstrated successful arc furnace production
of 90% TiO2 slag and 97% pig iron.
RECOMMENDATIONS
The following recommendations are made:
In accordance with UEC’s intentions to advance the Alto Paraná project to the next level
of development (economic viability of a proven resource), the following recommendations
are made:
1. Re-start and improve the efficiency of the mothballed pilot plant in order to
increase TiO2 content of the concentrates shipped to the smelter;
2. Conduct infill auger drilling within the Initial Mining Area of CIC-CI in order to
confirm a mineable (proven and probable category) reserve;
3. Acquire a Digital Terrain Model of the IMA in order to assist future ore reserve
estimates and mine/infrastructure planning; and
4. Complete a Preliminary Economic Assessment report, including a revised
resource model incorporating new data acquired as listed above.

MINERALS ADVISORY GROUP, LLC
20 URANIUM ENERGY CORP – Technical Report and Resource Estimate on Alto Paraná Project Date: Aug 11, 2017
2 INTRODUCTION
Minerals Advisory Group has prepared the Technical Report for Uranium Energy Corp as
the issuer of “Technical Report and Resource Estimate on Alto Paraná Project”.
Uranium Energy Corp is a publicly listed company undertaking exploration and
development work for a range of metals and minerals. On July 10, 2017, UEC exercised
its option to acquire all of the issued and outstanding shares of CIC Resources (Paraguay)
Inc. CIC owns 100% of Paraguay Resources Inc. (Cayman) which owns and controls
MYNM S.R.L., the holder of 70,498 has of concessions approved for exploration.
In 2012 CIC added a large TiO2 producer to the development team - Tronox/Exxaro.
Tronox/Exxaro undertook resource and engineering studies on the Alto Paraná project by
agreement with CIC. Tronox/Exxaro selected Hatch Engineering as the engineer of record
for their Key Elements Analysis Report (“KEA”) and used their own geological personnel
to study the resource. MAG is aware of data from the studies, but never fully evaluated
the Hatch KEA and is not able to comment on the work. MAG has included in this
Technical Report portions of the original Hains Engineering internal Technical Report as
well as updated information from the May 4, 2015 CIC Technical Report and Resource
Estimate on the Alto Paraná project. These earlier reports are listed in Item 27,
References.
UEC Personnel
NewFields
Estimate of Cost
TABLE 1-1 RECOMMENDED WORK AND BUDGET FOR PEA
Recommendations
Infill Drilling and XRF Sample Analysis
Proposed Vendor
Particle Size Analysis and XRF Sample Analysis
Digital Terain Model (Initial Mining Area)
MAG and UEC
Selection by UEC
Selection by UEC
Selection by UEC
Selection by UEC
Estimated Total Cost
$ USD
170,000
35,000
25,000
85,000
35,000
65,000
10,000
425,000
Preliminary Economic Assessment (PEA)
Develop a Proposed Mining Plan
Develop Environmental and Social Management Plan
Partial Transportaion Study
MINERALS ADVISORY GROUP, LLC
21 URANIUM ENERGY CORP – Technical Report and Resource Estimate on Alto Paraná Project Date: Aug 11, 2017
The purpose of this Technical Report and Resource Estimate is to provide a resource
estimate based entirely on concessions newly acquired through MYNM and approved by
the Paraguayan Government. In concept, the project consists of a proposed mining
operation, beneficiation of the material to produce an ilmenite/titanomagnetite concentrate
product, pre-reduction of the concentrate in a rotary kiln, and smelting of the reduced
concentrate in a DC electric arc furnace to produce a high quality titanium slag and a high
quality pig iron product. The titanium slag would be sold as a feedstock for the production
of titanium dioxide pigment. The pig iron would be sold to the iron and steel industry as a
source of high quality iron units for the production of steel or to the foundry industry for the
production of high quality ductile iron castings. CIC completed a pilot study to include
mining methods, processing of feed material, production of high grade ilmenite and
titanomagnetite. Concentrates have been tested in South Africa at MINTEC and 85%+
TiO2 slag and +97% pig iron production was demonstrated.
This Technical Report conforms to NI 43-101 Standards of Disclosure for Mineral Projects.
CIC commissioned Minerals Advisory Group Research and Development (“MAG R&D”) to
develop a metallurgical process to recover ilmenite, titanomagnetite and magnetite from
Alto Paraná laterite material. MAG R&D led the research effort and summarized the
process development work in a CIC internal research report entitled “Report of
Investigation 1 and Report of Investigation 2”. Based on the laboratory work, Minerals
Advisory Group personnel Dr. M.C. Kuhn and Kent McGrew designed, built and operated
the pilot facility in Paraguay. See Item 27, References.
SOURCES OF INFORMATION
Early work by CIC and MYNM on the Alto Paraná TiO2 project was carried out under the
direction of CIC and its technical advisors at the time:
Mr. Jorge Fierro, Chief Geologist Mr. J. David Lowell, Chairman Mr. Rob Reeves, Principal, 3R Associates
This report has been prepared by Dr. Martin C. Kuhn, PhD, PE & QP and David Brown,
CPG & QP. Dr. Kuhn is responsible for Item 13 (Mineral Processing and Metallurgical
Testing), Items 1 through 6 and 15 through 27. David Brown is responsible for Items 7
through12 and 14.
MINERALS ADVISORY GROUP, LLC
22 URANIUM ENERGY CORP – Technical Report and Resource Estimate on Alto Paraná Project Date: Aug 11, 2017
Site visits were carried out by:
Martin Kuhn (2009-2013) Dr. Kuhn has visited the property more than 10 times.
The last visit was February 15-23, 2013. Visits to the property began in early 2011
to identify potential staff to man the proposed pilot plant near Minga Pora,
Paraguay. In addition to identifying staff, potential contractors to provide
infrastructure for the green-fields plant site were interviewed. A deep water well
was drilled (280 m) and a 50,000 L fresh water tank was built and installed at site.
Electrical power from a 66 KV line was installed with a transformer to provide power
to the pilot plant and site. During the site preparation period, MAG contracted with
Lyntek in Denver, CO to provide equipment and materials for the pilot plant. In
August of 2011 the pilot plant arrived for installation at site and Martin Kuhn was
on site supervising the construction effort. In 2011 MAG supplied engineers to
assist in construction, ramp-up and operation of the pilot plant. In November and
early December of 2011, Kuhn provided plant supervision in the production of
concentrate for MINTEK. During the periods of September 21-26, 2012, October
13-16, 2012 and October 28-November 6, 2012, Kuhn worked at the pilot plant
supervising installation of plant improvements, the installation and operation of a
paste thickener and filling of the tailings columns. His final visit to the pilot plant
was February 15-22, 2013. During this visit he provided technical input to pilot plant
visitors.
David Brown (January 29-February 4, 2014) The 2014 site visit by Brown was
primarily to observe sampling methods and sample sites, including several of the
deep pits. During this visit he observed and assisted with the collection of samples
from three auger holes, which were analyzed in the field with a Niton portable
spectrometer. The field observation also included five measured sections from
road cuts, using the Niton device. The purpose of these sections was to assess
the vertical variability in Ti and Fe within the lateritic weathering profile.
Additionally, the author visited a quarry to observe the host basalt and measure
primary Ti grades in the field with the Niton. He also visited the pilot plant in order
to inspect the equipment and processes used to concentrate the Ti-bearing
material.

MINERALS ADVISORY GROUP, LLC
23 URANIUM ENERGY CORP – Technical Report and Resource Estimate on Alto Paraná Project Date: Aug 11, 2017
A title opinion has been provided by UEC’s local counsel.
The documentation reviewed, and other sources of information, are listed at the end of
this report in Item 27, References.
LIST OF ABBREVIATIONS
Units of measurement used in this report conform to the Imperial system. All currency in
this report is in US dollars (US$), unless otherwise noted.

MINERALS ADVISORY GROUP, LLC
24 URANIUM ENERGY CORP – Technical Report and Resource Estimate on Alto Paraná Project Date: Aug 11, 2017
Micron km2 square kilometer °C degree Celsius kPa kilopascal °F degree Fahrenheit kVA kilovolt-amperes g Microgram kW kilowatt A Ampere kWh kilowatt-hour a Annum L litre bbl Barrels L/s litres per second Btu British thermal units m meter C$ Canadian dollars M mega (million) cal Calorie m2 square meter cfm cubic feet per minute m3 cubic meter cm Centimeter min minute cm2 square centimeter MASL meters above sea level d Day mm millimeter dia. Diameter mph miles per hour dmt dry metric tonne MVA megavolt-amperes dwt dead-weight ton MW megawatt ft Foot MWh megawatt-hour ft/s foot per second m3/h cubic meters per hour ft2 square foot opt, oz/st ounce per short ton ft3 cubic foot oz Troy ounce (31.1035g) g Gram ppm part per million G giga (billion) psia pound per square inch absolute Gal Imperial gallon psig pound per square inch gauge g/L gram per litre RL relative elevation g/t gram per tonne s second gpm Imperial gallons per minute st short ton gr/ft3 grain per cubic foot stpa short ton per year gr/m3 grain per cubic meter stpd short ton per day hr Hour t metric tonne has Hectares tpa metric tonne per year hp Horsepower tpd metric tonne per day in Inch US$ United States dollar in2 square inch USg United States gallon J Joule USgpm US gallon per minute k kilo (thousand) V volt Kcal Kea
Kilocalorie key element analysis
W Watt
kg Kilogram wmt wet metric tonne km Kilometer yd3 cubic yard km/h kilometer per hour yr year

MINERALS ADVISORY GROUP, LLC
25 URANIUM ENERGY CORP – Technical Report and Resource Estimate on Alto Paraná Project Date: Aug 11, 2017
3 RELIANCE ON OTHER EXPERTS
This report has been prepared by Minerals Advisory Group for UEC. The information,
conclusions, opinions, and projections herein are based on:
Information available to MAG at the time of preparation of this report;
Assumptions, conditions and qualifications as set forth in this report;
Data, reports and other information supplied at one time by CIC and
other third party sources. MAG has relied on UEC and Paraguayan
counsel for an opinion on the reported property status. Documents from
UEC have been forwarded to MAG supporting that all claim blocks are
in good standing. VOUGA Abogados, Paraguayan legal counsel for
CIC and Victor Fernandez (UEC) have all validated Table 4-2; and
Maria Betharram Ardissone of law firm Fiorio, Cardozo and Alvarado.
MAG has relied on UEC for the corporate organization chart given in
Item 4, Table 4-1, Property Description and Location.
For the purpose of this report, MAG has also relied on ownership information provided by
UEC and UEC counsel. MAG has relied on local counsel’s opinion to validate property
status. UEC, through UEC local counsel, affirms that all permits, concessions and claims
are in good standing. MAG has relied upon UEC counsel in Paraguay to supply documents
relating to environmental permit applications.
4 PROPERTY DESCRIPTION AND LOCATION
LOCATION
UEC’s Alto Paraná project is located in eastern Paraguay in the departments of Alto
Paraná and Canindeyu.
The center of the property is located approximately 100 km north of Ciudad del Este.
Ciudad del Este has a population of approximately 300,000 and is the second largest city
in Paraguay. Ciudad del Este is the major commercial center for eastern Paraguay and is
connected to the city of Foz do Iguaçu in Brazil via a bridge crossing the Paraná River.

MINERALS ADVISORY GROUP, LLC
26 URANIUM ENERGY CORP – Technical Report and Resource Estimate on Alto Paraná Project Date: Aug 11, 2017
The Pan-American Highway connects Ciudad del Este to the capital, Asuncion, which is
approximately 300 km to the east.
UEC ORGANIZATION AND STRUCTURE
UEC’s mineral properties are held as exploration permits. The coordinates of the individual
ten (10) blocks of property are detailed in Table 4-2. There is sufficient land available
within the Alto Paraná property holdings to provide for a required mine, process plant,
tailings storage, and related infrastructure requirements. All properties are in good
standing.
UEC is a publicly listed company undertaking exploration and development work for a
range of metals and minerals. The Alto Paraná project is a mineral project located in
Eastern Paraguay in Alto Paraná province approximately 100 km north of Ciudad del Este.
On July 10, 2017 UEC exercised its option to acquire all of the issued and outstanding
shares of CIC Resources (Paraguay) Inc. CIC owns 100% of Paraguay Resources Inc.
(Cayman) which owns and controls Metálicos y No Metálicos S.R.L., the holder of 70,498
has approved for exploration.
UEC owns 100% of CIC Resources Inc. (Paraguay) and through JDL Resources Inc.
(Cayman Islands) owns 99% of Trier S.A. (Paraguay). Trier S.A. controls 100% of the
pilot plant and 30 has of property, fee simple, upon which the Alto Paraná project pilot
plant resides (see Figure 4-1)

MINERALS ADVISORY GROUP, LLC
27 URANIUM ENERGY CORP – Technical Report and Resource Estimate on Alto Paraná Project Date: Aug 11, 2017
Figure 4-1
Uranium Energy Corp. Organization Chart (Source: UEC)
UEC is in process of liquidating Paraguayan entities; Rostock Industrias Mineras S.A.,
Exploradora del Paraguay S. A., Exploractones Almirante Grau and Proyectos Mineros
Paraná S.A. Once these entities have been liquidated, the Cayman entities - PDL
Resources Inc, Paraguay Exploration Inc., Paraguay Minerals Inc. and PEL Minerals Inc.
- will be dissolved. After dissolution, UEC, CIC and MYNM will remain and control 70,498
has of exploration concessions, and JDL Resources Inc. and Trier, S.A. will control the
titanium project pilot plant, and 30 has fee simple land.
MINING LAW IN PARAGUAY
Paraguay has no significant history of mining. Mining activity in Paraguay is governed by
the national constitution under Law 3180/07 (the “Mining Law”) and as amended by
various articles in Laws No. 4269/2011 and 4935/2013. All mineral resources with the
exception of sand and gravel are vested in the State. The Ministry of Public Works and
Communications (“MOPC”) is charged with the responsibility of administrating the Mining

MINERALS ADVISORY GROUP, LLC
28 URANIUM ENERGY CORP – Technical Report and Resource Estimate on Alto Paraná Project Date: Aug 11, 2017
Law and regulating mining activities. The Mining Law does not cover petroleum, petroleum
by-products or other hydrocarbons.
Mineral rights in Paraguay are in three forms: Permiso de Prospección (Prospecting
Permit), Permiso de Exploración (Exploration Permit) and Concesión de Explotación
(Mining Concession). Each type of mining right has specific attributes and obligations.
The exploration land is privately owned and mainly farm land, accessible from main
highways and unpaved farm roads. Prospecting and exploration permits allow UEC to dig
pits, trenches and drill, but it is necessary to obtain the suffrage land owners’ permission
to work on their property. Figures 4-2 and 4-3 show the relative locations of UEC land in
Paraguay and a summary map of 10 approved exploration blocks (UEC Concessions).
Figure: 4-2
Location Map (Source: D. Hains, 2012)

MINERALS ADVISORY GROUP, LLC
29 URANIUM ENERGY CORP – Technical Report and Resource Estimate on Alto Paraná Project Date: Aug 11, 2017
Figure 4-3 Map of UEC Concessions (Source: UEC, 2017)
Prospecting and exploration rights are granted by the State through permits for specified
periods of time. Mining concessions are enacted as specific laws in the national Congress.
Mining concessions have specific attributes with respect to the length of term of the

MINERALS ADVISORY GROUP, LLC
30 URANIUM ENERGY CORP – Technical Report and Resource Estimate on Alto Paraná Project Date: Aug 11, 2017
concession and the associated financial obligations and benefits. All mining rights must
be recorded in the Mining Registry to be valid (not in force yet). The Mining Law (Law
3180/07) was amended by Law No. 4269/11 which was made official on July 15, 2011.
The amendments provide additional flexibility in mineral exploration and development and
incentives for mining companies. Specifically, the amendments to the Mining Law provide
for exemption from local or departmental (provincial) taxes on services provided to the
mining rights holder by sub-contractors, and value added tax free import of all non-locally
produced machinery, vehicles, supplies, tools and materials necessary for the mining
activities during the prospecting and exploration phases.
Exploration, prospecting and mining activities are subject to prior approval of
environmental plans and filing of environmental impact statements and/or environmental
impact assessments with the Secretaria del Ambiente (“SEAM”). The construction and
operation of the pilot plant was approved pursuant to an Environmental Impact
Assessment report and the regulations pertaining to the existing Environmental License
for Exploration.
All prospecting and exploration permits held by MYNM are in good standing. Insurance
policies are in force which requires 10% of investment commitment per year, on all active
prospecting and exploration permit areas. The location of existing, pending, and proposed
concession areas are shown on Figures 4-2 and 4-3. On Figure 4-3, there is a prominent
blank area internal to the proposed final 70,498 has concessions reduction. This internal
area is not part of the proposed resource development block because the identified
resources in this area are consistently below the lower cut-off grade of 6% TiO2. This area
is surrounded by Blocks A, B3 and C2. To the best of the QP’s knowledge (Brown), there
are no known factors or risks which could affect access, title, or the right, or ability to
perform work on the properties shown on Figures 4-2 and 4-3. Block B3 may be subject
to review by MOPOC relative to an extension of the exploration stage. (Source-Florio,
Cardozo & Alvarado).
MINERALS ADVISORY GROUP, LLC
31 URANIUM ENERGY CORP – Technical Report and Resource Estimate on Alto Paraná Project Date: Aug 11, 2017
PROPERTY DIMENSIONS AND LAND STATUS
UEC’s mineral properties are held as exploration permits. The coordinates and status of the individual properties are detailed in Table 4-2.
There is sufficient land available within the Alto Paraná property holdings to provide for all
required mine, process plant, tailings storage, and related infrastructure requirements.
LAND TENURE
Table 4-2 provides a summary of the mineral registration information associated with each
of the areas comprising the Alto Paraná project

MINERALS ADVISORY GROUP, LLC
32 URANIUM ENERGY CORP – Technical Report and Resource Estimate on Alto Paraná Project Date: Aug 11, 2017
Area Approval Expiration Environmental Approval ExpirationCode File Number (ha) N WGS84 E WGS84 Date Date Licence Date Date
1 7260000 720000
2 7254000 720000
3 7254000 717050
4 7245000 717050
5 7245000 707900
6 7249300 707900
7 7249300 705000
8 7258500 705000
9 7258500 710670
10 7260000 710670
11 7260000 715100
12 7256900 715100
13 7256900 711400
14 7254000 711400
15 7254000 713600
16 7255000 713600
17 7255000 718100
18 7258700 718100
19 7258700 719400
20 7260000 719400
1 7310000 710000
2 7308900 710000
3 7308900 712000
4 7303300 712000
5 7303300 710000
6 7292000 710000
7 7292000 706000
8 7308000 706000
9 7308000 706900
10 7310000 706900
1 7288000 720000
2 7276000 720000
3 7276000 717150
4 7270000 717150
5 7270000 720000
6 7263100 720000
7 7263100 717000
8 7267000 717000
9 7267000 713950
10 7276000 713950
11 7276000 715000
12 7284100 715000
13 7284100 713000
14 7288000 713000
1 7270000 710000
2 7265000 710000
3 7265000 715100
4 7260000 715100
5 7260000 709180
6 7261000 709180
7 7261000 707450
8 7263000 707450
9 7263000 706000
10 7270000 706000
MYNM15,155.5
17/15 (1st
extension)
188/17
(reduction)
I7‐i
Registry
Exploration 22/04/2017
In process of granting
extension of exploration
permit pass to
exploitation (pending).
Reduction was approved
by Res. 1891/2016 (31,
Oct, 2016)
22/04/2015
Exploration
B2
Permit Type
I7‐a
Permit Status
1910/13
1891/16
(reduction)
11,685.0
14/02/2017
B1 I7‐a1 8,140.0
Block
31/10/2016
Datum Zone 21JOwnership Vertex
DGCCARN Nr. 1271/15
DGCCARN Nr. 1271/15
B3
14/02/2018
I7‐e3
DGCCARN Nr. 1272/15
1910/13
1891/16
(reduction)
A
MYNM
MYNM
2nd. year of extension of
exploration phase
5,942.0
1910/13
1891/16
(reduction)
26/12/2016
22/04/2017
In process of granting
extension of exploration
permit or pass to
exploitation (pending).
Reduction was approved
by Res. 1891/2016 (31,
Oct, 2016)
31/10/2016
22/04/2015
Exploration
In process of granting
extension of exploration
permit or pass to
exploitation (pending).
Reduction was approved
by Res. 1891/2016 (31,
Oct, 2016)
31/10/2016
MYNM
26/12/2016
Table 4‐2: UEC Property Coordinates; Alto Parana Project (Source UEC)
DGCCARN Nr. 1271/15 22/04/2015 22/04/2017
22/04/2015 22/04/2017
26/12/2016Exploration

MINERALS ADVISORY GROUP, LLC
33 URANIUM ENERGY CORP – Technical Report and Resource Estimate on Alto Paraná Project Date: Aug 11, 2017
1 7308000 706000
2 7300000 706000
3 7300000 702900
4 7304100 702900
5 7304100 702000
6 7308000 702000
1 7272000 706000
2 7264900 706000
3 7264900 705000
4 7261000 705000
5 7261000 703700
6 7258500 703700
7 7258500 705000
8 7250000 705000
9 7250000 700000
10 7266900 700000
11 7266900 703100
12 7272000 703100
1 7278000 722000
2 7276000 722000
3 7276000 720000
4 7278000 720000
1 7266200 730000
2 7260900 730000
3 7260900 721950
4 7254000 721950
5 7254000 720000
6 7266200 720000
1 7266900 700000
2 7263000 700000
3 7263000 697000
4 7260000 697000
5 7260000 692000
6 7266900 692000
1 7259000 700000
2 7250000 700000
3 7250000 691850
4 7255000 691850
5 7255000 697000
6 7259000 697000
70,498.0
E1
5/9/2017
29/08/2018
H7‐h
Exploration
DGCCARN Nr. 623/16 29/08/2016
4,620.0
28/01/2015
29/08/2018
MYNM
28/01/2018
DGCCARN Nr. 623/16 29/08/2016
E2
6,645.5
MYNM
D2
I7‐a4
MYNM
999/14
3rd trimester of the 2nd
year Exploration
29/08/2018
H7‐h
MYNM
Exploration
999/14
3rd trimester of the 2nd
year Exploration
5,275.0
02/12/2015
MYNM
Exploration
02/12/2018
Exploration
27/01/2018
DGCCARN Nr. 624/16
In process of granting
extension of exploration
permit (pending).
Reduction was approved
by Res. 795/2017 (29,
May, 2017)
DGCCARN Nr. 624/16
29/08/2016
Exploration
I7‐e4
106/15;
1404/15
(reduction)
106/15;
1404/15
(reduction)
400.0D1
9,804.0
C1 H7‐m
118/15;
2242/15
(reduction)
2,831.0 MYNM
C2
Exploration
H7‐e3
118/15;
2242/15
(reduction)
DGCCARN Nr. 625/16
In process of granting
extension of exploration
permit (pending).
Reduction was approved
by Res. 795/2017 (29,
May, 2017)
29/07/201829/07/16DGCCARN Nr. 625/16
29/07/2018
5/9/2014 5/9/2017
3rd trimester of the 2nd
year Exploration
3rd trimester of the 2nd
year Exploration
21/08/2015
29/07/16
21/08/2015
21/08/2018
5/9/2014
29/08/2016
29/08/2018

MINERALS ADVISORY GROUP, LLC
34 URANIUM ENERGY CORP – Technical Report and Resource Estimate on Alto Paraná Project Date: Aug 11, 2017
Figure 4-4 shows UEC approved blocks and in the legend indicates the Governmental
block resolution numbers as a function of block area (has) and color. The corresponding
Table 4-2 above enumerates the precise locations by map coordinate corners.
Figure 4-4
UEC concessions by block designations and resolution numbers. (Source: UEC)
All listed resolutions from the Paraguayan Government have been reviewed and
correspond to the relative areas exhibited in Figure 4-4.

MINERALS ADVISORY GROUP, LLC
35 URANIUM ENERGY CORP – Technical Report and Resource Estimate on Alto Paraná Project Date: Aug 11, 2017
There is sufficient land available within the Alto Paraná property holdings to provide for all
required mine, process plant, tailings storage, and related infrastructure requirements.
UEC owns in fee simple (100% Interest) a 30 ha parcel within the UEC exploration permits.
This property is the site of the pilot plant and test pit and is illustrated in Figure 4-5.
FIGURE 4-5: UEC PILOT PLANT AREA
MINERALS ADVISORY GROUP, LLC
36 URANIUM ENERGY CORP – Technical Report and Resource Estimate on Alto Paraná Project Date: Aug 11, 2017
PROJECT PERMITTING
The project will be required to submit a detailed environmental impact assessment
(Evaluación de Impacto Ambiental) (“EIA”) for the project prior to obtaining a permit for
mine development and construction of the processing and smelting facilities in accordance
with Law 294/93. The EIA must cover all aspects of the project and detail to prevailing
environmental conditions with respect to water, flora and fauna, air, noise, social and other
factors and the expected impacts of the project on the physical and social environment,
as well as any mitigating measures. The EIA must be prepared and submitted to SEAM
by a locally registered and approved environmental consultant.
Permits to take water from either underground or surface sources for industrial purposes
will be required in accordance with Law 3239/2007. Hydrogeological studies of the impact
of water withdrawal on the subsurface aquifer and on surface water drainage patterns will
be required. Permits will also be required for discharge of treated water to any receiving
streams and for the disposal of tailings which could release water to the surrounding
surface or subsurface environment. Characterization studies of tailings discharges will be
required.
Permits for taking potable water and for sewage disposal will be required under Law
1614/00.
5 ACCESSIBILITY, CLIMATE, LOCAL RESOURCES, INFRASTRUCTURE AND PHYSIOGRAPHY
ACCESSIBILITY
Paraguay is a small land-locked country covering 406,752 km2. It is bordered by Argentina,
Bolivia and Brazil. The country is separated from Brazil and Argentina on the east and
southeast by the Paraná River and from Argentina on the west by the Pilcomayo River
and Paraguay River. Bolivia borders on the north. The population is approximately 6
million with 57% living in the rural areas and 43% in urban areas. The capital of Paraguay

MINERALS ADVISORY GROUP, LLC
37 URANIUM ENERGY CORP – Technical Report and Resource Estimate on Alto Paraná Project Date: Aug 11, 2017
is Asunçion, a modern city with a population of approximately 2 million. The country has a
modern system of highways and international airports in Asunçion and Ciudad del Este,
the second largest city. The economy is largely based on agriculture, with some light
manufacturing and tourism. Eastern Paraguay, especially the department of Alto Paraná
where the project is located, is intensively farmed. Due to the location of the country
between Argentina and Brazil, smuggling has also been a major activity in the past.
Paraguay is a major exporter of hydroelectric power, with major dams at Itaipu, Acaray
and Yacyreta on the Paraná River. The Itaipu dam is the second largest in the world with
a rated generating capacity of 14,000 MW and supplies approximately 90% of Paraguay’s
power requirements. The Itaipu Dam is located just north of Ciudad del Este and
approximately 80 km south of the center of the property. The Itaipu Dam is a joint operation
between the governments of Paraguay and Brazil. The Yacyreta Dam is located near
Encarnaçion on the Paraná River and has a rated generating capacity of 4,000 MW. It is
a joint operation between the governments of Paraguay and Argentina. The Acaray Dam
is located at Ciudad del Este and has a rated generating capacity of 200 MW. The
availability of abundant, low cost hydroelectric power is one of the major industrial
attractions of Paraguay.
The property is located in the Department of Alto Paraná in eastern Paraguay. The
property covers a very large area extending 127.9 km in a north-south direction and 73.2
km west to east. The pilot plant is located near UTM coordinates 71179E and 7250879 N
(WGS 84, Zone 21 J). Access to the property is provided by a paved highway leading
north from Ciudad del Este and roughly bisecting the property to the town of Cruce
Carolina. Ciudad del Este is located approximately 80 km south of the pilot plant area.
Ciudad del Este is located approximately 300 km east and is connected to the capital,
Asunción, by the Pan-American Highway. The Pan-American Highway connects to Brazil
via a crossing of the Paraná River from Ciudad del Este to Foz de Iguaçu. Foz de Iguaçu,
a city of approximately 320,000, is connected to the port of Santos via a national highway
and railroad. Another crossing to Brazil is also available at the Itaipu Dam. However, this
is not a commercial crossing. A network of good quality local farm roads throughout the
concession areas provides excellent local access to all areas of the property.
The Alto Paraná project elevations are variable and range between 150-380 meters above
sea level.

MINERALS ADVISORY GROUP, LLC
38 URANIUM ENERGY CORP – Technical Report and Resource Estimate on Alto Paraná Project Date: Aug 11, 2017
Asuncion and Ciudad del Este provide international air travel access with connections to
Brazil, Argentina, Chile and Bolivia. The Paraná River is navigable up to the Itaipu Dam
and barge shipping to ports near Ciudad del Este (elevation at airport is 258 m) is available
from ports in Argentina and Uruguay. Shipments to the property can also be made through
Asuncion via the Paraguay River and Rio Plate from Argentina.
CLIMATE
The climate in the project area is classified as semi-tropical. Rainfall averages
approximately 1,800 mm per year, with a peak of approximately 225 mm in November and
a minimum of approximately 50 mm in July. While there is no distinct dry season, the
winter months of June through August do show significantly less rainfall than other months.
Rainfall in the peak months is often in the form of intense downpours. Temperatures are
typically moderate, with peak daytime temperatures experienced during the summer
months of November through March. The maximum temperature in March averages
approximately 280C, with a minimum of approximately 200C. June and July are the coolest
months, with maximum temperatures in the range of 210C to 230C and minimum
temperatures in the range of 110C to 120C. During the pilot plant campaign, weather
conditions allowed drying of tailings material and demonstrated sufficient evaporation to
permit significant evaporation and shrinkage of tailings material.
Neither weather nor climate poses a risk to mine or plant operation. The Paraná laterites
are shallow and can be extracted by back hoe and front-end loader. No blasting of
material is necessary. Heavy rain may slow mining down, however most storm events are
intermittent and mining machinery will likely operate on rock and prepared road surfaces.
LOCAL RESOURCES
The project area is the center of major agricultural activity and is well serviced by local
roads, agricultural and mechanical equipment suppliers and light industry. There are
several small to mid-size towns located along the highway bisecting the property which
can provide local services. Ciudad del Este is the second largest city in Paraguay, with a
population of approximately 300,000. A full range of services including heavy equipment
MINERALS ADVISORY GROUP, LLC
39 URANIUM ENERGY CORP – Technical Report and Resource Estimate on Alto Paraná Project Date: Aug 11, 2017
supply and repair and electrical and mechanical equipment and engineering support is
available in Ciudad del Este.
There is sufficient land available on the property for all necessary mining, beneficiation
and metallurgical operations and plant and equipment.
INFRASTRUCTURE
Local infrastructure in the area is excellent. A paved national highway leading north from
Ciudad del Este bisects the major portion of the property. The highway is paralleled by
two high voltage lines, one of 66 KV and one of 220 KV, as well as lower voltage electric
power lines. There is a major sub-station located at Itakary, approximately 20 km south of
the current location of the pilot plant. This sub-station connects 220 KV and 66 KV power
lines from the Itaipu Dam. A 500 KV line is currently under construction and will follow the
right-of-way of the 220 KV line. Local access and farm roads provide a well-developed
network of access throughout the property.
Water transport on the Paraná River using barges is available for movement of bulk
commodities from a network of ports located below the Itaipu dam near Ciudad del Este.
This barge system provides for access to ocean ports in Uruguay and Argentina. The
maximum allowable draft at low water is approximately 3.6 m at Encarnaçion. This
decreases to approximately 2.7 m at the ports located near Ciudad del Este. The Paraguay
River is navigable for much of its length and Handysize ocean going vessels (25,000 dwt)
are able to navigate to Asuncion. Barge transport and smaller size vessels are able to
transit the river as far as Puerto Bahia Negra near the Brazilian border.
The Pan-American Highway crosses Paraguay from Ciudad del Este to Asunçion, with
bridge connections to Brazil between Ciudad del Este and Foz de Iguacu and from
Asunçion to Argentina. There is also a road connection between Encarnaçion and
Rosadas in Argentina. The national system of highways is reasonably well developed and
connects the major cities in Paraguay. A rail line connects Asunçion to Buenos Aires
through a crossing from Encarnaçion to Rosadas. The rail line within Paraguay is in a state
of disrepair.

MINERALS ADVISORY GROUP, LLC
40 URANIUM ENERGY CORP – Technical Report and Resource Estimate on Alto Paraná Project Date: Aug 11, 2017
International airports are located at Asunçion and Ciudad del Este with direct connections
to Chile, Argentina, Brazil, and Bolivia.
There are a number of small to mid-size towns within the property. Local supplies and
services are available. CIC constructed a small pilot plant near the town of Minga Pora.
This plant is connected to the local power grid. A test mine and water well for process
water have been constructed. Local manual labour is generally available from the
surrounding communities, while skilled labour and heavy construction equipment is
sourced from Ciudad del Este. There are two aggregate crushing operations nearby which
can provide sufficient aggregate for construction purposes. MYNM also maintains an
administrative office in Asunçion. Both the pilot plant and the office have internet
connections.
PHYSIOGRAPHY
The project area is gently rolling farmland with a maximum elevation difference of
approximately 30 m. Drainages are generally west to east leading to the Paraná River.
Drainage valleys are typically wooded. Environmental regulations require farmers to set
aside 10% of the land for tree cover. Similar regulations apply to mining activities.
Stream water in the project area is the property of the Itapúa Dam and mining activity is
limited within 100 m of the stream.

MINERALS ADVISORY GROUP, LLC
41 URANIUM ENERGY CORP – Technical Report and Resource Estimate on Alto Paraná Project Date: Aug 11, 2017
6 HISTORY
There are no records of exploration or historical mining activity in the MYNM permitted
area prior to exploration activities initiated by CIC. UEC purchased the assets of CIC
Resources Inc. (CIC). Limited exploration by Tronox/Exxaro was accomplished during the
KEA study conducted by Hatch under the Tronox/Exxaro CIC joint supervision. MAG has
not presented any of the Tronox/Exxaro exploration data.
7 GEOLOGICAL SETTING AND MINERALIZATION
GEOLOGICAL SETTING
Paraguay has limited information about its mineral wealth and geological setting. There is
no government Geological Survey and information is either private, company generated,
or in scattered scientific reports. The only complete geological map of Paraguay is at
1:1,000,000 scale produced in 1986 by Fulfaro and Avarenga. The metallogenic map of
Paraguay was completed by Caceres and Palmieri in 1986. These geologic and
metallogenic maps summarize the regional work done in Paraguay between 1979 and
1983 by Anshutz Corporation, who staked 64,000 km2 in eastern Paraguay and performed
a reconnaissance exploration program of mapping, Landsat image analysis and
radiometric and magnetic airborne surveys. Anshutz Corporation left Paraguay in 1987.
Figures 7.1 and 7.2 show the geology and mineral occurrences of eastern Paraguay. The
only current active metal mine in Paraguay is the Paso Yobai project owned by Latin
American Minerals, although other properties are under active exploration. The only other
active mining activity is in quarries for supply of aggregate.
A program, sponsored by the German government, exists to map Paraguay at 1:100,000
scale but only 4 sheets of 79 have been completed.
REGIONAL GEOLOGY
Paraguay’s geological framework consists of three cratons ranging in age from 3,800 to
2.7 Ma, composed of gneisses, granulites, and greenstone belts, and surrounded by 950
MINERALS ADVISORY GROUP, LLC
42 URANIUM ENERGY CORP – Technical Report and Resource Estimate on Alto Paraná Project Date: Aug 11, 2017
– 550 Ma old metamorphic rocks broadly referred to as the Brazilian Shield. These rocks
are covered by intra-cratonic red beds of Carboniferous and Permian age, the Coronel
Oveido Formation and Independencia Group (Table 7-1). The geologic evolution of
Paraguay to this time was related to the Gondwana Super Continent, which consisted of
Africa, Australia and South America.
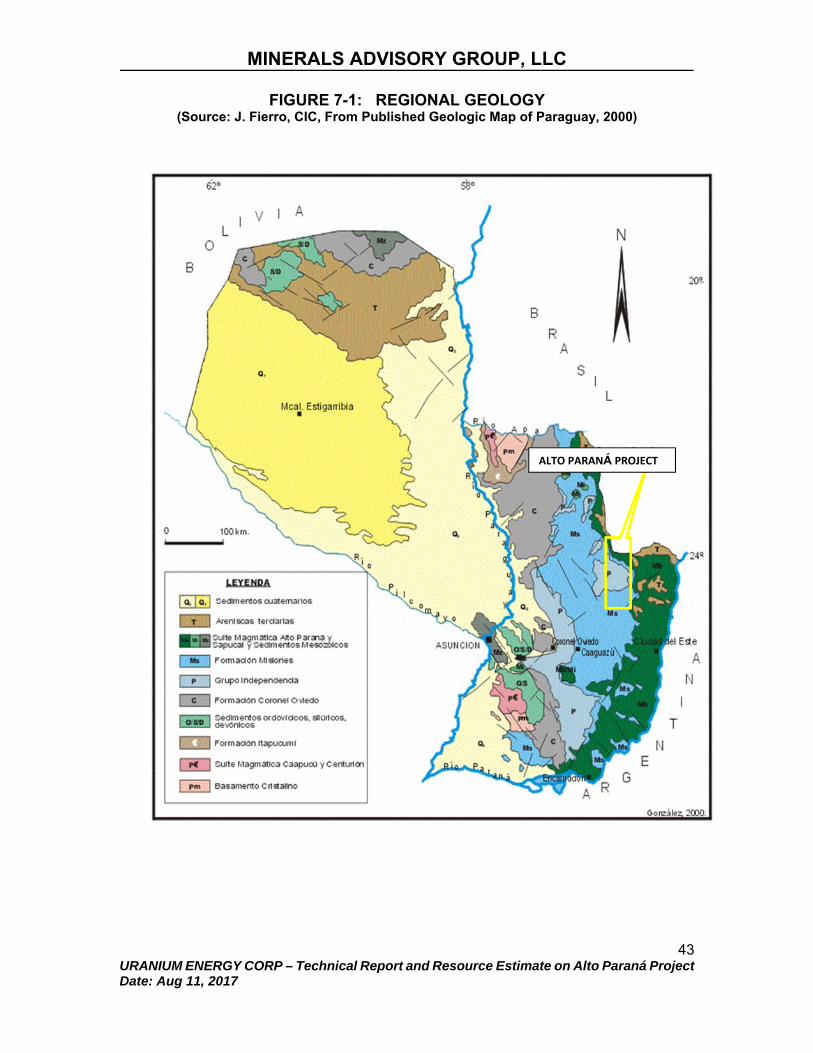
MINERALS ADVISORY GROUP, LLC
43 URANIUM ENERGY CORP – Technical Report and Resource Estimate on Alto Paraná Project Date: Aug 11, 2017
FIGURE 7-1: REGIONAL GEOLOGY (Source: J. Fierro, CIC, From Published Geologic Map of Paraguay, 2000)
ALTO PARANÁ PROJECT

MINERALS ADVISORY GROUP, LLC
44 URANIUM ENERGY CORP – Technical Report and Resource Estimate on Alto Paraná Project Date: Aug 11, 2017
FIGURE 7-2: MINERAL OCCURRENCES IN PARAGUAY (Source: J. Fierro, CIC from Latin American Minerals Technical Report, 2009)
ALTO PARANÁ
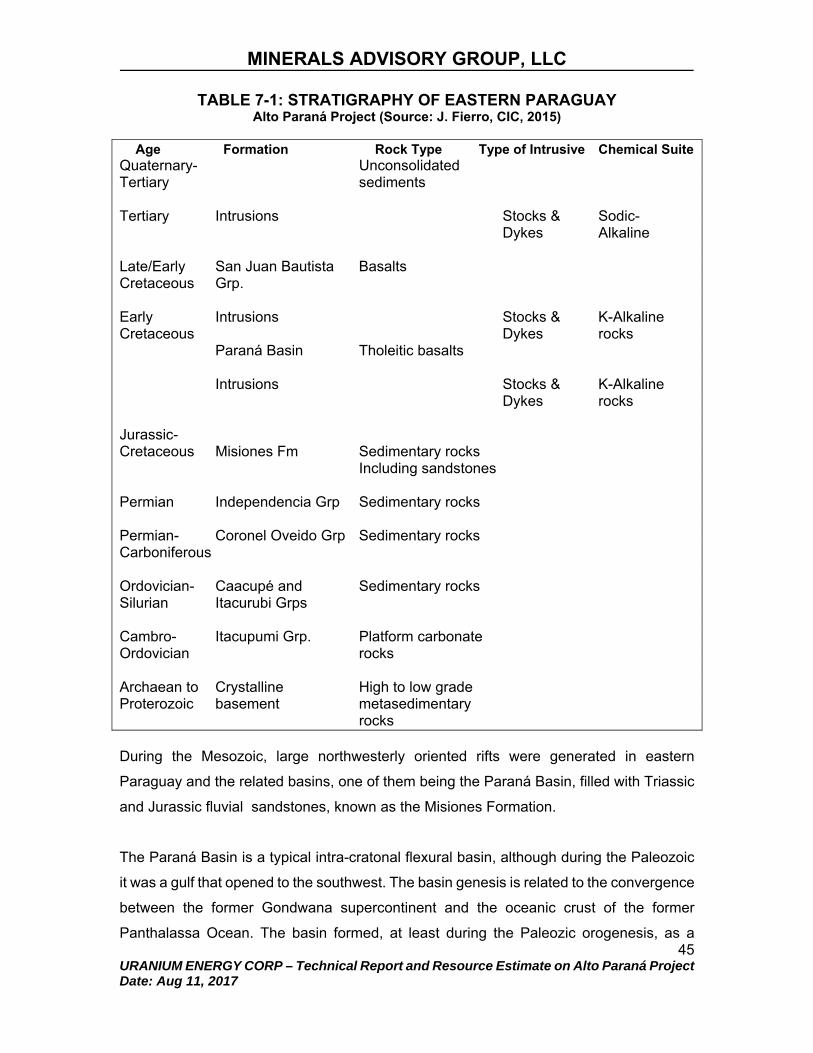
MINERALS ADVISORY GROUP, LLC
45 URANIUM ENERGY CORP – Technical Report and Resource Estimate on Alto Paraná Project Date: Aug 11, 2017
TABLE 7-1: STRATIGRAPHY OF EASTERN PARAGUAY Alto Paraná Project (Source: J. Fierro, CIC, 2015)
Age Formation Rock Type Type of Intrusive Chemical Suite Quaternary- Unconsolidated Tertiary sediments Tertiary Intrusions Stocks & Sodic- Dykes Alkaline Late/Early San Juan Bautista Basalts Cretaceous Grp. Early Intrusions Stocks & K-Alkaline Cretaceous Dykes rocks Paraná Basin Tholeitic basalts Intrusions Stocks & K-Alkaline Dykes rocks Jurassic- Cretaceous Misiones Fm Sedimentary rocks Including sandstones Permian Independencia Grp Sedimentary rocks Permian- Coronel Oveido Grp Sedimentary rocks Carboniferous Ordovician- Caacupé and Sedimentary rocks Silurian Itacurubi Grps Cambro- Itacupumi Grp. Platform carbonate Ordovician rocks Archaean to Crystalline High to low grade Proterozoic basement metasedimentary rocks During the Mesozoic, large northwesterly oriented rifts were generated in eastern
Paraguay and the related basins, one of them being the Paraná Basin, filled with Triassic
and Jurassic fluvial sandstones, known as the Misiones Formation.
The Paraná Basin is a typical intra-cratonal flexural basin, although during the Paleozoic
it was a gulf that opened to the southwest. The basin genesis is related to the convergence
between the former Gondwana supercontinent and the oceanic crust of the former
Panthalassa Ocean. The basin formed, at least during the Paleozic orogenesis, as a

MINERALS ADVISORY GROUP, LLC
46 URANIUM ENERGY CORP – Technical Report and Resource Estimate on Alto Paraná Project Date: Aug 11, 2017
foreland basin. The present Paraná River, which forms the eastern boundary of Paraguay,
flows along the central axis of the Paraná Basin and drains the modern basin.
The sedimentary rocks of the basin are intruded by two rift related mafic units, the Alto
Paraná Magmatic Suite and the Sapuci Magmatic Suite. Both units intrude the older
sedimentary rocks as dykes and sills and also occur as extrusive rocks along northwest
regional structures. The Sapucai Group is alkali and consists of carbonatites, tephrites,
nepheline syenites, shonkonites, malignites, phonolites, essexites, kimberlites and
alkaline trachytes. The Alto Paraná Suite consists of tholeitic basalts and lamprophides.
The basalts are of early Cretaceous age and represent flows derived from the initial
opening of the South Atlantic. Small areas of metamorphosed gabbro sills and dykes that
cut the layered basalts are also present. These are also thought to be of Cretaceous-
Jurassic age. Overlying the basalts and gabbros is a laterite plateau. The plateau is nearly
flat with gently rolling terrain. (Gonzalez Nunez and Cubas Villalba, 2001; Fulfaro, 1996).
LOCAL AND PROPERTY GEOLOGY
The underlying rocks on the property are primarily tholeiitic basalts belonging to the Alto
Paraná Formation. The basalts are cut by dykes and sills of gabbro. These rocks have
been subject to extensive weathering and a laterite cover has developed. The laterite is
very homogeneously distributed throughout the property. Laterite thickness ranges from
approximately 2 m to over 10 m, and averages approximately 7 m. Fresh gabbro and
basalts crop out at the base of the creeks where the laterite profile has been eroded.
The basalts are dense and fine grained with quartz-filled amygdules near flow tops.
Analysis of the basalt in the field with a Niton portable spectrometer shows the primary
TiO2 content is variable, ranging from about 1% – 4% in a quarry near the pilot plant. This
indicates that the Ti-bearing ilmenite was concentrated and re-distributed during the
laterization process because measured laterite TiO2 grades are on the order of two times
the primary grade in the basalts.
Figures 7-3 and 7-4 show the surface topography, hydrography, and geology of the UEC
concessions. Shown for reference on both figures are the outline of the UEC concessions
and the location of auger holes used for the resource calculation. The dendritic drainage

MINERALS ADVISORY GROUP, LLC
47 URANIUM ENERGY CORP – Technical Report and Resource Estimate on Alto Paraná Project Date: Aug 11, 2017
patterns shown on Figure 7-3 are typical of easily erodible material in an uplifted plateau
region such as Alto Paraná.
Figure 7-5 is a more detailed view of the southern part of the property, encompassing the
area where the majority of sampling and pilot studies have been concentrated to date. The
locations of two geological cross sections are shown on this figure: A-A’ (a transverse
east-west oriented section) and B-B’ (a generally longitudinal section oriented northeast-
southwest). These two cross sections are shown in profile view as Figures 7-5 and 7-6.
The nature of the Ti-bearing laterite mineralization is a broad, nearly continuous tabular
body with a total known extent covering approximately 90 km x 50 km and varying in
thickness from an average of 4 to 10 meters (Figure 7-5 and Figure 7-6). The underlying
saprolite layer is generally no more than 1 – 3 meters thick and the saprolite grades
abruptly into fresh basalt. A younger and less weathered analogue for the Paraná laterites
are the Columbia River flood basalts in the northwest U.S, which are very similar in origin
to the Ti-bearing Paraná basalts, except for the deeply weathered lateritic character of the
Paraná lavas. The Columbia River basalt flows display sheeted horizontal layers with
columnar jointing, and they typically consist of multiple flow units. Individual flow units can
be up to 50 meters thick and extend for hundreds of kilometers. This is essentially the
physical character of the Paraná Ti mineralization. The only significant deviations from a
flat tabular shape are gentle undulations or “pinch and swell” features which could be due
to eruption over pre-existing topography or to differential compaction during laterite
formation.

MINERALS ADVISORY GROUP, LLC
48 URANIUM ENERGY CORP – Technical Report and Resource Estimate on Alto Paraná Project Date: Aug 11, 2017
Figure 7-3: PROPERTY TERRAIN, DRAINAGE, AND INFRASTRUCTURE
(Source: D. Brown, From CIC data 2015)
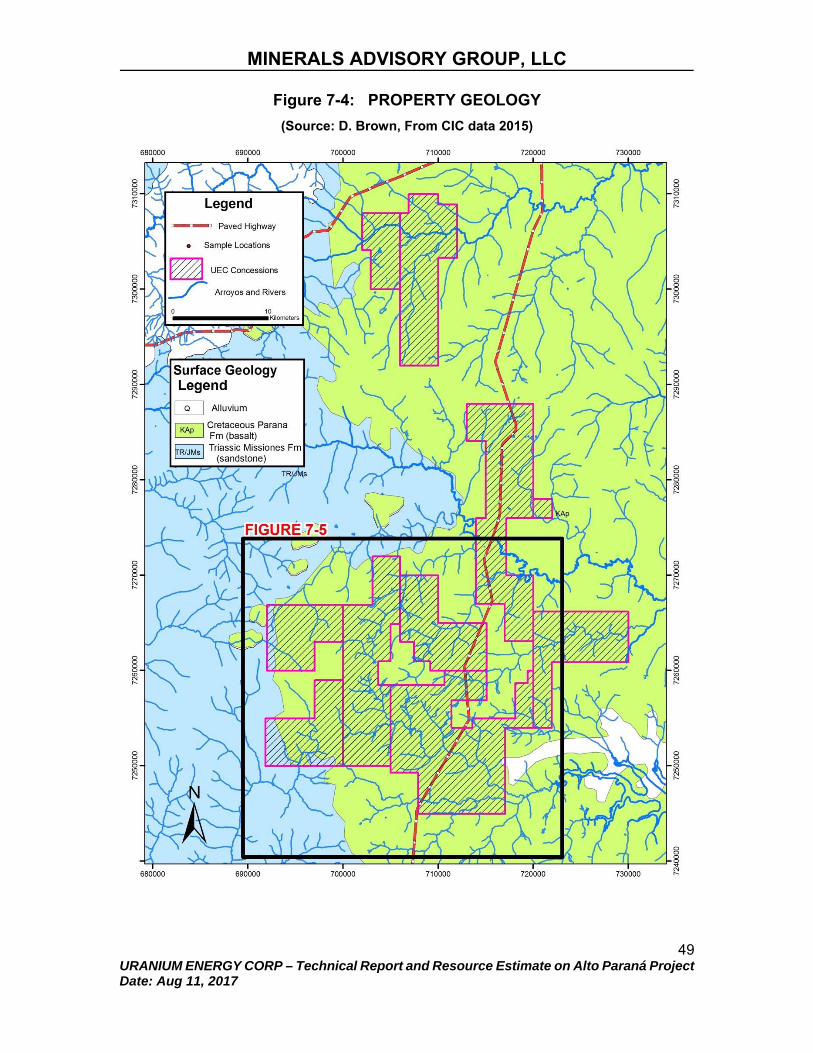
MINERALS ADVISORY GROUP, LLC
49 URANIUM ENERGY CORP – Technical Report and Resource Estimate on Alto Paraná Project Date: Aug 11, 2017
Figure 7-4: PROPERTY GEOLOGY
(Source: D. Brown, From CIC data 2015)

MINERALS ADVISORY GROUP, LLC
50 URANIUM ENERGY CORP – Technical Report and Resource Estimate on Alto Paraná Project Date: Aug 11, 2017
Figure 7-5: GEOLOGIC CROSS SECTION LOCATIONS
(Source: D. Brown, From CIC data 2015)

MINERALS ADVISORY GROUP, LLC
51 URANIUM ENERGY CORP – Technical Report and Resource Estimate on Alto Paraná Project Date: Aug 11, 2017
FIGURE 7-6 (SOURCE: D. BROWN, 2016)
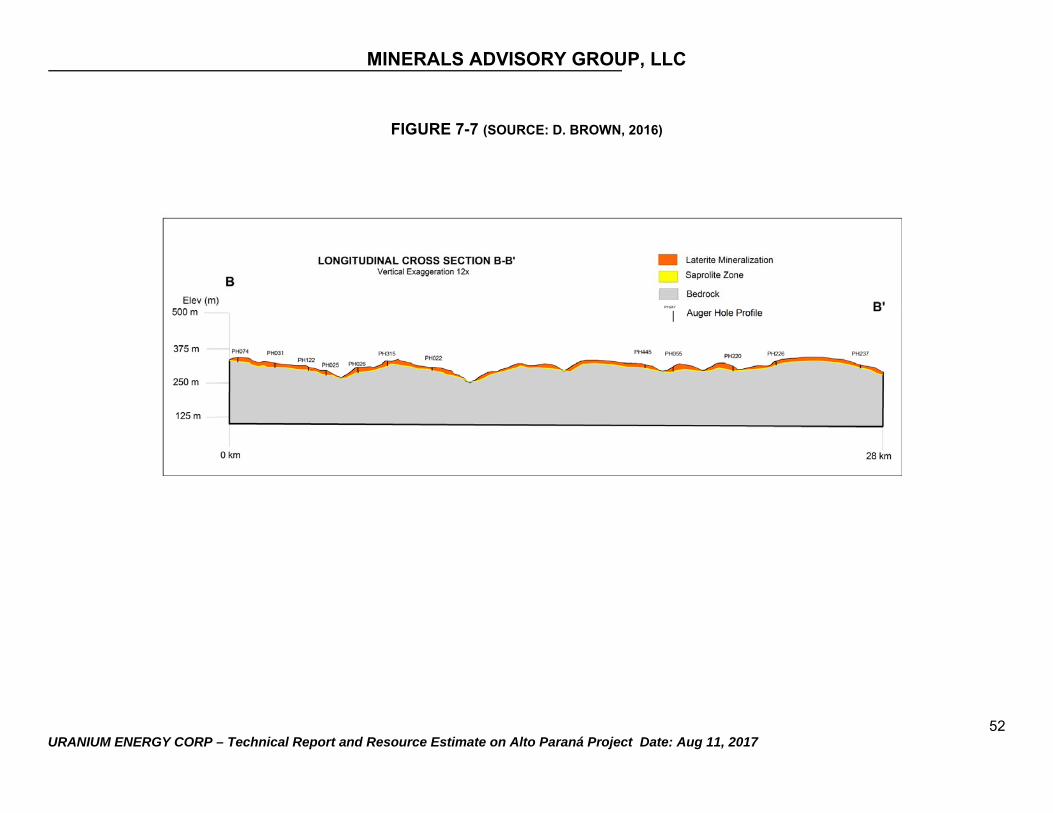
MINERALS ADVISORY GROUP, LLC
52 URANIUM ENERGY CORP – Technical Report and Resource Estimate on Alto Paraná Project Date: Aug 11, 2017
FIGURE 7-7 (SOURCE: D. BROWN, 2016)

MINERALS ADVISORY GROUP, LLC
53 URANIUM ENERGY CORP – Technical Report and Resource Estimate on Alto Paraná Project Date: Aug 11, 2017
MINERALIZATION
The horizontal mineralized zones shown in cross section (Figures 7-6 and 7-7) represent
lateritized basalt and gabbro with disseminated ilmenite and magnetite. The character and
delineation of these zones is discussed in more detail in Item 9 of this report (Exploration).
The grades shown on the profiles were determined from conventional laboratory analysis
of hand dug pits averaging between 2 – 10 meters in depth.
Most of the higher TiO2 grade occurrences are spatially contiguous and are probably
underlain by gabbro. The gabbro appears to contain more TiO2, Ni, Sr, V, and Zr than the
basalt. Residual enrichment occurred at approximately constant volume during breakdown
of silicate minerals from the mafic rocks. Weathering is also critical for TiO2 enrichment.
Iron is progressively leached from ilmenite during weathering.
Figure 7-8 depicts a typical vertical weathering profile for the laterite. Commonly
identifiable zones include the following:
0.10 – 0.30 m thick surface lateritic soil with about 20% organic matter and concentration of Fe oxides, mainly magnetite. TiO2 content for this zone is usually high and varies between 4% – 11% TiO2;
5 m – 10 m thick zone of reddish brown laterite comprised predominately
of kaolin clay with hematite, limonite and SiO2. Typically averages 3% - 11% TiO2 but in best zones ±8% TiO2. Fe oxide nodules 1 cm – 3 cm in diameter are commonly found at the base of the main laterite horizon. Kaolinite content varies from 50% - 75%. Small and irregular lenses of bauxite also occur within this basal horizon, due to leaching and downward transport of aluminous minerals higher in the profile. The water table is typically close to the saprolite/laterite interface; and
1 m – 3 m yellow-red saprolite with lower TiO2 which grades downward into
gabbro and basalts.

MINERALS ADVISORY GROUP, LLC
54 URANIUM ENERGY CORP – Technical Report and Resource Estimate on Alto Paraná Project Date: Aug 11, 2017
FIGURE 7-8: LATERITE PROFILE (Source: J. Fierro, CIC, 2009)
0.0 m
5.0 m
10.0 m
15.0 m
20.0 m
Lateritic soil with 20% organic material and Fe oxides
Reddish brown laterite (kaolinite clay with hematite, limonite, ilmenite), 5-10 meter thick and 3 - 11 %TiO2
Fe oxides nodules 1 - 3 cm in diameter with sparse, irregular and small bauxite lenses and quartz fragments.
1 - 3 meters of yellow red saprolite with lower TiO2 which grades downward into gabro and basalts.
Layered basalt flows cut by microgabro, gabro sills and dikes

MINERALS ADVISORY GROUP, LLC
55 URANIUM ENERGY CORP – Technical Report and Resource Estimate on Alto Paraná Project Date: Aug 11, 2017
8 DEPOSIT TYPES
Alto Paraná is provisionally classified as a lateritic ilmenite-titanomagnetite deposit. This
type of deposit is an unusual and previously unknown (or non-published) source of
titanium. The geological development of an economic laterite deposit requires a prolonged
period of tropical weathering, good drainage, a relatively slow rate of erosion, and a source
rock with significant heavy mineral accessories such as ilmenite or magnetite. These
conditions have prevailed in the Paraná Basin since at least Late Cretaceous times and
have resulted in the accumulation of substantially enriched concentrations of heavy
minerals (in this case Ti as ilmenite) over eons of time.
The most closely related analogues to known deposit types are laterite deposits of bauxite
and iron, which are typically characterized by relatively thin but horizontally extensive
mineralization. Lateral grade continuity is typically broad in scale, sometimes measured
over distances of kilometers or even tens of kilometers. The fundamental process of
laterite development in a tropical humid environment is fairly straightforward, although the
exact physiochemical processes and time frames involved are less well understood and
are topics of ongoing scientific investigation. Silicate minerals in bedrock including quartz
and feldspar are dissolved and removed over time, while chemically and mechanically
resistant oxides such as ilmenite remain behind. Over time the original rock is reduced to
a smaller volume consisting mainly of clays, fine grained iron oxides, and various residual
heavy minerals. The heavy minerals are, by their magnetic and specific gravity properties,
separable using metallurgical methods.
To the best of the QP’s knowledge, the Alto Paraná mineralization is unique. There are no
known titanium deposits of this type that Alto Paraná can be compared with and no iron-
titanium deposits of this geological type are in production elsewhere in the world. The
world’s largest titanium deposits are almost exclusively of a type known as heavy mineral
beach placer deposits. Of the six largest deposits currently in production or under
development, five are beach placer deposits located in Africa and the sixth is a hardrock
anorthosite mine in Quebec Canada (Reeves and Kuhn, 2016). Compared with other

MINERALS ADVISORY GROUP, LLC
56 URANIUM ENERGY CORP – Technical Report and Resource Estimate on Alto Paraná Project Date: Aug 11, 2017
world class titanium deposits, the Alto Paraná estimated resource is reported to be an
order of magnitude larger than any of these deposits in terms of total tonnage and
recoverable Ti as ilmenite (Reeves and Kuhn, 2016).

MINERALS ADVISORY GROUP, LLC
57 URANIUM ENERGY CORP – Technical Report and Resource Estimate on Alto Paraná Project Date: Aug 11, 2017
9 EXPLORATION
SUMMARY OF SAMPLING PROGRAMS
No new exploration has been proposed or conducted on the Alto Paraná property by UEC
subsequent to acquisition and consolidation of the property in 2016. Exploration results
presented in this section are based on baseline exploration studies conducted by CI over
a five-year period (2009 – 2013). These results were thoroughly documented in the 2015
43-101 technical report for CIC, and have been accepted and certified by the QP for the
current report based on a non-biased and professional examination of data from the
original exploration work.
Initial exploration work by CIC stemmed from a regional bauxite reconnaissance program
in 2008. During the course of this work it was found that there was a TiO2 soil anomaly
and the focus of the exploration work changed to titanium resource potential based on this
un-anticipated result. Systematic exploration of the property for titanium mineralization
began in 2009 with very widely spaced (up to 4 km apart) shallow and deep pit sampling.
The primary purpose of the 2009 exploration program was to define the limits of the TiO2
anomaly and to test for higher grade zones. Shallow pit samples were collected at a depth
of one meter, while deep pit samples were collected over each meter interval from the
surface to the pit bottom, which in most cases was at the laterite/saprolite interface. This
work was successful in defining a wide area of anomalous TiO2 and in defining some
higher grade areas (Figure 9-2). The grade contours shown on this map were determined
from the assays of 555 deep pits and 485 shallow pits excavated through 2011 (Table 9-
1). The primary purpose of this wide-spaced pit sampling was to determine the lateral
limits of potential economic mineralization in order to determine which ground should be
protected with long-term mineral concessions.
Similar exploration continued in 2010 with sampling concentrated in higher grade areas.
Spacing of hand-dug pits was reduced to an average of 1 – 2 km and some infill sampling
was done at 500 m x 1,000 m. Samples were assayed at ALS Chemex in Lima using XRF.
Samples were also collected for laboratory metallurgical test work.

MINERALS ADVISORY GROUP, LLC
58 URANIUM ENERGY CORP – Technical Report and Resource Estimate on Alto Paraná Project Date: Aug 11, 2017
Exploration work in 2011 was focused on in-fill shallow auger sampling in higher grade
zones, predominantly within the 36,000 hectares area of the MYNM concessions block.
The MYNM area was selected for closer spaced sampling based on wide-spaced shallow
sampling results in 2009 and 2010, but also because of favorable lease terms available at
that time with farmers adjacent to the pilot plant site. Portable XRF readings of samples
using a Niton XL3p instrument were taken in the field as a check against the laboratory
assays. Table 9-1 summarizes the various exploration programs.
SAMPLE METHODS AND DESCRIPTION
Auger sampling was done using either a hand auger or a two-person hand-held power
auger. This type of auger allows the collection of high quality samples of about 30 cm
length (the length of the collection cup). All deep auger samples are at 900 azimuth and
extend to the laterite/saprolite interface, typically 7m – 8m depth. Figure 9-1 illustrates the
hand auger used for the shallow (1 m) sampling.

MINERALS ADVISORY GROUP, LLC
59 URANIUM ENERGY CORP – Technical Report and Resource Estimate on Alto Paraná Project Date: Aug 11, 2017
FIGURE 9-1: HAND AUGER DRILL FOR SHALLOW SAMPLES PARANÁ PROJECT (SOURCE: CIC, 2011)
For shallow auger holes, material from the last 30 cm of the hole is collected and placed
in a plastic bag which is sealed and labeled. To avoid contamination, the upper vegetation
and organic rich soil zone is first cleared off with a shovel before the hole is started. A
Niton spectrometer reading is taken from the bagged material before the sample is sent
to ALS Chemex for analysis by multi-element XRF. For the deep auger holes, the same
procedure is followed, with a 30 cm sample collected at the end of each one meter run.
For the hand dug pits, channel samples are carved from one side of the pit over one meter
widths, starting from the bottom and working to the top in order to avoid contamination. At
the surface the material hauled up from each one meter channel is mixed and quartered
on a tarp. One quarter of the laterite material is placed in a plastic bag and a Niton reading
is recorded as a back-up analysis.

MINERALS ADVISORY GROUP, LLC
60 URANIUM ENERGY CORP – Technical Report and Resource Estimate on Alto Paraná Project Date: Aug 11, 2017
It is the author’s opinion that the sampling techniques used for both the deep pits and the
auger holes were representative of surrounding mineralized laterite material. The auger
samples and pit wall channels were free from contamination and do not contain any known
bias. In fact, samples of this nature are probably superior to conventional drilling which is
subject to caving and loss of fines due to air or water pressure. To the best of the author’s
knowledge, industry standards were properly followed throughout the project regarding
the collection, chain of custody, and handling of all samples.
TABLE 9-1: EXPLORATION PROGRAM SUMMARY Alto Paraná Project (Source: J. Mejia, CIC, 2015)
Year Deep Pits No. Samples Gasoline Auger No. samples S Series 1m Pits T Series 1m Hand Auger2009 186 1486 466
2010 332 2664
2011 37 281 19 2262
2012 132 1107
2013 3 30
Total 558 4461 132 1107 485 2262
Deep Samples Shallow Samples
Assay results were compiled to develop contour maps showing TiO2 and Fe2O3 grade
distributions across the property. The results are illustrated in Figures 9-2, 9-3 and 9-4.

MINERALS ADVISORY GROUP, LLC
61 URANIUM ENERGY CORP – Technical Report and Resource Estimate on Alto Paraná Project Date: Aug 11, 2017
FIGURE 9-2: TIO2 GRADE DISTRIBUTION Alto Paraná Project (Source: J. Fierro / D. Brown, 2015)

MINERALS ADVISORY GROUP, LLC
62 URANIUM ENERGY CORP – Technical Report and Resource Estimate on Alto Paraná Project Date: Aug 11, 2017
DISCUSSION AND INTERPRETATION
Exploration work available as of the date of this report has delineated an extremely large
and thoroughly documented volume of Ti-bearing lateritic material. CIC sampling and due
diligence verification demonstrate very consistent TiO2 and Fe2O3 grades, based upon
observed surface trends and statistical comparisons. The indicated average TiO2 grades
of 7 - 9 % are generally higher than most "conventional" titanium deposits currently in
production. The QP’s opinion is that the sampling methods and procedures utilized in the
resource evaluation are not only acceptable but well suited to the physical nature of the
lateritic mineralization.
The geochemical exploration results from the Alto Paraná Project, summarized in Figure
9-2, represent relatively deep sampling as opposed to conventional surface rock or soil
surveys, which generally penetrate no more than a few centimeters beneath the regolith
surface. As such the CIC samples penetrate most or all of the potential mineralized
material. The objective of the CIC sampling was to identify areas of higher grade/thickness
for more detailed resource evaluation in smaller areas, as opposed to identification of "drill
targets" per se. In this sense, the higher grade TiO2 areas shown on Figure 9-2 should not
be considered as "anomalies", but rather as indicated areas of higher grade resource
potential, as presented in Item 14 of this report.
10 DRILLING
No conventional exploration drilling such as diamond coring or air reverse circulation has
been conducted on the project. The only type of drilling done on the property is shallow
auger boring. A description of this method is summarized in Item 9 of this report.
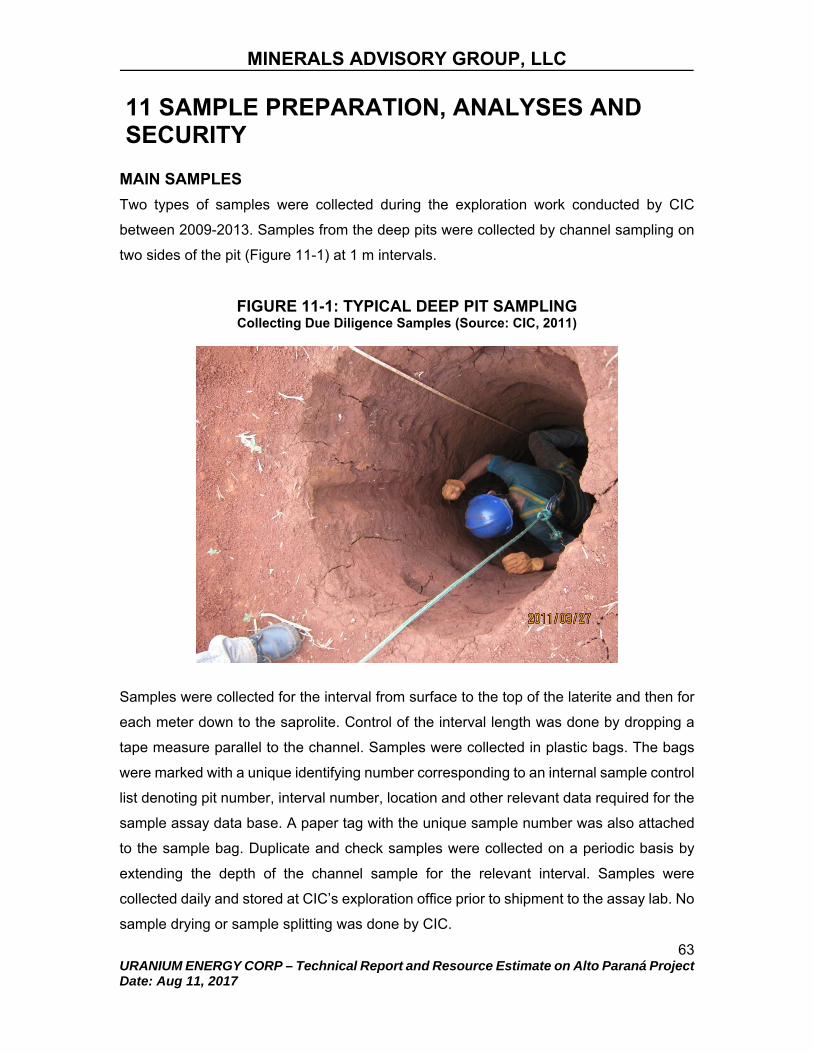
MINERALS ADVISORY GROUP, LLC
63 URANIUM ENERGY CORP – Technical Report and Resource Estimate on Alto Paraná Project Date: Aug 11, 2017
11 SAMPLE PREPARATION, ANALYSES AND SECURITY
MAIN SAMPLES
Two types of samples were collected during the exploration work conducted by CIC
between 2009-2013. Samples from the deep pits were collected by channel sampling on
two sides of the pit (Figure 11-1) at 1 m intervals.
FIGURE 11-1: TYPICAL DEEP PIT SAMPLING Collecting Due Diligence Samples (Source: CIC, 2011)
Samples were collected for the interval from surface to the top of the laterite and then for
each meter down to the saprolite. Control of the interval length was done by dropping a
tape measure parallel to the channel. Samples were collected in plastic bags. The bags
were marked with a unique identifying number corresponding to an internal sample control
list denoting pit number, interval number, location and other relevant data required for the
sample assay data base. A paper tag with the unique sample number was also attached
to the sample bag. Duplicate and check samples were collected on a periodic basis by
extending the depth of the channel sample for the relevant interval. Samples were
collected daily and stored at CIC’s exploration office prior to shipment to the assay lab. No
sample drying or sample splitting was done by CIC.
MINERALS ADVISORY GROUP, LLC
64 URANIUM ENERGY CORP – Technical Report and Resource Estimate on Alto Paraná Project Date: Aug 11, 2017
Shallow (1 m) auger samples were collected by hand auger. The auger was pushed to a
1 m depth and a sample collected from the interval, as illustrated in Figure 10-1. Deeper
auger samples were collected using a hand-held power auger. Material from each meter
interval was collected and composited as a single sample.
Samples were shipped in batches of approximately 30 to ALS in Lima, Peru. ALS Peru is
certified to ISO 17025 standards as an analytical laboratory and is also certified to
Peruvian national standards for minerals assays. CIC was totally independent of ALS
Laboratories and has no affiliation with their operations. At ALS, samples were subject to
the following ALS sample preparation and analytical protocols and procedures:
Sample log in, bar coding, drying at 1100C;
Sample crushing to 70% < 2 mm;
Sample splitting in riffle splitter;
Pulverization of 64 approx. 300 gram split; and
Analysis by XRF (ME-XRF12st) and/or ICP/AES (ME-ICP-41), plus Loss on
Ignition (OA-GRA05).
The basic sample preparation procedure is illustrated in Figure 11-2.

MINERALS ADVISORY GROUP, LLC
65 URANIUM ENERGY CORP – Technical Report and Resource Estimate on Alto Paraná Project Date: Aug 11, 2017
FIGURE 11-2: SAMPLE PREPARATION PROCEDURE (Source: CIC, 2011)
In total, 4486 main samples were collected from the deep pits and 2992 samples from the
1 m auger drill program.
SECURITY
All samples were handled in compliance with standard industry practice regarding security
and chain of custody. Bagged samples were temporarily stored in a secure storage room
at the field camp in San Alberto, under the supervision of the camp manager. Samples
were trucked to Asuncion, which is about a six hour drive. In Asuncion the samples were
delivered to DHL for shipment to ALS Chemex in Lima via commercial air. At DHL the
samples were kept between 24 and 72 hours until customs clearance was completed. ALS

MINERALS ADVISORY GROUP, LLC
66 URANIUM ENERGY CORP – Technical Report and Resource Estimate on Alto Paraná Project Date: Aug 11, 2017
Chemex representatives collected samples from the Lima airport and transported them to
the lab, which is about 5 minutes from the airport.
Project geologists were present during handling and transport to temporary storage and
to DHL facilities in Asuncion.
It is the opinion of the QP for Item 11 that security measures utilized in the past by CIC
and its contractors were adequate to ensure that none of the samples were compromised
in any way, and that the guidelines in Item 11(d) of 43-101F1 were followed correctly.
DUPLICATES AND CHECKS
Selected samples were split for duplicate analysis at ALS and for check assay analysis at
ALS in Vancouver and IPL Laboratories in Vancouver. The number of these samples was
quite limited (74 duplicates and 6 checks). In addition, ALS Peru split off laboratory pulp
duplicates at a rate of 1 in 50 main samples as part of its standard QA/QC procedures.
The number of duplicate samples is considerably below recommended practice. Future
drilling and sampling programs should ensure a minimum of 10% duplicates (as both
coarse and pulp duplicates of the main samples) and 5% check samples.
STANDARDS AND BLANKS
CIC did not insert any certified reference materials (CRMs) or blanks with the main,
duplicate or check samples. Instead, CIC relied on the use of ALS inserted standards and
blanks for monitoring laboratory precision. In accordance with the 2012 due diligence
recommendation made by Hains Engineering, future drilling and sampling programs
should incorporate provision for insertion of certified reference materials and/or reference
matched and round-robin evaluated standards and certified blanks. The recommended
insertion rate for both standards and blanks is 5% each of main, coarse and pulp
duplicates and check samples.
STATISTICAL ANALYSIS – DUPLICATE SAMPLES VS. ORIGINAL
(Source: Hains, 2011)
A paired statistical analysis was performed to compare the results from the duplicate
samples and its corresponding original sample. In this analysis, samples were separated
by batch number before analysis. Each batch had a minimum of 9 points for comparison.
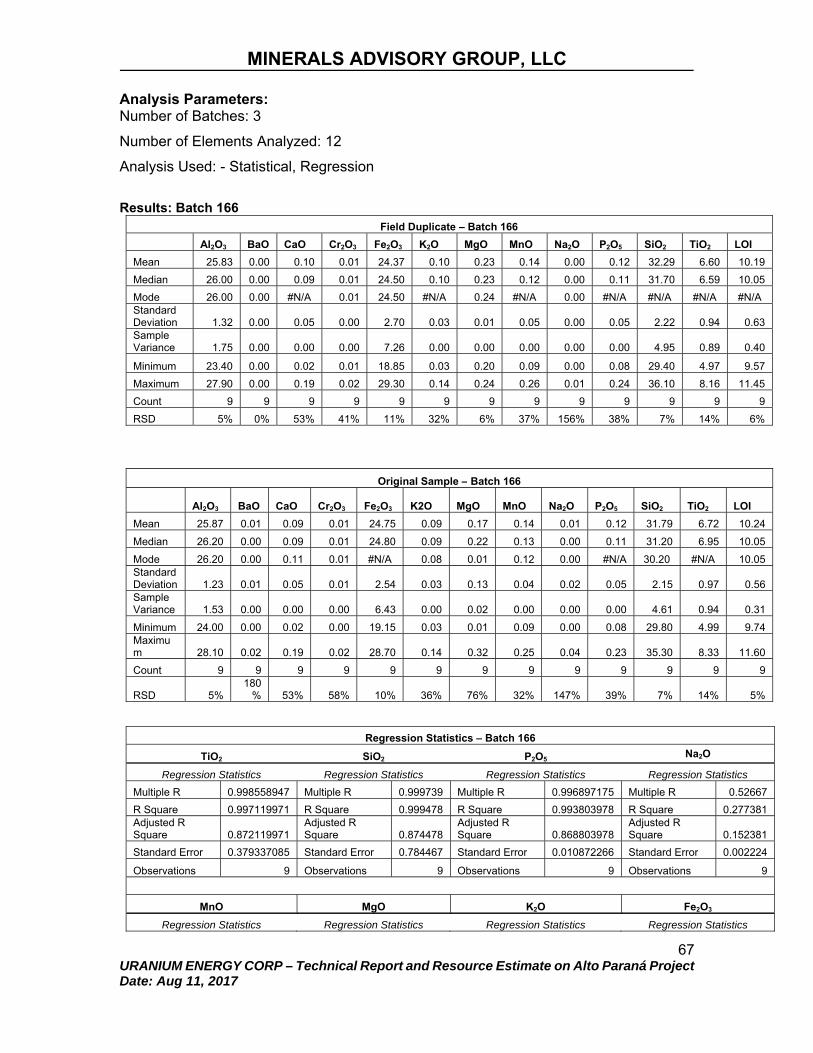
MINERALS ADVISORY GROUP, LLC
67 URANIUM ENERGY CORP – Technical Report and Resource Estimate on Alto Paraná Project Date: Aug 11, 2017
Analysis Parameters: Number of Batches: 3
Number of Elements Analyzed: 12
Analysis Used: - Statistical, Regression
Results: Batch 166
Field Duplicate – Batch 166
Al2O3 BaO CaO Cr2O3 Fe2O3 K2O MgO MnO Na2O P2O5 SiO2 TiO2 LOI
Mean 25.83 0.00 0.10 0.01 24.37 0.10 0.23 0.14 0.00 0.12 32.29 6.60 10.19
Median 26.00 0.00 0.09 0.01 24.50 0.10 0.23 0.12 0.00 0.11 31.70 6.59 10.05
Mode 26.00 0.00 #N/A 0.01 24.50 #N/A 0.24 #N/A 0.00 #N/A #N/A #N/A #N/A Standard Deviation 1.32 0.00 0.05 0.00 2.70 0.03 0.01 0.05 0.00 0.05 2.22 0.94 0.63 Sample Variance 1.75 0.00 0.00 0.00 7.26 0.00 0.00 0.00 0.00 0.00 4.95 0.89 0.40
Minimum 23.40 0.00 0.02 0.01 18.85 0.03 0.20 0.09 0.00 0.08 29.40 4.97 9.57
Maximum 27.90 0.00 0.19 0.02 29.30 0.14 0.24 0.26 0.01 0.24 36.10 8.16 11.45
Count 9 9 9 9 9 9 9 9 9 9 9 9 9
RSD 5% 0% 53% 41% 11% 32% 6% 37% 156% 38% 7% 14% 6%
Original Sample – Batch 166
Al2O3 BaO CaO Cr2O3 Fe2O3 K2O MgO MnO Na2O P2O5 SiO2 TiO2 LOI
Mean 25.87 0.01 0.09 0.01 24.75 0.09 0.17 0.14 0.01 0.12 31.79 6.72 10.24
Median 26.20 0.00 0.09 0.01 24.80 0.09 0.22 0.13 0.00 0.11 31.20 6.95 10.05
Mode 26.20 0.00 0.11 0.01 #N/A 0.08 0.01 0.12 0.00 #N/A 30.20 #N/A 10.05 Standard Deviation 1.23 0.01 0.05 0.01 2.54 0.03 0.13 0.04 0.02 0.05 2.15 0.97 0.56 Sample Variance 1.53 0.00 0.00 0.00 6.43 0.00 0.02 0.00 0.00 0.00 4.61 0.94 0.31
Minimum 24.00 0.00 0.02 0.00 19.15 0.03 0.01 0.09 0.00 0.08 29.80 4.99 9.74 Maximum 28.10 0.02 0.19 0.02 28.70 0.14 0.32 0.25 0.04 0.23 35.30 8.33 11.60
Count 9 9 9 9 9 9 9 9 9 9 9 9 9
RSD 5% 180
% 53% 58% 10% 36% 76% 32% 147% 39% 7% 14% 5%
Regression Statistics – Batch 166
TiO2 SiO2 P2O5 Na2O
Regression Statistics Regression Statistics Regression Statistics Regression Statistics
Multiple R 0.998558947 Multiple R 0.999739 Multiple R 0.996897175 Multiple R 0.52667
R Square 0.997119971 R Square 0.999478 R Square 0.993803978 R Square 0.277381 Adjusted R Square 0.872119971
Adjusted R Square 0.874478
Adjusted R Square 0.868803978
Adjusted R Square 0.152381
Standard Error 0.379337085 Standard Error 0.784467 Standard Error 0.010872266 Standard Error 0.002224
Observations 9 Observations 9 Observations 9 Observations 9
MnO MgO K2O Fe2O3
Regression Statistics Regression Statistics Regression Statistics Regression Statistics
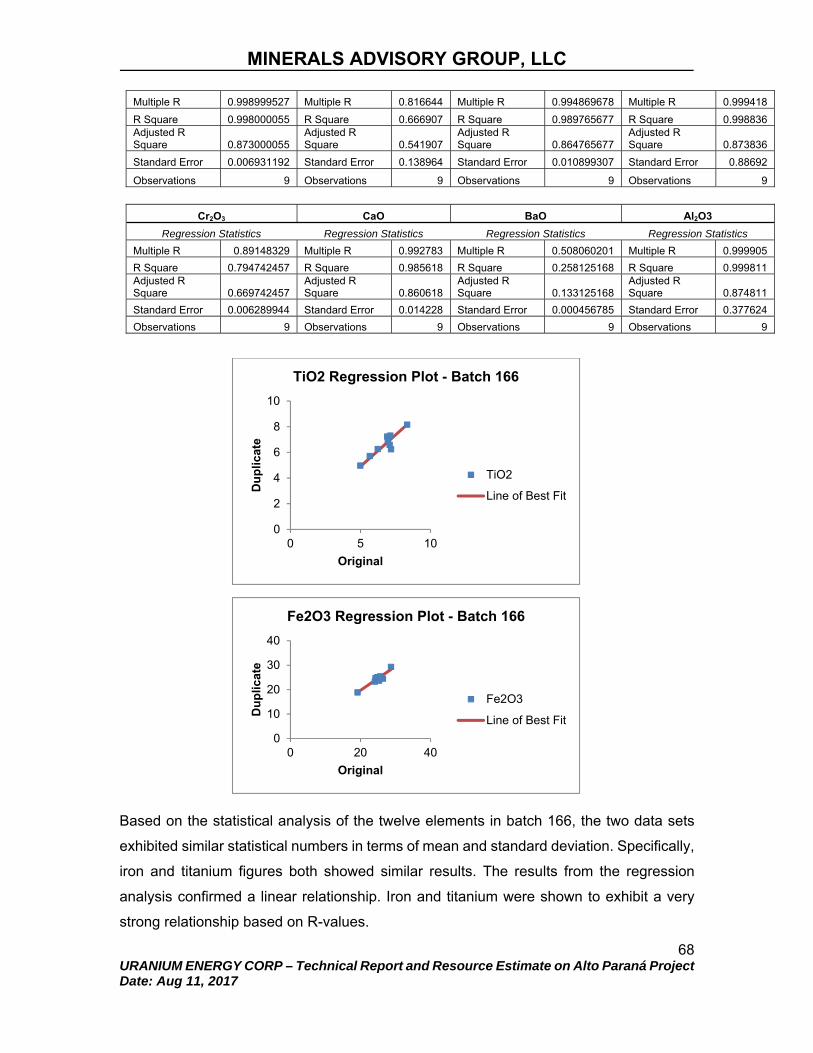
MINERALS ADVISORY GROUP, LLC
68 URANIUM ENERGY CORP – Technical Report and Resource Estimate on Alto Paraná Project Date: Aug 11, 2017
Multiple R 0.998999527 Multiple R 0.816644 Multiple R 0.994869678 Multiple R 0.999418
R Square 0.998000055 R Square 0.666907 R Square 0.989765677 R Square 0.998836 Adjusted R Square 0.873000055
Adjusted R Square 0.541907
Adjusted R Square 0.864765677
Adjusted R Square 0.873836
Standard Error 0.006931192 Standard Error 0.138964 Standard Error 0.010899307 Standard Error 0.88692
Observations 9 Observations 9 Observations 9 Observations 9
Cr2O3 CaO BaO Al2O3
Regression Statistics Regression Statistics Regression Statistics Regression Statistics
Multiple R 0.89148329 Multiple R 0.992783 Multiple R 0.508060201 Multiple R 0.999905
R Square 0.794742457 R Square 0.985618 R Square 0.258125168 R Square 0.999811 Adjusted R Square 0.669742457
Adjusted R Square 0.860618
Adjusted R Square 0.133125168
Adjusted R Square 0.874811
Standard Error 0.006289944 Standard Error 0.014228 Standard Error 0.000456785 Standard Error 0.377624
Observations 9 Observations 9 Observations 9 Observations 9
Based on the statistical analysis of the twelve elements in batch 166, the two data sets
exhibited similar statistical numbers in terms of mean and standard deviation. Specifically,
iron and titanium figures both showed similar results. The results from the regression
analysis confirmed a linear relationship. Iron and titanium were shown to exhibit a very
strong relationship based on R-values.
0
2
4
6
8
10
0 5 10
Du
plic
ate
Original
TiO2 Regression Plot - Batch 166
TiO2
Line of Best Fit
0
10
20
30
40
0 20 40
Du
plic
ate
Original
Fe2O3 Regression Plot - Batch 166
Fe2O3
Line of Best Fit

MINERALS ADVISORY GROUP, LLC
69 URANIUM ENERGY CORP – Technical Report and Resource Estimate on Alto Paraná Project Date: Aug 11, 2017
Results: Batch 181
Duplicate Samples – Batch 181
Al2O3
BaO CaO Cr2O3 Fe2O3 K2O MgO MnO Na2O P2O5 SiO2 TiO2 LOI
Mean 25.91 0.00 0.09 0.00 22.50 0.09 0.27 0.13 0.00 0.12 33.26 7.25 10.61
Median 27.10 0.00 0.08 0.00 21.10 0.09 0.27 0.10 0.00 0.11 33.70 6.66 10.45
Mode #N/A 0.00 0.02 0.00 #N/A #N/A 0.27 #N/A 0.00 #N/A #N/A 6.20 11.05 Standard Deviation 3.13 0.00 0.08 0.00 4.00 0.03 0.05 0.06 0.00 0.04 2.65 1.87 0.93 Sample Variance 9.80 0.00 0.01 0.00 16.01 0.00 0.00 0.00 0.00 0.00 7.03 3.51 0.87
Minimum 19.90 0.00 0.02 0.00 17.25 0.04 0.21 0.07 0.00 0.06 29.20 4.96 8.98
Maximum 29.50 0.00 0.23 0.01 28.40 0.13 0.38 0.24 0.00 0.20 36.30 10.55 12.40
Count 11 11 11 11 11 11 11 11 11 11 11 11 11
RSD 12% 0% 92% 136% 18% 29% 17% 45% 0% 36% 8% 26% 9%
Original Samples – Batch 181
Al2O3
BaO CaO Cr2O3 Fe2O3 K2O MgO MnO Na2O P2O5 SiO2 TiO2 LOI
Mean 25.89 0.00 0.09 0.01 22.70 0.10 0.27 0.14 0.01 0.11 32.77 7.38 10.55
Median 27.60 0.00 0.07 0.01 21.50 0.11 0.25 0.10 0.00 0.11 33.90 6.86 10.35
Mode #N/A 0.00 0.02 0.01 #N/A 0.11 0.25 #N/A 0.00 #N/A 36.00 #N/A #N/A Standard Deviation 3.22 0.01 0.08 0.01 4.18 0.03 0.06 0.06 0.02 0.04 2.82 2.00 0.94 Sample Variance 10.40 0.00 0.01 0.00 17.50 0.00 0.00 0.00 0.00 0.00 7.98 3.98 0.89
Minimum 19.70 0.00 0.02 0.01 17.30 0.04 0.19 0.08 0.00 0.06 27.80 4.93 9.01
Maximum 29.20 0.03 0.23 0.04 29.00 0.15 0.37 0.25 0.08 0.18 36.00 10.90 12.45
Count 11 11 11 11 11 11 11 11 11 11 11 11 11
RSD 12% 278
% 83% 64% 18% 34% 21% 45% 250% 36% 9% 27% 9%
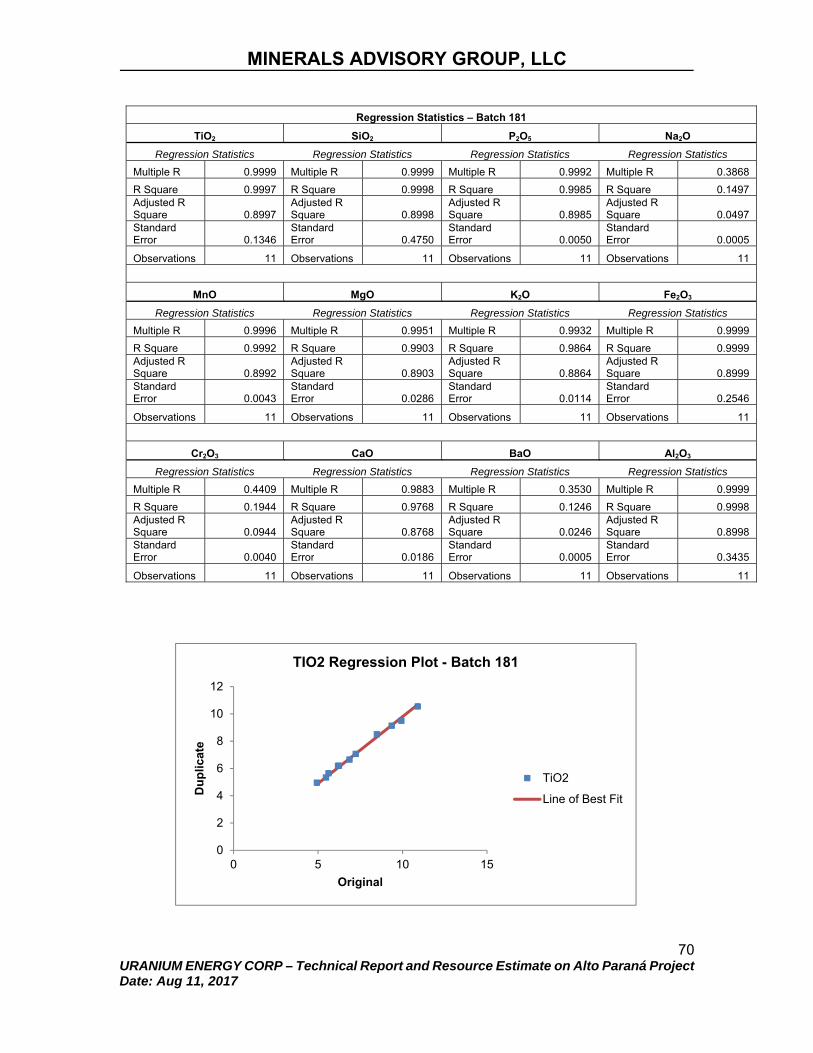
MINERALS ADVISORY GROUP, LLC
70 URANIUM ENERGY CORP – Technical Report and Resource Estimate on Alto Paraná Project Date: Aug 11, 2017
Regression Statistics – Batch 181
TiO2 SiO2 P2O5 Na2O
Regression Statistics Regression Statistics Regression Statistics Regression Statistics
Multiple R 0.9999 Multiple R 0.9999 Multiple R 0.9992 Multiple R 0.3868
R Square 0.9997 R Square 0.9998 R Square 0.9985 R Square 0.1497 Adjusted R Square 0.8997
Adjusted R Square 0.8998
Adjusted R Square 0.8985
Adjusted R Square 0.0497
Standard Error 0.1346
Standard Error 0.4750
Standard Error 0.0050
Standard Error 0.0005
Observations 11 Observations 11 Observations 11 Observations 11
MnO MgO K2O Fe2O3
Regression Statistics Regression Statistics Regression Statistics Regression Statistics
Multiple R 0.9996 Multiple R 0.9951 Multiple R 0.9932 Multiple R 0.9999
R Square 0.9992 R Square 0.9903 R Square 0.9864 R Square 0.9999 Adjusted R Square 0.8992
Adjusted R Square 0.8903
Adjusted R Square 0.8864
Adjusted R Square 0.8999
Standard Error 0.0043
Standard Error 0.0286
Standard Error 0.0114
Standard Error 0.2546
Observations 11 Observations 11 Observations 11 Observations 11
Cr2O3 CaO BaO Al2O3
Regression Statistics Regression Statistics Regression Statistics Regression Statistics
Multiple R 0.4409 Multiple R 0.9883 Multiple R 0.3530 Multiple R 0.9999
R Square 0.1944 R Square 0.9768 R Square 0.1246 R Square 0.9998 Adjusted R Square 0.0944
Adjusted R Square 0.8768
Adjusted R Square 0.0246
Adjusted R Square 0.8998
Standard Error 0.0040
Standard Error 0.0186
Standard Error 0.0005
Standard Error 0.3435
Observations 11 Observations 11 Observations 11 Observations 11
0
2
4
6
8
10
12
0 5 10 15
Du
plic
ate
Original
TIO2 Regression Plot - Batch 181
TiO2
Line of Best Fit

MINERALS ADVISORY GROUP, LLC
71 URANIUM ENERGY CORP – Technical Report and Resource Estimate on Alto Paraná Project Date: Aug 11, 2017
Based on the statistical analysis of the twelve elements in batch 181, the two data sets
exhibited similar statistical numbers in terms of mean and standard deviation. Specifically,
iron and titanium figures both showed similar results for their relative standard deviation
percent. The results from the regression analysis confirmed a linear relationship. Iron and
titanium were shown to exhibit a very strong relationship based on R-values.
Results: Batch 198
Duplicate Samples - Batch 198
Al2O3 BaO CaO Cr2O3 Fe2O3 K2O MgO MnO Na2O P2O5 SiO2 TiO2 LOI
Mean 25.883 0.12
4 0.11
8 0.014 23.179 0.118 0.275 0.129 0.017 0.129 33.183 7.417 11.004
Median 26.300 0.12
3 0.09
5 0.014 23.850 0.100 0.280 0.120 0.018 0.129 32.200 7.540 11.000
Mode #N/A #N/A
0.020 0.015 #N/A 0.100 0.240 #N/A 0.020 #N/A 31.400 #N/A 10.750
Standard Deviation 2.237
0.022
0.097 0.002 2.749 0.031 0.049 0.037 0.005 0.027 2.515 1.543 0.660
Sample Variance 5.005
0.000
0.009 0.000 7.555 0.001 0.002 0.001 0.000 0.001 6.327 2.380 0.436
Minimum 21.900 0.09
2 0.02
0 0.010 16.250 0.080 0.190 0.069 0.009 0.090 30.600 4.810 10.050
Maximum 28.700 0.16
5 0.33
0 0.017 26.200 0.170 0.360 0.200 0.029 0.184 39.100 10.20
0 11.950
Count 12 12 12 12 12 12 12 12 12 12 12 12 12
RSD 9% 17% 82% 14% 12% 26% 18% 28% 29% 21% 8% 21% 6%
0
5
10
15
20
25
30
35
0 10 20 30 40
Du
plic
ate
Original
Fe2O3 Regression Plot - Batch 181
Fe2O3
Line of Best Fit

MINERALS ADVISORY GROUP, LLC
72 URANIUM ENERGY CORP – Technical Report and Resource Estimate on Alto Paraná Project Date: Aug 11, 2017
Original Samples – Batch 198
Al2O3 BaO CaO Cr2O3 Fe2O3 K2O MgO MnO Na2O P2O5 SiO2 TiO2 LOI
Mean 25.767 0.087 0.117 0.011 22.813 0.108 0.279 0.125 0.023 0.128 32.583 7.173 11.008
Median 26.200 0.102 0.085 0.013 23.500 0.098 0.290 0.120 0.001 0.124 32.500 7.370 11.075
Mode 26.200 #N/A 0.040 0.015 24.000 #N/A 0.290 #N/A 0.001 #N/A 32.600 #N/A 11.400 Standard Deviation 2.203 0.050 0.103 0.006 2.624 0.030 0.052 0.035 0.032 0.029 2.527 1.436 0.558 Sample Variance 4.852 0.003 0.011 0.000 6.885 0.001 0.003 0.001 0.001 0.001 6.385 2.062 0.311
Minimum 22.100 0.018 0.005 0.001 16.050 0.074 0.180 0.066 0.001 0.089 29.200 4.640 10.200
Maximum 28.600 0.146 0.340 0.018 25.600 0.155 0.350 0.191 0.075 0.187 38.000 9.370 11.950
Count 12 12 12 12 12 12 12 12 12 12 12 12 12
RSD 9% 58% 88% 50% 12% 28% 19% 28% 140% 23% 8% 20% 5%
Regression Statistics – Batch 198
TiO2 P2O5 Na2O MnO
Regression Statistics Regression Statistics Regression Statistics Regression Statistics
Multiple R 0.9995 Multiple R 0.9996 Multiple R 0.5956 Multiple R 0.9997
R Square 0.9991 R Square 0.9993 R Square 0.3548 R Square 0.9994 Adjusted R Square 0.9082
Adjusted R Square 0.9084
Adjusted R Square 0.2639
Adjusted R Square 0.9085
Standard Error 0.2384
Standard Error 0.0037
Standard Error 0.0152
Standard Error 0.0033
Observations 12 Observations 12 Observations 12 Observations 12
MgO K2O Fe2O3 Cr2O3
Regression Statistics Regression Statistics Regression Statistics Regression Statistics
Multiple R 0.9943 Multiple R 0.9972 Multiple R 0.9999 Multiple R 0.8811
R Square 0.9886 R Square 0.9944 R Square 0.9999 R Square 0.7763 Adjusted R Square 0.8977
Adjusted R Square 0.9035
Adjusted R Square 0.9090
Adjusted R Square 0.6854
Standard Error 0.0311
Standard Error 0.0095
Standard Error 0.2594
Standard Error 0.0069
Observations 12 Observations 12 Observations 12 Observations 12
CaO BaO Al2O3 SiO2
Regression Statistics Regression Statistics Regression Statistics Regression Statistics
Multiple R 0.9968 Multiple R 0.9002 Multiple R 0.9999 Multiple R 0.9998
R Square 0.9937 R Square 0.8104 R Square 0.9999 R Square 0.9997 Adjusted R Square 0.9028
Adjusted R Square 0.7195
Adjusted R Square 0.9090
Adjusted R Square 0.9088
Standard Error 0.0125
Standard Error 0.0573
Standard Error 0.3126
Standard Error 0.6126
Observations 12 Observations 12 Observations 12 Observations 12

MINERALS ADVISORY GROUP, LLC
73 URANIUM ENERGY CORP – Technical Report and Resource Estimate on Alto Paraná Project Date: Aug 11, 2017
Based on the statistical analysis of the twelve elements in batch 198, the two data sets
exhibited similar statistical numbers in terms of mean and standard deviation. Iron and
titanium oxide numbers were very similar. The results from the regression analysis
confirmed a linear relationship. Iron and titanium were shown to exhibit a very strong
relationship based on R-values.
The overall conclusion from analysis of the three batches of paired samples is that there
is demonstrable evidence to indicate that the duplicate and original samples are similar
and equivalent. Based on the data, the QP (D. Brown) concludes that the sampling data
is accurate within acceptable analytical error limits, and can be reliably used for resource
estimate calculations included in this report.
0
2
4
6
8
10
12
0 2 4 6 8 10
Du
plic
ate
Original
TiO2 Regression Plot - 198
TiO2
Line of Best Fit
0
5
10
15
20
25
30
0 5 10 15 20 25 30
Du
plic
ate
Original
Fe2O3 Regression Plot - 198
Fe2O3
Line of Best Fit

MINERALS ADVISORY GROUP, LLC
74 URANIUM ENERGY CORP – Technical Report and Resource Estimate on Alto Paraná Project Date: Aug 11, 2017
SUMMARY QA/QC ANALYSIS
Analysis of the available QA/QC data indicates the analytical results can be considered
as reliable. Given the nature of the mineralization in the laterite, significant variations from
the mean values would not be expected. The assay results appear to adequately represent
the range of TiO2 and Fe2O3 and other oxides of interest within the deposit. However,
additional QA/QC controls are recommended to bring future exploration programs in line
with industry practice. It is recommended that a matrix matched certified standard be
prepared and inserted at a rate of 5% (five per hundred or every 20th sample). Similarly,
the number of coarse and pulp duplicates and check samples should be increased to
match current industry practice. Certified blanks should be inserted at a rate of 5% of
samples. Finally, it is recommended that additional samples be taken for particle size
analysis.

MINERALS ADVISORY GROUP, LLC
75 URANIUM ENERGY CORP – Technical Report and Resource Estimate on Alto Paraná Project Date: Aug 11, 2017
12 DATA VERIFICATION
Data verification was done by Don Hains as part of a technical report in 43-101
format completed for CIC-CI in 2012 (Hains, D.H., 2012). Data verification consisted
of the following activities:
Collection of due diligence samples for chemical and particle size analysis
from deep pits and 1 m auger holes, and
Review of the assay data base against the laboratory certificates.
Deep pit samples were collected at 1 m intervals from a profile of five closely spaced
pits located within the pilot plant parcel from three additional locations within
distance of 0.7 to 3.5 km west and east of the pilot plant site (Figure 12-1). Also, 18
one-meter auger samples were collected along Highway 536 as shown on Figure
12-1. All samples were shipped to ALS Peru for assay. The assay data from these
pits was compared to the original assays for the respective pits. The results of the
comparison are detailed in Table 12-1.
The tables, charts, and conclusions contained in this section are extracted from the
2012 Hains report dealing with verification of CIC sampling procedures and
analytical accuracy. The QP is satisfied that the verification procedures used by
Hains are acceptable and accurate with respect to 43-101 technical specifications
and standard industry practice. The sample locations are considered by the QP to
be representative of the mineralization as a whole, and the variance between
original CIC results and due diligence samples are believed to be within acceptable
limits. No independent verification was conducted by the QP’s for this report
because no such additional verification was deemed necessary by the authors due
to the extensive and thorough nature of the data verification previously completed
by Hains and reviewed by the authors.

MINERALS ADVISORY GROUP, LLC
76 URANIUM ENERGY CORP – Technical Report and Resource Estimate on Alto Paraná Project Date: Aug 11, 2017
FIGURE 12-1: LOCATION OF VERIFICATION SAMPLES (SOURCE: D. BROWN, 2015)

MINERALS ADVISORY GROUP, LLC
77 URANIUM ENERGY CORP – Technical Report and Resource Estimate on Alto Paraná Project Date: Aug 11, 2017
TABLE 12-1: DUE DILIGENCE SAMPLE COMPARISON – PIT SAMPLES CIC Alto Paraná Project (Source: Hains, 2011)
Hole PH‐082
Al2O3 BaO CaO Cr2O3 Fe2O3 K2O MgO MnO Na2O P2O5 SiO2 TiO2 LOI DD Sample % % % % % % % % % % % % % PH‐082.1 24 0.006 0.06 0.005 25.6 0.082 0.38 0.158 <0.001 0.118 30.5 9.31 9.58 PH‐082.2 24.8 0.004 0.05 0.011 25.6 0.088 0.37 0.149 0.002 0.103 31.4 9.03 8.89 PH‐082.3 24.8 0.003 0.02 0.009 27 0.076 0.35 0.154 <0.001 0.092 29.6 9.44 8.64 PH‐082.4 24.4 0.002 0.02 0.006 26.4 0.078 0.37 0.152 <0.001 0.094 30.2 9.51 8.53 PH‐082.5 24.2 0.006 0.02 0.009 28.1 0.073 0.34 0.16 <0.001 0.104 28.9 9.28 8.55 PH‐082.6 21.8 0.006 0.02 0.016 34.3 0.055 0.31 0.163 <0.001 0.213 25.7 8.8 8.55
average 24.00 0.005 0.03 0.009 27.83 0.08 0.35 0.16 0.00 0.121 29.38 9.23 8.79 Std. Dev. 1.12 0.00 0.02 0.00 3.30 0.01 0.03 0.01 #DIV/0! 0.05 1.99 0.27 0.41 Variance 1.2640 0.0000 0.0003 0.0000 10.9227 0.0001 0.0007 0.0000 #DIV/0! 0.0021 3.9657 0.0713 0.1679 Rel Diff of Means ‐3.38%
‐800.00% 28.49%
‐553.33% ‐0.74% 84.96%
‐6966.67% 8.39%
‐300.00% 9.37% 1.07% 5.36% 0.47%
Original Al2O3 BaO CaO Cr2O3 Fe2O3 K2O MgO MnO Na2O P2O5 SiO2 TiO2 LOI
PH082‐1 23.8 0.0005 0.07 0.0005 25.1 0.483 0.005 0.15 0.0005 0.121 30.7 9.07 10.55
PH082‐2 24.3 0.0005 0.04 0.0005 25.4 0.493 0.005 0.144 0.0005 0.099 31.4 9.19 8.94
PH082‐3 24 0.0005 0.04 0.0005 26.5 0.511 0.005 0.148 0.0005 0.091 30.3 9.77 8.56
PH082‐4 24.2 0.0005 0.02 0.0005 27 0.506 0.005 0.152 0.0005 0.089 29.7 9.77 8.52
PH082‐5 24.2 0.0005 0.03 0.0005 27.1 0.501 0.005 0.152 0.0005 0.091 29.7 9.62 8.53
PH082‐6 21.6 0.0005 0.03 0.007 33.7 0.452 0.005 0.158 0.0005 0.204 26.2 8.94 8.7
PH082‐7 20.4 0.0005 0.08 0.0005 28.6 0.56 0.005 0.288 0.0005 0.237 29.9 11.9 8.02
Average 23.21 0.001 0.04 0.0014 27.63 0.50 0.005 0.170 0.0005 0.133 29.70 9.75 8.83 St. Dev 1.56 0.00 0.02 0.00 2.92 0.03 0.00 0.05 0.00 0.06 1.66 1.01 0.81 Variance 2.4348 0.0000 0.0005 0.0000 8.5190 0.0011 0.0000 0.0027 0.0000 0.0038 2.7567 1.0120 0.6504 Hole PH‐044 DD Sample Al2O3 BaO CaO Cr2O3 Fe2O3 K2O MgO MnO Na2O P2O5 SiO2 TiO2 LOI PH‐044.1 27.2 0.005 0.08 0.007 22.1 0.085 0.33 0.134 <0.001 0.124 31.9 7.12 11.4 PH‐044.2 27.7 0.01 0.03 0.006 22.4 0.102 0.35 0.131 0.004 0.114 32.3 7.26 10.55 PH‐044.3 27.3 <0.001 0.02 0.007 22.7 0.088 0.3 0.125 0.003 0.109 32.1 7.23 10.2 PH‐044.4 27.9 0.002 0.02 0.005 23.2 0.093 0.31 0.131 <0.001 0.105 30.8 7.58 10.1 PH‐044.5 27.9 0.008 0.03 0.006 23.2 0.092 0.31 0.131 <0.001 0.104 31 7.45 10.15 PH‐044.6 27.7 0.008 0.02 0.009 23.9 0.085 0.3 0.145 <0.001 0.114 30.6 7.72 9.97 PH‐044.7 27.9 0.008 0.02 0.011 23.9 0.079 0.28 0.143 0.001 0.123 30.6 7.3 9.92 PH‐044.8 27.8 0.007 0.02 0.007 24.3 0.071 0.27 0.148 <0.001 0.138 30.7 7.24 9.88
average 27.68 0.007 0.03 0.007 23.21 0.087 0.31 0.136 0.003 0.116 31.25 7.36 10.27 St. Dev 0.28 0.00 0.02 0.00 0.78 0.01 0.03 0.01 0.00 0.01 0.72 0.20 0.50 Variance 0.0764 0.0000 0.0004 0.0000 0.6127 0.0001 0.0007 0.0001 0.0000 0.0001 0.5229 0.0412 0.2526 Rel Diff of Means
‐0.596% 1.257% 30.769%
‐18.636%
‐4.639% 67.210%
‐151.712% ####### 84.365% 2.570% 2.072%
‐3.261% 2.847%

MINERALS ADVISORY GROUP, LLC
78 URANIUM ENERGY CORP – Technical Report and Resource Estimate on Alto Paraná Project Date: Aug 11, 2017
Original Al2O3 BaO CaO Cr2O3 Fe2O3 K2O MgO MnO Na2O P2O5 SiO2 TiO2 LOI
PH044 0‐1
26.7 0.0005 0.06 0.0005 21.5 0.402 0.005 0.131 0.027 0.126 32.4 7.24 11.45
PH044 1‐2
27.1 0.0005 0.05 0.0005 21.8 0.425 0.005 0.123 0.03 0.112 32.6 7.34 10.4
PH044 2‐3
27.1 0.0005 0.03 0.0005 22.4 0.427 0.005 0.125 0.027 0.109 31.9 7.55 10.35
PH044 3‐4
27.8 0.0005 0.02 0.0005 22.8 0.424 0.005 0.122 0.016 0.104 31.1 7.62 10.05
PH044 4‐5
27.6 0.0005 0.02 0.001 23 0.429 0.005 0.124 0.032 0.102 30.9 7.74 10.1
PH044 5‐6
27.2 0.015 0.08 0.015 23.7 0.073 0.3 0.13 0.02 0.106 30.5 7.58 10.25
PH044 6‐7
27.2 0.01 0.03 0.013 23.6 0.084 0.3 0.132 0.0005 0.108 30.8 7.44 10.25
PH044 7‐8.25
26.5 0.012 0.06 0.016 23.6 0.12 0.29 0.136 0.0005 0.118 31.9 7.14 10.1
PH044 8.25‐9
30.4 0.023 0.04 0.008 17.25 0.0005 0.18 0.084 0.0005 0.19 35.1 4.52 12.2
average 27.51 0.0069 0.04 0.01 22.18 0.265 0.122 0.123 0.017 0.119 31.91 7.13 10.57 Std. Dev.
1.15 0.01 0.02 0.01 2.01 0.19 0.14 0.02 0.01 0.03 1.40 1.00 0.74
Variance 1.3311 0.0001 0.0004 0.0000 4.0450 0.0354 0.0204 0.0002 0.0002 0.0008 1.9736 0.9945 0.5532 Hole PH‐109
DD Sample Al2O3 BaO CaO Cr2O3 Fe2O3 K2O MgO MnO Na2O P2O5 SiO2 TiO2 LOI
PH‐109.1 24 0.005 0.03 0.005 27.3 0.059 0.38 0.176 <0.001 0.126 28.5 9.66 9.73 PH‐109.2 24.9 0.005 0.03 0.006 26.8 0.076 0.37 0.163 <0.001 0.114 29.3 9.28 9.22 PH‐109.3 25.2 0.005 0.02 0.005 27.4 0.076 0.36 0.162 <0.001 0.11 28.9 9.23 8.98 PH‐109.4 24.9 0.006 0.01 0.005 28 0.066 0.35 0.166 <0.001 0.108 27.8 9.47 8.7 PH‐109.5 25.2 0.006 0.02 0.004 27.9 0.064 0.34 0.167 <0.001 0.111 28 9.43 8.99 PH‐109.6 25.5 0.009 0.01 0.012 27.9 0.06 0.33 0.165 <0.001 0.124 28.1 9.02 8.92
average 24.95 0.006 0.02 0.006 27.55 0.067 0.36 0.167 <0.001 0.1155 28.43 9.35 9.09 Std. Dev. 0.52 0.00 0.01 0.00 0.47 0.01 0.02 0.01 #DIV/0! 0.01 0.58 0.22 0.35 Variance 0.2670 0.0000 0.0001 0.0000 0.2190 0.0001 0.0004 0.0000 #DIV/0! 0.0001 0.3347 0.0490 0.1259 Rel. Diff of Means
‐1.600% 76.986% 44.000% 47.358%
‐0.130%
‐65.312% ‐4.412% ‐1.084% #VALUE! 14.172% 0.084%
‐2.874% 4.831%
Original Al2O3 BaO CaO Cr2O3 Fe2O3 K2O MgO MnO Na2O P2O5 SiO2 TiO2 LOI
PH109 0‐0.3
23.6 0.0005 0.04 0.01 27.3 0.035 0.36 0.172 0.05 0.126 28.4 9.6 10.25
PH109 0.3‐1.3
24.4 0.031 0.05 0.018 26.7 0.049 0.37 0.16 0.05 0.116 29.1 9.09 9.85
PH109 1.3 ‐2.3
24.9 0.028 0.04 0.012 26.6 0.058 0.35 0.153 0.051 0.107 29.4 8.9 9.46
PH109 2.3 ‐3.3
24.8 0.024 0.03 0.018 27.8 0.048 0.34 0.16 0.052 0.106 28 9.32 9.2
PH109 3.3 ‐4.3
25.1 0.025 0.02 0.008 27.7 0.043 0.33 0.161 0.045 0.11 28.1 9.02 9.33
PH109 4.3 – 5.8
24.7 0.029 0.04 0.008 28.3 0.043 0.34 0.17 0.084 0.11 27.8 9.36 9.01
PH109 5.8‐6.3
24.4 0.045 0.03 0.008 28.2 0.007 0.29 0.177 0.049 0.267 28.4 8.32 9.76
average 24.56 0.026 0.04 0.012 27.51 0.04 0.34 0.165 0.054 0.135 28.46 9.09 9.55

MINERALS ADVISORY GROUP, LLC
79 URANIUM ENERGY CORP – Technical Report and Resource Estimate on Alto Paraná Project Date: Aug 11, 2017
Std. Dev.
0.49 0.01 0.01 0.00 0.68 0.02 0.03 0.01 0.01 0.06 0.59 0.41 0.43
Variance 0.2429 0.0002 0.0001 0.0000 0.4581 0.0003 0.0007 0.0001 0.0002 0.0035 0.3462 0.1700 0.1824 Hole PH537
DD Sample Al2O3 BaO CaO Cr2O3 Fe2O3 K2O MgO MnO Na2O P2O5 SiO2 TiO2 LOI
PH‐537.1 24.8 0.003 0.11 0.012 24.5 0.102 0.37 0.154 0.006 0.13 31.6 8.62 9.65 PH‐537.2 25.4 0.001 0.06 0.003 23 0.108 0.34 0.117 0.001 0.102 32 7.77 9.47 PH‐537.3 25.4 0.004 0.05 <0.001 24.1 0.1 0.34 0.122 0.002 0.092 31.1 8.12 9.3 PH‐537.4 25.6 0.002 0.05 <0.001 24.4 0.102 0.33 0.123 <0.001 0.089 30.5 8.1 9.14 PH‐537.5 26.2 <0.001 0.05 0.008 24.3 0.098 0.31 0.115 <0.001 0.083 30.8 8.03 9.12
average 25.48 0.003 0.06 0.008 24.06 0.102 0.34 0.126 0.003 0.099 31.2 8.128 9.336 Std. Dev 0.50 0.00 0.03 0.00 0.61 0.00 0.02 0.02 0.00 0.02 0.60 0.31 0.23
Variance 0.252 1.67E‐06 0.00068
2.033E‐05 0.373 0.000014 0.00047 0.00025 0.000007 0.000344 0.365 0.09517 0.05073
Rel. Diff of Means
‐0.463% 51.220% 11.724%
‐11.515% 2.294%
‐23.636% 0.952% 4.213% 88.571% 10.023% 0.160% 2.702%
‐0.293%
Original Al2O3 BaO CaO Cr2O3 Fe2O3 K2O MgO MnO Na2O P2O5 SiO2 TiO2 LOI
PH537 0‐0.2
25.6 0.01 0.05 0.01 25 0.06 0.32 0.122 0.024 0.147 31.5 7.85 9.14
PH537 0.2 1.2
26.1 0.0005 0.05 0.006 24.8 0.07 0.31 0.122 0.019 0.088 30.6 8.04 9.08
PH537 1.2 ‐2.2
26.1 0.0005 0.05 0.006 24.9 0.078 0.32 0.123 0.022 0.086 30.6 8.27 8.95
PH537 2.2‐3.2
25.9 0.003 0.05 0.005 24.5 0.082 0.33 0.125 0.026 0.09 30.9 8.19 9.11
PH537 3.2‐4.2
25.9 0.003 0.08 0.006 24.3 0.084 0.35 0.122 0.029 0.093 31.2 8.19 9.04
PH537 4.2‐5.2
26 0.01 0.07 0.008 23.8 0.092 0.36 0.122 0.03 0.103 32.6 8.18 9.33
PH537 5.2‐6.1
25.3 0.004 0.09 0.005 23.3 0.085 0.35 0.132 0.028 0.12 32 7.96 9.82
PH537 6.1‐6.3
22 0.01 0.14 0.009 26.4 0.109 0.39 0.186 0.032 0.155 30.6 10.15 10
average 25.36 0.005 0.07 0.007 24.63 0.083 0.34 0.132 0.026 0.110 31.25 8.35 9.31 Std. Dev. 1.39 0.00 0.03 0.00 0.92 0.01 0.03 0.02 0.00 0.03 0.74 0.74 0.39 Variance 1.9198 0.0000 0.0010 0.0000 0.8507 0.0002 0.0007 0.0005 0.0000 0.0008 0.5486 0.5464 0.1516 Hole PH538
DD Sample Al2O3 BaO CaO Cr2O3 Fe2O3 K2O MgO MnO Na2O P2O5 SiO2 TiO2 LOI
PH‐538.1 24.4 0.007 0.13 0.003 23.9 0.107 0.36 0.148 0.005 0.116 31.4 8.31 9.75 PH‐538.2 25 0.004 0.05 <0.001 23.7 0.107 0.36 0.128 0.014 0.098 31.7 8.14 9.29 PH‐538.3 25.1 0.003 0.03 0.024 24.8 0.097 0.35 0.131 0.063 0.089 30.8 8.53 8.98 PH‐538.4 25.1 0.003 0.02 0.016 25 0.089 0.33 0.131 0.014 0.084 29.8 8.54 8.86 PH‐538.5 25.3 0.001 0.02 0.001 25.2 0.09 0.32 0.132 0.005 0.079 29.9 8.55 8.85 PH‐538.6 25.5 <0.001 0.02 0.003 25.3 0.088 0.32 0.129 0.005 0.077 29.6 8.43 8.82

MINERALS ADVISORY GROUP, LLC
80 URANIUM ENERGY CORP – Technical Report and Resource Estimate on Alto Paraná Project Date: Aug 11, 2017
PH‐538.7 25.5 0.008 0.02 0.005 25.4 0.084 0.32 0.13 0.003 0.085 30.1 8.23 8.81
Average 25.13 0.004 0.04 0.009 24.76 0.095 0.34 0.133 0.016 0.090 30.47 8.39 9.05 Std. Dev. 0.38 0.00 0.04 0.01 0.69 0.01 0.02 0.01 0.02 0.01 0.83 0.17 0.35 Variance 0.1424 0.0000 0.0016 0.0001 0.4695 0.0001 0.0004 0.0000 0.0005 0.0002 0.6924 0.0273 0.1232 Rel. Diff. of Means 2.565%
‐12.554% 35.268%
‐17.117%
‐0.762% ‐9.458% ‐2.165% ‐1.077% 37.212% 16.700% 1.355%
‐2.907% 4.571%
Original Al2O3 BaO CaO Cr2O3 Fe2O3 K2O MgO MnO Na2O P2O5 SiO2 TiO2 LOI
PH538 0‐0.1
25.5 0.014 0.04 0.007 25.1 0.05 0.31 0.118 0.019 0.188 30.4 7.92 9.19
PH538 0.1‐0.9
25.9 0.003 0.03 0.007 25.3 0.067 0.31 0.13 0.026 0.091 30.8 8.07 8.9
PH538 0.9 ‐1.9
26.9 0.004 0.03 0.006 25 0.071 0.3 0.122 0.034 0.091 30.9 7.73 8.99
PH538 1.9‐2.9
26.4 0.0005 0.01 0.006 24.9 0.079 0.31 0.127 0.017 0.079 30.1 8.17 9.11
PH538 2.9‐3.9
26.4 0.0005 0.02 0.012 24.9 0.081 0.31 0.127 0.019 0.08 30.2 8.29 9.2
PH538 3.9‐4.9
26 0.0005 0.02 0.008 24.6 0.086 0.33 0.13 0.023 0.088 30.9 8.35 9.2
PH538 4.9‐5.9
26.1 0.003 0.03 0.004 24 0.088 0.34 0.123 0.03 0.095 31.8 7.99 10.15
PH538 5.9‐6.9
25.4 0.003 0.06 0.009 24.1 0.119 0.37 0.135 0.026 0.105 31.4 8.42 9.51
PH538 6.9‐7.9
27 0.005 0.17 0.006 22.1 0.094 0.34 0.114 0.023 0.11 32.7 7.02 10.3
PH538 7.8‐8
22.3 0.005 0.23 0.009 25.7 0.129 0.38 0.187 0.031 0.15 29.7 9.57 10.3
Average 25.79 0.004 0.06 0.007 24.57 0.086 0.33 0.131 0.025 0.108 30.89 8.15 9.49 Std. Dev. 1.33 0.00 0.07 0.00 1.01 0.02 0.03 0.02 0.01 0.03 0.89 0.64 0.55 Variance 1.7788 0.0000 0.0055 0.0000 1.0157 0.0006 0.0008 0.0004 0.0000 0.0012 0.7921 0.4097 0.3054 Hole PH539
DD Sample Al2O3 BaO CaO Cr2O3 Fe2O3 K2O MgO MnO Na2O P2O5 SiO2 TiO2 LOI
PH‐539.1 25.5 0.003 0.13 0.018 22.9 0.094 0.35 0.128 0.006 0.112 31.2 7.46 10.15 PH‐539.2 25.8 0.004 0.05 0.01 23.3 0.1 0.35 0.12 0.006 0.1 31.5 7.64 9.62 PH‐539.3 25.6 0.006 0.03 0.004 25 0.092 0.34 0.13 <0.001 0.095 30.2 8.32 9.32 PH‐539.4 26.2 0.008 0.03 0.003 25.1 0.085 0.33 0.13 <0.001 0.093 29.9 8.12 9.53 PH‐539.5 26 0.003 0.02 0.006 25.3 0.081 0.33 0.134 <0.001 0.092 29.8 8.21 9.28 PH‐539.6 26.1 0.006 0.02 0.004 26 0.076 0.32 0.139 0.004 0.097 29.6 8.36 9.22 PH‐539.7 25.7 0.003 0.02 0.01 26.3 0.067 0.31 0.148 0.023 0.107 29.7 8.36 9.23
Average 25.84 0.005 0.04 0.008 24.84 0.085 0.33 0.133 0.010 0.099 30.27 8.07 9.48 Std. Dev. 0.26 0.00 0.04 0.01 1.29 0.01 0.01 0.01 0.01 0.01 0.77 0.37 0.33 Variance 0.0695 0.0000 0.0016 0.0000 1.6529 0.0001 0.0002 0.0001 0.0001 0.0001 0.5857 0.1350 0.1111 Rel Diff of Means
‐1.256%
‐48.872% 31.122% 33.288% 3.210% ‐6.546% ‐0.866% 9.922% 57.609% 14.121%
‐0.421% 3.784%
‐1.932%
Original Al2O3 BaO CaO Cr2O3 Fe2O3 K2O MgO MnO Na2O P2O5 SiO2 TiO2 LOI
PH539 0‐0.2
24.8 0.011 0.03 0.026 29.1 0.048 0.29 0.172 0.028 0.194 28.8 8.07 9.04
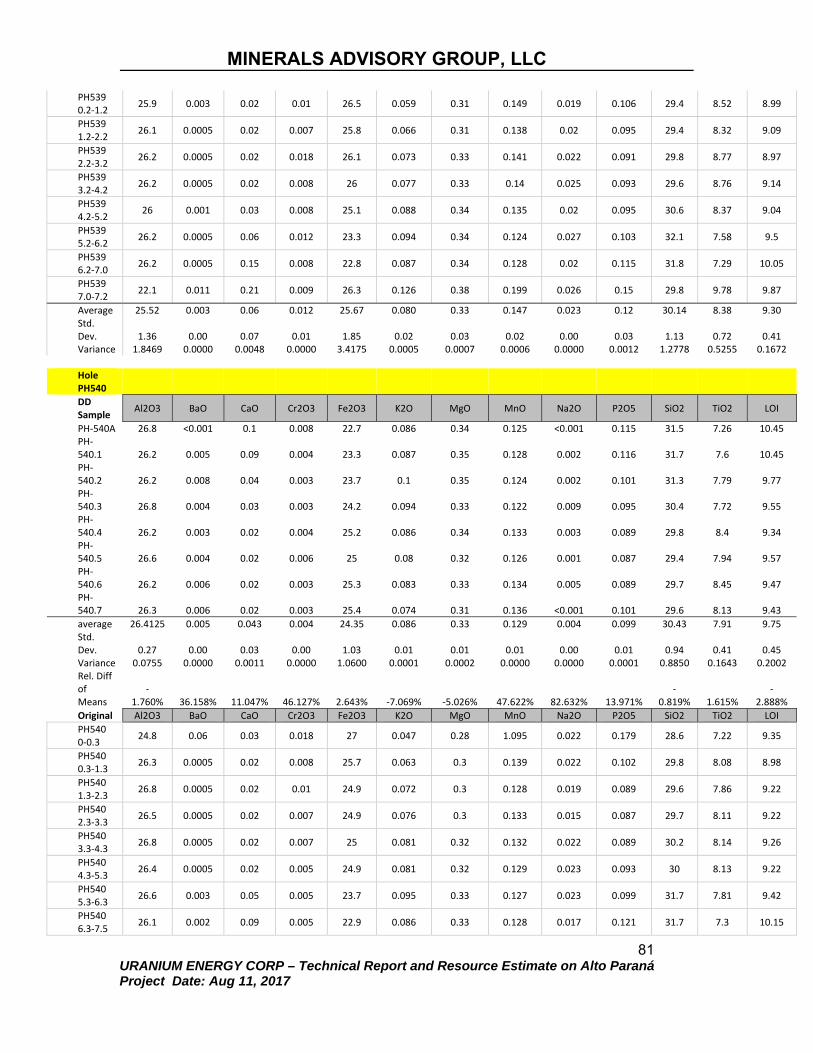
MINERALS ADVISORY GROUP, LLC
81 URANIUM ENERGY CORP – Technical Report and Resource Estimate on Alto Paraná Project Date: Aug 11, 2017
PH539 0.2‐1.2
25.9 0.003 0.02 0.01 26.5 0.059 0.31 0.149 0.019 0.106 29.4 8.52 8.99
PH539 1.2‐2.2
26.1 0.0005 0.02 0.007 25.8 0.066 0.31 0.138 0.02 0.095 29.4 8.32 9.09
PH539 2.2‐3.2
26.2 0.0005 0.02 0.018 26.1 0.073 0.33 0.141 0.022 0.091 29.8 8.77 8.97
PH539 3.2‐4.2
26.2 0.0005 0.02 0.008 26 0.077 0.33 0.14 0.025 0.093 29.6 8.76 9.14
PH539 4.2‐5.2
26 0.001 0.03 0.008 25.1 0.088 0.34 0.135 0.02 0.095 30.6 8.37 9.04
PH539 5.2‐6.2
26.2 0.0005 0.06 0.012 23.3 0.094 0.34 0.124 0.027 0.103 32.1 7.58 9.5
PH539 6.2‐7.0
26.2 0.0005 0.15 0.008 22.8 0.087 0.34 0.128 0.02 0.115 31.8 7.29 10.05
PH539 7.0‐7.2
22.1 0.011 0.21 0.009 26.3 0.126 0.38 0.199 0.026 0.15 29.8 9.78 9.87
Average 25.52 0.003 0.06 0.012 25.67 0.080 0.33 0.147 0.023 0.12 30.14 8.38 9.30 Std. Dev. 1.36 0.00 0.07 0.01 1.85 0.02 0.03 0.02 0.00 0.03 1.13 0.72 0.41 Variance 1.8469 0.0000 0.0048 0.0000 3.4175 0.0005 0.0007 0.0006 0.0000 0.0012 1.2778 0.5255 0.1672 Hole PH540
DD Sample Al2O3 BaO CaO Cr2O3 Fe2O3 K2O MgO MnO Na2O P2O5 SiO2 TiO2 LOI
PH‐540A 26.8 <0.001 0.1 0.008 22.7 0.086 0.34 0.125 <0.001 0.115 31.5 7.26 10.45 PH‐540.1 26.2 0.005 0.09 0.004 23.3 0.087 0.35 0.128 0.002 0.116 31.7 7.6 10.45 PH‐540.2 26.2 0.008 0.04 0.003 23.7 0.1 0.35 0.124 0.002 0.101 31.3 7.79 9.77 PH‐540.3 26.8 0.004 0.03 0.003 24.2 0.094 0.33 0.122 0.009 0.095 30.4 7.72 9.55 PH‐540.4 26.2 0.003 0.02 0.004 25.2 0.086 0.34 0.133 0.003 0.089 29.8 8.4 9.34 PH‐540.5 26.6 0.004 0.02 0.006 25 0.08 0.32 0.126 0.001 0.087 29.4 7.94 9.57 PH‐540.6 26.2 0.006 0.02 0.003 25.3 0.083 0.33 0.134 0.005 0.089 29.7 8.45 9.47 PH‐540.7 26.3 0.006 0.02 0.003 25.4 0.074 0.31 0.136 <0.001 0.101 29.6 8.13 9.43
average 26.4125 0.005 0.043 0.004 24.35 0.086 0.33 0.129 0.004 0.099 30.43 7.91 9.75 Std. Dev. 0.27 0.00 0.03 0.00 1.03 0.01 0.01 0.01 0.00 0.01 0.94 0.41 0.45 Variance 0.0755 0.0000 0.0011 0.0000 1.0600 0.0001 0.0002 0.0000 0.0000 0.0001 0.8850 0.1643 0.2002 Rel. Diff of Means
‐1.760% 36.158% 11.047% 46.127% 2.643% ‐7.069% ‐5.026% 47.622% 82.632% 13.971%
‐0.819% 1.615%
‐2.888%
Original Al2O3 BaO CaO Cr2O3 Fe2O3 K2O MgO MnO Na2O P2O5 SiO2 TiO2 LOI
PH540 0‐0.3
24.8 0.06 0.03 0.018 27 0.047 0.28 1.095 0.022 0.179 28.6 7.22 9.35
PH540 0.3‐1.3
26.3 0.0005 0.02 0.008 25.7 0.063 0.3 0.139 0.022 0.102 29.8 8.08 8.98
PH540 1.3‐2.3
26.8 0.0005 0.02 0.01 24.9 0.072 0.3 0.128 0.019 0.089 29.6 7.86 9.22
PH540 2.3‐3.3
26.5 0.0005 0.02 0.007 24.9 0.076 0.3 0.133 0.015 0.087 29.7 8.11 9.22
PH540 3.3‐4.3
26.8 0.0005 0.02 0.007 25 0.081 0.32 0.132 0.022 0.089 30.2 8.14 9.26
PH540 4.3‐5.3
26.4 0.0005 0.02 0.005 24.9 0.081 0.32 0.129 0.023 0.093 30 8.13 9.22
PH540 5.3‐6.3
26.6 0.003 0.05 0.005 23.7 0.095 0.33 0.127 0.023 0.099 31.7 7.81 9.42
PH540 6.3‐7.5
26.1 0.002 0.09 0.005 22.9 0.086 0.33 0.128 0.017 0.121 31.7 7.3 10.15

MINERALS ADVISORY GROUP, LLC
82 URANIUM ENERGY CORP – Technical Report and Resource Estimate on Alto Paraná Project Date: Aug 11, 2017
PH540 7.5‐7.7
23.3 0.005 0.16 0.006 26.1 0.124 0.38 0.197 0.027 0.178 30.3 9.72 10.5
average 25.96 0.008 0.05 0.008 25.01 0.081 0.32 0.245 0.021 0.115 30.18 8.04 9.48 Std. Dev. 1.17 0.02 0.05 0.00 1.22 0.02 0.03 0.32 0.00 0.04 0.99 0.72 0.50 Variance 1.3578 0.0004 0.0023 0.0000 1.4786 0.0005 0.0008 0.1020 0.0000 0.0014 0.9844 0.5190 0.2514 Hole PH541
DD Sample Al2O3 BaO CaO Cr2O3 Fe2O3 K2O MgO MnO Na2O P2O5 SiO2 TiO2 LOI
PH‐541.1 26.8 0.004 0.15 0.003 22.1 0.102 0.33 0.12 0.001 0.12 31.6 6.93 10.8 PH‐541.2 26.9 0.009 0.06 0.005 22.7 0.105 0.34 0.118 <0.001 0.104 31.6 7.27 10.25 PH‐541.3 26.7 0.003 0.03 0.004 24.4 0.097 0.34 0.128 0.003 0.095 30 7.86 9.76 PH‐541.4 26.7 0.003 0.02 0.002 24.5 0.088 0.32 0.133 <0.001 0.095 29.6 7.97 9.59 PH‐541.5 26.7 <0.001 0.02 0.003 24.5 0.088 0.32 0.129 <0.001 0.09 29.4 7.99 9.55 PH‐541.6 27.2 0.003 0.02 0.003 24.7 0.084 0.31 0.128 0.001 0.094 29.7 7.78 9.57
Average 26.83 0.004 0.05 0.003 23.82 0.094 0.33 0.126 0.002 0.100 30.32 7.63 9.92 Std. Dev. 0.20 0.00 0.05 0.00 1.12 0.01 0.01 0.01 0.00 0.01 1.01 0.43 0.51 Variance 0.0387 0.0000 0.0026 0.0000 1.2497 0.0001 0.0001 0.0000 0.0000 0.0001 1.0257 0.1880 0.2554 Rel. Diff of Means
‐2.897% 60.201% 28.571% 58.333% 2.257% ‐4.703% ‐8.088% 8.475% 95.536% 7.047%
‐0.869% 3.660%
‐0.371%
Original Al2O3 BaO CaO Cr2O3 Fe2O3 K2O MgO MnO Na2O P2O5 SiO2 TiO2 LOI
PH541 0.01.
26.9 0.001 0.02 0.005 25.2 0.055 0.29 0.141 0.022 0.131 29.1 7.83 9.69
PH541 0.1‐1.1
26.6 0.0005 0.02 0.005 25.2 0.07 0.3 0.141 0.02 0.103 29.8 8.01 9.29
PH541 1.1‐2.1
27.6 0.0005 0.02 0.006 23.8 0.08 0.29 0.122 0.02 0.096 30.2 7.22 9.36
PH541 2.1‐3.1
27 0.0005 0.02 0.005 24.4 0.082 0.3 0.13 0.02 0.091 30 7.89 9.29
PH541 3.1‐4.1
27.1 0.004 0.02 0.007 24.6 0.084 0.31 0.134 0.016 0.094 30.2 7.91 9.35
PH541 4.1‐5.1
25.7 0.021 0.05 0.011 24.5 0.09 0.29 0.129 0.045 0.091 29.6 8.05 9.82
PH541 5.1‐6.1
25.5 0.021 0.06 0.011 23.4 0.11 0.3 0.122 0.094 0.097 31.3 7.8 10.1
PH541 6.1‐6.9
26.2 0.019 0.15 0.01 22.5 0.097 0.29 0.124 0.038 0.114 31.2 7.13 10.95
PH541 6.9‐7.1
22.1 0.032 0.27 0.012 25.7 0.14 0.35 0.196 0.061 0.148 29.1 9.47 11.1
Average 26.08 0.011 0.07 0.008 24.37 0.090 0.30 0.138 0.037 0.107 30.06 7.92 9.88 Std. Dev 1.64 0.01 0.09 0.00 1.00 0.02 0.02 0.02 0.03 0.02 0.79 0.67 0.70 Variance 2.6844 0.0001 0.0074 0.0000 0.9975 0.0006 0.0004 0.0005 0.0007 0.0004 0.6253 0.4456 0.4961
The data show reasonable comparability between the original and due diligence
samples in terms of relative difference of the means of the due diligence sample
versus the original sample, especially for the major oxides of interest. Some of the
larger differences for some elements are attributed to variations in sample lengths
between the original samples and the due diligence samples.

MINERALS ADVISORY GROUP, LLC
83 URANIUM ENERGY CORP – Technical Report and Resource Estimate on Alto Paraná Project Date: Aug 11, 2017
Shallow (1m) auger drill samples were collected from sites adjacent to highway 536
at approximate 1 km intervals over a distance of over 20 km. This data provided a
general indication of the surface of the deposit in a northeast-southwest direction.
The results of the analyses are provided in Table 12-2.
TABLE 12-2: DUE DILIGENCE SAMPLES 1 m Auger Drill Samples (Source: Hains, 2012)
Al2O3 BaO CaO Cr2O3 Fe2O3 K2O MgO MnO Na2O P2O5 SiO2 TiO2 LOI
DH 01 26.5 0.002 0.1 0.005 22.9 0.084 0.36 0.117 <0.001 0.116 31.2 6.98 10.65
DH 02 27.9 0.009 0.14 0.006 20.5 0.11 0.35 0.109 0.004 0.122 33.5 6.25 10.85
DH 03 29.9 0.006 0.16 0.038 17.65 0.139 0.32 0.075 0.009 0.116 35.9 4.52 11.5
DH 04 30.1 0.002 0.06 0.01 17.45 0.1 0.26 0.068 0.005 0.086 36.9 2.9 12.25
DH 05 28.3 0.004 0.06 0.029 22.1 0.069 0.27 0.106 <0.001 0.09 33.2 4.53 11.35
DH 06 28.1 0.001 0.04 0.027 24.3 0.064 0.3 0.117 <0.001 0.102 29.9 4.91 11.6
DH 07 27.6 0.001 0.04 0.01 24.1 0.083 0.27 0.123 <0.001 0.102 30.4 5.96 10.9
DH 08 26.7 0.001 0.04 0.012 25.9 0.062 0.31 0.151 <0.001 0.127 29.3 6.64 10.8
DH 09 26.4 <0.001 0.04 0.005 25.5 0.064 0.33 0.138 <0.001 0.12 28.1 7.49 11.7
DH 10 26.8 0.006 0.18 0.028 17.15 0.071 0.31 0.069 <0.001 0.108 39.3 5.53 10.55
DH 11 29 0.006 0.14 0.005 15.9 0.124 0.29 0.083 0.005 0.078 38.1 4.9 11.1
DH 12 24.6 0.003 0.02 0.012 18.9 0.071 0.29 0.105 <0.001 0.084 40 6.27 9.99
DH 13 23.1 0.002 0.07 0.004 23.7 0.071 0.35 0.157 <0.001 0.078 34.8 8.58 9.05
DH 14 27.1 0.003 0.08 0.014 22.4 0.071 0.33 0.136 <0.001 0.118 32.8 6.69 10.95
DH 15 24 0.003 0.11 0.004 27.3 0.049 0.36 0.173 <0.001 0.12 28.9 9.51 9.52
DH 16 28.1 0.009 0.18 0.008 21.5 0.106 0.31 0.127 0.002 0.134 33.1 5.71 11.05
DH 17 30.4 0.006 0.09 0.005 17.25 0.126 0.3 0.07 0.006 0.114 37.3 3.7 11.65
DH 18 28.4 0.003 0.16 0.009 13.8 0.126 0.26 0.06 0.006 0.079 43.1 3.49 11
Average 27.39 0.00 0.10 0.01 21.02 0.09 0.31 0.11 0.01 0.11 34.21 5.81 10.91
StDev 2.01 0.00 0.05 0.01 3.87 0.03 0.03 0.03 0.00 0.02 4.27 1.73 0.79
Variance 4.0481 0.0000 0.0028 0.0001 14.9403 0.0007 0.0011 0.0011 0.0000 0.0003 18.2422 2.9869 0.6177
RSD 7.35% 66.21% 56.08% 80.86% 18.39% 30.87% 10.60% 30.66% 40.45% 17.47% 12.48% 29.75% 7.20%
This data compares favourably with the results of the 1 m auger drill samples from
adjacent areas.
Particle size analysis of samples from two pits in the pilot plant area are provided in
Table 12-2 and Figures 12-1 and 12-2. The data are for dried but not blunged
samples and thus show larger particle sizes than blunged material. Despite this

MINERALS ADVISORY GROUP, LLC
84 URANIUM ENERGY CORP – Technical Report and Resource Estimate on Alto Paraná Project Date: Aug 11, 2017
defect, the data are consistent with assay and laboratory test data showing a
relatively fine material and decreasing TiO2 and Fe2O3 content with decreasing
particle size.
TABLE 12-3: PARTICLE SIZE ANALYSIS – DUE DILIGENCE SAMPLES Pits 541 and 537 (Source: Hains, 2012)
SAMPLE Recvd Wt. +1180 um +1000 um +600um +250um +106um +75um +38um
DESCRIPTION kg g g g g g g g PH-541.1 0.71 164.8 25.4 76.1 191.5 157.4 51.5 33.4 PH-541.2 0.69 156.7 24.4 72.5 180.4 169.6 43.7 30 PH-541.3 0.89 213.2 34 110.1 238.4 197.1 56.2 37.2 PH-541.4 0.84 218.9 37 111.4 208.5 181.3 42.2 35 PH-541.5 0.79 204.9 36.2 114.6 204.3 159.2 30.7 40.9 PH-541.6 0.99 273.1 43.3 137.8 231.3 202.9 67.8 35 PH-537.1 0.5 123.2 19.5 58.5 133.7 105.1 34.2 26.5 PH-537.2 0.79 166.1 26.5 90.4 250.4 168.6 52.4 32.7 PH-537.3 0.97 243.7 36.2 123 276 196.2 52.7 35 PH-537.4 1.03 252.1 45.9 144.6 277.3 190.8 75.2 32.1 PH-537.5 0.84 228.7 43.4 122.7 193.6 150.1 59.9 31.7 Total 9.04 2245.4 371.8 1161.7 2385.4 1878.3 566.5 369.5
Figure 12-2: particle size distribution (Source: Hains, 2012)
Particle Size Distribution
0.00%
10.00%
20.00%
30.00%
40.00%
50.00%
60.00%
70.00%
80.00%
90.00%
100.00%
+38u
m
+75u
m
+106
um
+250
um
+600
um
+100
0 um
+118
0 um
% P
as
sin
g
Combined % Passing
Pit 541 % Passing
Pit 537 % Passing
Due Diligence Samples

MINERALS ADVISORY GROUP, LLC
85 URANIUM ENERGY CORP – Technical Report and Resource Estimate on Alto Paraná Project Date: Aug 11, 2017
FIGURE 12-3: ASSAYS BY SIZE FRACTION AND DEPTH Due Diligence Samples (Source: Hains, 2012)
TiO2 % by Size Fraction and Depth
0
2
4
6
8
10
12
0-1m 1m - 2m 2m - 3m 3-m - 4m 4m - 5m 5m - 6m
Depth (m)
TiO
2 (w
t%)
+1180 um
+1000 um
+600 um
+250 um
+106 um
+75 um
+38 um
Pit 541
Fe2O3 % by Size Fraction and Depth
0
5
10
15
20
25
30
0-1m 1m - 2m 2m - 3m 3-m - 4m 4m - 5m 5m - 6m
Depth (m)
Fe
2O3
(wt%
)
+1180 um
+1000 um
+600 um
+250 um
+106 um
+75 um
+38 um
Pit 541

MINERALS ADVISORY GROUP, LLC
86 URANIUM ENERGY CORP – Technical Report and Resource Estimate on Alto Paraná Project Date: Aug 11, 2017
Review of the pit assay data base against the assay certificates did not reveal any
discrepancies and in the opinion of the author, the assay data is of adequate
accuracy and precision for use in the technical report.
TiO2 % by Particle Size and Depth
0
2
4
6
8
10
12
0-1m 1m - 2m 2m - 3m 3-m - 4m 4m - 5m
Depth (m)
TiO
2 (w
t%)
+1180 um
+1000 um
+600 um
+250 um
+106 um
+75 um
+38 um
Hole 537
Fe2O3 % by Particle Size and Depth
0
5
10
15
20
25
30
0-1m 1m - 2m 2m - 3m 3-m - 4m 4m - 5m
Depth (m)
Fe
2O3
(wt%
)
+1180 um
+1000 um
+600 um
+250 um
+106 um
+75 um
+38 um
Pit 537

MINERALS ADVISORY GROUP, LLC
87 URANIUM ENERGY CORP – Technical Report and Resource Estimate on Alto Paraná Project Date: Aug 11, 2017
13 MINERAL PROCESSING AND METALLURGICAL TESTING
Typical titanium rich sand deposits use well proven mineral processing technology to
recover the valuable minerals. The Alto Paraná titanium sand mineralization is embedded
in a clay matrix and represents what appears to be a “one of a kind” resource. As such no
existing plant or operation has attempted the recovery of ilmenite / titanomagnetite from a
material with 60% – 75% fines. For this reason it was deemed necessary to demonstrate
that technology could be developed to successfully recover titania bearing minerals from
Paraná lateritic materials.
CIC undertook an extensive program of mineral processing and metallurgical test work in
2009 designed to produce a high quality ilmenite and magnetite concentrates. This work
program involved both laboratory scale and pilot plant scale test work. Concentrate
production has been followed by process modeling studies, laboratory scale and pilot plant
scale smelting tests for production of titanium dioxide slag and high quality pig iron. At
the end of 2011, approximately 108 tons of concentrate were produced in the pilot plant
in Paraguay. This material was used as feed for pilot plant smelting tests at MINTEK in
South Africa during the first quarter of 2012. The smelting test work was successfully
completed during the week of March 25, 2012.
MINERAL PROCESSING
LABORATORY TEST WORK
Initial mineral processing test work was undertaken in 2009 based on laboratory scale
processing of laterite samples collected from test pits. This work, which was supervised
by Minerals Advisory Group LLC, Tucson, Arizona (MAG) involved materials
characterization to define the chemistry, mineralogy and physical characteristics of the
laterite, followed by experimental work at Minerals Advisory Group Research and
Development (Tucson) to establish a potential flow sheet for recovery of the ilmenite and
magnetite. Chemical and mineralogical analysis shows the following characteristic
analysis for the laterite (Table 13-1).

MINERALS ADVISORY GROUP, LLC
88 URANIUM ENERGY CORP – Technical Report and Resource Estimate on Alto Paraná Project Date: Aug 11, 2017
TABLE 13-1: TYPICAL LATERITE CHEMICAL AND MINERALOGICAL ANALYSIS (SOURCE: MAG, 2009)
CIC-CI Alto Paraná Project
Chemical Analysis1 (wt%)
Al2O3 BaO
CaO
Cr2O3
Fe2O3
K2O MgO
MnO
Na2
O P2O5
SiO2
TiO2
LOI
22.50
0.01 0.05 0.01 26.01 0.08
0.29 0.14 0.02 0.10 31.0 8.04 11.70
Trace Element Analysis2 (ppm)
S Cl V Co
Ni W Cu Zn As Sn Pb
Mo Sr U Th Nb
Zr Rb
Y
500 200 760 47 57 <10 321 130 <20 105 25 <10 13 <20 <20 56 612 18 41
Typical Mineralogical Analysis3 Mineral Name Chemical Formula Approx. Wt% Kaolinite Al2Si2O5(OH)4 65 Gibbsite Al(OH)3 <5 Hematite Fe2O3 9 Magnetite (Maghemite) (Fe,Mn,Zn,Cu,Ni)(Fe,Al,Cr)2O4
7 Ilmenite FeOTiO2 8 Quartz SiO2 <5 Rutile TiO2 <2 Other ? <5
1) by lithium borate fusion, ICP 2) by XRF 3) by XRD
The amount of kaolinite in the laterite can vary from 50% to 75% depending on the location
of the sample and depth of sample. The ilmenite and titanomagnetite/hematite are present
in the laterite as free particles. Figure 13-1 provides a micrograph of typical heavy mineral
particles obtained from a panned laterite sample.

MINERALS ADVISORY GROUP, LLC
89 URANIUM ENERGY CORP – Technical Report and Resource Estimate on Alto Paraná Project Date: Aug 11, 2017
FIGURE 13-1: MICROGRAPH OF PANNED HEAVY MINERAL SAMPLE CIC-CI Alto Paraná Project (Source: MAG, 2009)
Over 97% of the titanium values are present at less than a 28 mesh particle size (600 μm),
with +28 mesh material primarily being in the form of ilmenite-titanomagnetite nodules
found near the interface between the saprolite and laterite. Particle size determination by
Pocock Industrial Inc. of a hydroseparator feed material wet screened at 500 mesh (25
micron), followed by dry screening of the oversize fraction, showed the following (Table
13-2):
TABLE 13-2: PARTICLE SIZE ANALYSIS CIC-CI Resources Alto Paraná Project (Source: MAG, 2009)
As kaolinite and other clay particles are by definition <25 micron (500mesh), the relevant
product fraction is +25 micron (500 mesh). Figure 13-2 provides concentrate particle size

MINERALS ADVISORY GROUP, LLC
90 URANIUM ENERGY CORP – Technical Report and Resource Estimate on Alto Paraná Project Date: Aug 11, 2017
data for some typical sample composites. These data are for concentrates that were
subjected to differential settlement and cleaning by elution to remove the -500 mesh
particles. The first graph is for a relatively low grade concentrate compared to the data for
PH 109. Overall, it was determined that the average (P50) particle size for the ilmenite was
135μ and 165μ for the iron oxide particles in the +500 mesh material.
FIGURE 13-2: TYPICAL CONCENTRATE PARTICLE SIZE ANALYSIS CIC-CI Alto Paraná Project (Source: MAG, 2010)
Composite A : PH 74, 78, 81, 82 & 84 Pit Composite
A relationship exists between particle size distribution and TiO2 head grade, as illustrated
by the grade-recovery data in Figure 13-3:
FIGURE 13-3: ILMENITE HEAD GRADE VS PARTICLE SIZE
CIC-CI Alto Paraná Project (Source: MAG, 2009)
Composite B: PH 109 Composite
0
10
20
30
40
50
60
70
80
90
100
0 50 100 150 200 250 300 350 400 450 500
WE
IGH
T %
PA
SS
ING
CU
MU
LATI
VE
PARTICLE SIZE (microns)

MINERALS ADVISORY GROUP, LLC
91 URANIUM ENERGY CORP – Technical Report and Resource Estimate on Alto Paraná Project Date: Aug 11, 2017
Laboratory test work on beneficiation of the material determined that blunging1, followed
by screening, elution and magnetic separation, was the most effective method to achieve
high recoveries of both ilmenite and magnetite/titanomagnetite with good grade.
Elutriation was found to be highly effective in producing a concentrate with a relatively
narrow particle size distribution and minimum fines. Figure 13-4 illustrates the particle size
distribution of the eluted fines from a cleaned concentrate produced from composite as
illustrated in Figure 13-2.
FIGURE 13-4: PARTICLE SIZE DISTRIBUTION OF ELUTED FINES FROM CLEANED CONCENTRATE (SOURCE MAG: 2010)
CIC-CI Resources Alto Paraná Project
Theis data indicates a P80 of approximately 25 microns for the eluted fines, with an average
particle size of 6 – 7 microns. Analysis indicated most of the +25 micron particles were
silica, thus elution acts as both a fines removal and a concentration process.
Magnetic separation tests of the eluted concentrate involved low intensity magnetic
separation followed by high intensity separation. Initial test work was undertaken in open
circuit configuration at Outotec Inc. in Jacksonville, FL. The test results indicated two
1 Blunging refers to high shear dispersion of clay matrix minerals in water
0
10
20
30
40
50
60
70
80
90
100
0 100 200 300 400 500
WE
IGH
T %
PA
SS
ING
CU
MU
LA
TIV
E
PARTICLE SIZE (microns)
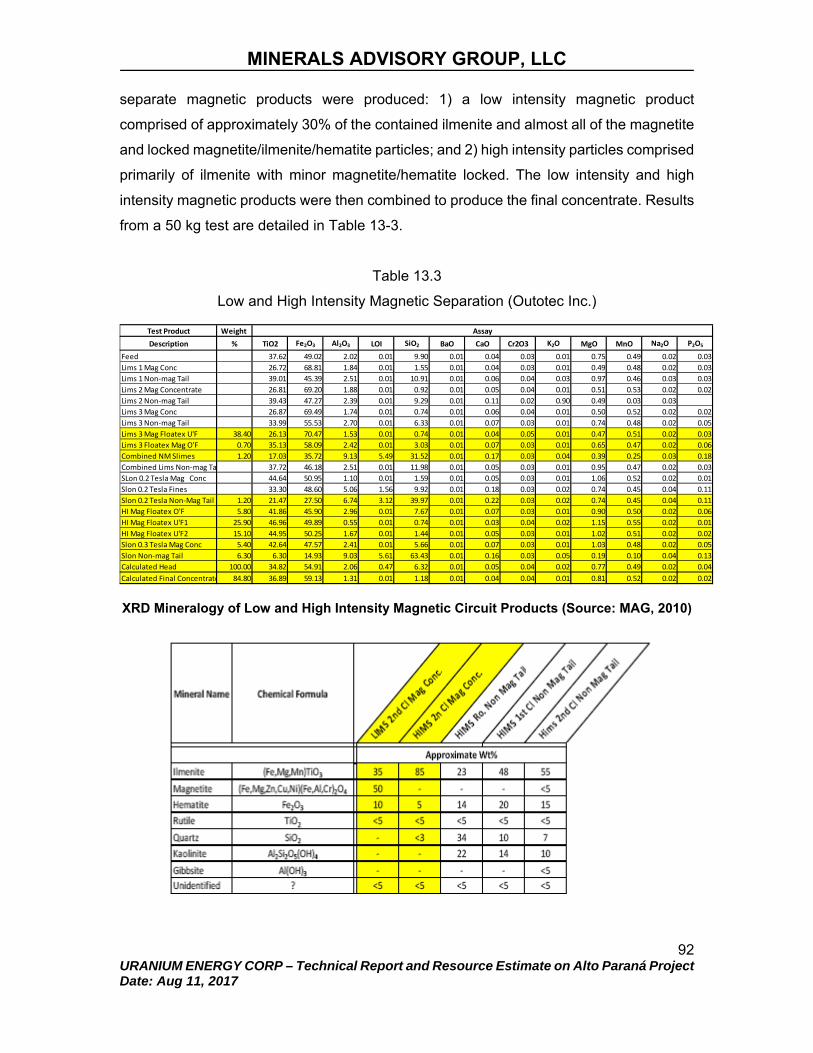
MINERALS ADVISORY GROUP, LLC
92 URANIUM ENERGY CORP – Technical Report and Resource Estimate on Alto Paraná Project Date: Aug 11, 2017
separate magnetic products were produced: 1) a low intensity magnetic product
comprised of approximately 30% of the contained ilmenite and almost all of the magnetite
and locked magnetite/ilmenite/hematite particles; and 2) high intensity particles comprised
primarily of ilmenite with minor magnetite/hematite locked. The low intensity and high
intensity magnetic products were then combined to produce the final concentrate. Results
from a 50 kg test are detailed in Table 13-3.
Table 13.3
Low and High Intensity Magnetic Separation (Outotec Inc.)
XRD Mineralogy of Low and High Intensity Magnetic Circuit Products (Source: MAG, 2010)
Test Product Weight Description % TiO2 Fe2O3 Al2O3 LOI SiO2 BaO CaO Cr2O3 K2O MgO MnO Na2O P2O5
Feed 37.62 49.02 2.02 0.01 9.90 0.01 0.04 0.03 0.01 0.75 0.49 0.02 0.03
Lims 1 Mag Conc 26.72 68.81 1.84 0.01 1.55 0.01 0.04 0.03 0.01 0.49 0.48 0.02 0.03
Lims 1 Non‐mag Tail 39.01 45.39 2.51 0.01 10.91 0.01 0.06 0.04 0.03 0.97 0.46 0.03 0.03
Lims 2 Mag Concentrate 26.81 69.20 1.88 0.01 0.92 0.01 0.05 0.04 0.01 0.51 0.53 0.02 0.02
Lims 2 Non‐mag Tail 39.43 47.27 2.39 0.01 9.29 0.01 0.11 0.02 0.90 0.49 0.03 0.03
Lims 3 Mag Conc 26.87 69.49 1.74 0.01 0.74 0.01 0.06 0.04 0.01 0.50 0.52 0.02 0.02
Lims 3 Non‐mag Tail 33.99 55.53 2.70 0.01 6.33 0.01 0.07 0.03 0.01 0.74 0.48 0.02 0.05
Lims 3 Mag Floatex U'F 38.40 26.13 70.47 1.53 0.01 0.74 0.01 0.04 0.05 0.01 0.47 0.51 0.02 0.03
Lims 3 Floatex Mag O'F 0.70 35.13 58.09 2.42 0.01 3.03 0.01 0.07 0.03 0.01 0.65 0.47 0.02 0.06
Combined NM Slimes 1.20 17.03 35.72 9.13 5.49 31.52 0.01 0.17 0.03 0.04 0.39 0.25 0.03 0.18
Combined Lims Non‐mag Ta 37.72 46.18 2.51 0.01 11.98 0.01 0.05 0.03 0.01 0.95 0.47 0.02 0.03
SLon 0.2 Tesla Mag Conc 44.64 50.95 1.10 0.01 1.59 0.01 0.05 0.03 0.01 1.06 0.52 0.02 0.01
Slon 0.2 Tesla Fines 33.30 48.60 5.06 1.56 9.92 0.01 0.18 0.03 0.02 0.74 0.45 0.04 0.11
Slon 0.2 Tesla Non‐Mag Tail 1.20 21.47 27.50 6.74 3.12 39.97 0.01 0.22 0.03 0.02 0.74 0.45 0.04 0.11
HI Mag Floatex O'F 5.80 41.86 45.90 2.96 0.01 7.67 0.01 0.07 0.03 0.01 0.90 0.50 0.02 0.06
HI Mag Floatex U'F1 25.90 46.96 49.89 0.55 0.01 0.74 0.01 0.03 0.04 0.02 1.15 0.55 0.02 0.01
HI Mag Floatex U'F2 15.10 44.95 50.25 1.67 0.01 1.44 0.01 0.05 0.03 0.01 1.02 0.51 0.02 0.02
Slon 0.3 Tesla Mag Conc 5.40 42.64 47.57 2.41 0.01 5.66 0.01 0.07 0.03 0.01 1.03 0.48 0.02 0.05
Slon Non‐mag Tail 6.30 6.30 14.93 9.03 5.61 63.43 0.01 0.16 0.03 0.05 0.19 0.10 0.04 0.13
Calculated Head 100.00 34.82 54.91 2.06 0.47 6.32 0.01 0.05 0.04 0.02 0.77 0.49 0.02 0.04
Calculated Final Concentrate 84.80 36.89 59.13 1.31 0.01 1.18 0.01 0.04 0.04 0.01 0.81 0.52 0.02 0.02
Assay

MINERALS ADVISORY GROUP, LLC
93 URANIUM ENERGY CORP – Technical Report and Resource Estimate on Alto Paraná Project Date: Aug 11, 2017
Laboratory investigations of tailings management involved tests of high rate thickening for
differential settling, decant tailings thickening and centrifugation of thickened tailings.
During test work, it was found that the elution tailings could be treated by pH adjustment
and the addition of flocculent to produce a high consistency settled solids suitable for
disposal in a tailings pond, with minimal requirements for centrifugation of the thickener
overflow to remove residual solids. Figure 13-5 illustrates the laboratory test work showing
tailings thickening.
FIGURE 13-5: LABORATORY TAILINGS THICKENING TEST Alto Paraná Project (Source: MAG, 2010)
Based on the results of the laboratory test work, a pilot plant was designed with a capacity
of approximately 1.5 tonnes per hour to the blunging circuit. This pilot plant was shipped
to Paraguay and installed on the project site in August, 2011.
PILOT PLANT TEST WORK
The demonstration plant was designed to accomplish the following objectives:
Provide an opportunity to scale up from batch processing to a continuous operation;
Demonstrate the separation of heavy titanium/iron rich sands from a 60-70% kaolinite laterite matrix;
Operate a plant large enough to produce 108 metric tonnes of concentrate for arc furnace smelting tests at MINTEK, South Africa;

MINERALS ADVISORY GROUP, LLC
94 URANIUM ENERGY CORP – Technical Report and Resource Estimate on Alto Paraná Project Date: Aug 11, 2017
Demonstrate the ability of a continuous circuit to reproduce the quality of final concentrate expected from large scale laboratory tests;
Demonstrate a process capable of operating at natural pH to allow the return of process tailings to the environment at a pH suitable to promote agricultural use of mined out areas;
Optimize process reagents to minimize operating costs and exclude reagents that potentially could be harmful to the environment; and
Develop tailings handling technology suitable to return clean recycle water to process and high percent solids tailings suitable for pumping and direct deposition as mine backfill.
MYNM extracted 8,000 tonnes of feed material from its 30 hectare property in Minga Pora,
Paraguay. Exploration pits were dug by CIC’s geological exploration group, sampled and
used as the basis for locating the test pit. The exploration pits suggested 8.0% TiO2 feed
material would be extracted and site sampling of extracted material averaged 7.97% TiO2,
confirming the exploration pit projections. About 3,000 tonnes of material were stockpiled
for feed to the plant and 5,000 tonnes used to berm the extraction pit to be used for tailings
disposal.
The pilot plant was used to demonstrate process unit operations as well as provide
opportunities for process development and demonstration of mining methods. Figures 13-
6 and 13-7 illustrate the mine area, tailings area and the pilot plant.
FIGURE 13-6: PILOT PLANT PIT AND TAILINGS POND Alto Paraná Project (Source: MAG, 2011)
Pit Area with Tailings Sump Tailings O/F Water Recycle Pond

MINERALS ADVISORY GROUP, LLC
95 URANIUM ENERGY CORP – Technical Report and Resource Estimate on Alto Paraná Project Date: Aug 11, 2017
FIGURE 13-7: CIC RESOURCES PILOT PLANT Alto Paraná Project (Source: MAG, 2011)
Feed Load Ramp & Hopper Hydroseparator (red) Tank Blunger in background Elution (blue) Column Attrition Scrubber (green)
Adjustment Tanks and Sweco Screens High and Low Intensity Magnetic Separator
3D PERSPECTIVE OF PILOT PLANT (SOURCE: MAG, 2011)
Blunger
Blunger Feed Platform
Agitated Mixing Tanks Hydroseparator
Motor Control Center #2
Final Tailings Thickener (located at tailings dam)
Elutriator
R&D Containers
Motor Control Center #1
Magnetic Separators
M&E Thickener LI Non-magnetic Tailings

MINERALS ADVISORY GROUP, LLC
96 URANIUM ENERGY CORP – Technical Report and Resource Estimate on Alto Paraná Project Date: Aug 11, 2017
The pilot plant was designed from the laboratory test data, with equipment selected and
sized for a production rate of 1.5 tph in accordance with the materials balances detailed
in Figure 13-8. A laterite moisture content of 25% - 28% was assumed. The product grades
and distributions detailed in Figure 13-8 were based on the results of the magnetic
separation tests at Outotec on 110 kg laboratory concentrate.
FIGURE 13-8: SIMPLIFIED BLOCK FLOW DIAGRAM AND PROJECTED MASS BALANCE (SOURCE: MAG, 2011)
Alto Paraná Project
The demonstration plant operated for approximately 3 months for operator training, ramp
up, circuit modification and concentrate production. Approximately 108 tons of combined
low intensity magnetic separation (LIMS) and high intensity magnetic separation (HIMS)
concentrates were produced. The products were packed in 240 sealed barrels and
shipped to MINTEK in South Africa in early December for arc furnace smelter tests.

MINERALS ADVISORY GROUP, LLC
97 URANIUM ENERGY CORP – Technical Report and Resource Estimate on Alto Paraná Project Date: Aug 11, 2017
The projected pilot plant metallurgy shown in Figure 13-8 and Table 13-3 compared well
with actual results. Table 13-4 illustrates results from November 9, 2011 for a feed material
having approximately the same head grade as in Figure 13-8.
TABLE 13-4: PILOT PLANT MASS BALANCE – TYPICAL RESULT November 9, 2011 (Source: MAG)
Alto Paraná Project
During pilot plant operation, it was decided to recycle the elution column overflow to the
blunger. This was done to minimize loss of ilmenite and magnetite and also to assist in
the plant water balance. The distribution of products in Table 13-4 has been adjusted by
an estimate of the tonnage reporting to the hydrosizer overflow based on percent solids
and flow rate of the stream. Similarly, the products to magnetic separation have been
adjusted by an estimate from the tonnage reporting to the high and low intensity magnetic
concentrates. The combined grade of LIMS and HIMS is lower than plant practice, but
represents the results for the shift in question. The mass balance rejects the HIMS
scavenger concentrate; however, the entrained ilmenite in the scavenger concentrate is
recoverable at grade by tabling. This could potentially increase total TiO2 recovery.
The TiO2 grades of LIMS and HIMS as compared to those reporting to final concentrate
barrel samples are very similar to the test samples produced at Outotec. The
demonstration plant LIMS circuit lost a minor amount of magnetite to the HIMS circuit and
entrained or recovered a notable amount of ilmenite to the LIMS concentrate. As a result
the Outotec work suggested a LIMS concentrate of about 26% TiO2 and a HIMS
TiO2 Fe2O3 Al2O3 SiO2 TiO2 Fe2O3 Al2O3 SiO2
% % % % % % % % %0 Blunger Feed 100.0 8.6 23.8 25.8 31.8 99.8 108.1 99.3 94.1
1 Blunger O"F 112.2 8.6 25.3 25.2 30.7 112.5 119.4 109.5 108.4
2 Hydrosizer O"F 78.3 2.5 18.1 30.1 35.7 23.1 59.6 91.3 88.0
3 Hydrosizer U"F 33.9 22.7 38.4 11.5 21.1 89.4 54.8 15.0 22.5
4 Elution O"F 12.2 8.9 22.0 21.6 37.2 12.6 11.3 10.2 14.3
5 Elution U"F 20.7 31.9 49.8 5.8 11.3 76.8 43.5 4.8 8.2
6 Lims Tail 13.0 35.8 41.0 5.9 13.5 54.1 22.5 3.0 5.5
7 LIMS Concentrate 7.7 29.4 64.7 1.9 1.2 26.3 21.0 0.6 0.3
8 Mag Thickener O"F 0.8 6.8 21.3 26.5 32.5 0.6 0.7 0.8 0.8
9 HIMS Feed 12.3 37.5 42.7 4.7 14.1 53.5 21.8 2.2 4.7
10 HIMS Conc #1 8.7 43.6 48.1 2.8 2.4 44.1 17.6 0.9 0.6
11 HIMS Scavenger Concentrate 3.6 29.0 33.7 7.0 27.0 8.9 3.6 0.6 3.1
12 HIMS Tail 0.8 6.9 19.1 22.9 39.6 0.6 0.6 0.7 0.9
Final Tail 83.4 3.4 18.4 28.9 35.4 33.2 59.6 94.0 98.6
Final Concentrate 16.4 36.9 55.9 2.4 1.8 70.5 35.7 1.5 1.0
Note: Hydrosizer O'F recycled to blunger rather than to tail.
WeightDistribution
ProductAssay
Stream

MINERALS ADVISORY GROUP, LLC
98 URANIUM ENERGY CORP – Technical Report and Resource Estimate on Alto Paraná Project Date: Aug 11, 2017
concentrate of about 46.4% TiO2 and a combined final concentrate of about 36.9% TiO2.
The demonstration plant produced on average a concentrate of about 46.4% TiO2 in the
HIMS concentrate and 29% TiO2 in the LIMS circuit and the combined concentrates of
37.5% TiO2 and 58.8% Fe2O3 (see Table 3-5).
TABLE 13-5: MAGNETIC CONCENTRATE COMPARISON – LABORATORY VS PILOT PLANT RESULTS (SOURCE: MAG, 2011)
Alto Paraná Project
Pilot Plant Results (Average of 84 t combined product)
Concentrate Barrels Al2O3 BaO CaO Cr2O3 Fe2O3 K2O MgO MnO Na2O P2O5 SiO2 SrO TiO2 LOI
Number % % % % % % % % % % % % % %
HIMS 90 0.95 0.014 0.017 0.011 50.14 0.005 1.10 0.53 0.031 0.015 1.76 0.002 46.38 2.92
LIMS 94 1.68 0.008 0.015 0.026 67.06 0.003 0.60 0.49 0.031 0.028 0.86 0.003 29.07 1.72
TOTAL 184 1.32 0.011 0.016 0.019 58.78 0.004 0.85 0.51 0.031 0.021 1.30 0.003 37.53 2.31
Laboratory Result, Combined Product
Concentrate Al2O3 BaO CaO Cr2O3 Fe2O3 K2O MgO MnO Na2O P2O5 SiO2 SrO TiO2 LOI % % % % % % % % % % % % % %
TOTAL 1.31 0.01 0.04 0.04 59.13 0.01 0.81 0.52 0.02 0.022 1.18 n.r. 36.89 2.20
Based on the assays for the pilot plant product, the combined LIMS and HIMS product
had the following mineralogical composition:
wt% ilmenite = % TiO2 X MW ilmenite = (37.53/79.90) x 151.70 = 71.27%
MW TiO2 Iron for ilmenite = % ilmenite - % TiO2 = 71.27% - 37.53% = 33.73% wt. % magnetite = Total iron – iron for ilmenite = 58.78% - 33.73% = 25.05% This calculation assumes all the residual iron is in the form of magnetite, which is not true
as iron is present in the residual clays, micas and pyroxenes.
Figure 13-9 displays the relative particle size distribution of LIMS, HIMS and combined
magnetic concentrates as produced from Alto Paraná samples in the laboratory, and
Figure 13-10 displays the average particle size distribution of concentrates produced in
the demonstration plant, both with and without the addition of polymer flocculent. The
laboratory LIMS particle size D50 is about 212µ, the HIMS about 110µ and the combined
concentrates about 150µ. The demonstration plant concentrates were coarser and
contained fewer -74µ particles. Plant operation set the hydrosizer rise rate to avoid

MINERALS ADVISORY GROUP, LLC
99 URANIUM ENERGY CORP – Technical Report and Resource Estimate on Alto Paraná Project Date: Aug 11, 2017
significant -45µ material reporting to the hydrosizer underflow. The plant LIMS concentrate
D50 is about 250µ, the HIMS concentrate about 150µ and the combined concentrates
about 180µ.
Plant operating conditions were modified during the early phase of ramp up. The planned
operation of the circuit included the addition of sodium hydroxide (NaOH) to modify the pH
to greater than 7.0 in feed preparation to facilitate optimum dispersion with sodium
polyacrylate (C-211). Laboratory usage of C-211 suggested an additional amount of about
2 kg/mt to achieve complete dispersion of kaolinite. In plant practice with local well water,
the level of acrylate addition proved to be 0.8-1.0 kg/mt at natural ph. Excellent dispersion
was achieved at natural pH, and NaOH was not necessary to modify the operating pH of
the demonstration plant blunging and mixing circuits.
The plant operating design included the addition of 0.35 kg/mt of anionic flocculent A110.
A two-step process of anionic flocculation of tailings and densification of tailings material
in a convention high rate thickener to include thickener overflow adjustment to pH 4.5-5.0
for further water treatment was originally designed. The system performed as expected;
however, the low pH water needed to be adjusted to neutral pH with NaOH for introduction
to the plant recycle water system.

MINERALS ADVISORY GROUP, LLC
100 URANIUM ENERGY CORP – Technical Report and Resource Estimate on Alto Paraná Project Date: Aug 11, 2017
FIGURE 13-9: MAGNETICS PRODUCTS PARTICLE SIZE DISTRIBUTION – LABORATORY RESULT (SOURCE: MAG, 2011)
Alto Paraná Project
FIGURE 13-10: MAGNETICS PRODUCTS PARTICLE SIZE DISTRIBUTION –
PILOT PLANT RESULT (SOURCE: MAG, 2011) Alto Paraná Project
0102030405060708090
100
10 1,000Cumulative Weigh
t Percent Passing
(%)
Screen Size Opening (microns)
Demonstration Plant ConcentratesWeight % passing screen size, LIMS, HIMS and combined magnetic concentrate.
LIMS Conc. HIMS Conc. Mag Conc.
Poly. (LIMS Conc.) Poly. (HIMS Conc.) Poly. (Mag Conc.)

MINERALS ADVISORY GROUP, LLC
101 URANIUM ENERGY CORP – Technical Report and Resource Estimate on Alto Paraná Project Date: Aug 11, 2017
Testing at site was initiated to avoid the use of sulfuric acid for pH modification and sodium
hydroxide for water neutralization. This was done to reduce the amount of sulphate
introduced to the recycle water. A redesigned reagent system that could operate at natural
pH and return clear water to process was developed. The revised processing scheme
allows operation with the use of only two reagents; sodium polyacrylate (0.8-1.0 kg/mt)
and A110 (0.15 kg/mt). The revised process will enable the production of suitable tailings
for pumping to backfill the extraction pit and produce a clean paste thickener overflow for
water recycle to the plant. The plant was modified to demonstrate the proprietary-new
technology during a plant run in 2012.
CONVERSION FROM CONVENTIONAL TO PASTE THICKENING
Following the initial pilot plant production run to produce concentrate for MINTEK smelter
testing, the plant was modified to test thickening and tailings management. The plant was
modified to test paste thickening as opposed to conventional thickening.
The paste thickener produced 36-40% solids underflow with low reagent consumption.
SMELTER TEST WORK
MNYM contracted with MINTEK of South Africa to undertake a series of test work related
to smelting of the ilmenite/magnetite concentrate. This work involved modeling of smelter
performance, slag and pig iron chemistry and mass and energy balances based on
concentrate assay results from the laboratory test work, small scale (5 kg) smelting of a
concentrate produced during the laboratory test work, computer modeling of pre-reduced
concentrate, and large scale smelting of concentrate produced form the pilot plant
operation. This latter work involved processing approximately 110 tons of concentrate and
was successfully completed the week of March 25, 2012.
The work at MINTEK is based on using a concentrate feed having less than 35% TiO2.
This restriction is due to current patent and other intellectual property agreements between
MINTEK and other parties related to DC electric arc smelting technology. The agreements
MINTEK has with third parties expire within the next 12 to 24 months. Upon expiration of
the agreements, both MINTEK and MYNM will be able to pursue development of smelting
options related to concentrate grading in excess of 35% TiO2. Such a development would
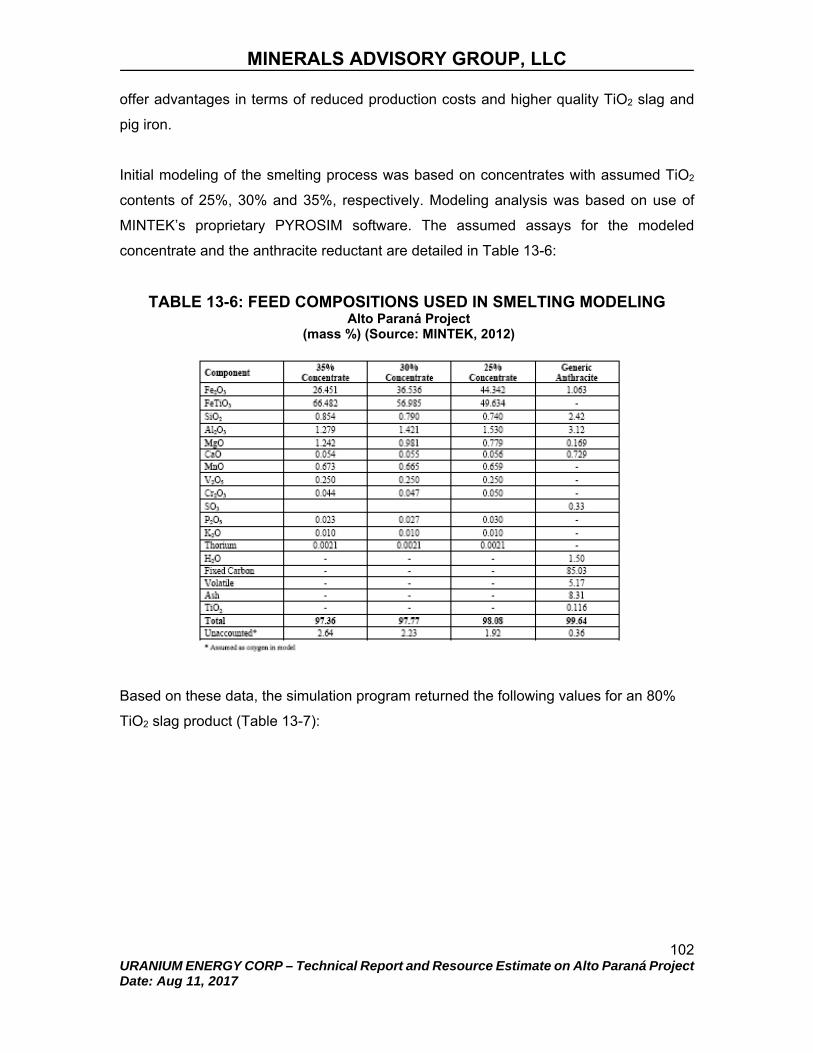
MINERALS ADVISORY GROUP, LLC
102 URANIUM ENERGY CORP – Technical Report and Resource Estimate on Alto Paraná Project Date: Aug 11, 2017
offer advantages in terms of reduced production costs and higher quality TiO2 slag and
pig iron.
Initial modeling of the smelting process was based on concentrates with assumed TiO2
contents of 25%, 30% and 35%, respectively. Modeling analysis was based on use of
MINTEK’s proprietary PYROSIM software. The assumed assays for the modeled
concentrate and the anthracite reductant are detailed in Table 13-6:
TABLE 13-6: FEED COMPOSITIONS USED IN SMELTING MODELING Alto Paraná Project
(mass %) (Source: MINTEK, 2012)
Based on these data, the simulation program returned the following values for an 80%
TiO2 slag product (Table 13-7):

MINERALS ADVISORY GROUP, LLC
103 URANIUM ENERGY CORP – Technical Report and Resource Estimate on Alto Paraná Project Date: Aug 11, 2017
TABLE 13-7: SIMULATION RESULTS Predicted FeO and TiO2 Content in Slag
(mass %) (Source: MINTEK, 2012)
Predicted Energy Requirement

MINERALS ADVISORY GROUP, LLC
104 URANIUM ENERGY CORP – Technical Report and Resource Estimate on Alto Paraná Project Date: Aug 11, 2017
TABLE 13-8: PREDICTED MASS AND ENERGY BALANCE SUMMARY FOR
35% TIO2 CONCENTRATE
(Source: MINTEK, 2012)
The simulation results indicated that both the TiO2 slag and the pig iron product would be
of acceptable quality.
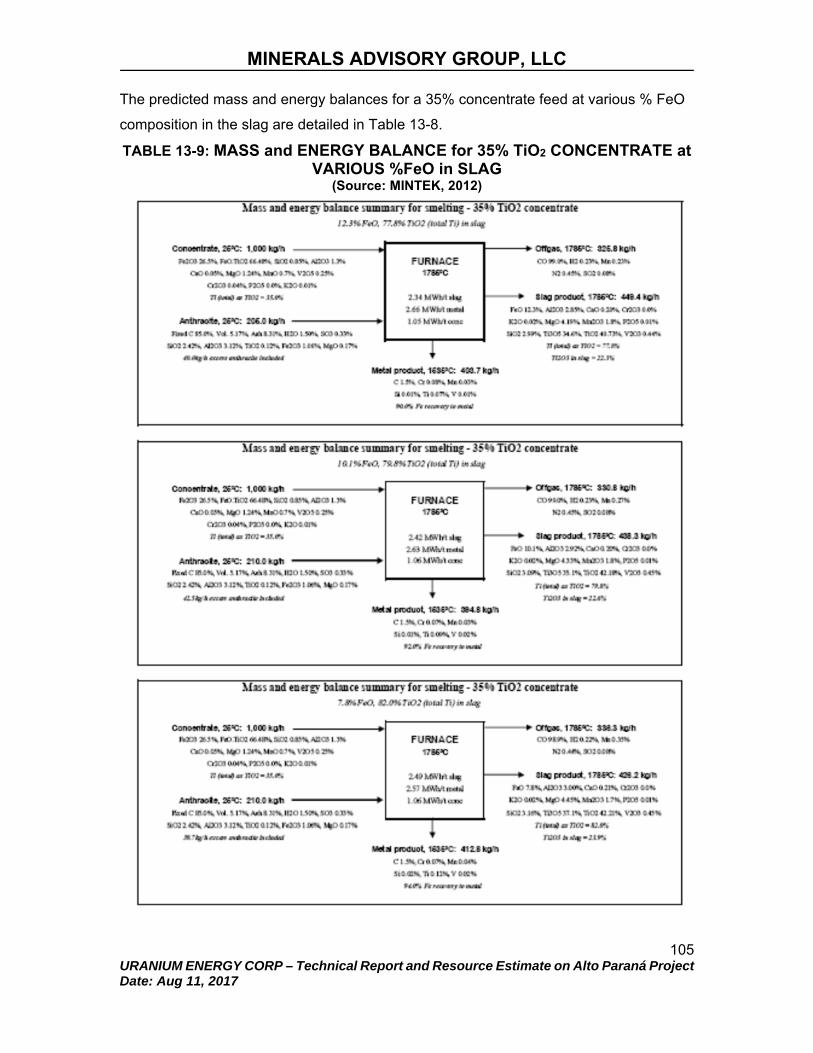
MINERALS ADVISORY GROUP, LLC
105 URANIUM ENERGY CORP – Technical Report and Resource Estimate on Alto Paraná Project Date: Aug 11, 2017
The predicted mass and energy balances for a 35% concentrate feed at various % FeO
composition in the slag are detailed in Table 13-8.
TABLE 13-9: MASS and ENERGY BALANCE for 35% TiO2 CONCENTRATE at VARIOUS %FeO in SLAG
(Source: MINTEK, 2012)
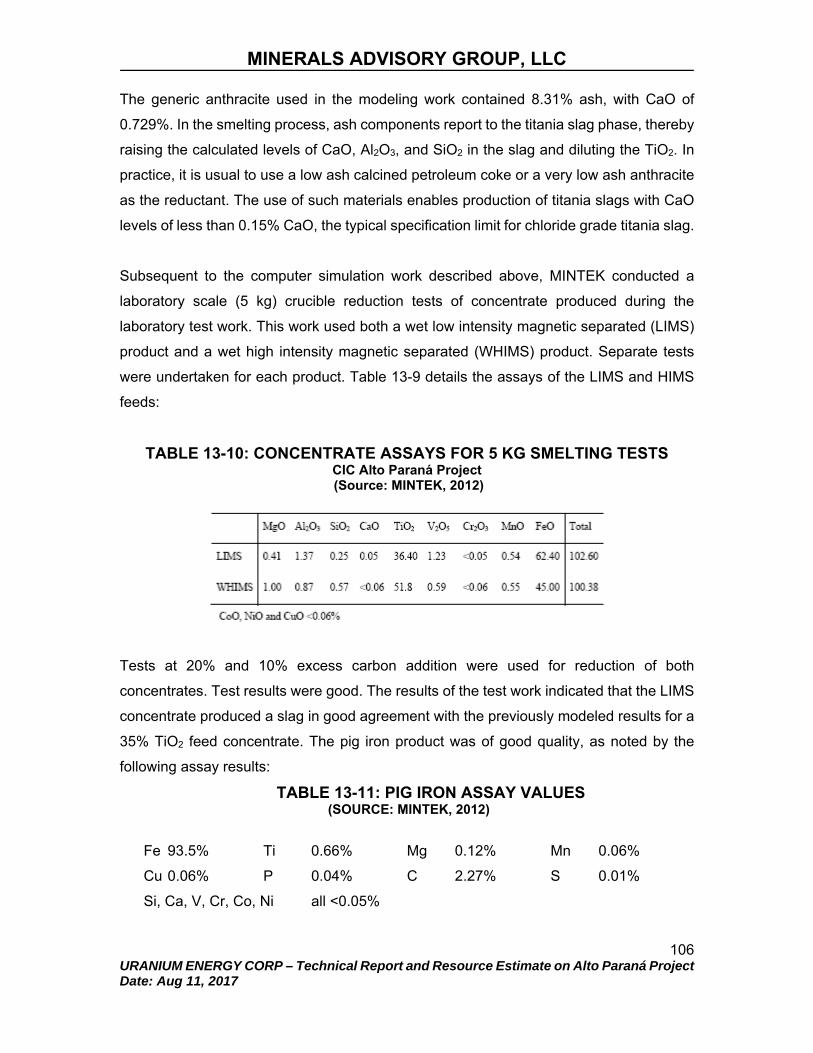
MINERALS ADVISORY GROUP, LLC
106 URANIUM ENERGY CORP – Technical Report and Resource Estimate on Alto Paraná Project Date: Aug 11, 2017
The generic anthracite used in the modeling work contained 8.31% ash, with CaO of
0.729%. In the smelting process, ash components report to the titania slag phase, thereby
raising the calculated levels of CaO, Al2O3, and SiO2 in the slag and diluting the TiO2. In
practice, it is usual to use a low ash calcined petroleum coke or a very low ash anthracite
as the reductant. The use of such materials enables production of titania slags with CaO
levels of less than 0.15% CaO, the typical specification limit for chloride grade titania slag.
Subsequent to the computer simulation work described above, MINTEK conducted a
laboratory scale (5 kg) crucible reduction tests of concentrate produced during the
laboratory test work. This work used both a wet low intensity magnetic separated (LIMS)
product and a wet high intensity magnetic separated (WHIMS) product. Separate tests
were undertaken for each product. Table 13-9 details the assays of the LIMS and HIMS
feeds:
TABLE 13-10: CONCENTRATE ASSAYS FOR 5 KG SMELTING TESTS CIC Alto Paraná Project (Source: MINTEK, 2012)
Tests at 20% and 10% excess carbon addition were used for reduction of both
concentrates. Test results were good. The results of the test work indicated that the LIMS
concentrate produced a slag in good agreement with the previously modeled results for a
35% TiO2 feed concentrate. The pig iron product was of good quality, as noted by the
following assay results:
TABLE 13-11: PIG IRON ASSAY VALUES (SOURCE: MINTEK, 2012)
Fe 93.5% Ti 0.66% Mg 0.12% Mn 0.06%
Cu 0.06% P 0.04% C 2.27% S 0.01%
Si, Ca, V, Cr, Co, Ni all <0.05%

MINERALS ADVISORY GROUP, LLC
107 URANIUM ENERGY CORP – Technical Report and Resource Estimate on Alto Paraná Project Date: Aug 11, 2017
It was further concluded that larger scale tests involving more realistic smelting conditions
such as those that exist for the MINTEK pilot plant furnace would provide more indicative
information.
Computer modeling of using a pre-reduced concentrate as smelter feed was also
undertaken. Work consisted of modeling various batch concepts using Fact Sage, a
thermodynamic software package. The modeled product was a 10% FeO slag smelted at
1,7000C. The results of the analysis are summarized below:
TABLE 13-12: PRE-REDUCED CONCENTRATE MODE RESULTS (SOURCE: MINTEK, 2012)
Condition Ilmenite/Magnetite
Feed
Total Energy Required/t
Ilmenite (MWh/t)
Electrical Energy (MWh/t)
Thermal Energy (MWh/t)
No pre-reduction 1,000 kg 1.015 1.015 - Pre-reduced feed 857.6 kg 0.665 - 0.665 Cold pre-reduced
feed + cold ilmenite
857.63 kg cold 142.37 kg cold
1.150 0.485 0.665
Hot pre-reduced feed + ilmenite
857.63 kg hot 142.37 kg cold
0.972 0.307 0.665
This work indicates that substantial reductions in electrical energy requirements can be
obtained if the feed concentrate is pre-reduced. Reductions in electrical energy
requirements translate into increased furnace capacity as more melting power is available
for a given charge of material. This in turn leads to faster tap-to-tap times.
PILOT PLANT SMELTING TEST
Ilmenite concentrate produced by the Paraná pilot plant was shipped to South Africa for
smelting tests at MINTEK. A total of approximately 108 tons of concentrate was
processed. The feed material was adjusted to 35% TiO2 content by blending the LIMS and
HIMS concentrate fractions. The results of the test work were very encouraging. Figure
13-11 summarizes the increase in slag quality to levels in excess of 90%. The MgO level
is somewhat elevated due to erosion of the magnesia refectory. In practice, a freeze wall
of titanium slag is built up in the furnace which prevents such erosion. The CaO content

MINERALS ADVISORY GROUP, LLC
108 URANIUM ENERGY CORP – Technical Report and Resource Estimate on Alto Paraná Project Date: Aug 11, 2017
of the slag is low and it is anticipated that it will be further reduced in industrial practice.
The pig iron product showed excellent results, with low levels of contaminants.
FIGURE 13-11: PILOT PLANT SMELTER RESULTS
(SOURCE: MINTEK, 2012)
Graph of TiO2, FeO and MgO concentrations in slag from furnace start up to 2 weeks into a 2 1/2 week pilot DC arc smelter test (Data to 3/27/2011)
The smelter charge for the furnace is 20% anthracite and 80% ilmenite. The test work
indicates the slag is quite fluid and flows much more readily than typical TiO2 slags. Such
a result is unexpected and shows potential for significant improvements in furnace
productivity. The anthracite is a low ash material sourced from China. Figures 13-11
through 13-13 and 13-14 show various aspects of the test work.
FIGURE 13-12: SLAG TAP FROM PILOT PLANT FURNACE
(SOURCE: MAG, 2012)
Water jacket repair b k

MINERALS ADVISORY GROUP, LLC
109 URANIUM ENERGY CORP – Technical Report and Resource Estimate on Alto Paraná Project Date: Aug 11, 2017
FIGURE 13-13: IRON METAL TAP FROM PILOT PLANT FURNACE (SOURCE: MAG, 2012)
FIGURE 13-14: SLAG AND PIG IRON PRODUCTS (SOURCE: MAG, 2012)
TiO2Slag – cooling prior to crushing Pig Iron – slag residue to be removed
SUMMARY
Overall, the pilot plant test program has been highly successful. The beneficiation test
work has demonstrated the efficiency and effectiveness of the process flow sheet and the
ability to recover a high quality concentrate. The pilot plant smelting test work has
demonstrated that high quality slag and pig iron products can be readily produced from
the concentrate. Significant engineering data has been developed to use in design of the
full scale plant.
TAILINGS HANDLING AND REMEDIATION

MINERALS ADVISORY GROUP, LLC
110 URANIUM ENERGY CORP – Technical Report and Resource Estimate on Alto Paraná Project Date: Aug 11, 2017
MAG published a “Report of Investigation-Tailings, MYNM Pilot Plant, and Tailings
Management Study” in October 2012 (Authored by Martin C. Kuhn). The report covered a
laboratory study of placed tailings and used the data to develop a preliminary model of
tailings sedimentation, settling, compacting and dewatering. A large-scale extended test
program was developed and instituted to provide operating data on shrinkage and
dewatering of kaolinite tails over an extended period of time in 5-7 meter deep in-situ
concrete columns. This report summarizes column data obtained over a one year period
from October 31, 2012, through November 11, 2013. The study has allowed MAG to refine
the sedimentation model and predict likely shrinkage of tailings volumes over time. The
predicted tailings expansion upon placement and shrinkage as a function of time allows a
preliminary design of tailings placement in mined out areas. MYNM continued sampling of
the in-situ columns through 2014 and recently completed a sampling campaign in
February of 2015. An up-to-date analysis of continued tailing compaction and shrinkage
is the subject of Tailings Report #3, authored by MAG in March of 2015.
TAILINGS SHRINKAGE
Paraná tails are estimated to be about 80-85% kaolinite and silica and about 15-20%
hematite. The specific gravity of kaolinite and silica are about 2.65 and hematite about
5.26. The tailings specific gravity has been estimated to approximate 3.1-3.2 g/cm3.
Expansion of tailings as a function of percent solids then can be calculated and is
graphically expressed in Figures 13-15 & 16.
FIGURE 13-15 EXPANSION OF TAILS AS A FUNCTION OF PERCENT SOLIDS
THEORETICAL (BLUE) PARANÁ TAILS SAMPLES (RED)

MINERALS ADVISORY GROUP, LLC
111 URANIUM ENERGY CORP – Technical Report and Resource Estimate on Alto Paraná Project Date: Aug 11, 2017
(SOURCE: MAG, 2014)
FIGURE 13-16
EXPANSION AS A FUNCTION OF PERCENT SOLIDS, THEORETICAL AND
PARANÁ SAMPLES
(SOURCE: MAG, 2014)
Samples extracted from previously settled tailings in a tailings impoundment allowed the
determination of Paraná tailings apparent wet-bulk density as a function of % solids. The
agreement with the theoretical calculations shown in Figure 13-14 allow the development
of a reliable model to predict tailings volume contraction and expansion. The curves
y = 1016.3x-1.598
R² = 0.9929
y = 668.96x-1.466
R² = 0.8925
0.0
0.5
1.0
1.5
2.0
2.5
3.0
3.5
4.0
4.5
5.0
25 35 45 55 65 75 85
Vol
ume
Tai
ls/V
olum
e M
ine
Percent Solids

MINERALS ADVISORY GROUP, LLC
112 URANIUM ENERGY CORP – Technical Report and Resource Estimate on Alto Paraná Project Date: Aug 11, 2017
described in Figures 1.01&2 accurately describe the observed settling experienced in the
columns over the first year of settling. See Figure 13-16.
FIGURE 13-17
SETTLING AND SHRINKAGE IN TEST COLUMNS 1-5.
(SOURCE: MAG, 2014)
Averaging and extending the column data allows a projection of in-place shrinkage at 700 and 800 days. Figure 13-17 shows this projection.
FIGURE 13-18
AVERAGE COLUMN SETTLING FROM DAY 161 TO DAY 800
1.0
1.5
2.0
2.5
3.0
3.5
4.0
0 50 100 150 200 250 300 350 400
Tai
lings
Exp
ansi
on (
Vol
. 1t
Sol
id
Tai
lings
/Vol
. 1t
Sol
id M
ine)
Settling Time in Column (Days)Column 1 Column 2 Column 3Column 4 Column 5 Power (Column 1)
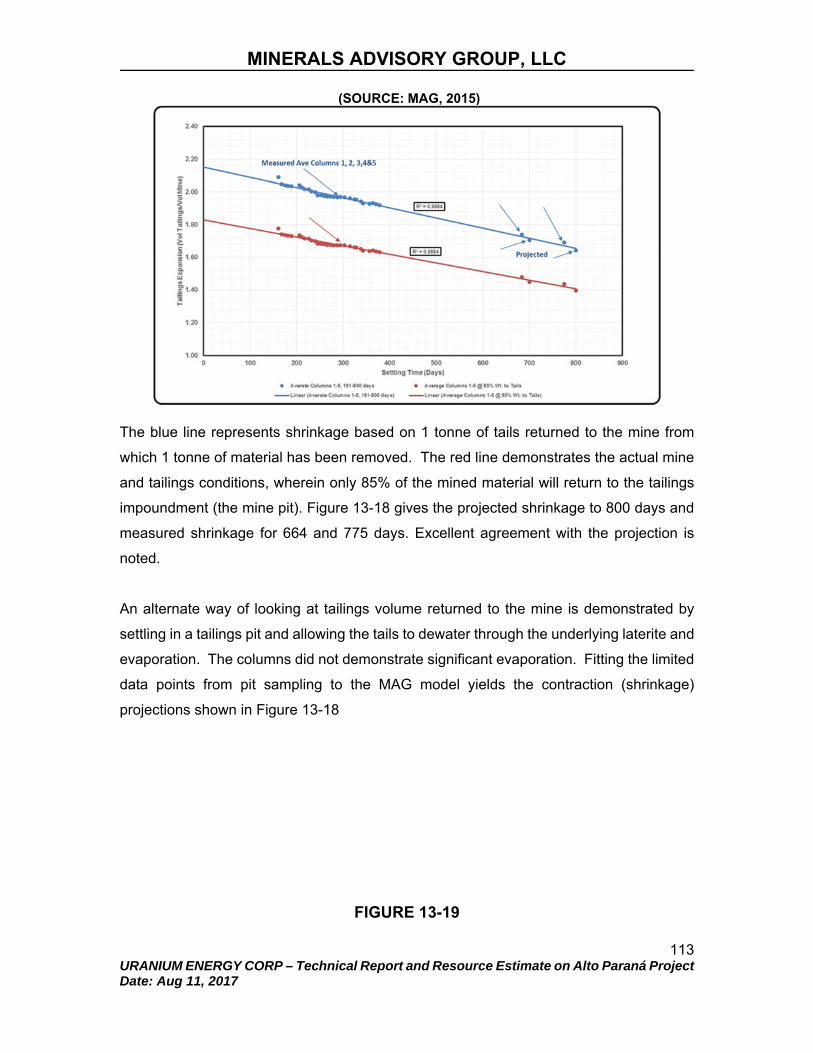
MINERALS ADVISORY GROUP, LLC
113 URANIUM ENERGY CORP – Technical Report and Resource Estimate on Alto Paraná Project Date: Aug 11, 2017
(SOURCE: MAG, 2015)
The blue line represents shrinkage based on 1 tonne of tails returned to the mine from
which 1 tonne of material has been removed. The red line demonstrates the actual mine
and tailings conditions, wherein only 85% of the mined material will return to the tailings
impoundment (the mine pit). Figure 13-18 gives the projected shrinkage to 800 days and
measured shrinkage for 664 and 775 days. Excellent agreement with the projection is
noted.
An alternate way of looking at tailings volume returned to the mine is demonstrated by
settling in a tailings pit and allowing the tails to dewater through the underlying laterite and
evaporation. The columns did not demonstrate significant evaporation. Fitting the limited
data points from pit sampling to the MAG model yields the contraction (shrinkage)
projections shown in Figure 13-18
FIGURE 13-19

MINERALS ADVISORY GROUP, LLC
114 URANIUM ENERGY CORP – Technical Report and Resource Estimate on Alto Paraná Project Date: Aug 11, 2017
SHRINKAGE IN TAILINGS POND
(SOURCE: MAG, 2014)
The time to reach an acceptable level of expansion appears to require evaporation and
layering of tails. Apparent from Figure 13-19 is the return of tailings to the pit in layers of
3.5 meters allows shrinkage equal to the volume of material removed from the pit in about
600 days. These tailings would average about 63% solids and in MAG’s opinion would
sustain agricultural activity.
From data produced to-date, MAG believes deposition in about 2 meter lifts could result
in the return of tailings material to agricultural use in about one year.
CONCLUSIONS
Paraná tailings expand and shrink proportional to entrained water.
Using an estimate of Fe2O3 15-20% in tails yields a S.G. of about 3.1-3.2. The
specific gravity of the tails does not greatly influence shrinkage calculations. For
all calculations made in this report a S.G. of 3.2 was assumed.
At a tailings percent solids of 36% introduced to the columns, about 50% of the
water lost in the first year was lost in the first 10 days.
R² = 0.9965
R² = 0.9965
1.00
1.50
2.00
2.50
3.00
3.50
0 100 200 300 400 500 600 700 800 900
Exp
ansi
on
Tai
ls V
olu
me/
Min
e P
it M
olu
me
Settling Time (Days)Expansion of Equal Wt Tails/Mine VolumesExpansion 85% of Tails to Mine

MINERALS ADVISORY GROUP, LLC
115 URANIUM ENERGY CORP – Technical Report and Resource Estimate on Alto Paraná Project Date: Aug 11, 2017
One year of settling in the column resulted in a 36% solids tailing material to thicken
to about 57% solids.
One year of settling and drying in a pit exposed to the atmosphere resulted in
average of 4 meters in depth of 63.6% solids.
The average of columns shrinkage over 800 days yields expansion over removed
pit material of 1.6 times that extracted from the pit. Since only 85% of the mine
material will be returned to the pit, the final expected expansion is projected to be
1.4 times the volume extracted from the pit.
An excellent correlation between theoretical and measured shrinkage as a function
of percent solids is noted in both the column program and the pit program.
Paraná tailings respond predictably and well to conventional and paste thickening
and dewatering in tailings impoundments over time. Thickness of deposition
favors evaporation in 2 meter layers versus 7 meters with limited evaporation.
Tailings covered by a 20-30 cm layer of stockpiled organic rich soil from mine grub
and clear operations provides a suitable soil for the return of the pit areas to
agricultural use.
Numerous samples from Alto Paraná laterites were studied in the metallurgical
program for variability. The samples demonstrate variability in TiO2 and silica
content; however, all tested samples responded as expected to the developed
process flowsheet. Depending on location and laterite depth, the relative
proportion of recoverable TiO2 could vary. As TiO2 grade diminished, recovery of
TiO2 also decreased (Figure 13-3).
Typical ilmenite mineral sand deposits are high in uranium and thorium; however,
the Paraná concentrates are very low in both uranium and thorium. Magnesium
and vanadium contained in concentrates were noted to report to titanium slag
(MgO) and pig iron (V2O5). Additional study of the variability in the resource is
recommended.
RECOMMENDATIONS AND METALLURGICAL RISKS

MINERALS ADVISORY GROUP, LLC
116 URANIUM ENERGY CORP – Technical Report and Resource Estimate on Alto Paraná Project Date: Aug 11, 2017
Alto Paraná tailings need to be better defined in terms of percent solids and pulp
rheology to determine optimum percent solids for pumping to remote tailings
impoundments.
Proper tailings handling will be critical in returning the tailings material to the land
to allow agricultural use.
Prepare a large enough area to deposit tailings and test surface conditions
necessary for load bearing farm equipment.
Plan and execute a program to determine optimum thickness of deposition with an
objective of also determining load bearing capacity of layered tailings allowed to
dry on the surface to about 70% solids.
Demonstrate ability of mining operation to operate on basalt and after the removal
of plant feed, replacement of saprolite layer for drainage of tailings water during
shrinkage.
Demonstrate replacement of grub and clear organic rich soil will allow the return
of land for agriculture purposes.
An important feature of the test program was to test water quality as the water
enters the ground water to travel to the local streams. Since the process operates
at natural pH and no sulfides are in the material, increasing levels of metallic salts
are not expected; a demonstration of this is recommended.

MINERALS ADVISORY GROUP, LLC
117 URANIUM ENERGY CORP – Technical Report and Resource Estimate on Alto Paraná Project Date: Aug 11, 2017
14 MINERAL RESOURCE ESTIMATES
SPECIFIC GRAVITY (BULK DENSITY)
In order to calculate a resource tonnage it is necessary to determine a reliable average
density of in situ lateritic material. Estimates of bulk density and specific gravity of the
laterite were obtained using several methods by Hains (2012). Measurements included
laboratory tests based on published standard methods, as well as field tests using
recognized but non-standard methods. The test methods employed included the following:
ASTM D854, Peru National Standard Test method NTP 339.131;
ALS Chemex method OA-GRAO8b;
Archimedes method;
Sand replacement method; and
Gravimetric/volumetric method.
The latter two methods are field methods. The first involves removing a volume of sample
material and weighing it both wet and dried to constant weight. The void is filled with a
measured amount of fine dry quartz sand and the wet and dry bulk densities determined.
The second involves excavation of a specific unit volume of material and weighing the
sample in the wet and dry states. The wet and dry bulk densities are then calculated. Both
methods have been found to be sufficiently accurate to enable them to be used in early
stage resource calculations. Table 14-1 summarizes the results of the various bulk density
and specific gravity determinations.

MINERALS ADVISORY GROUP, LLC
118 URANIUM ENERGY CORP – Technical Report and Resource Estimate on Alto Paraná Project Date: Aug 11, 2017
TABLE 14-1: BULK DENSITY/SPECIFIC GRAVITY DETERMINATIONS CIC Alto Paraná Project (Source: D. Hains, 2012)
Sample Coordinates (WGS
84) Method S.G1 Method Bulk
Density Moisture (%)
Lab. Date
Sampled Easting Northing Wet Dry
PH-100 711111 7260030 D854 2.90 Archi.2 1.56 SENICO Dec.17/09 PH-202 711096 7250252 D854 2.87 Archi. 1.69 SENICO Dec17/09 PH-164 718267 7255266 D854 2.38 Grav.3 20.9 Minilab Dec.17/09 PH-157 708508 7243382 2.44 Grav. 21.1 Minilab Dec.17/09
PH-44 713740 7248769 OA-GRAO8b
2.69
ALS Dec. 17/09
Pilot Plant
0-1m
Grav.
1.87 1.24 33.83
CIC Res.
Oct. 29/11
1-2m 1.75 1.31 25.19 2-3m 1.90 1.24 34.95 3-4m 2.24 1.67 25.27 4-5m 2.93 2.19 25.12 5-6m 2.43 1.81 25.50 6-7m 2.71 1.99 26.62
average 2.26 1.64 28.33
T-2253 708921 7252649
Sand Rep
1.75
Oct. 20/11
Sand Rep
1.89
Arch. 2.03
T-2173 708668 7254445
Sand Rep
2.08
Sand Rep
1.85
Arch. 2.09
T-2250 707947 7251350
Sand Rep
1.99
Sand Rep
1.67
Arch. 1.97
T-2194 710223 7253367
Sand Rep
2.04
Sand Rep
1.81
Arch. 2.13
T-2254 709932 7251509
Sand Rep
1.91
Sand Rep
1.65
Arch. 2.01
1) Specific gravity of solids 2) Archimedes method 3) Gravimetric
Local contractors reported typical wet and dry bulk densities similar to those determined
by MAG for the Pilot Plant samples. This report has used a dry bulk density of 1.64 for
estimation of resource tonnage. Additional bulk density tests should be undertaken to

MINERALS ADVISORY GROUP, LLC
119 URANIUM ENERGY CORP – Technical Report and Resource Estimate on Alto Paraná Project Date: Aug 11, 2017
better characterize the bulk density variability of the deposit and to establish seasonal
variations in bulk density due to rainfall both laterally and vertically across the deposit.
CIC MYNM RESOURCE ESTIMATE (2015)
The 2015, 43-101 technical report prepared for CIC and Delta Gold Corp included a
resource estimate for the 36,177 hectares MYNM concessions block (Kuhn M. C. and
Brown D. M., 2015). This area (Figure 14-1) was chosen for a resource estimate because
it was the final planned concession holdings after consolidation of the original CIC
concessions to the area of generally highest grade/thickness and greatest density of
sampling. A preliminary resource estimate for this planned ultimate holding area was made
by CIC in February of 2015, as summarized in Table 14-2 below.
Resources were estimated using the polygon method where polygons were constructed
using perpendicular bisectors around each central pit. Polygon grade and thickness were
determined by assigning an average grade and thickness of the pit in the center of each
polygon. Environmentally sensitive surface drainages and natural forest areas (blank
areas) were excluded from the original polygons and hence not included in the final
resource polygons. A specific gravity of 1.64 was used for all tonnage calculations using
the average dry density for the Pilot Plant samples (Table 14-1).
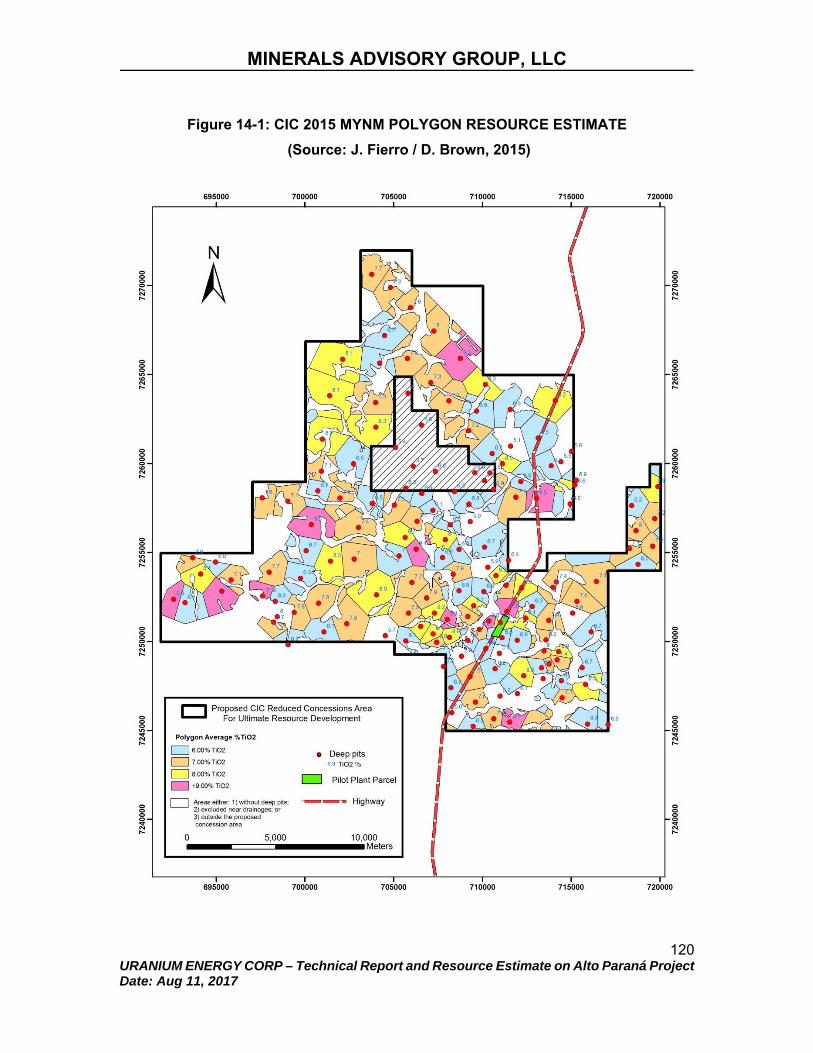
MINERALS ADVISORY GROUP, LLC
120 URANIUM ENERGY CORP – Technical Report and Resource Estimate on Alto Paraná Project Date: Aug 11, 2017
Figure 14-1: CIC 2015 MYNM POLYGON RESOURCE ESTIMATE
(Source: J. Fierro / D. Brown, 2015)

MINERALS ADVISORY GROUP, LLC
121 URANIUM ENERGY CORP – Technical Report and Resource Estimate on Alto Paraná Project Date: Aug 11, 2017
TABLE 14-2: 2015 MYNM RESOURCE ESTIMATE
Alto Paraná Project (Source: J. Fierro, CIC, 2015)
Notes:
1. CIM definitions were followed for Mineral Resources. 2. The Qualified Person for this Mineral Resource estimate is David Brown, P. Geo. 3. Maximum Mineral Resources are estimated at a cut-off grade of approx. 6.0% TiO2. 4. A minimum mining thickness of 1 meter was used. 5. The Mineral resource is based on an area of 36,177 ha. 6. Effective date February 2015.
UEC RESOURCE ESTIMATE (2017)
An updated resource calculation has been estimated for this technical report. This
resource estimate was calculated for the 70,498 hectares in exploration concessions
which UEC holds under license from MOPC as described in Section 4 of this report. The
location of the resource polygons is shown on Figure 14-2 and the calculated resource is
summarized in Table 14-3. These estimates were made using the same polygon method
as described previously for the 2015 MYNM 43-101 report and the same average specific
gravity of 1.64. A total of 328 polygons were used in the calculations for the updated 2017
resource estimate.
Table 14-3: 2017 UEC RESOURCE ESTIMATE
Cut-Off % % TiO2 % Fe2O3 % Ilmenite
calculated Tonnes
Thickness
(m)
<5.0 7.31 23.35 13.68 5.21 billion 6.50
6.0 7.41 23.58 13.95 4.94 billion 6.61
7.0 7.83 24.35 14.96 3.35 billion 6.40
Cut Off (%TiO2) %TiO2 %Fe2O3 Ton nes Average Thickness (m) 6.0 7.47 24.40 2,406,182,800 6.11
7.0 7.91 25.14 1,602,307,400 5.90
8.0 8.58 26.04 596,535,797 5.24

MINERALS ADVISORY GROUP, LLC
122 URANIUM ENERGY CORP – Technical Report and Resource Estimate on Alto Paraná Project Date: Aug 11, 2017
Notes:
1.CIM definitions were followed for Mineral Resources. 2. The Qualified Person for this Mineral Resource estimate is David Brown, P. Geo. 3.Maximum Mineral Resources are estimated at a cut-off grade of approx 5.0% TiO2. 4.A minimum mining thickness of 1 meter was used. 5.The Mineral resource is based on a property area of 70,498 hectares. 6.Effective date August 11, 2017.
Volume percent of ilmenite in Table 14-3 was approximated using atomic weights,
assuming that ilmenite (FeTiO3) is the only or predominant mineral source of titanium. This
assumption is supported by mineralogical XRD studies of laterite material which show that
the mineral contents of rutile, the only other potential Ti source, are negligible. Estimation
of hematite as a mineral percentage from the laboratory analyses is not feasible because
the hematite reports as fine grained particles possibly associated with clay rather than
heavy minerals.

MINERALS ADVISORY GROUP, LLC
123 URANIUM ENERGY CORP – Technical Report and Resource Estimate on Alto Paraná Project Date: Aug 11, 2017
Figure 14-2: UEC 2017 POLYGON RESOURCE ESTIMATE
(Source: D. Brown, 2016)
By definition, Inferred Resources do not have demonstrated economic value and it is not
known if they can be developed. As defined, Inferred Mineral Resources have reasonable
prospects for economic extraction. Certain assumptions have been made in assigning Alto
Paraná to this resource category. These include: (1) that TiO2 and Fe2O3 grades can be
reliably extrapolated between the widely spaced test pits; (2) that average thickness of
mineralization between test pits does not radically vary from the average of about 6
meters; (3) that TiO2 and pig iron market prices are economical at the time of extraction;

MINERALS ADVISORY GROUP, LLC
124 URANIUM ENERGY CORP – Technical Report and Resource Estimate on Alto Paraná Project Date: Aug 11, 2017
and (4) that recoveries obtained in the pilot plant can be reproduced in a full-production
scale beneficiation plant.
With regard to assumptions 1 and 2, it is the QP's opinion that consistency and reliability
of grade and thickness has a high probability of accuracy based on the relatively large
volume of data collected to date coupled with aerial extent and geological homogeneity of
the deposit. With regard to sensitivity to metals prices, these are highly unpredictable and
it is uncertain whether prices would be economic at a future extraction date.
FACTORS AFFECTING ACCURACY AND FUTURE VIABILITY OF
RESOURCE ESTIMATE
With regard to information presented by the QP for this Item 14, there are no known legal,
permitting, or title issues that could have a detrimental effect on the mineral resource
estimates and potential mineability of these estimates. Regarding environmental
concerns, it is the QP’s opinion that sufficient mitigation efforts have been followed by both
UEC and its predecessor CIC to exclude areas of virgin forest or active drainages from
any proposed resource extraction.
There are some physical factors concerning moisture content, specific gravity variation,
and grain size which could affect the recoverable titanium metal from the currently
estimated resource. These factors will have to be assessed in any future reserve estimates
and economic evaluation studies by the project team.
With further regard to the unusual nature of this ilmenite deposit, a reader familiar with
large open pit base or precious metal mines might question whether seemingly random
scattered blocks could be mined effectively. However, the mining method contemplated
for the Alto Paraná mineralization would not consist of one or several large pits, but rather
numerous shallow pits or “panel areas” which would be backfilled and reclaimed by the
drainage exclusion areas (irregular white areas on Fig. 14-1), which are prohibited from
mining and were not included in the total resource estimate.

MINERALS ADVISORY GROUP, LLC
125 URANIUM ENERGY CORP – Technical Report and Resource Estimate on Alto Paraná Project Date: Aug 11, 2017
15 MINERAL RESERVE ESTIMATES
No mineral reserve estimates have been calculated at this stage of the project.

MINERALS ADVISORY GROUP, LLC
126 URANIUM ENERGY CORP – Technical Report and Resource Estimate on Alto Paraná Project Date: Aug 11, 2017
16 MINING METHODS
No mining plan is included in this Technical Report.

MINERALS ADVISORY GROUP, LLC
127 URANIUM ENERGY CORP – Technical Report and Resource Estimate on Alto Paraná Project Date: Aug 11, 2017
17 RECOVERY METHODS
No process recovery methods are included in this Technical Report.

MINERALS ADVISORY GROUP, LLC
128 URANIUM ENERGY CORP – Technical Report and Resource Estimate on Alto Paraná Project Date: Aug 11, 2017
18 PROJECT INFRASTRUCTURE
No Project infrastructure has been included in this Technical Report.

MINERALS ADVISORY GROUP, LLC
129 URANIUM ENERGY CORP – Technical Report and Resource Estimate on Alto Paraná Project Date: Aug 11, 2017
19 MARKET STUDIES AND CONTRACTS
No market studies or contracts have been included in this Technical Report.

MINERALS ADVISORY GROUP, LLC
130 URANIUM ENERGY CORP – Technical Report and Resource Estimate on Alto Paraná Project Date: Aug 11, 2017
20 ENVIRONMENTAL STUDIES, PERMITTING AND SOCIAL OR COMMUNITY IMPACT
Environmental and permitting has been addressed in Item 4 of this Technical Report.
As with most new mining projects, a major risk to the project is excellent community
relations and land management. The ability of the project to purchase/lease the land to
allow the recovery of heavy minerals with the return of the clay tailings in a form to support
farming will be closely tied to the project demonstrating, early on, suitable technology.
Assuming the project will use pyrometallurgical technology (electric arc smelting) to
produce high value products such as high grade TiO2 slag and pig iron, a suitable site
directly tied to the Itaipu Dam’s hydroelectric power plant will be essential to ensure low
cost 100% reliable power availability. One of the greatest advantages to the project is low
cost power, since most current TiO2 producers are experiencing higher and higher power
costs. (See Item 24)
Proximity to reliable shipping lanes will also be extremely important for the transportation
of products to South American and overseas markets. (See Item 24)

MINERALS ADVISORY GROUP, LLC
131 URANIUM ENERGY CORP – Technical Report and Resource Estimate on Alto Paraná Project Date: Aug 11, 2017
21 CAPITAL AND OPERATING COSTS
No capital or operating costs are given in this Technical Report.

MINERALS ADVISORY GROUP, LLC
132 URANIUM ENERGY CORP – Technical Report and Resource Estimate on Alto Paraná Project Date: Aug 11, 2017
22 ECONOMIC ANALYSIS
No economic analyses have been made a part of this Technical Report.

MINERALS ADVISORY GROUP, LLC
133 URANIUM ENERGY CORP – Technical Report and Resource Estimate on Alto Paraná Project Date: Aug 11, 2017
23 ADJACENT PROPERTIES
The UEC properties are surrounded by lateritic materials high in TiO2. To date no other companies have filed for exploration permits.

MINERALS ADVISORY GROUP, LLC
134 URANIUM ENERGY CORP – Technical Report and Resource Estimate on Alto Paraná Project Date: Aug 11, 2017
24 OTHER RELEVANT DATA AND INFORMATION
TRANSPORTATION
Paraguay is a landlocked country with limited transportation connections to the rest of the
world. Transport costs and the associated logistical requirements are a significant factor
in determining the economic viability of major mineral and metallurgical projects such as
the Alto Paraná ilmenite project.
The most significant transportation corridors are the Paraguay and Paraná Rivers. These
rivers provide access for goods into and out of Paraguay using barges and, in the case of
the Paraguay River, ships. Road connections to Brazil and Argentina are available, but
distances to major ports are significant. There is no active rail system in Paraguay and rail
connections with Brazil and Argentina require road transport from Paraguay to rail heads
in those countries.
The Paraguay and Paraná Rivers are subject to significant fluctuations in water levels and
have increasing draft limitations going upstream. Figure 24-1 illustrates the general
limitations on vessel draft.

MINERALS ADVISORY GROUP, LLC
135 URANIUM ENERGY CORP – Technical Report and Resource Estimate on Alto Paraná Project Date: Aug 11, 2017
FIGURE 24-1: DRAFT LIMITATIONS ON PARAGUAY AND PARANÁ RIVERS
Below Rosario in Argentina, there are no draft limitations and large ocean going vessels
can freely navigate. Between Rosario and Santa Fe, the draft limit decreases to 7.62 m,
limiting vessels to no more than approximately 40,000 DWT capacity. Between Santa Fe
and Asuncion, the draft limit decreases again to 3.65 m. This limits potential cargo ships
at Asuncion to no more than 25,000 DWT, and generally requires vessels to carry only
part loads until reaching Santa Fe, or having to discharge partial cargos at Santa Fe.
Above Asuncion, the draft limit decreases to 2.7 m on both the Paraguay and Paraná
Rivers. This draft limitation means only barge traffic is available for shipping. Dams on the
Paraná River further limit navigation on the river, with no barge traffic being present above
the Itaipu Dam just north of Ciudad del Este.
Navigation restrictions are imposed on both the Paraguay and Paraná Rivers in terms of
the size of barge strings,barge size and barge hours of operation. There are also
restrictions on free movement of barges between the various countries; this persists
despite existing agreements permitting free navigation. For example, Argentina and
2.7 m draft
3.65 m draft
7.62 m draft
10.36 m draft

MINERALS ADVISORY GROUP, LLC
136 URANIUM ENERGY CORP – Technical Report and Resource Estimate on Alto Paraná Project Date: Aug 11, 2017
Paraguay impose restrictions on the national registration of barges. Paraguay requires
that only Paraguayan flagged barges load or unload cargo in Paraguay. Current barge
limitations on the Paraguay and Paraná Rivers are detailed in Table 24-1.
TABLE 24-1: BARGE RESTRICTIONS ON PARAGUAY AND PARANÁ RIVERS
River From To Barge String Size (W x L (m)
Paraguay/Rio Plate
Nueva Palmira, Arg. Gral. San Martin, Arg.
50 x 290 m or 50 x 236 m, depending on channel
San Martin, Arg. Confluencia, Arg. No restrictions Confluencia, Arg. Rio Apa, Py 60 m x 319 m Rio Apa, Py Corumba, Brazil 50 m x 290 m Corumba, Brazil Cáceres, Brazil 24 m x 80 m
Paraná
Tres Fronteras, Py San Gotardo, Py 6 barges, 12 hr continuous navigation
San Gotardo, Py Encarnacion, Py 16 barges, 12 hr continuous navigation
Encarnacion, Py Confluencia, Arg. 20 barges, 48 hr. Continuous navigation
Note Dry season limitations on Paraná River. Rainy season limits are higher
The typical individual barge is 10.6 m wide by 60 m and has a draft of 3 m. This type of
barge can hold 1,500 tonnes. The largest barge used on the rivers is 16.6 m wide x 60 m
long with a 3 m draft and holds 2,600 tonnes.
Port facilities on both the Paraguay and Paraná Rivers are limited. The Port of Asuncion
is the largest general cargo port in Paraguay. The port has a 1,200 m long wharf with a
maximum depth of 3.3 m at low water. The port has a general cargo open storage area of
15,000 m2 and a container storage area of 26,000 m2. The port is operated by the
Administratcion Nacional de Navegacion y Puertos (ANNP), a Paraguayan government
agency. Ports on the Paraná are generally restricted to loading grain. The river has very
steep banks for most of its length and significant open space for bulk commodity storage
is limited. The closest port having reasonably significant bulk commodity storage capability
is Puerto Trociuk at km 1,566. This port is at km 1,566 and has a storage area of 22 ha.
By way of reference, Encarnacion is at km 1,583 and Tres Fronteras, which is near Ciudad
del Este, is at km 1,928.

MINERALS ADVISORY GROUP, LLC
137 URANIUM ENERGY CORP – Technical Report and Resource Estimate on Alto Paraná Project Date: Aug 11, 2017
Development of bulk loading and unloading facilities for coal and slag will be essential for
the success of the project. Logistics and logistics costs are a critical component of the
project and require extremely detailed study to select the most appropriate option.
ELECTRICITY PRICE
The Alto Paraná project will be a significant consumer of electricity. While under the control
of CIC, a negotiated price of about $0.04/kWh was proposed and appeared to be
agreeable to ANDE. The $0.04/kWh cost is below the published tariff provided by ANDE,
the national electricity distributor. Rio Tinto has also proposed a major project in Paraguay
to construct an aluminum smelter based on imported alumina feedstock. Their proposal
was based on securing a large, low cost block of power at about $0.04/kWh.
MINERALS ADVISORY GROUP, LLC
138 URANIUM ENERGY CORP – Technical Report and Resource Estimate on Alto Paraná Project Date: Aug 11, 2017
25 INTERPRETATION AND CONCLUSIONS
Mineralization on the property consists of laterite containing ilmenite, titanomagnetite,
magnetite and hematite derived from Early Cretaceous tholeitic basalts of the Paraná
Basin and associated gabbro intrusions. The basalts and gabbros have been laterized to
an average depth of approximately 7 m over a very extensive area. Kaolinite is the
dominant mineral in the laterite, representing 60% - 75% of the mineral assemblage.
Ilmenite and associated ferrous minerals are present in the laterite as discrete minerals
having average particle sizes in the 135 μm to 165 μm range. The grade of TiO2 in the
laterite ranges up to approximately 11% but is typically in the 5% to 9% TiO2.
Based on pilot plant operational results and MINTEK smelting results and standard
industry practice it is reasonable to assume the successful development of the project for
production of a high quality titanium slag for use as a feedstock in chloride process titanium
dioxide pigment manufacture. A high quality pig iron co-product will also be produced. The
pig iron is used in the manufacture of high quality ductile iron castings for automotive and
machinery applications.
Exploration work on the property began in 2009 with a program of very widespread hand-
dug deep pits sampled at approximate 1 m intervals. In these deep pits, samples were
collected through the laterite zone to the top of the saprolite zone. The initial phase of
pitting and sampling was followed up by more closely spaced deep pitting and shallow 1
m auger drilling in 2010 and 2011. Sample spacing for the pits varies from approximately
1 km x 1 km to more than 4 km. There is only limited deep pit sampling on spacing at less
than 1 km x 1 km. In total, 4,432 samples from deep pits and 2,992 1 m auger samples
have been collected and analyzed. Analysis of this project-wide sample data indicates that
assays from the deep pits generally provide more reliable data than the shallow auger
samples due to vertical inhomogeneity from soil surface to saprolite base resulting from
compaction and also possibly from primary segregation of heavy minerals during
crystallization and eruption of the basalt host rock.

MINERALS ADVISORY GROUP, LLC
139 URANIUM ENERGY CORP – Technical Report and Resource Estimate on Alto Paraná Project Date: Aug 11, 2017
In late 2014 CIC Inc. applied to reduce the original 321,980 ha concession areas to a
smaller footprint covering 74,447 has. Upon approval of this application in 2015, CIC Inc.
intended to reduce the mineral concession holdings further to a final resource permit area
of 36,177 ha covering the indicated highest grade and potentially economically extractable
part of the titanium mineralization. UEC has elected to increase the size of their properties
compared to the reduced CIC holdings. A resource estimate for the UEC area is given as
summarized in Table 25-1.
Table 25-1: 2017 UEC RESOURCE ESTIMATE
Cut-Off % % TiO2 % Fe2O3 % Ilmenite
calculated Tonnes
Thickness
(m)
<5.0 7.31 23.35 13.68 5.21 billion 6.50
6.0 7.41 23.58 13.95 4.94 billion 6.61
7.0 7.83 24.35 14.96 3.35 billion 6.40
Notes:
1.CIM definitions were followed for Mineral Resources. 2. The Qualified Person for this Mineral Resource estimate is David Brown, P. Geo. 3.Maximum Mineral Resources are estimated at a cut-off grade of approx 5.0% TiO2. 4.A minimum mining thickness of 1 meter was used. 5.The Mineral resource is based on a property area of 70,498 hectares. 6.Effective date August 11, 2017
The inferred resource is calculated on the total TiO2 and Fe2O3 assays. Metallurgical test
work demonstrates that recovery of +25 µ ilmenite/titanomagnetite diminishes as feed
grade decreases. Future geological exploration work needs to focus not only on total TiO2
but also on recoverable TiO2. Recoverable values will be determined by recognizing the
smallest particle size allowed in smelter feed.
The resource is exceptionally large and initial operating parameters should be directed to
procuring properties with the most favorable heavy mineral particle size distribution. Land
acquisition and excellent community relationships will be critical issues in the ability of
UEC to purchase the highest value properties. To the authors’ knowledge there are no
known significant risks that could negatively affect the exploration information and mineral
resource estimates presented in this technical report. This assumes that there are no

MINERALS ADVISORY GROUP, LLC
140 URANIUM ENERGY CORP – Technical Report and Resource Estimate on Alto Paraná Project Date: Aug 11, 2017
unforeseen changes to Paraguayan mining or environmental regulations or in the attitude
of local land owners, who are presently predominantly in favor of the project.
To date the resource appears to be very homogeneous and mineral chemistry consistent.
Elements such as uranium and thorium have been problems for heavy minerals extracted
from sands; however, Alto Paraná uranium and thorium levels are extremely low.
Vanadium, magnesium and calcium levels in slag and pig iron must be carefully monitored
and controlled.
Previous owners have conducted extensive process development work with the objective
of a technically and economically viable process flow sheet for beneficiation of the
material. This work has included design, construction and operation of a 1.5 t/hour pilot
plant in Paraguay. The process development work has been very successful. The pilot
plant produced approximately 108 tonnes of concentrate over a three month period.
During the operation of the pilot plant, significant process improvements were identified
and implemented which resulted in significant reductions in reagent usage and the
capacity to produce a tailings at 30-40%+ solids with paste thickener technology. Mass
recovery of concentrate in the pilot plant operation was approximately 16.9%, which
compared very well with laboratory test work. The concentrate produced during the pilot
plant operations demonstrated excellent quality. Table 25-2 shows the average results for
84 t of concentrate and a comparison to the laboratory result.
TABLE 25-2: MAGNETIC CONCENTRATE COMPARISON – LABORATORY VS PILOT PLANT RESULTS
CIC Alto Paraná Project (Source: MAG, 2015)
Pilot Plant Results (Average of 84 t combined product – CIC XRF Assays)
Concentrate Barrels Al2O3 BaO CaO Cr2O3 Fe2O3 K2O MgO MnO Na2O P2O5 SiO2 SrO TiO2 LOI Number % % % % % % % % % % % % % %
HIMS 90 0.95 0.014 0.017 0.011 50.14 0.005 1.10 0.53 0.031 0.015 1.76 0.002 46.38 2.92 LIMS 94 1.68 0.008 0.015 0.026 67.06 0.003 0.60 0.49 0.031 0.028 0.86 0.003 29.07 1.72 TOTAL 184 1.32 0.011 0.016 0.019 58.78 0.004 0.85 0.51 0.031 0.021 1.30 0.003 37.53 2.31
Laboratory Result, Combined Product – (CIC XRF Assays)
Concentrate Assay
Al2O3 BaO CaO Cr2O3 Fe2O3 K2O MgO MnO Na2O P2O5 SiO2 SrO TiO2 LOI
% % % % % % % % % % % % % % 1.31 0.01 0.04 0.04 59.13 0.01 0.81 0.52 0.02 0.022 1.18 n.r. 36.89 0.01

MINERALS ADVISORY GROUP, LLC
141 URANIUM ENERGY CORP – Technical Report and Resource Estimate on Alto Paraná Project Date: Aug 11, 2017
MYNM shipped 108 tonnes of concentrate in January, 2012 to MINTEK in South Africa for
smelting in the MINTEK pilot plant. This work was completed during the last week of
March, 2012 and was highly successful. The pilot plant operation demonstrated the
following key conclusions:
Smelter operations during the two week test went as planned, without
upset, with the exception of one half-day period when a water jacket leak
had to be repaired and the smelter was idled during that period. MINTEK
resumed smelting operations once the repair was made;
TiO2 slag quality met or exceeded expectations for this first test. During
stabilized operations, slag assays were consistently better than 85% and
later exceeded 90% as more operating parameters were tested;
Pig iron quality met expectations, with low manganese premium material
being produced in the 85-87% TiO2 range;
Slag fluidity remained high, even when TiO2 content exceeded 90%.
Electric power requirements fell within expected ranges, when adjusted for
moisture content in feeds and heat losses from a pilot scale. Reductant
ratios, when adjusted for a pilot scale operation, also fell within expected
parameters; and
Overall, this was a very encouraging first smelting test, as most early trials
with other materials have not been met with the same level of success and
many faced severe operational problems.
Figure 25-1 illustrates the evolution of the furnace performance during the course of the
pilot plant test work.

MINERALS ADVISORY GROUP, LLC
142 URANIUM ENERGY CORP – Technical Report and Resource Estimate on Alto Paraná Project Date: Aug 11, 2017
FIGURE 25-1: PILOT PLANT SMELTER RESULTS (SOURCE: MINTEK, 2012)
Graph of TiO2, FeO and MgO concentrations in slag from furnace start up to 2 weeks into a 2 1/2 week pilot DC arc smelter test (Data to 3/27/2011)
CONCLUSIONS The Alto Paraná resource represents a potential large and sustainable business
opportunity for UEC (Cayman Islands) and is important for the Country of Paraguay.
The Alto Paraná resource appears to be homogeneous and much higher grade than
existing mineral sands deposits. Further work on particle size distribution of the
ilmenite/titanomagnetite fraction will help better define the resource.
Metallurgical processing of Alto Paraná materials at the pilot plant in Paraguay
demonstrated successful recovery of +40µ heavy minerals into a combined high and low
intensity magnetic concentrate.
Large scale electric arc smelting of Alto Paraná high intensity/low intensity magnetic
concentrate at MINTEK in South Africa demonstrated successful arc furnace production
of 90% TiO2 slag and 97% pig iron.
Water jacket repair b k

MINERALS ADVISORY GROUP, LLC
143 URANIUM ENERGY CORP – Technical Report and Resource Estimate on Alto Paraná Project Date: Aug 11, 2017
26 RECOMMENDATIONS
RECOMMENDATIONS
In accordance with UEC’s intentions to advance the Alto Paraná Project to the next level
of development (economic viability of a proven resource), the following recommendations
are made:
1. Re-start and improve the efficiency of the mothballed pilot plant in order to
increase TiO2 content of the concentrates shipped to the smelter;
2. Conduct infill auger drilling within the Initial Mining Area of CIC in order to confirm
a mineable (proven and probable category) reserve;
3. Acquire a Digital Terrain Model of the IMA in order to assist future ore reserve
estimates and mine/infrastructure planning; and
4. Complete a Preliminary Economic Assessment report, including a revised
resource model incorporating new data acquired as listed above.
For UEC to prepare a Preliminary Economic Analysis, MAG recommends the additional
work shown in Table 27-1.
An area designated as the Initial Mining Area (IMA) was proposed in the 2012 Haines
technical report for CIC as the most favorable location to delineate ore reserves and
conduct initial extraction of the reserves (Figure 27-1). This area covering approximately
UEC Personnel
NewFields
Estimate of Cost
TABLE 27-1 RECOMMENDED WORK AND BUDGET FOR PEA
Recommendations
Infill Drilling and XRF Sample Analysis
Proposed Vendor
Particle Size Analysis and XRF Sample Analysis
Digital Terain Model (Initial Mining Area)
MAG and UEC
Selection by UEC
Selection by UEC
Selection by UEC
Selection by UEC
Estimated Total Cost
$ USD
170,000
35,000
25,000
85,000
35,000
65,000
10,000
425,000
Preliminary Economic Assessment (PEA)
Develop a Proposed Mining Plan
Develop Environmental and Social Management Plan
Partial Transportaion Study
MINERALS ADVISORY GROUP, LLC
144 URANIUM ENERGY CORP – Technical Report and Resource Estimate on Alto Paraná Project Date: Aug 11, 2017
2,700 hectares consists of generally more consistent mineralization and higher grades of
Ti-bearing laterite material within the overall property. Internal to the IMA itself is a smaller
area that was designated in the Haines report for an initial mining operation with an
estimated mine life of 11 years (Figure 27-1). It is recommended that UEC conducts
infilling auger drilling within this relatively small area covering 856 hectares. To date the
area has been tested with approximately 160 auger holes averaging 200 – 350 meters
apart. Based on this relatively wide-spaced auger drilling, the IMA was projected to contain
sufficient resources to sustain an eleven year mine life using bulk surface mining methods
and cut-off grades proposed in the technical report for CIC by Haines (2012). The 11 year
mine area is generally flat, consisting of large cultivated soybean fields, which is important
in terms of the type of mine and backfill type of operations envisioned for the project.
A significant advantage in concentrating future exploration, modeling, and development of
the Alto Paraná titanium-iron resource within the recommended boundaries is proximity to
the Pilot Plant. This has obvious cost and logistical advantages regarding processing of
both auger drill samples and any future bulk samples. At a minimum, it is recommended
to fill in the grid spacing of 8 meter - 12 meter deep auger holes within the 11 Year
Resource Block to 100 meters. This would require an estimated 200 holes. The unit cost
of these auger holes is estimated to be $137 US per hole for labor and $52 US per sample
for analyses (based on historic CIC costs 2009 - 2011). Assuming an average of 10
samples per hole, this works out to be approximately $700 per auger hole.
As part of any future exploration, it is recommended that a representative population of
the auger samples (say 50% of the holes) be subjected to a particle size analysis using
screen tests. In previous bulk sample runs at the Pilot Plant, in some cases as much as
60% of the concentrates were less than 40 microns in size, which is below the minimum
particle size accepted by the smelter. In future exploration work, it will be necessary not
only to determine average grades versus depth, but also the distribution of grades by size
fraction with depth. This testing could be done at the pilot plant at reduced cost versus a
commercial laboratory. For budget estimate purpose, this is projected to add another 20%
to unit cost per auger hole.
Accurate digital terrain model (DTM) data is critical for the next phase of the project,
including resource modeling and preliminary mine/infrastructure design. A LIDAR aerial

MINERALS ADVISORY GROUP, LLC
145 URANIUM ENERGY CORP – Technical Report and Resource Estimate on Alto Paraná Project Date: Aug 11, 2017
survey to produce a DTM with one meter or less accuracy for the IMA is estimated to cost
approximately $25,000, based on estimates available on the Internet.
27 REFERENCES
Cargill, D. G., Technical Report, Paso Yobai Gold Project, Paraguay, prepared for Latin American Minerals, February, 2008
Fulfaro, J.; Alvarena, D.’ Conrado, C.; Paraguay 1986, Mapa Geologico de la República del Paraguay, Proyecto par 83/00.

MINERALS ADVISORY GROUP, LLC
146 URANIUM ENERGY CORP – Technical Report and Resource Estimate on Alto Paraná Project Date: Aug 11, 2017
Fulfaro, V.J., Geologia del Paraguay Oriental, in Magmatisomo Alcalino en Paraguay Central-Oriental, Relations con Magmatismo Coeval en Brasil; Comin-Chiarmonti, P. and Gomes, C. B. (ds), Edusp/Fapesp, Sao Paulo, 1996, pp. 17-29.
Gonzalez, M.; Vallalba, n. San Lorenzo, Mapa Geologico de la República del Paraguay, 2001.
Nunez, m. E. Asuncion, Mapa Geologico de la República del Paraguay, Texto explicative, 1999.
Reeves, R. G. and Kuhn, M. C., Review of top 6 Titanium Deposits in the World; Internal Report by MAG Associates LLC, November 2016.
CIC INTERNAL REPORTS Kuhn, M. C., Report of Investigation-Tailings, MYNM Pilot Plant Tailings Management
Study, October 2012, pp 1-22. Kuhn, M. C., Report of Investigation Paraná Tailings #2, MYNM Pilot Plant, Tailings
Management and Remediation Study, February 2014, pp1-34. Kuhn, M. C., Report of Investigation Paraná Tailings #3, MYNM Pilot Plant, Tailings
Management and Remediation Study, March 2015. Kuhn, M. C. and Brown, D . M., Technical Report and Resource Estimate on Alto Paraná
Project; Report for NI 43-101Prepared for CIC Resources Inc and Delta Gold Corporation, April 2015.
Minerals Advisory Group, Report of Investigation 2, MAG R&D, November 2009, pp1-145. Pocock Industrial, Inc., Particle Size Analyses, Flocculent Screening, Hydroseparation,
Gravity Sedimentation and Pulp Rheology, CIC Resources, Paraná Project, September 2010, pp 1-31.
Minerals Advisory Group R&D, Report of Investigation 1, Paraná Titanium Recovery Project, July 2009, pp 1.40.
Minerals Advisory Group, Summary report, Development and Preparation of Ilmenite Concentrate, August 2010, pp 1.20.
Stammer, J., Advanced Mineralogy Research Center, Colorado School of Mines, QEMSCAN Analysis of Laterite Concentrates, Paraguay, October 27, 2009, pp1-29.
Appleby, S., Advanced Mineralogy Research Center, Colorado School of Mines, QEMSCAN Analysis-Alto Paraná Project; January 14, 2011, pp 1-14.
Geldenhuys, I. J.’ McCullough, S.D.; Xakalashe, B. S., Moodley, R.; MINTEK; External Report, 6303, Pilot Plant. DC Furnace Test Work for CIC Resources: Smelting of Ilmenite Concentrate From Paraguay Containing Less Than 35% TiO2, pp 1-184.
Minerals Advisory Group, Scoping Study 3, Paraná Prospect, January 2012, pp 1-120. Minerals Advisory Group, Scoping Study 4, Paraná Prospect, March, 2012, pp 1-118. Minerals Advisory Group, Processing of Paraná feed Materials, February, 2011. Hains, D. H., QP, Hains Engineering Company Limited, Technical Report, Resource
Estimate, and Preliminary Economic Analysis on the Alto Paraná Ilmenite Project, Report 43-101, April 22, 2012, pp1-1 through30-1.
VOUGA Abogados Title Opinion regarding Departments of Alto Paraná and Canindeyu Mining Rights and Claims March 30, 2015.
Walkers Legal Opinion letter regarding CIC Resources and Associated Corporate entities in Good Standing in the Cayman Islands (the “Registrar”); March 31, 2015.
Fierro, J,, Resources Estimation – Alto Paraná, updated as of February, 2015 Fierro, J. and Mejia J. – CIC technical documents and maps/tables made between 2010 -
2015 using Public GIS information and proprietary exploration data held by CIC Lic. Geol. Orlando Oport, Environmental Permit of Applications, 6 Feb 2015.

MINERALS ADVISORY GROUP, LLC
147 URANIUM ENERGY CORP – Technical Report and Resource Estimate on Alto Paraná Project Date: Aug 11, 2017
Obras Publicas y Comunicaciones, Resolutions 1404, 8/21/2015; 2242, 12/2/2015; 188, 2/14/2017; 795, 5/29/2017;1891, 8/16/2016.
Uranium Energy Corp Exercises Option to Acquire the Alto Paraná Titanium Project in Paraguay, 6/10/2017.
Certificate of Good Standing, Paraguay Resource Inc., 7/18/2017; CIC Resources (Paraguay) Inc., 7/18/2017.
Certificate of Good Standing, JDL Resources Inc, Cayman Islands, 13, July, 2017. Figueredo, Jorge, Email in regards to USD 0.04,kwh power, 12/15/2016. Administracion Nacional De Electricidad, Pyoyecto de Mineria e Industria Electrointensiva
de Titaniio-Ilmenita Alto Paraná, 3/15/2013. State of Nevada “Certificate of Existence with Status in Good Standing (Uranium Energy
Corp), Feb 9, 2016. Maria Betharram Ardissone of Fiorio, Cardazo and Alvarado Law Firm report containing
the current situation of the “ALTO PARANA” Project. August 7, 2017, pages 1-5.

MINERALS ADVISORY GROUP, LLC
148 URANIUM ENERGY CORP – Technical Report and Resource Estimate on Alto Paraná Project Date: Aug 11, 2017
28 DATE AND SIGNATURE PAGE
CERTIFICATE OF QUALIFIED PERSON I am Martin C. Kuhn, as author of this report entitled “Technical Report and Resource Estimate on Alto Paraná Project” dated August 11, 2017 do hereby certify that:
1. I am a Senior Principal of:
Minerals Advisory Group, LLC 2524 W Ruthrauff Rd Tucson, Arizona, USA 85705
2. I am a graduate of the Colorado School of Mines with the following degrees: a. Metallurgical Engineer, 1963 b. Master of Science, Metallurgical Engineering, 1967 c. Doctor of Philosophy, Metallurgical Engineer, 1969
3. I am a Distinguished Member of the Society of Mining Engineers of the
American Institute of Mining, Metallurgical and Petroleum Engineers, Class of 1987 I am a Member of the Mining and Metallurgical Society of America, Member Number-01216 I am a Founding Registered Member of the Society for Mining, Metallurgy, and Exploration, Inc., Member Number 1802650RM, 2006 I am a Registered Professional Engineer, Metallurgical Engineering, State Board of Technical Registration, State of Arizona, USA, Certificate Number 10560, 1976. I have worked as a Metallurgical Engineer for forty nine (49) years since leaving school with my PhD in Metallurgical Engineering. I have relevant process and engineering experience in processing industrial, precious and heavy metal materials. Following is an example of projects I have been involved in.
UOP, Inc. Developed and piloted nickel and cobalt recovery technology from high iron laterite ores.

MINERALS ADVISORY GROUP, LLC
149 URANIUM ENERGY CORP – Technical Report and Resource Estimate on Alto Paraná Project Date: Aug 11, 2017
UOP, Inc. Directed laboratory and pilot scale research in the recovery of titanium from ilmenite.
UOP, Inc. Developed and piloted silica-free powdered iron recovery from specular hematite concentrates.
Universal Tankships (Delaware) Inc., Jari, Para, Brazil: Designed, installed and operated a 15 MTPH heavy media plant for a gibbsite-hematite separation from high clay lateritic ores.
IMC/W.R. Grace, Florida: Provided process development, conceptual engineering, and major equipment selection of 100 TPH beneficiation plant for the separation of dolomite from phosphate rock.
CIC Resources, Developed and demonstrated first successful recovery of ilmenite/magnetic from lateritic ores in Paraguay.
Ok Tedi Mining, Ltd.: Removal and reconstruction of two copper concentrators from United States locations for primary copper/gold milling in Papua New Guinea.
Newcrest Mining Limited, Provided metallurgical due diligence review to the Newcrest Mining Board for the Cadia Hill Gold/Copper Project, Orange, NSW.
Newmont Mining, Performed a critical review for the Newmont Board of a feasibility study for a gold mill at Yanacocha, Peru.
Newmont Mining, Performed a critical review for the Newmont Board of a feasibility study for the Phoenix Gold/Copper Project in Nevada.
Peru Copper Inc., Developed and supervised metallurgical research and development program for the Toromocho Project. Authored the metallurgical section of the Canadian Instrument 43-101.
Copper Range Company, Provided metallurgical due diligence for the in-situ copper leaching, solvent extraction and electrowinning project at White Pine, Michigan, USA
Goldfields, Inc, Provided metallurgical due diligence of heap leach, carbon adsorption, electrowinning and conventional milling of the Pipeline Project, Nevada, USA
4. I have read the definition of “qualified person” set out in National Instrument 43-101 (“NI 43-101”) and certify that by reason of my education, affiliation with a professional association (as defined in NI 43-101) and past relevant work experience, I fulfill the requirements to be a “qualified person” for the purposes of NI 43-101.

MINERALS ADVISORY GROUP, LLC
150 URANIUM ENERGY CORP – Technical Report and Resource Estimate on Alto Paraná Project Date: Aug 11, 2017
5. I have visited the project on numerous occasions from 2011 through September 21-26, 2012; October 13-16, 2012; October 28-November 6, 2012; and February 15-22, 2013.
6. I am responsible for the overall preparation of the report and specifically of Items (1 through 6, 13, 15 through 22 & 23 through 27) of the Technical Report titled “Technical Report and Resource Estimate on Alto Paraná Project” dated August 11, 2017.
7. I am independent of the Issuer, Uranium Energy Corp. (USA) applying the test set out in Section 1.5 of National Instrument 43-101. My Prior involvement with the project began in 2009 by analyzing lateritic materials from Paraná at Minerals Advisory Group R&D in Tucson, AZ. Minerals Advisory Group, under contract with CIC Resources, Inc. developed the metallurgical process, designed, engineered and delivered a pilot plant to site and managed the operation of the plant to produce the technical information and ilmenite concentrate for smelter testing at MINTEC in South Africa. Minerals Advisory Group’s last on-site involvement in the project was February 22nd, 2013. My visits to the property began in 2009 observing the resource and 2011 to identify potential staff to man the proposed pilot plant near Minga Pora, Paraguay. In addition to identifying staff, I identified potential contractors to provide infrastructure for the green-fields plant site. A deep water well was drilled (280 m) and a 50,000 L fresh water tank built and installed at site. Electrical power from a 66 KV line was installed with transformer to provide power to the pilot plant and site. During the site preparation period MAG contracted with Lyntek in Denver, CO to provide equipment and materials for the pilot plant. In August of 2011 the pilot plant arrived for installation at site and I was on site supervising the construction effort. In 2011 MAG supplied engineers to assist in construction, ramp-up and operation of the pilot plant. In November and early December of 2011, I provided plant supervision in the production of concentrate for MINTEK. The periods of September 21-26, 2012, October 13-16, 2012 and October 28-November 6, 2012 I worked at the pilot plant supervising installation of plant improvements, the installation and operation of a paste thickener and filling of the tailings columns. My final visit to the pilot plant was February 15-22, 2013. During this visit I provided technical input to pilot plant visitors. I was the QP of record for a May 4, 2015 Technical Report on the Alto Paraná project.
8. I have read National Instrument 43-101 and Form 43-101F1, and the Technical Report has been prepared in compliance with that instrument and form.

MINERALS ADVISORY GROUP, LLC
151 URANIUM ENERGY CORP – Technical Report and Resource Estimate on Alto Paraná Project Date: Aug 11, 2017

MINERALS ADVISORY GROUP, LLC
152 URANIUM ENERGY CORP – Technical Report and Resource Estimate on Alto Paraná Project Date: Aug 11, 2017

MINERALS ADVISORY GROUP, LLC
153 URANIUM ENERGY CORP – Technical Report and Resource Estimate on Alto Paraná Project Date: Aug 11, 2017