technical report 98-01: fisheries use and water quality in ... · technical report no. 98-1...
TRANSCRIPT

Technical Report No. 98-1
Fisheries Use and Water Quality in the Fort Knox Mine Water Supply Reservoir
by Alvin G. Ott and Phyllis Weber Scannell
January 1998
Alaska Department of Fish and Game Habitat and Restoration Division

The Alaska Department of Fish and Game administers all programs and activities free from discrimination on the basis of sex, color, race, religion, national origin, age, marital status, pregnancy, parenthood, or disability. For information on alternative formats available for this and other department publications contact the department ADA Coordinator (voice) 9071465-4120: (TTD) 9071478-3648. Any person who believes s h e has been discriminated against should write to: ADF&G, PO Box 25526, Juneau, AK 99802-5526 or O.E.O. U.S. Department of the Interior, Washington D.C. 20240.

FISHERIES USE AND WATER QUALITY IN THE FORT KNOX MINE WATER SUPPLY RESERVOIR
by
Alvin G. Ott and Phyllis Weber Scannell
Janet Kowalski Director
Habitat and Restoration Division Alaska Department of Fish and Game

Table of Contents
Table of Contents ........................................................................................................... i List of Tables ................................................................................................................... ii
... List of Figures ................................................................................................................. III
........................................................................................................... Acknowledgments iv
........................................................................................................ Executive Summary v
Introduction ..................................................................................................................... I Methods .......................................................................................................................... 4
Sampling Sites ............................................................................................................ 4
Fish ............................................................................................................................. 4
Water Quality .............................................................................................................. 6
Results and Discussion .................................................................................................. 7
Fort Knox Water Supply Reservoir. Water Quality ...................................................... 7
Fort Knox Water Supply Reservoir. Arctic Grayling .................................................... 9
............................................................... Fort Knox Water Supply Reservoir. Burbot 13
Literature Cited ............................................................................................................. 20
Appendix 1 - Water Quality Water Supply Reservoir .................................................... 21
Appendix 2 - Growth of Tagged Arctic Grayling (1997) ................................................ 23
Appendix 3 . Growth of Tagged Burbot (1995 . 1997) .................................................. 24

List of Tables
1. Catch of Arctic grayling in fyke nets fished in the Fort Knox water supply ............................................................................................................... reservoir. 10
2. Length (mm) of young-of-the-year (YOY) Arctic grayling captured with fyke-nets in late Augustlearly September in the Fort Knox water supply reservoir. .............. 11
3. Catch of burbot in the water supply reservoir in 1996 and 1997 using minnow ............................................................................................. traps and hoop nets. 14
4. Catch of burbot in unbaited fyke-nets fished in the Fort Knox water supply ............................................................................................................... reservoir. 15

List of Figures
1. Fort Knox project location. .................................................................... ................... . . 2
2. Fyke-net sample sites in the water supply reservoir. ................................................. 5
3. Water quality sample sites in the Fort Knox water supply reservoir (1997). .............. 8
4. The minimum, maximum, and mean growth of Arctic grayling in upper Fish Creek and the Fort Knox water supply reservoir from 1994 to 1997. .. ...... ............ 12
5. Length (minimum, mean, and maximum) of young-of-the-year burbot captured with fyke-nets in August 1996 and 1997. .... . .... . . . . . . . . . . . . . . ... ... . . . . . . . . . .. . . . . . . .. . . . . .. . . . . . . . . 16
6. Length (minimum, mean, and maximum) of age I + burbot captured with hoop and minnow traps in late May 1997 and with fyke-nets in late August 1997. . . . . . . . . I 7
7. Length-frequency distribution of burbot caught in the water supply reservoir (1 995-1 997). . . . . . . . . . . . . . . . . . . . . . . . . . . . . . . . . . . . . . . . . . . . . . . . . . . . . . . . . . . . . . . . . . . . . . . . . . . . . . . . . . . . . . . . . . . . . . . . . . . . . . . . . . I 9

Acknowledgments
Our thanks to Mr. Steve Lang, Mr. Tom Irwin, and Mr. Bill Jeffress (Fairbanks Gold
Mining, Inc.) for continuing to work cooperatively with the department. We thank Ms.
Sheree Warner of the Alaska Department of Fish and Game (ADF&G) for her
assistance in preparation of the final report. Mr. Matt Evenson (Sport Fish Division,
ADF&G) continued his burbot research in the water supply reservoir and his data were
incorporated in this report. Dr. Jim Reynolds and Dr. Al Tyler (University of Alaska
Fairbanks) and their students participated in the September sample event. Mr. Jack
Winters, Mr. Bill Morris, and Mr. Carl Hemming (ADF&G) and Mr. Keith Mueller (US Fish
and Wildlife Service) assisted with field data collection. Constructive review of our
report was provided Uy Mr. Matt Evenson, Mr. Jack Winters, and Mr. Bill Jeffress.

Executive Summary
Maximum pool elevation for the water supply reservoir will be 1021.0 ft. Water levels in
the water supply reservoir reached a maximum elevation of 1,016.6 ft in July 1996 and
1015.3 ft in July 1997. Water levels decreased gradually during summer 1996 and
remained fairly constant in summer 1997. Seepage flow, below the dam, has remained
fairly constant at a rate of 1.5 to 2.0 cfs.
Anaerobic conditions were found in the middle of the water supply reservoir in
September 1997. Dissolved oxygen was partially depleted even at a depth of 1 m.
Dissolved oxygen was higher in the upper portion of the water supply reservoir. Water
was mixed down to 5+ m and was stratified above or at 7 m. The lowest dissolved
oxygen concentrations were found where the water was the deepest.
Catch rates for Arctic grayling (Thymallus arcticus) in fall 1997 were substantially less
than fall 1996. Our late fall sampling with fyke-nets in 1996 and 1997 showed minimal
survival of young-of-the-year spawned in spring 1996 and some survival of the fish
spawned in spring 1997. Lack of access to stream habitats for spawning and predation
by burbot probably explain poor young-of-the-year survival. Growth rates in the water
supply reservoir continue to exceed those found prior to construction.
In May 1995, we conducted a marwrecapture experiment estimating the burbot (Lota
Iota) population at about 825 (Ott and Weber Scannell 1996). Our spring 1997
population estimate for burbot 2250 mm was 622 (95% confidence interval 462 to 782)
with an unknown number less than 250 mm. Catch rates in late August and early
September of 1997 were substantially higher than in August 1996. In August 1996,
and 1997 young-of-the-year burbot were present in fyke-net catches. In late August
1996 these fish averaged 122 mm and in late Augusffearly September of 1997, this
size group averaged 119 mm. We believe that spawning success was high in
FebruaryIMarch 1994 as reflected by high catches of fish <200 mm in spring 1995,
extremely poor for FebruaryIMarch 1995 as seen by the near total absence of fish
between 200 and 250 mm in August of 1996, and high for 1996 based on an
abundance of fish <250 mm in August 1997.

Introduction
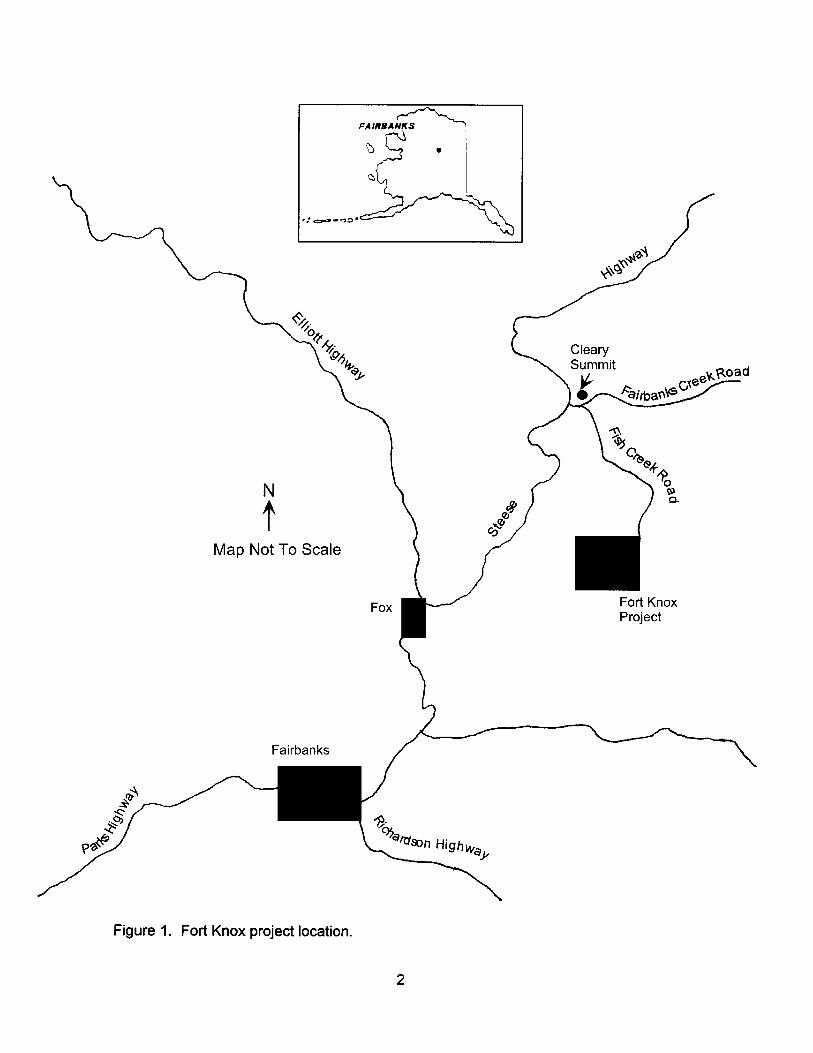
Fairbanks Gold Mining, Inc. (FGMI) began construction of the Fort Knox hard-rock gold
mine in spring 1995. The mine is located in the headwaters of the Fish Creek drainage
about 25 km northeast of Fairbanks (Figure 1). The project includes an open-pit mine,
mill, tailing impoundment, water supply reservoir, and related facilities. A description of
construction activities during 1995 and 1996 at the reservoir was presented by Ott and
Weber Scannell (1996) and Ott and Townsend (1997). Water impoundment began in
the water supply reservoir in November 1995. Construction of the dam and spillway
was complete by July 1996 and the first official gold pour was made on December 20,
1996.
Water levels in the water supply reservoir reached a maximum elevation of 1,016.6 ft in
July 1996; pumping then began to move water to the tailing impoundment. Ultimately,
maximum pool elevation will be 1021.0 ft. Final water surface elevation was 1,011.9 ft
in November 1996, when pumping ceased. Water levels continued to decrease slowly
reaching a low of 1,009.5 ft on April 25, 1997. Maximum surface elevation reported
after spring breakup in 1997 was 1,015.3 ft on June 6. In late August 1997, FGMI
began pumping seepage water back to the water supply reservoir at a rate of about
800 gallons/minute. Water levels remained fairly constant throughout summer 1997 as
indicated by an elevation of 1,014.3 ft recorded on October 10, 1997. Seepage flow
below the dam has remained fairly constant at a rate of 1.5 to 2.0 cfs.
Our fisheries study was initiated in 1992 and focused on streams in and downstream of
the project area (Weber Scannell and Ott 1993). In 1993, stream sampling continued
and we began to collect fisheries data in abandoned settling ponds and mine cuts that
would be flooded by the water supply reservoir (Weber Scannell and Ott 1994). In
1994, we established and sampled stream reaches above and below the area that
would be flooded (Ott et al. 1995). Stream sampling continued in 1995 and we
estimated the Arctic grayling (Thymallus arcticus) and burbot (Lota Iota) population that
would be available to colonize the water supply reservoir (Ott and Weber Scannell
1996). We estimated that there were about 1,700 Arctic grayling 4 5 0 mm
Map Not To Scale
Fort Knox Project
Fairbanks
Figure 1. Fort Knox project location.

and 4,350 2150 mm in Fish Creek upstream of the freshwater dam. The number of
burbot in upper Fish Creek drainage, mainly in Polar Ponds # I and #2, was about 825.
In 1996, we began to monitor fish use of the water supply reservoir by gathering
information on growth, recruitment of young-of-the-year, and catch per unit of effort (Ott
and Weber Scannell 1996). We continued to monitor fish use of the water supply
reservoir in summer 1997 by conducting a markhecapture experiment to estimate the
burbot population, and by gathering data on growth and recruitment of young-of-the-
year burbot and Arctic grayling. We also began to collect water quality data in the
water supply reservoir. Our report summarizes data collection in 1997 and discusses
these findings in relation to previous work.

Sampling Sites
Baseline sampling sites (Upper Last Chance Creek, Bear Creek, and Lower Fish
Creek) were established in 1994 to assess effects of the project on water quality and
use of streams by fish. In 1997, water quality samples were not taken at these sites
and fish sampling was not performed although visual observations were made in Upper
Last Chance Creek.
Baseline fyke-net sampling sites in the water supply reservoir were established in 1996.
Five of the eight sample sites were fished in 1997 (Figure 2). The general area for
each net site is fixed but location varies with water level. Fyke-nets have been fished
at the following sites: Fyke-net #I (Solo Creek Bay), #2 and #6 (Last Chance Bay), #3
(Pump Bay), #4 (Polar Pond Bay), #5 (Upper Last Chance Bay), #7 (Fish Bay), and #8
(Main Reservoir). The most frequently used net sites are Solo Bay (#1), Last Chance
Bay (#2), Pump Bay (#3), Upper Last Chance Bay (#5), and Fish Bay (#7).
Hoop traps (small and large) and minnow traps were fished throughout the water
supply reservoir. Gear types were mixed to ensure each area (e.g., Solo Bay) had a
combination of minnow traps and large and small hoop traps.
Fish
We sampled fish by electrofishing, fyke-nets, hoop traps, minnow traps, and visual
observation. In 1997, most fish were collected with hoop traps and fyke-nets. Arctic
grayling were not marked in 1997. Some of the burbot collected during May and
September were marked with a floy-tag and some, previously marked and injected with
oxytetracycline, were retained for age validation studies being conducted by Mr. Matt
Evenson (Sport Fish Division). A pulsed-DC (direct current) electrofishing system
mounted on a 6.1 m-long boat (Clark 1995) was used to collect fish in September 1997.

Figure 2. Fyke-net sample sites in the water supply reservoir.
WATER SUPPLY DAM
NOT TO SCALE FISH CREEK

Two sizes of fyke-net were used. Net size (wings, mesh, and center leads) was the
same except for entrance frames. Entrance frames were either 0.9 m2 or 1.2 m2. Fyke-
nets were 3.7 m long, had five hoops, a 1.8 m cod end, and 0.9 m by 7.6 m net wings
attached to the entrance frame. The center lead was 30.4 m and was deployed to the
maximum extent possible without submerging the top of the entrance frame. Nets were
set with the center lead either perpendicular to or at an angle to shore, depending upon
distance to deep water. Unbaited fyke-nets were fished 24 hr and reset or pulled.
We used minnow and hoop traps baited with salmon roe and fish to collect burbot in
the water supply reservoir. Traps were fished 24 hr and rebaited if reset. Minnow traps
were 42 cm long, 22 cm in diameter, of wire mesh construction, and had two 2.5 cm2
openings on each end. Two sizes of hoop nets were used. Small traps were 1.6 m
long with four hoops 54 cm in diameter. Netting was 8.5 mm bar mesh. The large
traps were 3.05 m long with seven hoops. Hoop diameter tapered from 0.61 m at the
entrance to 0.46 m at the cod end. Netting on the larger hoop traps was 25 mm bar
mesh. All traps were kept stretched and open with spreader bars and each trap had
one throat with the cod end tied.
We estimated the population size of burbot in the water supply reservoir with
Chapman's modification of the Peterson mark-recapture technique (Chapman 1951).
During the mark and recapture event, fish were captured with hoop nets and minnow
traps. Formulas used to estimate the population, the variance of the estimate, and the
95% confidence interval (CI) were presented in our 1996 report (Ott and Weber
Scannell 1996).
Water Quality
Temperature, dissolved oxygen, pH, specific conductivity, and turbidity were measured
at depth with a Hydrolab Surveyor 4 meter and a Hydrolab Minisonde Multiprobe.
Water was collected with a VanDorn water sample bottle. We also sampled for
zooplankton with 2 m tows and filtered surface water samples for later chlorophyll-a
analysis.

Results and Discussion
Fort Knox Water Supply Reservoir, Water Quality
On September 6 and 7, 1997, the University of Alaska Fairbanks fish classes (Dr.
Reynolds and Dr. Tyler and ten students) began a fisheries techniques class to sample
the Fort Knox water supply reservoir. The intent is to conduct the field program using
the same methods as an annual sample event. They ran a temperatureldissolved
oxygen profile on a transect down the center of the water supply reservoir (Figure 3).
Concentrations of dissolved oxygen ranged from 0 to 11 mg/L and water temperatures
from 7 to 14OC. Surface water at the west end (upstream side) of the water supply
reservoir was at saturation, but decreased with depth. Anaerobic conditions were first
found in the middle of the water supply reservoir on the east-west transect at the pump
house at a depth of 5 m. Anaerobic conditions continued east to a position about 100
m from the dam. Dissolved oxygen concentrations were partially depleted at this
location even at a depth of 1 m.
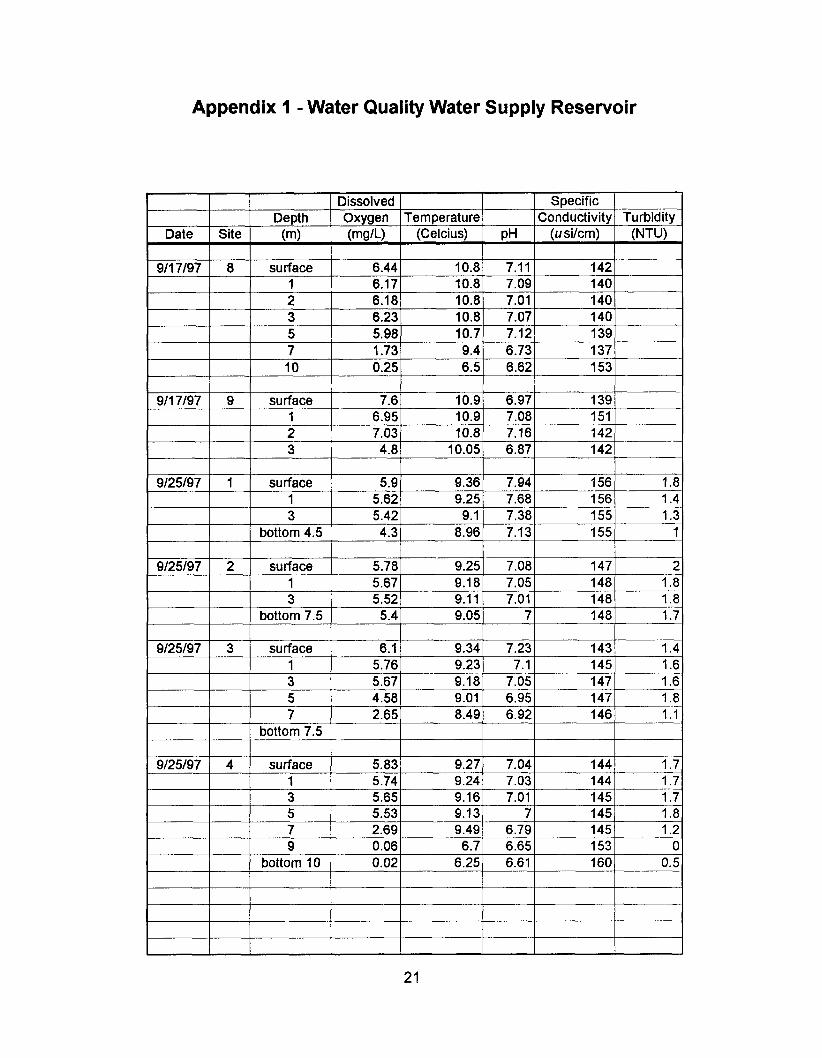
We continued to sample water quality in the water supply reservoir on the 17th and
25th of September. Two sites were selected: Site 8 in the middle of the water supply
reservoir (water depth 10.5 m) across from Solo Creek; and Site 9 near the inflow
(water depth 3.5 m) from Last Chance Creek (Figure 3). Dissolved oxygen at the Last
Chance Creek site was 7.6 mg/L at the surface and 4.8 mg/L at 3 m. Water at the Last
Chance Creek site was mixed to the bottom. In the middle of the water supply
reservoir, surface dissolved oxygen was measured at 6.4 mglL and dropped to 0.25
mg1L. Water was mixed down to 5+ m and was stratified above or at 7 m.
On September 25, seven sites were selected and sampled (Figure 3). Results were
similar to the previous week; the thermocline again occurred between 5 and 7 m.
Dissolved oxygen ranged from 5.78 to 6.34 mglL at the surface and from 0.0 to 5.4 at
the bottom (Appendix 1). The lowest dissolved oxygen concentrations were found at
Sites 6 and 4 where the water was deepest. We plan to continue water quality
monitoring and collect water samples to measure both biological and chemical oxygen
demand at depth during the winter of 199711 998.

Figure 3. Water quality sample sites in the Fort Knox water supply reservoir (1997).
WATER SUPPLY DAM
0 Temperature, Dissolved Oxygen Sites
- - - Temperature, Dissolved Oxygen Transect
LAST CHANCE
NOT TO SCALE / FISH CREEK

Fort Knox Water Supply Reservoir, Arctic Grayling
On May 21, 1997, after a 24 hr set, two fyke nets contained 386 (Pump Bay #3) and
254 (Solo Bay #I) Arctic grayling. Both male and female Arctic grayling were ripe, with
milt evident and running eggs present. On May 29, 1997, we observed adult Arctic
grayling spawning on a gravel shoal near the head of the original upper Last Chance
Creek pond. We conducted a visual survey along the margins of the water supply
reservoir in late July, but did not observe any young-of-the-year.
We believe that the extremely high catch in spring 1997 was due to timing - nets were
fished at a time when adult fish were actively moving along the shoreline to find
suitable spawning habitat. There are three tributaries to the water supply reservoir:
Solo Creek which was not used for spawning before construction due to cold water
temperatures in this north-facing permafrost drainage; Fish Creek where a barrier has
been built to keep fish from the constructed wetland complex; and Last Chance Creek
where aufeis forced the creek out of the channel and over a 2 m high waterfall. Arctic
grayling did not have access to stream spawning habitat in either 1996 or 1997.
During the last week of August, we fished five fyke nets (Solo Bay # I , Last Chance Bay
#2, Pump Bay #3, Upper Last Chance Bay #5, and Fish Bay #7) for two days. We also
fished the same nets for one day in early September (Table 1). Catch rates for Arctic
grayling in fall 1997 were substantially less than fall 1996. In fall (late Augustlearly
September) 1997, young-of-the-year Arctic grayling were captured with fyke nets. The
actual catch of young-of-the-year fish is higher than shown due to predation in the net
by burbot. We are assuming, based on age at length data collected in spring 1996 (Ott
and Townsend 1997), that most of the young-of-the-year in late fall are less than 100
mm. Hughes (1986) collected outmigrating fish from Badger Slough with a weir and
reported that most fall outmigrants were young-of-the-year Arctic grayling less than 100
mm. Holmes (1985) found that the mean size of age 1 Arctic grayling in the Chena
River was 97 mm. Mean length of young-of-the-year Arctic grayling in Badger Slough
by the end of September was 84.3 mm (range 65 to 11 1 mm, SD = 9.0) (Wuttig 1997).

Table 1. Catch of Arctic grayling in fyke nets fished in the Fort Knox water supply reservoir.
Sample Number of Number of Grayling Number of Grayling CPUE Date Nets ( 4 5 0 mm) (>I 50 mm) (AGItraplday)
*Arctic grayling were counted and released - measurements were not made due to the large number of fish. We did estimate that less than 10 of the 640 were small (i.e. 4 5 0 mm).

Young-of-the-year Arctic grayling collected in outlet streams in the Polar Pond complex
in 1994 prior to flooding by the water supply reservoir averaged 70 mm (N= 26, 52 to
97 mm, SD = 12.5) on August 11. Assuming fish 4 0 0 mm are young-of-the-year, our
late fall sampling with fyke-nets in 1996 and 1997 showed minimal survival of fish
spawned in spring 1996 and some survival of the 1997 spring spawning population
(Table 2). Access to suitable stream spawning habitats was not available in either
1996 or 1997. Water levels in summer 1996 began to decrease when pumping began
from the water supply reservoir; however, water elevations were relatively stable with a
gradual decrease throughout summer 1997. Assuming most Arctic grayling spawning
occurred in shallow water habitat as observed in 1997, decreased water levels in 1996
may have had an negative impact on egg survival.
Table 2. Length (mm) of young-of-the-year (YOY) Arctic grayling captured with fyke- nets in late Augustlearly September in the Fort Knox water supply reservoir.
Average Sample Total Fish Number of Length Range Year Caught Y-0-Y (mm) (mm) SD
We continued to monitor growth of Arctic grayling and planned to conduct a
marwrecapture population experiment in fall 1997. A population estimate was not
made due to low catches in the fyke-nets. We did recapture Arctic grayling tagged in
1995 and 1996 (Appendix 2). Prior to flooding of the water supply reservoir, average
annual growth for Arctic grayling collected in the Last Chance Creek complex was 9
mm. Annual growth increased to 21 mm from 1995 to 1996 when the water supply
reservoir was beginning to fill. During summer 1996, fish tagged in spring and
recaptured in fall had an average growth of 41 mm, a substantial increase over pre-
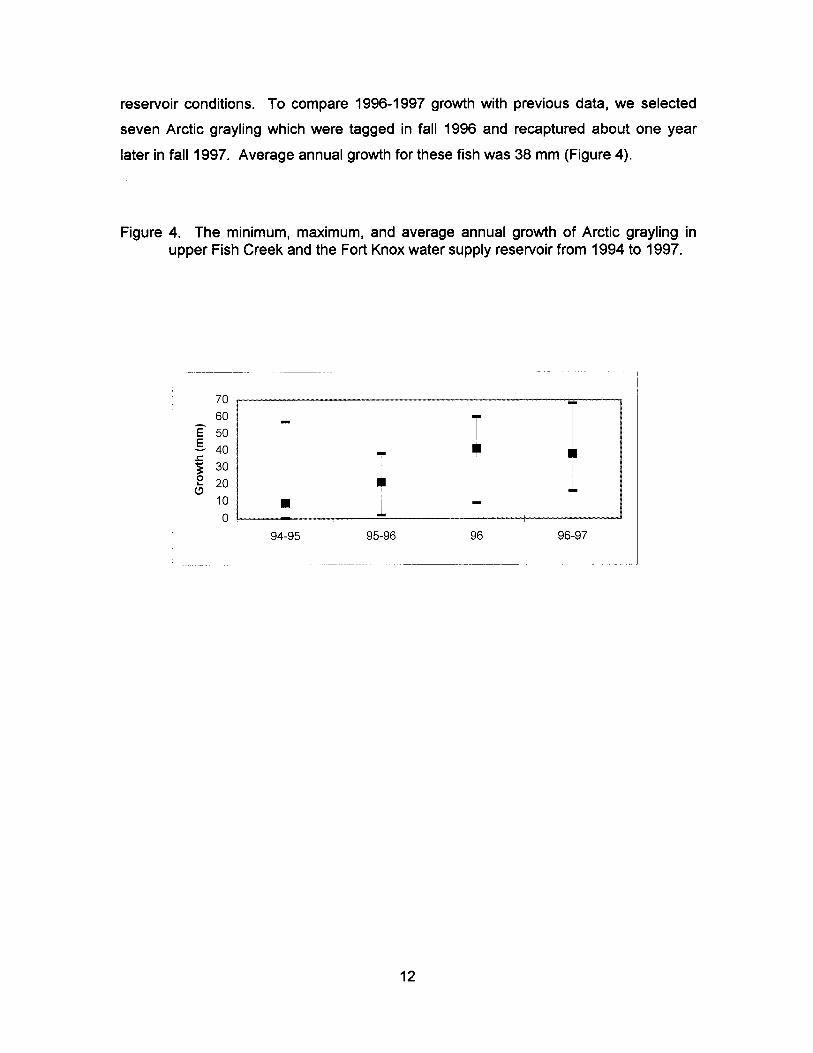
reservoir conditions. To compare 1996-1 997 growth with previous data, we selected
seven Arctic grayling which were tagged in fall 1996 and recaptured about one year
later in fall 1997. Average annual growth for these fish was 38 mm (Figure 4).
Figure 4. The minimum, maximum, and average annual growth of Arctic grayling in upper Fish Creek and the Fort Knox water supply reservoir from 1994 to 1997.

Fort Knox Water Supply Reservoir, Burbot
Burbot use of the Lower Last Chance Creek Pond and Polar Ponds # I and #2 was
reported by Ott and Weber Scannell (1996). In May 1995, we conducted a
markhecapture experiment and estimated the burbot population at about 825 (Ott and
Weber Scannell 1996). Flooding of the water supply reservoir began in November
1995, isolating burbot upstream of the dam. Burbot sampling continued in summer
1996, with data collected on growth of fish tagged in 1995, recruitment and growth of
young-of-the-year burbot, and catch using minnow traps, hoop nets, and fyke nets (Ott
and Townsend 1997).
In late May 1997, we again conducted a markhecapture population estimate for burbot.
Total catch by gear type and catch per unit of effort are shown in Table 3. Catch per
unit of effort generally was highest in the small hoop traps and least in minnow traps.
Effectiveness of gear type probably was related to the size composition of the
population being sampled. Unmarked burbot were tagged, and recaptured fish with an
oxytetracyclene mark were retained. Some mortalities (gilled in hoop nets) were
encountered in the large hoop traps.
We marked 189 burbot captured with hoop nets and minnow traps on May 21 and 22,
1997. Sixteen of the burbot ranged in size from 145 to 181 mm and the remaining 173
were between 287 and 605 mm. We recaptured 125 burbot on May 28 and 29, 1997.
Of the 125 fish, eight were small (147 to 195 mm) and the rest ranged from 273 to 612
mm. Thirty-two of the fish seen during the recapture event had been marked on May
21 or 22. None of the recaptured fish was less than 250 mm. Our population estimate
for burbot ,250 mm was 622 (95% confidence interval 462 to 782) with an unknown
number less than 250 mm. This length range likely represents the same cohorts that
were estimated in 1995.
Sampling for burbot continued in late August and early September 1997 using fyke-
nets. A total of 245 burbot was captured. Catch rates in late August and early
September of 1997 were substantially higher than in August 1996 (Table 4); and a
much larger proportion of small burbot (< 250 mm) were captured during the 1997

Table 3. Catch of burbot in the water supply reservoir in 1996 and 1997 using minnow traps and hoop nets.
Sample Gear Number Catch Mean CPUE' Date Type of Traps (Total) (B Bltra plda y)
May 22,96 May 23,96
minnow minnow
May 20,97 May 21, 97
minnow minnow
May 28, 97 May 29,97
minnow minnow
small hoop small hoop
May 22,96 May 23,96
May 20,97 May 21, 97
small hoop small hoop
May 28, 97 May 29, 97
small hoop small hoop
May 22,96 May 23,96
large hoop large hoop
large hoop large hoop
May 20,97 May 21, 97
May 28,97 May 29, 97
large hoop large hoop
--
I CPUE = catch per unit of effort
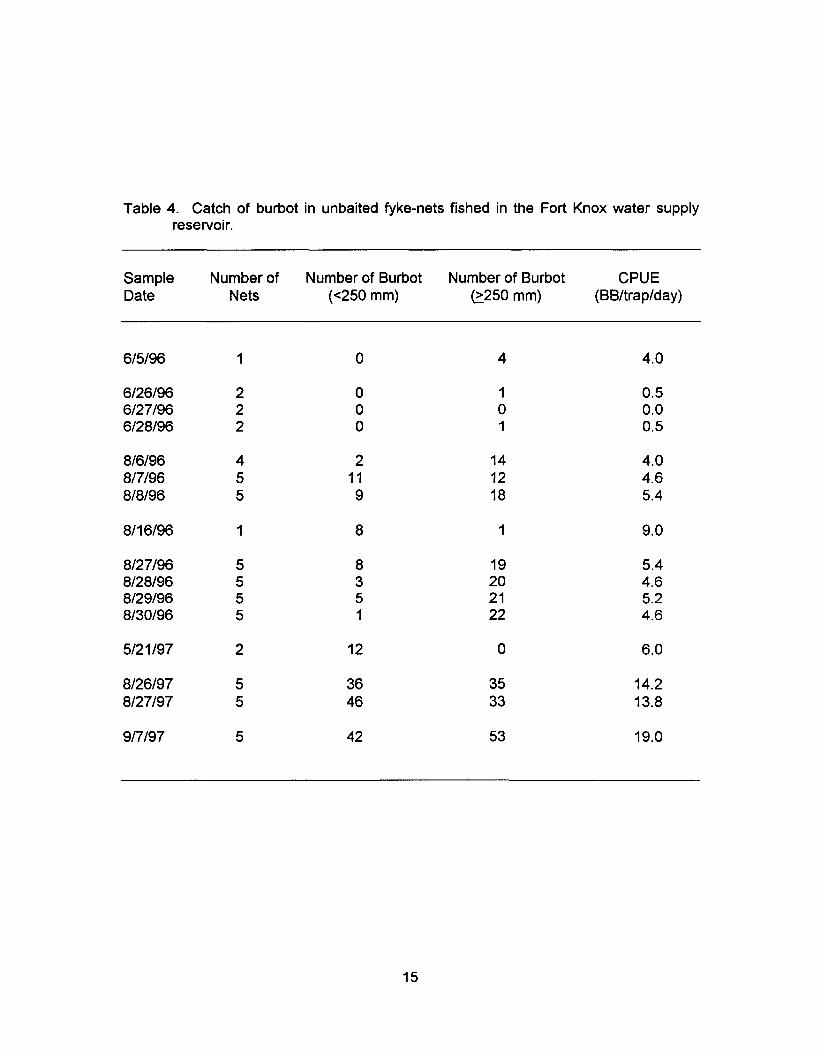
Table 4. Catch of burbot in unbaited fyke-nets fished in the Fort Knox water supply reservoir.
Sample Number of Number of Burbot Number of Burbot CPUE Date Nets ( ~ 2 5 0 mm) (1250 mm) (B Bltra p/d a y)
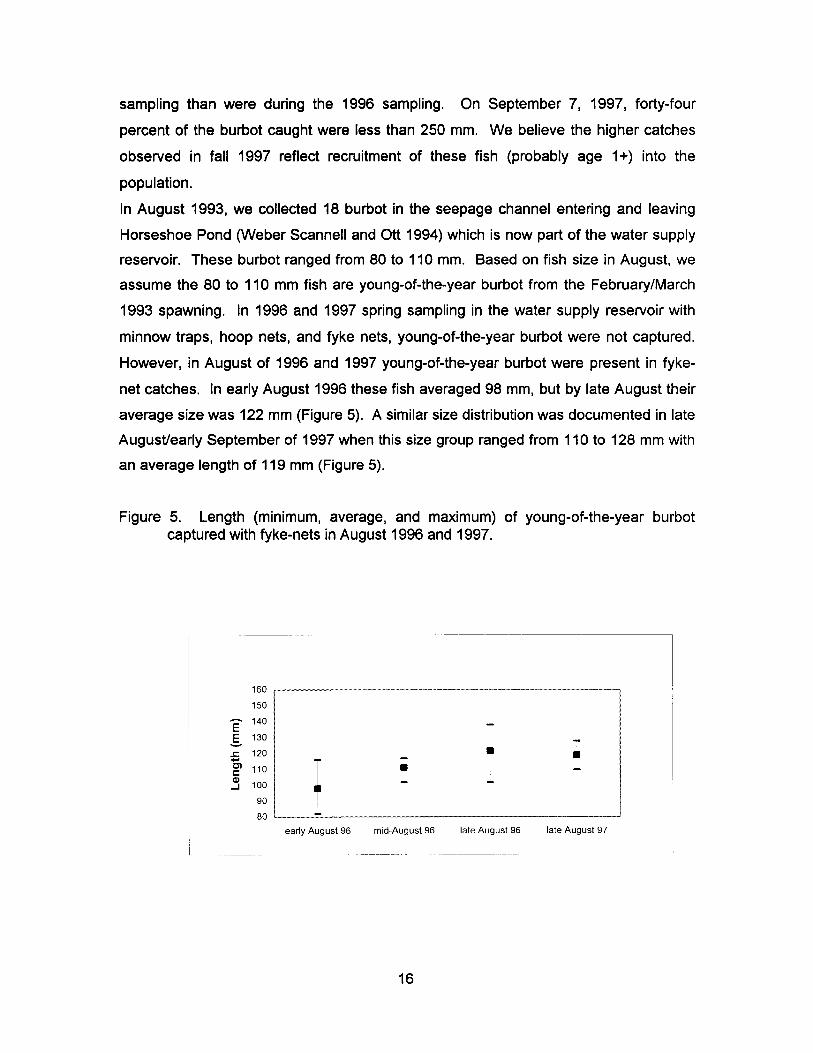
sampling than were during the 1996 sampling. On September 7, 1997, forty-four
percent of the burbot caught were less than 250 mm. We believe the higher catches
observed in fall 1997 reflect recruitment of these fish (probably age I+) into the
population.
In August 1993, we collected 18 burbot in the seepage channel entering and leaving
Horseshoe Pond (Weber Scannell and Ott 1994) which is now part of the water supply
reservoir. These burbot ranged from 80 to 110 mm. Based on fish size in August, we
assume the 80 to 110 mm fish are young-of-the-year burbot from the FebruaryIMarch
1993 spawning. In 1996 and 1997 spring sampling in the water supply reservoir with
minnow traps, hoop nets, and fyke nets, young-of-the-year burbot were not captured.
However, in August of 1996 and 1997 young-of-the-year burbot were present in fyke-
net catches. In early August 1996 these fish averaged 98 mm, but by late August their
average size was 122 mm (Figure 5). A similar size distribution was documented in late
Augustlearly September of 1997 when this size group ranged from 110 to 128 mm with
an average length of 119 mm (Figure 5).
Figure 5. Length (minimum, average, and maximum) of young-of-the-year burbot captured with fyke-nets in August 1996 and 1997.
90 ~ 80 -
early August 96 rnld-August 96 late August 96 late August 97

In late May 1997, we caught 28 small burbot that ranged from 129 to 195 mm (n=28,
average length 162 mm). We assume these are age 1+ fish that averaged 122 mm in
the fall of 1996. This size group of fish caught in late Augustlearly September 1997
averaged 209 mm (n=114, range 172 to 246 mm). Average growth was 47 mm during
summer 1997 (Figure 6). These fish caused the substantial increase in catch per unit
of effort in fall 1997 (Table 4).
Figure 6. Length (minimum, average, and maximum) of age 1+ burbot captured with hoop and minnow traps in late May 1997 and with fyke-nets in late August 1997.
50 1 1 late May late August

Length-frequency distribution for burbot caught in fyke-nets in May 1995 (pre-flooding
of the water supply reservoir), August 1996, and September 1997 is shown in Figure 7.
We believe that spawning success was high in FebruarylMarch 1994 as reflected by
high catches of fish ~ 2 0 0 mm in spring 1995, extremely poor for FebruaryIMarch 1995
as seen by the near total absence of fish between 200 and 250 mm in August of 1996,
and high for 1996 based on an abundance of fish ~ 2 5 0 mm in August 1997.
During the construction phase of the Fort Knox project, flow in Fish Creek was diverted
through the Polar Pond complex beginning in 1993. Flow through the Polar Pond
complex where burbot were first found in 1994 remained unchanged until April 1995
when, at the request of the department, flow was diverted at the tailings dam away from
the Polar Pond complex. Diversion of breakup flows from the Polar Pond complex was
done to reduce the risk of dike failures and potential effects to construction activities at
the water supply dam site. Immediately following breakup in 1995, Fish Creek was
diverted back to flow through the Polar Ponds. Diversion of water from the ponds in
April 1995 may have caused, in part, the lack of spawning success and fry survival.
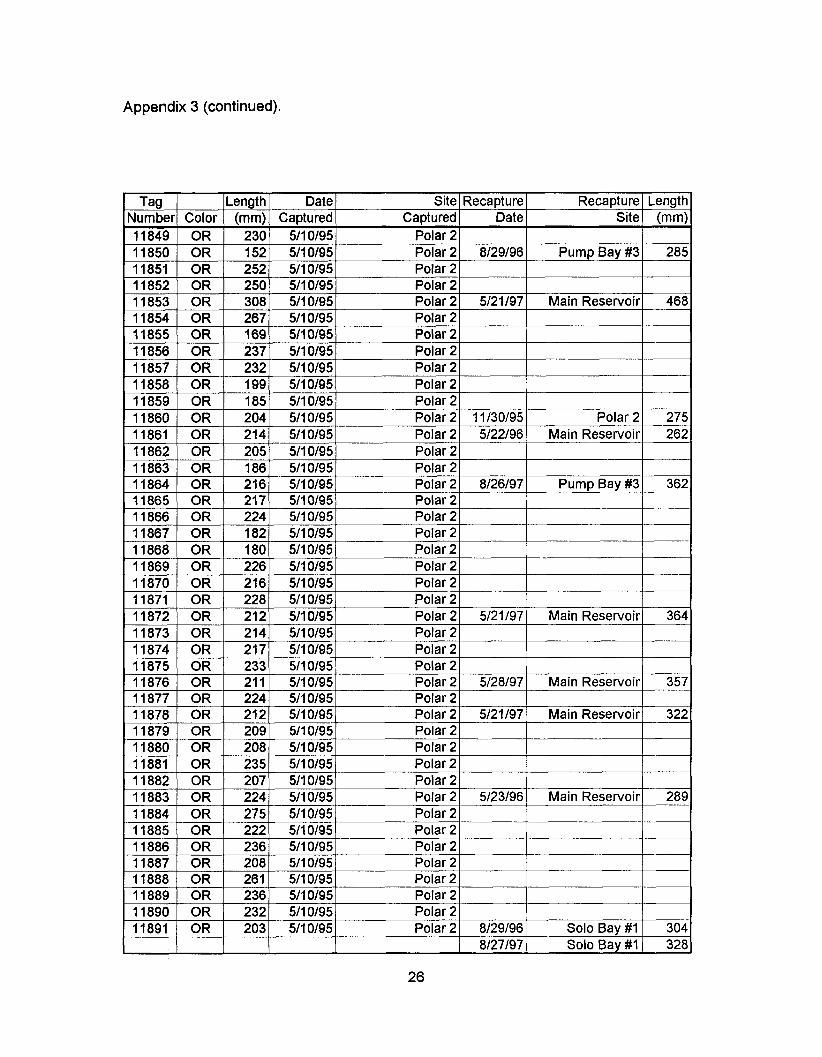
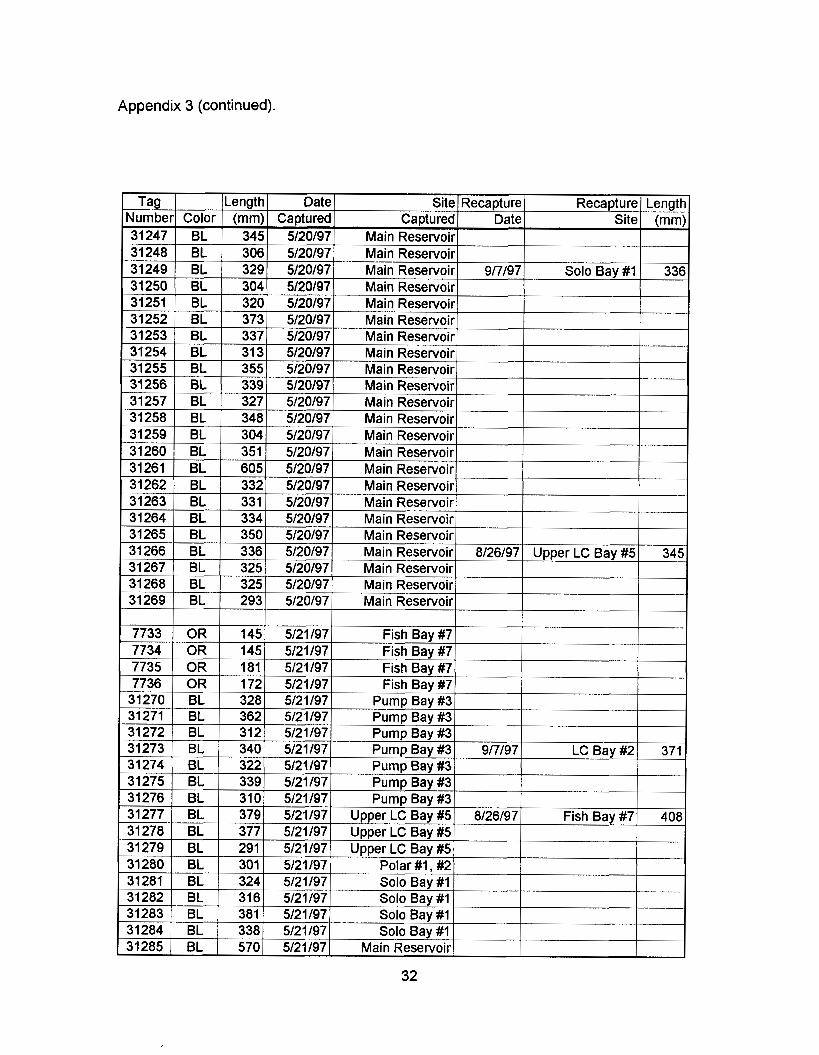
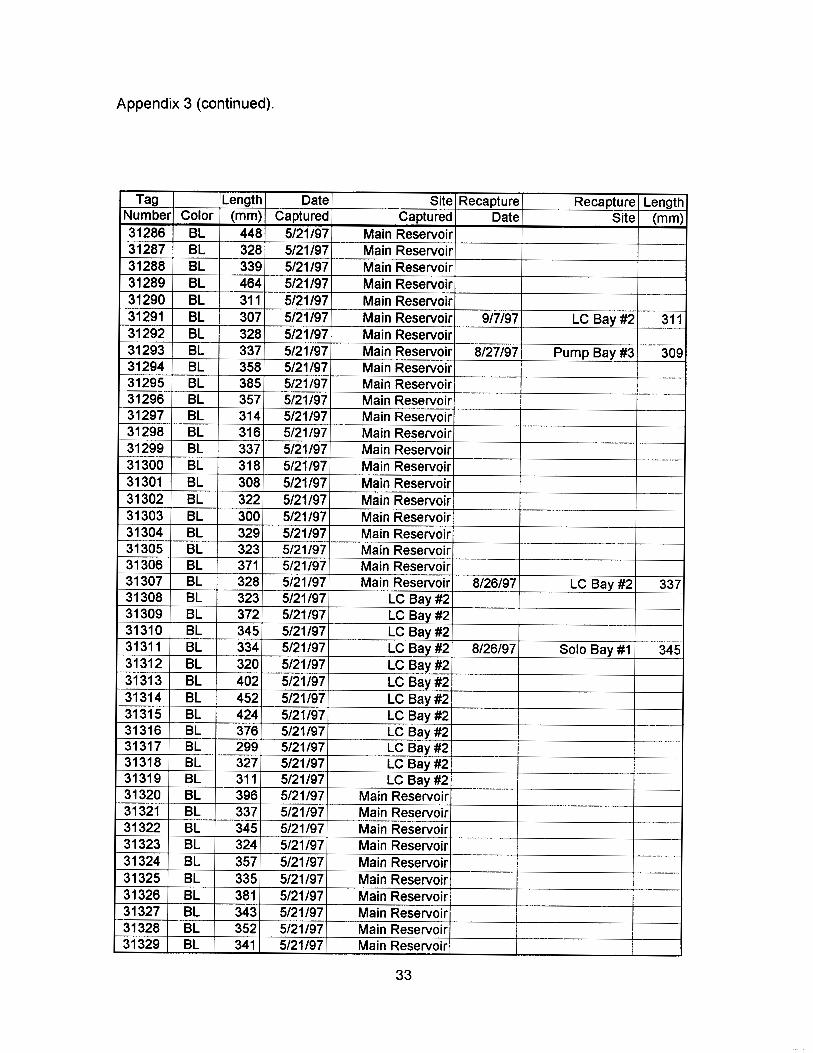
Growth information was collected in 1997 from 21 burbot tagged in May and recaptured
in late Augustlearly September 1997 (Appendix 3). Burbot, when marked, ranged from
299 to 387 mm (average length 341 mm, SD = 23 mm). Burbot growth for summer
1997 ranged from 0 to 45 mm with an average of 18 mm (SD = 13). Average growth
for burbot tagged in May 1995 and recaptured in November 1995 was 30 mm (Ott and
Townsend 1997). Burbot caught in May 1996 had an average growth of 50 mm since
May 1995 (Ott and Townsend 1997).

Figure 7. Length-frequency distribution of burbot caught in the water supply reservoir (1 995-1 997).
Burbot (May 1995, n = 163) 100
0 0 0 0 0 0 0 0 0 0 0 O l n O l n O l n O ~ O l n 7 . - c u c u r n r n v v l n l n
Upper Limit of Size Range (mm)
Burbot (August 1996, n = 99) ~
Upper Limit of Size Range (mm)
Burbot (September 1997, n = 95)
0 0 0 0 0 0 0 0 0 0 0
l n O l n O ~ O l n O l n Z . - N c u r n r n T r T r l n r O
Upper Limit of Size Range (mm)

Literature Cited
Chapman, D.G. 1951. Some practices of the hypergeometric distribution with applications to zoological censuses. University of California Publications in Statistics 1 : 131 -60.
Clark, R.A. 1995. Stock status and rehabilitation of Chena River Arctic grayling during 1994. Alaska Department of Fish and Game, Division of Sport Fish. Fisheries Data Series No. 95-8. Federal Aid in Sport Fish Restoration Act, Project F-10- 10, Job No. 3-2(a). 64 pp.
Holmes, R. 1985. Population structure and dynamics of the Arctic grayling with emphasis on heavily fished stocks. Annual Performance Report. Alaska Department of Fish and Game. Federal Aid in Fish Restoration Act. Vol. 26. Proj. F-9-17, Study R-I, Job R-I-A. 59-102.
Hughes, N. 1986. Fish and aquatic habitat of Badger Slough, Chena River, Alaska. Unit Contribution Number 22, Alaska Cooperative Fishery Research Unit, University of Alaska, Fairbanks, Alaska, USA. 26 pp.
Ott, A.G. and A.H. Townsend. 1997. Fisheries use of the Fort Knox water supply reservoir 1996. Alaska Department of Fish and Game Tech. Rept. 97-2. Habitat and Restoration Division. Juneau. 69 pp.
Ott, A.G., P. Weber Scannell, and A.H. Townsend. 1995. Aquatic habitat and fisheries studies upper Fish Creek, 1992-1995. Alaska Department of Fish and Game Tech. Rept. 95-4. Habitat and Restoration Division. Juneau. 61 pp.
Ott, A.G. and P. Weber Scannell. 1996. Baseline fish and aquatic habitat data for Fort Knox mine 1992 to 1995. Alaska Department of Fish and Game Tech. Rept. 96-5. Habitat and Restoration Division. Juneau. 165 pp.
Weber Scannell, P. and A.G. Ott. 1993. Aquatic habitat study, upper Fish Creek drainage, with an emphasis on Arctic grayling (Thymallus arcticus): baseline studies 1992. Alaska Department of Fish and Game Tech. Rept. 93-4. Habitat and Restoration Division. Juneau. 76 pp.
Weber Scannell, P. and A.G. Ott. 1994. Aquatic habitat of Fish Creek before development of the Fort Knox gold mine 1992-1993. Alaska Department of Fish and Game Tech. Rept. 94-5. Habitat and Restoration Division. Juneau. 79 pp.
Wuttig, K.G. 1997. Successional changes in hydrology, water quality, primary production, and growth of juvenile Arctic grayling of blocked Tanana River sloughs, Alaska. M.S. Thesis. University of Alaska Fairbanks. 105 pp.
Appendix 1 - Water Quality Water Supply Reservoir

Appendix I (concluded).

Appendix 2 - Growth of Tagged Arctic Grayling (1997)

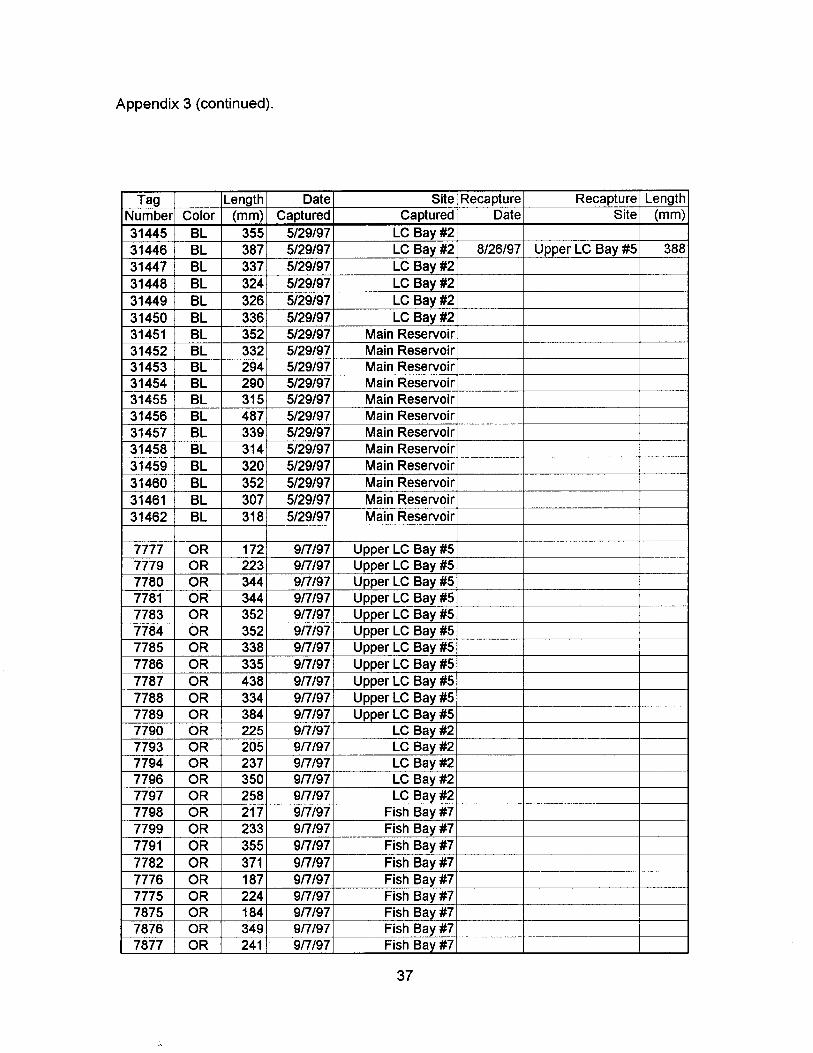
Appendix 3 - Growth of Tagged Burbot (1995 - 1997)

Appendix 3 (continued).
Appendix 3 (continued).
11891 Polar 2 1 8/29/96 1 8/27/97
OR Solo Bay #1 Solo Bay #1
2031 5110195 304 328

Appendix 3 (continued).
6689 1 OR 1 1541 51181951 Polar 1 / 6690 / OR 1 2171 51181951 Polar 1 I

Appendix 3 (continued).

Appendix 3 (continued).
6657 6658
OR OR
215 21 1
5/18/95 5/18/95
Polar 2 Polar 2 9/7/97 Upper LC Bay #5 350

Appendix 3 (continued).

Appendix 3 (continued).
31245 1 BL 31246 1 BL
Main Reservoir Main Reservoir
315 322
5120197 5120197
Appendix 3 (continued).
Appendix 3 (continued).

Appendix 3 (continued).

Appendix 3 (continued).
Main Reservoir Main Reservoir
31404 31405
BL BL
331 297
5/28/97 5/28/97

Appendix 3 (continued).
Appendix 3 (continued).

Appendix 3 (continued).
1 7824 1 OR 1 2051 9/7/97] Pump Bay #3 1

Appendix 3 (concluded).