technical report #6 extended norms...2,200 cases in the wisc–v normative sample, only 16 children...
TRANSCRIPT

1 Copyright © 2019 NCS Pearson, Inc. All rights reserved. Normative copyright © 2014 NCS Pearson, Inc.
Technical Report #6
Extended Norms November, 2019
Susan Engi Raiford, PhD1, Troy Courville, PhD2; Daniel Peters, PhD3, Barbara J. Gilman, MS4, and Linda Silverman, PhD4
1 Pearson Clinical Assessment 2 Georgia Tech Professional Education 3 Summit Center 4 Gifted Development Center
Overview This technical report provides information about the derivation and use of new extended norms for several subtest and composite scores for the Wechsler Intelligence Scale for Children (5th ed.; WISC–V; Wechsler, 2014). These norms were developed in response to requests from the National Association for Gifted Children (NAGC). They are designed to be used to more clearly identify highly gifted children with composite scores far above 130. The extended norms are useful when a child’s scaled score on one or more subtests is at the maximum value (i.e., 19 points). These extended norms raise the upper end of the score range for the subtests to a maximum value of 28 points and for composite scores to 210 points.
Background The WISC–V subtests each have a range of total raw scores that translate to a scaled score of 19 at the varying age bands. This range differs by subtest and by age. Not all subtests have extensive room for extension in this range, especially at older ages, and extending the scaled score range to 28 is not always possible. Therefore, the potential clinical utility is greatest for younger children, and the upper limit of the extended norms’ scaled scores differ by subtest and by age.
Similar extended norms were published for the Wechsler Intelligence Scale for Children (4th ed.; WISC–IV; Wechsler, 2003) several years after publication (Zhu, Cayton, Weiss, & Gabel, 2008). Many practitioners have inquired about the delay between the initial publication and the extended norms release. This delay is related to the need to collect appropriate validity data to validate extended norms. Specifically, the validity study requires WISC–V scores from a large sample of younger children whose performance, on multiple subtests, exceeds the minimum total raw score needed to obtain a scaled score of 19. As the norms must be available before these difficult-to-find cases can be located, the endeavor can take many years after the initial publication. The authors wish to thank and acknowledge the many clinicians who contributed cases to this sample.
2 Copyright © 2019 NCS Pearson, Inc. All rights reserved. Normative copyright © 2014 NCS Pearson, Inc.
It is important to note that the extended norms are not useful for most children. Among the 2,200 cases in the WISC–V normative sample, only 16 children obtained any composite score of 150 or higher. According to the bell curve, out of 20,000,000 same-age peers, only one child would be expected to obtain an FSIQ of 180 or higher.
Supporting Information Standardization and Norms Development The extended norms were developed using the WISC–V normative sample and the normative information procedures described in chapter 3 of the WISC–V Technical and Interpretive Manual, and a highly gifted sample provided by psychologists from the NAGC. NAGC experts confirmed that scores from these cases were as expected. The extended norms are based on the same metrics used in all Wechsler intelligence scales and are consistent with the normal curve.
Highly Gifted Special Group Study The NAGC sample contained 108 usable cases with a mean age of 9.6 years with a standard deviation of 2.2 years and an age range of 6–16 years. The sample consisted of 71% males and 29% females. Table 1 reports the mean subtest and composite scores of the sample. Table 1 shows that mean composite scores based on the extended norms average about 1 to 2 points higher than the corresponding means based on the regular norms. The maximum score and variance for each composite score increased. As expected, the composite scores with the highest g-loadings (e.g., VCI, FRI, FSIQ, VECI, EFI, GAI, and EGAI), show the largest maximum score increases.
About 43% of children in the highly gifted sample showed increased FSIQ scores when the extended norms were used. These results indicate that the WISC–V extended norms improved differentiation among the highly gifted children.

3 Copyright © 2019 NCS Pearson, Inc. All rights reserved. Normative copyright © 2014 NCS Pearson, Inc.
Table 1. Mean Performance of Highly Intellectually Gifted Group (National Association for Gifted Children) Subtest/Composite Score Mean SD n Minimum Maximum Similarities Extended 18.1 2.8 108 10 26 Vocabulary Extended 16.9 2.0 108 12 22 Information Extended 17.3 2.6 99 12 25 Comprehension Extended 18.1 3.4 94 11 25 Block Design Extended 14.4 3.0 108 8 22 Visual Puzzles Extended 14.6 2.3 108 9 22 Matrix Reasoning Extended 15.0 3.7 108 6 26 Figure Weights Extended 15.2 2.5 108 5 20 Picture Concepts Extended 13.6 2.9 74 6 20 Arithmetic Extended 15.1 3.1 72 8 22 Digit Span Extended 14.4 3.7 108 4 26 Picture Span Extended 13.7 3.2 108 4 20 Letter-Number Sequencing Extended 14.0 2.4 52 7 20 Coding Extended 12.0 3.2 108 1 20 Symbol Search Extended 12.5 3.4 108 1 21 Cancellation Extended 10.1 3.2 59 2 17
Verbal Comprehension Index 140.7 10.2 108 116 155 Verbal Comprehension Index Extended 143.5 13.1 108 116 180 Visual Spatial Index 125.7 13.1 108 97 155 Visual Spatial Index Extended 126.1 13.9 108 97 164 Fluid Reasoning Index 128.6 12.9 108 85 155 Fluid Reasoning Index Extended 129.7 15.2 108 85 171 Working Memory Index 121.9 15.1 108 74 155 Working Memory Index Extended 122.6 16.3 108 74 162 Processing Speed Index 112.7 16.3 108 66 144 Processing Speed Index Extended 112.9 16.6 108 66 148 Full Scale IQ 134.9 10.4 108 102 156 Full Scale IQ Extended 136.3 11.5 108 102 162
Verbal (Expanded Crystallized) Index 141.9 8.3 94 118 155 Verbal (Expanded Crystallized) Index Extended 145.8 12.3 94 118 177 Expanded Fluid Index 131.3 13.6 67 84 155 Expanded Fluid Index Extended 132.1 14.7 67 84 167 Quantitative Reasoning Index 129.7 15.1 72 80 155 Quantitative Reasoning Index Extended 130.0 15.6 72 80 158 Auditory Working Memory Index 123.9 14.2 52 84 151 Auditory Working Memory Index Extended 124.4 15.0 52 84 155 Nonverbal Index 129.9 13.6 108 92 157 Nonverbal Index Extended 130.6 14.3 108 92 160 General Ability Index 136.7 9.6 108 112 157 General Ability Index Extended 138.3 11.0 108 112 168 Expanded General Ability Index 138.1 7.7 70 121 155 Expanded General Ability Index Extended 140.5 10.1 70 121 166 Cognitive Proficiency Index 121.2 15.0 108 75 151 Cognitive Proficiency Index Extended 121.7 15.7 108 75 157

4 Copyright © 2019 NCS Pearson, Inc. All rights reserved. Normative copyright © 2014 NCS Pearson, Inc.
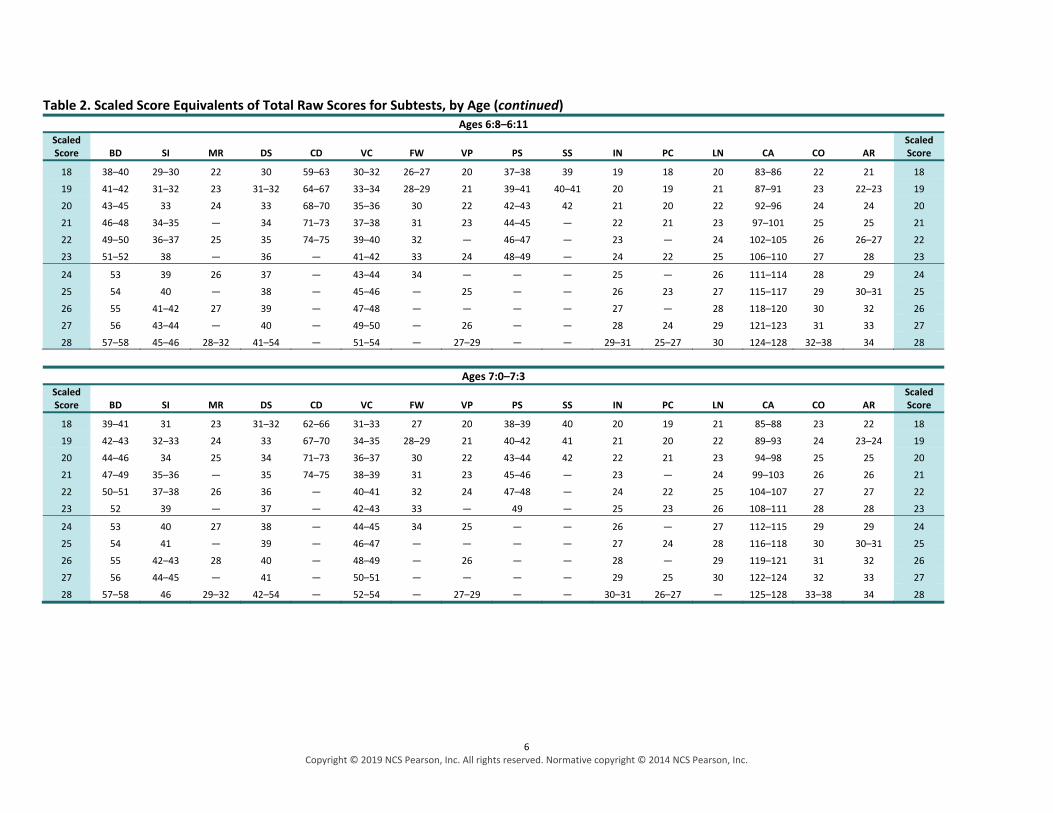
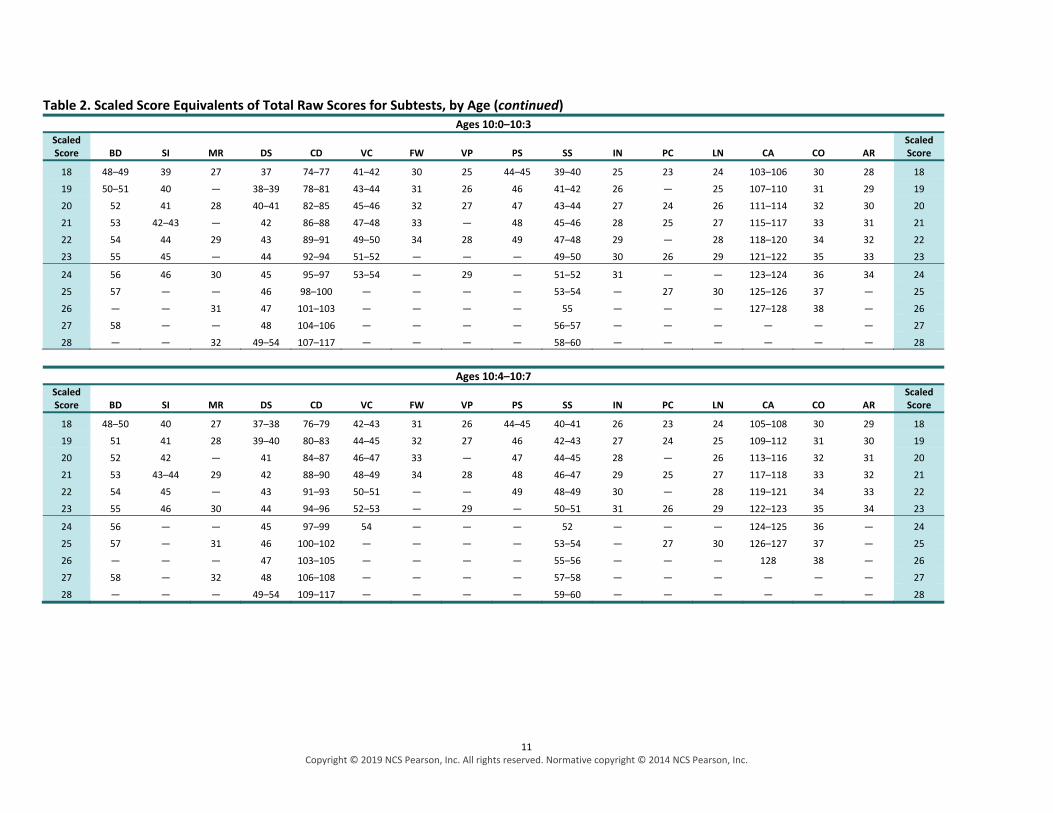
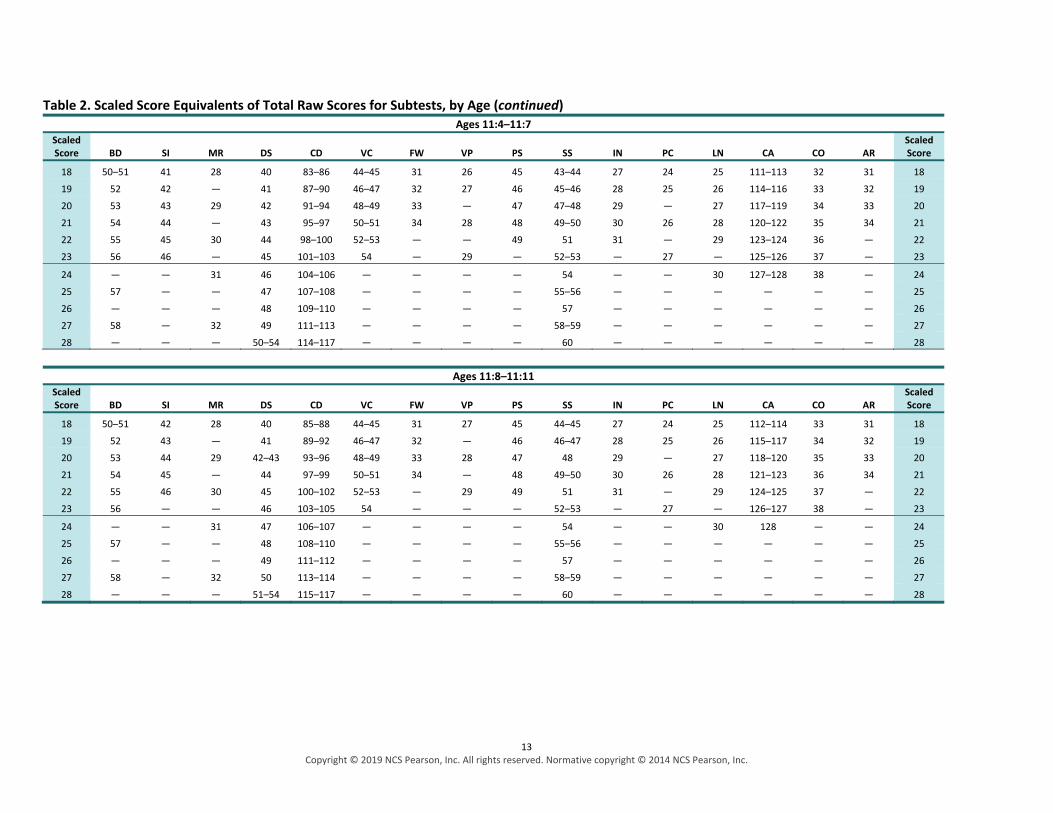
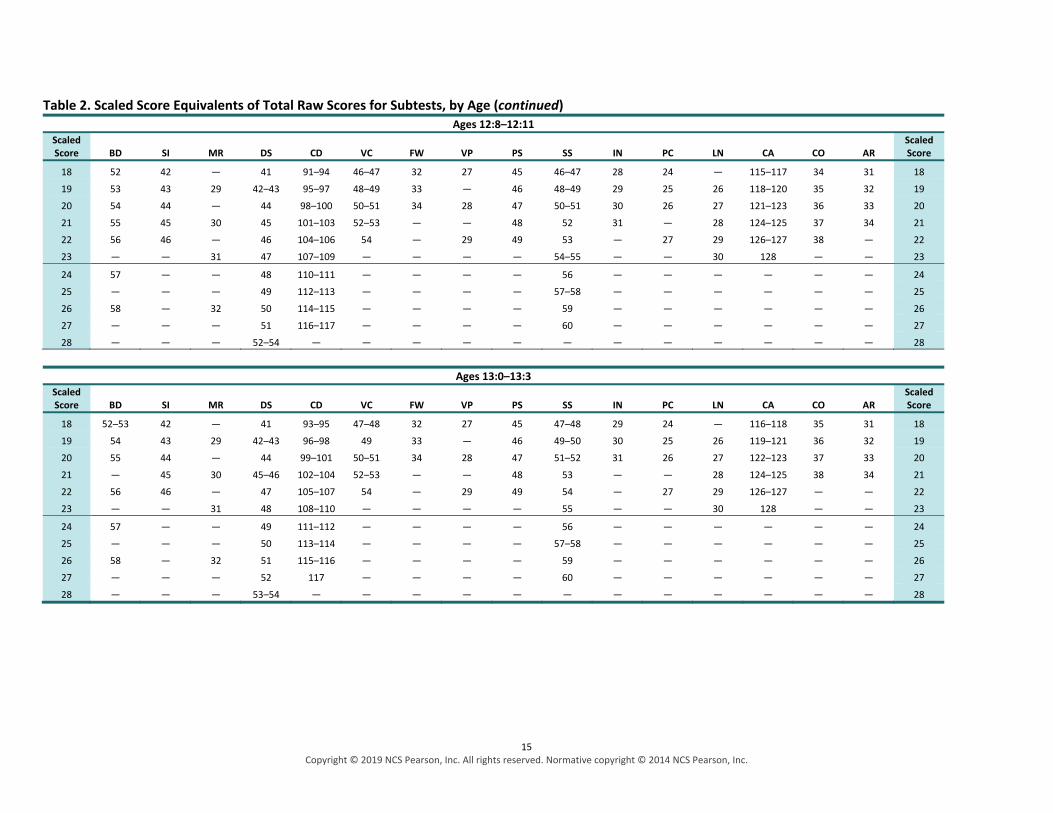
Deriving the Extended Subtest Scaled Scores Extended subtest scaled scores are derived in the same manner as the published subtest scaled scores. Locate the section of Table 2 that corresponds to the child’s test age. For each subtest, locate the child’s total raw score in the column corresponding to that subtest, and then read across the row to the far left or right column to obtain the extended scaled score.
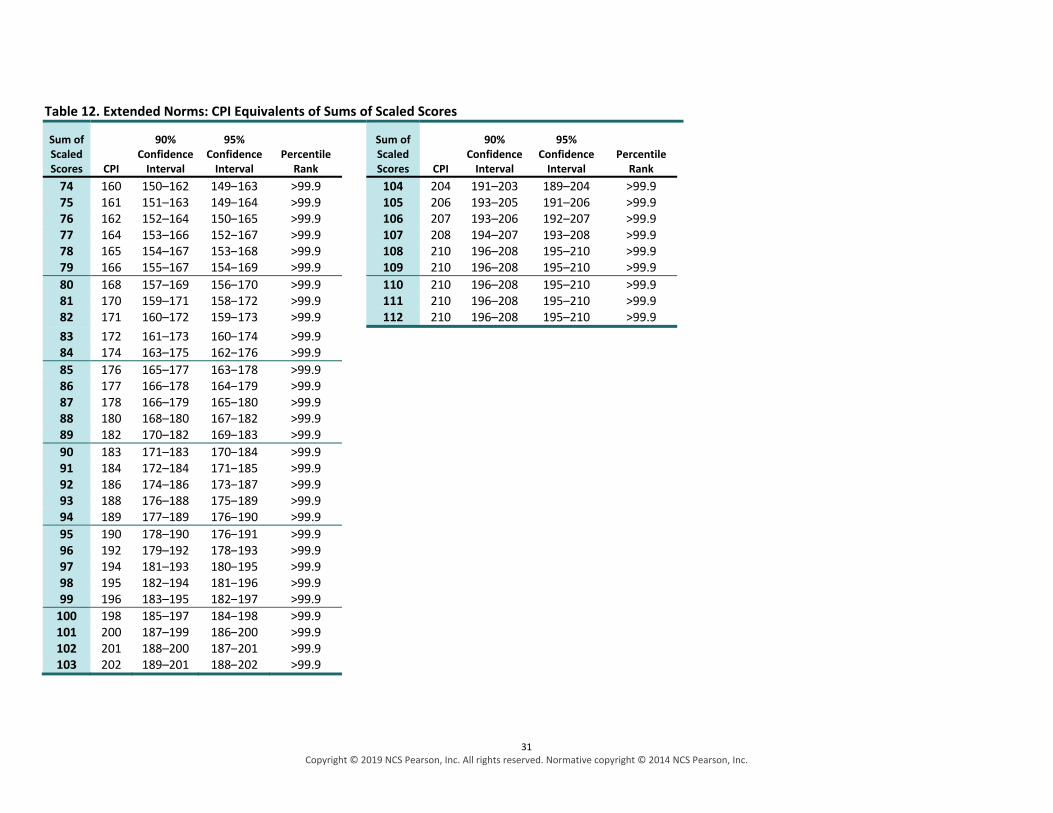
Deriving the Extended Composite Scores Extended composite scores are derived in the same manner as the published composite scores. Sum the scaled scores for the subtests that contribute to that composite score. Tables 3–12 present the extended composite score equivalents of the sums of scaled scores. Each table also includes percentile ranks and confidence intervals.

5 Copyright © 2019 NCS Pearson, Inc. All rights reserved. Normative copyright © 2014 NCS Pearson, Inc.
Table 2. Scaled Score Equivalents of Total Raw Scores for Subtests, by Age Ages 6:0–6:3
Scaled Score BD SI MR DS CD VC FW VP PS SS IN PC LN CA CO AR
Scaled Score
18 36–38 27–28 20 27–28 51–55 28–30 25–26 18 35–36 36–37 18 17 19 80–83 20–21 19 18 19 39–41 29–30 21 29 56–59 31–32 27 19 37–39 38–39 19 18 20 84–88 22 20–21 19 20 42–44 31–32 22 30–31 60–63 33–34 28–29 20 40–41 40 20 19 21 89–93 23 22 20 21 45–46 33–34 — 32 64–67 35–36 30 21 42–43 41 21 — 22 94–98 24 23 21 22 47–48 35–36 23 33 68–70 37–38 31 22 44–45 42 22 20 23 99–102 25 24 22 23 49–50 37 — 34 71–73 39–40 32 — 46–47 — 23 21 24 103–107 26 25–26 23
24 51–52 38 24 35 74–75 41–42 33 23 48–49 — 24 — 25 108–111 27 27 24 25 53 39 — 36 — 43–44 34 — — — 25 22 26 112–115 28 28–29 25 26 54 40–41 25 37 — 45–46 — 24 — — 26 — 27 116–118 29 30 26 27 55 42–43 — 38 — 47–48 — — — — 27 23 28 119–121 30 31–32 27 28 56–58 44–46 26–32 39–54 — 49–54 — 25–29 — — 28–31 24–27 29–30 122–128 31–38 33–34 28
Ages 6:4–6:7 Scaled Score BD SI MR DS CD VC FW VP PS SS IN PC LN CA CO AR
Scaled Score
18 37–39 28–29 21 28–29 55–59 29–31 25–26 19 36–37 37–38 19 18 20 81–84 21 20 18 19 40–42 30–31 22 30–31 60–63 32–33 27–28 20 38–40 39–40 20 19 21 85–89 22 21–22 19 20 43–45 32–33 23 32 64–67 34–35 29–30 21 41–42 41 21 20 22 90–94 23 23 20 21 46–47 34–35 — 33 68–70 36–37 31 22 43–44 42 22 — 23 95–99 24 24 21 22 48–49 36–37 24 34 71–73 38–39 32 23 45–46 — 23 21 24 100–104 25 25–26 22 23 50–51 38 — 35 74–75 40–41 33 — 47–48 — 24 22 25 105–108 26 27 23
24 52–53 39 25 36 — 42–43 34 24 49 — 25 — 26 109–112 27 28 24 25 54 40 — 37 — 44–45 — — — — 26 23 27 113–116 28 29–30 25 26 55 41–42 26 38 — 46–47 — 25 — — 27 — 28 117–119 29 31 26 27 56 43–44 — 39 — 48–49 — — — — 28 24 29 120–122 30 32–33 27 28 57–58 45–46 27–32 40–54 — 50–54 — 26–29 — — 29–31 25–27 30 123–128 31–38 34 28
6 Copyright © 2019 NCS Pearson, Inc. All rights reserved. Normative copyright © 2014 NCS Pearson, Inc.
Table 2. Scaled Score Equivalents of Total Raw Scores for Subtests, by Age (continued) Ages 6:8–6:11
Scaled Score BD SI MR DS CD VC FW VP PS SS IN PC LN CA CO AR
Scaled Score
18 38–40 29–30 22 30 59–63 30–32 26–27 20 37–38 39 19 18 20 83–86 22 21 18 19 41–42 31–32 23 31–32 64–67 33–34 28–29 21 39–41 40–41 20 19 21 87–91 23 22–23 19 20 43–45 33 24 33 68–70 35–36 30 22 42–43 42 21 20 22 92–96 24 24 20 21 46–48 34–35 — 34 71–73 37–38 31 23 44–45 — 22 21 23 97–101 25 25 21 22 49–50 36–37 25 35 74–75 39–40 32 — 46–47 — 23 — 24 102–105 26 26–27 22 23 51–52 38 — 36 — 41–42 33 24 48–49 — 24 22 25 106–110 27 28 23
24 53 39 26 37 — 43–44 34 — — — 25 — 26 111–114 28 29 24 25 54 40 — 38 — 45–46 — 25 — — 26 23 27 115–117 29 30–31 25 26 55 41–42 27 39 — 47–48 — — — — 27 — 28 118–120 30 32 26 27 56 43–44 — 40 — 49–50 — 26 — — 28 24 29 121–123 31 33 27 28 57–58 45–46 28–32 41–54 — 51–54 — 27–29 — — 29–31 25–27 30 124–128 32–38 34 28
Ages 7:0–7:3 Scaled Score BD SI MR DS CD VC FW VP PS SS IN PC LN CA CO AR
Scaled Score
18 39–41 31 23 31–32 62–66 31–33 27 20 38–39 40 20 19 21 85–88 23 22 18 19 42–43 32–33 24 33 67–70 34–35 28–29 21 40–42 41 21 20 22 89–93 24 23–24 19 20 44–46 34 25 34 71–73 36–37 30 22 43–44 42 22 21 23 94–98 25 25 20 21 47–49 35–36 — 35 74–75 38–39 31 23 45–46 — 23 — 24 99–103 26 26 21 22 50–51 37–38 26 36 — 40–41 32 24 47–48 — 24 22 25 104–107 27 27 22 23 52 39 — 37 — 42–43 33 — 49 — 25 23 26 108–111 28 28 23
24 53 40 27 38 — 44–45 34 25 — — 26 — 27 112–115 29 29 24 25 54 41 — 39 — 46–47 — — — — 27 24 28 116–118 30 30–31 25 26 55 42–43 28 40 — 48–49 — 26 — — 28 — 29 119–121 31 32 26 27 56 44–45 — 41 — 50–51 — — — — 29 25 30 122–124 32 33 27 28 57–58 46 29–32 42–54 — 52–54 — 27–29 — — 30–31 26–27 — 125–128 33–38 34 28

7 Copyright © 2019 NCS Pearson, Inc. All rights reserved. Normative copyright © 2014 NCS Pearson, Inc.
Table 2. Scaled Score Equivalents of Total Raw Scores for Subtests, by Age (continued) Ages 7:4–7:7
Scaled Score BD SI MR DS CD VC FW VP PS SS IN PC LN CA CO AR
Scaled Score
18 40–42 32–33 24 32–33 65–69 32–34 27–28 21 39–40 41 21 19 21 87–89 23–24 23 18 19 43–44 34 25 34 70–72 35–36 29 22 41–43 42 22 20 22 90–95 25 24–25 19 20 45–47 35 — 35 73–74 37–38 30 23 44–45 — 23 21 23 96–100 26 26 20 21 48–49 36–37 26 36 75 39–40 31 24 46–47 — 24 — 24 101–105 27 27 21 22 50–51 38–39 — 37 — 41–42 32 25 48 — 25 22 25 106–109 28 28 22 23 52–53 40 27 38 — 43–44 33 — 49 — 26 23 26 110–113 29 29 23
24 54 41 — 39 — 45–46 34 26 — — 27 — 27 114–116 30 30 24 25 55 42 28 40 — 47–48 — — — — 28 24 28 117–119 31 31 25 26 56 43–44 — 41 — 49–50 — 27 — — 29 — 29 120–122 32 32 26 27 57 45 29 42 — 51–52 — — — — 30 25 30 123–125 33 33 27 28 58 46 30–32 43–54 — 53–54 — 28–29 — — 31 26–27 — 126–128 34–38 34 28
Ages 7:8–7:11 Scaled Score BD SI MR DS CD VC FW VP PS SS IN PC LN CA CO AR
Scaled Score
18 42–43 32–33 24 33–34 68–71 33–35 27–28 22 40–41 — 21 19 22 89–92 24 24 18 19 44–45 34 25 35 72–74 36–37 29 23 42–43 42 22 20 23 93–97 25 25–26 19 20 46–48 35–36 26 36 75 38–39 30–31 24 44–45 — 23 21 24 98–102 26 27 20 21 49–50 37–38 — 37 — 40–41 32 25 46–47 — 24 — 25 103–107 27 28 21 22 51–52 39–40 27 38 — 42–43 33 26 48 — 25 22 26 108–111 28 29 22 23 53 41 — 39 — 44–45 34 — 49 — 26 23 27 112–114 29 30 23
24 54 42 28 40 — 46–47 — 27 — — 27 — — 115–117 30 31 24 25 55 43 — 41 — 48–49 — — — — 28 24 28 118–120 31 32 25 26 56 44 29 42 — 50–51 — 28 — — 29 — 29 121–123 32 33 26 27 57 45 — 43 — 52–54 — — — — 30 25 30 124–126 33 34 27 28 58 46 30–32 44–54 — — — 29 — — 31 26–27 — 127–128 34–38 — 28

8 Copyright © 2019 NCS Pearson, Inc. All rights reserved. Normative copyright © 2014 NCS Pearson, Inc.
Table 2. Scaled Score Equivalents of Total Raw Scores for Subtests, by Age (continued) Ages 8:0–8:3
Scaled Score BD SI MR DS CD VC FW VP PS SS IN PC LN CA CO AR
Scaled Score
18 43–44 33 25 33–34 56–59 34–36 28 23 40–42 33–34 22 20 22 91–94 25 25 18 19 45–46 34 26 35 60–63 37–38 29–30 24 43–44 35–36 23 21 23 95–99 26 26 19 20 47–48 35–36 — 36 64–67 39–40 31 25 45–46 37–38 24 22 24 100–104 27 27 20 21 49–50 37–38 27 37 68–70 41–42 32 26 47–48 39–40 25 — 25 105–109 28 28 21 22 51–52 39–40 — 38 71–74 43–44 33 — 49 41–42 26 23 26 110–113 29 29 22 23 53 41 28 39 75–77 45–46 34 27 — 43–44 27 24 27 114–116 30 30 23
24 54 42 — 40 78–80 47–48 — — — 45–46 28 — 28 117–118 31 31 24 25 55 43 29 41 81–83 49–50 — 28 — 47–48 29 25 29 119–121 32 32 25 26 56 44 — 42 84–86 51–52 — — — 49–50 30 — 30 122–124 33 33 26 27 57 45 30 43 87–89 53–54 — 29 — 51–52 31 26 — 125–126 34 34 27 28 58 46 31–32 44–54 90–117 — — — — 53–60 — 27 — 127–128 35–38 — 28
Ages 8:4–8:7 Scaled Score BD SI MR DS CD VC FW VP PS SS IN PC LN CA CO AR
Scaled Score
18 44–45 34 25 34–35 59–62 35–37 28–29 24 41–42 34–35 22 21 22 93–96 26 26 18 19 46–47 35–36 26 36 63–66 38–39 30 25 43–45 36–37 23 22 23 97–101 27 27 19 20 48–49 37–38 27 37 67–70 40–41 31 26 46–47 38–39 24 — 24 102–106 28 28 20 21 50–51 39–40 — 38 71–74 42–43 32 — 48 40–41 25 23 25 107–110 29 29 21 22 52 41 28 39 75–77 44–45 33 27 49 42–43 26 24 26 111–114 30 30 22 23 53 42 — 40 78–80 46–47 34 — — 44–45 27 — 27 115–117 31 31 23
24 54 43 29 41 81–83 48–49 — 28 — 46–47 28 25 28 118–119 32 32 24 25 55 44 — 42 84–86 50–51 — — — 48–49 29 — 29 120–122 33 33 25 26 56 45 30 43 87–89 52–53 — 29 — 50–51 30 26 30 123–125 34 34 26 27 57 46 — 44 90–92 54 — — — 52–53 31 — — 126–127 35 — 27 28 58 — 31–32 45–54 93–117 — — — — 54–60 — 27 — 128 36–38 — 28

9 Copyright © 2019 NCS Pearson, Inc. All rights reserved. Normative copyright © 2014 NCS Pearson, Inc.
Table 2. Scaled Score Equivalents of Total Raw Scores for Subtests, by Age (continued) Ages 8:8–8:11
Scaled Score BD SI MR DS CD VC FW VP PS SS IN PC LN CA CO AR
Scaled Score
18 45–46 35–36 26 34–35 62–65 37–38 29 24 42–43 35–36 23 21 23 95–98 27 27 18 19 47–48 37 — 36–37 66–70 39–40 30 25 44–45 37–38 24 22 24 99–103 28 28 19 20 49–50 38 27 38 71–74 41–42 31 26 46–47 39–40 25 23 25 104–108 29 29 20 21 51 39–40 — 39 75–77 43–44 32 27 48 41–42 26 — 26 109–112 30 30 21 22 52 41–42 28 40 78–80 45–46 33 — 49 43–44 27 24 27 113–115 31 31 22 23 53 43 — 41 81–83 47–48 34 28 — 45–46 28 — — 116–118 32 32 23
24 54 44 29 42 84–86 49–50 — — — 47–48 29 25 28 119–120 33 33 24 25 55 45 — 43 87–89 51–52 — 29 — 49–50 30 — 29 121–123 34 34 25 26 56 46 30 44 90–92 53–54 — — — 51–52 31 26 30 124–125 35 — 26 27 57 — — 45 93–95 — — — — 53–54 — — — 126–127 36 — 27 28 58 — 31–32 46–54 96–117 — — — — 55–60 — 27 — 128 37–38 — 28
Ages 9:0–9:3 Scaled Score BD SI MR DS CD VC FW VP PS SS IN PC LN CA CO AR
Scaled Score
18 46–47 36 26 35–36 65–69 38–39 29 24 42–43 36–37 24 21 23 97–100 27–28 27 18 19 48–49 37 27 37 70–73 40–41 30 25 44–45 38–39 25 22 24 101–104 29 28 19 20 50 38 — 38 74–77 42–43 31 26 46–47 40–41 26 23 25 105–109 30 29 20 21 51 39–40 28 39 78–80 44–45 32 27 48 42–43 27 24 26 110–113 31 30 21 22 52 41–42 — 40 81–83 46–47 33 — 49 44–45 28 — 27 114–116 32 31 22 23 53 43 29 41 84–86 48–49 34 28 — 46–47 29 25 — 117–119 33 32 23
24 54 44 — 42 87–89 50–51 — — — 48–49 30 — 28 120–121 34 33 24 25 55 45 30 43 90–92 52–53 — 29 — 50–51 31 26 29 122–123 35 34 25 26 56 46 — 44 93–95 54 — — — 52–53 — — 30 124–126 36 — 26 27 57 — 31 45 96–98 — — — — 54–55 — 27 — 127–128 37 — 27 28 58 — 32 46–54 99–117 — — — — 56–60 — — — — 38 — 28

10 Copyright © 2019 NCS Pearson, Inc. All rights reserved. Normative copyright © 2014 NCS Pearson, Inc.
Table 2. Scaled Score Equivalents of Total Raw Scores for Subtests, by Age (continued) Ages 9:4–9:7
Scaled Score BD SI MR DS CD VC FW VP PS SS IN PC LN CA CO AR
Scaled Score
18 46–47 37 — 35–36 68–72 39–40 29 25 43–44 37–38 24 22 23 99–102 28 28 18 19 48–49 38 27 37–38 73–76 41–42 30 26 45–46 39–40 25 23 24 103–106 29 29 19 20 50–51 39 28 39 77–80 43–44 31 27 47 41–42 26 — 25 107–110 30 30 20 21 52 40–41 — 40 81–83 45–46 32 — 48 43–44 27 24 26 111–114 31 31 21 22 53 42–43 29 41 84–86 47–48 33 28 49 45–46 28 — 27 115–117 32 32 22 23 54 44 — 42 87–89 49–50 34 — — 47–48 29 25 28 118–120 33 33 23
24 55 45 30 43 90–92 51–52 — 29 — 49–50 30 — 29 121–122 34 34 24 25 56 46 — 44 93–95 53–54 — — — 51–52 31 26 30 123–124 35 — 25 26 57 — 31 45 96–98 — — — — 53–54 — — — 125–126 36 — 26 27 58 — — 46 99–101 — — — — 55–56 — 27 — 127–128 37 — 27 28 — — 32 47–54 102–117 — — — — 57–60 — — — — 38 — 28
Ages 9:8–9:11 Scaled Score BD SI MR DS CD VC FW VP PS SS IN PC LN CA CO AR
Scaled Score
18 47–48 38 27 36–37 71–75 40–41 29 25 43–44 38–39 25 22 23 101–104 29 28 18 19 49–50 39 — 38 76–78 42–43 30 26 45–46 40–41 26 23 24 105–108 30 29 19 20 51 40 28 39–40 79–82 44–45 31 27 47 42–43 27 24 25 109–112 31 30 20 21 52 41–42 — 41 83–85 46–47 32 — 48 44–45 28 — 26 113–115 32 31 21 22 53 43–44 29 42 86–88 48–49 33 28 49 46–47 29 25 27 116–118 33 32 22 23 54 45 — 43 89–91 50–51 34 — — 48–49 30 — 28 119–121 34 33 23
24 55 46 30 44 92–94 52–53 — 29 — 50–51 31 26 29 122–123 35 34 24 25 56 — — 45 95–97 54 — — — 52–53 — — 30 124–125 36 — 25 26 57 — 31 46 98–100 — — — — 54–55 — 27 — 126–127 37 — 26 27 58 — — 47 101–103 — — — — 56–57 — — — 128 38 — 27 28 — — 32 48–54 104–117 — — — — 58–60 — — — — — — 28
11 Copyright © 2019 NCS Pearson, Inc. All rights reserved. Normative copyright © 2014 NCS Pearson, Inc.
Table 2. Scaled Score Equivalents of Total Raw Scores for Subtests, by Age (continued) Ages 10:0–10:3
Scaled Score BD SI MR DS CD VC FW VP PS SS IN PC LN CA CO AR
Scaled Score
18 48–49 39 27 37 74–77 41–42 30 25 44–45 39–40 25 23 24 103–106 30 28 18 19 50–51 40 — 38–39 78–81 43–44 31 26 46 41–42 26 — 25 107–110 31 29 19 20 52 41 28 40–41 82–85 45–46 32 27 47 43–44 27 24 26 111–114 32 30 20 21 53 42–43 — 42 86–88 47–48 33 — 48 45–46 28 25 27 115–117 33 31 21 22 54 44 29 43 89–91 49–50 34 28 49 47–48 29 — 28 118–120 34 32 22 23 55 45 — 44 92–94 51–52 — — — 49–50 30 26 29 121–122 35 33 23
24 56 46 30 45 95–97 53–54 — 29 — 51–52 31 — — 123–124 36 34 24 25 57 — — 46 98–100 — — — — 53–54 — 27 30 125–126 37 — 25 26 — — 31 47 101–103 — — — — 55 — — — 127–128 38 — 26 27 58 — — 48 104–106 — — — — 56–57 — — — — — — 27 28 — — 32 49–54 107–117 — — — — 58–60 — — — — — — 28
Ages 10:4–10:7 Scaled Score BD SI MR DS CD VC FW VP PS SS IN PC LN CA CO AR
Scaled Score
18 48–50 40 27 37–38 76–79 42–43 31 26 44–45 40–41 26 23 24 105–108 30 29 18 19 51 41 28 39–40 80–83 44–45 32 27 46 42–43 27 24 25 109–112 31 30 19 20 52 42 — 41 84–87 46–47 33 — 47 44–45 28 — 26 113–116 32 31 20 21 53 43–44 29 42 88–90 48–49 34 28 48 46–47 29 25 27 117–118 33 32 21 22 54 45 — 43 91–93 50–51 — — 49 48–49 30 — 28 119–121 34 33 22 23 55 46 30 44 94–96 52–53 — 29 — 50–51 31 26 29 122–123 35 34 23
24 56 — — 45 97–99 54 — — — 52 — — — 124–125 36 — 24 25 57 — 31 46 100–102 — — — — 53–54 — 27 30 126–127 37 — 25 26 — — — 47 103–105 — — — — 55–56 — — — 128 38 — 26 27 58 — 32 48 106–108 — — — — 57–58 — — — — — — 27 28 — — — 49–54 109–117 — — — — 59–60 — — — — — — 28

12 Copyright © 2019 NCS Pearson, Inc. All rights reserved. Normative copyright © 2014 NCS Pearson, Inc.
Table 2. Scaled Score Equivalents of Total Raw Scores for Subtests, by Age (continued) Ages 10:8–10:11
Scaled Score BD SI MR DS CD VC FW VP PS SS IN PC LN CA CO AR
Scaled Score
18 49–50 41 — 38–39 79–82 42–43 31 26 44–45 41–42 26 23 24 107–110 31 30 18 19 51 42 28 40 83–86 44–45 32 27 46 43–44 27 24 25 111–114 32 31 19 20 52 43 — 41–42 87–90 46–47 33 — 47 45–46 28 25 26 115–117 33 32 20 21 53 44 29 43 91–93 48–49 34 28 48 47–48 29 — 27 118–120 34 33 21 22 54 45 — 44 94–96 50–51 — — 49 49 30 26 28 121–122 35 34 22 23 55 46 30 45 97–99 52–53 — 29 — 50–51 31 — 29 123–124 36 — 23
24 56 — — 46 100–102 54 — — — 52–53 — 27 — 125–126 37 — 24 25 57 — 31 47 103–105 — — — — 54–55 — — 30 127–128 38 — 25 26 — — — 48 106–107 — — — — 56 — — — — — — 26 27 58 — 32 49 108–110 — — — — 57–58 — — — — — — 27 28 — — — 50–54 111–117 — — — — 59–60 — — — — — — 28
Ages 11:0–11:3 Scaled Score BD SI MR DS CD VC FW VP PS SS IN PC LN CA CO AR
Scaled Score
18 50–51 41 28 39 81–84 43–44 31 26 45 42–43 27 23 25 109–112 32 30 18 19 52 42 — 40–41 85–88 45–46 32 27 46 44–45 28 24 26 113–115 33 31 19 20 53 43 — 42 89–92 47–48 33 — 47 46–47 29 25 27 116–118 34 32 20 21 54 44 29 43 93–95 49–50 34 28 48 48–49 30 — 28 119–121 35 33 21 22 55 45 — 44 96–98 51–52 — — 49 50 31 26 29 122–123 36 34 22 23 56 46 30 45 99–101 53–54 — 29 — 51–52 — — — 124–125 37 — 23
24 — — — 46 102–103 — — — — 53 — 27 30 126–127 38 — 24 25 57 — 31 47 104–106 — — — — 54–55 — — — 128 — — 25 26 — — — 48 107–108 — — — — 56 — — — — — — 26 27 58 — 32 49 109–111 — — — — 57–58 — — — — — — 27 28 — — — 50–54 112–117 — — — — 59–60 — — — — — — 28
13 Copyright © 2019 NCS Pearson, Inc. All rights reserved. Normative copyright © 2014 NCS Pearson, Inc.
Table 2. Scaled Score Equivalents of Total Raw Scores for Subtests, by Age (continued) Ages 11:4–11:7
Scaled Score BD SI MR DS CD VC FW VP PS SS IN PC LN CA CO AR
Scaled Score
18 50–51 41 28 40 83–86 44–45 31 26 45 43–44 27 24 25 111–113 32 31 18 19 52 42 — 41 87–90 46–47 32 27 46 45–46 28 25 26 114–116 33 32 19 20 53 43 29 42 91–94 48–49 33 — 47 47–48 29 — 27 117–119 34 33 20 21 54 44 — 43 95–97 50–51 34 28 48 49–50 30 26 28 120–122 35 34 21 22 55 45 30 44 98–100 52–53 — — 49 51 31 — 29 123–124 36 — 22 23 56 46 — 45 101–103 54 — 29 — 52–53 — 27 — 125–126 37 — 23
24 — — 31 46 104–106 — — — — 54 — — 30 127–128 38 — 24 25 57 — — 47 107–108 — — — — 55–56 — — — — — — 25 26 — — — 48 109–110 — — — — 57 — — — — — — 26 27 58 — 32 49 111–113 — — — — 58–59 — — — — — — 27 28 — — — 50–54 114–117 — — — — 60 — — — — — — 28
Ages 11:8–11:11 Scaled Score BD SI MR DS CD VC FW VP PS SS IN PC LN CA CO AR
Scaled Score
18 50–51 42 28 40 85–88 44–45 31 27 45 44–45 27 24 25 112–114 33 31 18 19 52 43 — 41 89–92 46–47 32 — 46 46–47 28 25 26 115–117 34 32 19 20 53 44 29 42–43 93–96 48–49 33 28 47 48 29 — 27 118–120 35 33 20 21 54 45 — 44 97–99 50–51 34 — 48 49–50 30 26 28 121–123 36 34 21 22 55 46 30 45 100–102 52–53 — 29 49 51 31 — 29 124–125 37 — 22 23 56 — — 46 103–105 54 — — — 52–53 — 27 — 126–127 38 — 23
24 — — 31 47 106–107 — — — — 54 — — 30 128 — — 24 25 57 — — 48 108–110 — — — — 55–56 — — — — — — 25 26 — — — 49 111–112 — — — — 57 — — — — — — 26 27 58 — 32 50 113–114 — — — — 58–59 — — — — — — 27 28 — — — 51–54 115–117 — — — — 60 — — — — — — 28

14 Copyright © 2019 NCS Pearson, Inc. All rights reserved. Normative copyright © 2014 NCS Pearson, Inc.
Table 2. Scaled Score Equivalents of Total Raw Scores for Subtests, by Age (continued) Ages 12:0–12:3
Scaled Score BD SI MR DS CD VC FW VP PS SS IN PC LN CA CO AR
Scaled Score
18 51–52 42 28 41 87–90 45–46 31 27 45 44–45 28 24 25 113–115 33 31 18 19 53 43 — 42 91–94 47–48 32 — 46 46–47 29 25 26 116–118 34 32 19 20 54 44 29 43 95–98 49–50 33 28 47 48–49 30 — 27 119–121 35 33 20 21 55 45 — 44 99–101 51–52 34 — 48 50–51 31 26 28 122–124 36 34 21 22 56 46 30 45 102–104 53–54 — 29 49 52 — — 29 125–126 37 — 22 23 — — — 46 105–107 — — — — 53–54 — 27 30 127 38 — 23
24 57 — 31 47 108–109 — — — — 55 — — — 128 — — 24 25 — — — 48 110–111 — — — — 56–57 — — — — — — 25 26 58 — — 49 112–113 — — — — 58 — — — — — — 26 27 — — 32 50 114–115 — — — — 59 — — — — — — 27 28 — — — 51–54 116–117 — — — — 60 — — — — — — 28
Ages 12:4–12:7 Scaled Score BD SI MR DS CD VC FW VP PS SS IN PC LN CA CO AR
Scaled Score
18 52 42 — 41 89–92 46–47 31 27 45 45–46 28 24 25 114–116 34 31 18 19 53 43 29 42 93–96 48–49 32 — 46 47–48 29 25 26 117–119 35 32 19 20 54 44 — 43–44 97–99 50–51 33 28 47 49–50 30 26 27 120–122 36 33 20 21 55 45 30 45 100–102 52–53 34 — 48 51 31 — 28 123–124 37 34 21 22 56 46 — 46 103–105 54 — 29 49 52 — 27 29 125–126 38 — 22 23 — — 31 47 106–108 — — — — 53–54 — — 30 127–128 — — 23
24 57 — — 48 109–110 — — — — 55 — — — — — — 24 25 — — — 49 111–112 — — — — 56–57 — — — — — — 25 26 58 — 32 50 113–114 — — — — 58 — — — — — — 26 27 — — — 51 115–116 — — — — 59 — — — — — — 27 28 — — — 52–54 117 — — — — 60 — — — — — — 28
15 Copyright © 2019 NCS Pearson, Inc. All rights reserved. Normative copyright © 2014 NCS Pearson, Inc.
Table 2. Scaled Score Equivalents of Total Raw Scores for Subtests, by Age (continued) Ages 12:8–12:11
Scaled Score BD SI MR DS CD VC FW VP PS SS IN PC LN CA CO AR
Scaled Score
18 52 42 — 41 91–94 46–47 32 27 45 46–47 28 24 — 115–117 34 31 18 19 53 43 29 42–43 95–97 48–49 33 — 46 48–49 29 25 26 118–120 35 32 19 20 54 44 — 44 98–100 50–51 34 28 47 50–51 30 26 27 121–123 36 33 20 21 55 45 30 45 101–103 52–53 — — 48 52 31 — 28 124–125 37 34 21 22 56 46 — 46 104–106 54 — 29 49 53 — 27 29 126–127 38 — 22 23 — — 31 47 107–109 — — — — 54–55 — — 30 128 — — 23
24 57 — — 48 110–111 — — — — 56 — — — — — — 24 25 — — — 49 112–113 — — — — 57–58 — — — — — — 25 26 58 — 32 50 114–115 — — — — 59 — — — — — — 26 27 — — — 51 116–117 — — — — 60 — — — — — — 27 28 — — — 52–54 — — — — — — — — — — — — 28
Ages 13:0–13:3 Scaled Score BD SI MR DS CD VC FW VP PS SS IN PC LN CA CO AR
Scaled Score
18 52–53 42 — 41 93–95 47–48 32 27 45 47–48 29 24 — 116–118 35 31 18 19 54 43 29 42–43 96–98 49 33 — 46 49–50 30 25 26 119–121 36 32 19 20 55 44 — 44 99–101 50–51 34 28 47 51–52 31 26 27 122–123 37 33 20 21 — 45 30 45–46 102–104 52–53 — — 48 53 — — 28 124–125 38 34 21 22 56 46 — 47 105–107 54 — 29 49 54 — 27 29 126–127 — — 22 23 — — 31 48 108–110 — — — — 55 — — 30 128 — — 23
24 57 — — 49 111–112 — — — — 56 — — — — — — 24 25 — — — 50 113–114 — — — — 57–58 — — — — — — 25 26 58 — 32 51 115–116 — — — — 59 — — — — — — 26 27 — — — 52 117 — — — — 60 — — — — — — 27 28 — — — 53–54 — — — — — — — — — — — — 28

16 Copyright © 2019 NCS Pearson, Inc. All rights reserved. Normative copyright © 2014 NCS Pearson, Inc.
Table 2. Scaled Score Equivalents of Total Raw Scores for Subtests, by Age (continued) Ages 13:4–13:7
Scaled Score BD SI MR DS CD VC FW VP PS SS IN PC LN CA CO AR
Scaled Score
18 52–53 42 — 42 95–97 47–48 32 27 45 48–49 29 25 26 117–119 35 32 18 19 54 43 29 43 98–100 49–50 33 — 46 50–51 30 26 27 120–122 36 33 19 20 55 44 — 44–45 101–103 51–52 34 28 47 52–53 31 — 28 123–124 37 34 20 21 56 45 30 46 104–106 53–54 — — 48 54 — 27 29 125–126 38 — 21 22 — 46 — 47 107–108 — — 29 49 55 — — 30 127–128 — — 22 23 57 — 31 48 109–111 — — — — 56 — — — — — — 23
24 — — — 49 112–113 — — — — 57 — — — — — — 24 25 58 — — 50 114–115 — — — — 58 — — — — — — 25 26 — — 32 51 116 — — — — 59 — — — — — — 26 27 — — — 52 117 — — — — 60 — — — — — — 27 28 — — — 53–54 — — — — — — — — — — — — 28
Ages 13:8–13:11 Scaled Score BD SI MR DS CD VC FW VP PS SS IN PC LN CA CO AR
Scaled Score
18 53 42 — 42 96–98 47–48 32 27 45 48–49 29 25 26 118–120 36 32 18 19 54 43 29 43–44 99–101 49–50 33 — 46 50–51 30 26 27 121–123 37 33 19 20 55 44 — 45 102–104 51–52 34 28 47 52–53 31 — 28 124–125 38 34 20 21 56 45 30 46 105–107 53–54 — — 48 54 — 27 29 126–127 — — 21 22 — 46 — 47 108–110 — — 29 49 55 — — 30 128 — — 22 23 57 — 31 48 111–112 — — — — 56 — — — — — — 23
24 — — — 49 113–114 — — — — 57 — — — — — — 24 25 58 — — 50 115–116 — — — — 58–59 — — — — — — 25 26 — — 32 51 117 — — — — 60 — — — — — — 26 27 — — — 52 — — — — — — — — — — — — 27 28 — — — 53–54 — — — — — — — — — — — — 28

17 Copyright © 2019 NCS Pearson, Inc. All rights reserved. Normative copyright © 2014 NCS Pearson, Inc.
Table 2. Scaled Score Equivalents of Total Raw Scores for Subtests, by Age (continued) Ages 14:0–14:3
Scaled Score BD SI MR DS CD VC FW VP PS SS IN PC LN CA CO AR
Scaled Score
18 53 42 — 42–43 97–100 48–49 32 27 45 49–50 30 25 26 119–120 36 32 18 19 54 43 29 44 101–103 50–51 33 — 46 51–52 31 26 27 121–123 37 33 19 20 55 44 — 45–46 104–106 52–53 34 28 47 53–54 — — 28 124–125 38 34 20 21 56 45 30 47 107–109 54 — — 48 55 — 27 29 126–127 — — 21 22 57 46 — 48 110–111 — — 29 49 56 — — 30 128 — — 22 23 — — 31 49 112–113 — — — — 57 — — — — — — 23
24 — — — 50 114–115 — — — — 58 — — — — — — 24 25 58 — — 51 116–117 — — — — 59 — — — — — — 25 26 — — 32 52 — — — — — 60 — — — — — — 26 27 — — — 53 — — — — — — — — — — — — 27 28 — — — 54 — — — — — — — — — — — — 28
Ages 14:4–14:7 Scaled Score BD SI MR DS CD VC FW VP PS SS IN PC LN CA CO AR
Scaled Score
18 53 42 — 42–43 98–101 48–49 33 27 45 49–50 30 25 26 120–121 36 33 18 19 54 43 29 44–45 102–104 50–51 34 — 46 51–52 31 26 27 122–124 37 34 19 20 55 44 — 46 105–107 52–53 — 28 47 53–54 — 27 28 125–126 38 — 20 21 56 45 30 47 108–110 54 — — 48 55 — — 29 127 — — 21 22 57 46 — 48 111–112 — — 29 49 56 — — 30 128 — — 22 23 — — 31 49 113–114 — — — — 57 — — — — — — 23
24 — — — 50 115–116 — — — — 58 — — — — — — 24 25 58 — — 51 117 — — — — 59 — — — — — — 25 26 — — 32 52 — — — — — 60 — — — — — — 26 27 — — — 53 — — — — — — — — — — — — 27 28 — — — 54 — — — — — — — — — — — — 28

18 Copyright © 2019 NCS Pearson, Inc. All rights reserved. Normative copyright © 2014 NCS Pearson, Inc.
Table 2. Scaled Score Equivalents of Total Raw Scores for Subtests, by Age (continued) Ages 14:8–14:11
Scaled Score BD SI MR DS CD VC FW VP PS SS IN PC LN CA CO AR
Scaled Score
18 53 43 — 43 99–102 49–50 33 27 46 50–51 30 25 — 120–121 37 33 18 19 54 44 29 44–45 103–105 51 34 — 47 52–53 31 26 27 122–124 38 34 19 20 55 45 — 46 106–108 52–53 — 28 48 54–55 — 27 28 125–126 — — 20 21 56 46 30 47–48 109–111 54 — — 49 56 — — 29 127 — — 21 22 57 — — 49 112–113 — — 29 — 57 — — 30 128 — — 22 23 — — 31 50 114–115 — — — — 58 — — — — — — 23
24 — — — 51 116–117 — — — — 59 — — — — — — 24 25 58 — — 52 — — — — — 60 — — — — — — 25 26 — — 32 53 — — — — — — — — — — — — 26 27 — — — — — — — — — — — — — — — — 27 28 — — — 54 — — — — — — — — — — — — 28
Ages 15:0–15:3 Scaled Score BD SI MR DS CD VC FW VP PS SS IN PC LN CA CO AR
Scaled Score
18 53 43 — 43–44 100–103 49–50 33 — 46 50–51 30 25 — 121–122 37 33 18 19 54 44 29 45 104–106 51 34 28 47 52–53 31 26 27 123–124 38 34 19 20 55 45 — 46–47 107–109 52–53 — — 48 54–55 — 27 28 125–126 — — 20 21 56 46 30 48 110–112 54 — 29 49 56 — — 29 127 — — 21 22 57 — — 49 113–114 — — — — 57 — — 30 128 — — 22 23 — — 31 50 115–116 — — — — 58 — — — — — — 23
24 — — — 51 117 — — — — 59 — — — — — — 24 25 58 — — 52 — — — — — 60 — — — — — — 25 26 — — 32 53 — — — — — — — — — — — — 26 27 — — — — — — — — — — — — — — — — 27 28 — — — 54 — — — — — — — — — — — — 28

19 Copyright © 2019 NCS Pearson, Inc. All rights reserved. Normative copyright © 2014 NCS Pearson, Inc.
Table 2. Scaled Score Equivalents of Total Raw Scores for Subtests, by Age (continued) Ages 15:4–15:7
Scaled Score BD SI MR DS CD VC FW VP PS SS IN PC LN CA CO AR
Scaled Score
18 54 44 — 44 101–104 50–51 33 — 46 51–52 — 26 27 121–122 37 33 18 19 55 45 29 45–46 105–107 52 34 28 47 53–54 31 — 28 123–124 38 34 19 20 56 46 — 47 108–110 53 — — 48 55–56 — 27 29 125–126 — — 20 21 57 — 30 48 111–113 54 — 29 49 57 — — 30 127 — — 21 22 — — — 49 114–115 — — — — 58 — — — 128 — — 22 23 — — 31 50 116 — — — — 59 — — — — — — 23
24 58 — — 51 117 — — — — 60 — — — — — — 24 25 — — — 52 — — — — — — — — — — — — 25 26 — — 32 53 — — — — — — — — — — — — 26 27 — — — — — — — — — — — — — — — — 27 28 — — — 54 — — — — — — — — — — — — 28
Ages 15:8–15:11 Scaled Score BD SI MR DS CD VC FW VP PS SS IN PC LN CA CO AR
Scaled Score
18 54 44 29 44–45 102–105 50–51 33 — 46 51–52 — 26 27 121–122 37 33 18 19 55 45 — 46–47 106–108 52 34 28 47 53–54 31 — 28 123–124 38 34 19 20 56 46 30 48 109–111 53 — — 48 55–56 — 27 29 125–126 — — 20 21 57 — — 49 112–113 54 — 29 49 57–58 — — 30 127 — — 21 22 — — 31 50 114–115 — — — — 59 — — — 128 — — 22 23 — — — 51 116 — — — — 60 — — — — — — 23
24 58 — — 52 117 — — — — — — — — — — — 24 25 — — 32 — — — — — — — — — — — — — 25 26 — — — 53 — — — — — — — — — — — — 26 27 — — — — — — — — — — — — — — — — 27 28 — — — 54 — — — — — — — — — — — — 28

20 Copyright © 2019 NCS Pearson, Inc. All rights reserved. Normative copyright © 2014 NCS Pearson, Inc.
Table 2. Scaled Score Equivalents of Total Raw Scores for Subtests, by Age (continued) Ages 16:0–16:3
Scaled Score BD SI MR DS CD VC FW VP PS SS IN PC LN CA CO AR
Scaled Score
18 55 45 29 45 103–106 51 33 — 46 52–53 — 26 27 122–123 37 33 18 19 56 46 — 46–47 107–109 52 34 28 47 54–55 31 — 28 124–125 38 34 19 20 57 — 30 48 110–112 53 — — 48 56–57 — 27 29 126–127 — — 20 21 — — — 49 113–114 54 — 29 49 58 — — 30 128 — — 21 22 — — 31 50 115 — — — — 59 — — — — — — 22 23 58 — — 51 116 — — — — 60 — — — — — — 23
24 — — — 52 117 — — — — — — — — — — — 24 25 — — 32 — — — — — — — — — — — — — 25 26 — — — 53 — — — — — — — — — — — — 26 27 — — — — — — — — — — — — — — — — 27 28 — — — 54 — — — — — — — — — — — — 28
Ages 16:4–16:7 Scaled Score BD SI MR DS CD VC FW VP PS SS IN PC LN CA CO AR
Scaled Score
18 55 45 — 45–46 104–107 52 — 28 46 53–54 — 26 27 122–123 37 — 18 19 56 46 30 47 108–110 53 34 — 47 55–56 31 — 28 124–125 38 34 19 20 57 — — 48 111–113 54 — 29 48 57–58 — 27 29 126–127 — — 20 21 — — 31 49 114–115 — — — 49 59 — — 30 128 — — 21 22 — — — 50 116 — — — — 60 — — — — — — 22 23 58 — — 51 117 — — — — — — — — — — — 23
24 — — 32 52 — — — — — — — — — — — — 24 25 — — — — — — — — — — — — — — — — 25 26 — — — 53 — — — — — — — — — — — — 26 27 — — — — — — — — — — — — — — — — 27 28 — — — 54 — — — — — — — — — — — — 28

21 Copyright © 2019 NCS Pearson, Inc. All rights reserved. Normative copyright © 2014 NCS Pearson, Inc.
Table 2. Scaled Score Equivalents of Total Raw Scores for Subtests, by Age (continued) Ages 16:8–16:11
Scaled Score BD SI MR DS CD VC FW VP PS SS IN PC LN CA CO AR
Scaled Score
18 55 — — 46 104–107 52 — 28 46 54–55 — 26 27 122–123 37 — 18 19 56 46 30 47 108–110 53 34 — 47 56–57 31 — 28 124–125 38 34 19 20 57 — — 48 111–113 54 — 29 48 58 — 27 29 126–127 — — 20 21 — — 31 49 114–115 — — — 49 59 — — 30 128 — — 21 22 — — — 50 116 — — — — 60 — — — — — — 22 23 58 — — 51 117 — — — — — — — — — — — 23
24 — — 32 52 — — — — — — — — — — — — 24 25 — — — — — — — — — — — — — — — — 25 26 — — — 53 — — — — — — — — — — — — 26 27 — — — — — — — — — — — — — — — — 27 28 — — — 54 — — — — — — — — — — — — 28

22 Copyright © 2019 NCS Pearson, Inc. All rights reserved. Normative copyright © 2014 NCS Pearson, Inc.
Table 3. Extended Norms: VCI, VSI, and FRI Equivalents of Sums of Scaled Scores
Verbal Comprehension Index Visual Spatial Index Fluid Reasoning Index
Sum of Scaled Scores VCI
90% Confidence
Interval
95% Confidence
Interval Percentile
Rank
Sum of Scaled Scores VSI
90% Confidence
Interval
95% Confidence
Interval Percentile
Rank
Sum of Scaled Scores FRI
90% Confidence
Interval
95% Confidence
Interval Percentile
Rank 38 155 144–157 143–158 >99.9 38 155 144–157 143–158 >99.9 38 155 145–157 144–158 >99.9 39 158 147–160 146–161 >99.9 39 158 147–160 146–161 >99.9 39 159 149–161 148–162 >99.9 40 161 150–163 148–164 >99.9 40 161 150–163 148–164 >99.9 40 162 152–164 150–165 >99.9 41 164 152–165 151–167 >99.9 41 164 152–165 151–167 >99.9 41 165 154–167 153–168 >99.9 42 168 156–169 155–170 >99.9 42 168 156–169 155–170 >99.9 42 168 157–169 156–170 >99.9 43 171 159–172 158–173 >99.9 43 171 159–172 158–173 >99.9 43 171 160–172 159–173 >99.9 44 174 162–175 160–176 >99.9 44 174 162–175 160–176 >99.9 44 174 163–175 162–176 >99.9 45 177 164–177 163–178 >99.9 45 177 164–177 163–178 >99.9 45 177 166–178 164–179 >99.9 46 180 167–180 166–181 >99.9 46 181 168–181 167–182 >99.9 46 180 168–180 167–182 >99.9 47 183 170–183 169–184 >99.9 47 184 171–184 170–185 >99.9 47 183 171–183 170–184 >99.9 48 186 173–186 171–187 >99.9 48 187 174–186 172–188 >99.9 48 186 174–186 173–187 >99.9 49 189 175–188 174–190 >99.9 49 190 176–189 175–190 >99.9 49 189 177–189 176–190 >99.9 50 192 178–191 177–192 >99.9 50 194 180–193 179–194 >99.9 50 192 179–192 178–193 >99.9 51 195 181–194 180–195 >99.9 51 197 183–196 182–197 >99.9 51 195 182–194 181–196 >99.9 52 198 184–197 183–198 >99.9 52 200 186–198 184–200 >99.9 52 198 185–197 184–198 >99.9 53 201 186–199 185–201 >99.9 53 204 189–202 188–203 >99.9 53 201 188–200 187–201 >99.9 54 204 189–202 188–203 >99.9 54 207 192–205 191–206 >99.9 54 204 191–203 189–204 >99.9 55 207 192–205 191–206 >99.9 55 209 194–207 193–208 >99.9 55 207 193–206 192–207 >99.9 56 210 195–208 194–209 >99.9 56 210 195–208 194–209 >99.9 56 210 196–208 195–210 >99.9

23 Copyright © 2019 NCS Pearson, Inc. All rights reserved. Normative copyright © 2014 NCS Pearson, Inc.
Table 4. Extended Norms: WMI and PSI Equivalents of Sums of Scaled Scores Working Memory Index Processing Speed Index
Sum of Scaled Scores WMI
90% Confidence
Interval
95% Confidence
Interval Percentile
Rank
Sum of Scaled Scores PSI
90% Confidence
Interval
95% Confidence
Interval Percentile
Rank 38 155 144–157 143–158 >99.9 38 155 141–156 139–157 >99.9 39 157 146–159 145–160 >99.9 39 158 144–159 142–160 >99.9 40 159 148–161 147–162 >99.9 40 161 146–161 145–163 >99.9 41 162 151–163 149–165 >99.9 41 164 149–164 147–165 >99.9 42 165 153–166 152–167 >99.9 42 167 151–166 150–168 >99.9 43 169 157–170 156–171 >99.9 43 170 154–169 153–171 >99.9 44 172 160–173 159–174 >99.9 44 174 158–173 156–174 >99.9 45 175 163–175 161–177 >99.9 45 177 160–175 159–177 >99.9 46 178 165–178 164–179 >99.9 46 180 163–178 161–179 >99.9 47 182 169–182 168–183 >99.9 47 183 166–181 164–182 >99.9 48 185 172–185 171–186 >99.9 48 186 168–183 167–185 >99.9 49 188 175–187 173–189 >99.9 49 189 171–186 169–187 >99.9 50 191 177–190 176–191 >99.9 50 192 173–188 172–190 >99.9 51 195 181–194 180–195 >99.9 51 195 176–191 175–193 >99.9 52 198 184–197 183–198 >99.9 52 198 179–194 177–195 >99.9 53 201 186–199 185–201 >99.9 53 201 181–196 180–198 >99.9

24 Copyright © 2019 NCS Pearson, Inc. All rights reserved. Normative copyright © 2014 NCS Pearson, Inc.
Table 5. Extended Norms: FSIQ Equivalents of Sums of Scaled Scores
Sum of Scaled Scores FSIQ
90% Confidence
Interval
95% Confidence
Interval Percentile
Rank
Sum of Scaled Scores FSIQ
90% Confidence
Interval
95% Confidence
Interval Percentile
Rank
Sum of Scaled Scores FSIQ
90% Confidence
Interval
95% Confidence
Interval Percentile
Rank 130 160 153–162 152–163 >99.9 160 183 175–184 174–185 >99.9 190 207 198–207 197–208 >99.9 131 160 153–162 152–163 >99.9 161 184 176–185 175–186 >99.9 191 208 199–208 198–209 >99.9 132 161 154–163 153–164 >99.9 162 185 177–186 176–187 >99.9 192 209 200–209 199–210 >99.9 133 162 155–164 154–165 >99.9 163 186 178–187 177–188 >99.9 193 210 201–210 200–211 >99.9 134 162 155–164 154–165 >99.9 164 186 178–187 177–188 >99.9 194 210 201–210 200–211 >99.9 135 163 156–165 155–166 >99.9 165 187 179–188 178–189 >99.9 195 210 201–210 200–211 >99.9 136 164 157–166 156–167 >99.9 166 188 180–189 179–190 >99.9 196 210 201–210 200–211 >99.9 137 165 158–167 157–168 >99.9 167 189 181–190 180–191 >99.9138 166 159–168 158–169 >99.9 168 190 182–191 181–192 >99.9139 166 159–168 158–169 >99.9 169 190 182–191 181–192 >99.9140 167 160–169 159–170 >99.9 170 191 183–192 182–193 >99.9141 168 161–170 160–171 >99.9 171 192 184–193 183–194 >99.9142 169 162–171 161–172 >99.9 172 193 185–194 184–195 >99.9143 169 162–171 161–172 >99.9 173 194 186–195 185–196 >99.9144 170 162–172 162–173 >99.9 174 194 186–195 185–196 >99.9145 171 163–173 163–174 >99.9 175 195 186–196 186–197 >99.9146 172 164–174 163–175 >99.9 176 196 187–197 187–198 >99.9147 173 165–175 164–176 >99.9 177 197 188–198 187–199 >99.9148 173 165–175 164–176 >99.9 178 198 189–199 188–200 >99.9149 174 166–176 165–177 >99.9 179 198 189–199 188–200 >99.9150 175 167–177 166–178 >99.9 180 199 190–200 189–201 >99.9151 176 168–178 167–179 >99.9 181 200 191–201 190–202 >99.9152 177 169–179 168–180 >99.9 182 201 192–202 191–203 >99.9153 178 170–180 169–181 >99.9 183 202 193–203 192–204 >99.9154 178 170–180 169–181 >99.9 184 202 193–203 192–204 >99.9155 179 171–181 170–181 >99.9 185 203 194–204 193–205 >99.9156 180 172–182 171–182 >99.9 186 204 195–205 194–205 >99.9157 181 173–182 172–183 >99.9 187 205 196–206 195–206 >99.9158 182 174–183 173–184 >99.9 188 206 197–206 196–207 >99.9159 182 174–183 173–184 >99.9 189 206 197–206 196–207 >99.9

25 Copyright © 2019 NCS Pearson, Inc. All rights reserved. Normative copyright © 2014 NCS Pearson, Inc.
Table 6. Extended Norms: Verbal Expanded Crystallized Index (VECI) Equivalents of Sums of Scaled Scores
Sum of Scaled Scores VECI
90% Confidence
Interval
95% Confidence
Interval Percentile
Rank
Sum of Scaled Scores VECI
90% Confidence
Interval
95% Confidence
Interval Percentile
Rank 75 153 145–156 144–157 >99.9 105 200 190–200 189–201 >99.976 156 148–158 147–159 >99.9 106 201 191–201 190–202 >99.977 158 150–160 149–161 >99.9 107 203 193–203 192–204 >99.978 159 151–161 150–162 >99.9 108 204 194–204 193–205 >99.979 161 153–163 152–164 >99.9 109 206 195–206 194–207 >99.980 162 154–164 153–165 >99.9 110 207 196–207 195–208 >99.981 164 156–166 155–167 >99.9 111 208 197–208 196–209 >99.982 165 157–167 156–168 >99.9 112 210 199–210 198–211 >99.983 167 158–169 157–170 >99.9 84 168 159–170 158–171 >99.9 85 170 161–172 160–173 >99.9 86 171 162–173 161–174 >99.9 87 173 164–175 163–176 >99.9 88 174 165–176 164–177 >99.9 89 176 167–177 166–178 >99.9 90 177 168–178 167–179 >99.9 91 179 170–180 169–181 >99.9 92 180 171–181 170–182 >99.9 93 182 173–183 172–184 >99.9 94 183 174–184 173–185 >99.9 95 185 176–186 175–187 >99.9 96 186 176–187 175–188 >99.9 97 188 178–189 177–190 >99.9 98 189 179–190 178–191 >99.9 99 191 181–192 180–193 >99.9
100 192 182–193 181–194 >99.9 101 194 184–195 183–196 >99.9 102 195 185–195 184–196 >99.9 103 197 187–197 186–198 >99.9 104 198 188–198 187–199 >99.9

26 Copyright © 2019 NCS Pearson, Inc. All rights reserved. Normative copyright © 2014 NCS Pearson, Inc.
Table 7. Extended Norms: Expanded Fluid Index (EFI) Equivalents of Sums of Scaled Scores
Sum of Scaled Scores EFI
90% Confidence
Interval
95% Confidence
Interval Percentile
Rank
Sum of Scaled Scores EFI
90% Confidence
Interval
95% Confidence
Interval Percentile
Rank
74 155 147–157 146–158 >99.9 104 201 191–201 190–202 >99.975 156 148–158 147–159 >99.9 105 203 193–203 192–204 >99.976 157 149–159 148–160 >99.9 106 205 195–205 194–206 >99.977 158 150–160 149–161 >99.9 107 207 196–207 195–208 >99.978 159 151–161 150–162 >99.9 108 209 198–209 197–210 >99.979 161 153–163 152–164 >99.9 109 210 199–210 198–211 >99.980 162 154–164 153–165 >99.9 110 210 199–210 198–211 >99.981 163 155–165 154–166 >99.9 111 210 199–210 198–211 >99.982 165 157–167 156–168 >99.9 112 210 199–210 198–211 >99.983 166 157–168 156–169 >99.9 84 167 158–169 157–170 >99.9 85 169 160–171 159–172 >99.9 86 170 161–172 160–173 >99.9 87 171 162–173 161–174 >99.9 88 173 164–175 163–176 >99.9 89 175 166–176 165–177 >99.9 90 177 168–178 167–179 >99.9 91 179 170–180 169–181 >99.9 92 180 171–181 170–182 >99.9 93 181 172–182 171–183 >99.9 94 183 174–184 173–185 >99.9 95 185 176–186 175–187 >99.9 96 187 177–188 176–189 >99.9 97 189 179–190 178–191 >99.9 98 190 180–191 179–192 >99.9 99 191 181–192 180–193 >99.9
100 193 183–194 182–195 >99.9 101 195 185–195 184–196 >99.9 102 197 187–197 186–198 >99.9 103 199 189–199 188–200 >99.9

27 Copyright © 2019 NCS Pearson, Inc. All rights reserved. Normative copyright © 2014 NCS Pearson, Inc.
Table 8. Extended Norms: QRI and AWMI Equivalents of Sums of Scaled Scores Quantitative Reasoning Index Auditory Working Memory Index
Sum of Scaled Scores QRI
90% Confidence
Interval
95% Confidence
Interval Percentile
Rank
Sum of Scaled Scores AWMI
90% Confidence
Interval
95% Confidence
Interval Percentile
Rank
38 155 147–157 146–158 >99.9 39 155 145–157 144–158 >99.9 39 158 150–160 149–161 >99.9 40 158 148–160 147–161 >99.9 40 161 153–163 152–164 >99.9 41 161 151–163 149–164 >99.9 41 164 156–166 155–167 >99.9 42 165 154–167 153–168 >99.9 42 168 159–170 158–171 >99.9 43 168 157–169 156–170 >99.9 43 171 162–173 161–174 >99.9 44 171 160–172 159–173 >99.9 44 174 165–176 164–177 >99.9 45 175 164–176 163–177 >99.9 45 177 168–178 167–179 >99.9 46 178 166–179 165–180 >99.9 46 180 171–181 170–182 >99.9 47 181 169–181 168–183 >99.9 47 183 174–184 173–185 >99.9 48 184 172–184 171–185 >99.9 48 186 176–187 175–188 >99.9 49 188 176–188 175–189 >99.9 49 189 179–190 178–191 >99.9 50 191 179–191 177–192 >99.9 50 192 182–193 181–194 >99.9 51 194 181–193 180–195 >99.9 51 195 185–195 184–196 >99.9 52 197 184–196 183–197 >99.9 52 198 188–198 187–199 >99.9 53 201 188–200 187–201 >99.9 53 201 191–201 190–202 >99.9 54 204 191–203 189–204 >99.9 54 204 194–204 193–205 >99.9 55 207 193–206 192–207 >99.9 55 207 196–207 195–208 >99.9 56 210 196–208 195–210 >99.9 56 210 199–210 198–211 >99.9

28 Copyright © 2019 NCS Pearson, Inc. All rights reserved. Normative copyright © 2014 NCS Pearson, Inc.
Table 9. Extended Norms: NVI Equivalents of Sums of Scaled Scores
Sum of Scaled Scores NVI
90% Confidence
Interval
95% Confidence
Interval Percentile
Rank
Sum of Scaled Scores NVI
90% Confidence
Interval
95% Confidence
Interval Percentile
Rank
Sum of Scaled Scores NVI
90% Confidence
Interval
95% Confidence
Interval Percentile
Rank 108 160 152–162 151–163 >99.9 136 182 173–183 172–184 >99.9 164 206 195–206 194–207 >99.9 109 160 152–162 151–163 >99.9 137 183 174–184 173–185 >99.9 165 207 196–207 195–208 >99.9 110 161 153–163 152–164 >99.9 138 184 175–185 174–186 >99.9 166 208 197–208 196–209 >99.9 111 162 154–164 153–165 >99.9 139 185 176–186 175–187 >99.9 167 209 198–209 197–210 >99.9 112 162 154–164 153–165 >99.9 140 186 176–187 175–188 >99.9 168 210 199–210 198–211 >99.9 113 163 155–165 154–166 >99.9 141 186 176–187 175–188 >99.9114 164 156–166 155–167 >99.9 142 187 177–188 176–189 >99.9115 165 157–167 156–168 >99.9 143 188 178–189 177–190 >99.9116 166 157–168 156–169 >99.9 144 189 179–190 178–191 >99.9117 166 157–168 156–169 >99.9 145 190 180–191 179–192 >99.9118 167 158–169 157–170 >99.9 146 191 181–192 180–193 >99.9119 168 159–170 158–171 >99.9 147 191 181–192 180–193 >99.9120 169 160–171 159–172 >99.9 148 192 182–193 181–194 >99.9121 170 161–172 160–173 >99.9 149 193 183–194 182–195 >99.9122 171 162–173 161–174 >99.9 150 194 184–195 183–196 >99.9123 171 162–173 161–174 >99.9 151 195 185–195 184–196 >99.9124 172 163–174 162–175 >99.9 152 196 186–196 185–197 >99.9125 173 164–175 163–176 >99.9 153 197 187–197 186–198 >99.9126 174 165–176 164–177 >99.9 154 198 188–198 187–199 >99.9127 175 166–176 165–177 >99.9 155 199 189–199 188–200 >99.9128 176 167–177 166–178 >99.9 156 200 190–200 189–201 >99.9129 176 167–177 166–178 >99.9 157 201 191–201 190–202 >99.9130 177 168–178 167–179 >99.9 158 201 191–201 190–202 >99.9131 178 169–179 168–180 >99.9 159 202 192–202 191–203 >99.9132 179 170–180 169–181 >99.9 160 203 193–203 192–204 >99.9133 180 171–181 170–182 >99.9 161 204 194–204 193–205 >99.9134 181 172–182 171–183 >99.9 162 205 195–205 194–206 >99.9135 181 172–182 171–183 >99.9 163 206 195–206 194–207 >99.9

29 Copyright © 2019 NCS Pearson, Inc. All rights reserved. Normative copyright © 2014 NCS Pearson, Inc.
Table 10. Extended Norms: GAI Equivalents of Sums of Scaled Scores
Sum of Scaled Scores GAI
90% Confidence
Interval
95% Confidence
Interval Percentile
Rank
Sum of Scaled Scores GAI
90% Confidence
Interval
95% Confidence
Interval Percentile
Rank 95 160 153–162 152–163 >99.9 133 205 196-206 195-206 >99.9 96 161 154–163 153–164 >99.9 134 206 197-206 196-207 >99.9 97 162 155–164 154–165 >99.9 135 207 198-207 197-208 >99.9 98 163 156–165 155–166 >99.9 136 208 199-208 198-209 >99.9 99 165 158–167 157–168 >99.9 137 209 200-209 199-210 >99.9
100 166 159–168 158–169 >99.9 138 210 201-210 200-211 >99.9 101 167 160–169 159–170 >99.9 139 210 201-210 200-211 >99.9 102 168 161–170 160–171 >99.9 140 210 201-210 200-211 >99.9 103 170 162–172 162–173 >99.9 104 171 163–173 163–174 >99.9 105 172 164–174 163–175 >99.9 106 173 165–175 164–176 >99.9 107 174 166–176 165–177 >99.9 108 176 168–178 167–179 >99.9 109 177 169–179 168–180 >99.9 110 178 170–180 169–181 >99.9 111 179 171–181 170–181 >99.9 112 181 173–182 172–183 >99.9 113 182 174–183 173–184 >99.9 114 183 175–184 174–185 >99.9 115 184 176–185 175–186 >99.9 116 185 177–186 176–187 >99.9 117 187 179–188 178–189 >99.9 118 188 180–189 179–190 >99.9 119 189 181–190 180–191 >99.9 120 190 182–191 181–192 >99.9 121 191 183–192 182–193 >99.9 122 192 184–193 183–194 >99.9 123 194 186–195 185–196 >99.9 124 195 186–196 186–197 >99.9 125 196 187–197 187–198 >99.9 126 197 188–198 187–199 >99.9 127 198 189–199 188–200 >99.9 128 200 191–201 190–202 >99.9 129 201 192–202 191–203 >99.9 130 202 193–203 192–204 >99.9 131 203 194–204 193–205 >99.9 132 204 195–205 194–205 >99.9

30 Copyright © 2019 NCS Pearson, Inc. All rights reserved. Normative copyright © 2014 NCS Pearson, Inc.
Table 11. Extended Norms: EGAI Equivalents of Sums of Scaled Scores
Sum of Scaled Scores EGAI
90% Confidence
Interval
95% Confidence
Interval Percentile
Rank
Sum of Scaled Scores EGAI
90% Confidence
Interval
95% Confidence
Interval Percentile
Rank
Sum of Scaled Scores EGAI
90% Confidence
Interval
95% Confidence
Interval Percentile
Rank 152 160 154–162 153–163 >99.9 178 186 179–188 178–188 >99.9 204 210 203–211 202–212 >99.9 153 161 155–163 154–164 >99.9 179 187 180–189 179–189 >99.9 205 210 203–211 202–212 >99.9 154 162 156–164 155–165 >99.9 180 188 181–190 180–190 >99.9 206 210 203–211 202–212 >99.9 155 163 157–165 156–166 >99.9 181 189 182–190 181–191 >99.9 207 210 203–211 202–212 >99.9 156 164 158–166 157–167 >99.9 182 190 183–191 182–192 >99.9 208 210 203–211 202–212 >99.9 157 165 159–167 158–168 >99.9 183 191 184–192 183–193 >99.9 209 210 203–211 202–212 >99.9 158 166 160–168 159–169 >99.9 184 192 185–193 184–194 >99.9 210 210 203–211 202–212 >99.9 159 167 161–169 160–170 >99.9 185 193 186–194 185–195 >99.9 211 210 203–211 202–212 >99.9 160 168 162–170 161–171 >99.9 186 194 187–195 186–196 >99.9 212 210 203–211 202–212 >99.9 161 169 163–171 162–172 >99.9 187 195 188–196 187–197 >99.9 213 210 203–211 202–212 >99.9 162 170 164–172 163–173 >99.9 188 196 189–197 188–198 >99.9 214 210 203–211 202–212 >99.9 163 171 165–173 164–174 >99.9 189 197 190–198 189–199 >99.9 215 210 203–211 202–212 >99.9 164 172 166–174 165–175 >99.9 190 198 191–199 190–200 >99.9 216 210 203–211 202–212 >99.9 165 173 167–175 166–176 >99.9 191 199 192–200 191–201 >99.9 217 210 203–211 202–212 >99.9 166 174 168–176 167–177 >99.9 192 200 193–201 192–202 >99.9 218 210 203–211 202–212 >99.9 167 175 169–177 168–178 >99.9 193 201 194–202 193–203 >99.9 219 210 203–211 202–212 >99.9 168 176 170–178 169–179 >99.9 194 202 195–203 194–204 >99.9 220 210 203–211 202–212 >99.9 169 177 171–179 170–180 >99.9 195 203 196–204 195–205 >99.9 221 210 203–211 202–212 >99.9 170 178 172–180 171–181 >99.9 196 204 197–205 196–206 >99.9 222 210 203–211 202–212 >99.9 171 179 172–181 172–182 >99.9 197 205 198–206 197–207 >99.9 223 210 203–211 202–212 >99.9 172 180 173–182 173–183 >99.9 198 206 199–207 198–208 >99.9173 181 174–183 174–184 >99.9 199 207 200–208 199–209 >99.9174 182 175–184 175–184 >99.9 200 208 201–209 200–210 >99.9175 183 176–185 176–185 >99.9 201 209 202–210 201–211 >99.9176 184 177–186 177–186 >99.9 202 210 203–211 202–212 >99.9177 185 178–187 178–187 >99.9 203 210 203–211 202–212 >99.9
31 Copyright © 2019 NCS Pearson, Inc. All rights reserved. Normative copyright © 2014 NCS Pearson, Inc.
Table 12. Extended Norms: CPI Equivalents of Sums of Scaled Scores
Sum of Scaled Scores CPI
90% Confidence
Interval
95% Confidence
Interval Percentile
Rank
Sum of Scaled Scores CPI
90% Confidence
Interval
95% Confidence
Interval Percentile
Rank
74 160 150–162 149–163 >99.9 104 204 191–203 189–204 >99.975 161 151–163 149–164 >99.9 105 206 193–205 191–206 >99.976 162 152–164 150–165 >99.9 106 207 193–206 192–207 >99.977 164 153–166 152–167 >99.9 107 208 194–207 193–208 >99.978 165 154–167 153–168 >99.9 108 210 196–208 195–210 >99.979 166 155–167 154–169 >99.9 109 210 196–208 195–210 >99.980 168 157–169 156–170 >99.9 110 210 196–208 195–210 >99.981 170 159–171 158–172 >99.9 111 210 196–208 195–210 >99.982 171 160–172 159–173 >99.9 112 210 196–208 195–210 >99.983 172 161–173 160–174 >99.9 84 174 163–175 162–176 >99.9 85 176 165–177 163–178 >99.9 86 177 166–178 164–179 >99.9 87 178 166–179 165–180 >99.9 88 180 168–180 167–182 >99.9 89 182 170–182 169–183 >99.9 90 183 171–183 170–184 >99.9 91 184 172–184 171–185 >99.9 92 186 174–186 173–187 >99.9 93 188 176–188 175–189 >99.9 94 189 177–189 176–190 >99.9 95 190 178–190 176–191 >99.9 96 192 179–192 178–193 >99.9 97 194 181–193 180–195 >99.9 98 195 182–194 181–196 >99.9 99 196 183–195 182–197 >99.9
100 198 185–197 184–198 >99.9 101 200 187–199 186–200 >99.9 102 201 188–200 187–201 >99.9 103 202 189–201 188–202 >99.9

32 Copyright © 2019 NCS Pearson, Inc. All rights reserved. Normative copyright © 2014 NCS Pearson, Inc.
Reporting and Describing Scores Derived Using the Extended Norms The extended subtest norms are based on comparisons with the child’s same-age peers, and the extended composite norms are age-corrected standard scores. The extended composite norms can be interpreted similarly to other composite scores, as outlined in chapter 6 of the WISC–V Technical and Interpretive Manual. Age-based percentile ranks are provided for the extended composite norms and indicate a child’s standing relative to other children the same age. Percentile ranks reflect points on a scale at or below which a given percentage of scores lie, based on the normative sample. The percentile ranks for the extended composite scores are interpreted as are other percentile ranks, as described in chapter 6 of the WISC–V Technical and Interpretive Manual.
Scores on measures of cognitive ability are based on observational data and represent estimates of a child’s true scores. They reflect a child’s true abilities combined with some degree of measurement error. Confidence intervals provide another means of expressing score precision and serve as a reminder that measurement error is inherent in all scores. Refer to chapter 6 of the WISC–V Technical and Interpretive Manual for additional information about confidence intervals and their use in interpretation.
The following wording is recommended when the extended norms are used:
Because [insert child’s name] obtained the top scaled score on [insert # of subtests] subtests, the scaled and composite scores were derived using a special table of extended norms created using the normative sample and a sample of highly gifted children (see WISC-V Technical Report #6). Using these extended norms, the scores are as follows: [describe].
Case Study Name: Child A
Test Age: 9 years 0 months
Because Child A obtained the top scaled score on seven subtests, the scaled and composite scores were derived using a special table of extended norms created using the normative sample and a sample of highly gifted children (see WISC-V Technical Report #6). Using these extended norms, the scores are as follows.
Raw score
Scaled score Sum of scaled scores Standard score Subtest Regular Extended Composite Regular Extended Regular ExtendedSimilarities 46 19 26 Verbal Comprehension Index 38 46 155 180 Vocabulary 42 19 20 Visual Spatial Index 29 29 126 126 Information 27 19 21 Fluid Reasoning Index 34 34 140 140 Comprehension 33 19 23 Working Memory Index 37 37 150 150 Block Design 36 14 14 Processing Speed Index 27 27 119 119 Visual Puzzles 20 15 15 Full Scale IQ 116 124 146 154 Matrix Reasoning 27 19 19 Verbal (Expanded Crystallized) Index 76 90 155 177 Figure Weights 26 15 15 Expanded Fluid Index 69 70 148 150 Picture Concepts 19 16 16 Quantitative Reasoning Index 34 35 143 146 Arithmetic 29 19 20 Auditory Working Memory Index 37 37 151 151 Digit Span 37 19 19 Nonverbal Index 92 92 139 139 Picture Span 42 18 18 General Ability Index 86 94 147 158 Letter-Number Sequencing 23 18 18 Expanded General Ability Index 143 158 150 166 Coding 36 11 11 Cognitive Proficiency Index 64 64 141 141 Symbol Search 32 16 16 Cancellation 48 9 9

33 Copyright © 2019 NCS Pearson, Inc. All rights reserved. Normative copyright © 2014 NCS Pearson, Inc.
References Wechsler, D. (2003). Wechsler intelligence scale for children (4th ed.). Bloomington, MN: Pearson. Wechsler, D. (2014). Wechsler intelligence scale for children (5th ed.). Bloomington, MN: Pearson. Zhu, J., Cayton, T., Weiss, L., & Gabel, A. (2008). WISC–IV extended norms (WISC–IV Technical Report 7).
Bloomington, MN: Pearson. Retrieved from https://images.pearsonclinical.com/images/assets/WISC-IV/WISCIV_TechReport_7.pdf