technical report 15th march 2012
TRANSCRIPT

8/2/2019 Technical Report 15th March 2012
http://slidepdf.com/reader/full/technical-report-15th-march-2012 1/5
For Private Circulation Only | 1
Technical Research | March 15, 2012
Yesterday, for the fourth consecutive session, we witnessed
a gap up opening due to positive sentiments across global
markets. However, after the gap up opening, markets
witnessed some profit booking in the later half and closed
marginally above 5450 mark. On the sectoral front,
Banking, Capital Goods and PSU counters were among the
major gainers, whereas Realty and IT sectors remained
under pressure. The advance to decline ratio was
marginally in favor of declining counters. (A= 1401
D= 1505) (Source –www.bseindia.com)
Formation:
• The positive crossover in “5 & 20-day EMA” and “RSI
Smoothened” oscillator is still intact.
Trading strategy:
In today’s trading session, it is likely that our markets open
lower in line with global clues. The US DOLLAR INDEX has
strengthened and the charts indicate probability of a further
upside move in this index. With regards to our markets, the
volatility is expected to rise on account of the RBI monetary
policy. Thus, going forward, positive momentum is likely to
resume ONLY if markets sustain above yesterday’s high of
18041 / 5500. In this case, indices are likely to rally
towards 18250 – 18524 / 5538 – 5610 levels. On the
downside, the immediate support is seen around 17837 –
17692 / 5437 – 5382 levels.
Daily Technical Report
Sensex (17919) / NIFTY (5464)
Exhibit 1: N ifty Daily Chart
Source: Falcon
Actionable points:View Neutral
Resistance Levels 5500 - 5538 – 5610Support Levels 5437 – 5382

8/2/2019 Technical Report 15th March 2012
http://slidepdf.com/reader/full/technical-report-15th-march-2012 2/5
Technical Research | March 15, 2012
For Private Circulation Only | 2
Yesterday, Bank Nifty opened with an upside gap and
gained momentum as the day progressed to close near
the highest point of the day. The positive crossover in “RSI
Smoothened” oscillator on the daily chart mentioned in
our previous report is still intact. Conversely on the hourly
chart the “RSI Smoothened” oscillator is placed in an
extreme overbought condition, hence possibility of a
minor pullback in the index cannot be ruled out. In such a
scenario the index is likely to find support at 10768 –
10671- 10543 levels. On the upside if the index sustainsabove yesterday’s high of 10912 then it is likely to rally
towards 11013 – 11227 levels.
Note: In view of RBI monetary policy we expect Bank
Nifty to be volatile. Hence traders are advised to trade
with strict stop losses and stay light on their positions.
Actionable points:
View NeutralResistance Levels 10912 – 11013 - 11227Support Levels 10768 – 10671 - 10543
Bank N ifty Outlook - (10890)
Exhibit 2: Bank Nifty Daily Chart
Source: Falcon
8/2/2019 Technical Report 15th March 2012
http://slidepdf.com/reader/full/technical-report-15th-march-2012 3/5
Technical Research | March 15, 2012
For Private Circulation Only | 3
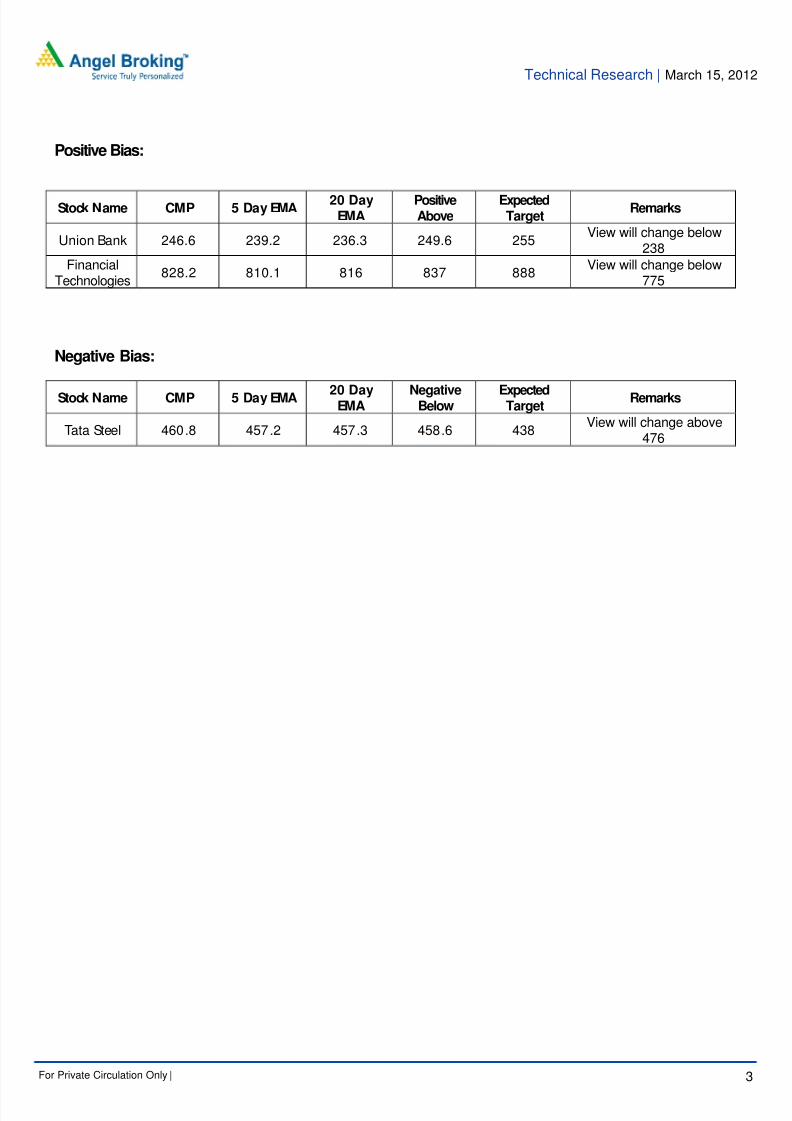
Positive Bias:
Stock Name CMP 5 Day EMA 20 DayEMA
PositiveAbove
ExpectedTarget
Remarks
Union Bank 246.6 239.2 236.3 249.6 255View will change below
238
FinancialTechnologies
828.2 810.1 816 837 888View will change below
775
Negative Bias:
Stock Name CMP 5 Day EMA 20 DayEMA
NegativeBelow
ExpectedTarget
Remarks
Tata Steel 460.8 457.2 457.3 458.6 438View will change above
476
8/2/2019 Technical Report 15th March 2012
http://slidepdf.com/reader/full/technical-report-15th-march-2012 4/5
Technical Research | March 15, 2012
For Private Circulation Only | 4
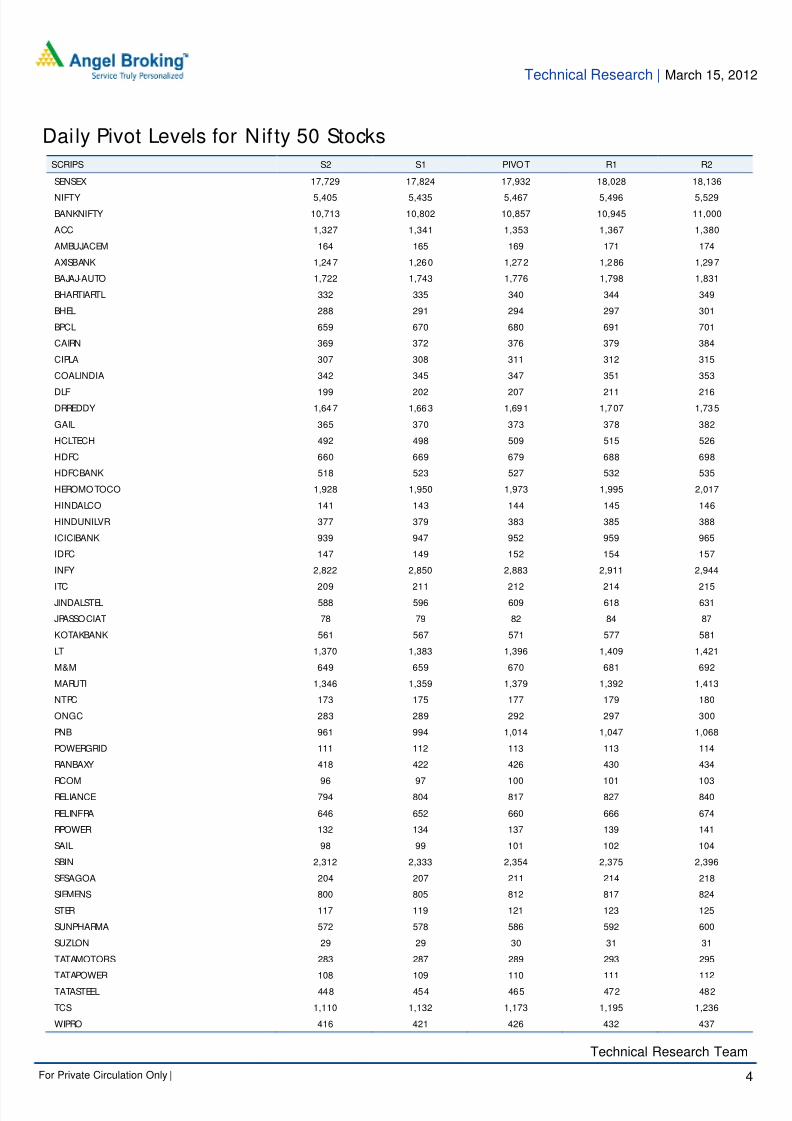
SCRIPS S2 S1 PIVOT R1 R2
SENSEX 17,729 17,824 17,932 18,028 18,136
NIFTY 5,405 5,435 5,467 5,496 5,529
BANKNIFTY 10,713 10,802 10,857 10,945 11,000
ACC 1,327 1,341 1,353 1,367 1,380
AMBUJACEM 164 165 169 171 174
AXISBANK 1,247 1,260 1,272 1,286 1,297
BAJAJ-AUTO 1,722 1,743 1,776 1,798 1,831
BHARTIARTL 332 335 340 344 349
BHEL 288 291 294 297 301
BPCL 659 670 680 691 701
CAIRN 369 372 376 379 384
CIPLA 307 308 311 312 315
COALINDIA 342 345 347 351 353
DLF 199 202 207 211 216
DRREDDY 1,647 1,663 1,691 1,707 1,735
GAIL 365 370 373 378 382
HCLTECH 492 498 509 515 526
HDFC 660 669 679 688 698
HDFCBANK 518 523 527 532 535
HEROMOTOCO 1,928 1,950 1,973 1,995 2,017
HINDALCO 141 143 144 145 146
HINDUNILVR 377 379 383 385 388
ICICIBANK 939 947 952 959 965
IDFC 147 149 152 154 157
INFY 2,822 2,850 2,883 2,911 2,944
ITC 209 211 212 214 215JINDALSTEL 588 596 609 618 631
JPASSOCIAT 78 79 82 84 87
KOTAKBANK 561 567 571 577 581
LT 1,370 1,383 1,396 1,409 1,421
M&M 649 659 670 681 692
MARUTI 1,346 1,359 1,379 1,392 1,413
NTPC 173 175 177 179 180
ONGC 283 289 292 297 300
PNB 961 994 1,014 1,047 1,068
POWERGRID 111 112 113 113 114
RANBAXY 418 422 426 430 434
RCOM 96 97 100 101 103RELIANCE 794 804 817 827 840
RELINFRA 646 652 660 666 674
RPOWER 132 134 137 139 141
SAIL 98 99 101 102 104
SBIN 2,312 2,333 2,354 2,375 2,396
SESAGOA 204 207 211 214 218
SIEMENS 800 805 812 817 824
STER 117 119 121 123 125
SUNPHARMA 572 578 586 592 600
SUZLON 29 29 30 31 31
TATAMOTORS 283 287 289 293 295
TATAPOWER 108 109 110 111 112
TATASTEEL 448 454 465 472 482
TCS 1,110 1,132 1,173 1,195 1,236
WIPRO 416 421 426 432 437
Technical Research Team
Daily Pivot Levels for Nif ty 50 Stocks

8/2/2019 Technical Report 15th March 2012
http://slidepdf.com/reader/full/technical-report-15th-march-2012 5/5
Technical Research | March 15, 2012
For Private Circulation Only | 5
Technical Report
RESEARCH TEAM
Shardul Kulkarni Head - Technicals
Sameet Chavan Technical Analyst
Sacchitanand Uttekar Technical Analyst
Mehul Kothari Technical Analyst
Ankur Lakhotia Technical Analyst
For any Queries, Suggestions and Feedback kindly mail to [email protected]
Research Team: 022-3952 6600 Website: www.angelbroking.com
DISCLAIMER: This document is not for public distribution and has been furnished to you solely for your information and must not
be reproduced or redistributed to any other person. Persons into whose possession this document may come are required to observe
these restrictions.
Opinion expressed is our current opinion as of the date appearing on this material only. While we endeavor to update on a
reasonable basis the information discussed in this material, there may be regulatory, compliance, or other reasons that prevent us
from doing so. Prospective investors and others are cautioned that any forward-looking statements are not predictions and may be
subject to change without notice. Our proprietary trading and investment businesses may make investment decisions that are
inconsistent with the recommendations expressed herein.
The information in this document has been printed on the basis of publicly available information, internal data and other reliable
sources believed to be true and are for general guidance only. While every effort is made to ensure the accuracy and completeness of
information contained, the company takes no guarantee and assumes no liability for any errors or omissions of the information. No
one can use the information as the basis for any claim, demand or cause of action.
Recipients of this material should rely on their own investigations and take their own professional advice. Each recipient of this
document should make such investigations as it deems necessary to arrive at an independent evaluation of an investment in the
securities of companies referred to in this document (including the merits and risks involved), and should consult their own advisors to
determine the merits and risks of such an investment. Price and value of the investments referred to in this material may go up or
down. Past performance is not a guide for future performance. Certain transactions - futures, options and other derivatives as well as
non- investment grade securities - involve substantial risks and are not suitable for all investors. Reports based on technical analysis
centers on studying charts of a stock's price movement and trading volume, as opposed to focusing on a company's fundamentals
and as such, may not match with a report on a company's fundamentals.
We do not undertake to advise you as to any change of our views expressed in this document. While we would endeavor to update
the information herein on a reasonable basis, Angel Broking, its subsidiaries and associated companies, their directors and
employees are under no obligation to update or keep the information current. Also there may be regulatory, compliance, or other
reasons that may prevent Angel Broking and affiliates from doing so. Prospective investors and others are cautioned that any
forward-looking statements are not predictions and may be subject to change without notice.
Angel Broking Limited and affiliates, including the analyst who has issued this report, may, on the date of this report, and from time
to time, have long or short positions in, and buy or sell the securities of the companies mentioned herein or engage in any other
transaction involving such securities and earn brokerage or compensation or act as advisor or have other potential conflict of interest
with respect to company/ies mentioned herein or inconsistent with any recommendation and related information and opinions.
Angel Broking Limited and affiliates may seek to provide or have engaged in providing corporate finance, investment banking or
other advisory services in a merger or specific transaction to the companies referred to in this report, as on the date of this report or
in the past.
Sebi Registration No : INB 010996539