technical report 1101 assessments - university of … report 1101 ... little else. without knowing...
TRANSCRIPT

Technical Report 1101
DIBELS Data System: 2010-2011 Percentile Ranks for DIBELS Next Benchmark
Assessments
Authors:
Kelli D. Cummings
Patrick C. Kennedy
Janet Otterstedt
Scott K. Baker
Edward J. Kame’enui
University of Oregon
Center on Teaching and Learning
Citation:
Cummings, K. D., Kennedy, P. C., Otterstedt, J., Baker, S. K., & Kame’enui, E. J. (2011). DIBELS Data System: 2010-2011 Percentile Ranks for DIBELS Next Benchmark Assessments (Technical Report 1101). Eugene, OR: University of Oregon. The research reported here was supported exclusively by the Center on Teaching and Learning (CTL), a research and outreach unit in the College of Education at the University of Oregon, its Director, Edward J. Kame'enui, Dean-Knight Professor, and Associate Director, Scott Baker. The data, analyses, results, and opinions expressed are those of the authors and CTL, and do not represent views of the College of Education or the University of Oregon.
DIBELS Next 2010-2011 Percentile Ranks 2
Technical Report 1101
DIBELS Data System: 2010-2011 Percentile Ranks for DIBELS Next Benchmark
Assessments
In this report we present percentile ranks for DIBELS Next benchmark assessments,
based on a nationally representative convenience sample of schools from the DIBELS Data
System (DDS) for the 2010-2011 school year. Percentile ranks (or percentiles) are a common
metric used to facilitate the interpretation of individual characteristics relative to the distribution
of those characteristics in a particular group of people. Percentiles can describe measurable
physical characteristics, such as height or weight, as well as more abstract attributes, such as
intelligence or reading proficiency. In either case, the validity of the interpretation depends on
understanding what is being measured and the norm group being used for comparison.
Recommended Standards for Interpreting Percentile Rank Scores
As an example, consider the issue of interpreting an individual’s height—both as a raw
score (number of centimeters tall) and a percentile score (percentile for height). If we know that
someone is 164 centimeters tall we have some information about him or her, but we know very
little else. Without knowing more about who the person is and to whom they are being
compared, both raw scores and percentiles are difficult to interpret.
On one hand, if a person who is 164 centimeters in height is compared to adult males in
the U.S., their score would be considered below the 5th percentile and we could conclude that this
person is short, relative to other U.S. adult males (Halls & Hanson, 2000). In contrast, if we
compare this person to 12-year-old children in the U.S., their score would fall at the 95th
percentile and we could conclude that this person is quite tall, compared to other 12 year-olds in
the U.S. (National Center for Health Statistics, 2000). If we used either of the above comparison
DIBELS Next 2010-2011 Percentile Ranks 3
groups and the person was actually an adult woman, we might have made an incorrect
comparison and would draw the wrong conclusion. When the raw score value of 164 centimeters
is compared to adult women in the U.S., the score falls at the 50th percentile for height, which is
in the average range (Halls & Hanson, 2000). The same raw score may correspond to very
different percentile scores depending on the comparison group.
Educators use percentiles frequently to describe the relative position of student scores on
performance-based measures. In all cases, the language used to describe the percentile score
should convey the maximum possible information about the group to which the individual is
being compared. Consider the following example as a guideline when interpreting student
reading performance using the percentiles in this report. If 3rd-grade Jonny performed at the 75th
percentile on a commonly accepted measure of Oral Reading Fluency (e.g., DIBELS Oral
Reading Fluency), it would be appropriate to say “On a standard assessment of Oral Reading
Fluency, Jonny performed as well as or better than 75 percent of other 3rd grade students from
DDS schools.”
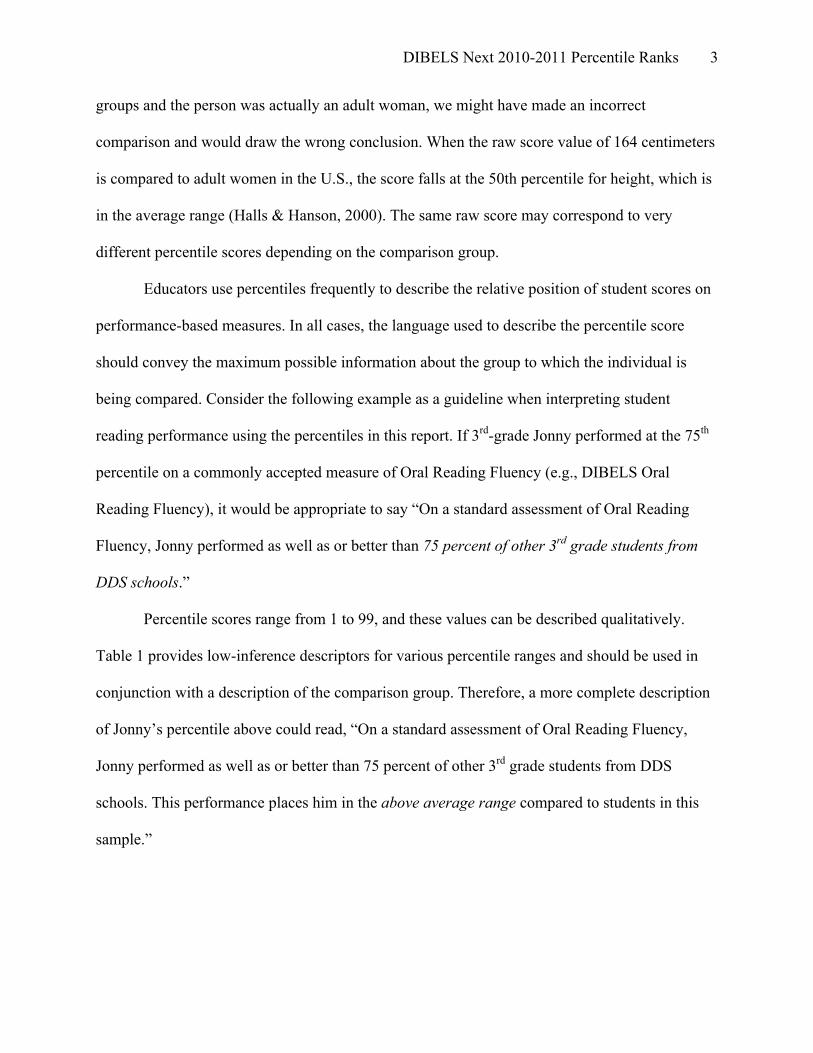
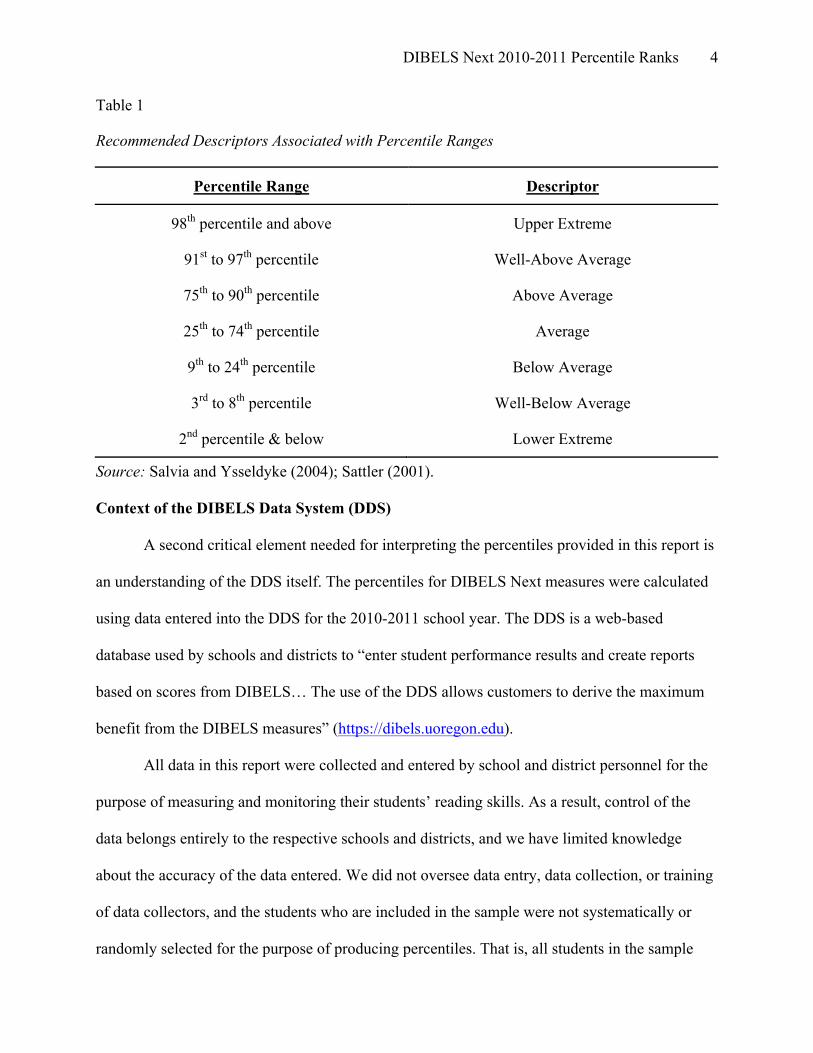
Percentile scores range from 1 to 99, and these values can be described qualitatively.
Table 1 provides low-inference descriptors for various percentile ranges and should be used in
conjunction with a description of the comparison group. Therefore, a more complete description
of Jonny’s percentile above could read, “On a standard assessment of Oral Reading Fluency,
Jonny performed as well as or better than 75 percent of other 3rd grade students from DDS
schools. This performance places him in the above average range compared to students in this
sample.”
DIBELS Next 2010-2011 Percentile Ranks 4
Table 1
Recommended Descriptors Associated with Percentile Ranges
Percentile Range Descriptor
98th percentile and above Upper Extreme
91st to 97th percentile Well-Above Average
75th to 90th percentile Above Average
25th to 74th percentile Average
9th to 24th percentile Below Average
3rd to 8th percentile Well-Below Average
2nd percentile & below Lower Extreme
Source: Salvia and Ysseldyke (2004); Sattler (2001).
Context of the DIBELS Data System (DDS)
A second critical element needed for interpreting the percentiles provided in this report is
an understanding of the DDS itself. The percentiles for DIBELS Next measures were calculated
using data entered into the DDS for the 2010-2011 school year. The DDS is a web-based
database used by schools and districts to “enter student performance results and create reports
based on scores from DIBELS… The use of the DDS allows customers to derive the maximum
benefit from the DIBELS measures” (https://dibels.uoregon.edu).
All data in this report were collected and entered by school and district personnel for the
purpose of measuring and monitoring their students’ reading skills. As a result, control of the
data belongs entirely to the respective schools and districts, and we have limited knowledge
about the accuracy of the data entered. We did not oversee data entry, data collection, or training
of data collectors, and the students who are included in the sample were not systematically or
randomly selected for the purpose of producing percentiles. That is, all students in the sample

DIBELS Next 2010-2011 Percentile Ranks 5
attended schools that have taken some initiative to measure the reading skills of their students.
Students from such schools may or may not be representative of “typical” students in all U.S.
public schools.
Despite these limitations, we believe that data in the DDS were collected and entered in
good faith, to the best of the abilities of the district and school personnel involved, and that these
percentiles provide valuable information for users of the DDS. We have taken several steps to
improve the quality of the data. Rather than including all data entered into the DDS, we instead
employed modest exclusion criteria (described in the Participants subsection, pp. 11 - 13). In
addition, we have compared participating schools to the U.S. population of public schools as an
estimate of the overall representativeness of the sample (see Tables 5 – 18, pp. 27 – 47).
The Method and Results sections are organized around 3 key areas. First, we describe the
DIBELS Next measures, the Sentinel Schools Project (SSP) participants who formed the basis
for the comparison group in this technical report, and the exclusionary criteria that we applied to
the sample. Next, we describe the final, total sample in detail; including the average number of
students per district and students per school at each grade level and time of year (pp. 21 – 23);
and the demographic information for the complete sample (pp. 23 - 48). In the final section of
this report, we list percentile scores for each raw score across all DIBELS Next measures, by
grade and time of year (i.e., individual DIBELS Next Measures: pp. 52 - 104; DIBELS Next
Composite Score: pp. 105 - 127).
Percentile Method
Measures
DIBELS Next (Good & Kaminski, 2011) benchmark assessments are a collection of
measures administered in various combinations from kindergarten through sixth grade. The
DIBELS Next 2010-2011 Percentile Ranks 6
DIBELS Next measures focus on essential reading skills in five critical areas of reading
achievement: phonemic awareness, phonics, accuracy and fluency with reading connected text,
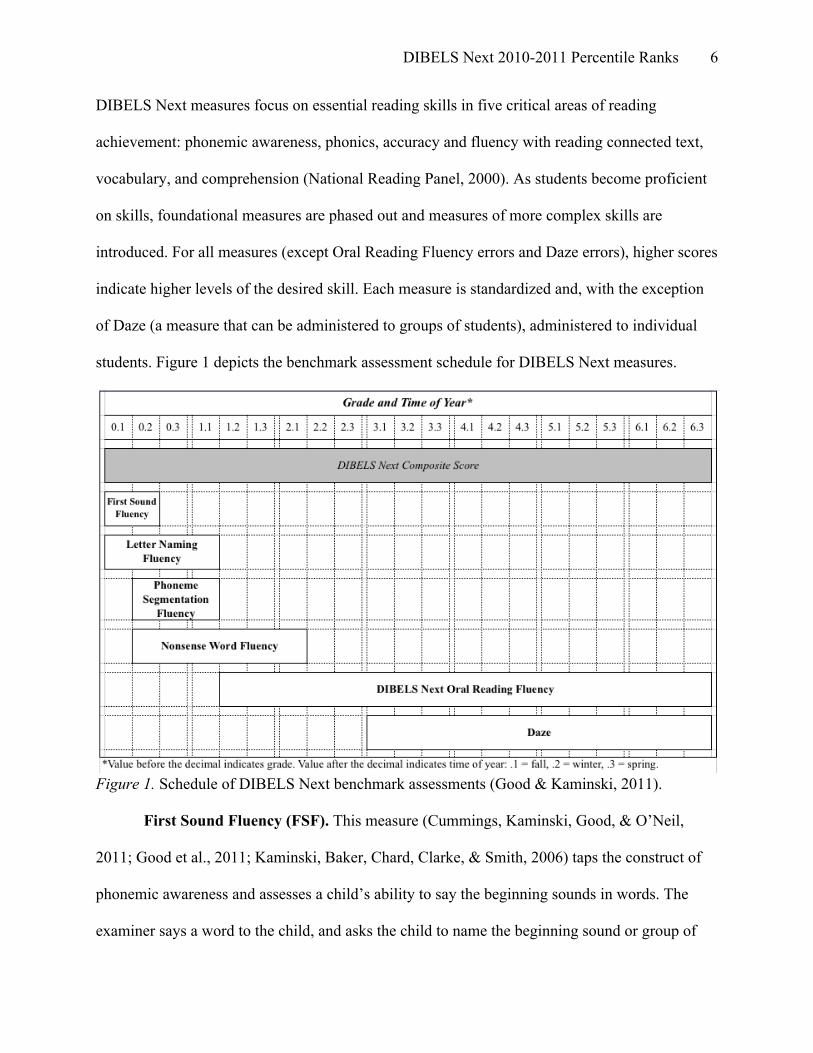
vocabulary, and comprehension (National Reading Panel, 2000). As students become proficient
on skills, foundational measures are phased out and measures of more complex skills are
introduced. For all measures (except Oral Reading Fluency errors and Daze errors), higher scores
indicate higher levels of the desired skill. Each measure is standardized and, with the exception
of Daze (a measure that can be administered to groups of students), administered to individual
students. Figure 1 depicts the benchmark assessment schedule for DIBELS Next measures.
Figure 1. Schedule of DIBELS Next benchmark assessments (Good & Kaminski, 2011).
First Sound Fluency (FSF). This measure (Cummings, Kaminski, Good, & O’Neil,
2011; Good et al., 2011; Kaminski, Baker, Chard, Clarke, & Smith, 2006) taps the construct of
phonemic awareness and assesses a child’s ability to say the beginning sounds in words. The
examiner says a word to the child, and asks the child to name the beginning sound or group of

DIBELS Next 2010-2011 Percentile Ranks 7
sounds in that word. Once the child responds, the examiner presents another word, and the
process is repeated until 1 minute has elapsed or until the last item has been reached. FSF scores
are not prorated, so if a child finishes the 30 probe items prior to the 1-minute time limit, their
final score consists of their total score at completion. Good and Kaminski (2011) provide a
discontinue rule for FSF wherein a total score of 0 is to be recorded for all students who respond
incorrectly to the first 5 test items. The total DIBELS Next FSF score corresponds to the number
of correct beginning sounds produced. FSF is given in the beginning and middle of kindergarten.
Letter Naming Fluency (LNF). The LNF task (Good & Kaminski, 2002; Good &
Kaminski, 2011; Marston & Magnusson, 1988) is a measure of familiarity with letters of the
alphabet. Students are presented with a page of upper- and lower-case letters arranged in a
stratified order and are asked to name as many letters as they can. Students are told that if they
do not know a letter, they will be told the letter. The student is allowed 1 minute to produce as
many letter names as s/he can, and the total DIBELS Next LNF score is equal to the number of
letters named correctly. LNF scores are not prorated. If a student finishes all of the LNF items on
the page before 1 minute has elapsed, they are instructed to stop, and their final score at
completion is recorded in to the DDS. If a student responds incorrectly to the first row of LNF
items (i.e., the first 10 letters), examiners are instructed to stop and to record a total score of 0 for
the measure. LNF is administered throughout kindergarten, and in the fall of grade 1.
Phoneme Segmentation Fluency (PSF). PSF is a test of phonemic awareness (Dynamic
Measurement Group, 2008; Good & Kaminski, 2002; Good & Kaminski, 2011; Kaminski &
Good, 1996) that assesses a student’s ability to fluently segment 3- and 4-phoneme words into
their individual phonemes. The examiner administers the PSF task by reading words aloud.
Students are required to say the individual phonemes in each presented word. For example, if the
DIBELS Next 2010-2011 Percentile Ranks 8
examiner says, “/sat/”, the student would say, “/s/ /a/ /t/” to receive a total of 3 points for the
word. After the student responds, the examiner presents the next word, and the total DIBELS
Next PSF score is the number of correct phonemes that the student says. PSF is administered
without prorating. If all of the PSF items are presented prior to the 1 minute timing, the final
score simply consists of the total number of correct phonemes in the child's response. If a student
produces 0 correct phonemes in the first 5 words, examiners are instructed to discontinue the
PSF task and record a total score of 0 for the student. This measure is administered in the winter
and spring of kindergarten, and in the fall of grade 1.
Nonsense Word Fluency (NWF). The NWF task measures knowledge of the alphabetic
principle—including both letter-sound correspondence and the ability to blend letters into words
in which letters represent their most common sounds (Kaminski & Good, 1996; Good &
Kaminski, 2002; Good & Kaminski, 2011). Students are presented with a page of stratified
vowel-consonant (VC) and consonant-vowel-consonant (CVC) nonsense words (e.g., sog, rav,
ov) and asked to: (a) say the individual letter sound of each letter, or (b) read the whole nonsense
word. For example, if the stimulus word is /sog/ the student could say "/s/ /o/ /g/" to obtain a
total of 3 letter sounds correct, or say the word "/sog/" to obtain a total of 3 letter sounds correct
and 1 whole word read. The student is allowed 1 minute to say as many letter-sounds as s/he can,
and the final DIBELS Next NWF score consists of two parts: (i) the number of letter-sounds
produced correctly (CLS) and (ii) the number of whole words read (WWR). NWF is not prorated
if the student finishes the entire form in less than 1 minute. The discontinue rule for NWF is
enforced for any student who produces 0 correct letter sounds in the first row (i.e. the first 5) of
items. Examiners are instructed to record a total score of 0 for both CLS and WWR for students
DIBELS Next 2010-2011 Percentile Ranks 9
who meet the discontinue rule. NWF is given in the winter and spring of kindergarten,
throughout grade 1, and in the fall of grade 2.
Oral Reading Fluency (ORF). ORF is a measure of accuracy and fluency with reading
connected text (Children's Educational Services, 1987; Good & Kaminski, 2011; Good,
Kaminski, & Dill, 2002). DIBELS Next ORF consists of a set of reading passages that were
calibrated to the goal level of reading for each grade and that follow standardized administration
procedures (Powell-Smith, Good, & Atkins, 2010). To obtain the benchmark score for ORF,
students are asked to read 3 passages aloud, for 1 minute each. Words omitted, substitutions, and
hesitations of more than 3 seconds are scored as errors. Words self-corrected within 3 seconds
are scored as correct. For benchmark assessments, the DIBELS Next ORF score is composed of
the median number of words (from the 3 passages) that are read correctly. The DIBELS Next
ORF errors score is also composed of the median number of errors made while reading (from the
3 passages). The median ORF and ORF errors score are used to compute the overall DIBELS
Next ORF reading accuracy score. The median scoring rule is true in all cases where students
have not met a specified discontinue rule. The discontinue rule for ORF is as follows: (a) if
students read 0 words correctly in the first row of the passage, examiners are to discontinue ORF
administration immediately and record a score of 0 words correct and the corresponding number
of errors as the student's score in the DDS; (b) if students read fewer than 10 words correctly in
the first passage, neither the second nor the third passage is to be administered. The final scores
for a student who met discontinue rule (b) are the number of words correct and the number of
errors from the first passage alone.
Like all other DIBELS Next measures, ORF is not prorated. Students who finish reading
the passage prior to 1 minute are instructed to stop reading, and their final score at completion is
DIBELS Next 2010-2011 Percentile Ranks 10
the score that is recorded in the DDS. ORF is administered in the winter and spring of grade 1,
and throughout grades 2-6.
Retell. The Retell measure provides a comprehension check for the ORF assessment
(Dynamic Measurement Group, 2008; Good & Kaminski, 2002; Good & Kaminski, 2011). It
takes approximately 1 minute to administer, and is given after each of the 3 ORF passages read
at benchmark—provided that a discontinue rule has not been met (i.e., students should read at
least 40 words correctly on the ORF passage in order to be administered Retell). After each
passage is read, the examiner asks the child to, “Tell me all that you can about what you just
read.” As in the case of the ORF and ORF errors scores, the final DIBELS Next Retell score is
composed of the median number of words in the child’s retell (from the 3 ORF passages) that are
related to the passage. In cases where the discontinue rule has been met (i.e., when students read
fewer than 40 words correct on an ORF passage), the DIBELS Next Retell score may consist of
the mean of 2 scores (when two Retells are administered) or a single score (when one Retell is
administered).
DIBELS-Maze (Daze). Daze is a measure of comprehension in which approximately
every 7th word of a passage has been deleted and replaced with a blank (Good et al., 2011;
McGraw, 2006). Students have 3 minutes to read the passage silently and complete the sentences
by circling one of the three word choices on the page. For each item, one of the words is the
correct choice and the other two words are distracters. Reading passages for Daze were
developed by a team of authors who were provided story ideas focused on careers and
geographic locations within the U.S. All passages were leveled by grade using the same
procedures used for the ORF passages. The final DIBELS Next Daze score is equal to the
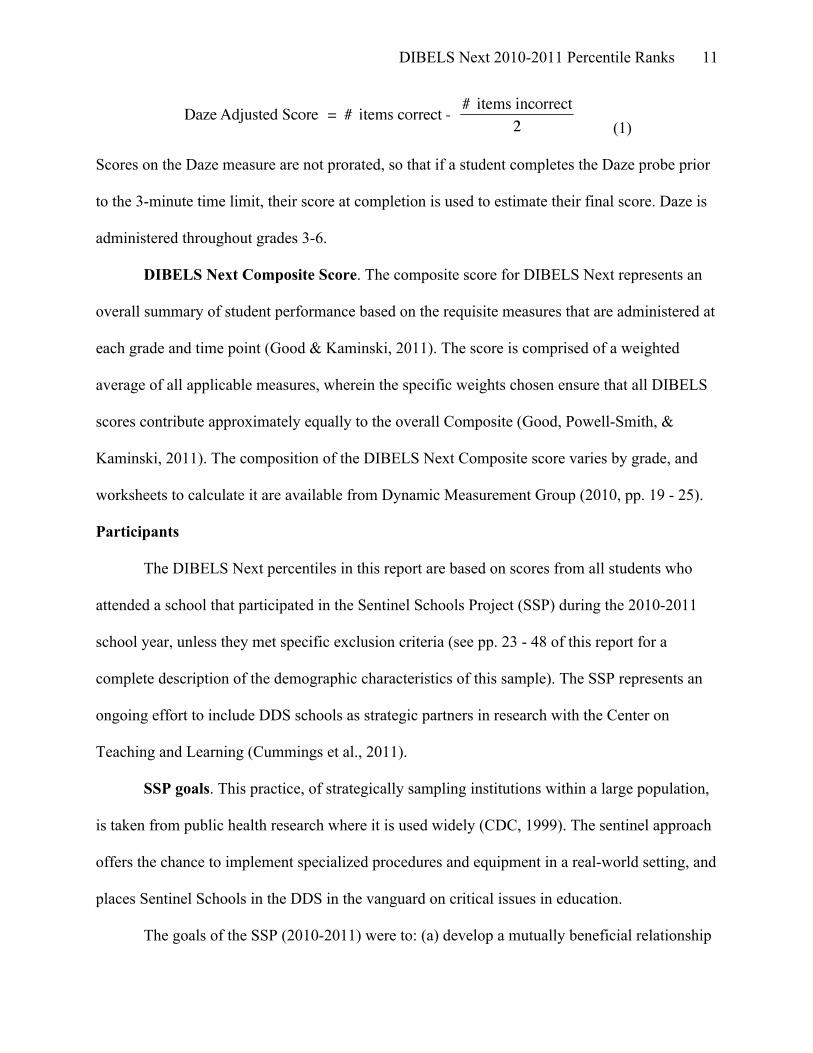
number of items correct adjusted for guessing, as illustrated in Formula 1.
DIBELS Next 2010-2011 Percentile Ranks 11
(1)
Scores on the Daze measure are not prorated, so that if a student completes the Daze probe prior
to the 3-minute time limit, their score at completion is used to estimate their final score. Daze is
administered throughout grades 3-6.
DIBELS Next Composite Score. The composite score for DIBELS Next represents an
overall summary of student performance based on the requisite measures that are administered at
each grade and time point (Good & Kaminski, 2011). The score is comprised of a weighted
average of all applicable measures, wherein the specific weights chosen ensure that all DIBELS
scores contribute approximately equally to the overall Composite (Good, Powell-Smith, &
Kaminski, 2011). The composition of the DIBELS Next Composite score varies by grade, and
worksheets to calculate it are available from Dynamic Measurement Group (2010, pp. 19 - 25).
Participants
The DIBELS Next percentiles in this report are based on scores from all students who
attended a school that participated in the Sentinel Schools Project (SSP) during the 2010-2011
school year, unless they met specific exclusion criteria (see pp. 23 - 48 of this report for a
complete description of the demographic characteristics of this sample). The SSP represents an
ongoing effort to include DDS schools as strategic partners in research with the Center on
Teaching and Learning (Cummings et al., 2011).
SSP goals. This practice, of strategically sampling institutions within a large population,
is taken from public health research where it is used widely (CDC, 1999). The sentinel approach
offers the chance to implement specialized procedures and equipment in a real-world setting, and
places Sentinel Schools in the DDS in the vanguard on critical issues in education.
The goals of the SSP (2010-2011) were to: (a) develop a mutually beneficial relationship
DIBELS Next 2010-2011 Percentile Ranks 12
with a network of schools that are representative of the variation in contexts, student populations,
and teaching staff in U.S. schools, and (b) leverage that relationship to inform and improve
assessment and instructional practices. We chose to use only the SSP schools in the analyses of
system-wide percentiles for DIBELS Next because we have greater knowledge of the assessment
and instructional practices in those schools. This consideration was particularly important
because the DIBELS Next measures were used for the first time, wide-scale, during the 2010-
2011 school year. All SSP schools reported their fidelity of assessment practices with DIBELS
Next (Smith et al., 2011). Approximately 35% (N = 28) of SSP schools also collected delayed
alternate-form reliability checks for all DIBELS Next measures during their winter assessment,
and received additional training on appropriate administration and scoring rules (Cummings et
al., 2011).
Selection criteria—school level. Students were included in the percentiles sample if:
(a) we could identify the National Center for Education Statistics (NCES, 2011) identification
number for their school; and (b) we had access to the most recent (2009-2010) NCES data for
their school. These two criteria are essential, so that we can describe characteristics of
participating schools using NCES data and compare them to schools not included in the sample.
Because NCES data for private schools had not been released at the time this report was written,
the percentiles in this report include only students who attended U.S. public schools. Of the 84
schools that participated in the SSP project, four were private schools and one school did not
have an NCES identification number. These five schools, representing 852 students, were
excluded from the percentile calculations in this report.
Selection criteria—student level. In addition to the above school-level criteria, we also
excluded individual scores if they exceeded the maximum possible number of items on the probe
DIBELS Next 2010-2011 Percentile Ranks 13
(i.e., we assumed that DIBELS Next scores were not prorated nor were any of the measures
repeated). This criterion was included due to inconsistencies in the way schools administer and
score assessments, and to eliminate extreme data points that are possibly due to random data
entry errors. Composite scores were excluded if scores on any of the component measures
exceeded the maximum possible score. We also screened out scores that were not possible given
students’ pattern of performance on other measures (i.e., bivariate illegal values).
Nonsense Word Fluency (NWF). We excluded score pairs (i.e., bivariate illegal values) on
the NWF measure if either the Correct Letter Sounds (CLS) score was missing, or if the Whole
Words Read (WWR) score was greater than half of the CLS score. For example, if a student had
a WWR score of 8 and a CLS score that was less than or equal to 15, both scores were excluded
from further analysis.
Oral Reading Fluency (ORF). Values for the ORF-errors score were excluded if the
corresponding ORF score was missing. ORF-accuracy scores were not calculated if either the
ORF or the ORF-error scores were missing.
Daze. We excluded Daze-error scores if the corresponding Daze Raw score was missing. We
did not calculate Daze Adjusted scores if either the Daze or Daze Error scores were missing.
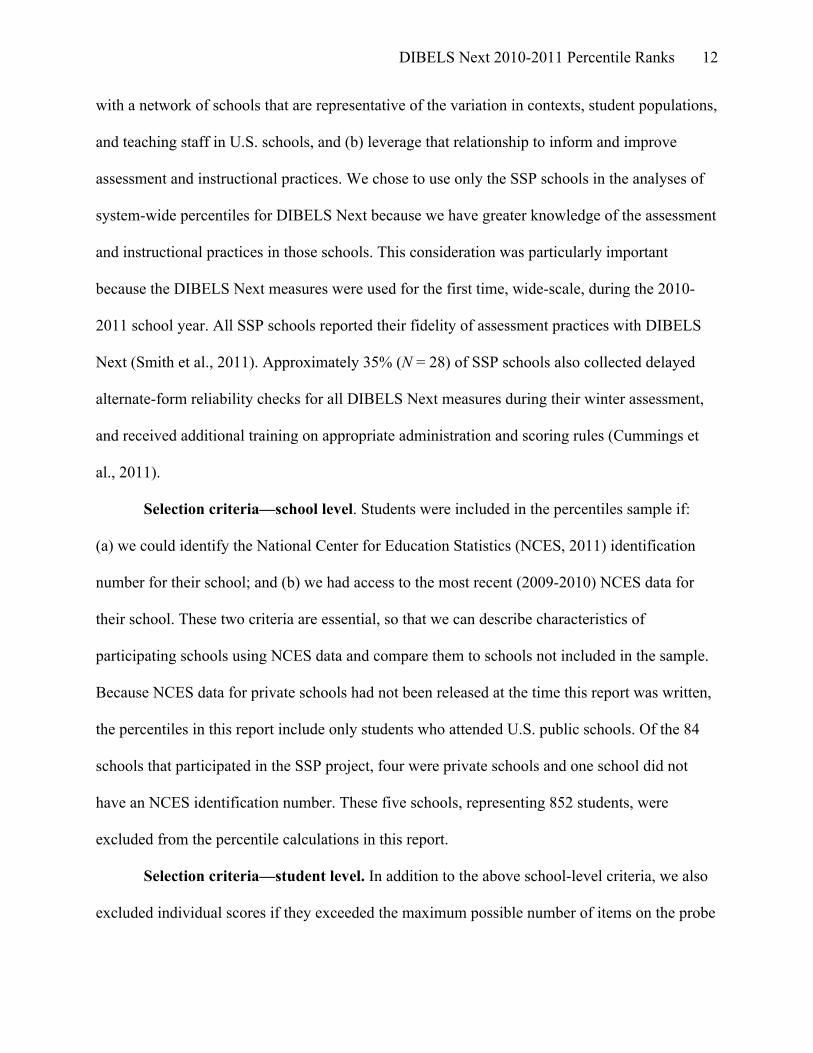
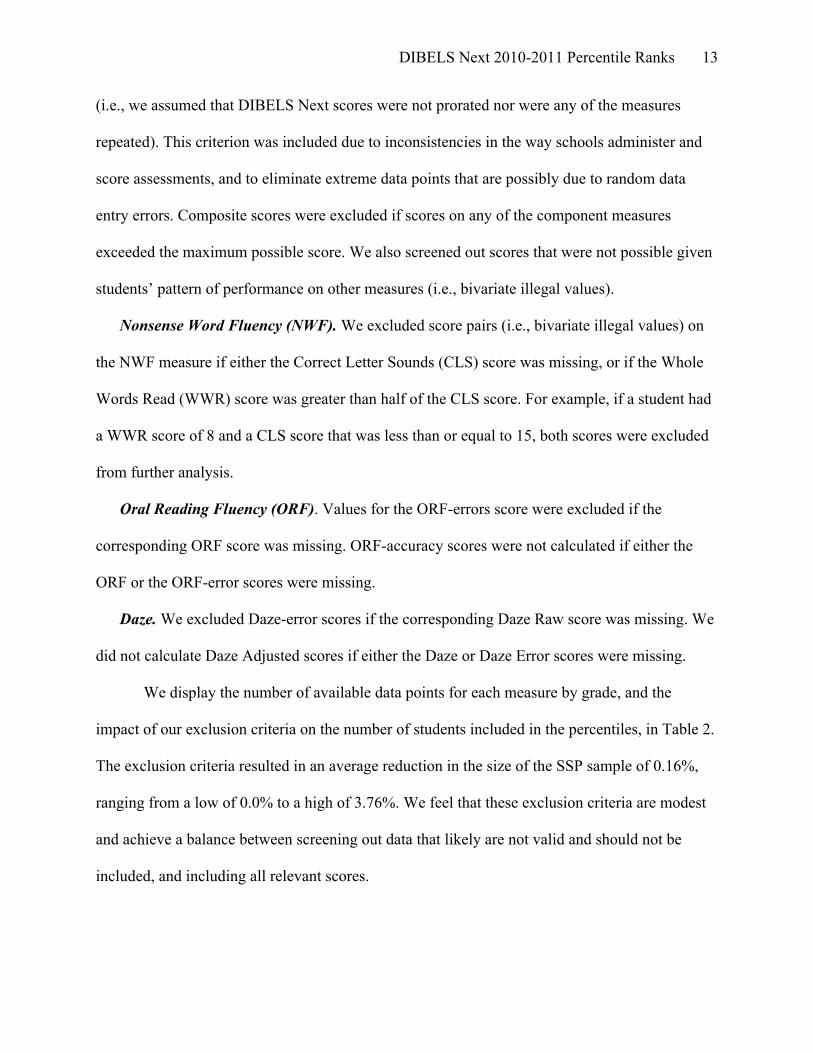
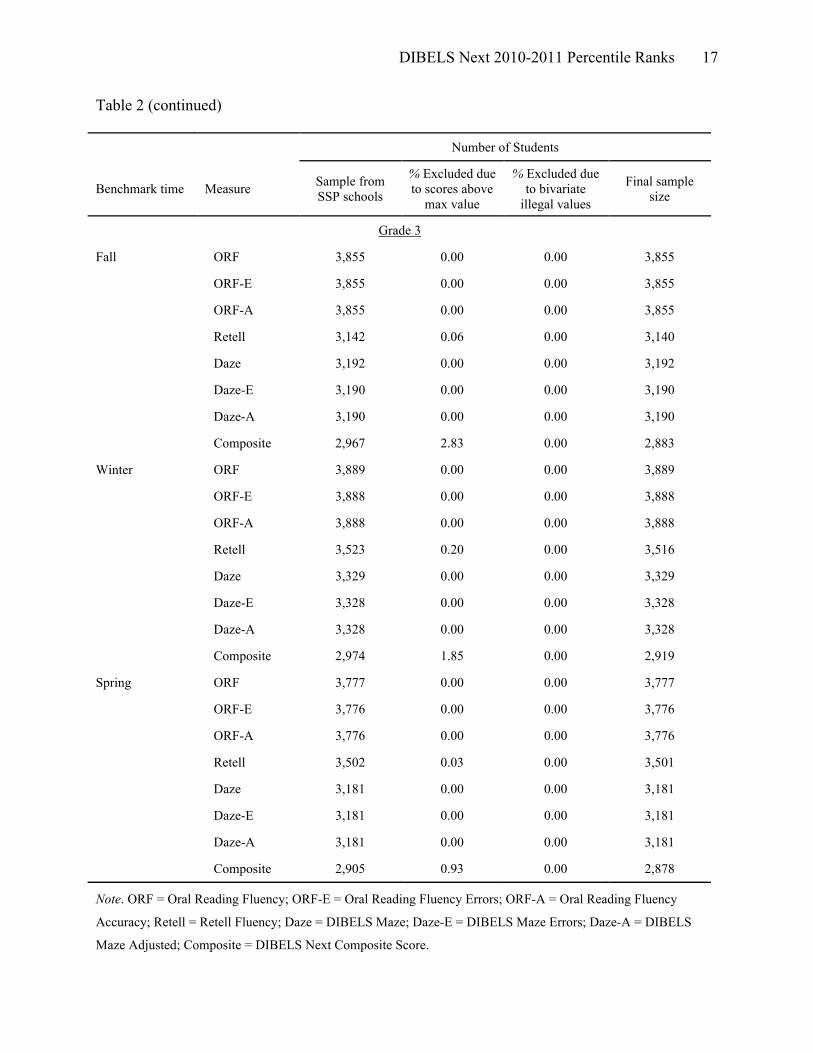
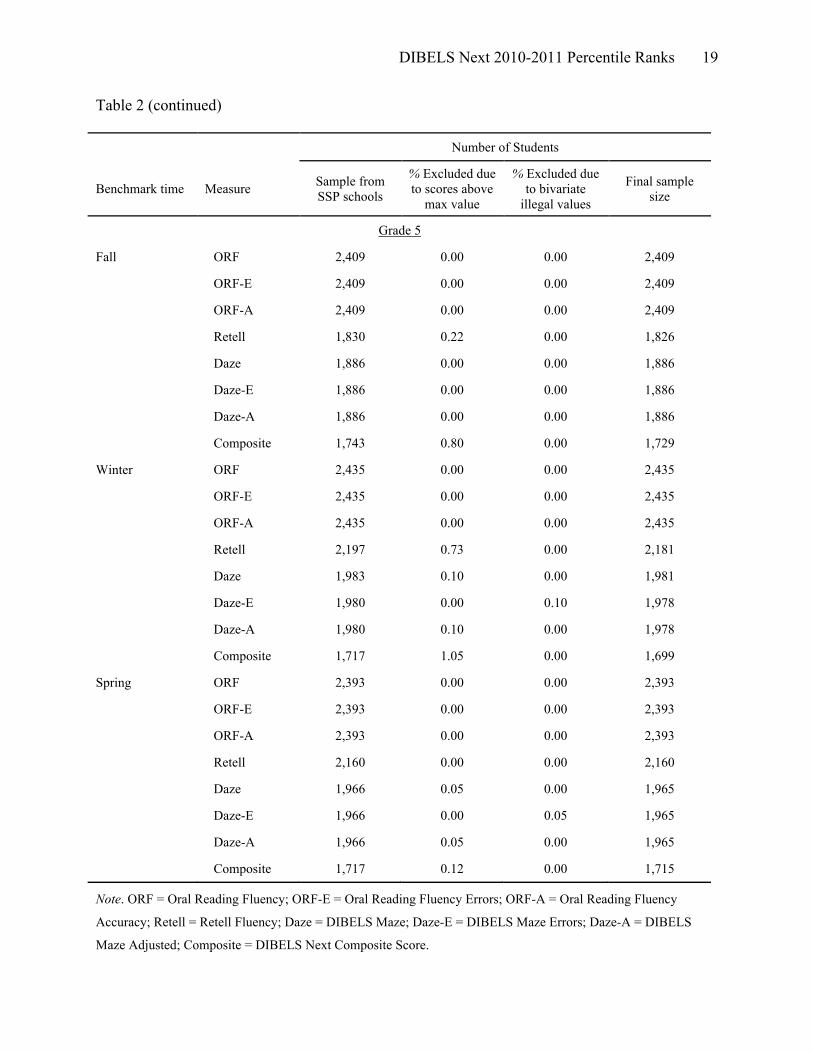
We display the number of available data points for each measure by grade, and the
impact of our exclusion criteria on the number of students included in the percentiles, in Table 2.
The exclusion criteria resulted in an average reduction in the size of the SSP sample of 0.16%,
ranging from a low of 0.0% to a high of 3.76%. We feel that these exclusion criteria are modest
and achieve a balance between screening out data that likely are not valid and should not be
included, and including all relevant scores.
DIBELS Next 2010-2011 Percentile Ranks 14
Table 2
Effect of Selection Criteria on Sample Size
Note. FSF = First Sound Fluency; LNF = Letter Naming Fluency; Composite = DIBELS Next Composite Score;
PSF = Phoneme Segmentation Fluency; CLS = Nonsense Word Fluency Correct Letter Sounds; WWR = Nonsense
Word Fluency Whole Words Read.
Number of Students
Benchmark time Measure Sample from SSP schools
% Excluded due to scores above
max value
% Excluded due to bivariate
illegal values
Final sample size
Kindergarten
Fall FSF 4,499 0.00 0.00 4,499
LNF 4,498 0.00 0.00 4,498
Composite 4,498 0.00 0.00 4,498
Winter FSF 4,605 0.00 0.00 4,605
LNF 4,605 0.00 0.00 4,605
PSF 4,605 0.04 0.00 4,603
CLS 4,604 0.00 0.00 4,604
WWR 4,409 0.00 0.20 4,400
Composite 4,604 0.04 0.00 4,602
Spring LNF 4,459 0.00 0.00 4,459
PSF 4,459 0.07 0.00 4,456
CLS 4,460 0.00 0.00 4,460
WWR 4,431 0.00 0.11 4,426
Composite 4,458 0.07 0.00 4,455

DIBELS Next 2010-2011 Percentile Ranks 15
Table 2 (continued)
Note. LNF = Letter Naming Fluency; PSF = Phoneme Segmentation Fluency; CLS = Nonsense Word Fluency
Correct Letter Sounds; WWR = Nonsense Word Fluency Whole Words Read; Composite = DIBELS Next
Composite Score; ORF = Oral Reading Fluency; ORF-E = Oral Reading Fluency Errors; ORF-A = Oral Reading
Fluency Accuracy; Retell = Retell Fluency.
Number of Students
Benchmark time Measure Sample from SSP schools
% Excluded due to scores above
max value
% Excluded due to bivariate
illegal values
Final sample size
Grade 1
Fall LNF 4,555 0.00 0.00 4,555
PSF 4,555 0.00 0.00 4,555
CLS 4,554 0.00 0.00 4,554
WWR 4,432 0.00 0.16 4,425
Composite 4,553 0.00 0.00 4,553
Winter CLS 4,629 0.00 0.00 4,629
WWR 4,620 0.00 0.15 4,613
ORF 4,612 0.00 0.00 4,612
ORF-E 4,601 0.00 0.00 4,601
ORF-A 4,601 0.00 0.00 4,601
Retell 3,250 0.03 0.00 3,249
Composite 4,592 0.00 0.15 4,585
Spring CLS 4,496 0.00 0.00 4,496
WWR 4,496 0.00 0.13 4,490
ORF 4,495 0.00 0.00 4,495
ORF-E 4,493 0.00 0.00 4,493
ORF-A 4,493 0.00 0.00 4,493
Retell 3,860 0.00 0.00 3,860
Composite 4,491 0.00 0.13 4,485
DIBELS Next 2010-2011 Percentile Ranks 16
Table 2 (continued)
Note. CLS = Nonsense Word Fluency Correct Letter Sounds; WWR = Nonsense Word Fluency Whole Words Read;
Composite = DIBELS Next Composite Score; ORF = Oral Reading Fluency; ORF-E = Oral Reading Fluency
Errors; ORF-A = Oral Reading Fluency Accuracy; Retell = Retell Fluency.
Number of Students
Benchmark time Measure Sample from SSP schools
% Excluded due to scores above
max value
% Excluded due to bivariate
illegal values
Final sample size
Grade 2
Fall CLS 4,235 0.00 0.00 4,235
WWR 4,235 0.00 0.31 4,222
ORF 4,231 0.00 0.00 4,231
ORF-E 4,227 0.00 0.00 4,227
ORF-A 4,227 0.00 0.00 4,227
Retell 3,385 0.03 0.00 3,384
Composite 4,217 0.00 0.31 4,204
Winter ORF 4,311 0.00 0.00 4,311
ORF-E 4,309 0.00 0.00 4,309
ORF-A 4,309 0.00 0.00 4,309
Retell 3,871 0.15 0.00 3,865
Composite 4,014 3.76 0.00 3,863
Spring ORF 4,176 0.00 0.00 4,176
ORF-E 4,175 0.00 0.00 4,175
ORF-A 4,175 0.00 0.00 4,175
Retell 3,866 0.00 0.00 3,866
Composite 3,944 1.98 0.00 3,866
DIBELS Next 2010-2011 Percentile Ranks 17
Table 2 (continued)
Note. ORF = Oral Reading Fluency; ORF-E = Oral Reading Fluency Errors; ORF-A = Oral Reading Fluency
Accuracy; Retell = Retell Fluency; Daze = DIBELS Maze; Daze-E = DIBELS Maze Errors; Daze-A = DIBELS
Maze Adjusted; Composite = DIBELS Next Composite Score.
Number of Students
Benchmark time Measure Sample from SSP schools
% Excluded due to scores above
max value
% Excluded due to bivariate
illegal values
Final sample size
Grade 3
Fall ORF 3,855 0.00 0.00 3,855
ORF-E 3,855 0.00 0.00 3,855
ORF-A 3,855 0.00 0.00 3,855
Retell 3,142 0.06 0.00 3,140
Daze 3,192 0.00 0.00 3,192
Daze-E 3,190 0.00 0.00 3,190
Daze-A 3,190 0.00 0.00 3,190
Composite 2,967 2.83 0.00 2,883
Winter ORF 3,889 0.00 0.00 3,889
ORF-E 3,888 0.00 0.00 3,888
ORF-A 3,888 0.00 0.00 3,888
Retell 3,523 0.20 0.00 3,516
Daze 3,329 0.00 0.00 3,329
Daze-E 3,328 0.00 0.00 3,328
Daze-A 3,328 0.00 0.00 3,328
Composite 2,974 1.85 0.00 2,919
Spring ORF 3,777 0.00 0.00 3,777
ORF-E 3,776 0.00 0.00 3,776
ORF-A 3,776 0.00 0.00 3,776
Retell 3,502 0.03 0.00 3,501
Daze 3,181 0.00 0.00 3,181
Daze-E 3,181 0.00 0.00 3,181
Daze-A 3,181 0.00 0.00 3,181
Composite 2,905 0.93 0.00 2,878

DIBELS Next 2010-2011 Percentile Ranks 18
Table 2 (continued)
Note. ORF = Oral Reading Fluency; ORF-E = Oral Reading Fluency Errors; ORF-A = Oral Reading Fluency
Accuracy; Retell = Retell Fluency; Daze = DIBELS Maze; Daze-E = DIBELS Maze Errors; Daze-A = DIBELS
Maze Adjusted; Composite = DIBELS Next Composite Score.
Number of Students
Benchmark time Measure Sample from SSP schools
% Excluded due to scores above
max value
% Excluded due to bivariate
illegal values
Final sample size
Grade 4
Fall ORF 3,772 0.00 0.00 3,772
ORF-E 3,670 0.00 0.00 3,670
ORF-A 3,670 0.00 0.00 3,670
Retell 3,116 0.19 0.00 3,110
Daze 3,129 0.00 0.00 3,129
Daze-E 3,127 0.00 0.00 3,127
Daze-A 3,127 0.00 0.00 3,127
Composite 2,912 1.51 0.00 2,868
Winter ORF 3,840 0.00 0.00 3,840
ORF-E 3,732 0.00 0.00 3,732
ORF-A 3,732 0.00 0.00 3,732
Retell 3,497 0.20 0.00 3,490
Daze 3,286 0.00 0.00 3,286
Daze-E 3,284 0.00 0.00 3,284
Daze-A 3,284 0.00 0.00 3,284
Composite 2,912 0.89 0.00 2,886
Spring ORF 3,648 0.00 0.00 3,648
ORF-E 3,648 0.00 0.00 3,648
ORF-A 3,648 0.00 0.00 3,648
Retell 3,397 0.00 0.00 3,397
Daze 3,117 0.13 0.00 3,113
Daze-E 3,117 0.00 0.13 3,113
Daze-A 3,117 0.13 0.00 3,113
Composite 2,835 0.46 0.00 2,822
DIBELS Next 2010-2011 Percentile Ranks 19
Table 2 (continued)
Note. ORF = Oral Reading Fluency; ORF-E = Oral Reading Fluency Errors; ORF-A = Oral Reading Fluency
Accuracy; Retell = Retell Fluency; Daze = DIBELS Maze; Daze-E = DIBELS Maze Errors; Daze-A = DIBELS
Maze Adjusted; Composite = DIBELS Next Composite Score.
Number of Students
Benchmark time Measure Sample from SSP schools
% Excluded due to scores above
max value
% Excluded due to bivariate
illegal values
Final sample size
Grade 5
Fall ORF 2,409 0.00 0.00 2,409
ORF-E 2,409 0.00 0.00 2,409
ORF-A 2,409 0.00 0.00 2,409
Retell 1,830 0.22 0.00 1,826
Daze 1,886 0.00 0.00 1,886
Daze-E 1,886 0.00 0.00 1,886
Daze-A 1,886 0.00 0.00 1,886
Composite 1,743 0.80 0.00 1,729
Winter ORF 2,435 0.00 0.00 2,435
ORF-E 2,435 0.00 0.00 2,435
ORF-A 2,435 0.00 0.00 2,435
Retell 2,197 0.73 0.00 2,181
Daze 1,983 0.10 0.00 1,981
Daze-E 1,980 0.00 0.10 1,978
Daze-A 1,980 0.10 0.00 1,978
Composite 1,717 1.05 0.00 1,699
Spring ORF 2,393 0.00 0.00 2,393
ORF-E 2,393 0.00 0.00 2,393
ORF-A 2,393 0.00 0.00 2,393
Retell 2,160 0.00 0.00 2,160
Daze 1,966 0.05 0.00 1,965
Daze-E 1,966 0.00 0.05 1,965
Daze-A 1,966 0.05 0.00 1,965
Composite 1,717 0.12 0.00 1,715

DIBELS Next 2010-2011 Percentile Ranks 20
Table 2 (continued)
Note. ORF = Oral Reading Fluency; ORF-E = Oral Reading Fluency Errors; ORF-A = Oral Reading Fluency
Accuracy; Retell = Retell Fluency; Daze = DIBELS Maze; Daze-E = DIBELS Maze Errors; Daze-A = DIBELS
Maze Adjusted; Composite = DIBELS Next Composite Score.
Number of Students
Benchmark time Measure Sample from SSP schools
% Excluded due to scores above
max value
% Excluded due to bivariate
illegal values
Final sample size
Grade 6
Fall ORF 1,456 0.00 0.00 1,456
ORF-E 1,453 0.00 0.00 1,453
ORF-A 1,453 0.00 0.00 1,453
Retell 1,078 0.19 0.00 1,076
Daze 1,081 0.00 0.00 1,081
Daze-E 1,081 0.00 0.00 1,081
Daze-A 1,081 0.00 0.00 1,081
Composite 1,076 0.28 0.00 1,073
Winter ORF 1,485 0.00 0.00 1,485
ORF-E 1,485 0.00 0.00 1,485
ORF-A 1,485 0.00 0.00 1,485
Retell 1,453 1.10 0.00 1,437
Daze 1,183 0.00 0.00 1,183
Daze-E 1,183 0.00 0.00 1,183
Daze-A 1,183 0.00 0.00 1,183
Composite 1,091 1.28 0.00 1,077
Spring ORF 1,484 0.00 0.00 1,484
ORF-E 1,484 0.00 0.00 1,484
ORF-A 1,484 0.00 0.00 1,484
Retell 1,449 0.00 0.00 1,449
Daze 1,181 0.00 0.00 1,181
Daze-E 1,180 0.00 0.00 1,180
Daze-A 1,180 0.00 0.00 1,180
Composite 1,100 0.00 0.00 1,100
DIBELS Next 2010-2011 Percentile Ranks 21
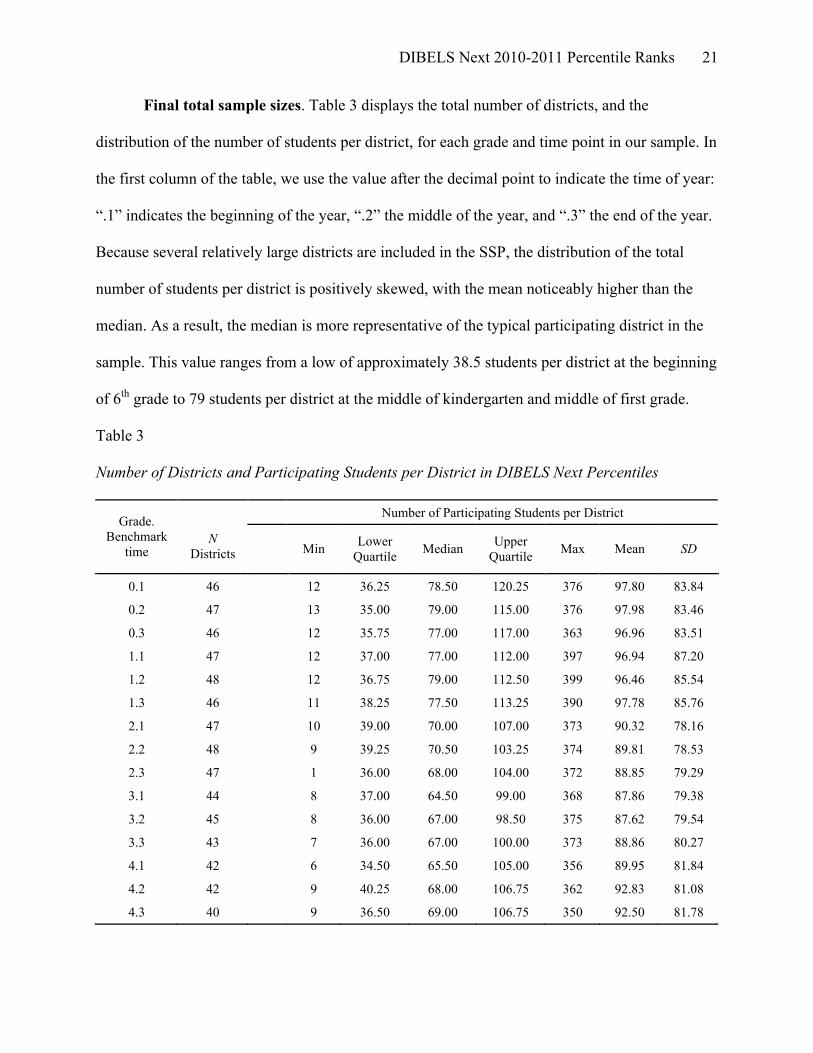
Final total sample sizes. Table 3 displays the total number of districts, and the
distribution of the number of students per district, for each grade and time point in our sample. In
the first column of the table, we use the value after the decimal point to indicate the time of year:
“.1” indicates the beginning of the year, “.2” the middle of the year, and “.3” the end of the year.
Because several relatively large districts are included in the SSP, the distribution of the total
number of students per district is positively skewed, with the mean noticeably higher than the
median. As a result, the median is more representative of the typical participating district in the
sample. This value ranges from a low of approximately 38.5 students per district at the beginning
of 6th grade to 79 students per district at the middle of kindergarten and middle of first grade.
Table 3
Number of Districts and Participating Students per District in DIBELS Next Percentiles
Number of Participating Students per District Grade. Benchmark
time
N
Districts Min Lower Quartile Median Upper
Quartile Max Mean SD
0.1 46 12 36.25 78.50 120.25 376 97.80 83.84
0.2 47 13 35.00 79.00 115.00 376 97.98 83.46
0.3 46 12 35.75 77.00 117.00 363 96.96 83.51
1.1 47 12 37.00 77.00 112.00 397 96.94 87.20
1.2 48 12 36.75 79.00 112.50 399 96.46 85.54
1.3 46 11 38.25 77.50 113.25 390 97.78 85.76
2.1 47 10 39.00 70.00 107.00 373 90.32 78.16
2.2 48 9 39.25 70.50 103.25 374 89.81 78.53
2.3 47 1 36.00 68.00 104.00 372 88.85 79.29
3.1 44 8 37.00 64.50 99.00 368 87.86 79.38
3.2 45 8 36.00 67.00 98.50 375 87.62 79.54
3.3 43 7 36.00 67.00 100.00 373 88.86 80.27
4.1 42 6 34.50 65.50 105.00 356 89.95 81.84
4.2 42 9 40.25 68.00 106.75 362 92.83 81.08
4.3 40 9 36.50 69.00 106.75 350 92.50 81.78
DIBELS Next 2010-2011 Percentile Ranks 22
Table 3 (continued)
Number of Participating Students per District Grade. Benchmark
time
N
Districts Min Lower Quartile Median Upper
Quartile Max Mean SD
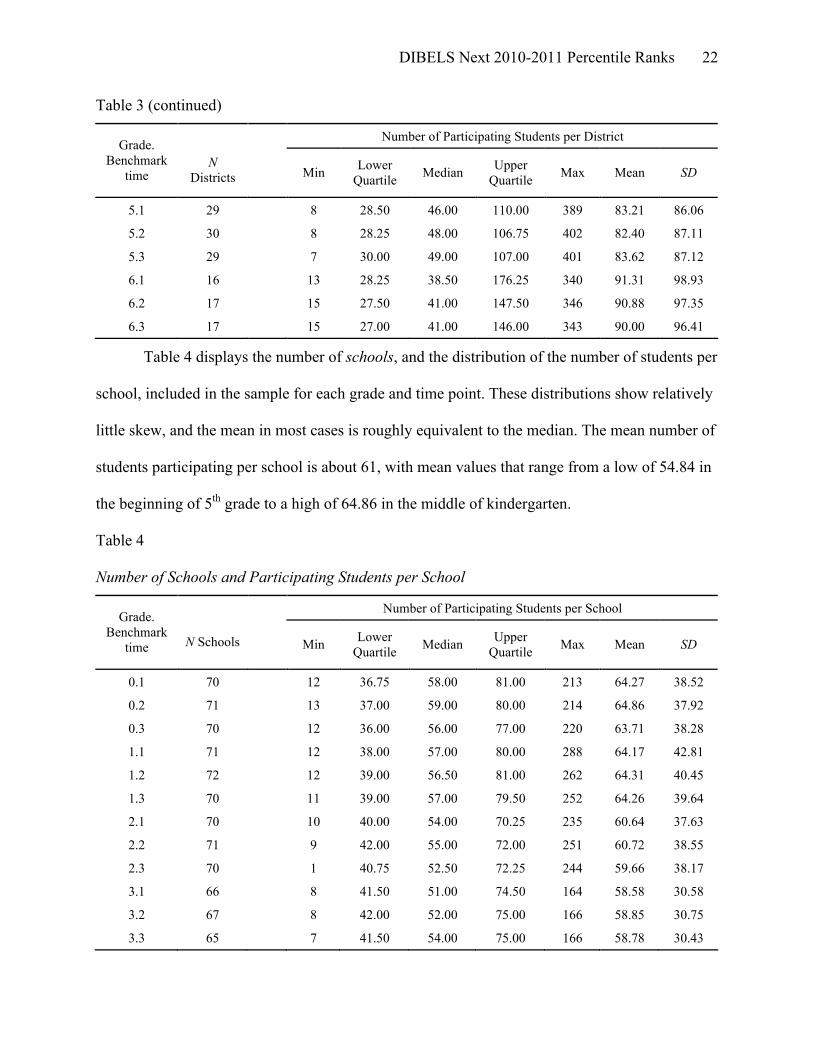
5.1 29 8 28.50 46.00 110.00 389 83.21 86.06
5.2 30 8 28.25 48.00 106.75 402 82.40 87.11
5.3 29 7 30.00 49.00 107.00 401 83.62 87.12
6.1 16 13 28.25 38.50 176.25 340 91.31 98.93
6.2 17 15 27.50 41.00 147.50 346 90.88 97.35
6.3 17 15 27.00 41.00 146.00 343 90.00 96.41
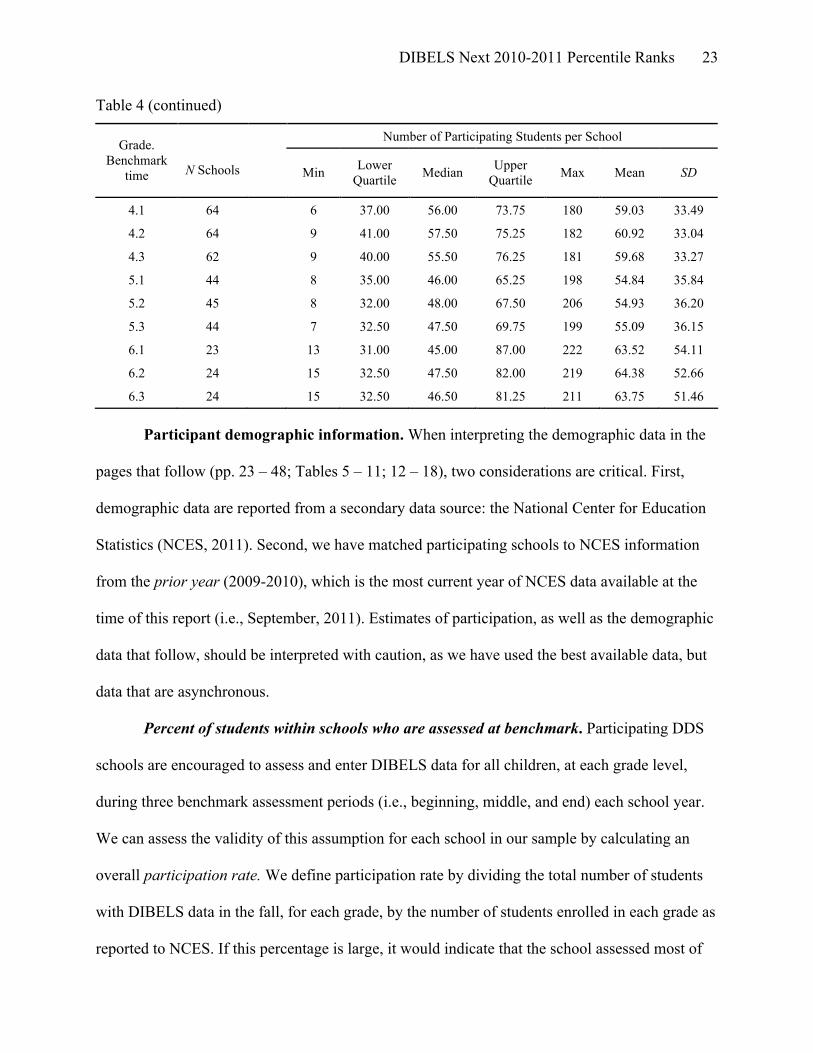
Table 4 displays the number of schools, and the distribution of the number of students per
school, included in the sample for each grade and time point. These distributions show relatively
little skew, and the mean in most cases is roughly equivalent to the median. The mean number of
students participating per school is about 61, with mean values that range from a low of 54.84 in
the beginning of 5th grade to a high of 64.86 in the middle of kindergarten.
Table 4
Number of Schools and Participating Students per School
Number of Participating Students per School Grade. Benchmark
time
N Schools Min Lower
Quartile Median Upper Quartile Max Mean SD
0.1 70 12 36.75 58.00 81.00 213 64.27 38.52
0.2 71 13 37.00 59.00 80.00 214 64.86 37.92
0.3 70 12 36.00 56.00 77.00 220 63.71 38.28
1.1 71 12 38.00 57.00 80.00 288 64.17 42.81
1.2 72 12 39.00 56.50 81.00 262 64.31 40.45
1.3 70 11 39.00 57.00 79.50 252 64.26 39.64
2.1 70 10 40.00 54.00 70.25 235 60.64 37.63
2.2 71 9 42.00 55.00 72.00 251 60.72 38.55
2.3 70 1 40.75 52.50 72.25 244 59.66 38.17
3.1 66 8 41.50 51.00 74.50 164 58.58 30.58
3.2 67 8 42.00 52.00 75.00 166 58.85 30.75
3.3 65 7 41.50 54.00 75.00 166 58.78 30.43
DIBELS Next 2010-2011 Percentile Ranks 23
Table 4 (continued)
Number of Participating Students per School Grade. Benchmark
time
N Schools Min Lower
Quartile Median Upper Quartile Max Mean SD
4.1 64 6 37.00 56.00 73.75 180 59.03 33.49
4.2 64 9 41.00 57.50 75.25 182 60.92 33.04
4.3 62 9 40.00 55.50 76.25 181 59.68 33.27
5.1 44 8 35.00 46.00 65.25 198 54.84 35.84
5.2 45 8 32.00 48.00 67.50 206 54.93 36.20
5.3 44 7 32.50 47.50 69.75 199 55.09 36.15
6.1 23 13 31.00 45.00 87.00 222 63.52 54.11
6.2 24 15 32.50 47.50 82.00 219 64.38 52.66
6.3 24 15 32.50 46.50 81.25 211 63.75 51.46
Participant demographic information. When interpreting the demographic data in the
pages that follow (pp. 23 – 48; Tables 5 – 11; 12 – 18), two considerations are critical. First,
demographic data are reported from a secondary data source: the National Center for Education
Statistics (NCES, 2011). Second, we have matched participating schools to NCES information
from the prior year (2009-2010), which is the most current year of NCES data available at the
time of this report (i.e., September, 2011). Estimates of participation, as well as the demographic
data that follow, should be interpreted with caution, as we have used the best available data, but
data that are asynchronous.
Percent of students within schools who are assessed at benchmark. Participating DDS
schools are encouraged to assess and enter DIBELS data for all children, at each grade level,
during three benchmark assessment periods (i.e., beginning, middle, and end) each school year.
We can assess the validity of this assumption for each school in our sample by calculating an
overall participation rate. We define participation rate by dividing the total number of students
with DIBELS data in the fall, for each grade, by the number of students enrolled in each grade as
reported to NCES. If this percentage is large, it would indicate that the school assessed most of
DIBELS Next 2010-2011 Percentile Ranks 24
their students, at all ranges of skill level. If the percentage is low, schools may be selecting only
certain subgroups of students to test. Recall that, in our sample, enrollment numbers are reported
for 2009-2010, while DIBELS Next data were collected in 2010-2011. Fluctuations in yearly
enrollment numbers can drastically impact these percentages, particularly in small schools.
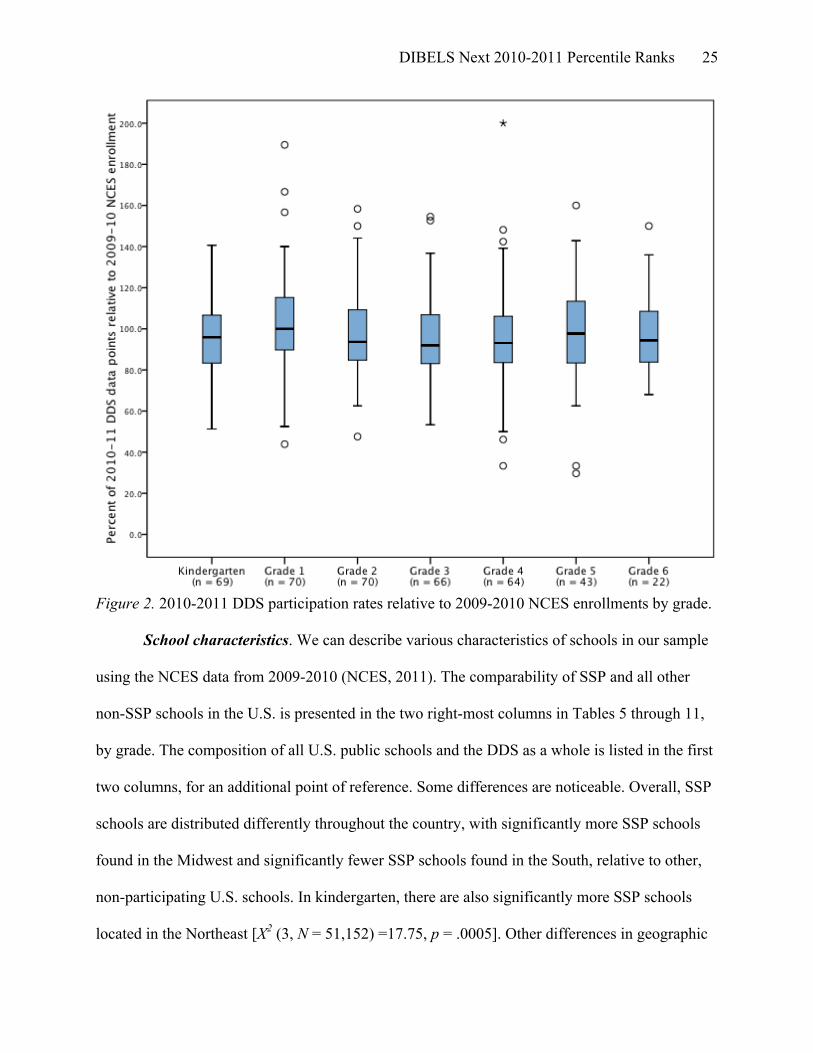
We defined the number of students assessed with DIBELS Next as the total number of
students with entered fall data for LNF in grade K, CLS in grade 1, and ORF in grades 2 – 6. We
elected to use the number of fall data points because NCES enrollment numbers are also reported
as of October 1st of each school year. With these considerations, we determined the median
student participation rate at 97% (range = 51% – 123%). Figure 2 shows box plots of these
participation rates for each grade.
As a second estimate of school-level participation in the DDS, we report data from an
Assessment Fidelity survey (see Smith et al., 2011 for a complete description of the survey and
all results) that was completed by the assessment coordinator at each participating Sentinel
School after fall benchmark data collection in 2010. According to these survey results, 97% of
schools report administering DIBELS at benchmark to all students in participating grades,
including students with IEPs. Of the two schools that report some level of exclusionary criteria,
one school reported that they excluded some students with IEPs (percentage not specified). The
second school reported that they excluded a portion of their English Learners in grades k – 2
(i.e., range = 20 – 50%), but no students with IEPs were excluded. Future research is needed to
examine the viability of both the survey approach and the NCES calculation procedure for
estimating participation rates at the school level (see Cummings, Otterstedt, Kennedy, Baker, &
Kame'enui, 2011 for a description of decision rules using NCES estimates of DDS participation
rates with DIBELS 6th edition data).
DIBELS Next 2010-2011 Percentile Ranks 25
Figure 2. 2010-2011 DDS participation rates relative to 2009-2010 NCES enrollments by grade.
School characteristics. We can describe various characteristics of schools in our sample
using the NCES data from 2009-2010 (NCES, 2011). The comparability of SSP and all other
non-SSP schools in the U.S. is presented in the two right-most columns in Tables 5 through 11,
by grade. The composition of all U.S. public schools and the DDS as a whole is listed in the first
two columns, for an additional point of reference. Some differences are noticeable. Overall, SSP
schools are distributed differently throughout the country, with significantly more SSP schools
found in the Midwest and significantly fewer SSP schools found in the South, relative to other,
non-participating U.S. schools. In kindergarten, there are also significantly more SSP schools
located in the Northeast [X2 (3, N = 51,152) =17.75, p = .0005]. Other differences in geographic
DIBELS Next 2010-2011 Percentile Ranks 26
location exist, but vary by grade. Additional school characteristics, such as location relative to
population centers and school type, are also presented in the tables that follow. Overall, it
appears that SSP schools are found in more rural areas. In grades k – 2, SSP schools are very
similar to all other non-SSP schools in the U.S. based on their Schoolwide Title I eligibility1
(Mdn = 57% eligible for SSP schools; 55% eligible for non-SSP schools). In grades 3 – 6, SSP
schools have larger Schoolwide Title I percentages than other non-SSP schools in the country
(Mdn= 64% eligible for SSP schools; 55% eligible for non-SSP schools).
SSP schools display some marked differences from U.S. public schools in terms of race
and ethnicity. One particularly noticeable difference is that, on average, SSP schools report a
higher percentage of White students 2(70.7% White) compared with other, non-SSP U.S. schools
(54.5% White). This difference results in a medium effect size (.46) using Cohen's (1992)
standards. Data regarding other similarities and differences between SSP, DDS, and U.S. public
schools in terms of gender, race/ethnicity, and student-to-teacher ratio are reported for each
grade in Tables 12 through 18.
1 Title 1 provides financial assistance to local educational agencies and schools with high numbers or high percentages of children from low-income families to help ensure that all children meet challenging state academic standards http://www2.ed.gov/programs/titleiparta/index.html. 2 The example presented here is based on the respective percentages in kindergarten, however the pattern of a greater number of White students in SSP schools compared with non-SSP schools hold true across all grades 1-6.

DIBELS Next 2010-2011 Percentile Ranks 27
Table 5
Characteristics of Schools with Kindergarten Students Included in DIBELS Next Percentiles
Compared to Public Schools in the U.S. and in the DIBELS Data System (DDS): Summary of
2009-2010 National Center for Education Statistics (NCES) Data
NCES: All Public Schools Offering
Kindergarten (n=51,151)
DDS: Public Schools with Kindergarten
Data (n = 9,798)
SSP: Public Schools with Kindergarten Data (n=71)
NCES: Non-SSP Public Schools
Offering Kindergarten (n=51,081)
Geographic Region
Northeast 15.90 16.02 21.13 15.89
Midwest 25.01 25.76 40.85 24.99
South 33.82 28.04 12.68 33.85
West 25.27 30.18 25.35 25.27
Location relative to population centers
City, Large 15.22 8.70 5.63 15.24
City, Midsize 6.47 4.97 0.00 6.48
City, Small 7.49 6.89 11.27 7.48
Suburb, Large 24.37 22.73 8.45 24.39
Suburb, Midsize 2.85 2.63 5.63 2.84
Suburb, Small 1.88 1.82 1.41 1.89
Town, Fringe 1.57 2.13 0.00 1.57
Town, Distant 5.61 7.01 15.49 5.59
Town, Remote 3.73 5.99 7.04 3.73
Rural, Fringe 12.06 12.92 21.13 12.04
Rural, Distant 11.71 15.35 19.72 11.70
Rural, Remote 6.76 8.72 4.23 6.76
Schoolwide Title 1 Eligible 55.10 56.10 56.34 55.10
Charter School 5.09 3.20 2.82 5.09
Type
Regular school 98.20 99.40 98.59 98.20
Special Education school 0.99 0.13 1.41 0.99
Vocational education school 0.02 0.01 0.00 0.02
Alternative/other school 0.79 0.46 0.00 0.79
Note. All reported values are expressed as percentages. Data source: NCES (2011).

DIBELS Next 2010-2011 Percentile Ranks 28
Table 6
Characteristics of Schools with Grade 1 Students Included in DIBELS Next Percentiles
Compared to Public Schools in the U.S. and in the DIBELS Data System (DDS): Summary of
2009-2010 National Center for Education Statistics (NCES) Data
NCES: All Public Schools Offering
Grade 1 (n=51,819)
DDS: Public Schools with Grade 1 Data (n = 10,160)
SSP: Public Schools with Grade 1 Data
(n=72)
NCES: Non-SSP Public Schools
Offering Grade 1 (n=51,748)
Geographic Region
Northeast 16.01 15.72 20.83 16.01
Midwest 25.13 26.97 40.28 25.11
South 33.73 27.25 12.50 33.76
West 25.12 30.06 26.39 25.12
Location relative to population centers
City, Large 15.10 8.77 5.56 15.12
City, Midsize 6.43 4.88 0.00 6.44
City, Small 7.46 7.10 11.11 7.45
Suburb, Large 24.53 22.56 8.33 24.56
Suburb, Midsize 2.87 2.67 5.56 2.86
Suburb, Small 1.91 1.83 1.39 1.91
Town, Fringe 1.56 2.09 0.00 1.57
Town, Distant 5.64 7.01 15.28 5.62
Town, Remote 3.82 5.99 6.94 3.81
Rural, Fringe 12.07 12.86 22.22 12.06
Rural, Distant 11.64 15.30 19.44 11.63
Rural, Remote 6.70 8.80 4.17 6.70
Schoolwide Title 1 Eligible 54.99 56.07 56.94 54.99
Charter School 5.08 3.14 2.78 5.08
Type
Regular school 97.95 99.37 98.61 97.95
Special Education school 1.11 0.16 1.39 1.11
Vocational education school 0.01 0.01 0.00 0.01
Alternative/other school 0.93 0.46 0.00 0.93
Note. All reported values are expressed as percentages. Data source: NCES (2011).

DIBELS Next 2010-2011 Percentile Ranks 29
Table 7
Characteristics of Schools with Grade 2 Students Included in DIBELS Next Percentiles
Compared to Public Schools in the U.S. and in the DIBELS Data System (DDS): Summary of
2009-2010 National Center for Education Statistics (NCES) Data
NCES: All Public Schools Offering
Grade 2 (n=51,903)
DDS: Public Schools with Grade 2 Data (n = 9,688)
SSP: Public Schools with Grade 2 Data
(n=71)
NCES: Non-SSP Public Schools
Offering Grade 2 (n=51,832)
Geographic Region
Northeast 16.00 15.53 19.72 15.99
Midwest 25.17 26.52 40.85 25.15
South 33.76 27.26 12.68 33.78
West 25.08 30.69 26.76 25.08
Location relative to population centers
City, Large 15.04 8.83 5.63 15.05
City, Midsize 6.43 5.01 0.00 6.44
City, Small 7.45 7.26 11.27 7.44
Suburb, Large 24.59 21.25 8.45 24.61
Suburb, Midsize 2.87 2.60 4.23 2.87
Suburb, Small 1.91 1.88 1.41 1.91
Town, Fringe 1.57 2.11 0.00 1.57
Town, Distant 5.65 7.08 15.49 5.63
Town, Remote 3.80 6.09 7.04 3.80
Rural, Fringe 12.11 12.88 23.94 12.09
Rural, Distant 11.63 15.86 18.31 11.62
Rural, Remote 6.68 9.01 4.23 6.68
Schoolwide Title 1 Eligible 54.98 57.49 57.75 54.98
Charter School 5.04 3.25 2.82 5.05
Type
Regular school 97.80 99.29 98.59 97.80
Special Education school 1.21 0.23 1.41 1.21
Vocational education school 0.01 0.00 0.00 0.01
Alternative/other school 0.98 0.49 0.00 0.99
Note. All reported values are expressed as percentages. Data source: NCES (2011).

DIBELS Next 2010-2011 Percentile Ranks 30
Table 8
Characteristics of Schools with Grade 3 Students Included in DIBELS Next Percentiles
Compared to Public Schools in the U.S. and in the DIBELS Data System (DDS): Summary of
2009-2010 National Center for Education Statistics (NCES) Data
NCES: All Public Schools Offering
Grade 3 (n=51,881)
DDS: Public Schools with Grade 3 Data
(n = 7952)
SSP: Public Schools with Grade 3 Data
(n=67)
NCES: Non-SSP Public Schools
Offering Grade 3 (n=51,814)
Geographic Region
Northeast 15.86 13.15 16.42 15.85
Midwest 25.18 26.01 43.28 25.16
South 33.80 26.26 13.43 33.82
West 25.17 34.58 26.87 25.16
Location relative to population centers
City, Large 14.97 8.46 5.97 14.98
City, Midsize 6.42 5.14 0.00 6.43
City, Small 7.46 7.02 11.94 7.46
Suburb, Large 24.59 20.42 7.46 24.62
Suburb, Midsize 2.88 2.77 4.48 2.88
Suburb, Small 1.89 1.92 1.49 1.90
Town, Fringe 1.57 2.11 0.00 1.57
Town, Distant 5.63 7.16 16.42 5.61
Town, Remote 3.78 6.28 7.46 3.78
Rural, Fringe 12.22 12.65 22.39 12.21
Rural, Distant 11.63 15.69 17.91 11.62
Rural, Remote 6.68 10.20 4.48 6.68
Schoolwide Title 1 Eligible 54.90 57.48 61.19 54.89
Charter School 4.97 3.31 2.99 4.98
Type
Regular school 97.67 99.23 98.51 97.66
Special Education school 1.26 0.19 1.49 1.26
Vocational education school 0.01 0.00 0.00 0.01
Alternative/other school 1.06 0.58 0.00 1.07
Note. All reported values are expressed as percentages. Data source: NCES (2011).

DIBELS Next 2010-2011 Percentile Ranks 31
Table 9
Characteristics of Schools with Grade 4 Students Included in DIBELS Next Percentiles
Compared to Public Schools in the U.S. and in the DIBELS Data System (DDS): Summary of
2009-2010 National Center for Education Statistics (NCES) Data
NCES: All Public Schools Offering
Grade 4 (n=51,635)
DDS: Public Schools with Grade 4 Data (n = 5,387)
SSP: Public Schools with Grade 4 Data
(n=65)
NCES: Non-SSP Public Schools
Offering Grade 4 (n=51,570)
Geographic Region
Northeast 15.64 11.75 13.85 15.64
Midwest 25.15 31.54 44.62 25.12
South 33.88 17.67 13.85 33.91
West 25.33 39.04 27.69 25.32
Location relative to population centers
City, Large 15.06 6.89 6.15 15.07
City, Midsize 6.48 5.03 0.00 6.49
City, Small 7.49 6.81 12.31 7.48
Suburb, Large 24.50 19.08 7.69 24.52
Suburb, Midsize 2.85 2.86 4.62 2.85
Suburb, Small 1.89 1.84 1.54 1.89
Town, Fringe 1.57 2.19 0.00 1.57
Town, Distant 5.54 7.07 16.92 5.52
Town, Remote 3.73 7.82 7.69 3.72
Rural, Fringe 12.25 13.24 21.54 12.24
Rural, Distant 11.65 15.24 16.92 11.65
Rural, Remote 6.70 11.71 4.62 6.71
Schoolwide Title 1 Eligible 54.83 56.10 63.08 54.82
Charter School 4.97 3.20 3.08 4.97
Type
Regular school 97.45 99.54 98.46 97.44
Special Education school 1.33 0.30 1.54 1.33
Vocational education school 0.01 0.00 0.00 0.01
Alternative/other school 1.21 0.17 0.00 1.21
Note. All reported values are expressed as percentages. Data source: NCES (2011).
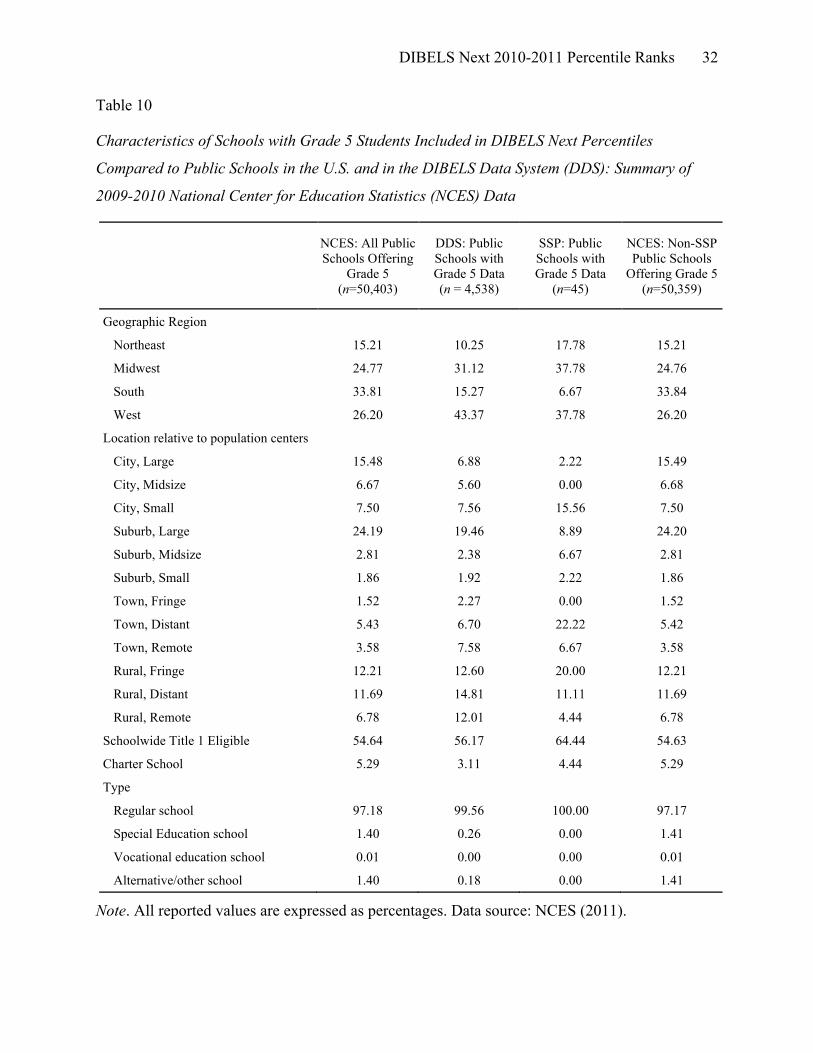
DIBELS Next 2010-2011 Percentile Ranks 32
Table 10
Characteristics of Schools with Grade 5 Students Included in DIBELS Next Percentiles
Compared to Public Schools in the U.S. and in the DIBELS Data System (DDS): Summary of
2009-2010 National Center for Education Statistics (NCES) Data
NCES: All Public Schools Offering
Grade 5 (n=50,403)
DDS: Public Schools with Grade 5 Data (n = 4,538)
SSP: Public Schools with Grade 5 Data
(n=45)
NCES: Non-SSP Public Schools
Offering Grade 5 (n=50,359)
Geographic Region
Northeast 15.21 10.25 17.78 15.21
Midwest 24.77 31.12 37.78 24.76
South 33.81 15.27 6.67 33.84
West 26.20 43.37 37.78 26.20
Location relative to population centers
City, Large 15.48 6.88 2.22 15.49
City, Midsize 6.67 5.60 0.00 6.68
City, Small 7.50 7.56 15.56 7.50
Suburb, Large 24.19 19.46 8.89 24.20
Suburb, Midsize 2.81 2.38 6.67 2.81
Suburb, Small 1.86 1.92 2.22 1.86
Town, Fringe 1.52 2.27 0.00 1.52
Town, Distant 5.43 6.70 22.22 5.42
Town, Remote 3.58 7.58 6.67 3.58
Rural, Fringe 12.21 12.60 20.00 12.21
Rural, Distant 11.69 14.81 11.11 11.69
Rural, Remote 6.78 12.01 4.44 6.78
Schoolwide Title 1 Eligible 54.64 56.17 64.44 54.63
Charter School 5.29 3.11 4.44 5.29
Type
Regular school 97.18 99.56 100.00 97.17
Special Education school 1.40 0.26 0.00 1.41
Vocational education school 0.01 0.00 0.00 0.01
Alternative/other school 1.40 0.18 0.00 1.41
Note. All reported values are expressed as percentages. Data source: NCES (2011).

DIBELS Next 2010-2011 Percentile Ranks 33
Table 11
Characteristics of Schools with Grade 6 Students Included in DIBELS Next Percentiles
Compared to Public Schools in the U.S. and in the DIBELS Data System (DDS): Summary of
2009-2010 National Center for Education Statistics (NCES) Data
NCES: All Public Schools Offering
Grade 6 (n=35,085)
DDS: Public Schools with Grade 6 Data (n = 1,894)
SSP: Public Schools with Grade 6 Data
(n=24)
NCES: Non-SSP Public Schools
Offering Grade 6 (n=35,062)
Geographic Region
Northeast 15.36 9.87 12.50 15.36
Midwest 26.48 30.62 50.00 26.47
South 29.52 10.30 8.33 29.54
West 28.63 49.21 29.17 28.63
Location relative to population centers
City, Large 15.03 9.13 0.00 15.04
City, Midsize 5.73 4.22 0.00 5.74
City, Small 6.51 4.86 20.83 6.50
Suburb, Large 21.31 21.49 12.50 21.32
Suburb, Midsize 2.48 1.58 4.17 2.48
Suburb, Small 1.81 0.84 0.00 1.81
Town, Fringe 1.68 1.21 0.00 1.69
Town, Distant 5.94 4.54 8.33 5.94
Town, Remote 3.78 5.49 8.33 3.78
Rural, Fringe 12.05 9.93 16.67 12.05
Rural, Distant 13.90 18.00 20.83 13.90
Rural, Remote 9.38 18.16 8.33 9.38
Schoolwide Title 1 Eligible 50.73 54.65 70.83 50.71
Charter School 7.73 5.17 4.17 7.73
Type
Regular school 94.56 99.31 100.00 94.56
Special Education school 2.11 0.32 0.00 2.11
Vocational education school 0.02 0.00 0.00 0.02
Alternative/other school 3.31 0.37 0.00 3.31
Note. All reported values are expressed as percentages. Data source: NCES (2011).
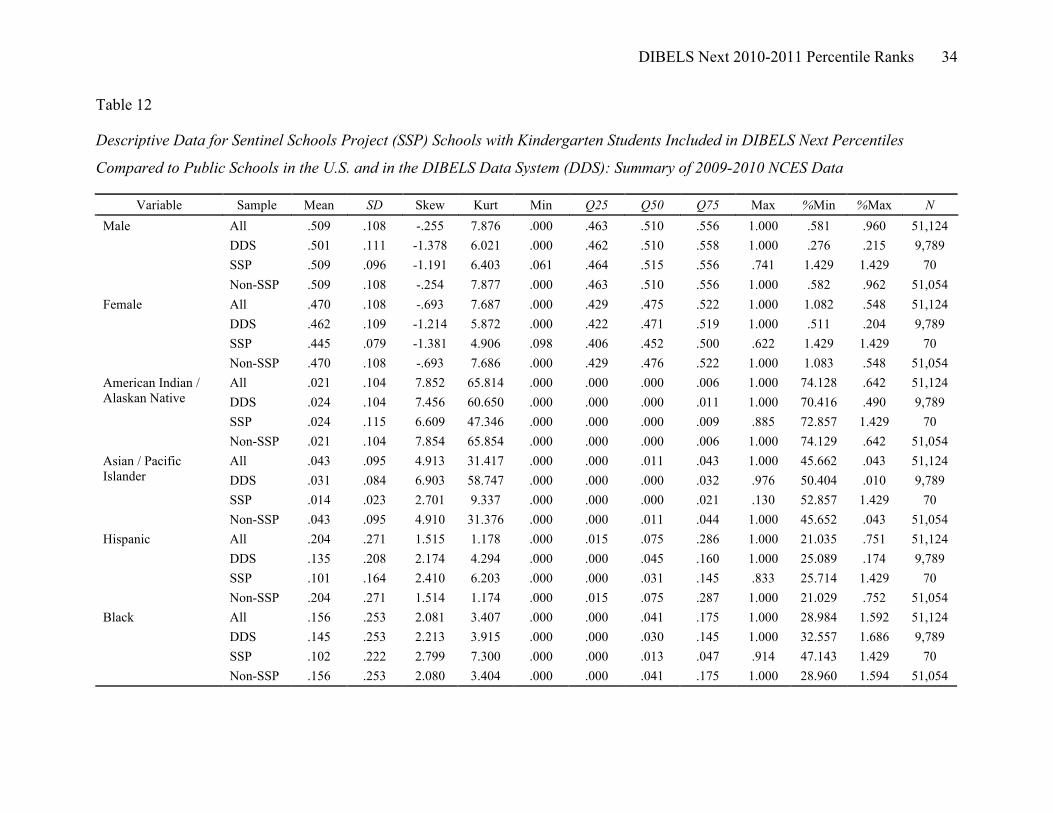
DIBELS Next 2010-2011 Percentile Ranks 34
Table 12
Descriptive Data for Sentinel Schools Project (SSP) Schools with Kindergarten Students Included in DIBELS Next Percentiles
Compared to Public Schools in the U.S. and in the DIBELS Data System (DDS): Summary of 2009-2010 NCES Data
Variable Sample Mean SD Skew Kurt Min Q25 Q50 Q75 Max %Min %Max N All .509 .108 -.255 7.876 .000 .463 .510 .556 1.000 .581 .960 51,124 DDS .501 .111 -1.378 6.021 .000 .462 .510 .558 1.000 .276 .215 9,789 SSP .509 .096 -1.191 6.403 .061 .464 .515 .556 .741 1.429 1.429 70
Male
Non-SSP .509 .108 -.254 7.877 .000 .463 .510 .556 1.000 .582 .962 51,054 All .470 .108 -.693 7.687 .000 .429 .475 .522 1.000 1.082 .548 51,124 DDS .462 .109 -1.214 5.872 .000 .422 .471 .519 1.000 .511 .204 9,789 SSP .445 .079 -1.381 4.906 .098 .406 .452 .500 .622 1.429 1.429 70
Female
Non-SSP .470 .108 -.693 7.686 .000 .429 .476 .522 1.000 1.083 .548 51,054 All .021 .104 7.852 65.814 .000 .000 .000 .006 1.000 74.128 .642 51,124 DDS .024 .104 7.456 60.650 .000 .000 .000 .011 1.000 70.416 .490 9,789 SSP .024 .115 6.609 47.346 .000 .000 .000 .009 .885 72.857 1.429 70
American Indian / Alaskan Native
Non-SSP .021 .104 7.854 65.854 .000 .000 .000 .006 1.000 74.129 .642 51,054 All .043 .095 4.913 31.417 .000 .000 .011 .043 1.000 45.662 .043 51,124 DDS .031 .084 6.903 58.747 .000 .000 .000 .032 .976 50.404 .010 9,789 SSP .014 .023 2.701 9.337 .000 .000 .000 .021 .130 52.857 1.429 70
Asian / Pacific Islander
Non-SSP .043 .095 4.910 31.376 .000 .000 .011 .044 1.000 45.652 .043 51,054 All .204 .271 1.515 1.178 .000 .015 .075 .286 1.000 21.035 .751 51,124 DDS .135 .208 2.174 4.294 .000 .000 .045 .160 1.000 25.089 .174 9,789 SSP .101 .164 2.410 6.203 .000 .000 .031 .145 .833 25.714 1.429 70
Hispanic
Non-SSP .204 .271 1.514 1.174 .000 .015 .075 .287 1.000 21.029 .752 51,054 All .156 .253 2.081 3.407 .000 .000 .041 .175 1.000 28.984 1.592 51,124 DDS .145 .253 2.213 3.915 .000 .000 .030 .145 1.000 32.557 1.686 9,789 SSP .102 .222 2.799 7.300 .000 .000 .013 .047 .914 47.143 1.429 70
Black
Non-SSP .156 .253 2.080 3.404 .000 .000 .041 .175 1.000 28.960 1.594 51,054
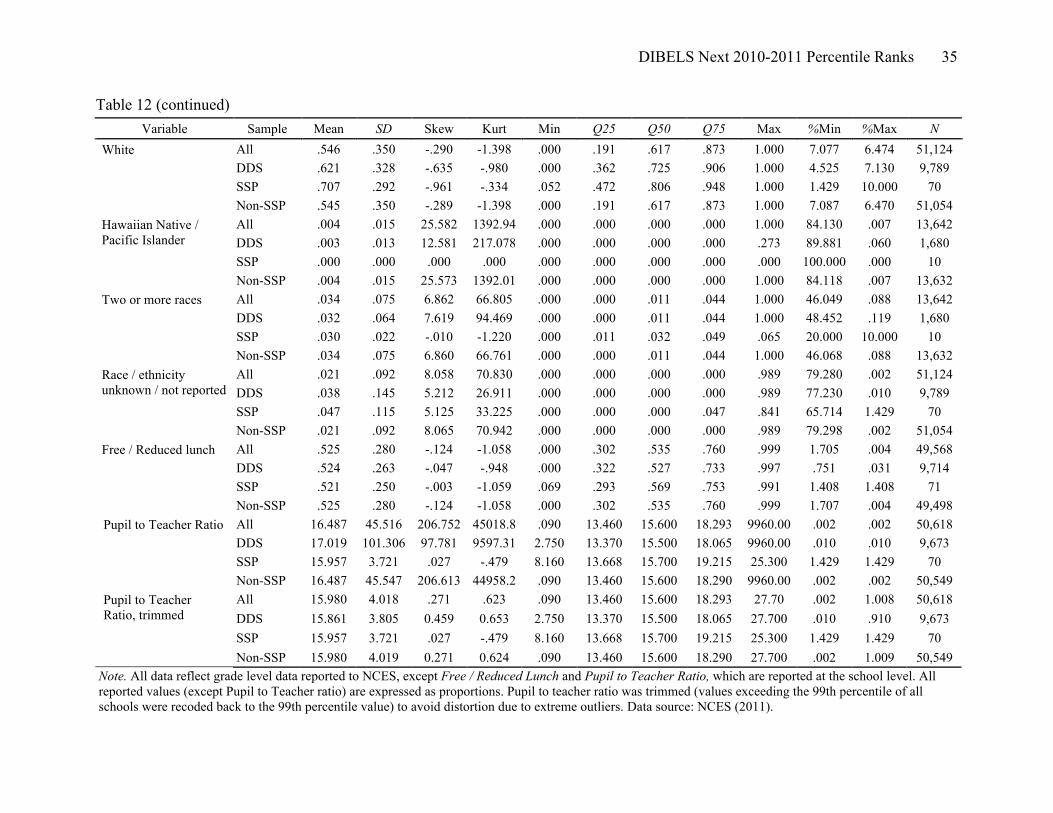
DIBELS Next 2010-2011 Percentile Ranks 35
Table 12 (continued) Variable Sample Mean SD Skew Kurt Min Q25 Q50 Q75 Max %Min %Max N
All .546 .350 -.290 -1.398 .000 .191 .617 .873 1.000 7.077 6.474 51,124 DDS .621 .328 -.635 -.980 .000 .362 .725 .906 1.000 4.525 7.130 9,789 SSP .707 .292 -.961 -.334 .052 .472 .806 .948 1.000 1.429 10.000 70
White
Non-SSP .545 .350 -.289 -1.398 .000 .191 .617 .873 1.000 7.087 6.470 51,054 All .004 .015 25.582 1392.94 .000 .000 .000 .000 1.000 84.130 .007 13,642 DDS .003 .013 12.581 217.078 .000 .000 .000 .000 .273 89.881 .060 1,680 SSP .000 .000 .000 .000 .000 .000 .000 .000 .000 100.000 .000 10
Hawaiian Native / Pacific Islander
Non-SSP .004 .015 25.573 1392.01 .000 .000 .000 .000 1.000 84.118 .007 13,632 All .034 .075 6.862 66.805 .000 .000 .011 .044 1.000 46.049 .088 13,642 DDS .032 .064 7.619 94.469 .000 .000 .011 .044 1.000 48.452 .119 1,680 SSP .030 .022 -.010 -1.220 .000 .011 .032 .049 .065 20.000 10.000 10
Two or more races
Non-SSP .034 .075 6.860 66.761 .000 .000 .011 .044 1.000 46.068 .088 13,632 All .021 .092 8.058 70.830 .000 .000 .000 .000 .989 79.280 .002 51,124 DDS .038 .145 5.212 26.911 .000 .000 .000 .000 .989 77.230 .010 9,789 SSP .047 .115 5.125 33.225 .000 .000 .000 .047 .841 65.714 1.429 70
Race / ethnicity unknown / not reported
Non-SSP .021 .092 8.065 70.942 .000 .000 .000 .000 .989 79.298 .002 51,054 All .525 .280 -.124 -1.058 .000 .302 .535 .760 .999 1.705 .004 49,568 DDS .524 .263 -.047 -.948 .000 .322 .527 .733 .997 .751 .031 9,714 SSP .521 .250 -.003 -1.059 .069 .293 .569 .753 .991 1.408 1.408 71
Free / Reduced lunch
Non-SSP .525 .280 -.124 -1.058 .000 .302 .535 .760 .999 1.707 .004 49,498 All 16.487 45.516 206.752 45018.8 .090 13.460 15.600 18.293 9960.00 .002 .002 50,618 DDS 17.019 101.306 97.781 9597.31 2.750 13.370 15.500 18.065 9960.00 .010 .010 9,673 SSP 15.957 3.721 .027 -.479 8.160 13.668 15.700 19.215 25.300 1.429 1.429 70
Pupil to Teacher Ratio
Non-SSP 16.487 45.547 206.613 44958.2 .090 13.460 15.600 18.290 9960.00 .002 .002 50,549 All 15.980 4.018 .271 .623 .090 13.460 15.600 18.293 27.70 .002 1.008 50,618 DDS 15.861 3.805 0.459 0.653 2.750 13.370 15.500 18.065 27.700 .010 .910 9,673 SSP 15.957 3.721 .027 -.479 8.160 13.668 15.700 19.215 25.300 1.429 1.429 70
Pupil to Teacher Ratio, trimmed
Non-SSP 15.980 4.019 0.271 0.624 .090 13.460 15.600 18.290 27.700 .002 1.009 50,549 Note. All data reflect grade level data reported to NCES, except Free / Reduced Lunch and Pupil to Teacher Ratio, which are reported at the school level. All reported values (except Pupil to Teacher ratio) are expressed as proportions. Pupil to teacher ratio was trimmed (values exceeding the 99th percentile of all schools were recoded back to the 99th percentile value) to avoid distortion due to extreme outliers. Data source: NCES (2011).
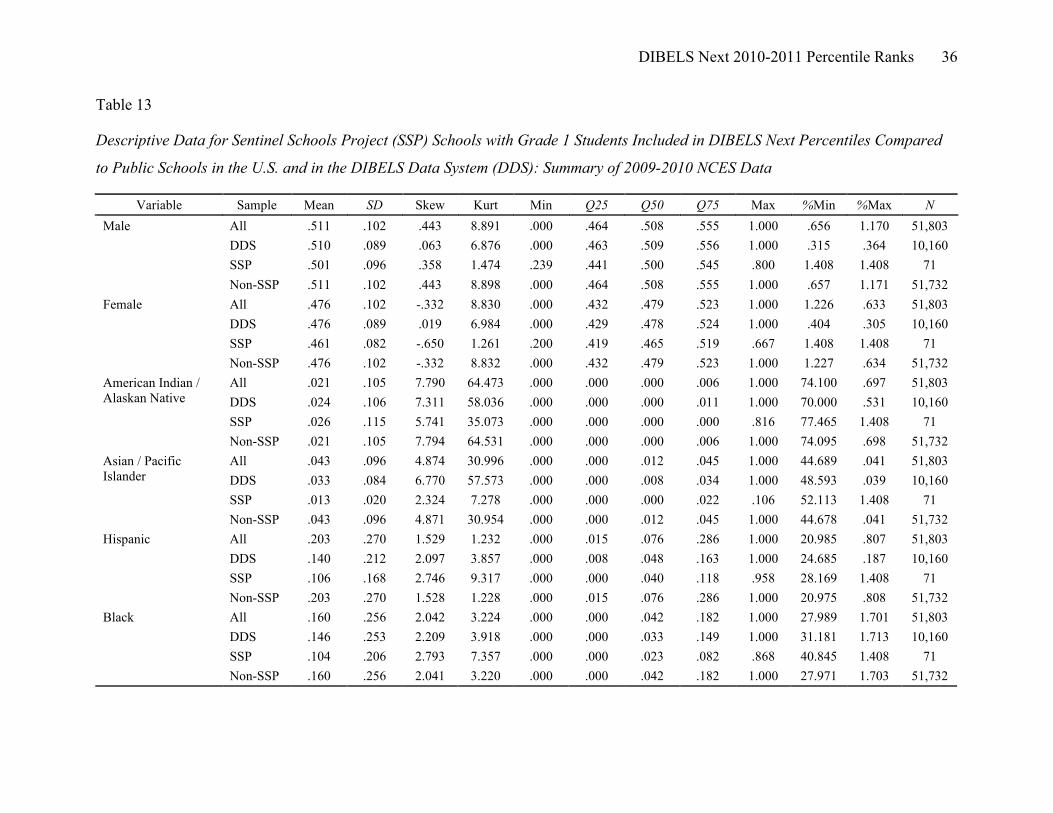
DIBELS Next 2010-2011 Percentile Ranks 36
Table 13
Descriptive Data for Sentinel Schools Project (SSP) Schools with Grade 1 Students Included in DIBELS Next Percentiles Compared
to Public Schools in the U.S. and in the DIBELS Data System (DDS): Summary of 2009-2010 NCES Data
Variable Sample Mean SD Skew Kurt Min Q25 Q50 Q75 Max %Min %Max N All .511 .102 .443 8.891 .000 .464 .508 .555 1.000 .656 1.170 51,803 DDS .510 .089 .063 6.876 .000 .463 .509 .556 1.000 .315 .364 10,160 SSP .501 .096 .358 1.474 .239 .441 .500 .545 .800 1.408 1.408 71
Male
Non-SSP .511 .102 .443 8.898 .000 .464 .508 .555 1.000 .657 1.171 51,732 All .476 .102 -.332 8.830 .000 .432 .479 .523 1.000 1.226 .633 51,803 DDS .476 .089 .019 6.984 .000 .429 .478 .524 1.000 .404 .305 10,160 SSP .461 .082 -.650 1.261 .200 .419 .465 .519 .667 1.408 1.408 71
Female
Non-SSP .476 .102 -.332 8.832 .000 .432 .479 .523 1.000 1.227 .634 51,732 All .021 .105 7.790 64.473 .000 .000 .000 .006 1.000 74.100 .697 51,803 DDS .024 .106 7.311 58.036 .000 .000 .000 .011 1.000 70.000 .531 10,160 SSP .026 .115 5.741 35.073 .000 .000 .000 .000 .816 77.465 1.408 71
American Indian / Alaskan Native
Non-SSP .021 .105 7.794 64.531 .000 .000 .000 .006 1.000 74.095 .698 51,732 All .043 .096 4.874 30.996 .000 .000 .012 .045 1.000 44.689 .041 51,803 DDS .033 .084 6.770 57.573 .000 .000 .008 .034 1.000 48.593 .039 10,160 SSP .013 .020 2.324 7.278 .000 .000 .000 .022 .106 52.113 1.408 71
Asian / Pacific Islander
Non-SSP .043 .096 4.871 30.954 .000 .000 .012 .045 1.000 44.678 .041 51,732 All .203 .270 1.529 1.232 .000 .015 .076 .286 1.000 20.985 .807 51,803 DDS .140 .212 2.097 3.857 .000 .008 .048 .163 1.000 24.685 .187 10,160 SSP .106 .168 2.746 9.317 .000 .000 .040 .118 .958 28.169 1.408 71
Hispanic
Non-SSP .203 .270 1.528 1.228 .000 .015 .076 .286 1.000 20.975 .808 51,732 All .160 .256 2.042 3.224 .000 .000 .042 .182 1.000 27.989 1.701 51,803 DDS .146 .253 2.209 3.918 .000 .000 .033 .149 1.000 31.181 1.713 10,160 SSP .104 .206 2.793 7.357 .000 .000 .023 .082 .868 40.845 1.408 71
Black
Non-SSP .160 .256 2.041 3.220 .000 .000 .042 .182 1.000 27.971 1.703 51,732

DIBELS Next 2010-2011 Percentile Ranks 37
Table 13 (continued) Variable Sample Mean SD Skew Kurt Min Q25 Q50 Q75 Max %Min %Max N
All .551 .349 -.322 -1.368 .000 .205 .628 .875 1.000 7.204 6.600 51,803 DDS .638 .321 -.726 -.802 .000 .413 .742 .909 1.000 4.370 7.323 10,160 SSP .709 .275 -.966 -.077 .042 .532 .811 .926 1.000 1.408 11.268 71
White
Non-SSP .550 .349 -.322 -1.369 .000 .204 .627 .874 1.000 7.214 6.594 51,732 All .003 .012 9.138 136.70 .000 .000 .000 .000 .300 84.481 .007 13,764 DDS .003 .013 10.078 136.773 .000 .000 .000 .000 .250 89.681 .058 1,725 SSP .004 .009 2.031 2.813 .000 .000 .000 .000 .024 81.818 9.091 11
Hawaiian Native / Pacific Islander
Non-SSP .003 .012 9.139 136.69 .000 .000 .000 .000 .300 84.483 .007 13,753 All .031 .078 7.560 74.874 .000 .000 .000 .038 1.000 50.145 .131 13,764 DDS .030 .063 8.148 103.265 .000 .000 .000 .041 1.000 51.246 .116 1,725 SSP .022 .024 .291 -1.872 .000 .000 .018 .049 .058 45.455 9.091 11
Two or more races
Non-SSP .031 .078 7.558 74.822 .000 .000 .000 .038 1.000 50.149 .131 13,753 All .013 .035 5.072 48.177 .000 .000 .000 .000 .889 79.644 .002 51,803 DDS .014 .036 4.396 31.104 .000 .000 .000 .000 .548 77.736 .010 10,160 SSP .023 .039 1.856 2.793 .000 .000 .000 .037 .156 64.789 1.408 71
Race / ethnicity unknown / not reported
Non-SSP .009 .024 4.511 33.698 .000 .000 .000 .000 .578 79.664 .002 51,732 All .524 .280 -.122 -1.059 .000 .301 .534 .760 .999 1.707 .004 50,217 DDS .525 .263 -.037 -.950 .000 .322 .527 .733 .997 .705 .030 10,072 SSP .525 .250 -.031 -1.073 .069 .300 .571 .758 .991 1.389 1.389 72
Free / Reduced lunch
Non-SSP .524 .280 -.122 -1.059 .000 .301 .534 .760 .999 1.709 .004 50,146 All 16.411 45.190 208.630 45760.3 .260 13.435 15.570 18.235 9960.00 .002 .002 51,253 DDS 16.989 99.405 99.787 9982.03 1.590 13.420 15.560 18.180 9960.00 .010 .010 10,032 SSP 16.006 3.717 -.002 -.496 8.160 13.680 15.760 19.410 25.300 1.408 1.408 71
Pupil to Teacher Ratio
Non-SSP 16.412 45.220 208.490 45698.7 .260 13.430 15.570 18.230 9960.00 .002 .002 51,183 All 15.918 4.010 0.212 0.629 .260 13.435 15.570 18.235 27.400 .002 1.001 51,253 DDS 15.914 3.782 0.401 0.538 1.590 13.420 15.560 18.180 27.400 .010 .877 10,032 SSP 16.006 3.717 -.002 -.496 8.160 13.680 15.760 19.410 25.300 1.408 1.408 71
Pupil to Teacher Ratio, trimmed
Non-SSP 15.917 4.010 0.213 0.630 .260 13.430 15.570 18.230 27.400 .002 1.002 51,183 Note. All data reflect grade level data reported to NCES, except Free / Reduced Lunch and Pupil to Teacher Ratio, which are reported at the school level. All reported values (except Pupil to Teacher ratio) are expressed as proportions. Pupil to teacher ratio was trimmed (values exceeding the 99th percentile of all schools were recoded back to the 99th percentile value) to avoid distortion due to extreme outliers. Data source: NCES (2011).
DIBELS Next 2010-2011 Percentile Ranks 38
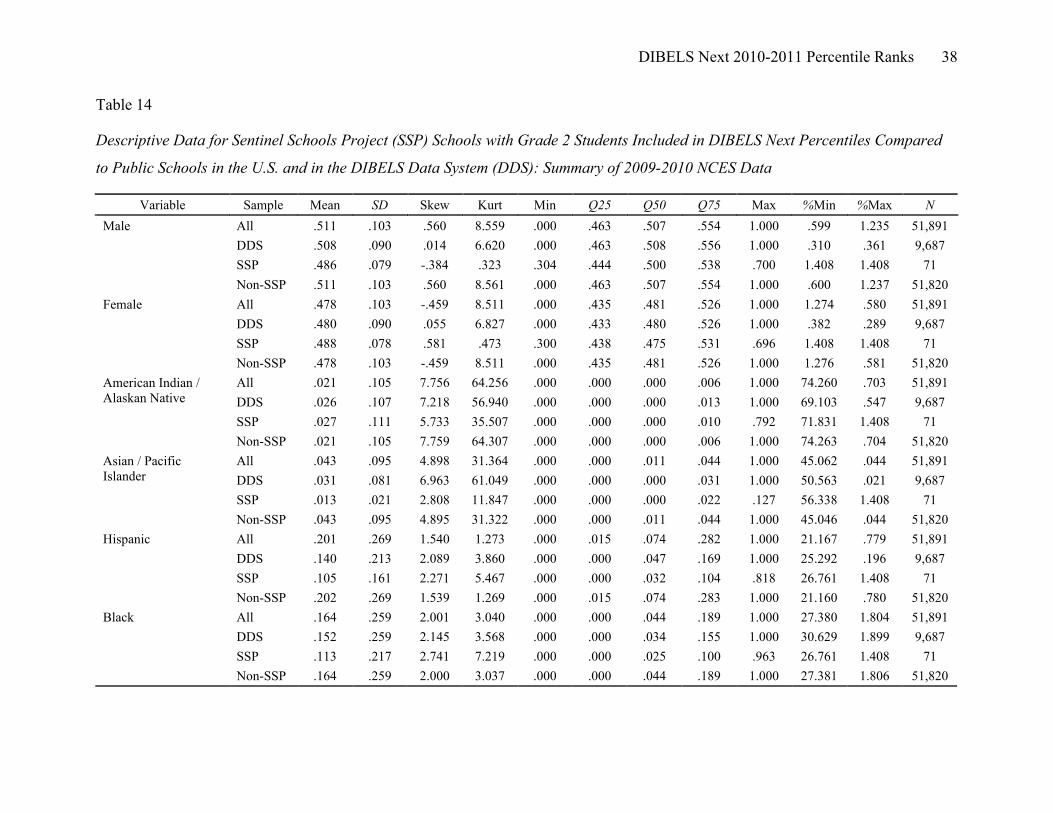
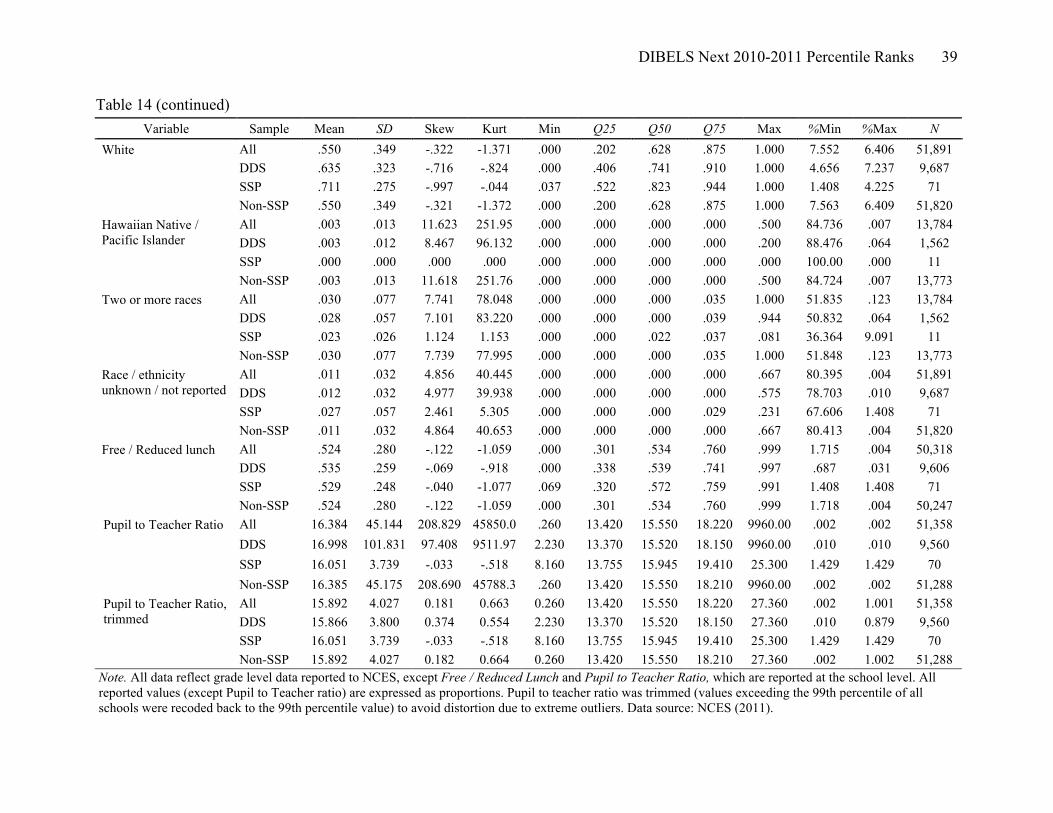
Table 14
Descriptive Data for Sentinel Schools Project (SSP) Schools with Grade 2 Students Included in DIBELS Next Percentiles Compared
to Public Schools in the U.S. and in the DIBELS Data System (DDS): Summary of 2009-2010 NCES Data
Variable Sample Mean SD Skew Kurt Min Q25 Q50 Q75 Max %Min %Max N All .511 .103 .560 8.559 .000 .463 .507 .554 1.000 .599 1.235 51,891 DDS .508 .090 .014 6.620 .000 .463 .508 .556 1.000 .310 .361 9,687 SSP .486 .079 -.384 .323 .304 .444 .500 .538 .700 1.408 1.408 71
Male
Non-SSP .511 .103 .560 8.561 .000 .463 .507 .554 1.000 .600 1.237 51,820 All .478 .103 -.459 8.511 .000 .435 .481 .526 1.000 1.274 .580 51,891 DDS .480 .090 .055 6.827 .000 .433 .480 .526 1.000 .382 .289 9,687 SSP .488 .078 .581 .473 .300 .438 .475 .531 .696 1.408 1.408 71
Female
Non-SSP .478 .103 -.459 8.511 .000 .435 .481 .526 1.000 1.276 .581 51,820 All .021 .105 7.756 64.256 .000 .000 .000 .006 1.000 74.260 .703 51,891 DDS .026 .107 7.218 56.940 .000 .000 .000 .013 1.000 69.103 .547 9,687 SSP .027 .111 5.733 35.507 .000 .000 .000 .010 .792 71.831 1.408 71
American Indian / Alaskan Native
Non-SSP .021 .105 7.759 64.307 .000 .000 .000 .006 1.000 74.263 .704 51,820 All .043 .095 4.898 31.364 .000 .000 .011 .044 1.000 45.062 .044 51,891 DDS .031 .081 6.963 61.049 .000 .000 .000 .031 1.000 50.563 .021 9,687 SSP .013 .021 2.808 11.847 .000 .000 .000 .022 .127 56.338 1.408 71
Asian / Pacific Islander
Non-SSP .043 .095 4.895 31.322 .000 .000 .011 .044 1.000 45.046 .044 51,820 All .201 .269 1.540 1.273 .000 .015 .074 .282 1.000 21.167 .779 51,891 DDS .140 .213 2.089 3.860 .000 .000 .047 .169 1.000 25.292 .196 9,687 SSP .105 .161 2.271 5.467 .000 .000 .032 .104 .818 26.761 1.408 71
Hispanic
Non-SSP .202 .269 1.539 1.269 .000 .015 .074 .283 1.000 21.160 .780 51,820 All .164 .259 2.001 3.040 .000 .000 .044 .189 1.000 27.380 1.804 51,891 DDS .152 .259 2.145 3.568 .000 .000 .034 .155 1.000 30.629 1.899 9,687 SSP .113 .217 2.741 7.219 .000 .000 .025 .100 .963 26.761 1.408 71
Black
Non-SSP .164 .259 2.000 3.037 .000 .000 .044 .189 1.000 27.381 1.806 51,820
DIBELS Next 2010-2011 Percentile Ranks 39
Table 14 (continued) Variable Sample Mean SD Skew Kurt Min Q25 Q50 Q75 Max %Min %Max N
All .550 .349 -.322 -1.371 .000 .202 .628 .875 1.000 7.552 6.406 51,891 DDS .635 .323 -.716 -.824 .000 .406 .741 .910 1.000 4.656 7.237 9,687 SSP .711 .275 -.997 -.044 .037 .522 .823 .944 1.000 1.408 4.225 71
White
Non-SSP .550 .349 -.321 -1.372 .000 .200 .628 .875 1.000 7.563 6.409 51,820 All .003 .013 11.623 251.95 .000 .000 .000 .000 .500 84.736 .007 13,784 DDS .003 .012 8.467 96.132 .000 .000 .000 .000 .200 88.476 .064 1,562 SSP .000 .000 .000 .000 .000 .000 .000 .000 .000 100.00 .000 11
Hawaiian Native / Pacific Islander
Non-SSP .003 .013 11.618 251.76 .000 .000 .000 .000 .500 84.724 .007 13,773 All .030 .077 7.741 78.048 .000 .000 .000 .035 1.000 51.835 .123 13,784 DDS .028 .057 7.101 83.220 .000 .000 .000 .039 .944 50.832 .064 1,562 SSP .023 .026 1.124 1.153 .000 .000 .022 .037 .081 36.364 9.091 11
Two or more races
Non-SSP .030 .077 7.739 77.995 .000 .000 .000 .035 1.000 51.848 .123 13,773 All .011 .032 4.856 40.445 .000 .000 .000 .000 .667 80.395 .004 51,891 DDS .012 .032 4.977 39.938 .000 .000 .000 .000 .575 78.703 .010 9,687 SSP .027 .057 2.461 5.305 .000 .000 .000 .029 .231 67.606 1.408 71
Race / ethnicity unknown / not reported
Non-SSP .011 .032 4.864 40.653 .000 .000 .000 .000 .667 80.413 .004 51,820 All .524 .280 -.122 -1.059 .000 .301 .534 .760 .999 1.715 .004 50,318 DDS .535 .259 -.069 -.918 .000 .338 .539 .741 .997 .687 .031 9,606 SSP .529 .248 -.040 -1.077 .069 .320 .572 .759 .991 1.408 1.408 71
Free / Reduced lunch
Non-SSP .524 .280 -.122 -1.059 .000 .301 .534 .760 .999 1.718 .004 50,247 All 16.384 45.144 208.829 45850.0 .260 13.420 15.550 18.220 9960.00 .002 .002 51,358 DDS 16.998 101.831 97.408 9511.97 2.230 13.370 15.520 18.150 9960.00 .010 .010 9,560 SSP 16.051 3.739 -.033 -.518 8.160 13.755 15.945 19.410 25.300 1.429 1.429 70
Pupil to Teacher Ratio
Non-SSP 16.385 45.175 208.690 45788.3 .260 13.420 15.550 18.210 9960.00 .002 .002 51,288 All 15.892 4.027 0.181 0.663 0.260 13.420 15.550 18.220 27.360 .002 1.001 51,358 DDS 15.866 3.800 0.374 0.554 2.230 13.370 15.520 18.150 27.360 .010 0.879 9,560 SSP 16.051 3.739 -.033 -.518 8.160 13.755 15.945 19.410 25.300 1.429 1.429 70
Pupil to Teacher Ratio, trimmed
Non-SSP 15.892 4.027 0.182 0.664 0.260 13.420 15.550 18.210 27.360 .002 1.002 51,288 Note. All data reflect grade level data reported to NCES, except Free / Reduced Lunch and Pupil to Teacher Ratio, which are reported at the school level. All reported values (except Pupil to Teacher ratio) are expressed as proportions. Pupil to teacher ratio was trimmed (values exceeding the 99th percentile of all schools were recoded back to the 99th percentile value) to avoid distortion due to extreme outliers. Data source: NCES (2011).
DIBELS Next 2010-2011 Percentile Ranks 40
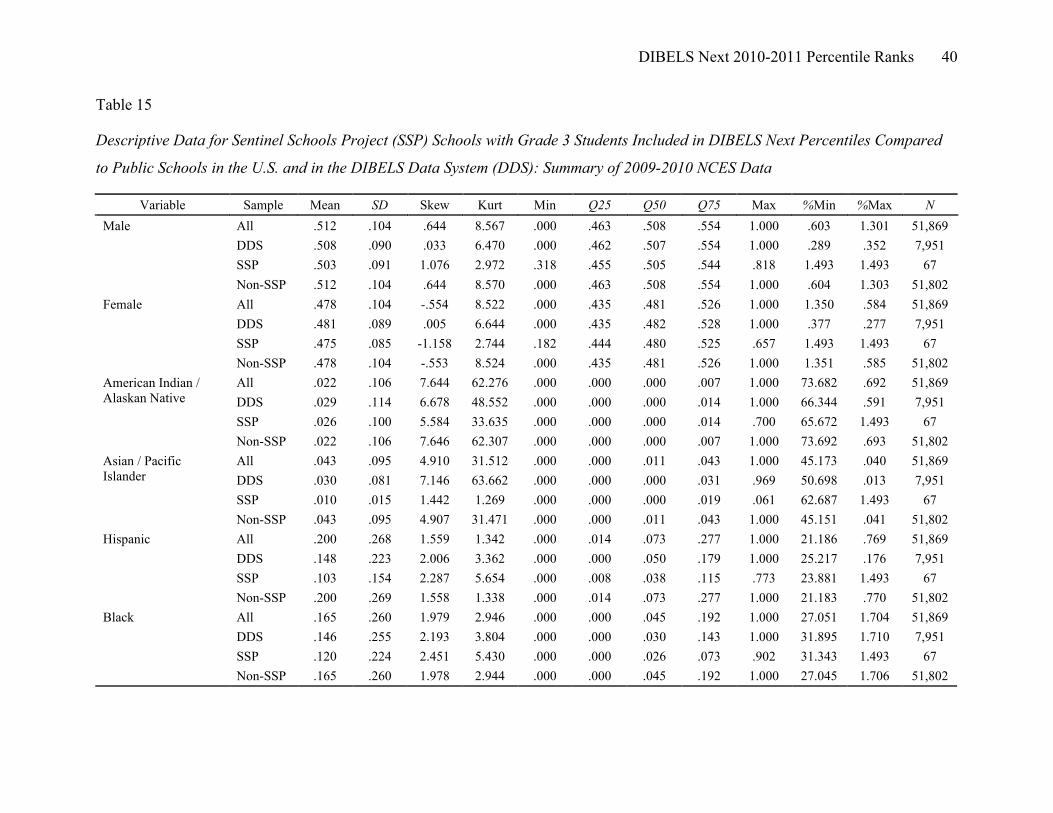
Table 15
Descriptive Data for Sentinel Schools Project (SSP) Schools with Grade 3 Students Included in DIBELS Next Percentiles Compared
to Public Schools in the U.S. and in the DIBELS Data System (DDS): Summary of 2009-2010 NCES Data
Variable Sample Mean SD Skew Kurt Min Q25 Q50 Q75 Max %Min %Max N All .512 .104 .644 8.567 .000 .463 .508 .554 1.000 .603 1.301 51,869 DDS .508 .090 .033 6.470 .000 .462 .507 .554 1.000 .289 .352 7,951 SSP .503 .091 1.076 2.972 .318 .455 .505 .544 .818 1.493 1.493 67
Male
Non-SSP .512 .104 .644 8.570 .000 .463 .508 .554 1.000 .604 1.303 51,802 All .478 .104 -.554 8.522 .000 .435 .481 .526 1.000 1.350 .584 51,869 DDS .481 .089 .005 6.644 .000 .435 .482 .528 1.000 .377 .277 7,951 SSP .475 .085 -1.158 2.744 .182 .444 .480 .525 .657 1.493 1.493 67
Female
Non-SSP .478 .104 -.553 8.524 .000 .435 .481 .526 1.000 1.351 .585 51,802 All .022 .106 7.644 62.276 .000 .000 .000 .007 1.000 73.682 .692 51,869 DDS .029 .114 6.678 48.552 .000 .000 .000 .014 1.000 66.344 .591 7,951 SSP .026 .100 5.584 33.635 .000 .000 .000 .014 .700 65.672 1.493 67
American Indian / Alaskan Native
Non-SSP .022 .106 7.646 62.307 .000 .000 .000 .007 1.000 73.692 .693 51,802 All .043 .095 4.910 31.512 .000 .000 .011 .043 1.000 45.173 .040 51,869 DDS .030 .081 7.146 63.662 .000 .000 .000 .031 .969 50.698 .013 7,951 SSP .010 .015 1.442 1.269 .000 .000 .000 .019 .061 62.687 1.493 67
Asian / Pacific Islander
Non-SSP .043 .095 4.907 31.471 .000 .000 .011 .043 1.000 45.151 .041 51,802 All .200 .268 1.559 1.342 .000 .014 .073 .277 1.000 21.186 .769 51,869 DDS .148 .223 2.006 3.362 .000 .000 .050 .179 1.000 25.217 .176 7,951 SSP .103 .154 2.287 5.654 .000 .008 .038 .115 .773 23.881 1.493 67
Hispanic
Non-SSP .200 .269 1.558 1.338 .000 .014 .073 .277 1.000 21.183 .770 51,802 All .165 .260 1.979 2.946 .000 .000 .045 .192 1.000 27.051 1.704 51,869 DDS .146 .255 2.193 3.804 .000 .000 .030 .143 1.000 31.895 1.710 7,951 SSP .120 .224 2.451 5.430 .000 .000 .026 .073 .902 31.343 1.493 67
Black
Non-SSP .165 .260 1.978 2.944 .000 .000 .045 .192 1.000 27.045 1.706 51,802

DIBELS Next 2010-2011 Percentile Ranks 41
Table 15 (continued) Variable Sample Mean SD Skew Kurt Min Q25 Q50 Q75 Max %Min %Max N
All .551 .350 -.325 -1.373 .000 .204 .628 .877 1.000 7.378 6.343 51,869 DDS .632 .325 -.696 -.872 .000 .400 .736 .909 1.000 4.452 7.056 7,951 SSP .717 .277 -1.043 .148 .039 .571 .821 .949 1.000 1.493 10.448 67
White
Non-SSP .551 .350 -.324 -1.373 .000 .203 .628 .876 1.000 7.388 6.338 51,802 All .003 .014 14.615 392.35 .000 .000 .000 .000 .500 84.888 .022 13,777 DDS .003 .014 8.656 91.271 .000 .000 .000 .000 .197 90.644 .086 1,165 SSP .001 .003 3.162 10.000 .000 .000 .000 .000 .008 90.000 10.000 10
Hawaiian Native / Pacific Islander
Non-SSP .003 .014 14.610 392.09 .000 .000 .000 .000 .500 84.884 .022 13,767 All .030 .080 7.720 76.301 .000 .000 .000 .034 1.000 52.646 .138 13,777 DDS .026 .060 7.832 92.922 .000 .000 .000 .032 .981 55.451 .086 1,165 SSP .019 .020 .663 -.877 .000 .000 .017 .035 .052 40.000 10.000 10
Two or more races
Non-SSP .030 .080 7.717 76.250 .000 .000 .000 .034 1.000 52.655 .138 13,767 All .011 .030 4.779 36.730 .000 .000 .000 .000 .534 80.834 .002 51,869 DDS .011 .032 5.465 48.451 .000 .000 .000 .000 .534 79.411 .013 7,951 SSP .021 .050 3.051 9.467 .000 .000 .000 .020 .250 70.149 1.493 67
Race / ethnicity unknown / not reported
Non-SSP .011 .030 4.782 36.841 .000 .000 .000 .000 .534 80.848 .002 51,802 All .524 .280 -.120 -1.057 .000 .301 .534 .759 .999 1.721 .004 50,308 DDS .542 .258 -.083 -.924 .000 .344 .545 .749 .997 .661 .025 7,871 SSP .545 .246 -.152 -.988 .069 .340 .577 .761 .991 1.493 1.493 67
Free / Reduced lunch
Non-SSP .524 .280 -.120 -1.058 .000 .301 .534 .759 .999 1.724 .004 50,241 All 16.389 45.168 208.697 45796.7 .260 13.420 15.560 18.220 9960.00 .002 .002 51,309 DDS 17.312 112.475 88.223 7799.69 2.500 13.360 15.660 18.405 9960.00 .013 .013 7,833 SSP 16.033 3.836 -.023 -.626 8.160 13.535 15.945 19.450 25.300 1.515 1.515 66
Pupil to Teacher Ratio
Non-SSP 16.389 45.197 208.566 45738.7 .260 13.420 15.560 18.220 9960.00 .002 .002 51,243 All 15.894 4.034 0.179 0.645 0.260 13.420 15.560 18.220 27.360 .002 1.004 51,309 DDS 15.954 3.885 0.279 0.305 2.500 13.360 15.660 18.405 27.360 .013 0.728 7,833 SSP 16.033 3.836 -.023 -.626 8.160 13.535 15.945 19.450 25.300 1.515 1.515 66
Pupil to Teacher Ratio, trimmed
Non-SSP 15.894 4.034 0.179 0.646 0.260 13.420 15.560 18.220 27.360 .002 1.005 51,243 Note. All data reflect grade level data reported to NCES, except Free / Reduced Lunch and Pupil to Teacher Ratio, which are reported at the school level. All reported values (except Pupil to Teacher ratio) are expressed as proportions. Pupil to teacher ratio was trimmed (values exceeding the 99th percentile of all schools were recoded back to the 99th percentile value) to avoid distortion due to extreme outliers. Data source: NCES (2011).

DIBELS Next 2010-2011 Percentile Ranks 42
Table 16
Descriptive Data for Sentinel Schools Project (SSP) Schools with Grade 4 Students Included in DIBELS Next Percentiles Compared
to Public Schools in the U.S. and in the DIBELS Data System (DDS): Summary of 2009-2010 NCES Data
Variable Sample Mean SD Skew Kurt Min Q25 Q50 Q75 Max %Min %Max N All .512 .108 .595 8.431 .000 .463 .507 .554 1.000 .717 1.437 51,623 DDS .508 .096 .098 6.811 .000 .459 .506 .556 1.000 .446 .501 5,386 SSP .505 .079 -.611 .729 .277 .463 .510 .567 .667 1.538 1.538 65
Male
Non-SSP .512 .108 .595 8.431 .000 .463 .507 .554 1.000 .718 1.439 51,558 All .478 .107 -.512 8.358 .000 .436 .483 .527 1.000 1.484 .697 51,623 DDS .479 .095 -.001 6.893 .000 .431 .480 .528 1.000 .538 .427 5,386 SSP .468 .074 .376 .097 .311 .414 .466 .517 .667 1.538 1.538 65
Female
Non-SSP .478 .107 -.513 8.357 .000 .436 .483 .527 1.000 1.486 .698 51,558 All .022 .106 7.648 62.458 .000 .000 .000 .007 1.000 73.566 .692 51,623 DDS .031 .124 6.403 43.516 .000 .000 .000 .015 1.000 65.373 .835 5,386 SSP .033 .112 4.969 25.799 .000 .000 .000 .017 .708 64.615 1.538 65
American Indian / Alaskan Native
Non-SSP .022 .106 7.652 62.518 .000 .000 .000 .007 1.000 73.577 .692 51,558 All .043 .096 4.986 32.280 .000 .000 .011 .043 1.000 45.298 .052 51,623 DDS .032 .085 6.874 59.154 .000 .000 .000 .033 1.000 51.095 .056 5,386 SSP .011 .016 2.163 6.662 .000 .000 .000 .018 .088 52.308 1.538 65
Asian / Pacific Islander
Non-SSP .043 .096 4.983 32.239 .000 .000 .011 .043 1.000 45.289 .052 51,558 All .197 .268 1.582 1.426 .000 .014 .071 .272 1.000 21.632 .845 51,623 DDS .149 .221 2.000 3.367 .000 .000 .050 .182 1.000 25.009 .204 5,386 SSP .102 .155 2.563 7.432 .000 .006 .042 .113 .810 24.615 1.538 65
Hispanic
Non-SSP .197 .268 1.581 1.422 .000 .014 .071 .272 1.000 21.628 .846 51,558 All .169 .263 1.944 2.779 .000 .000 .046 .200 1.000 26.804 1.908 51,623 DDS .110 .210 2.702 6.945 .000 .000 .022 .101 1.000 35.722 .724 5,386 SSP .120 .235 2.451 5.456 .000 .000 .019 .084 .930 41.538 1.538 65
Black
Non-SSP .169 .263 1.943 2.777 .000 .000 .046 .200 1.000 26.785 1.910 51,558
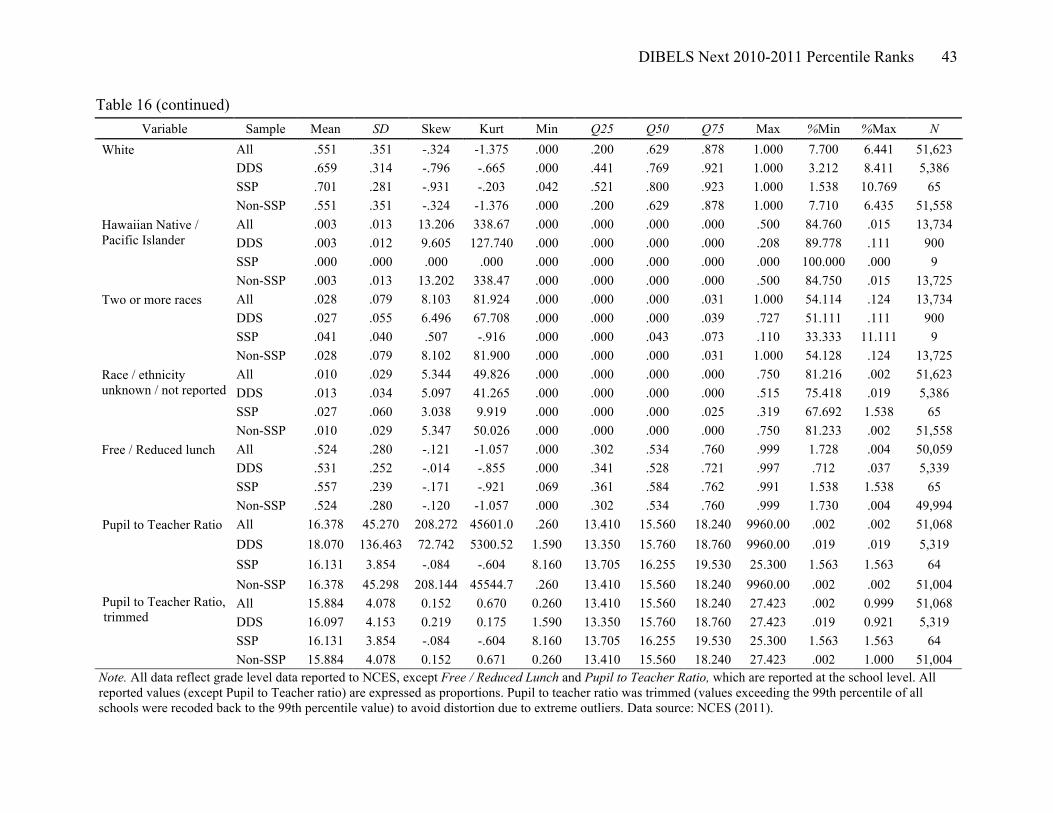
DIBELS Next 2010-2011 Percentile Ranks 43
Table 16 (continued) Variable Sample Mean SD Skew Kurt Min Q25 Q50 Q75 Max %Min %Max N
All .551 .351 -.324 -1.375 .000 .200 .629 .878 1.000 7.700 6.441 51,623 DDS .659 .314 -.796 -.665 .000 .441 .769 .921 1.000 3.212 8.411 5,386 SSP .701 .281 -.931 -.203 .042 .521 .800 .923 1.000 1.538 10.769 65
White
Non-SSP .551 .351 -.324 -1.376 .000 .200 .629 .878 1.000 7.710 6.435 51,558 All .003 .013 13.206 338.67 .000 .000 .000 .000 .500 84.760 .015 13,734 DDS .003 .012 9.605 127.740 .000 .000 .000 .000 .208 89.778 .111 900 SSP .000 .000 .000 .000 .000 .000 .000 .000 .000 100.000 .000 9
Hawaiian Native / Pacific Islander
Non-SSP .003 .013 13.202 338.47 .000 .000 .000 .000 .500 84.750 .015 13,725 All .028 .079 8.103 81.924 .000 .000 .000 .031 1.000 54.114 .124 13,734 DDS .027 .055 6.496 67.708 .000 .000 .000 .039 .727 51.111 .111 900 SSP .041 .040 .507 -.916 .000 .000 .043 .073 .110 33.333 11.111 9
Two or more races
Non-SSP .028 .079 8.102 81.900 .000 .000 .000 .031 1.000 54.128 .124 13,725 All .010 .029 5.344 49.826 .000 .000 .000 .000 .750 81.216 .002 51,623 DDS .013 .034 5.097 41.265 .000 .000 .000 .000 .515 75.418 .019 5,386 SSP .027 .060 3.038 9.919 .000 .000 .000 .025 .319 67.692 1.538 65
Race / ethnicity unknown / not reported
Non-SSP .010 .029 5.347 50.026 .000 .000 .000 .000 .750 81.233 .002 51,558 All .524 .280 -.121 -1.057 .000 .302 .534 .760 .999 1.728 .004 50,059 DDS .531 .252 -.014 -.855 .000 .341 .528 .721 .997 .712 .037 5,339 SSP .557 .239 -.171 -.921 .069 .361 .584 .762 .991 1.538 1.538 65
Free / Reduced lunch
Non-SSP .524 .280 -.120 -1.057 .000 .302 .534 .760 .999 1.730 .004 49,994 All 16.378 45.270 208.272 45601.0 .260 13.410 15.560 18.240 9960.00 .002 .002 51,068 DDS 18.070 136.463 72.742 5300.52 1.590 13.350 15.760 18.760 9960.00 .019 .019 5,319 SSP 16.131 3.854 -.084 -.604 8.160 13.705 16.255 19.530 25.300 1.563 1.563 64
Pupil to Teacher Ratio
Non-SSP 16.378 45.298 208.144 45544.7 .260 13.410 15.560 18.240 9960.00 .002 .002 51,004 All 15.884 4.078 0.152 0.670 0.260 13.410 15.560 18.240 27.423 .002 0.999 51,068 DDS 16.097 4.153 0.219 0.175 1.590 13.350 15.760 18.760 27.423 .019 0.921 5,319 SSP 16.131 3.854 -.084 -.604 8.160 13.705 16.255 19.530 25.300 1.563 1.563 64
Pupil to Teacher Ratio, trimmed
Non-SSP 15.884 4.078 0.152 0.671 0.260 13.410 15.560 18.240 27.423 .002 1.000 51,004 Note. All data reflect grade level data reported to NCES, except Free / Reduced Lunch and Pupil to Teacher Ratio, which are reported at the school level. All reported values (except Pupil to Teacher ratio) are expressed as proportions. Pupil to teacher ratio was trimmed (values exceeding the 99th percentile of all schools were recoded back to the 99th percentile value) to avoid distortion due to extreme outliers. Data source: NCES (2011).
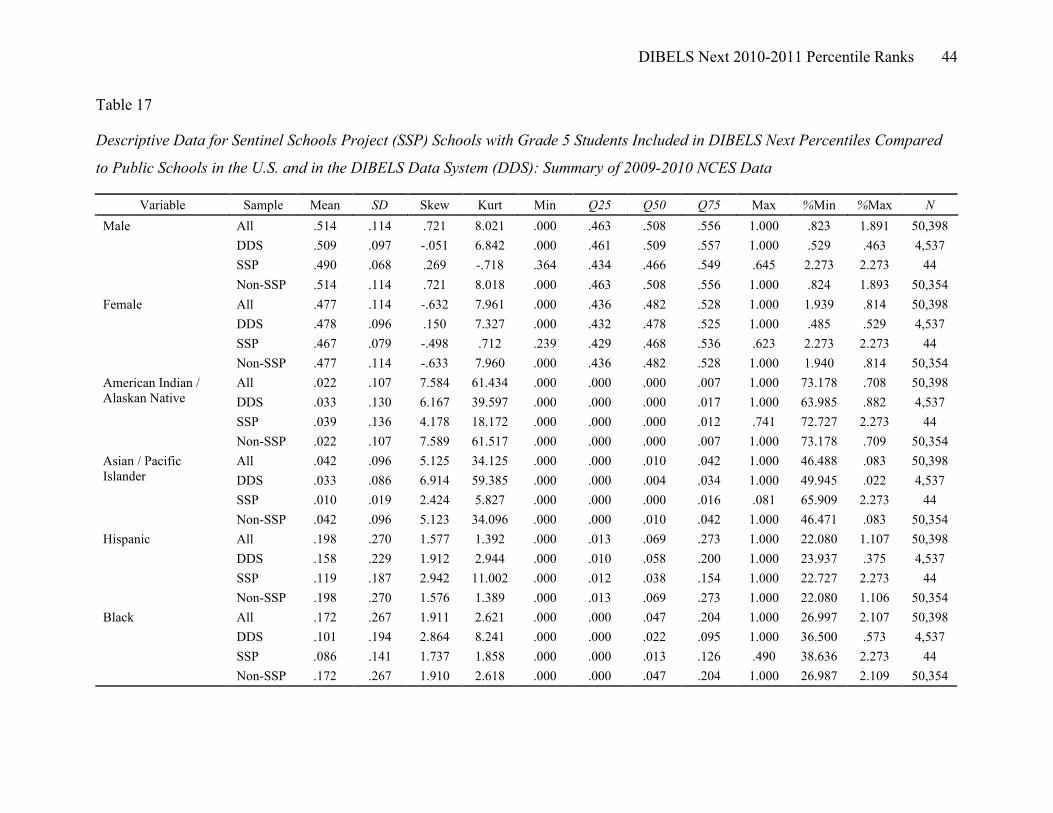
DIBELS Next 2010-2011 Percentile Ranks 44
Table 17
Descriptive Data for Sentinel Schools Project (SSP) Schools with Grade 5 Students Included in DIBELS Next Percentiles Compared
to Public Schools in the U.S. and in the DIBELS Data System (DDS): Summary of 2009-2010 NCES Data
Variable Sample Mean SD Skew Kurt Min Q25 Q50 Q75 Max %Min %Max N All .514 .114 .721 8.021 .000 .463 .508 .556 1.000 .823 1.891 50,398 DDS .509 .097 -.051 6.842 .000 .461 .509 .557 1.000 .529 .463 4,537 SSP .490 .068 .269 -.718 .364 .434 .466 .549 .645 2.273 2.273 44
Male
Non-SSP .514 .114 .721 8.018 .000 .463 .508 .556 1.000 .824 1.893 50,354 All .477 .114 -.632 7.961 .000 .436 .482 .528 1.000 1.939 .814 50,398 DDS .478 .096 .150 7.327 .000 .432 .478 .525 1.000 .485 .529 4,537 SSP .467 .079 -.498 .712 .239 .429 .468 .536 .623 2.273 2.273 44
Female
Non-SSP .477 .114 -.633 7.960 .000 .436 .482 .528 1.000 1.940 .814 50,354 All .022 .107 7.584 61.434 .000 .000 .000 .007 1.000 73.178 .708 50,398 DDS .033 .130 6.167 39.597 .000 .000 .000 .017 1.000 63.985 .882 4,537 SSP .039 .136 4.178 18.172 .000 .000 .000 .012 .741 72.727 2.273 44
American Indian / Alaskan Native
Non-SSP .022 .107 7.589 61.517 .000 .000 .000 .007 1.000 73.178 .709 50,354 All .042 .096 5.125 34.125 .000 .000 .010 .042 1.000 46.488 .083 50,398 DDS .033 .086 6.914 59.385 .000 .000 .004 .034 1.000 49.945 .022 4,537 SSP .010 .019 2.424 5.827 .000 .000 .000 .016 .081 65.909 2.273 44
Asian / Pacific Islander
Non-SSP .042 .096 5.123 34.096 .000 .000 .010 .042 1.000 46.471 .083 50,354 All .198 .270 1.577 1.392 .000 .013 .069 .273 1.000 22.080 1.107 50,398 DDS .158 .229 1.912 2.944 .000 .010 .058 .200 1.000 23.937 .375 4,537 SSP .119 .187 2.942 11.002 .000 .012 .038 .154 1.000 22.727 2.273 44
Hispanic
Non-SSP .198 .270 1.576 1.389 .000 .013 .069 .273 1.000 22.080 1.106 50,354 All .172 .267 1.911 2.621 .000 .000 .047 .204 1.000 26.997 2.107 50,398 DDS .101 .194 2.864 8.241 .000 .000 .022 .095 1.000 36.500 .573 4,537 SSP .086 .141 1.737 1.858 .000 .000 .013 .126 .490 38.636 2.273 44
Black
Non-SSP .172 .267 1.910 2.618 .000 .000 .047 .204 1.000 26.987 2.109 50,354
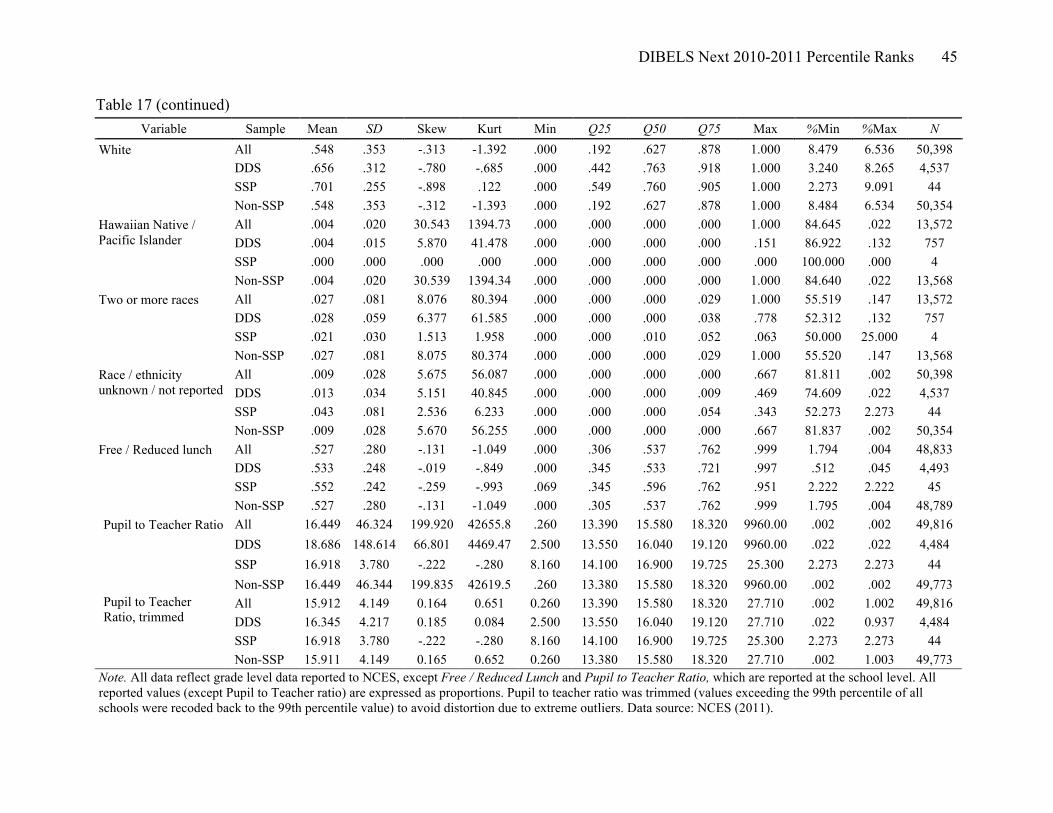
DIBELS Next 2010-2011 Percentile Ranks 45
Table 17 (continued) Variable Sample Mean SD Skew Kurt Min Q25 Q50 Q75 Max %Min %Max N
All .548 .353 -.313 -1.392 .000 .192 .627 .878 1.000 8.479 6.536 50,398 DDS .656 .312 -.780 -.685 .000 .442 .763 .918 1.000 3.240 8.265 4,537 SSP .701 .255 -.898 .122 .000 .549 .760 .905 1.000 2.273 9.091 44
White
Non-SSP .548 .353 -.312 -1.393 .000 .192 .627 .878 1.000 8.484 6.534 50,354 All .004 .020 30.543 1394.73 .000 .000 .000 .000 1.000 84.645 .022 13,572 DDS .004 .015 5.870 41.478 .000 .000 .000 .000 .151 86.922 .132 757 SSP .000 .000 .000 .000 .000 .000 .000 .000 .000 100.000 .000 4
Hawaiian Native / Pacific Islander
Non-SSP .004 .020 30.539 1394.34 .000 .000 .000 .000 1.000 84.640 .022 13,568 All .027 .081 8.076 80.394 .000 .000 .000 .029 1.000 55.519 .147 13,572 DDS .028 .059 6.377 61.585 .000 .000 .000 .038 .778 52.312 .132 757 SSP .021 .030 1.513 1.958 .000 .000 .010 .052 .063 50.000 25.000 4
Two or more races
Non-SSP .027 .081 8.075 80.374 .000 .000 .000 .029 1.000 55.520 .147 13,568 All .009 .028 5.675 56.087 .000 .000 .000 .000 .667 81.811 .002 50,398 DDS .013 .034 5.151 40.845 .000 .000 .000 .009 .469 74.609 .022 4,537 SSP .043 .081 2.536 6.233 .000 .000 .000 .054 .343 52.273 2.273 44
Race / ethnicity unknown / not reported
Non-SSP .009 .028 5.670 56.255 .000 .000 .000 .000 .667 81.837 .002 50,354 All .527 .280 -.131 -1.049 .000 .306 .537 .762 .999 1.794 .004 48,833 DDS .533 .248 -.019 -.849 .000 .345 .533 .721 .997 .512 .045 4,493 SSP .552 .242 -.259 -.993 .069 .345 .596 .762 .951 2.222 2.222 45
Free / Reduced lunch
Non-SSP .527 .280 -.131 -1.049 .000 .305 .537 .762 .999 1.795 .004 48,789 All 16.449 46.324 199.920 42655.8 .260 13.390 15.580 18.320 9960.00 .002 .002 49,816 DDS 18.686 148.614 66.801 4469.47 2.500 13.550 16.040 19.120 9960.00 .022 .022 4,484 SSP 16.918 3.780 -.222 -.280 8.160 14.100 16.900 19.725 25.300 2.273 2.273 44
Pupil to Teacher Ratio
Non-SSP 16.449 46.344 199.835 42619.5 .260 13.380 15.580 18.320 9960.00 .002 .002 49,773 All 15.912 4.149 0.164 0.651 0.260 13.390 15.580 18.320 27.710 .002 1.002 49,816 DDS 16.345 4.217 0.185 0.084 2.500 13.550 16.040 19.120 27.710 .022 0.937 4,484 SSP 16.918 3.780 -.222 -.280 8.160 14.100 16.900 19.725 25.300 2.273 2.273 44
Pupil to Teacher Ratio, trimmed
Non-SSP 15.911 4.149 0.165 0.652 0.260 13.380 15.580 18.320 27.710 .002 1.003 49,773 Note. All data reflect grade level data reported to NCES, except Free / Reduced Lunch and Pupil to Teacher Ratio, which are reported at the school level. All reported values (except Pupil to Teacher ratio) are expressed as proportions. Pupil to teacher ratio was trimmed (values exceeding the 99th percentile of all schools were recoded back to the 99th percentile value) to avoid distortion due to extreme outliers. Data source: NCES (2011).
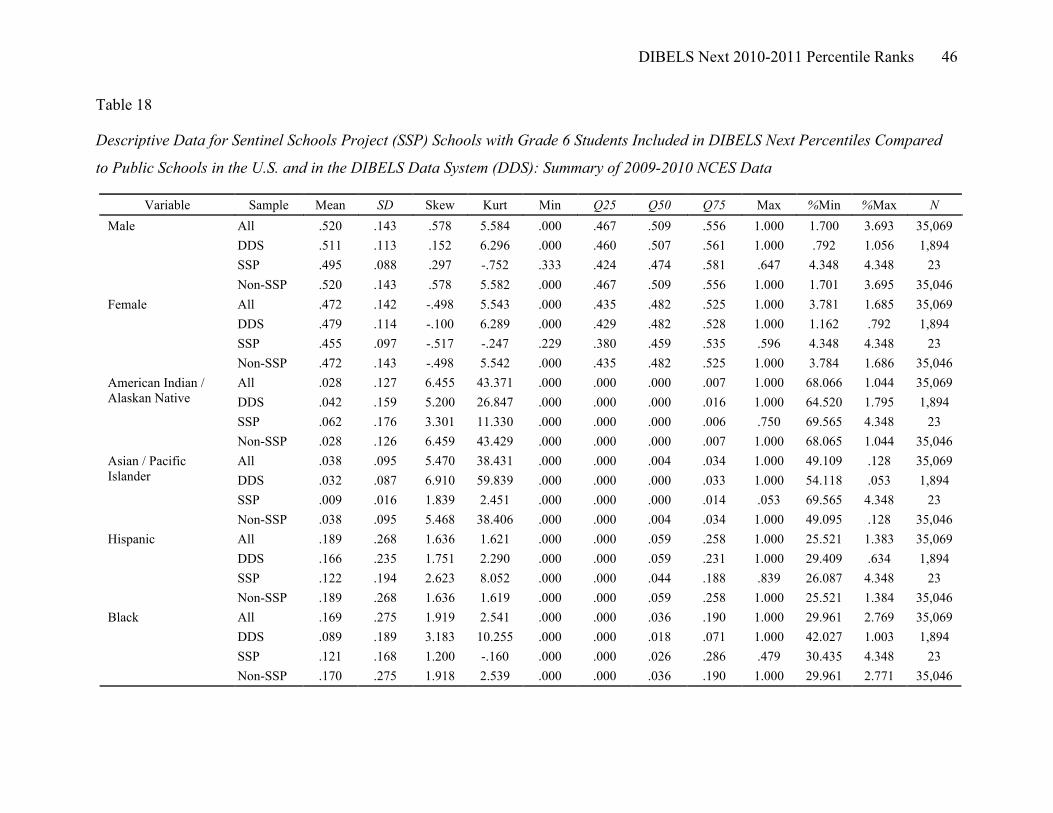
DIBELS Next 2010-2011 Percentile Ranks 46
Table 18
Descriptive Data for Sentinel Schools Project (SSP) Schools with Grade 6 Students Included in DIBELS Next Percentiles Compared
to Public Schools in the U.S. and in the DIBELS Data System (DDS): Summary of 2009-2010 NCES Data
Variable Sample Mean SD Skew Kurt Min Q25 Q50 Q75 Max %Min %Max N All .520 .143 .578 5.584 .000 .467 .509 .556 1.000 1.700 3.693 35,069 DDS .511 .113 .152 6.296 .000 .460 .507 .561 1.000 .792 1.056 1,894 SSP .495 .088 .297 -.752 .333 .424 .474 .581 .647 4.348 4.348 23
Male
Non-SSP .520 .143 .578 5.582 .000 .467 .509 .556 1.000 1.701 3.695 35,046 All .472 .142 -.498 5.543 .000 .435 .482 .525 1.000 3.781 1.685 35,069 DDS .479 .114 -.100 6.289 .000 .429 .482 .528 1.000 1.162 .792 1,894 SSP .455 .097 -.517 -.247 .229 .380 .459 .535 .596 4.348 4.348 23
Female
Non-SSP .472 .143 -.498 5.542 .000 .435 .482 .525 1.000 3.784 1.686 35,046 All .028 .127 6.455 43.371 .000 .000 .000 .007 1.000 68.066 1.044 35,069 DDS .042 .159 5.200 26.847 .000 .000 .000 .016 1.000 64.520 1.795 1,894 SSP .062 .176 3.301 11.330 .000 .000 .000 .006 .750 69.565 4.348 23
American Indian / Alaskan Native
Non-SSP .028 .126 6.459 43.429 .000 .000 .000 .007 1.000 68.065 1.044 35,046 All .038 .095 5.470 38.431 .000 .000 .004 .034 1.000 49.109 .128 35,069 DDS .032 .087 6.910 59.839 .000 .000 .000 .033 1.000 54.118 .053 1,894 SSP .009 .016 1.839 2.451 .000 .000 .000 .014 .053 69.565 4.348 23
Asian / Pacific Islander
Non-SSP .038 .095 5.468 38.406 .000 .000 .004 .034 1.000 49.095 .128 35,046 All .189 .268 1.636 1.621 .000 .000 .059 .258 1.000 25.521 1.383 35,069 DDS .166 .235 1.751 2.290 .000 .000 .059 .231 1.000 29.409 .634 1,894 SSP .122 .194 2.623 8.052 .000 .000 .044 .188 .839 26.087 4.348 23
Hispanic
Non-SSP .189 .268 1.636 1.619 .000 .000 .059 .258 1.000 25.521 1.384 35,046 All .169 .275 1.919 2.541 .000 .000 .036 .190 1.000 29.961 2.769 35,069 DDS .089 .189 3.183 10.255 .000 .000 .018 .071 1.000 42.027 1.003 1,894 SSP .121 .168 1.200 -.160 .000 .000 .026 .286 .479 30.435 4.348 23
Black
Non-SSP .170 .275 1.918 2.539 .000 .000 .036 .190 1.000 29.961 2.771 35,046
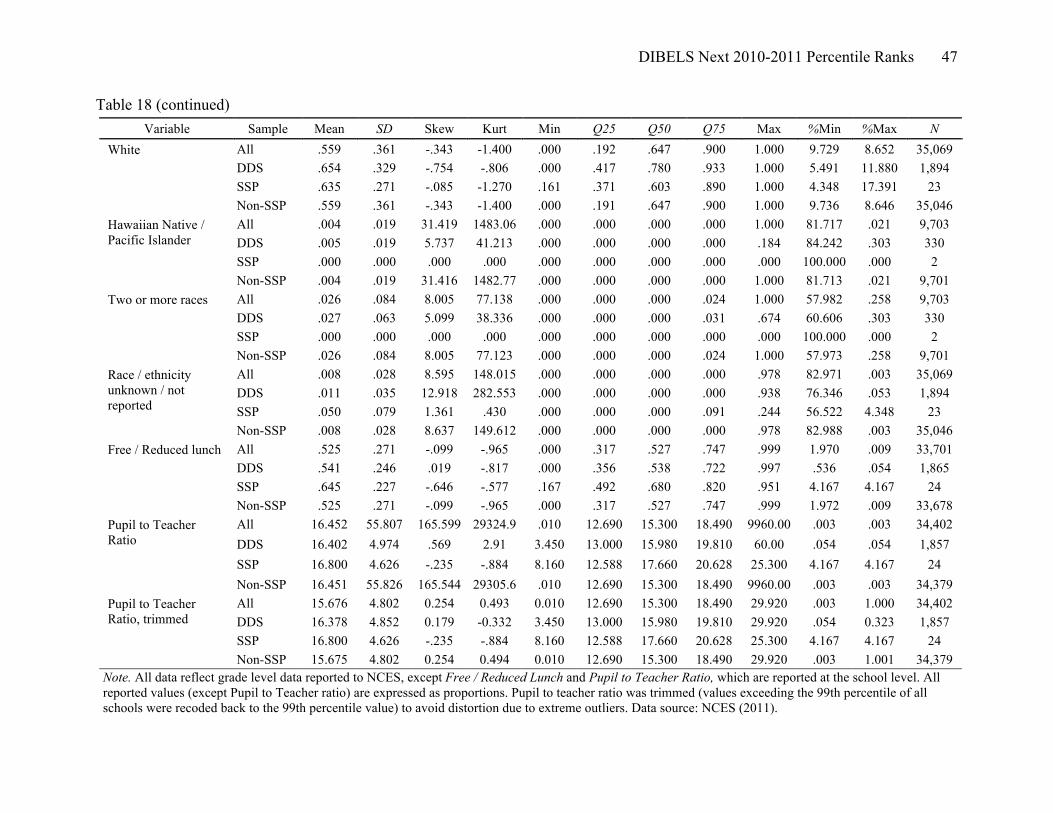
DIBELS Next 2010-2011 Percentile Ranks 47
Table 18 (continued) Variable Sample Mean SD Skew Kurt Min Q25 Q50 Q75 Max %Min %Max N
All .559 .361 -.343 -1.400 .000 .192 .647 .900 1.000 9.729 8.652 35,069 DDS .654 .329 -.754 -.806 .000 .417 .780 .933 1.000 5.491 11.880 1,894 SSP .635 .271 -.085 -1.270 .161 .371 .603 .890 1.000 4.348 17.391 23
White
Non-SSP .559 .361 -.343 -1.400 .000 .191 .647 .900 1.000 9.736 8.646 35,046 All .004 .019 31.419 1483.06 .000 .000 .000 .000 1.000 81.717 .021 9,703 DDS .005 .019 5.737 41.213 .000 .000 .000 .000 .184 84.242 .303 330 SSP .000 .000 .000 .000 .000 .000 .000 .000 .000 100.000 .000 2
Hawaiian Native / Pacific Islander
Non-SSP .004 .019 31.416 1482.77 .000 .000 .000 .000 1.000 81.713 .021 9,701 All .026 .084 8.005 77.138 .000 .000 .000 .024 1.000 57.982 .258 9,703 DDS .027 .063 5.099 38.336 .000 .000 .000 .031 .674 60.606 .303 330 SSP .000 .000 .000 .000 .000 .000 .000 .000 .000 100.000 .000 2
Two or more races
Non-SSP .026 .084 8.005 77.123 .000 .000 .000 .024 1.000 57.973 .258 9,701 All .008 .028 8.595 148.015 .000 .000 .000 .000 .978 82.971 .003 35,069 DDS .011 .035 12.918 282.553 .000 .000 .000 .000 .938 76.346 .053 1,894 SSP .050 .079 1.361 .430 .000 .000 .000 .091 .244 56.522 4.348 23
Race / ethnicity unknown / not reported
Non-SSP .008 .028 8.637 149.612 .000 .000 .000 .000 .978 82.988 .003 35,046 All .525 .271 -.099 -.965 .000 .317 .527 .747 .999 1.970 .009 33,701 DDS .541 .246 .019 -.817 .000 .356 .538 .722 .997 .536 .054 1,865 SSP .645 .227 -.646 -.577 .167 .492 .680 .820 .951 4.167 4.167 24
Free / Reduced lunch
Non-SSP .525 .271 -.099 -.965 .000 .317 .527 .747 .999 1.972 .009 33,678 All 16.452 55.807 165.599 29324.9 .010 12.690 15.300 18.490 9960.00 .003 .003 34,402 DDS 16.402 4.974 .569 2.91 3.450 13.000 15.980 19.810 60.00 .054 .054 1,857 SSP 16.800 4.626 -.235 -.884 8.160 12.588 17.660 20.628 25.300 4.167 4.167 24
Pupil to Teacher Ratio
Non-SSP 16.451 55.826 165.544 29305.6 .010 12.690 15.300 18.490 9960.00 .003 .003 34,379 All 15.676 4.802 0.254 0.493 0.010 12.690 15.300 18.490 29.920 .003 1.000 34,402 DDS 16.378 4.852 0.179 -0.332 3.450 13.000 15.980 19.810 29.920 .054 0.323 1,857 SSP 16.800 4.626 -.235 -.884 8.160 12.588 17.660 20.628 25.300 4.167 4.167 24
Pupil to Teacher Ratio, trimmed
Non-SSP 15.675 4.802 0.254 0.494 0.010 12.690 15.300 18.490 29.920 .003 1.001 34,379 Note. All data reflect grade level data reported to NCES, except Free / Reduced Lunch and Pupil to Teacher Ratio, which are reported at the school level. All reported values (except Pupil to Teacher ratio) are expressed as proportions. Pupil to teacher ratio was trimmed (values exceeding the 99th percentile of all schools were recoded back to the 99th percentile value) to avoid distortion due to extreme outliers. Data source: NCES (2011).
DIBELS Next 2010-2011 Percentile Ranks 48
Other meaningful differences in demographic composition in our SSP sample relative to
remaining U.S. schools include fewer overall numbers of students who are Black (10% versus
15.6%; kindergarten es = .21), students who are Hispanic (10% versus 20%; kindergarten es =
.38), and students who are Asian/Pacific Islander (1.4% versus 4.3%; kindergarten es = .31).
These differences result in small to medium effect size estimates, and should factor in to a
school's decision-making practices when determining the appropriateness of the current
comparison group for their students.
Sentinel schools represent the typical U.S. public school well in terms of overall rate for
free/reduced price lunch (Mdn = 54.5% of qualifying students in SSP schools; Mdn = 52.4% in
non-SSP schools). As noted in Tables 11 and 18, the schools that serve 6th grade students in our
sample are more likely to be Title I eligible than the average U.S. school (71% compared with
51%). Sixth grade schools in our sample also have more students who qualify for free/reduced
price lunch (64.5% compared with 52.5%). In terms of class sizes (expressed as pupil-to-teacher
ratio in tables 12 – 18), SSP schools show no meaningful differences from all other non-SSP
U.S. schools. The median pupil-to-teacher ratio in SSP schools is 16.051; the median for non-
SSP schools is 16.412.
In addition to the demographic characteristics listed above, we also know that schools in
our sample have varying levels of familiarity and experience with DIBELS (years of use range =
1 year to 10 or more years). Most SSP schools (76.5%) had been using DIBELS measures for the
previous 7 years (see Smith et al., 2011 for more information about data collection practices in
the SSP).
DIBELS Next 2010-2011 Percentile Ranks 49
Additional Considerations
It is important to be aware that although the participating schools and districts in this
report are distributed widely across the country (see Tables 5 - 11), they may not be fully
representative of the instruction and assessment practices that are used throughout the U.S. As
noted in the initial summary of DIBELS benchmark goals (found in Good, Wallin, Simmons,
Kame'enui, & Kaminski, 2002), DDS schools may be more likely than average U.S. schools to
engage in practices that support early literacy development. Schools and districts in our sample
may also be more likely to be invested in the beginning reading core areas of phonemic
awareness, phonics, and fluency with connected text (National Reading Panel, 2000). They also
may be more likely to engage in universal screening and progress monitoring with their students.
If your school is currently using the DDS, then we argue that this comparison group still
provides important contextual information regarding your school's performance. However, we
must point out that our sample has not been randomly selected, it is not a probability sample, and
the data were collected with few constraints other than the ones listed above.
Example of Recommended Standards for Describing Student Performance Using the
Percentiles in this Report
Recall that the language used to describe percentile scores should convey as much
information as possible, including a description of what is being measured and the group to
which the individual is being compared. Based on the information about our participant sample,
a complete interpretation of an individual student’s performance on a given DIBELS Next
measure is therefore as follows:
In (time of year), (name of student) performed as well as or better than XX% of students
included in the 2010-2011 DDS percentile sample for (name of measure), a task that
DIBELS Next 2010-2011 Percentile Ranks 50
requires students to (description of task). This comparison sample included students in
public schools that use the DDS and chose to participate in the Sentinel Schools Project
(SSP), a research initiative examining aspects of the DIBELS Next measures, including
normative and criterion-referenced score information. This means that (name of student)
performed in the (descriptor from Table 1) range relative to other students in this group.
For example:
In the fall, Sarah performed as well as or better than 63% of students included in the
2010-2011 DDS percentile sample for DIBELS Letter Naming Fluency, a task that
requires students to name randomly ordered printed letters. This comparison sample
included students in public schools that use the DDS and chose to participate in the
Sentinel Schools Project (SSP), a research initiative examining aspects of the DIBELS
Next measures, including normative and criterion-referenced score information. This
means that Sarah performed in the average range relative to other students in this group.
Results
Results are reported in sections according to grade level. Each section includes two
tables. The first table provides DIBELS Next descriptive statistics, including: (a) the mean,
standard deviation, 25th, 50th, and 75th percentiles, (b) the number of districts, schools, and
students included in the analyses at each time point, and (c) the percent of students at each time
point who performed in the “well below benchmark,” “below benchmark,” and “benchmark”
score ranges (as defined in Good et al., 2011) for measures that have defined cut scores for these
categories. The second table in each section reports the percentiles for each measure. The
percentiles for the composite score are reported for all grades in Table 33 (pp. 105 - 127).
DIBELS Next 2010-2011 Percentile Ranks 51
We computed the percentiles for each score on each measure by adding the percent of
students who scored below that score to one half of the percent of students at that score (Salvia &
Ysseldyke, 2004). For example, the percentile for a score of 10 on LNF in the fall of
kindergarten was obtained by adding the percent of students who scored below a score of 10
(33.84%) to half of the percent of students that scored exactly 10 (.5 * 1.87%), resulting in a
percentile score of 34.76. We round reported percentiles to the nearest whole number using
standard conventions. This methodology is consistent with that used in the previous report of
system-wide percentiles for DIBELS 6th edition measures (Good et al., 2002).
Percentiles are reported at each time point a measure is offered, including: FSF at the
beginning and middle of kindergarten; LNF from the beginning of kindergarten through the
beginning of first grade; PSF from the middle of kindergarten through the end of first grade;
NWF (both CLS and WWR scores) from the middle of kindergarten through the beginning of
second grade; ORF and Retell from the middle of first grade through sixth grade; and Daze from
the beginning of third grade through sixth grade.
When examining the percentiles for the ORF-Errors and the Daze-Errors scores, note that
the valences (i.e., values) for these scores are reversed. Because fewer errors are more desirable,
higher percentiles always indicate better performance. That is, few errors result in a higher
percentile, and many errors result in a lower percentile.
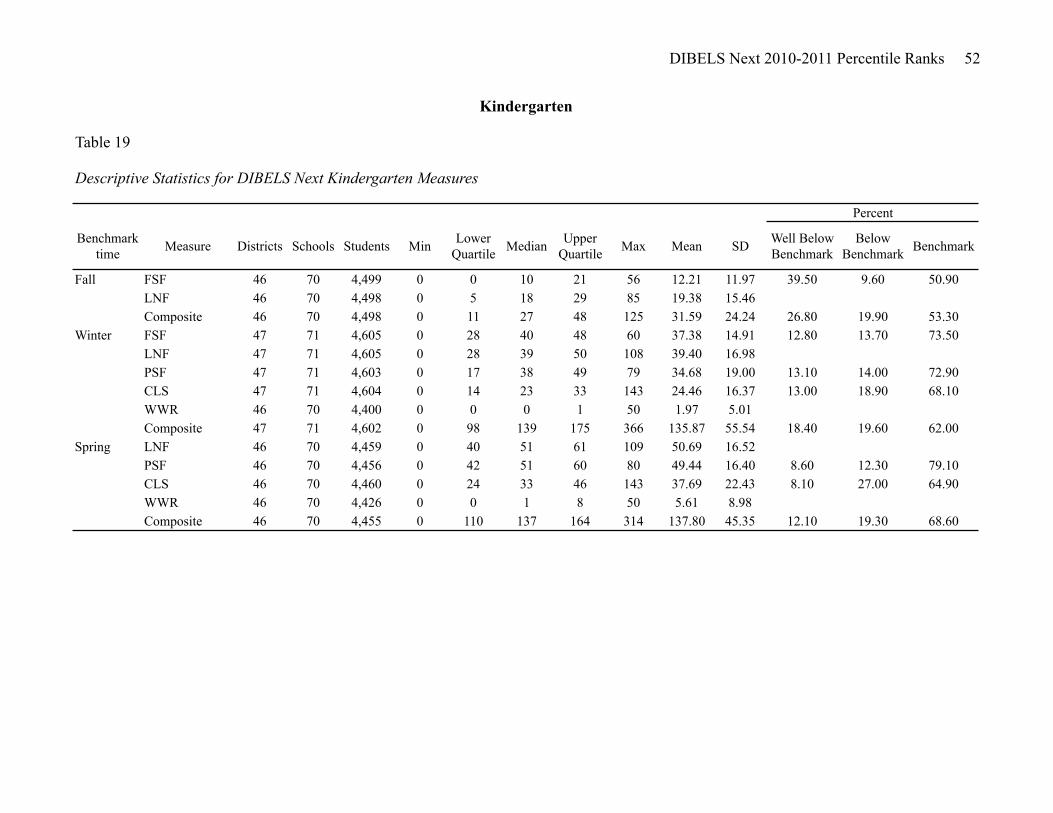
DIBELS Next 2010-2011 Percentile Ranks 52
Table 19
Descriptive Statistics for DIBELS Next Kindergarten Measures
Benchmark time Measure Districts Schools Students Min Lower
Quartile Median Upper Quartile Max Mean SD Well Below
BenchmarkBelow
Benchmark Benchmark
Fall FSF 46 70 4,499 0 0 10 21 56 12.21 11.97 39.50 9.60 50.90LNF 46 70 4,498 0 5 18 29 85 19.38 15.46Composite 46 70 4,498 0 11 27 48 125 31.59 24.24 26.80 19.90 53.30
Winter FSF 47 71 4,605 0 28 40 48 60 37.38 14.91 12.80 13.70 73.50LNF 47 71 4,605 0 28 39 50 108 39.40 16.98PSF 47 71 4,603 0 17 38 49 79 34.68 19.00 13.10 14.00 72.90CLS 47 71 4,604 0 14 23 33 143 24.46 16.37 13.00 18.90 68.10WWR 46 70 4,400 0 0 0 1 50 1.97 5.01Composite 47 71 4,602 0 98 139 175 366 135.87 55.54 18.40 19.60 62.00
Spring LNF 46 70 4,459 0 40 51 61 109 50.69 16.52PSF 46 70 4,456 0 42 51 60 80 49.44 16.40 8.60 12.30 79.10CLS 46 70 4,460 0 24 33 46 143 37.69 22.43 8.10 27.00 64.90WWR 46 70 4,426 0 0 1 8 50 5.61 8.98Composite 46 70 4,455 0 110 137 164 314 137.80 45.35 12.10 19.30 68.60
Percent
Kindergarten
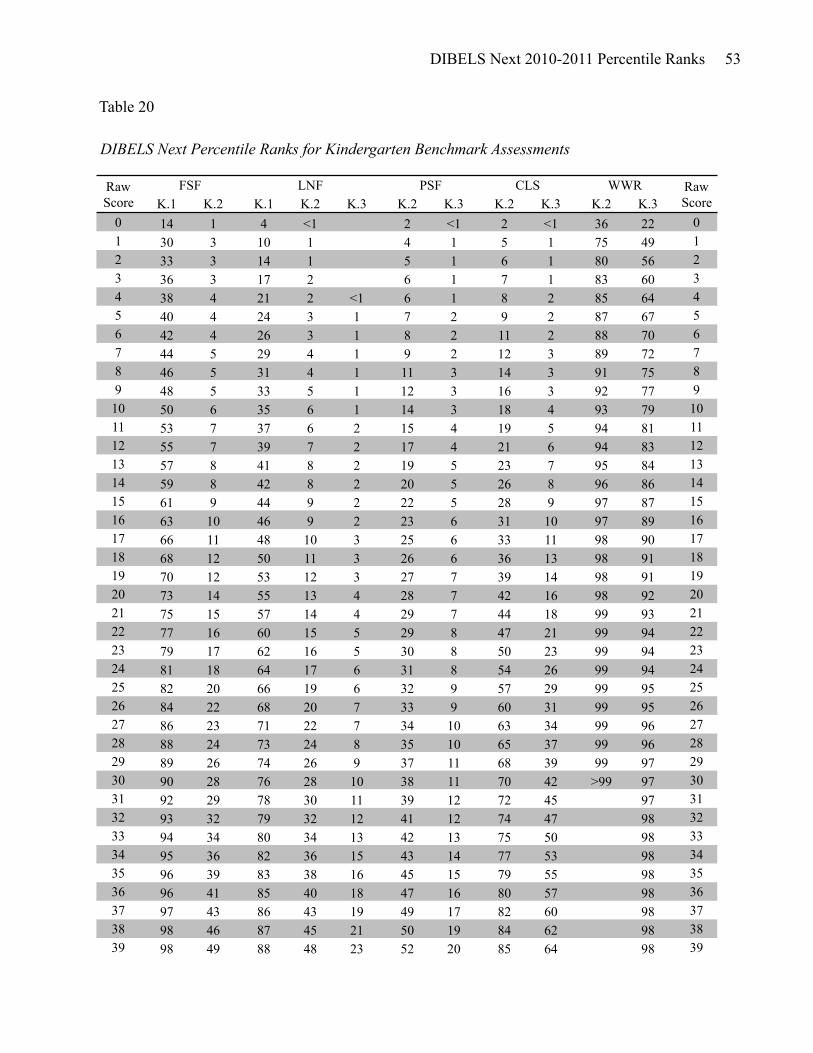
DIBELS Next 2010-2011 Percentile Ranks 53
K.1 K.2 K.1 K.2 K.3 K.2 K.3 K.2 K.3 K.2 K.30 14 1 4 <1 2 <1 2 <1 36 22 01 30 3 10 1 4 1 5 1 75 49 12 33 3 14 1 5 1 6 1 80 56 23 36 3 17 2 6 1 7 1 83 60 34 38 4 21 2 <1 6 1 8 2 85 64 45 40 4 24 3 1 7 2 9 2 87 67 56 42 4 26 3 1 8 2 11 2 88 70 67 44 5 29 4 1 9 2 12 3 89 72 78 46 5 31 4 1 11 3 14 3 91 75 89 48 5 33 5 1 12 3 16 3 92 77 9
10 50 6 35 6 1 14 3 18 4 93 79 1011 53 7 37 6 2 15 4 19 5 94 81 1112 55 7 39 7 2 17 4 21 6 94 83 1213 57 8 41 8 2 19 5 23 7 95 84 1314 59 8 42 8 2 20 5 26 8 96 86 1415 61 9 44 9 2 22 5 28 9 97 87 1516 63 10 46 9 2 23 6 31 10 97 89 1617 66 11 48 10 3 25 6 33 11 98 90 1718 68 12 50 11 3 26 6 36 13 98 91 1819 70 12 53 12 3 27 7 39 14 98 91 1920 73 14 55 13 4 28 7 42 16 98 92 2021 75 15 57 14 4 29 7 44 18 99 93 2122 77 16 60 15 5 29 8 47 21 99 94 2223 79 17 62 16 5 30 8 50 23 99 94 2324 81 18 64 17 6 31 8 54 26 99 94 2425 82 20 66 19 6 32 9 57 29 99 95 2526 84 22 68 20 7 33 9 60 31 99 95 2627 86 23 71 22 7 34 10 63 34 99 96 2728 88 24 73 24 8 35 10 65 37 99 96 2829 89 26 74 26 9 37 11 68 39 99 97 2930 90 28 76 28 10 38 11 70 42 >99 97 3031 92 29 78 30 11 39 12 72 45 97 3132 93 32 79 32 12 41 12 74 47 98 3233 94 34 80 34 13 42 13 75 50 98 3334 95 36 82 36 15 43 14 77 53 98 3435 96 39 83 38 16 45 15 79 55 98 3536 96 41 85 40 18 47 16 80 57 98 3637 97 43 86 43 19 49 17 82 60 98 3738 98 46 87 45 21 50 19 84 62 98 3839 98 49 88 48 23 52 20 85 64 98 39
Table 20
DIBELS Next Percentile Ranks for Kindergarten Benchmark Assessments
Raw Score
Raw Score
FSF LNF PSF CLS WWR
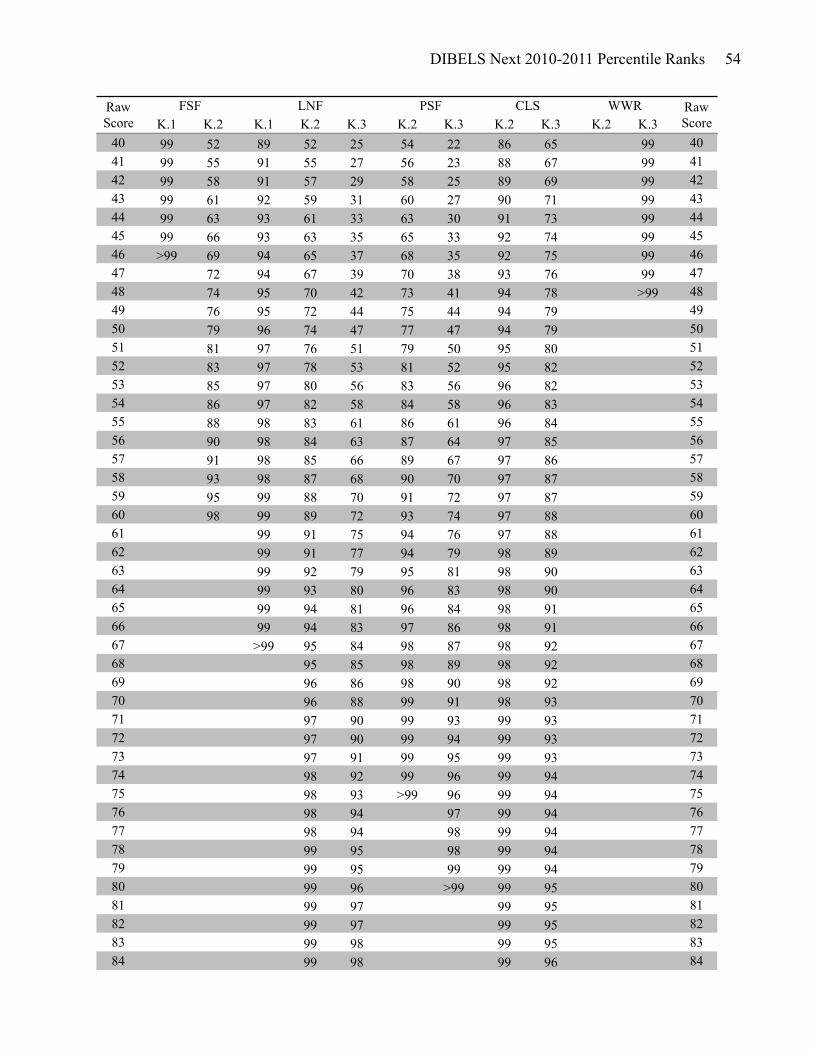
DIBELS Next 2010-2011 Percentile Ranks 54
K.1 K.2 K.1 K.2 K.3 K.2 K.3 K.2 K.3 K.2 K.3Raw Score
Raw Score
FSF LNF PSF CLS WWR
40 99 52 89 52 25 54 22 86 65 99 4041 99 55 91 55 27 56 23 88 67 99 4142 99 58 91 57 29 58 25 89 69 99 4243 99 61 92 59 31 60 27 90 71 99 4344 99 63 93 61 33 63 30 91 73 99 4445 99 66 93 63 35 65 33 92 74 99 4546 >99 69 94 65 37 68 35 92 75 99 4647 72 94 67 39 70 38 93 76 99 4748 74 95 70 42 73 41 94 78 >99 4849 76 95 72 44 75 44 94 79 4950 79 96 74 47 77 47 94 79 5051 81 97 76 51 79 50 95 80 5152 83 97 78 53 81 52 95 82 5253 85 97 80 56 83 56 96 82 5354 86 97 82 58 84 58 96 83 5455 88 98 83 61 86 61 96 84 5556 90 98 84 63 87 64 97 85 5657 91 98 85 66 89 67 97 86 5758 93 98 87 68 90 70 97 87 5859 95 99 88 70 91 72 97 87 5960 98 99 89 72 93 74 97 88 6061 99 91 75 94 76 97 88 6162 99 91 77 94 79 98 89 6263 99 92 79 95 81 98 90 6364 99 93 80 96 83 98 90 6465 99 94 81 96 84 98 91 6566 99 94 83 97 86 98 91 6667 >99 95 84 98 87 98 92 6768 95 85 98 89 98 92 6869 96 86 98 90 98 92 6970 96 88 99 91 98 93 7071 97 90 99 93 99 93 7172 97 90 99 94 99 93 7273 97 91 99 95 99 93 7374 98 92 99 96 99 94 7475 98 93 >99 96 99 94 7576 98 94 97 99 94 7677 98 94 98 99 94 7778 99 95 98 99 94 7879 99 95 99 99 94 7980 99 96 >99 99 95 8081 99 97 99 95 8182 99 97 99 95 8283 99 98 99 95 8384 99 98 99 96 84
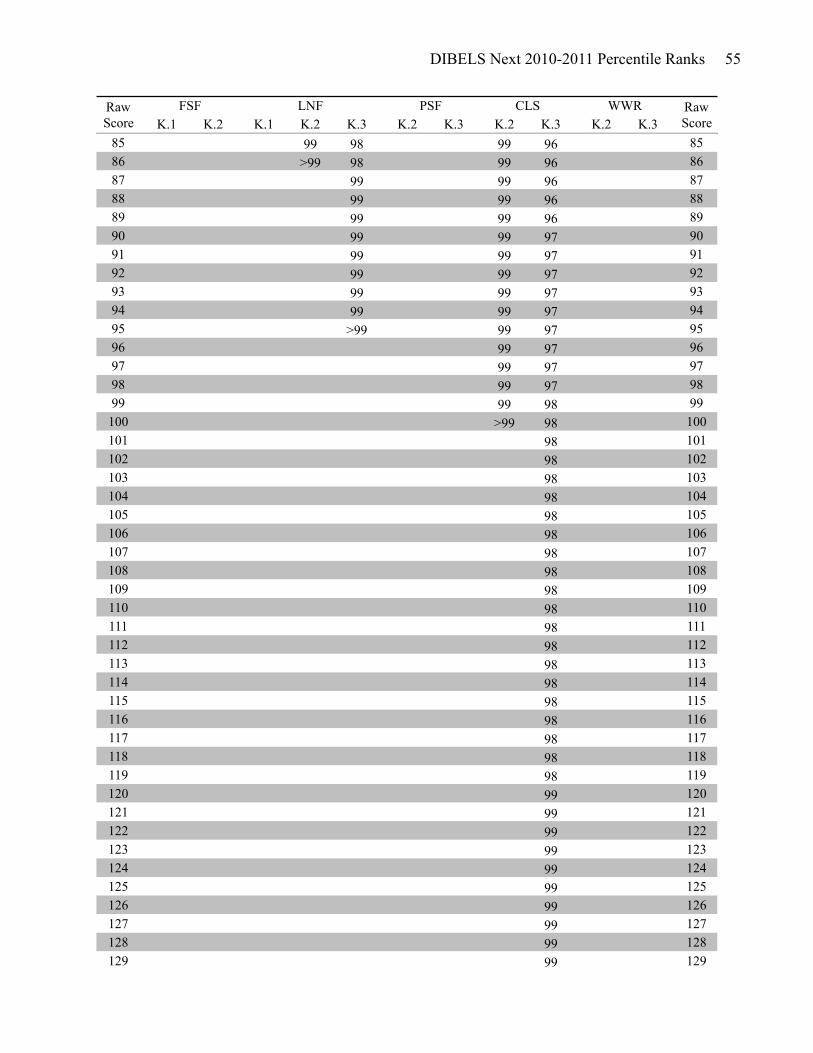
DIBELS Next 2010-2011 Percentile Ranks 55
K.1 K.2 K.1 K.2 K.3 K.2 K.3 K.2 K.3 K.2 K.3Raw Score
Raw Score
FSF LNF PSF CLS WWR
85 99 98 99 96 8586 >99 98 99 96 8687 99 99 96 8788 99 99 96 8889 99 99 96 8990 99 99 97 9091 99 99 97 9192 99 99 97 9293 99 99 97 9394 99 99 97 9495 >99 99 97 9596 99 97 9697 99 97 9798 99 97 9899 99 98 99100 >99 98 100101 98 101102 98 102103 98 103104 98 104105 98 105106 98 106107 98 107108 98 108109 98 109110 98 110111 98 111112 98 112113 98 113114 98 114115 98 115116 98 116117 98 117118 98 118119 98 119120 99 120121 99 121122 99 122123 99 123124 99 124125 99 125126 99 126127 99 127128 99 128129 99 129
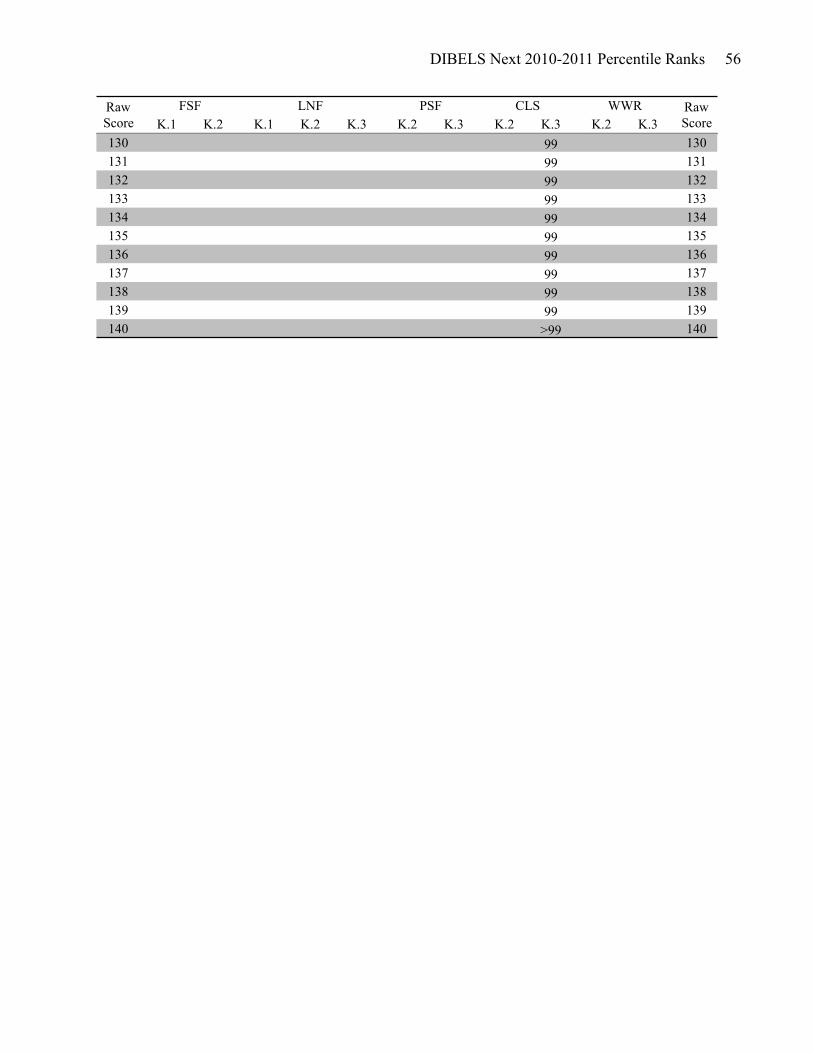
DIBELS Next 2010-2011 Percentile Ranks 56
K.1 K.2 K.1 K.2 K.3 K.2 K.3 K.2 K.3 K.2 K.3Raw Score
Raw Score
FSF LNF PSF CLS WWR
130 99 130131 99 131132 99 132133 99 133134 99 134135 99 135136 99 136137 99 137138 99 138139 99 139140 >99 140
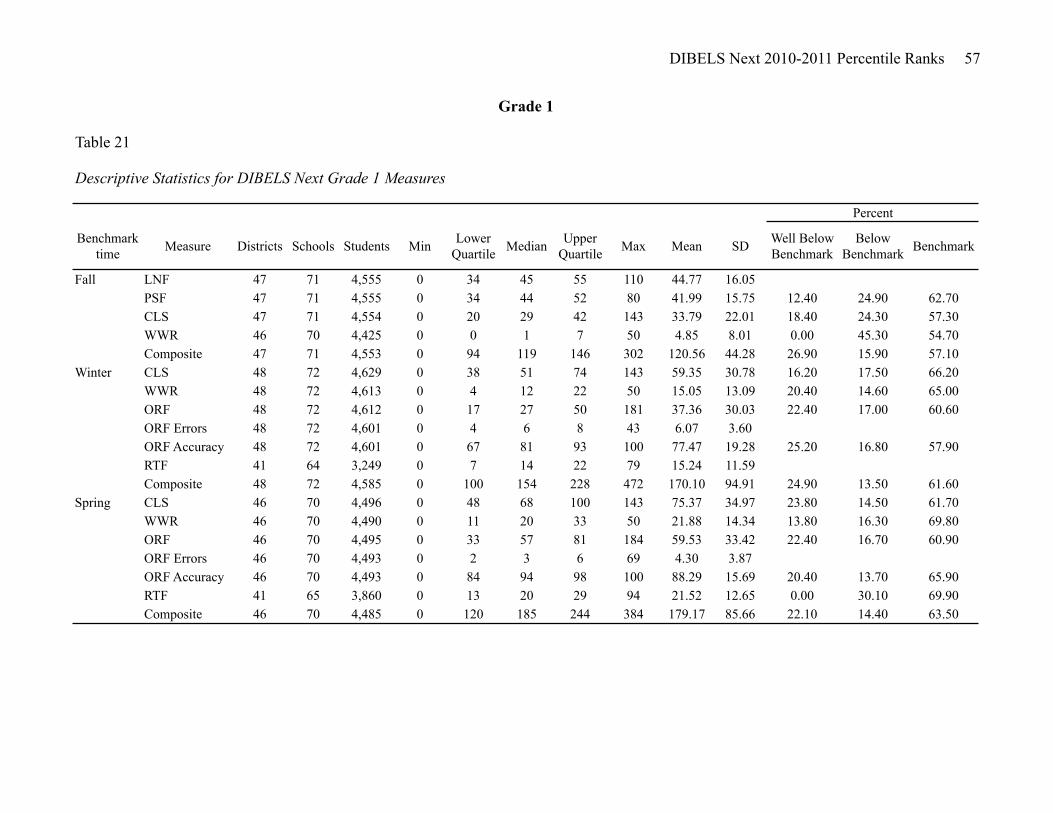
DIBELS Next 2010-2011 Percentile Ranks 57
Table 21
Descriptive Statistics for DIBELS Next Grade 1 Measures
Benchmark time Measure Districts Schools Students Min Lower
Quartile Median Upper Quartile Max Mean SD Well Below
BenchmarkBelow
Benchmark Benchmark
Fall LNF 47 71 4,555 0 34 45 55 110 44.77 16.05PSF 47 71 4,555 0 34 44 52 80 41.99 15.75 12.40 24.90 62.70CLS 47 71 4,554 0 20 29 42 143 33.79 22.01 18.40 24.30 57.30WWR 46 70 4,425 0 0 1 7 50 4.85 8.01 0.00 45.30 54.70Composite 47 71 4,553 0 94 119 146 302 120.56 44.28 26.90 15.90 57.10
Winter CLS 48 72 4,629 0 38 51 74 143 59.35 30.78 16.20 17.50 66.20WWR 48 72 4,613 0 4 12 22 50 15.05 13.09 20.40 14.60 65.00ORF 48 72 4,612 0 17 27 50 181 37.36 30.03 22.40 17.00 60.60ORF Errors 48 72 4,601 0 4 6 8 43 6.07 3.60ORF Accuracy 48 72 4,601 0 67 81 93 100 77.47 19.28 25.20 16.80 57.90RTF 41 64 3,249 0 7 14 22 79 15.24 11.59Composite 48 72 4,585 0 100 154 228 472 170.10 94.91 24.90 13.50 61.60
Spring CLS 46 70 4,496 0 48 68 100 143 75.37 34.97 23.80 14.50 61.70WWR 46 70 4,490 0 11 20 33 50 21.88 14.34 13.80 16.30 69.80ORF 46 70 4,495 0 33 57 81 184 59.53 33.42 22.40 16.70 60.90ORF Errors 46 70 4,493 0 2 3 6 69 4.30 3.87ORF Accuracy 46 70 4,493 0 84 94 98 100 88.29 15.69 20.40 13.70 65.90RTF 41 65 3,860 0 13 20 29 94 21.52 12.65 0.00 30.10 69.90Composite 46 70 4,485 0 120 185 244 384 179.17 85.66 22.10 14.40 63.50
Percent
Grade 1
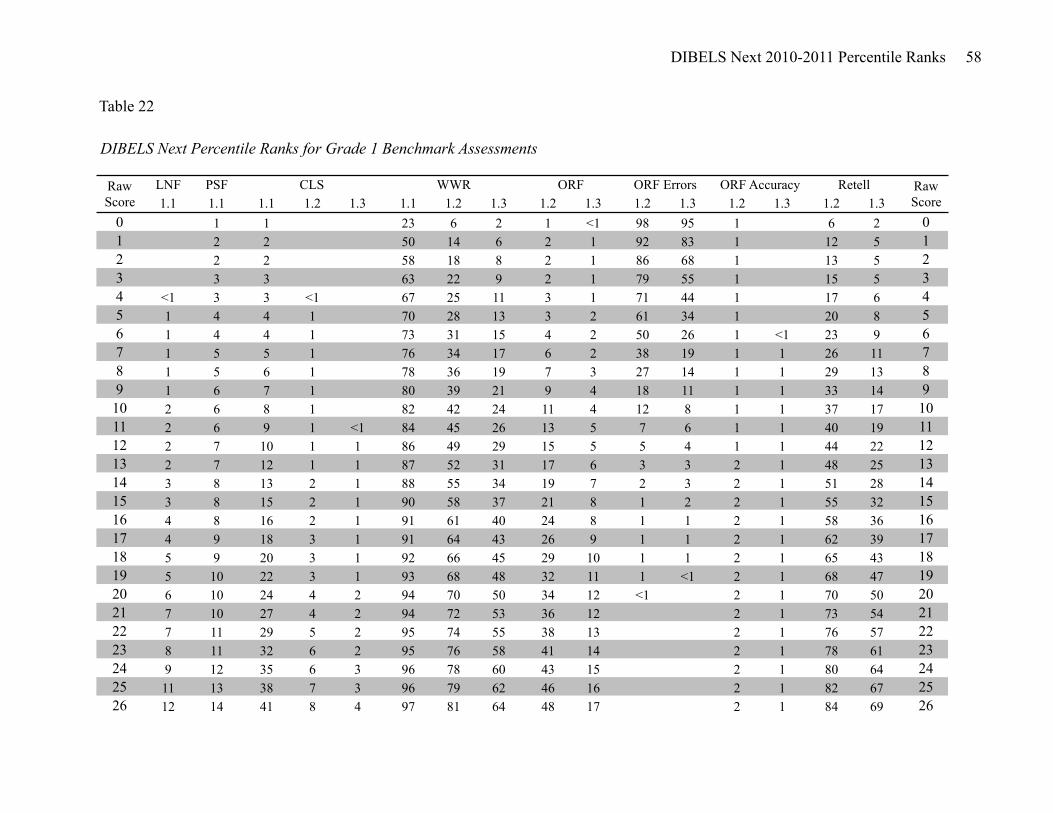
DIBELS Next 2010-2011 Percentile Ranks 58
LNF PSF1.1 1.1 1.1 1.2 1.3 1.1 1.2 1.3 1.2 1.3 1.2 1.3 1.2 1.3 1.2 1.3
0 1 1 23 6 2 1 <1 98 95 1 6 2 01 2 2 50 14 6 2 1 92 83 1 12 5 12 2 2 58 18 8 2 1 86 68 1 13 5 23 3 3 63 22 9 2 1 79 55 1 15 5 34 <1 3 3 <1 67 25 11 3 1 71 44 1 17 6 45 1 4 4 1 70 28 13 3 2 61 34 1 20 8 56 1 4 4 1 73 31 15 4 2 50 26 1 <1 23 9 67 1 5 5 1 76 34 17 6 2 38 19 1 1 26 11 78 1 5 6 1 78 36 19 7 3 27 14 1 1 29 13 89 1 6 7 1 80 39 21 9 4 18 11 1 1 33 14 910 2 6 8 1 82 42 24 11 4 12 8 1 1 37 17 1011 2 6 9 1 <1 84 45 26 13 5 7 6 1 1 40 19 1112 2 7 10 1 1 86 49 29 15 5 5 4 1 1 44 22 1213 2 7 12 1 1 87 52 31 17 6 3 3 2 1 48 25 1314 3 8 13 2 1 88 55 34 19 7 2 3 2 1 51 28 1415 3 8 15 2 1 90 58 37 21 8 1 2 2 1 55 32 1516 4 8 16 2 1 91 61 40 24 8 1 1 2 1 58 36 1617 4 9 18 3 1 91 64 43 26 9 1 1 2 1 62 39 1718 5 9 20 3 1 92 66 45 29 10 1 1 2 1 65 43 1819 5 10 22 3 1 93 68 48 32 11 1 <1 2 1 68 47 1920 6 10 24 4 2 94 70 50 34 12 <1 2 1 70 50 2021 7 10 27 4 2 94 72 53 36 12 2 1 73 54 2122 7 11 29 5 2 95 74 55 38 13 2 1 76 57 2223 8 11 32 6 2 95 76 58 41 14 2 1 78 61 2324 9 12 35 6 3 96 78 60 43 15 2 1 80 64 2425 11 13 38 7 3 96 79 62 46 16 2 1 82 67 2526 12 14 41 8 4 97 81 64 48 17 2 1 84 69 26
Table 22
DIBELS Next Percentile Ranks for Grade 1 Benchmark Assessments
Retell Raw Score
Raw Score
CLS WWR ORF ORF Errors ORF Accuracy

DIBELS Next 2010-2011 Percentile Ranks 59
LNF PSF1.1 1.1 1.1 1.2 1.3 1.1 1.2 1.3 1.2 1.3 1.2 1.3 1.2 1.3 1.2 1.3
Retell Raw Score
Raw Score
CLS WWR ORF ORF Errors ORF Accuracy
27 13 14 44 9 4 97 82 66 50 18 2 1 85 71 2728 15 15 47 10 5 97 83 68 52 19 2 1 87 74 2829 16 16 49 12 5 98 84 69 53 20 2 1 88 75 2930 18 17 52 13 6 98 85 71 55 21 3 1 90 77 3031 19 19 54 14 7 98 86 73 57 22 3 1 91 80 3132 21 20 57 16 8 98 87 74 58 23 3 1 92 81 3233 22 22 59 17 9 98 88 75 60 25 3 2 92 83 3334 24 24 61 18 9 99 89 77 61 26 3 2 93 84 3435 26 26 63 20 10 99 90 78 62 27 3 2 94 86 3536 29 29 64 21 11 99 91 80 63 28 3 2 94 87 3637 31 31 66 23 12 99 92 81 64 30 3 2 95 89 3738 33 33 68 25 13 99 92 83 65 31 4 2 96 90 3839 36 36 70 27 14 99 93 84 66 32 4 2 96 91 3940 39 39 72 29 15 99 93 85 67 33 4 2 96 92 4041 41 41 74 31 17 99 94 86 68 34 5 2 97 93 4142 44 44 76 33 18 99 95 88 69 35 5 2 97 93 4243 46 47 77 35 19 >99 95 89 70 36 5 3 97 94 4344 49 50 78 37 21 96 90 70 37 6 3 98 95 4445 51 54 79 39 22 96 91 71 38 6 3 98 95 4546 54 57 80 41 23 97 92 72 39 6 3 98 96 4647 57 60 81 43 24 97 93 73 40 7 3 98 96 4748 59 63 82 44 26 98 95 74 41 7 3 99 97 4849 62 66 83 46 27 98 96 74 42 7 3 99 97 4950 64 69 84 48 28 99 98 75 43 8 4 99 97 5051 67 72 84 49 29 76 44 8 4 99 98 5152 69 75 85 51 31 76 44 10 4 99 98 5253 70 77 86 52 32 77 45 10 4 99 98 5354 72 80 86 54 33 78 46 11 5 99 98 5455 74 82 87 55 35 78 47 12 5 >99 99 5556 76 84 88 57 36 79 48 12 5 99 5657 78 85 89 58 37 79 49 13 5 99 5758 80 87 89 60 39 80 51 14 6 99 58
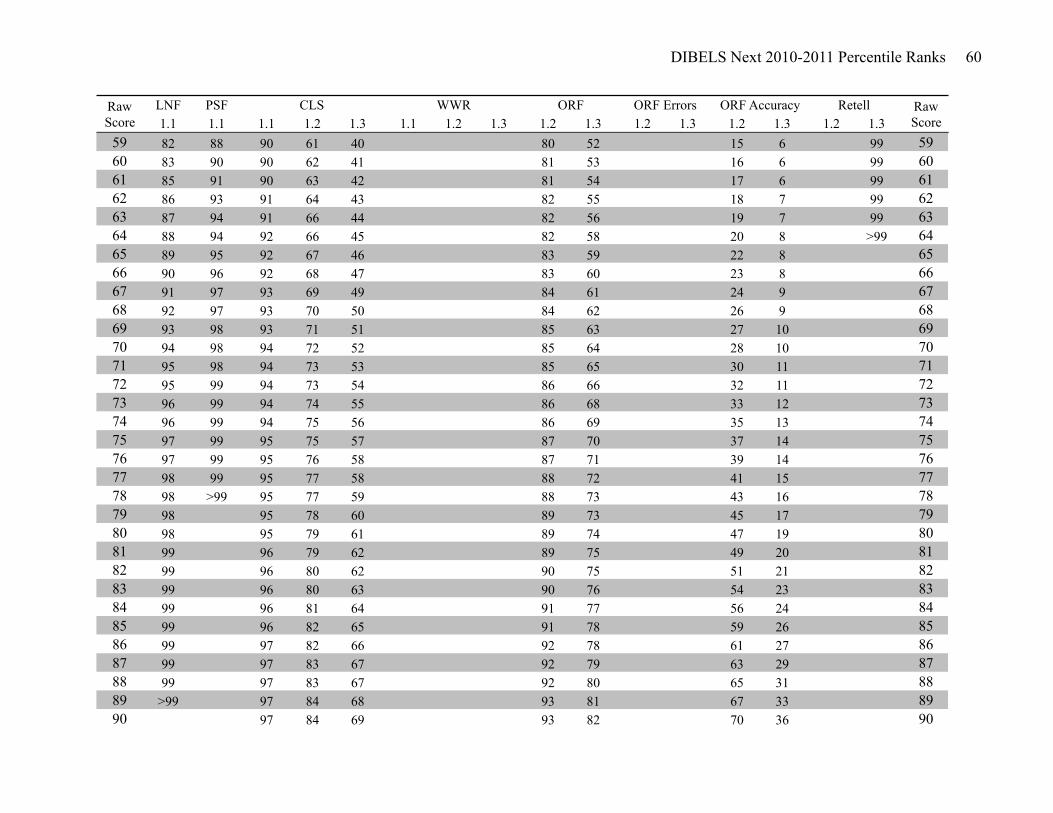
DIBELS Next 2010-2011 Percentile Ranks 60
LNF PSF1.1 1.1 1.1 1.2 1.3 1.1 1.2 1.3 1.2 1.3 1.2 1.3 1.2 1.3 1.2 1.3
Retell Raw Score
Raw Score
CLS WWR ORF ORF Errors ORF Accuracy
59 82 88 90 61 40 80 52 15 6 99 5960 83 90 90 62 41 81 53 16 6 99 6061 85 91 90 63 42 81 54 17 6 99 6162 86 93 91 64 43 82 55 18 7 99 6263 87 94 91 66 44 82 56 19 7 99 6364 88 94 92 66 45 82 58 20 8 >99 6465 89 95 92 67 46 83 59 22 8 6566 90 96 92 68 47 83 60 23 8 6667 91 97 93 69 49 84 61 24 9 6768 92 97 93 70 50 84 62 26 9 6869 93 98 93 71 51 85 63 27 10 6970 94 98 94 72 52 85 64 28 10 7071 95 98 94 73 53 85 65 30 11 7172 95 99 94 73 54 86 66 32 11 7273 96 99 94 74 55 86 68 33 12 7374 96 99 94 75 56 86 69 35 13 7475 97 99 95 75 57 87 70 37 14 7576 97 99 95 76 58 87 71 39 14 7677 98 99 95 77 58 88 72 41 15 7778 98 >99 95 77 59 88 73 43 16 7879 98 95 78 60 89 73 45 17 7980 98 95 79 61 89 74 47 19 8081 99 96 79 62 89 75 49 20 8182 99 96 80 62 90 75 51 21 8283 99 96 80 63 90 76 54 23 8384 99 96 81 64 91 77 56 24 8485 99 96 82 65 91 78 59 26 8586 99 97 82 66 92 78 61 27 8687 99 97 83 67 92 79 63 29 8788 99 97 83 67 92 80 65 31 8889 >99 97 84 68 93 81 67 33 8990 97 84 69 93 82 70 36 90
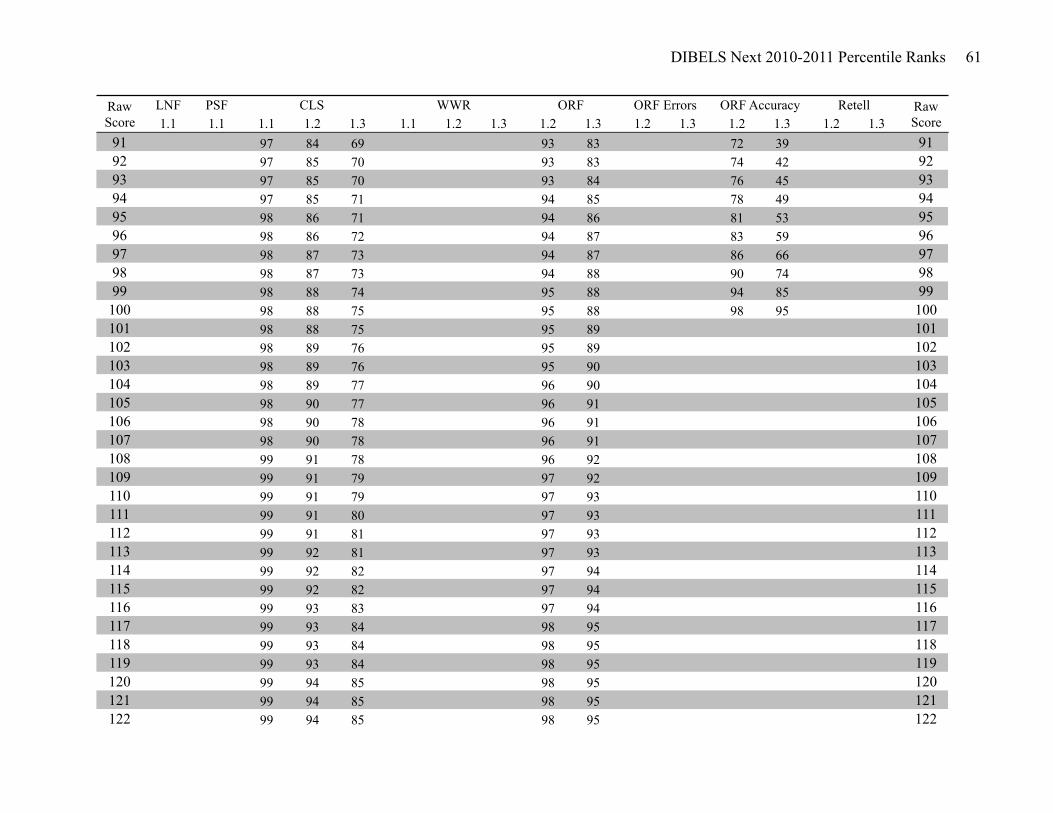
DIBELS Next 2010-2011 Percentile Ranks 61
LNF PSF1.1 1.1 1.1 1.2 1.3 1.1 1.2 1.3 1.2 1.3 1.2 1.3 1.2 1.3 1.2 1.3
Retell Raw Score
Raw Score
CLS WWR ORF ORF Errors ORF Accuracy
91 97 84 69 93 83 72 39 9192 97 85 70 93 83 74 42 9293 97 85 70 93 84 76 45 9394 97 85 71 94 85 78 49 9495 98 86 71 94 86 81 53 9596 98 86 72 94 87 83 59 9697 98 87 73 94 87 86 66 9798 98 87 73 94 88 90 74 9899 98 88 74 95 88 94 85 99100 98 88 75 95 88 98 95 100101 98 88 75 95 89 101102 98 89 76 95 89 102103 98 89 76 95 90 103104 98 89 77 96 90 104105 98 90 77 96 91 105106 98 90 78 96 91 106107 98 90 78 96 91 107108 99 91 78 96 92 108109 99 91 79 97 92 109110 99 91 79 97 93 110111 99 91 80 97 93 111112 99 91 81 97 93 112113 99 92 81 97 93 113114 99 92 82 97 94 114115 99 92 82 97 94 115116 99 93 83 97 94 116117 99 93 84 98 95 117118 99 93 84 98 95 118119 99 93 84 98 95 119120 99 94 85 98 95 120121 99 94 85 98 95 121122 99 94 85 98 95 122
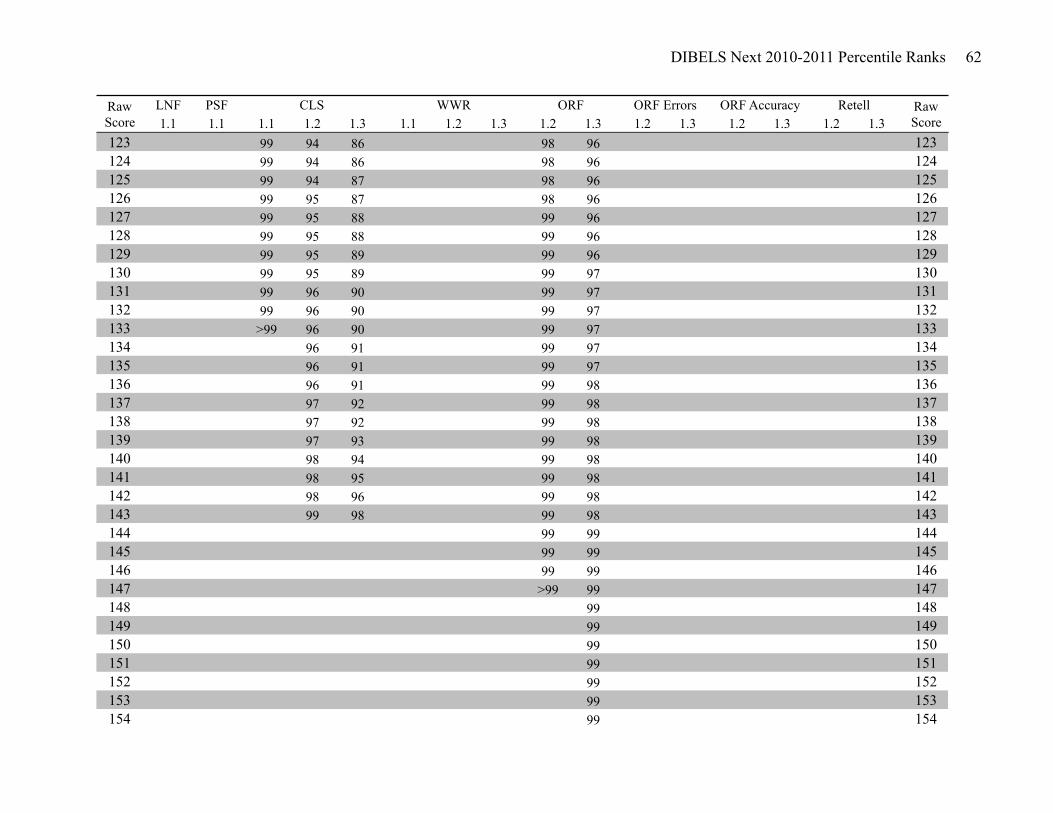
DIBELS Next 2010-2011 Percentile Ranks 62
LNF PSF1.1 1.1 1.1 1.2 1.3 1.1 1.2 1.3 1.2 1.3 1.2 1.3 1.2 1.3 1.2 1.3
Retell Raw Score
Raw Score
CLS WWR ORF ORF Errors ORF Accuracy
123 99 94 86 98 96 123124 99 94 86 98 96 124125 99 94 87 98 96 125126 99 95 87 98 96 126127 99 95 88 99 96 127128 99 95 88 99 96 128129 99 95 89 99 96 129130 99 95 89 99 97 130131 99 96 90 99 97 131132 99 96 90 99 97 132133 >99 96 90 99 97 133134 96 91 99 97 134135 96 91 99 97 135136 96 91 99 98 136137 97 92 99 98 137138 97 92 99 98 138139 97 93 99 98 139140 98 94 99 98 140141 98 95 99 98 141142 98 96 99 98 142143 99 98 99 98 143144 99 99 144145 99 99 145146 99 99 146147 >99 99 147148 99 148149 99 149150 99 150151 99 151152 99 152153 99 153154 99 154
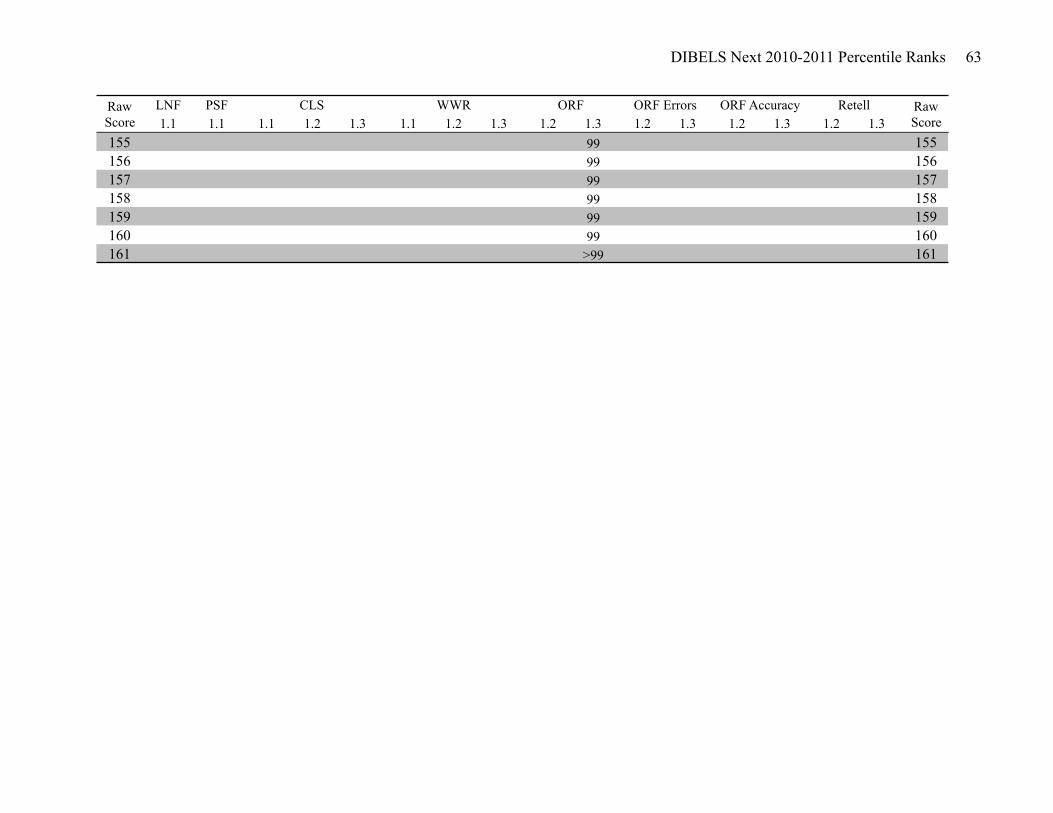
DIBELS Next 2010-2011 Percentile Ranks 63
LNF PSF1.1 1.1 1.1 1.2 1.3 1.1 1.2 1.3 1.2 1.3 1.2 1.3 1.2 1.3 1.2 1.3
Retell Raw Score
Raw Score
CLS WWR ORF ORF Errors ORF Accuracy
155 99 155156 99 156157 99 157158 99 158159 99 159160 99 160161 >99 161
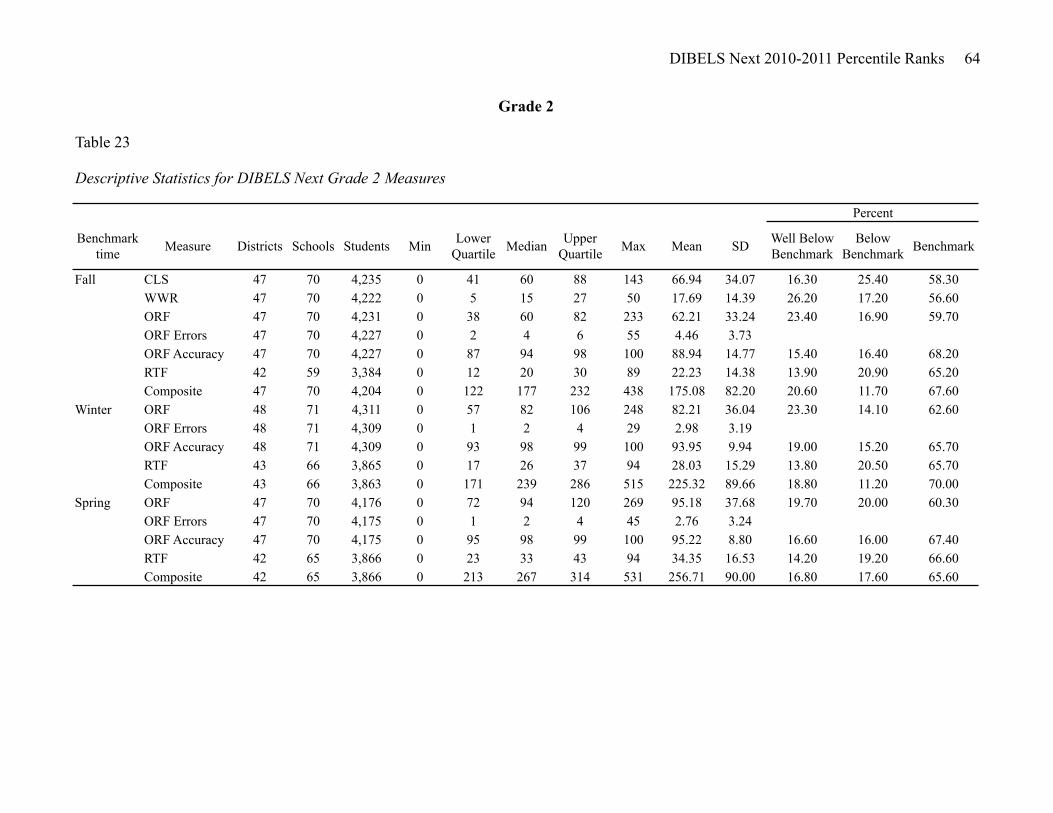
DIBELS Next 2010-2011 Percentile Ranks 64
Table 23
Descriptive Statistics for DIBELS Next Grade 2 Measures
Benchmark time Measure Districts Schools Students Min Lower
Quartile Median Upper Quartile Max Mean SD Well Below
BenchmarkBelow
Benchmark Benchmark
Fall CLS 47 70 4,235 0 41 60 88 143 66.94 34.07 16.30 25.40 58.30WWR 47 70 4,222 0 5 15 27 50 17.69 14.39 26.20 17.20 56.60ORF 47 70 4,231 0 38 60 82 233 62.21 33.24 23.40 16.90 59.70ORF Errors 47 70 4,227 0 2 4 6 55 4.46 3.73ORF Accuracy 47 70 4,227 0 87 94 98 100 88.94 14.77 15.40 16.40 68.20RTF 42 59 3,384 0 12 20 30 89 22.23 14.38 13.90 20.90 65.20Composite 47 70 4,204 0 122 177 232 438 175.08 82.20 20.60 11.70 67.60
Winter ORF 48 71 4,311 0 57 82 106 248 82.21 36.04 23.30 14.10 62.60ORF Errors 48 71 4,309 0 1 2 4 29 2.98 3.19ORF Accuracy 48 71 4,309 0 93 98 99 100 93.95 9.94 19.00 15.20 65.70RTF 43 66 3,865 0 17 26 37 94 28.03 15.29 13.80 20.50 65.70Composite 43 66 3,863 0 171 239 286 515 225.32 89.66 18.80 11.20 70.00
Spring ORF 47 70 4,176 0 72 94 120 269 95.18 37.68 19.70 20.00 60.30ORF Errors 47 70 4,175 0 1 2 4 45 2.76 3.24ORF Accuracy 47 70 4,175 0 95 98 99 100 95.22 8.80 16.60 16.00 67.40RTF 42 65 3,866 0 23 33 43 94 34.35 16.53 14.20 19.20 66.60Composite 42 65 3,866 0 213 267 314 531 256.71 90.00 16.80 17.60 65.60
Percent
Grade 2
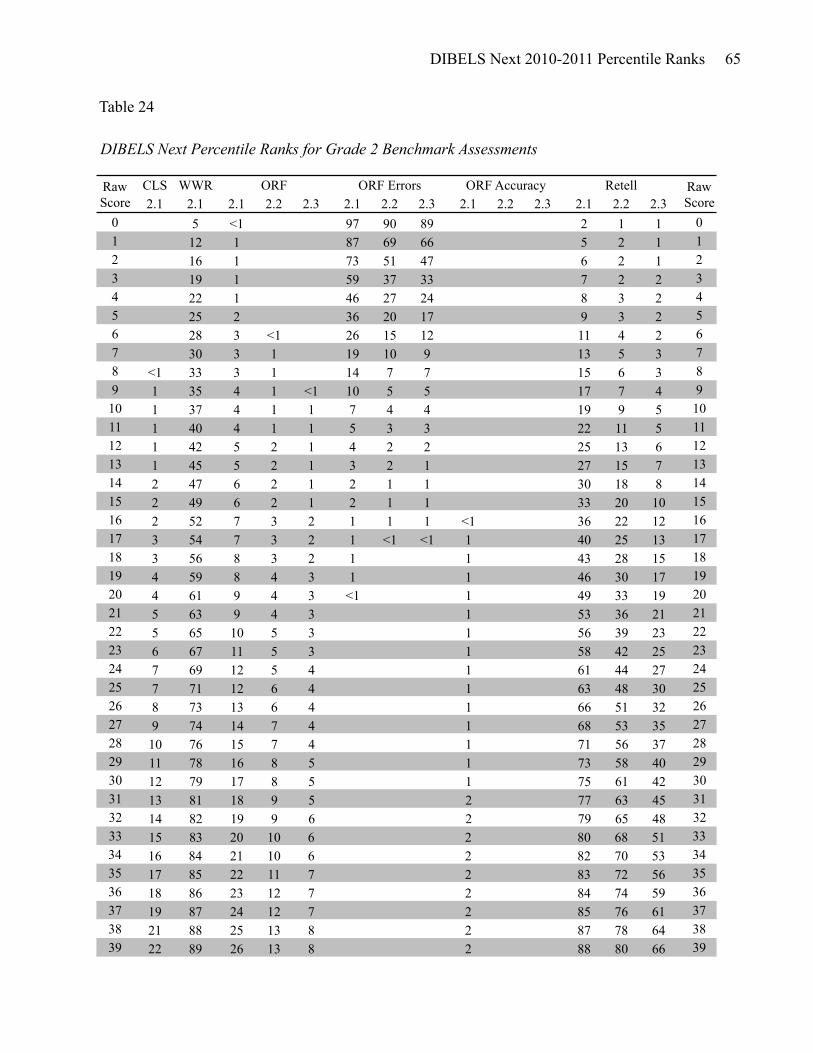
DIBELS Next 2010-2011 Percentile Ranks 65
CLS WWR2.1 2.1 2.1 2.2 2.3 2.1 2.2 2.3 2.1 2.2 2.3 2.1 2.2 2.3
0 5 <1 97 90 89 2 1 1 01 12 1 87 69 66 5 2 1 12 16 1 73 51 47 6 2 1 23 19 1 59 37 33 7 2 2 34 22 1 46 27 24 8 3 2 45 25 2 36 20 17 9 3 2 56 28 3 <1 26 15 12 11 4 2 67 30 3 1 19 10 9 13 5 3 78 <1 33 3 1 14 7 7 15 6 3 89 1 35 4 1 <1 10 5 5 17 7 4 910 1 37 4 1 1 7 4 4 19 9 5 1011 1 40 4 1 1 5 3 3 22 11 5 1112 1 42 5 2 1 4 2 2 25 13 6 1213 1 45 5 2 1 3 2 1 27 15 7 1314 2 47 6 2 1 2 1 1 30 18 8 1415 2 49 6 2 1 2 1 1 33 20 10 1516 2 52 7 3 2 1 1 1 <1 36 22 12 1617 3 54 7 3 2 1 <1 <1 1 40 25 13 1718 3 56 8 3 2 1 1 43 28 15 1819 4 59 8 4 3 1 1 46 30 17 1920 4 61 9 4 3 <1 1 49 33 19 2021 5 63 9 4 3 1 53 36 21 2122 5 65 10 5 3 1 56 39 23 2223 6 67 11 5 3 1 58 42 25 2324 7 69 12 5 4 1 61 44 27 2425 7 71 12 6 4 1 63 48 30 2526 8 73 13 6 4 1 66 51 32 2627 9 74 14 7 4 1 68 53 35 2728 10 76 15 7 4 1 71 56 37 2829 11 78 16 8 5 1 73 58 40 2930 12 79 17 8 5 1 75 61 42 3031 13 81 18 9 5 2 77 63 45 3132 14 82 19 9 6 2 79 65 48 3233 15 83 20 10 6 2 80 68 51 3334 16 84 21 10 6 2 82 70 53 3435 17 85 22 11 7 2 83 72 56 3536 18 86 23 12 7 2 84 74 59 3637 19 87 24 12 7 2 85 76 61 3738 21 88 25 13 8 2 87 78 64 3839 22 89 26 13 8 2 88 80 66 39
Table 24
DIBELS Next Percentile Ranks for Grade 2 Benchmark Assessments
Raw Score
ORF ORF Errors ORF Accuracy Retell Raw Score
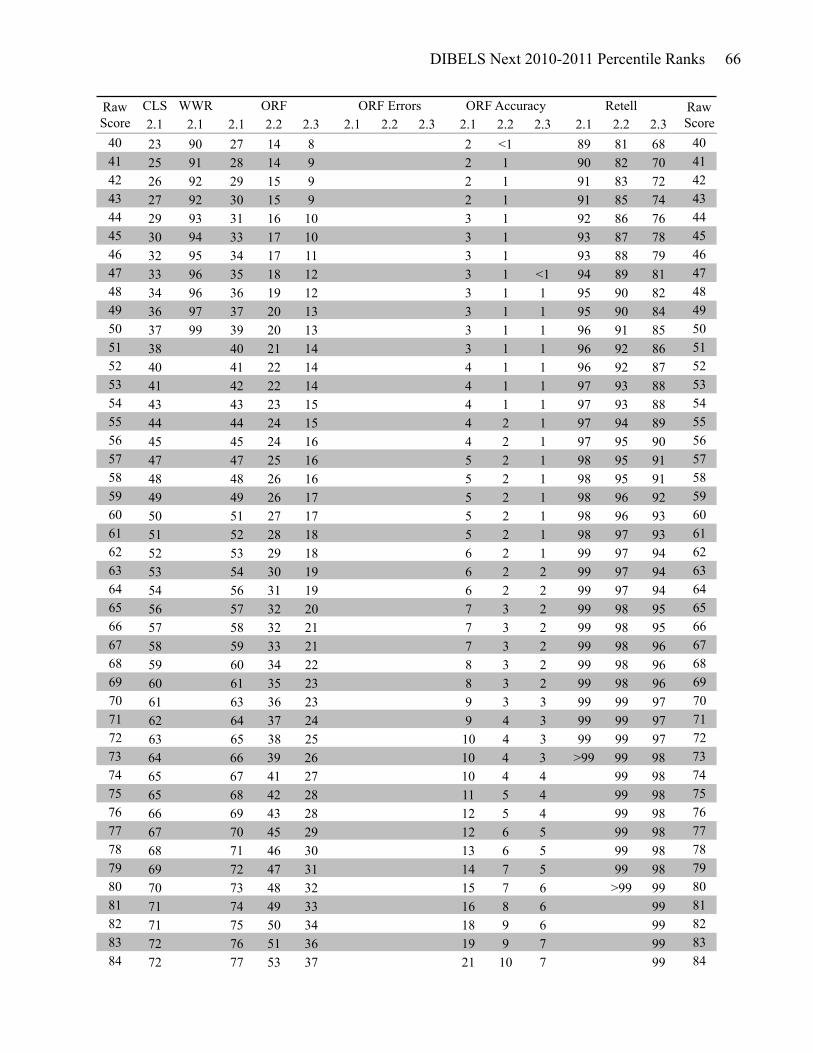
DIBELS Next 2010-2011 Percentile Ranks 66
CLS WWR2.1 2.1 2.1 2.2 2.3 2.1 2.2 2.3 2.1 2.2 2.3 2.1 2.2 2.3
Raw Score
ORF ORF Errors ORF Accuracy Retell Raw Score
40 23 90 27 14 8 2 <1 89 81 68 4041 25 91 28 14 9 2 1 90 82 70 4142 26 92 29 15 9 2 1 91 83 72 4243 27 92 30 15 9 2 1 91 85 74 4344 29 93 31 16 10 3 1 92 86 76 4445 30 94 33 17 10 3 1 93 87 78 4546 32 95 34 17 11 3 1 93 88 79 4647 33 96 35 18 12 3 1 <1 94 89 81 4748 34 96 36 19 12 3 1 1 95 90 82 4849 36 97 37 20 13 3 1 1 95 90 84 4950 37 99 39 20 13 3 1 1 96 91 85 5051 38 40 21 14 3 1 1 96 92 86 5152 40 41 22 14 4 1 1 96 92 87 5253 41 42 22 14 4 1 1 97 93 88 5354 43 43 23 15 4 1 1 97 93 88 5455 44 44 24 15 4 2 1 97 94 89 5556 45 45 24 16 4 2 1 97 95 90 5657 47 47 25 16 5 2 1 98 95 91 5758 48 48 26 16 5 2 1 98 95 91 5859 49 49 26 17 5 2 1 98 96 92 5960 50 51 27 17 5 2 1 98 96 93 6061 51 52 28 18 5 2 1 98 97 93 6162 52 53 29 18 6 2 1 99 97 94 6263 53 54 30 19 6 2 2 99 97 94 6364 54 56 31 19 6 2 2 99 97 94 6465 56 57 32 20 7 3 2 99 98 95 6566 57 58 32 21 7 3 2 99 98 95 6667 58 59 33 21 7 3 2 99 98 96 6768 59 60 34 22 8 3 2 99 98 96 6869 60 61 35 23 8 3 2 99 98 96 6970 61 63 36 23 9 3 3 99 99 97 7071 62 64 37 24 9 4 3 99 99 97 7172 63 65 38 25 10 4 3 99 99 97 7273 64 66 39 26 10 4 3 >99 99 98 7374 65 67 41 27 10 4 4 99 98 7475 65 68 42 28 11 5 4 99 98 7576 66 69 43 28 12 5 4 99 98 7677 67 70 45 29 12 6 5 99 98 7778 68 71 46 30 13 6 5 99 98 7879 69 72 47 31 14 7 5 99 98 7980 70 73 48 32 15 7 6 >99 99 8081 71 74 49 33 16 8 6 99 8182 71 75 50 34 18 9 6 99 8283 72 76 51 36 19 9 7 99 8384 72 77 53 37 21 10 7 99 84
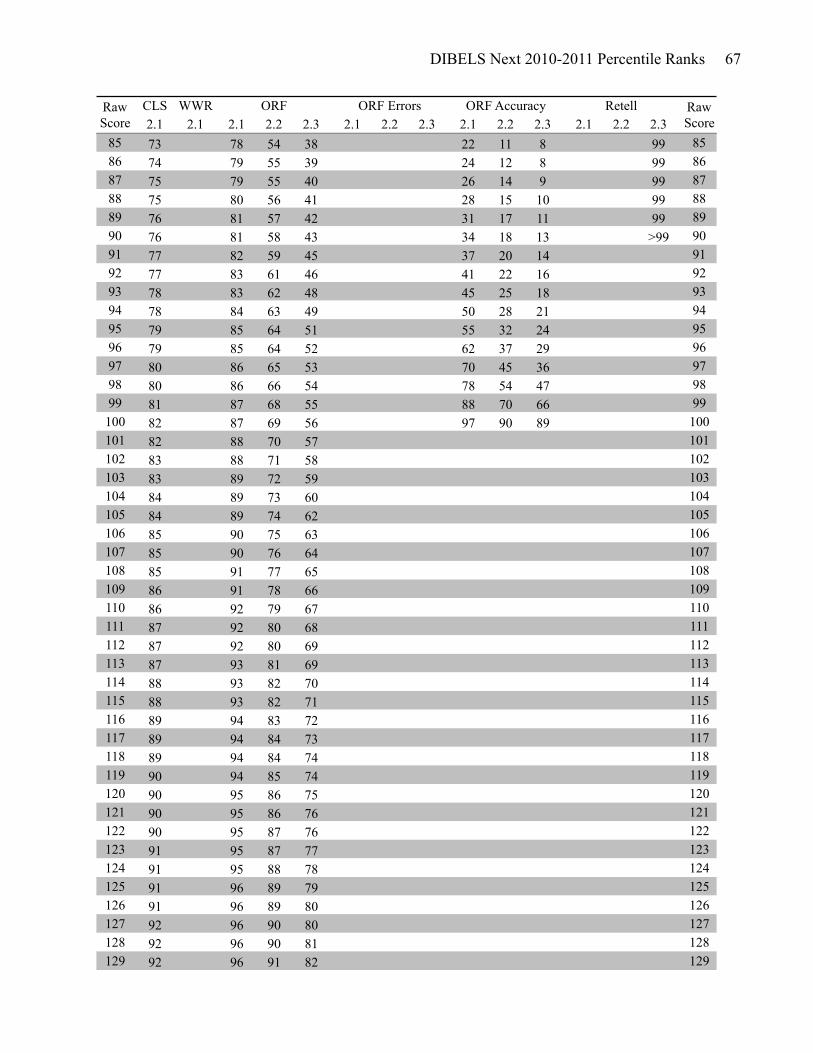
DIBELS Next 2010-2011 Percentile Ranks 67
CLS WWR2.1 2.1 2.1 2.2 2.3 2.1 2.2 2.3 2.1 2.2 2.3 2.1 2.2 2.3
Raw Score
ORF ORF Errors ORF Accuracy Retell Raw Score
85 73 78 54 38 22 11 8 99 8586 74 79 55 39 24 12 8 99 8687 75 79 55 40 26 14 9 99 8788 75 80 56 41 28 15 10 99 8889 76 81 57 42 31 17 11 99 8990 76 81 58 43 34 18 13 >99 9091 77 82 59 45 37 20 14 9192 77 83 61 46 41 22 16 9293 78 83 62 48 45 25 18 9394 78 84 63 49 50 28 21 9495 79 85 64 51 55 32 24 9596 79 85 64 52 62 37 29 9697 80 86 65 53 70 45 36 9798 80 86 66 54 78 54 47 9899 81 87 68 55 88 70 66 99100 82 87 69 56 97 90 89 100101 82 88 70 57 101102 83 88 71 58 102103 83 89 72 59 103104 84 89 73 60 104105 84 89 74 62 105106 85 90 75 63 106107 85 90 76 64 107108 85 91 77 65 108109 86 91 78 66 109110 86 92 79 67 110111 87 92 80 68 111112 87 92 80 69 112113 87 93 81 69 113114 88 93 82 70 114115 88 93 82 71 115116 89 94 83 72 116117 89 94 84 73 117118 89 94 84 74 118119 90 94 85 74 119120 90 95 86 75 120121 90 95 86 76 121122 90 95 87 76 122123 91 95 87 77 123124 91 95 88 78 124125 91 96 89 79 125126 91 96 89 80 126127 92 96 90 80 127128 92 96 90 81 128129 92 96 91 82 129
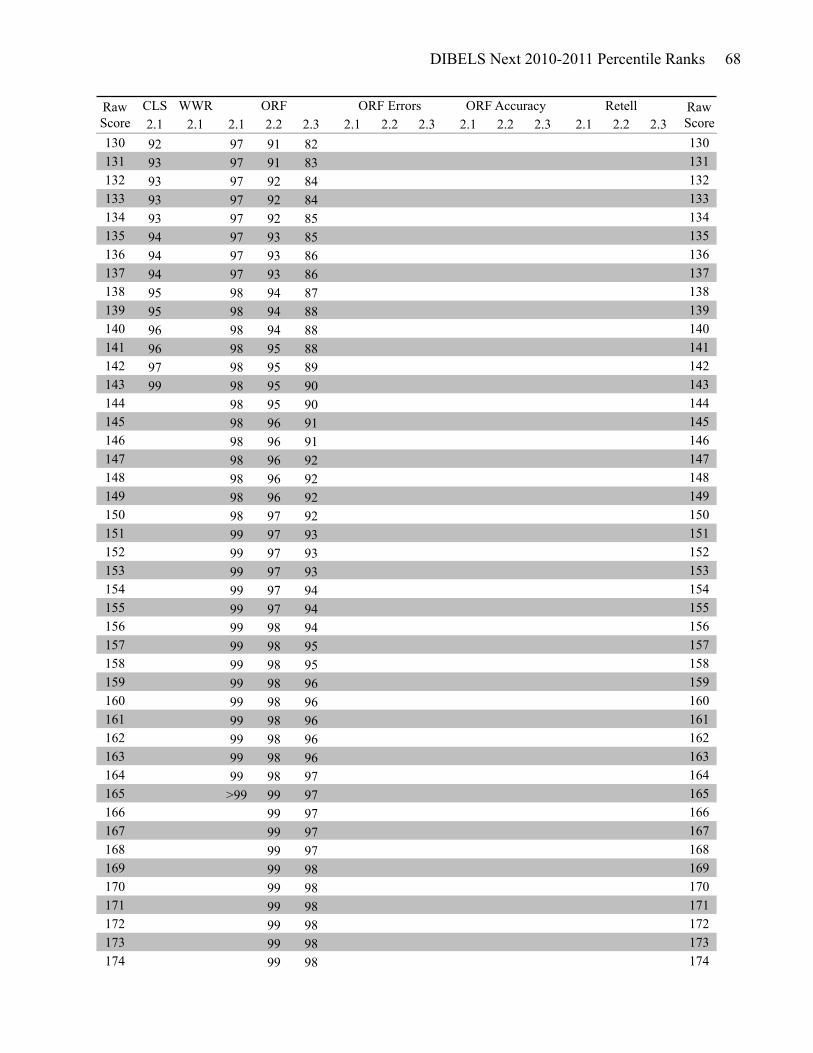
DIBELS Next 2010-2011 Percentile Ranks 68
CLS WWR2.1 2.1 2.1 2.2 2.3 2.1 2.2 2.3 2.1 2.2 2.3 2.1 2.2 2.3
Raw Score
ORF ORF Errors ORF Accuracy Retell Raw Score
130 92 97 91 82 130131 93 97 91 83 131132 93 97 92 84 132133 93 97 92 84 133134 93 97 92 85 134135 94 97 93 85 135136 94 97 93 86 136137 94 97 93 86 137138 95 98 94 87 138139 95 98 94 88 139140 96 98 94 88 140141 96 98 95 88 141142 97 98 95 89 142143 99 98 95 90 143144 98 95 90 144145 98 96 91 145146 98 96 91 146147 98 96 92 147148 98 96 92 148149 98 96 92 149150 98 97 92 150151 99 97 93 151152 99 97 93 152153 99 97 93 153154 99 97 94 154155 99 97 94 155156 99 98 94 156157 99 98 95 157158 99 98 95 158159 99 98 96 159160 99 98 96 160161 99 98 96 161162 99 98 96 162163 99 98 96 163164 99 98 97 164165 >99 99 97 165166 99 97 166167 99 97 167168 99 97 168169 99 98 169170 99 98 170171 99 98 171172 99 98 172173 99 98 173174 99 98 174

DIBELS Next 2010-2011 Percentile Ranks 69
CLS WWR2.1 2.1 2.1 2.2 2.3 2.1 2.2 2.3 2.1 2.2 2.3 2.1 2.2 2.3
Raw Score
ORF ORF Errors ORF Accuracy Retell Raw Score
175 99 98 175176 99 98 176177 99 99 177178 99 99 178179 99 99 179180 99 99 180181 99 99 181182 99 99 182183 99 99 183184 >99 99 184185 99 185186 99 186187 99 187188 99 188189 99 189190 99 190191 99 191192 99 192193 99 193194 99 194195 99 195196 99 196197 99 197198 >99 198
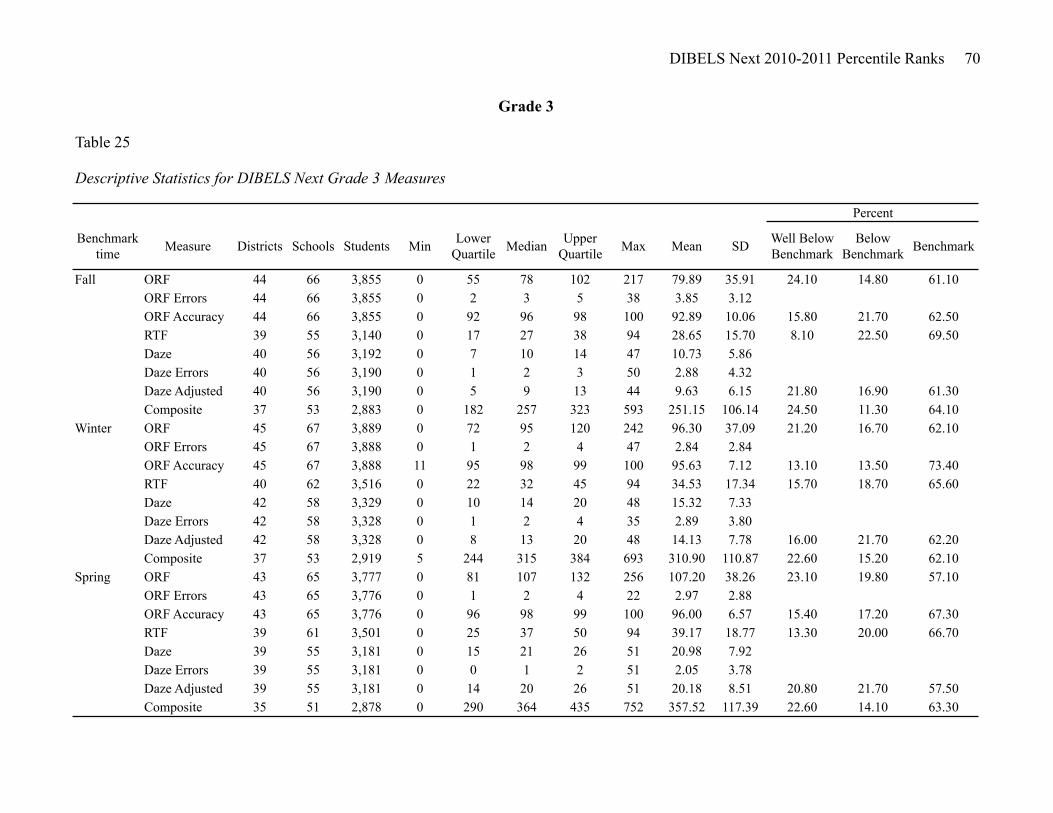
DIBELS Next 2010-2011 Percentile Ranks 70
Table 25
Descriptive Statistics for DIBELS Next Grade 3 Measures
Benchmark time Measure Districts Schools Students Min Lower
Quartile Median Upper Quartile Max Mean SD Well Below
BenchmarkBelow
Benchmark Benchmark
Fall ORF 44 66 3,855 0 55 78 102 217 79.89 35.91 24.10 14.80 61.10ORF Errors 44 66 3,855 0 2 3 5 38 3.85 3.12ORF Accuracy 44 66 3,855 0 92 96 98 100 92.89 10.06 15.80 21.70 62.50RTF 39 55 3,140 0 17 27 38 94 28.65 15.70 8.10 22.50 69.50Daze 40 56 3,192 0 7 10 14 47 10.73 5.86Daze Errors 40 56 3,190 0 1 2 3 50 2.88 4.32Daze Adjusted 40 56 3,190 0 5 9 13 44 9.63 6.15 21.80 16.90 61.30Composite 37 53 2,883 0 182 257 323 593 251.15 106.14 24.50 11.30 64.10
Winter ORF 45 67 3,889 0 72 95 120 242 96.30 37.09 21.20 16.70 62.10ORF Errors 45 67 3,888 0 1 2 4 47 2.84 2.84ORF Accuracy 45 67 3,888 11 95 98 99 100 95.63 7.12 13.10 13.50 73.40RTF 40 62 3,516 0 22 32 45 94 34.53 17.34 15.70 18.70 65.60Daze 42 58 3,329 0 10 14 20 48 15.32 7.33Daze Errors 42 58 3,328 0 1 2 4 35 2.89 3.80Daze Adjusted 42 58 3,328 0 8 13 20 48 14.13 7.78 16.00 21.70 62.20Composite 37 53 2,919 5 244 315 384 693 310.90 110.87 22.60 15.20 62.10
Spring ORF 43 65 3,777 0 81 107 132 256 107.20 38.26 23.10 19.80 57.10ORF Errors 43 65 3,776 0 1 2 4 22 2.97 2.88ORF Accuracy 43 65 3,776 0 96 98 99 100 96.00 6.57 15.40 17.20 67.30RTF 39 61 3,501 0 25 37 50 94 39.17 18.77 13.30 20.00 66.70Daze 39 55 3,181 0 15 21 26 51 20.98 7.92Daze Errors 39 55 3,181 0 0 1 2 51 2.05 3.78Daze Adjusted 39 55 3,181 0 14 20 26 51 20.18 8.51 20.80 21.70 57.50Composite 35 51 2,878 0 290 364 435 752 357.52 117.39 22.60 14.10 63.30
Percent
Grade 3
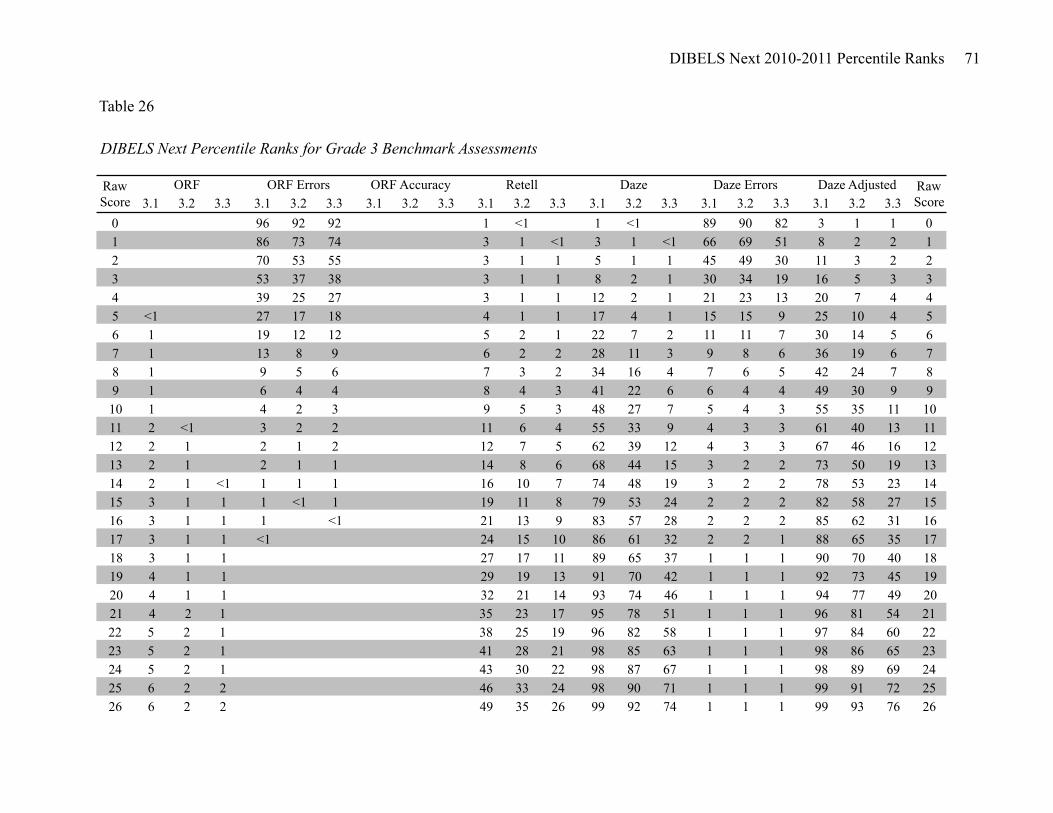
DIBELS Next 2010-2011 Percentile Ranks 71
3.1 3.2 3.3 3.1 3.2 3.3 3.1 3.2 3.3 3.1 3.2 3.3 3.1 3.2 3.3 3.1 3.2 3.3 3.1 3.2 3.30 96 92 92 1 <1 1 <1 89 90 82 3 1 1 01 86 73 74 3 1 <1 3 1 <1 66 69 51 8 2 2 12 70 53 55 3 1 1 5 1 1 45 49 30 11 3 2 23 53 37 38 3 1 1 8 2 1 30 34 19 16 5 3 34 39 25 27 3 1 1 12 2 1 21 23 13 20 7 4 45 <1 27 17 18 4 1 1 17 4 1 15 15 9 25 10 4 56 1 19 12 12 5 2 1 22 7 2 11 11 7 30 14 5 67 1 13 8 9 6 2 2 28 11 3 9 8 6 36 19 6 78 1 9 5 6 7 3 2 34 16 4 7 6 5 42 24 7 89 1 6 4 4 8 4 3 41 22 6 6 4 4 49 30 9 910 1 4 2 3 9 5 3 48 27 7 5 4 3 55 35 11 1011 2 <1 3 2 2 11 6 4 55 33 9 4 3 3 61 40 13 1112 2 1 2 1 2 12 7 5 62 39 12 4 3 3 67 46 16 1213 2 1 2 1 1 14 8 6 68 44 15 3 2 2 73 50 19 1314 2 1 <1 1 1 1 16 10 7 74 48 19 3 2 2 78 53 23 1415 3 1 1 1 <1 1 19 11 8 79 53 24 2 2 2 82 58 27 1516 3 1 1 1 <1 21 13 9 83 57 28 2 2 2 85 62 31 1617 3 1 1 <1 24 15 10 86 61 32 2 2 1 88 65 35 1718 3 1 1 27 17 11 89 65 37 1 1 1 90 70 40 1819 4 1 1 29 19 13 91 70 42 1 1 1 92 73 45 1920 4 1 1 32 21 14 93 74 46 1 1 1 94 77 49 2021 4 2 1 35 23 17 95 78 51 1 1 1 96 81 54 2122 5 2 1 38 25 19 96 82 58 1 1 1 97 84 60 2223 5 2 1 41 28 21 98 85 63 1 1 1 98 86 65 2324 5 2 1 43 30 22 98 87 67 1 1 1 98 89 69 2425 6 2 2 46 33 24 98 90 71 1 1 1 99 91 72 2526 6 2 2 49 35 26 99 92 74 1 1 1 99 93 76 26
Table 26
DIBELS Next Percentile Ranks for Grade 3 Benchmark Assessments
Daze Errors Daze Adjusted Raw Score
Raw Score
ORF ORF Errors ORF Accuracy Retell Daze
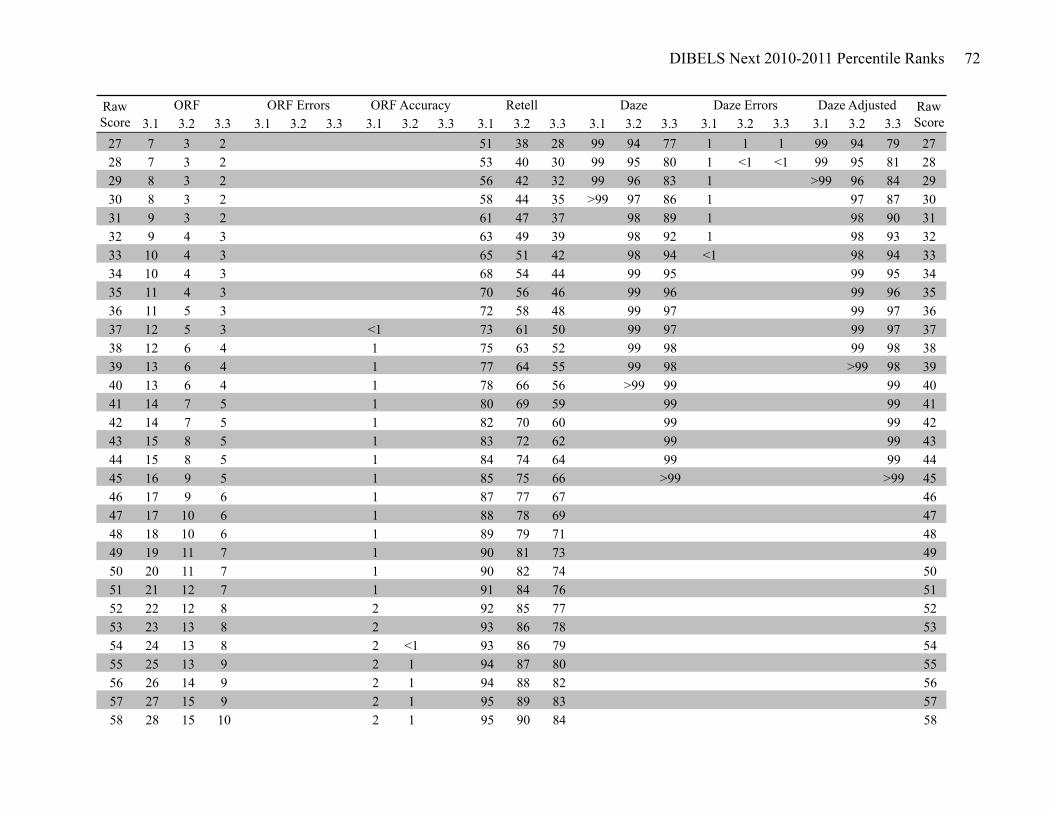
DIBELS Next 2010-2011 Percentile Ranks 72
3.1 3.2 3.3 3.1 3.2 3.3 3.1 3.2 3.3 3.1 3.2 3.3 3.1 3.2 3.3 3.1 3.2 3.3 3.1 3.2 3.3Daze Errors Daze Adjusted Raw
ScoreRaw Score
ORF ORF Errors ORF Accuracy Retell Daze
27 7 3 2 51 38 28 99 94 77 1 1 1 99 94 79 2728 7 3 2 53 40 30 99 95 80 1 <1 <1 99 95 81 2829 8 3 2 56 42 32 99 96 83 1 >99 96 84 2930 8 3 2 58 44 35 >99 97 86 1 97 87 3031 9 3 2 61 47 37 98 89 1 98 90 3132 9 4 3 63 49 39 98 92 1 98 93 3233 10 4 3 65 51 42 98 94 <1 98 94 3334 10 4 3 68 54 44 99 95 99 95 3435 11 4 3 70 56 46 99 96 99 96 3536 11 5 3 72 58 48 99 97 99 97 3637 12 5 3 <1 73 61 50 99 97 99 97 3738 12 6 4 1 75 63 52 99 98 99 98 3839 13 6 4 1 77 64 55 99 98 >99 98 3940 13 6 4 1 78 66 56 >99 99 99 4041 14 7 5 1 80 69 59 99 99 4142 14 7 5 1 82 70 60 99 99 4243 15 8 5 1 83 72 62 99 99 4344 15 8 5 1 84 74 64 99 99 4445 16 9 5 1 85 75 66 >99 >99 4546 17 9 6 1 87 77 67 4647 17 10 6 1 88 78 69 4748 18 10 6 1 89 79 71 4849 19 11 7 1 90 81 73 4950 20 11 7 1 90 82 74 5051 21 12 7 1 91 84 76 5152 22 12 8 2 92 85 77 5253 23 13 8 2 93 86 78 5354 24 13 8 2 <1 93 86 79 5455 25 13 9 2 1 94 87 80 5556 26 14 9 2 1 94 88 82 5657 27 15 9 2 1 95 89 83 5758 28 15 10 2 1 95 90 84 58
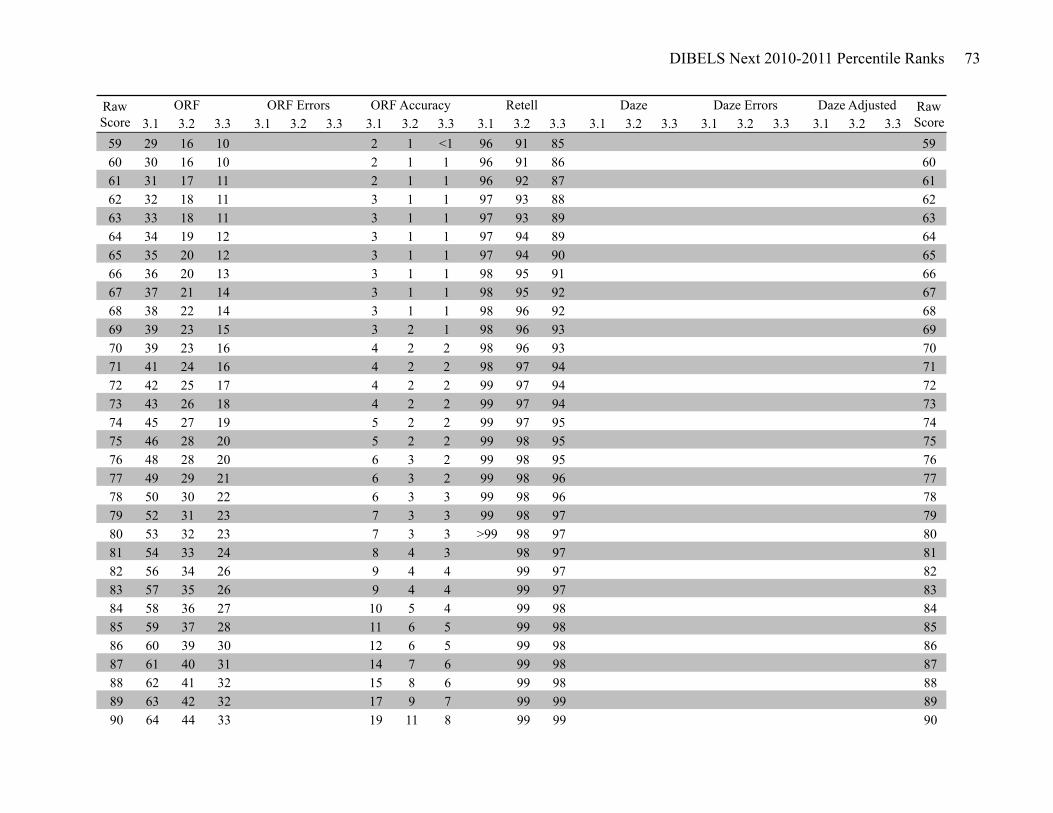
DIBELS Next 2010-2011 Percentile Ranks 73
3.1 3.2 3.3 3.1 3.2 3.3 3.1 3.2 3.3 3.1 3.2 3.3 3.1 3.2 3.3 3.1 3.2 3.3 3.1 3.2 3.3Daze Errors Daze Adjusted Raw
ScoreRaw Score
ORF ORF Errors ORF Accuracy Retell Daze
59 29 16 10 2 1 <1 96 91 85 5960 30 16 10 2 1 1 96 91 86 6061 31 17 11 2 1 1 96 92 87 6162 32 18 11 3 1 1 97 93 88 6263 33 18 11 3 1 1 97 93 89 6364 34 19 12 3 1 1 97 94 89 6465 35 20 12 3 1 1 97 94 90 6566 36 20 13 3 1 1 98 95 91 6667 37 21 14 3 1 1 98 95 92 6768 38 22 14 3 1 1 98 96 92 6869 39 23 15 3 2 1 98 96 93 6970 39 23 16 4 2 2 98 96 93 7071 41 24 16 4 2 2 98 97 94 7172 42 25 17 4 2 2 99 97 94 7273 43 26 18 4 2 2 99 97 94 7374 45 27 19 5 2 2 99 97 95 7475 46 28 20 5 2 2 99 98 95 7576 48 28 20 6 3 2 99 98 95 7677 49 29 21 6 3 2 99 98 96 7778 50 30 22 6 3 3 99 98 96 7879 52 31 23 7 3 3 99 98 97 7980 53 32 23 7 3 3 >99 98 97 8081 54 33 24 8 4 3 98 97 8182 56 34 26 9 4 4 99 97 8283 57 35 26 9 4 4 99 97 8384 58 36 27 10 5 4 99 98 8485 59 37 28 11 6 5 99 98 8586 60 39 30 12 6 5 99 98 8687 61 40 31 14 7 6 99 98 8788 62 41 32 15 8 6 99 98 8889 63 42 32 17 9 7 99 99 8990 64 44 33 19 11 8 99 99 90

DIBELS Next 2010-2011 Percentile Ranks 74
3.1 3.2 3.3 3.1 3.2 3.3 3.1 3.2 3.3 3.1 3.2 3.3 3.1 3.2 3.3 3.1 3.2 3.3 3.1 3.2 3.3Daze Errors Daze Adjusted Raw
ScoreRaw Score
ORF ORF Errors ORF Accuracy Retell Daze
91 65 45 34 22 12 10 99 99 9192 66 47 35 25 14 11 >99 99 9293 67 48 35 29 17 14 99 9394 68 49 36 34 20 17 >99 9495 69 50 37 41 24 22 9596 70 52 38 50 30 29 9697 71 53 40 61 39 38 9798 72 54 41 73 53 51 9899 72 55 42 86 72 72 99100 73 56 43 96 92 92 100101 74 57 45 101102 75 58 46 102103 76 59 47 103104 77 61 47 104105 77 62 48 105106 78 63 49 106107 79 64 50 107108 79 65 51 108109 80 66 52 109110 81 67 54 110111 82 68 55 111112 83 69 56 112113 84 69 57 113114 84 70 58 114115 85 71 59 115116 85 72 60 116117 86 73 62 117118 87 74 63 118119 87 74 64 119120 88 75 65 120121 88 76 65 121122 89 77 66 122

DIBELS Next 2010-2011 Percentile Ranks 75
3.1 3.2 3.3 3.1 3.2 3.3 3.1 3.2 3.3 3.1 3.2 3.3 3.1 3.2 3.3 3.1 3.2 3.3 3.1 3.2 3.3Daze Errors Daze Adjusted Raw
ScoreRaw Score
ORF ORF Errors ORF Accuracy Retell Daze
123 89 78 67 123124 89 78 68 124125 90 79 69 125126 90 79 70 126127 90 80 71 127128 91 81 72 128129 91 82 72 129130 91 82 73 130131 92 83 74 131132 92 84 75 132133 92 85 75 133134 92 85 76 134135 93 86 77 135136 93 86 78 136137 93 87 78 137138 94 87 79 138139 94 88 79 139140 94 88 80 140141 94 89 81 141142 94 89 82 142143 95 90 83 143144 95 90 83 144145 95 90 84 145146 95 91 85 146147 95 91 85 147148 96 91 86 148149 96 92 86 149150 96 92 87 150151 96 93 87 151152 97 93 88 152153 97 93 88 153154 97 94 89 154
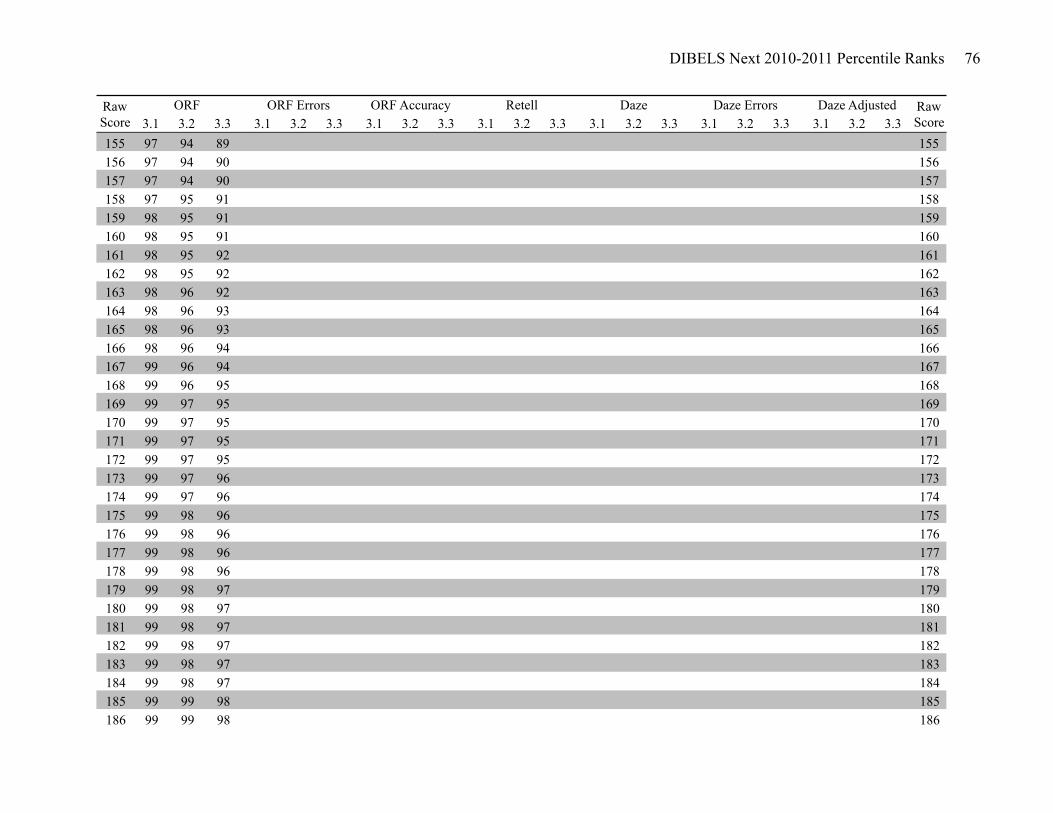
DIBELS Next 2010-2011 Percentile Ranks 76
3.1 3.2 3.3 3.1 3.2 3.3 3.1 3.2 3.3 3.1 3.2 3.3 3.1 3.2 3.3 3.1 3.2 3.3 3.1 3.2 3.3Daze Errors Daze Adjusted Raw
ScoreRaw Score
ORF ORF Errors ORF Accuracy Retell Daze
155 97 94 89 155156 97 94 90 156157 97 94 90 157158 97 95 91 158159 98 95 91 159160 98 95 91 160161 98 95 92 161162 98 95 92 162163 98 96 92 163164 98 96 93 164165 98 96 93 165166 98 96 94 166167 99 96 94 167168 99 96 95 168169 99 97 95 169170 99 97 95 170171 99 97 95 171172 99 97 95 172173 99 97 96 173174 99 97 96 174175 99 98 96 175176 99 98 96 176177 99 98 96 177178 99 98 96 178179 99 98 97 179180 99 98 97 180181 99 98 97 181182 99 98 97 182183 99 98 97 183184 99 98 97 184185 99 99 98 185186 99 99 98 186
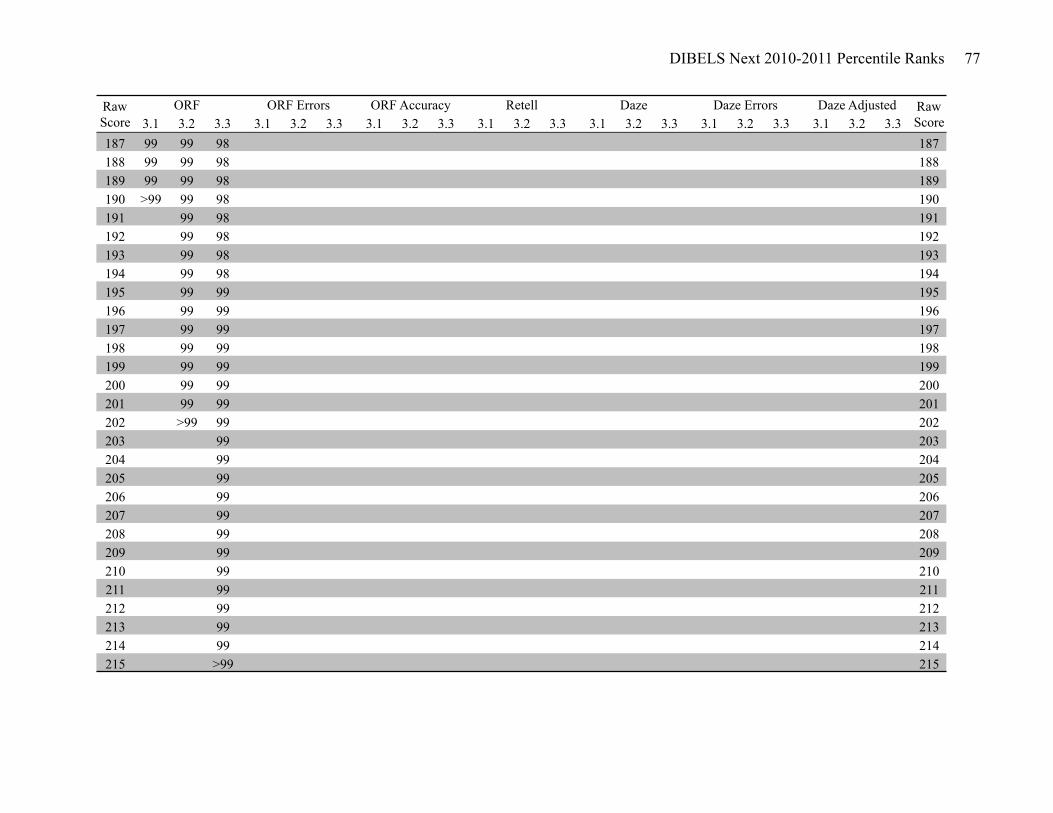
DIBELS Next 2010-2011 Percentile Ranks 77
3.1 3.2 3.3 3.1 3.2 3.3 3.1 3.2 3.3 3.1 3.2 3.3 3.1 3.2 3.3 3.1 3.2 3.3 3.1 3.2 3.3Daze Errors Daze Adjusted Raw
ScoreRaw Score
ORF ORF Errors ORF Accuracy Retell Daze
187 99 99 98 187188 99 99 98 188189 99 99 98 189190 >99 99 98 190191 99 98 191192 99 98 192193 99 98 193194 99 98 194195 99 99 195196 99 99 196197 99 99 197198 99 99 198199 99 99 199200 99 99 200201 99 99 201202 >99 99 202203 99 203204 99 204205 99 205206 99 206207 99 207208 99 208209 99 209210 99 210211 99 211212 99 212213 99 213214 99 214215 >99 215
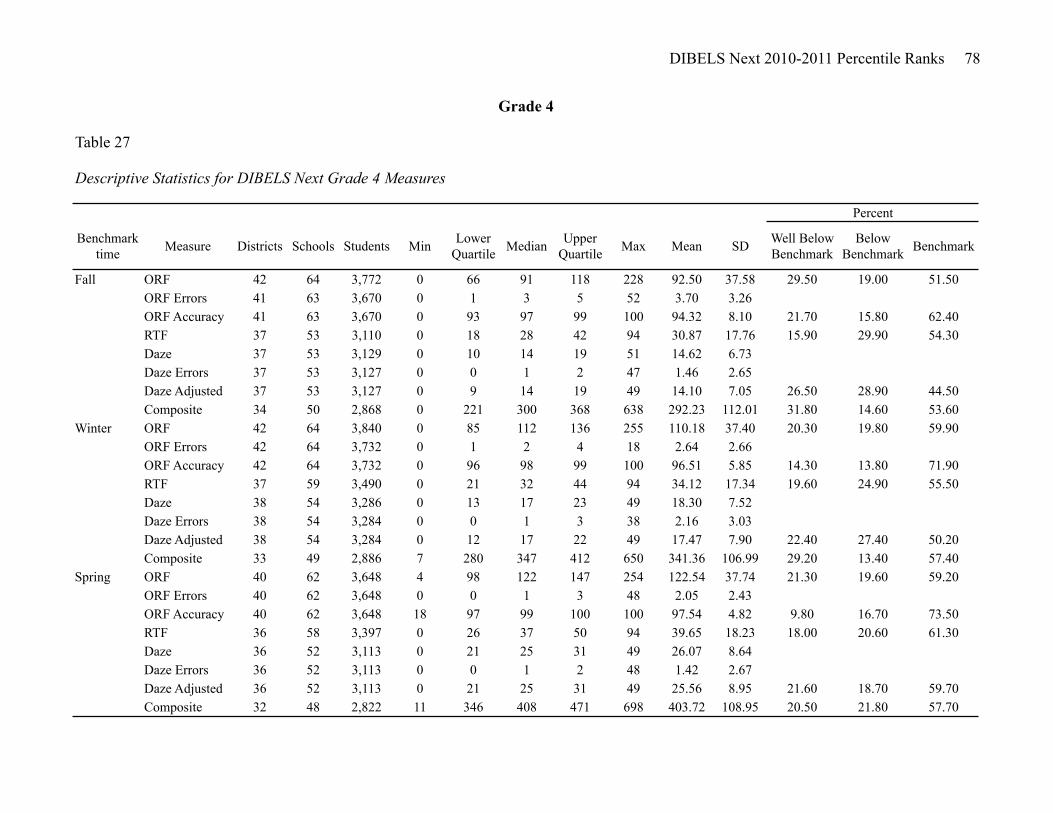
DIBELS Next 2010-2011 Percentile Ranks 78
Table 27
Descriptive Statistics for DIBELS Next Grade 4 Measures
Benchmark time Measure Districts Schools Students Min Lower
Quartile Median Upper Quartile Max Mean SD Well Below
BenchmarkBelow
Benchmark Benchmark
Fall ORF 42 64 3,772 0 66 91 118 228 92.50 37.58 29.50 19.00 51.50ORF Errors 41 63 3,670 0 1 3 5 52 3.70 3.26ORF Accuracy 41 63 3,670 0 93 97 99 100 94.32 8.10 21.70 15.80 62.40RTF 37 53 3,110 0 18 28 42 94 30.87 17.76 15.90 29.90 54.30Daze 37 53 3,129 0 10 14 19 51 14.62 6.73Daze Errors 37 53 3,127 0 0 1 2 47 1.46 2.65Daze Adjusted 37 53 3,127 0 9 14 19 49 14.10 7.05 26.50 28.90 44.50Composite 34 50 2,868 0 221 300 368 638 292.23 112.01 31.80 14.60 53.60
Winter ORF 42 64 3,840 0 85 112 136 255 110.18 37.40 20.30 19.80 59.90ORF Errors 42 64 3,732 0 1 2 4 18 2.64 2.66ORF Accuracy 42 64 3,732 0 96 98 99 100 96.51 5.85 14.30 13.80 71.90RTF 37 59 3,490 0 21 32 44 94 34.12 17.34 19.60 24.90 55.50Daze 38 54 3,286 0 13 17 23 49 18.30 7.52Daze Errors 38 54 3,284 0 0 1 3 38 2.16 3.03Daze Adjusted 38 54 3,284 0 12 17 22 49 17.47 7.90 22.40 27.40 50.20Composite 33 49 2,886 7 280 347 412 650 341.36 106.99 29.20 13.40 57.40
Spring ORF 40 62 3,648 4 98 122 147 254 122.54 37.74 21.30 19.60 59.20ORF Errors 40 62 3,648 0 0 1 3 48 2.05 2.43ORF Accuracy 40 62 3,648 18 97 99 100 100 97.54 4.82 9.80 16.70 73.50RTF 36 58 3,397 0 26 37 50 94 39.65 18.23 18.00 20.60 61.30Daze 36 52 3,113 0 21 25 31 49 26.07 8.64Daze Errors 36 52 3,113 0 0 1 2 48 1.42 2.67Daze Adjusted 36 52 3,113 0 21 25 31 49 25.56 8.95 21.60 18.70 59.70Composite 32 48 2,822 11 346 408 471 698 403.72 108.95 20.50 21.80 57.70
Percent
Grade 4

DIBELS Next 2010-2011 Percentile Ranks 79
4.1 4.2 4.3 4.1 4.2 4.3 4.1 4.2 4.3 4.1 4.2 4.3 4.1 4.2 4.3 4.1 4.2 4.3 4.1 4.2 4.30 95 90 86 1 <1 <1 78 88 79 1 1 <1 01 82 69 60 3 1 <1 1 44 61 43 2 1 1 12 66 49 39 3 1 1 1 <1 25 38 22 3 2 1 23 50 34 25 3 1 1 2 1 <1 14 23 12 5 2 1 34 36 23 15 4 1 1 4 1 1 8 15 8 6 3 2 45 26 16 10 4 2 1 6 2 1 5 10 5 9 4 2 56 19 11 6 5 2 1 9 2 1 4 7 4 12 5 2 67 14 7 4 6 3 2 13 4 2 3 5 3 16 7 3 78 10 5 3 7 3 2 17 5 2 2 3 2 20 9 3 89 <1 7 3 2 8 4 2 20 8 3 2 3 2 24 12 4 910 1 4 2 1 9 5 3 25 12 3 1 2 2 29 16 4 1011 1 3 1 1 11 6 4 31 16 4 1 2 2 34 20 5 1112 1 2 1 1 13 7 4 37 20 5 1 1 1 40 25 7 1213 1 2 1 <1 15 9 4 44 25 6 1 1 1 47 30 8 1314 1 1 <1 17 10 5 50 31 8 1 1 1 53 36 9 1415 1 <1 1 19 12 6 56 37 10 1 1 1 58 42 11 1516 1 1 1 21 13 7 61 43 12 <1 1 1 63 47 13 1617 2 1 <1 1 23 15 8 66 48 14 1 1 67 52 15 1718 2 1 1 <1 25 17 9 71 53 16 1 1 72 56 18 1819 2 1 1 27 19 10 75 58 18 1 <1 76 61 20 1920 2 1 1 30 21 12 79 62 21 <1 80 65 23 2021 2 1 1 32 24 13 83 67 25 84 69 27 2122 2 1 1 35 27 15 87 72 30 87 74 32 2223 3 1 1 37 29 17 90 76 35 90 78 37 2324 3 1 1 39 31 19 92 79 41 92 81 43 2425 3 1 1 42 34 22 93 83 48 93 84 50 2526 3 1 1 45 37 24 95 86 54 95 87 56 26
Table 28
DIBELS Next Percentile Ranks for Grade 4 Benchmark Assessments
Daze Errors Daze Adjusted Raw Score
Raw Score
ORF ORF Errors ORF Accuracy RTF Daze
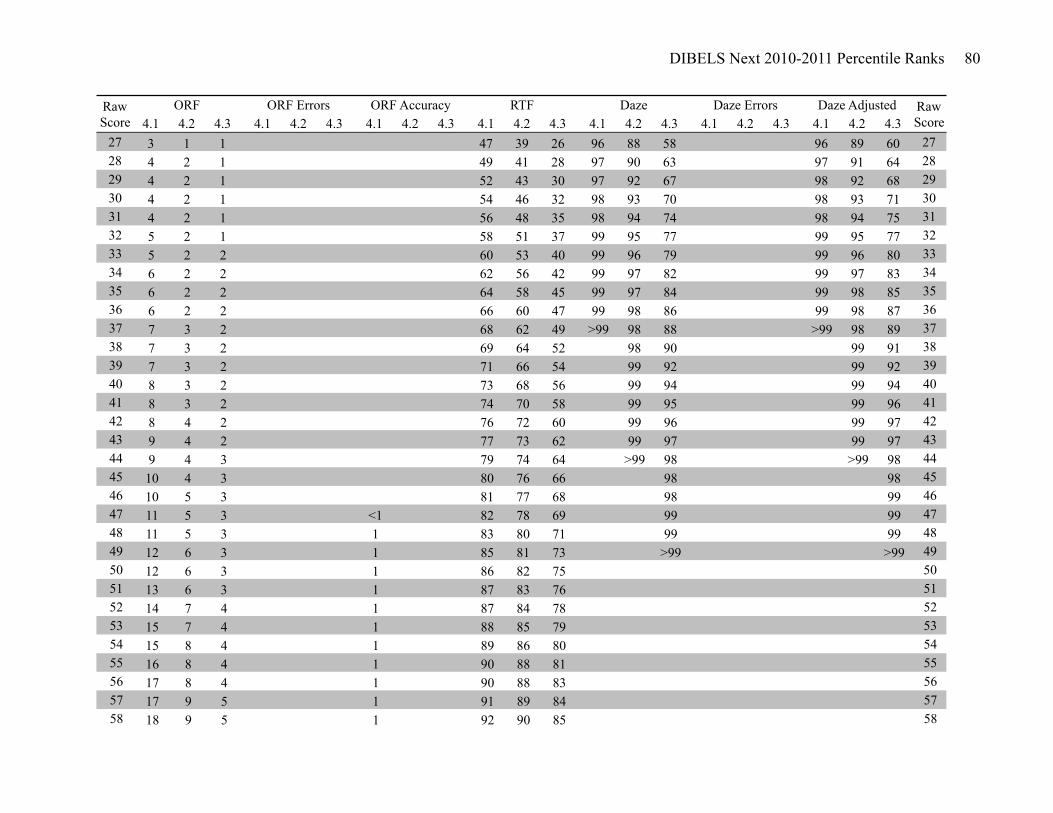
DIBELS Next 2010-2011 Percentile Ranks 80
4.1 4.2 4.3 4.1 4.2 4.3 4.1 4.2 4.3 4.1 4.2 4.3 4.1 4.2 4.3 4.1 4.2 4.3 4.1 4.2 4.3Daze Errors Daze Adjusted Raw
ScoreRaw Score
ORF ORF Errors ORF Accuracy RTF Daze
27 3 1 1 47 39 26 96 88 58 96 89 60 2728 4 2 1 49 41 28 97 90 63 97 91 64 2829 4 2 1 52 43 30 97 92 67 98 92 68 2930 4 2 1 54 46 32 98 93 70 98 93 71 3031 4 2 1 56 48 35 98 94 74 98 94 75 3132 5 2 1 58 51 37 99 95 77 99 95 77 3233 5 2 2 60 53 40 99 96 79 99 96 80 3334 6 2 2 62 56 42 99 97 82 99 97 83 3435 6 2 2 64 58 45 99 97 84 99 98 85 3536 6 2 2 66 60 47 99 98 86 99 98 87 3637 7 3 2 68 62 49 >99 98 88 >99 98 89 3738 7 3 2 69 64 52 98 90 99 91 3839 7 3 2 71 66 54 99 92 99 92 3940 8 3 2 73 68 56 99 94 99 94 4041 8 3 2 74 70 58 99 95 99 96 4142 8 4 2 76 72 60 99 96 99 97 4243 9 4 2 77 73 62 99 97 99 97 4344 9 4 3 79 74 64 >99 98 >99 98 4445 10 4 3 80 76 66 98 98 4546 10 5 3 81 77 68 98 99 4647 11 5 3 <1 82 78 69 99 99 4748 11 5 3 1 83 80 71 99 99 4849 12 6 3 1 85 81 73 >99 >99 4950 12 6 3 1 86 82 75 5051 13 6 3 1 87 83 76 5152 14 7 4 1 87 84 78 5253 15 7 4 1 88 85 79 5354 15 8 4 1 89 86 80 5455 16 8 4 1 90 88 81 5556 17 8 4 1 90 88 83 5657 17 9 5 1 91 89 84 5758 18 9 5 1 92 90 85 58
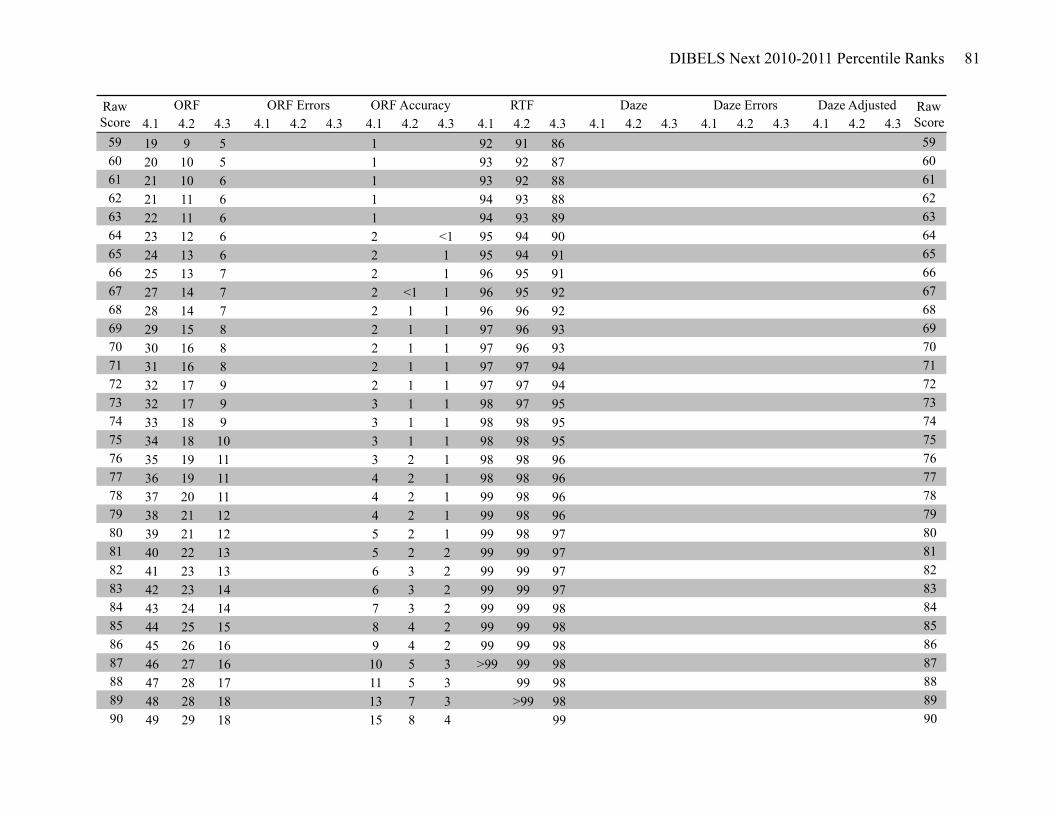
DIBELS Next 2010-2011 Percentile Ranks 81
4.1 4.2 4.3 4.1 4.2 4.3 4.1 4.2 4.3 4.1 4.2 4.3 4.1 4.2 4.3 4.1 4.2 4.3 4.1 4.2 4.3Daze Errors Daze Adjusted Raw
ScoreRaw Score
ORF ORF Errors ORF Accuracy RTF Daze
59 19 9 5 1 92 91 86 5960 20 10 5 1 93 92 87 6061 21 10 6 1 93 92 88 6162 21 11 6 1 94 93 88 6263 22 11 6 1 94 93 89 6364 23 12 6 2 <1 95 94 90 6465 24 13 6 2 1 95 94 91 6566 25 13 7 2 1 96 95 91 6667 27 14 7 2 <1 1 96 95 92 6768 28 14 7 2 1 1 96 96 92 6869 29 15 8 2 1 1 97 96 93 6970 30 16 8 2 1 1 97 96 93 7071 31 16 8 2 1 1 97 97 94 7172 32 17 9 2 1 1 97 97 94 7273 32 17 9 3 1 1 98 97 95 7374 33 18 9 3 1 1 98 98 95 7475 34 18 10 3 1 1 98 98 95 7576 35 19 11 3 2 1 98 98 96 7677 36 19 11 4 2 1 98 98 96 7778 37 20 11 4 2 1 99 98 96 7879 38 21 12 4 2 1 99 98 96 7980 39 21 12 5 2 1 99 98 97 8081 40 22 13 5 2 2 99 99 97 8182 41 23 13 6 3 2 99 99 97 8283 42 23 14 6 3 2 99 99 97 8384 43 24 14 7 3 2 99 99 98 8485 44 25 15 8 4 2 99 99 98 8586 45 26 16 9 4 2 99 99 98 8687 46 27 16 10 5 3 >99 99 98 8788 47 28 17 11 5 3 99 98 8889 48 28 18 13 7 3 >99 98 8990 49 29 18 15 8 4 99 90
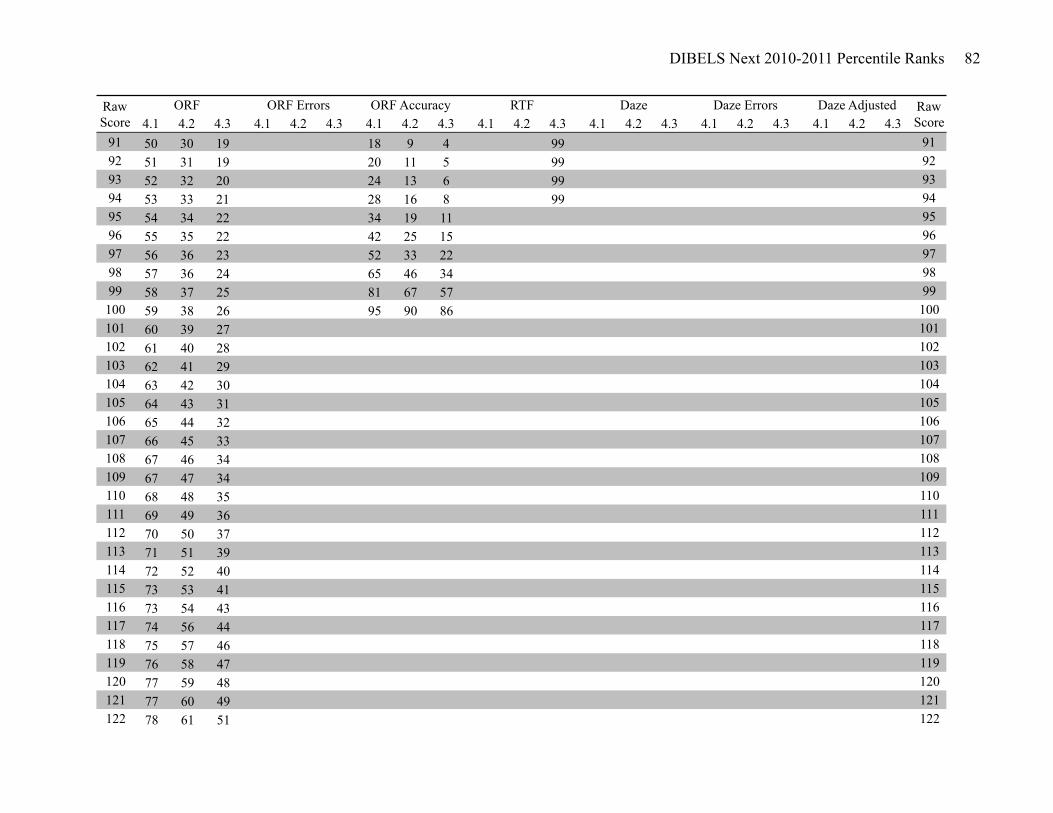
DIBELS Next 2010-2011 Percentile Ranks 82
4.1 4.2 4.3 4.1 4.2 4.3 4.1 4.2 4.3 4.1 4.2 4.3 4.1 4.2 4.3 4.1 4.2 4.3 4.1 4.2 4.3Daze Errors Daze Adjusted Raw
ScoreRaw Score
ORF ORF Errors ORF Accuracy RTF Daze
91 50 30 19 18 9 4 99 9192 51 31 19 20 11 5 99 9293 52 32 20 24 13 6 99 9394 53 33 21 28 16 8 99 9495 54 34 22 34 19 11 9596 55 35 22 42 25 15 9697 56 36 23 52 33 22 9798 57 36 24 65 46 34 9899 58 37 25 81 67 57 99100 59 38 26 95 90 86 100101 60 39 27 101102 61 40 28 102103 62 41 29 103104 63 42 30 104105 64 43 31 105106 65 44 32 106107 66 45 33 107108 67 46 34 108109 67 47 34 109110 68 48 35 110111 69 49 36 111112 70 50 37 112113 71 51 39 113114 72 52 40 114115 73 53 41 115116 73 54 43 116117 74 56 44 117118 75 57 46 118119 76 58 47 119120 77 59 48 120121 77 60 49 121122 78 61 51 122

DIBELS Next 2010-2011 Percentile Ranks 83
4.1 4.2 4.3 4.1 4.2 4.3 4.1 4.2 4.3 4.1 4.2 4.3 4.1 4.2 4.3 4.1 4.2 4.3 4.1 4.2 4.3Daze Errors Daze Adjusted Raw
ScoreRaw Score
ORF ORF Errors ORF Accuracy RTF Daze
123 79 63 52 123124 80 64 53 124125 80 65 53 125126 81 66 54 126127 82 67 55 127128 82 68 56 128129 83 69 57 129130 83 70 58 130131 84 71 59 131132 84 72 61 132133 85 73 62 133134 86 73 63 134135 86 74 64 135136 87 75 65 136137 87 76 66 137138 88 77 67 138139 89 78 67 139140 89 78 68 140141 90 79 69 141142 90 80 70 142143 91 81 71 143144 91 82 72 144145 91 82 73 145146 92 83 74 146147 92 84 75 147148 92 84 76 148149 93 85 76 149150 93 86 77 150151 93 87 78 151152 94 87 78 152153 94 88 79 153154 94 88 80 154
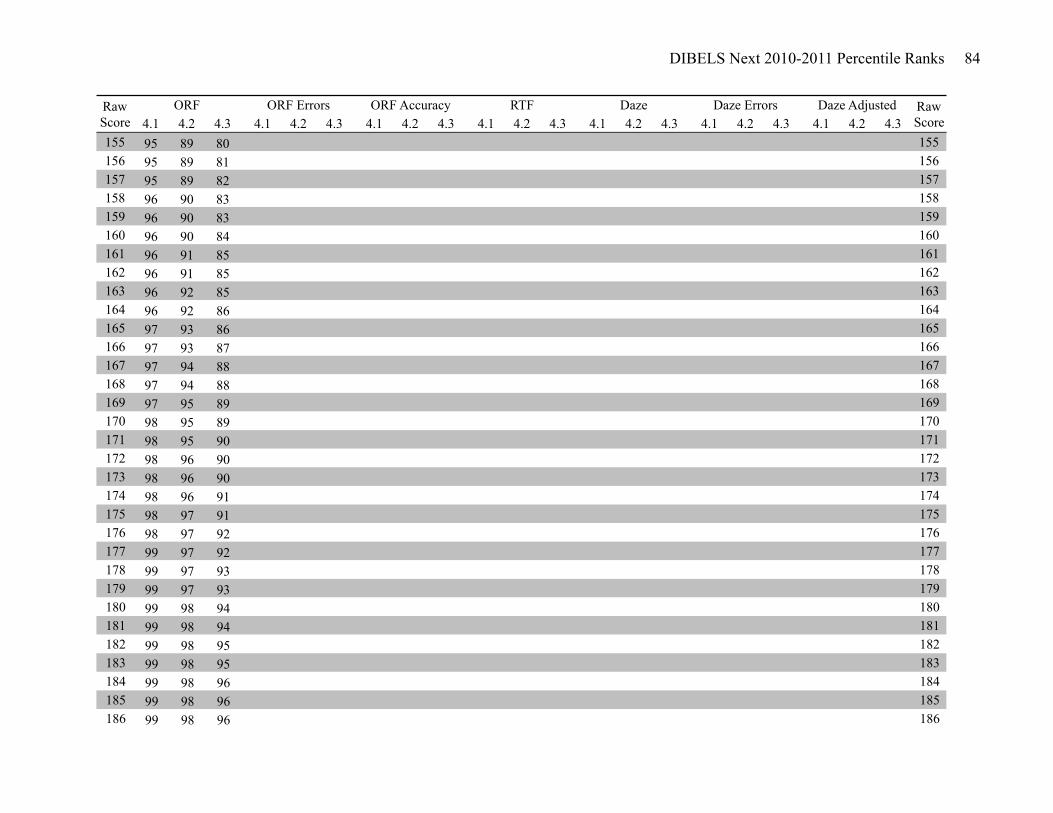
DIBELS Next 2010-2011 Percentile Ranks 84
4.1 4.2 4.3 4.1 4.2 4.3 4.1 4.2 4.3 4.1 4.2 4.3 4.1 4.2 4.3 4.1 4.2 4.3 4.1 4.2 4.3Daze Errors Daze Adjusted Raw
ScoreRaw Score
ORF ORF Errors ORF Accuracy RTF Daze
155 95 89 80 155156 95 89 81 156157 95 89 82 157158 96 90 83 158159 96 90 83 159160 96 90 84 160161 96 91 85 161162 96 91 85 162163 96 92 85 163164 96 92 86 164165 97 93 86 165166 97 93 87 166167 97 94 88 167168 97 94 88 168169 97 95 89 169170 98 95 89 170171 98 95 90 171172 98 96 90 172173 98 96 90 173174 98 96 91 174175 98 97 91 175176 98 97 92 176177 99 97 92 177178 99 97 93 178179 99 97 93 179180 99 98 94 180181 99 98 94 181182 99 98 95 182183 99 98 95 183184 99 98 96 184185 99 98 96 185186 99 98 96 186
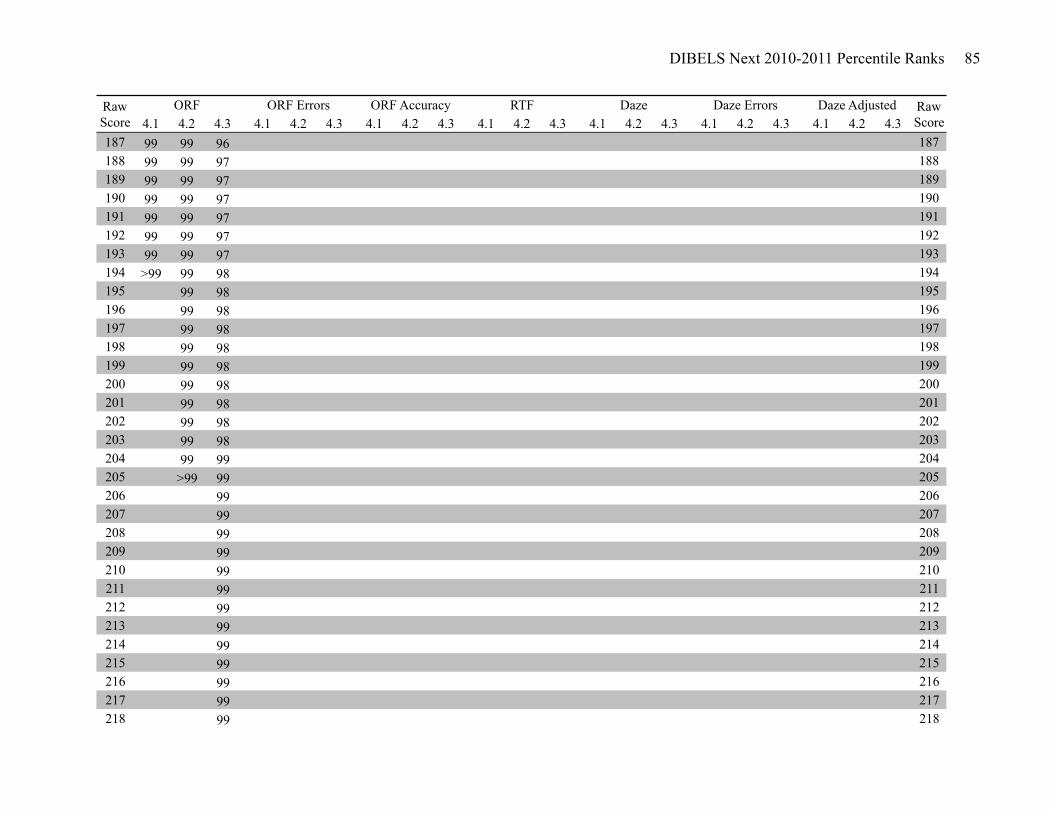
DIBELS Next 2010-2011 Percentile Ranks 85
4.1 4.2 4.3 4.1 4.2 4.3 4.1 4.2 4.3 4.1 4.2 4.3 4.1 4.2 4.3 4.1 4.2 4.3 4.1 4.2 4.3Daze Errors Daze Adjusted Raw
ScoreRaw Score
ORF ORF Errors ORF Accuracy RTF Daze
187 99 99 96 187188 99 99 97 188189 99 99 97 189190 99 99 97 190191 99 99 97 191192 99 99 97 192193 99 99 97 193194 >99 99 98 194195 99 98 195196 99 98 196197 99 98 197198 99 98 198199 99 98 199200 99 98 200201 99 98 201202 99 98 202203 99 98 203204 99 99 204205 >99 99 205206 99 206207 99 207208 99 208209 99 209210 99 210211 99 211212 99 212213 99 213214 99 214215 99 215216 99 216217 99 217218 99 218
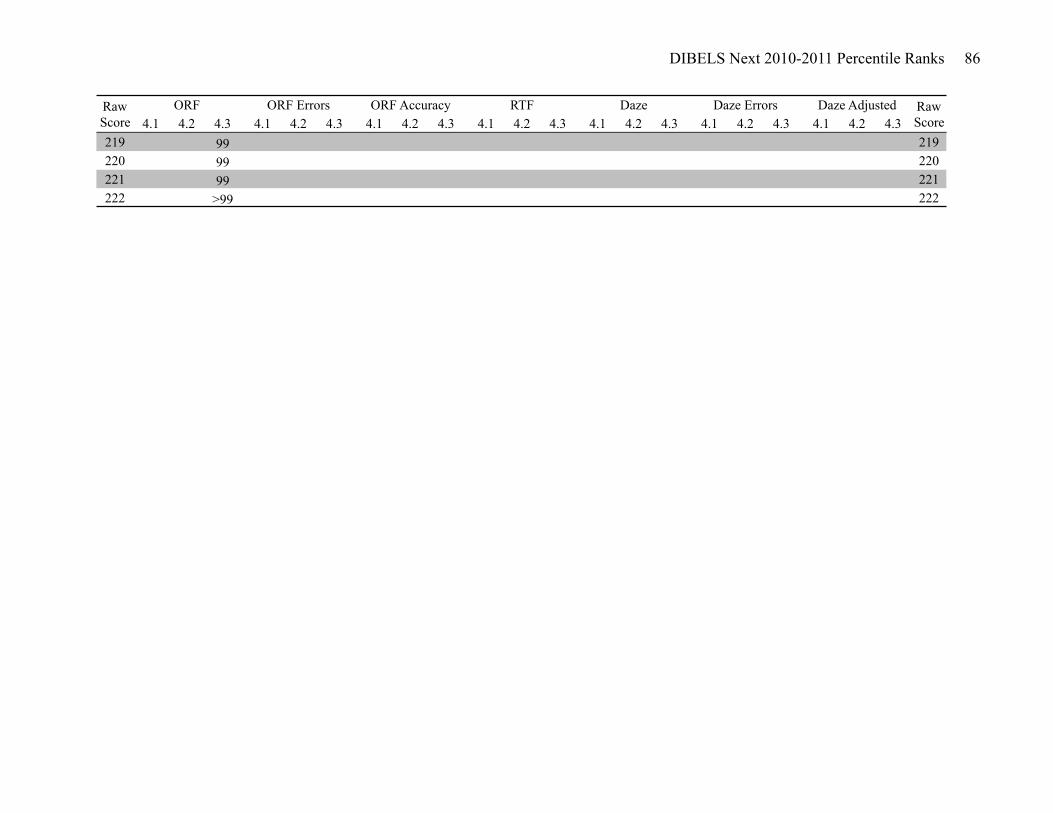
DIBELS Next 2010-2011 Percentile Ranks 86
4.1 4.2 4.3 4.1 4.2 4.3 4.1 4.2 4.3 4.1 4.2 4.3 4.1 4.2 4.3 4.1 4.2 4.3 4.1 4.2 4.3Daze Errors Daze Adjusted Raw
ScoreRaw Score
ORF ORF Errors ORF Accuracy RTF Daze
219 99 219220 99 220221 99 221222 >99 222
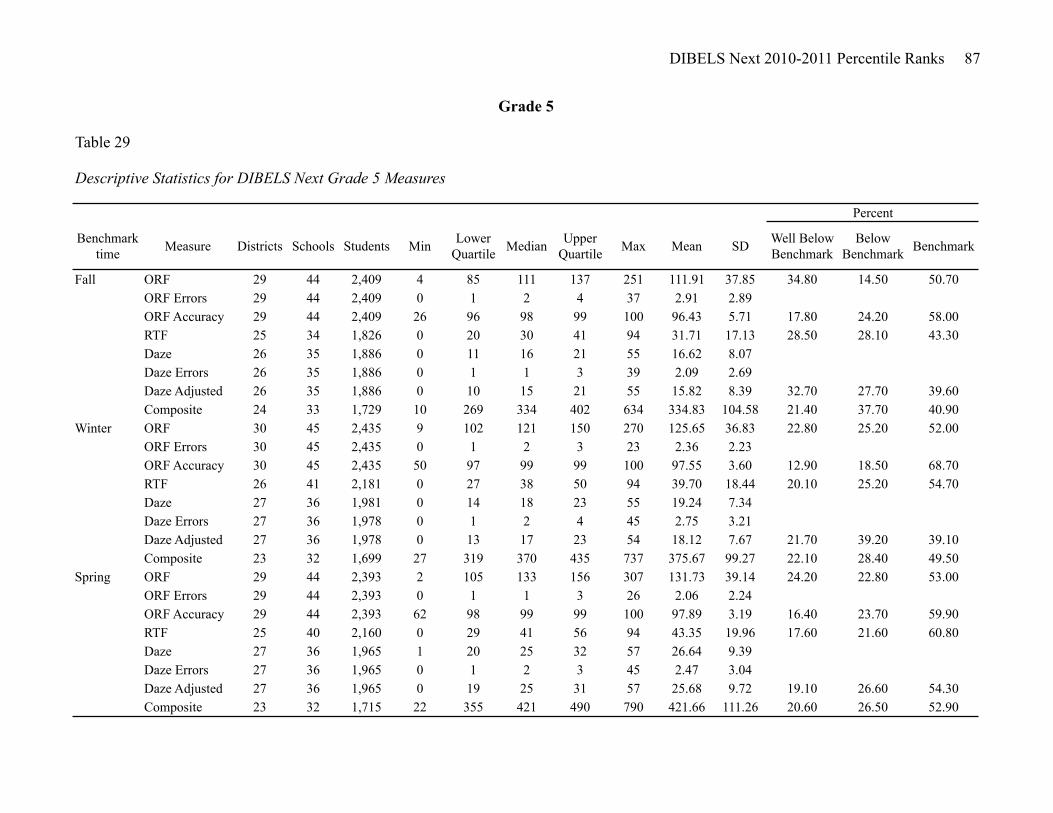
DIBELS Next 2010-2011 Percentile Ranks 87
Table 29
Descriptive Statistics for DIBELS Next Grade 5 Measures
Benchmark time Measure Districts Schools Students Min Lower
Quartile Median Upper Quartile Max Mean SD Well Below
BenchmarkBelow
Benchmark Benchmark
Fall ORF 29 44 2,409 4 85 111 137 251 111.91 37.85 34.80 14.50 50.70ORF Errors 29 44 2,409 0 1 2 4 37 2.91 2.89ORF Accuracy 29 44 2,409 26 96 98 99 100 96.43 5.71 17.80 24.20 58.00RTF 25 34 1,826 0 20 30 41 94 31.71 17.13 28.50 28.10 43.30Daze 26 35 1,886 0 11 16 21 55 16.62 8.07Daze Errors 26 35 1,886 0 1 1 3 39 2.09 2.69Daze Adjusted 26 35 1,886 0 10 15 21 55 15.82 8.39 32.70 27.70 39.60Composite 24 33 1,729 10 269 334 402 634 334.83 104.58 21.40 37.70 40.90
Winter ORF 30 45 2,435 9 102 121 150 270 125.65 36.83 22.80 25.20 52.00ORF Errors 30 45 2,435 0 1 2 3 23 2.36 2.23ORF Accuracy 30 45 2,435 50 97 99 99 100 97.55 3.60 12.90 18.50 68.70RTF 26 41 2,181 0 27 38 50 94 39.70 18.44 20.10 25.20 54.70Daze 27 36 1,981 0 14 18 23 55 19.24 7.34Daze Errors 27 36 1,978 0 1 2 4 45 2.75 3.21Daze Adjusted 27 36 1,978 0 13 17 23 54 18.12 7.67 21.70 39.20 39.10Composite 23 32 1,699 27 319 370 435 737 375.67 99.27 22.10 28.40 49.50
Spring ORF 29 44 2,393 2 105 133 156 307 131.73 39.14 24.20 22.80 53.00ORF Errors 29 44 2,393 0 1 1 3 26 2.06 2.24ORF Accuracy 29 44 2,393 62 98 99 99 100 97.89 3.19 16.40 23.70 59.90RTF 25 40 2,160 0 29 41 56 94 43.35 19.96 17.60 21.60 60.80Daze 27 36 1,965 1 20 25 32 57 26.64 9.39Daze Errors 27 36 1,965 0 1 2 3 45 2.47 3.04Daze Adjusted 27 36 1,965 0 19 25 31 57 25.68 9.72 19.10 26.60 54.30Composite 23 32 1,715 22 355 421 490 790 421.66 111.26 20.60 26.50 52.90
Percent
Grade 5
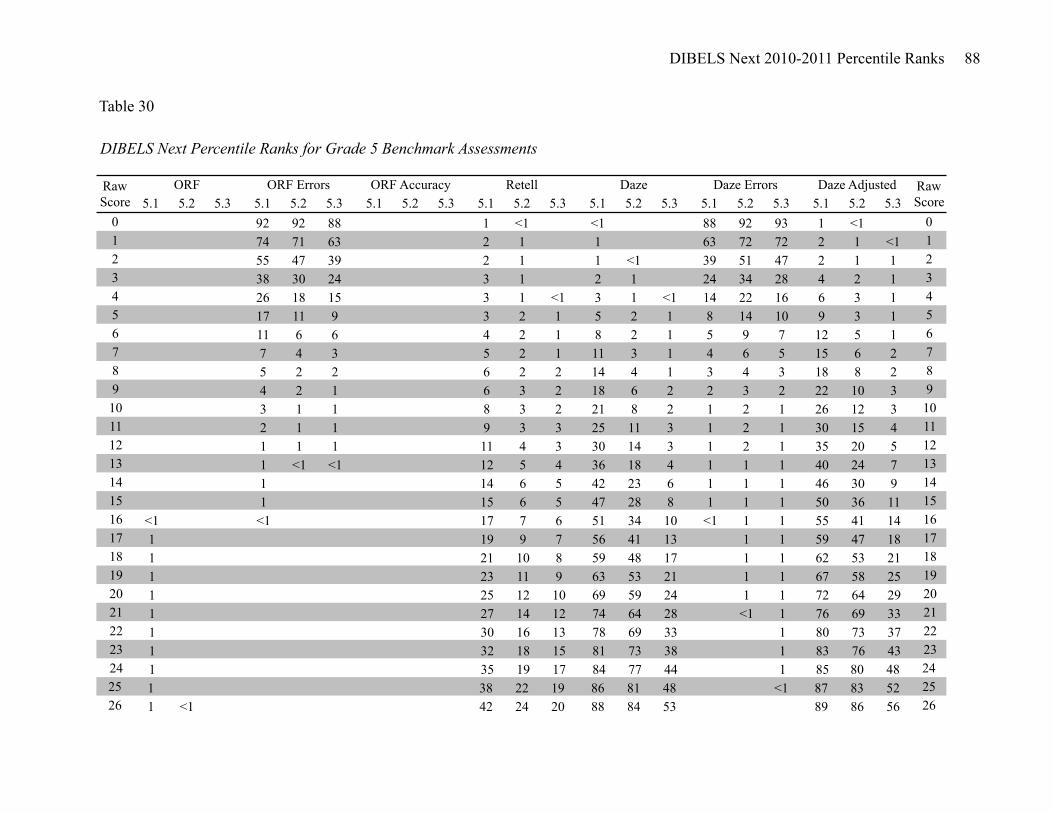
DIBELS Next 2010-2011 Percentile Ranks 88
5.1 5.2 5.3 5.1 5.2 5.3 5.1 5.2 5.3 5.1 5.2 5.3 5.1 5.2 5.3 5.1 5.2 5.3 5.1 5.2 5.30 92 92 88 1 <1 <1 88 92 93 1 <1 01 74 71 63 2 1 1 63 72 72 2 1 <1 12 55 47 39 2 1 1 <1 39 51 47 2 1 1 23 38 30 24 3 1 2 1 24 34 28 4 2 1 34 26 18 15 3 1 <1 3 1 <1 14 22 16 6 3 1 45 17 11 9 3 2 1 5 2 1 8 14 10 9 3 1 56 11 6 6 4 2 1 8 2 1 5 9 7 12 5 1 67 7 4 3 5 2 1 11 3 1 4 6 5 15 6 2 78 5 2 2 6 2 2 14 4 1 3 4 3 18 8 2 89 4 2 1 6 3 2 18 6 2 2 3 2 22 10 3 910 3 1 1 8 3 2 21 8 2 1 2 1 26 12 3 1011 2 1 1 9 3 3 25 11 3 1 2 1 30 15 4 1112 1 1 1 11 4 3 30 14 3 1 2 1 35 20 5 1213 1 <1 <1 12 5 4 36 18 4 1 1 1 40 24 7 1314 1 14 6 5 42 23 6 1 1 1 46 30 9 1415 1 15 6 5 47 28 8 1 1 1 50 36 11 1516 <1 <1 17 7 6 51 34 10 <1 1 1 55 41 14 1617 1 19 9 7 56 41 13 1 1 59 47 18 1718 1 21 10 8 59 48 17 1 1 62 53 21 1819 1 23 11 9 63 53 21 1 1 67 58 25 1920 1 25 12 10 69 59 24 1 1 72 64 29 2021 1 27 14 12 74 64 28 <1 1 76 69 33 2122 1 30 16 13 78 69 33 1 80 73 37 2223 1 32 18 15 81 73 38 1 83 76 43 2324 1 35 19 17 84 77 44 1 85 80 48 2425 1 38 22 19 86 81 48 <1 87 83 52 2526 1 <1 42 24 20 88 84 53 89 86 56 26
Table 30
DIBELS Next Percentile Ranks for Grade 5 Benchmark Assessments
Daze Errors Daze Adjusted Raw Score
Raw Score
ORF ORF Errors ORF Accuracy Retell Daze
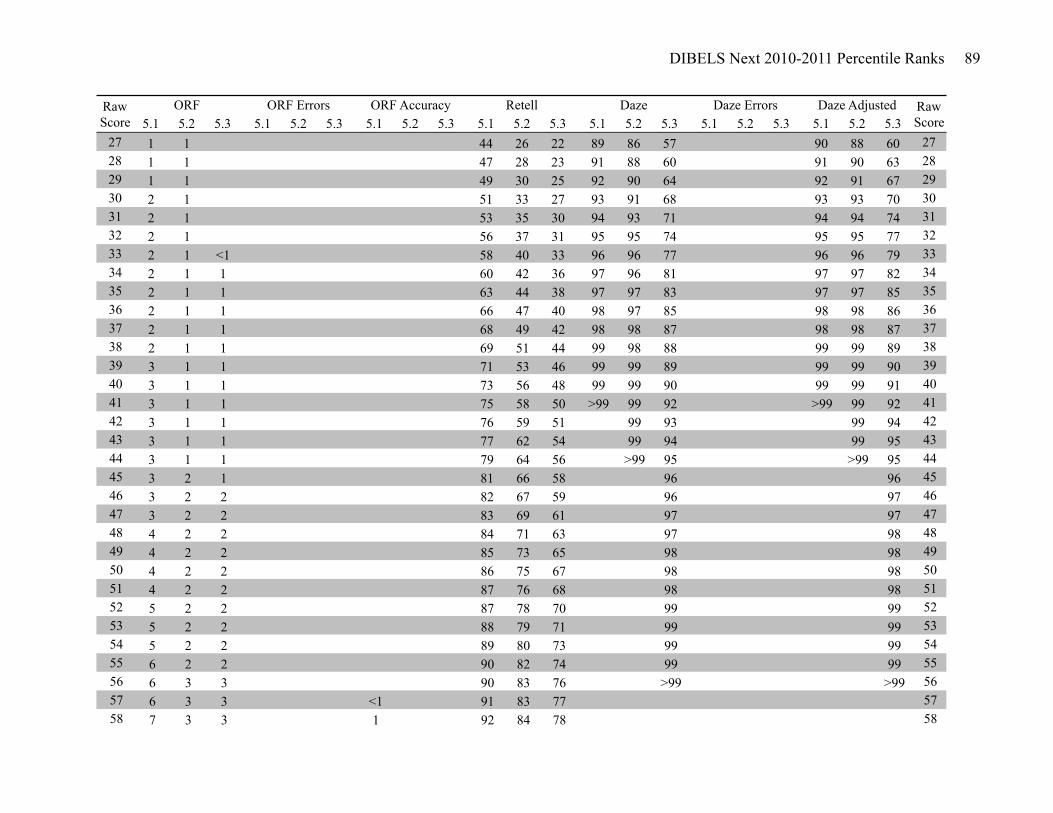
DIBELS Next 2010-2011 Percentile Ranks 89
5.1 5.2 5.3 5.1 5.2 5.3 5.1 5.2 5.3 5.1 5.2 5.3 5.1 5.2 5.3 5.1 5.2 5.3 5.1 5.2 5.3Daze Errors Daze Adjusted Raw
ScoreRaw Score
ORF ORF Errors ORF Accuracy Retell Daze
27 1 1 44 26 22 89 86 57 90 88 60 2728 1 1 47 28 23 91 88 60 91 90 63 2829 1 1 49 30 25 92 90 64 92 91 67 2930 2 1 51 33 27 93 91 68 93 93 70 3031 2 1 53 35 30 94 93 71 94 94 74 3132 2 1 56 37 31 95 95 74 95 95 77 3233 2 1 <1 58 40 33 96 96 77 96 96 79 3334 2 1 1 60 42 36 97 96 81 97 97 82 3435 2 1 1 63 44 38 97 97 83 97 97 85 3536 2 1 1 66 47 40 98 97 85 98 98 86 3637 2 1 1 68 49 42 98 98 87 98 98 87 3738 2 1 1 69 51 44 99 98 88 99 99 89 3839 3 1 1 71 53 46 99 99 89 99 99 90 3940 3 1 1 73 56 48 99 99 90 99 99 91 4041 3 1 1 75 58 50 >99 99 92 >99 99 92 4142 3 1 1 76 59 51 99 93 99 94 4243 3 1 1 77 62 54 99 94 99 95 4344 3 1 1 79 64 56 >99 95 >99 95 4445 3 2 1 81 66 58 96 96 4546 3 2 2 82 67 59 96 97 4647 3 2 2 83 69 61 97 97 4748 4 2 2 84 71 63 97 98 4849 4 2 2 85 73 65 98 98 4950 4 2 2 86 75 67 98 98 5051 4 2 2 87 76 68 98 98 5152 5 2 2 87 78 70 99 99 5253 5 2 2 88 79 71 99 99 5354 5 2 2 89 80 73 99 99 5455 6 2 2 90 82 74 99 99 5556 6 3 3 90 83 76 >99 >99 5657 6 3 3 <1 91 83 77 5758 7 3 3 1 92 84 78 58
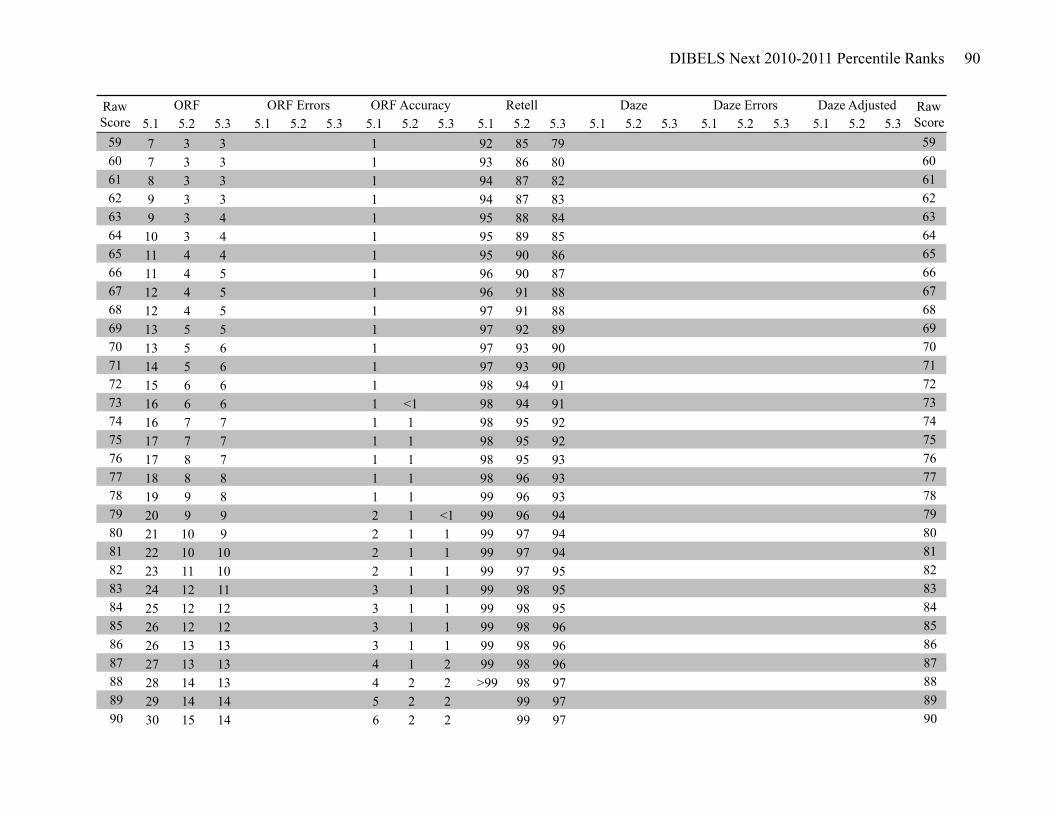
DIBELS Next 2010-2011 Percentile Ranks 90
5.1 5.2 5.3 5.1 5.2 5.3 5.1 5.2 5.3 5.1 5.2 5.3 5.1 5.2 5.3 5.1 5.2 5.3 5.1 5.2 5.3Daze Errors Daze Adjusted Raw
ScoreRaw Score
ORF ORF Errors ORF Accuracy Retell Daze
59 7 3 3 1 92 85 79 5960 7 3 3 1 93 86 80 6061 8 3 3 1 94 87 82 6162 9 3 3 1 94 87 83 6263 9 3 4 1 95 88 84 6364 10 3 4 1 95 89 85 6465 11 4 4 1 95 90 86 6566 11 4 5 1 96 90 87 6667 12 4 5 1 96 91 88 6768 12 4 5 1 97 91 88 6869 13 5 5 1 97 92 89 6970 13 5 6 1 97 93 90 7071 14 5 6 1 97 93 90 7172 15 6 6 1 98 94 91 7273 16 6 6 1 <1 98 94 91 7374 16 7 7 1 1 98 95 92 7475 17 7 7 1 1 98 95 92 7576 17 8 7 1 1 98 95 93 7677 18 8 8 1 1 98 96 93 7778 19 9 8 1 1 99 96 93 7879 20 9 9 2 1 <1 99 96 94 7980 21 10 9 2 1 1 99 97 94 8081 22 10 10 2 1 1 99 97 94 8182 23 11 10 2 1 1 99 97 95 8283 24 12 11 3 1 1 99 98 95 8384 25 12 12 3 1 1 99 98 95 8485 26 12 12 3 1 1 99 98 96 8586 26 13 13 3 1 1 99 98 96 8687 27 13 13 4 1 2 99 98 96 8788 28 14 13 4 2 2 >99 98 97 8889 29 14 14 5 2 2 99 97 8990 30 15 14 6 2 2 99 97 90
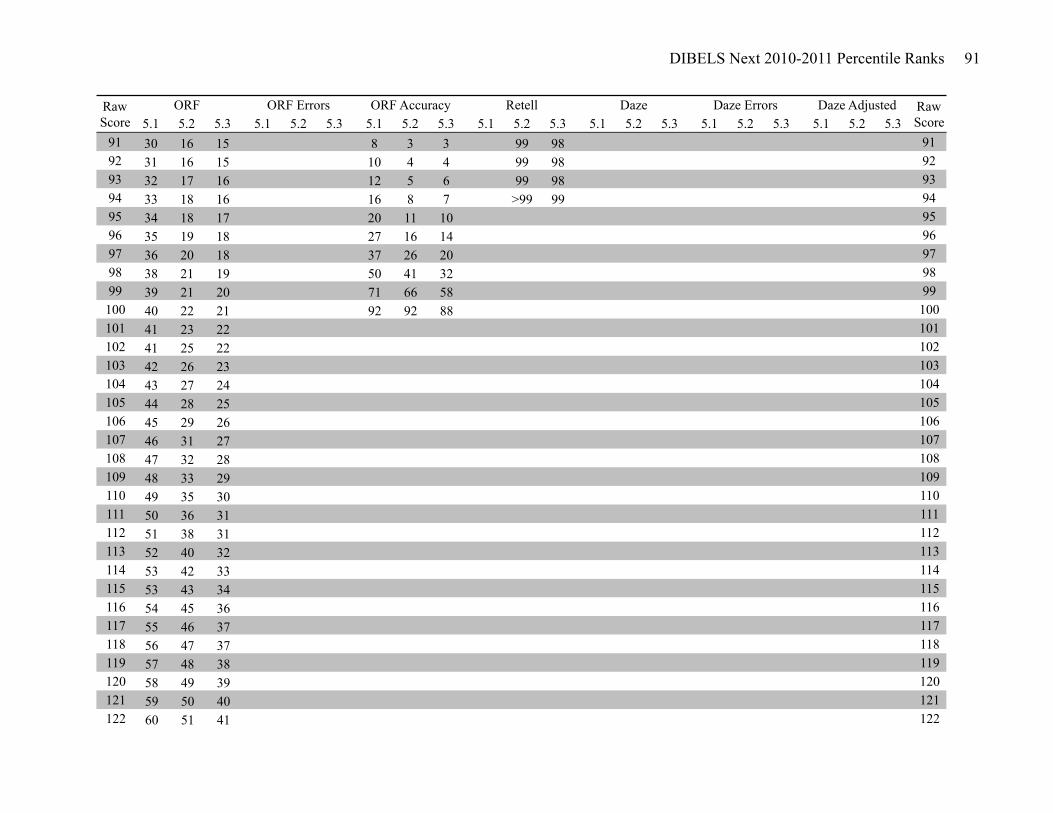
DIBELS Next 2010-2011 Percentile Ranks 91
5.1 5.2 5.3 5.1 5.2 5.3 5.1 5.2 5.3 5.1 5.2 5.3 5.1 5.2 5.3 5.1 5.2 5.3 5.1 5.2 5.3Daze Errors Daze Adjusted Raw
ScoreRaw Score
ORF ORF Errors ORF Accuracy Retell Daze
91 30 16 15 8 3 3 99 98 9192 31 16 15 10 4 4 99 98 9293 32 17 16 12 5 6 99 98 9394 33 18 16 16 8 7 >99 99 9495 34 18 17 20 11 10 9596 35 19 18 27 16 14 9697 36 20 18 37 26 20 9798 38 21 19 50 41 32 9899 39 21 20 71 66 58 99100 40 22 21 92 92 88 100101 41 23 22 101102 41 25 22 102103 42 26 23 103104 43 27 24 104105 44 28 25 105106 45 29 26 106107 46 31 27 107108 47 32 28 108109 48 33 29 109110 49 35 30 110111 50 36 31 111112 51 38 31 112113 52 40 32 113114 53 42 33 114115 53 43 34 115116 54 45 36 116117 55 46 37 117118 56 47 37 118119 57 48 38 119120 58 49 39 120121 59 50 40 121122 60 51 41 122
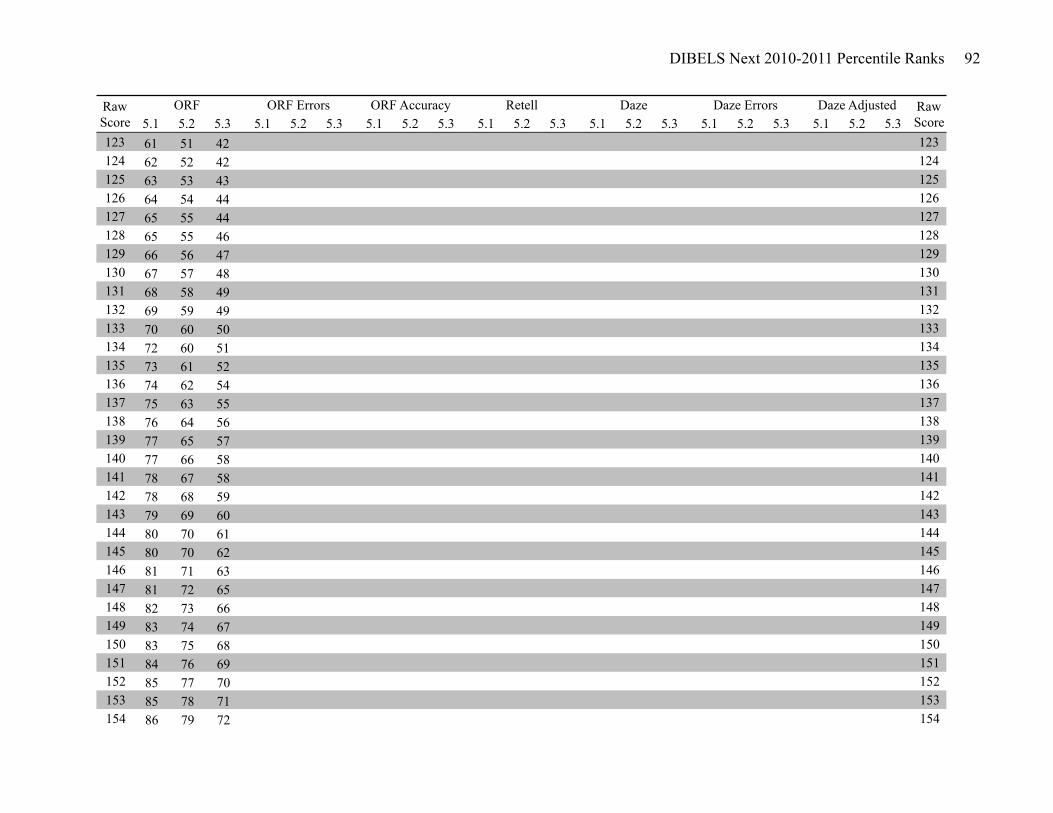
DIBELS Next 2010-2011 Percentile Ranks 92
5.1 5.2 5.3 5.1 5.2 5.3 5.1 5.2 5.3 5.1 5.2 5.3 5.1 5.2 5.3 5.1 5.2 5.3 5.1 5.2 5.3Daze Errors Daze Adjusted Raw
ScoreRaw Score
ORF ORF Errors ORF Accuracy Retell Daze
123 61 51 42 123124 62 52 42 124125 63 53 43 125126 64 54 44 126127 65 55 44 127128 65 55 46 128129 66 56 47 129130 67 57 48 130131 68 58 49 131132 69 59 49 132133 70 60 50 133134 72 60 51 134135 73 61 52 135136 74 62 54 136137 75 63 55 137138 76 64 56 138139 77 65 57 139140 77 66 58 140141 78 67 58 141142 78 68 59 142143 79 69 60 143144 80 70 61 144145 80 70 62 145146 81 71 63 146147 81 72 65 147148 82 73 66 148149 83 74 67 149150 83 75 68 150151 84 76 69 151152 85 77 70 152153 85 78 71 153154 86 79 72 154
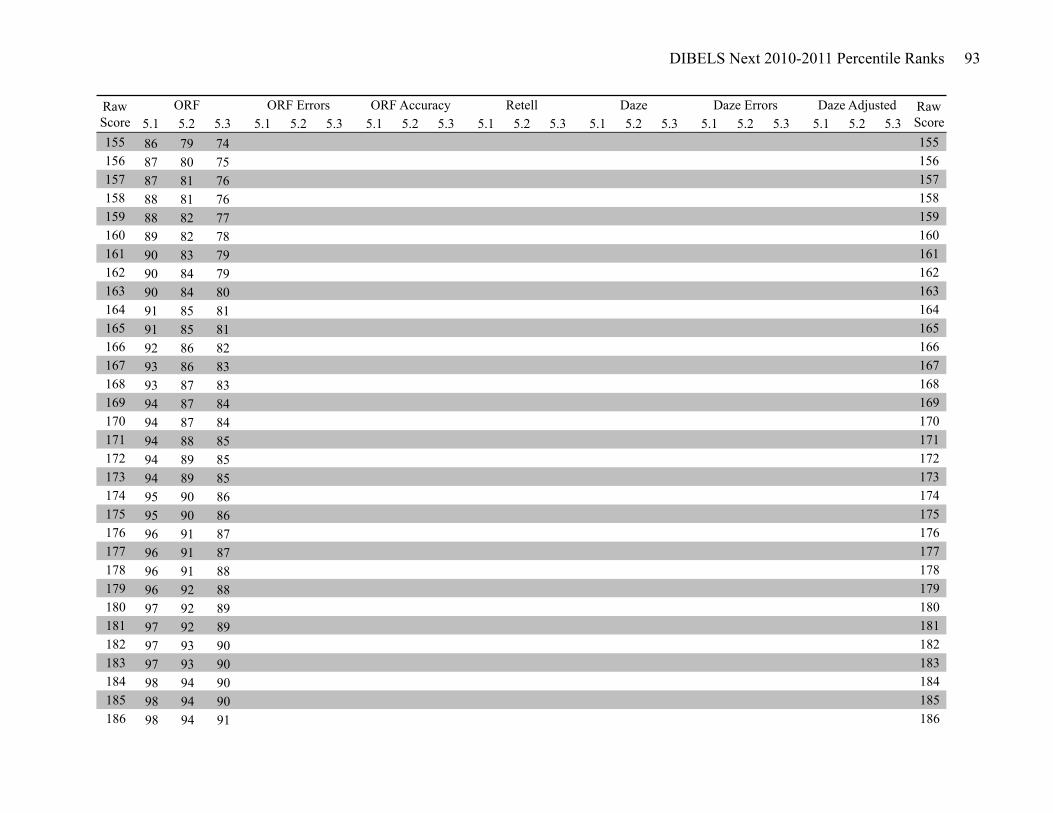
DIBELS Next 2010-2011 Percentile Ranks 93
5.1 5.2 5.3 5.1 5.2 5.3 5.1 5.2 5.3 5.1 5.2 5.3 5.1 5.2 5.3 5.1 5.2 5.3 5.1 5.2 5.3Daze Errors Daze Adjusted Raw
ScoreRaw Score
ORF ORF Errors ORF Accuracy Retell Daze
155 86 79 74 155156 87 80 75 156157 87 81 76 157158 88 81 76 158159 88 82 77 159160 89 82 78 160161 90 83 79 161162 90 84 79 162163 90 84 80 163164 91 85 81 164165 91 85 81 165166 92 86 82 166167 93 86 83 167168 93 87 83 168169 94 87 84 169170 94 87 84 170171 94 88 85 171172 94 89 85 172173 94 89 85 173174 95 90 86 174175 95 90 86 175176 96 91 87 176177 96 91 87 177178 96 91 88 178179 96 92 88 179180 97 92 89 180181 97 92 89 181182 97 93 90 182183 97 93 90 183184 98 94 90 184185 98 94 90 185186 98 94 91 186
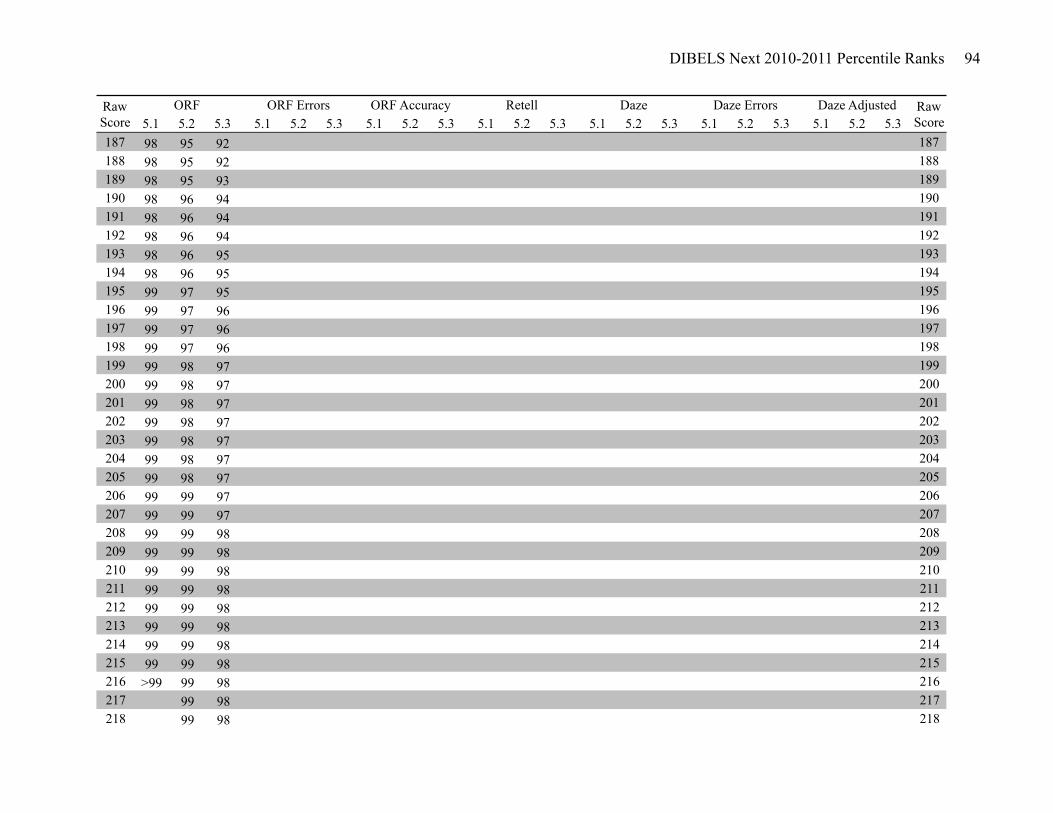
DIBELS Next 2010-2011 Percentile Ranks 94
5.1 5.2 5.3 5.1 5.2 5.3 5.1 5.2 5.3 5.1 5.2 5.3 5.1 5.2 5.3 5.1 5.2 5.3 5.1 5.2 5.3Daze Errors Daze Adjusted Raw
ScoreRaw Score
ORF ORF Errors ORF Accuracy Retell Daze
187 98 95 92 187188 98 95 92 188189 98 95 93 189190 98 96 94 190191 98 96 94 191192 98 96 94 192193 98 96 95 193194 98 96 95 194195 99 97 95 195196 99 97 96 196197 99 97 96 197198 99 97 96 198199 99 98 97 199200 99 98 97 200201 99 98 97 201202 99 98 97 202203 99 98 97 203204 99 98 97 204205 99 98 97 205206 99 99 97 206207 99 99 97 207208 99 99 98 208209 99 99 98 209210 99 99 98 210211 99 99 98 211212 99 99 98 212213 99 99 98 213214 99 99 98 214215 99 99 98 215216 >99 99 98 216217 99 98 217218 99 98 218
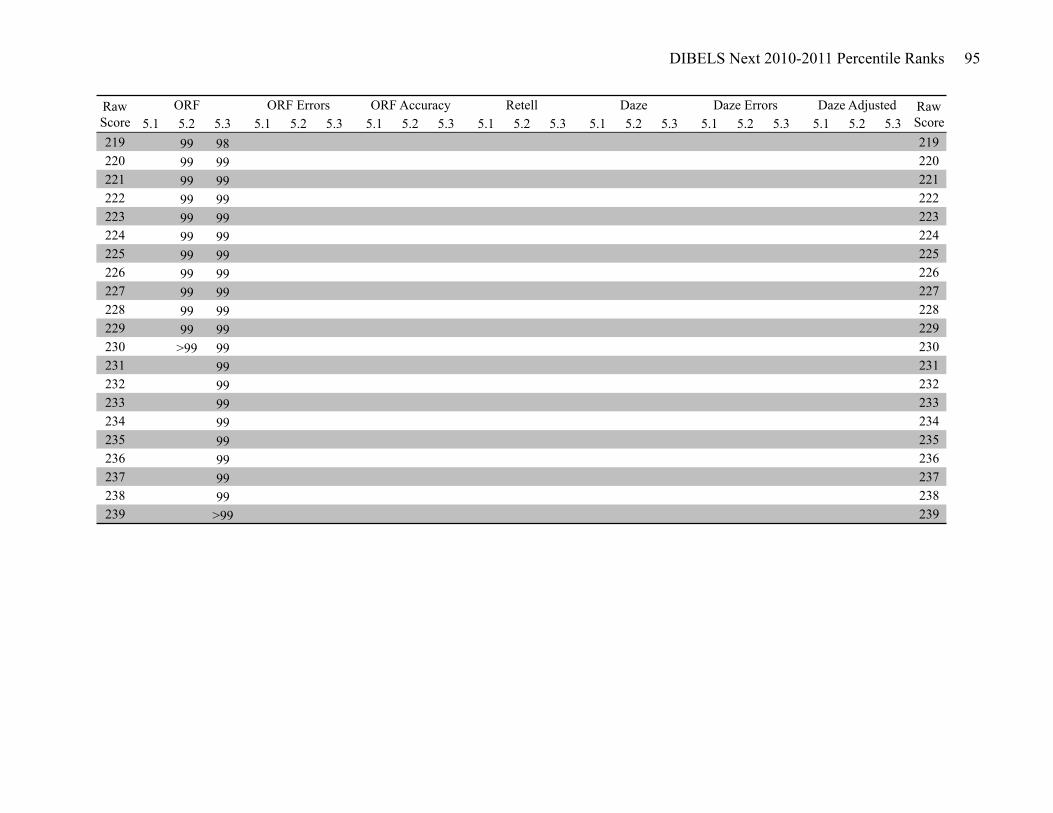
DIBELS Next 2010-2011 Percentile Ranks 95
5.1 5.2 5.3 5.1 5.2 5.3 5.1 5.2 5.3 5.1 5.2 5.3 5.1 5.2 5.3 5.1 5.2 5.3 5.1 5.2 5.3Daze Errors Daze Adjusted Raw
ScoreRaw Score
ORF ORF Errors ORF Accuracy Retell Daze
219 99 98 219220 99 99 220221 99 99 221222 99 99 222223 99 99 223224 99 99 224225 99 99 225226 99 99 226227 99 99 227228 99 99 228229 99 99 229230 >99 99 230231 99 231232 99 232233 99 233234 99 234235 99 235236 99 236237 99 237238 99 238239 >99 239
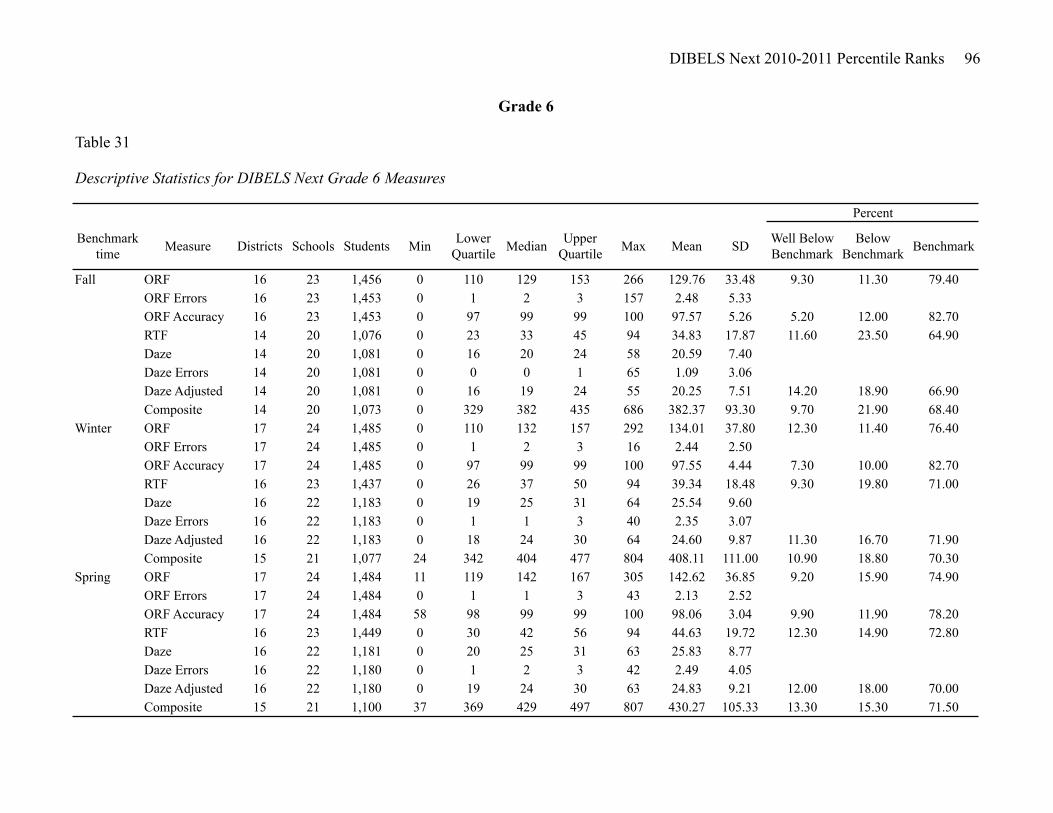
DIBELS Next 2010-2011 Percentile Ranks 96
Table 31
Descriptive Statistics for DIBELS Next Grade 6 Measures
Benchmark time Measure Districts Schools Students Min Lower
Quartile Median Upper Quartile Max Mean SD Well Below
BenchmarkBelow
Benchmark Benchmark
Fall ORF 16 23 1,456 0 110 129 153 266 129.76 33.48 9.30 11.30 79.40ORF Errors 16 23 1,453 0 1 2 3 157 2.48 5.33ORF Accuracy 16 23 1,453 0 97 99 99 100 97.57 5.26 5.20 12.00 82.70RTF 14 20 1,076 0 23 33 45 94 34.83 17.87 11.60 23.50 64.90Daze 14 20 1,081 0 16 20 24 58 20.59 7.40Daze Errors 14 20 1,081 0 0 0 1 65 1.09 3.06Daze Adjusted 14 20 1,081 0 16 19 24 55 20.25 7.51 14.20 18.90 66.90Composite 14 20 1,073 0 329 382 435 686 382.37 93.30 9.70 21.90 68.40
Winter ORF 17 24 1,485 0 110 132 157 292 134.01 37.80 12.30 11.40 76.40ORF Errors 17 24 1,485 0 1 2 3 16 2.44 2.50ORF Accuracy 17 24 1,485 0 97 99 99 100 97.55 4.44 7.30 10.00 82.70RTF 16 23 1,437 0 26 37 50 94 39.34 18.48 9.30 19.80 71.00Daze 16 22 1,183 0 19 25 31 64 25.54 9.60Daze Errors 16 22 1,183 0 1 1 3 40 2.35 3.07Daze Adjusted 16 22 1,183 0 18 24 30 64 24.60 9.87 11.30 16.70 71.90Composite 15 21 1,077 24 342 404 477 804 408.11 111.00 10.90 18.80 70.30
Spring ORF 17 24 1,484 11 119 142 167 305 142.62 36.85 9.20 15.90 74.90ORF Errors 17 24 1,484 0 1 1 3 43 2.13 2.52ORF Accuracy 17 24 1,484 58 98 99 99 100 98.06 3.04 9.90 11.90 78.20RTF 16 23 1,449 0 30 42 56 94 44.63 19.72 12.30 14.90 72.80Daze 16 22 1,181 0 20 25 31 63 25.83 8.77Daze Errors 16 22 1,180 0 1 2 3 42 2.49 4.05Daze Adjusted 16 22 1,180 0 19 24 30 63 24.83 9.21 12.00 18.00 70.00Composite 15 21 1,100 37 369 429 497 807 430.27 105.33 13.30 15.30 71.50
Percent
Grade 6
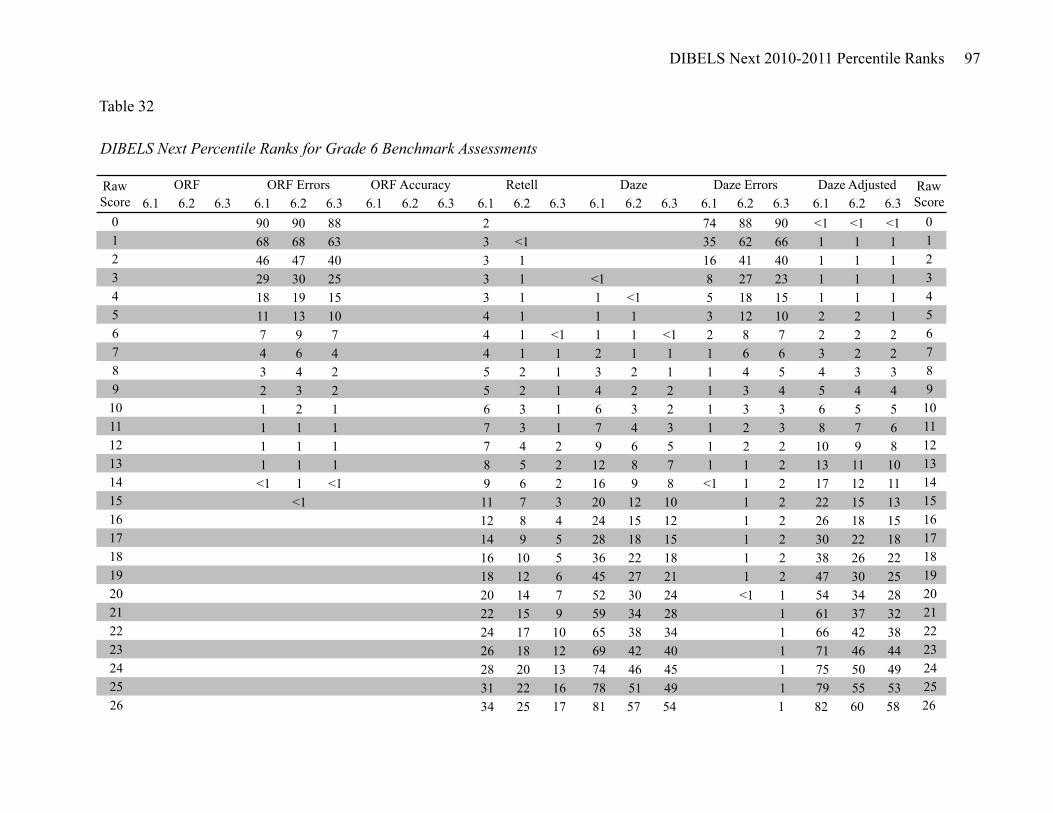
DIBELS Next 2010-2011 Percentile Ranks 97
6.1 6.2 6.3 6.1 6.2 6.3 6.1 6.2 6.3 6.1 6.2 6.3 6.1 6.2 6.3 6.1 6.2 6.3 6.1 6.2 6.30 90 90 88 2 74 88 90 <1 <1 <1 01 68 68 63 3 <1 35 62 66 1 1 1 12 46 47 40 3 1 16 41 40 1 1 1 23 29 30 25 3 1 <1 8 27 23 1 1 1 34 18 19 15 3 1 1 <1 5 18 15 1 1 1 45 11 13 10 4 1 1 1 3 12 10 2 2 1 56 7 9 7 4 1 <1 1 1 <1 2 8 7 2 2 2 67 4 6 4 4 1 1 2 1 1 1 6 6 3 2 2 78 3 4 2 5 2 1 3 2 1 1 4 5 4 3 3 89 2 3 2 5 2 1 4 2 2 1 3 4 5 4 4 910 1 2 1 6 3 1 6 3 2 1 3 3 6 5 5 1011 1 1 1 7 3 1 7 4 3 1 2 3 8 7 6 1112 1 1 1 7 4 2 9 6 5 1 2 2 10 9 8 1213 1 1 1 8 5 2 12 8 7 1 1 2 13 11 10 1314 <1 1 <1 9 6 2 16 9 8 <1 1 2 17 12 11 1415 <1 11 7 3 20 12 10 1 2 22 15 13 1516 12 8 4 24 15 12 1 2 26 18 15 1617 14 9 5 28 18 15 1 2 30 22 18 1718 16 10 5 36 22 18 1 2 38 26 22 1819 18 12 6 45 27 21 1 2 47 30 25 1920 20 14 7 52 30 24 <1 1 54 34 28 2021 22 15 9 59 34 28 1 61 37 32 2122 24 17 10 65 38 34 1 66 42 38 2223 26 18 12 69 42 40 1 71 46 44 2324 28 20 13 74 46 45 1 75 50 49 2425 31 22 16 78 51 49 1 79 55 53 2526 34 25 17 81 57 54 1 82 60 58 26
Table 32
DIBELS Next Percentile Ranks for Grade 6 Benchmark Assessments
Daze Errors Daze Adjusted Raw Score
Raw Score
ORF ORF Errors ORF Accuracy Retell Daze
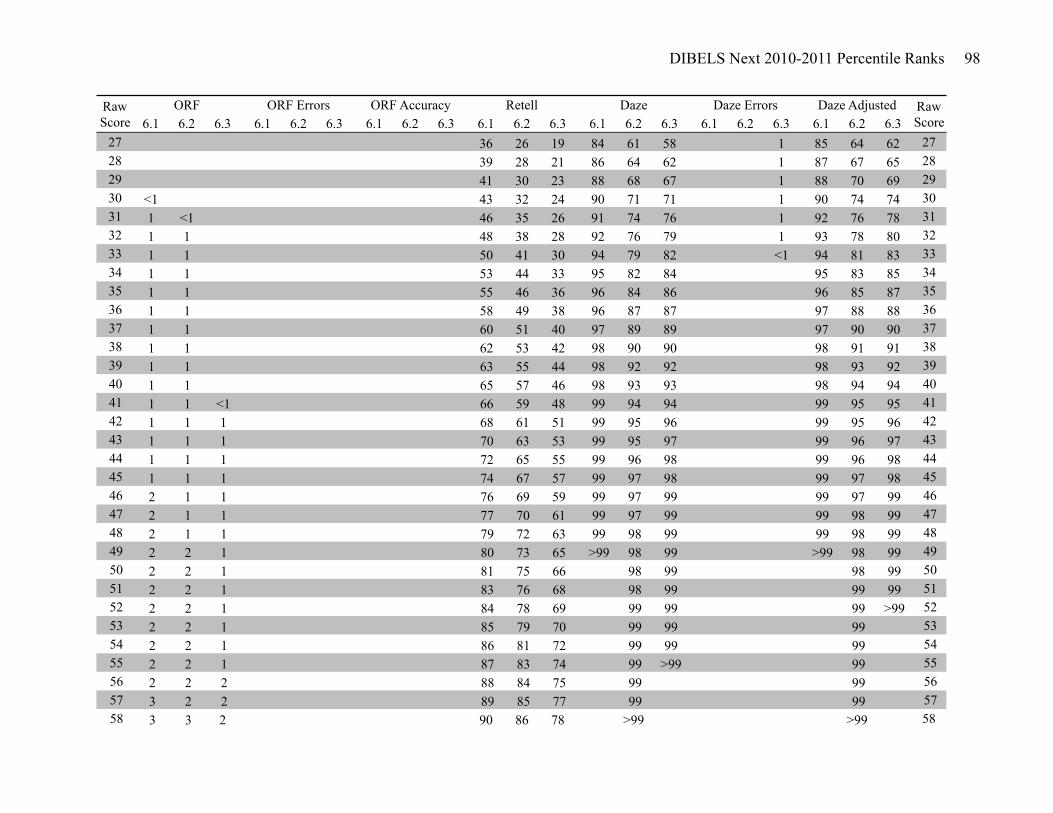
DIBELS Next 2010-2011 Percentile Ranks 98
6.1 6.2 6.3 6.1 6.2 6.3 6.1 6.2 6.3 6.1 6.2 6.3 6.1 6.2 6.3 6.1 6.2 6.3 6.1 6.2 6.3Daze Errors Daze Adjusted Raw
ScoreRaw Score
ORF ORF Errors ORF Accuracy Retell Daze
27 36 26 19 84 61 58 1 85 64 62 2728 39 28 21 86 64 62 1 87 67 65 2829 41 30 23 88 68 67 1 88 70 69 2930 <1 43 32 24 90 71 71 1 90 74 74 3031 1 <1 46 35 26 91 74 76 1 92 76 78 3132 1 1 48 38 28 92 76 79 1 93 78 80 3233 1 1 50 41 30 94 79 82 <1 94 81 83 3334 1 1 53 44 33 95 82 84 95 83 85 3435 1 1 55 46 36 96 84 86 96 85 87 3536 1 1 58 49 38 96 87 87 97 88 88 3637 1 1 60 51 40 97 89 89 97 90 90 3738 1 1 62 53 42 98 90 90 98 91 91 3839 1 1 63 55 44 98 92 92 98 93 92 3940 1 1 65 57 46 98 93 93 98 94 94 4041 1 1 <1 66 59 48 99 94 94 99 95 95 4142 1 1 1 68 61 51 99 95 96 99 95 96 4243 1 1 1 70 63 53 99 95 97 99 96 97 4344 1 1 1 72 65 55 99 96 98 99 96 98 4445 1 1 1 74 67 57 99 97 98 99 97 98 4546 2 1 1 76 69 59 99 97 99 99 97 99 4647 2 1 1 77 70 61 99 97 99 99 98 99 4748 2 1 1 79 72 63 99 98 99 99 98 99 4849 2 2 1 80 73 65 >99 98 99 >99 98 99 4950 2 2 1 81 75 66 98 99 98 99 5051 2 2 1 83 76 68 98 99 99 99 5152 2 2 1 84 78 69 99 99 99 >99 5253 2 2 1 85 79 70 99 99 99 5354 2 2 1 86 81 72 99 99 99 5455 2 2 1 87 83 74 99 >99 99 5556 2 2 2 88 84 75 99 99 5657 3 2 2 89 85 77 99 99 5758 3 3 2 90 86 78 >99 >99 58
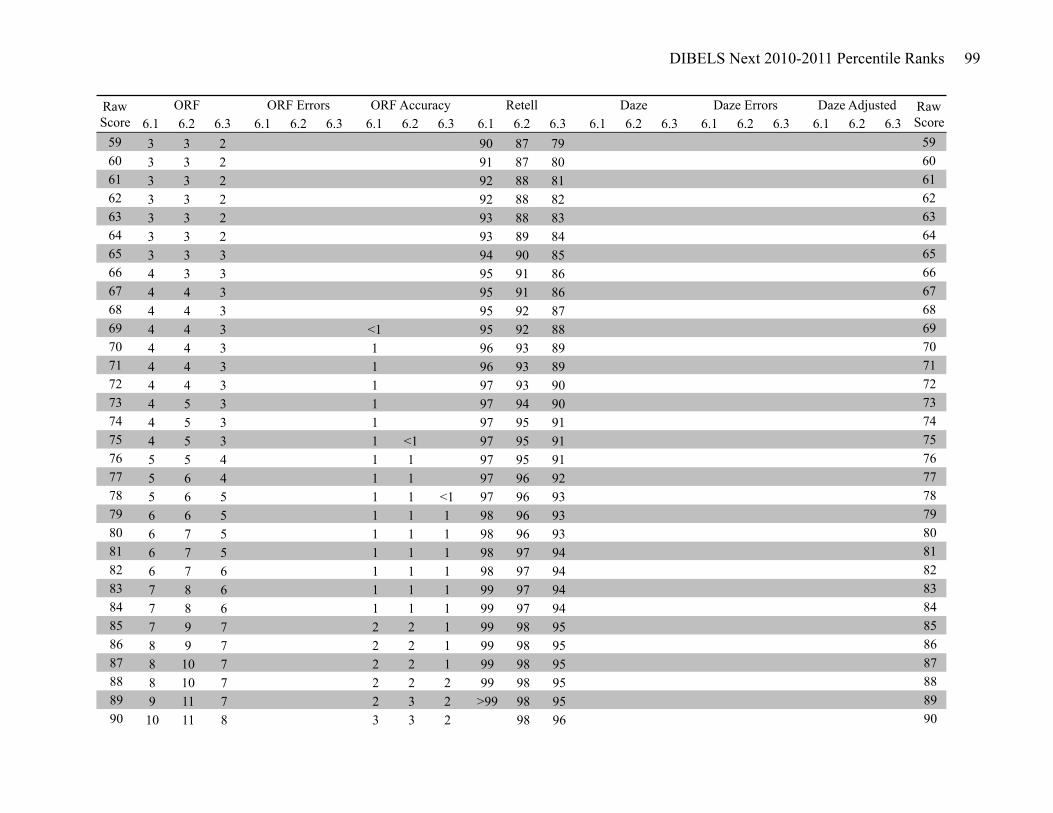
DIBELS Next 2010-2011 Percentile Ranks 99
6.1 6.2 6.3 6.1 6.2 6.3 6.1 6.2 6.3 6.1 6.2 6.3 6.1 6.2 6.3 6.1 6.2 6.3 6.1 6.2 6.3Daze Errors Daze Adjusted Raw
ScoreRaw Score
ORF ORF Errors ORF Accuracy Retell Daze
59 3 3 2 90 87 79 5960 3 3 2 91 87 80 6061 3 3 2 92 88 81 6162 3 3 2 92 88 82 6263 3 3 2 93 88 83 6364 3 3 2 93 89 84 6465 3 3 3 94 90 85 6566 4 3 3 95 91 86 6667 4 4 3 95 91 86 6768 4 4 3 95 92 87 6869 4 4 3 <1 95 92 88 6970 4 4 3 1 96 93 89 7071 4 4 3 1 96 93 89 7172 4 4 3 1 97 93 90 7273 4 5 3 1 97 94 90 7374 4 5 3 1 97 95 91 7475 4 5 3 1 <1 97 95 91 7576 5 5 4 1 1 97 95 91 7677 5 6 4 1 1 97 96 92 7778 5 6 5 1 1 <1 97 96 93 7879 6 6 5 1 1 1 98 96 93 7980 6 7 5 1 1 1 98 96 93 8081 6 7 5 1 1 1 98 97 94 8182 6 7 6 1 1 1 98 97 94 8283 7 8 6 1 1 1 99 97 94 8384 7 8 6 1 1 1 99 97 94 8485 7 9 7 2 2 1 99 98 95 8586 8 9 7 2 2 1 99 98 95 8687 8 10 7 2 2 1 99 98 95 8788 8 10 7 2 2 2 99 98 95 8889 9 11 7 2 3 2 >99 98 95 8990 10 11 8 3 3 2 98 96 90

DIBELS Next 2010-2011 Percentile Ranks 100
6.1 6.2 6.3 6.1 6.2 6.3 6.1 6.2 6.3 6.1 6.2 6.3 6.1 6.2 6.3 6.1 6.2 6.3 6.1 6.2 6.3Daze Errors Daze Adjusted Raw
ScoreRaw Score
ORF ORF Errors ORF Accuracy Retell Daze
91 10 12 8 3 4 3 98 96 9192 11 13 8 4 5 3 99 97 9293 12 13 8 5 7 4 99 97 9394 12 14 9 6 9 6 99 98 9495 13 14 9 9 12 8 9596 14 14 10 14 15 12 9697 14 15 10 22 22 18 9798 15 15 11 37 37 30 9899 16 16 11 64 63 56 99100 17 17 11 90 90 88 100101 18 17 12 101102 18 18 12 102103 19 19 13 103104 20 20 13 104105 20 21 14 105106 20 21 14 106107 21 22 15 107108 22 23 15 108109 23 24 16 109110 25 25 17 110111 27 26 18 111112 28 26 19 112113 29 27 20 113114 31 28 21 114115 33 28 21 115116 34 30 22 116117 35 31 23 117118 36 32 24 118119 37 34 25 119120 38 35 25 120121 40 36 26 121122 41 37 27 122
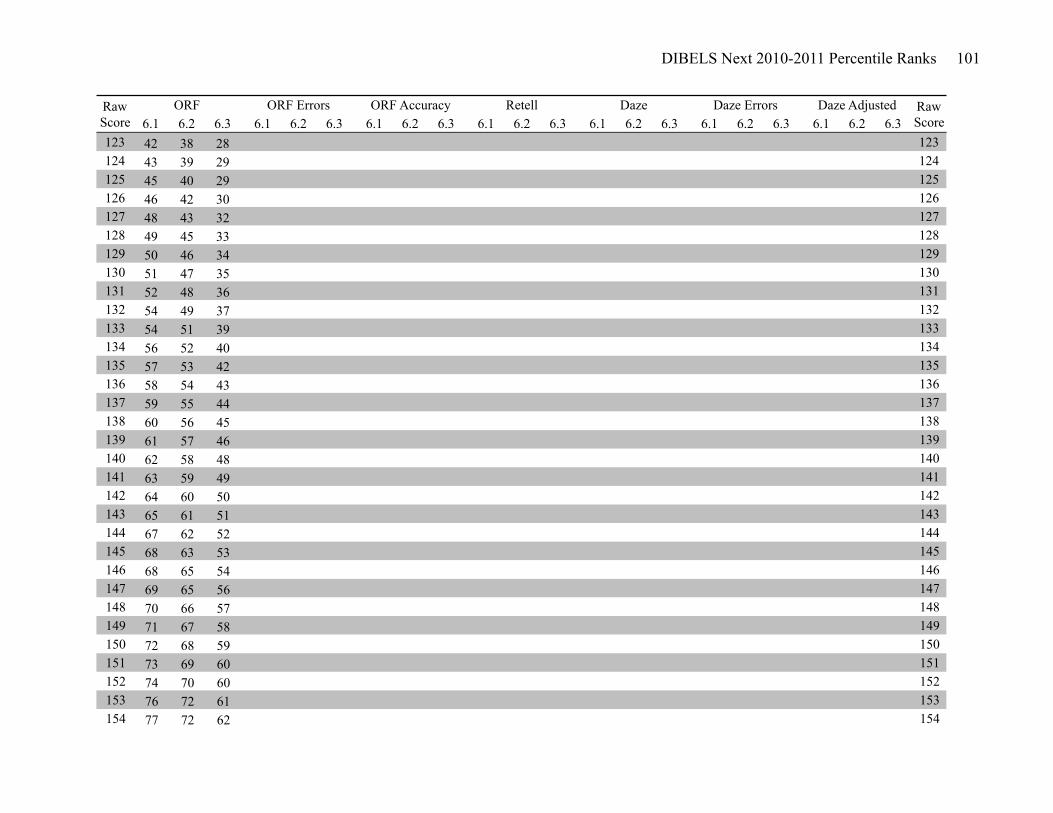
DIBELS Next 2010-2011 Percentile Ranks 101
6.1 6.2 6.3 6.1 6.2 6.3 6.1 6.2 6.3 6.1 6.2 6.3 6.1 6.2 6.3 6.1 6.2 6.3 6.1 6.2 6.3Daze Errors Daze Adjusted Raw
ScoreRaw Score
ORF ORF Errors ORF Accuracy Retell Daze
123 42 38 28 123124 43 39 29 124125 45 40 29 125126 46 42 30 126127 48 43 32 127128 49 45 33 128129 50 46 34 129130 51 47 35 130131 52 48 36 131132 54 49 37 132133 54 51 39 133134 56 52 40 134135 57 53 42 135136 58 54 43 136137 59 55 44 137138 60 56 45 138139 61 57 46 139140 62 58 48 140141 63 59 49 141142 64 60 50 142143 65 61 51 143144 67 62 52 144145 68 63 53 145146 68 65 54 146147 69 65 56 147148 70 66 57 148149 71 67 58 149150 72 68 59 150151 73 69 60 151152 74 70 60 152153 76 72 61 153154 77 72 62 154
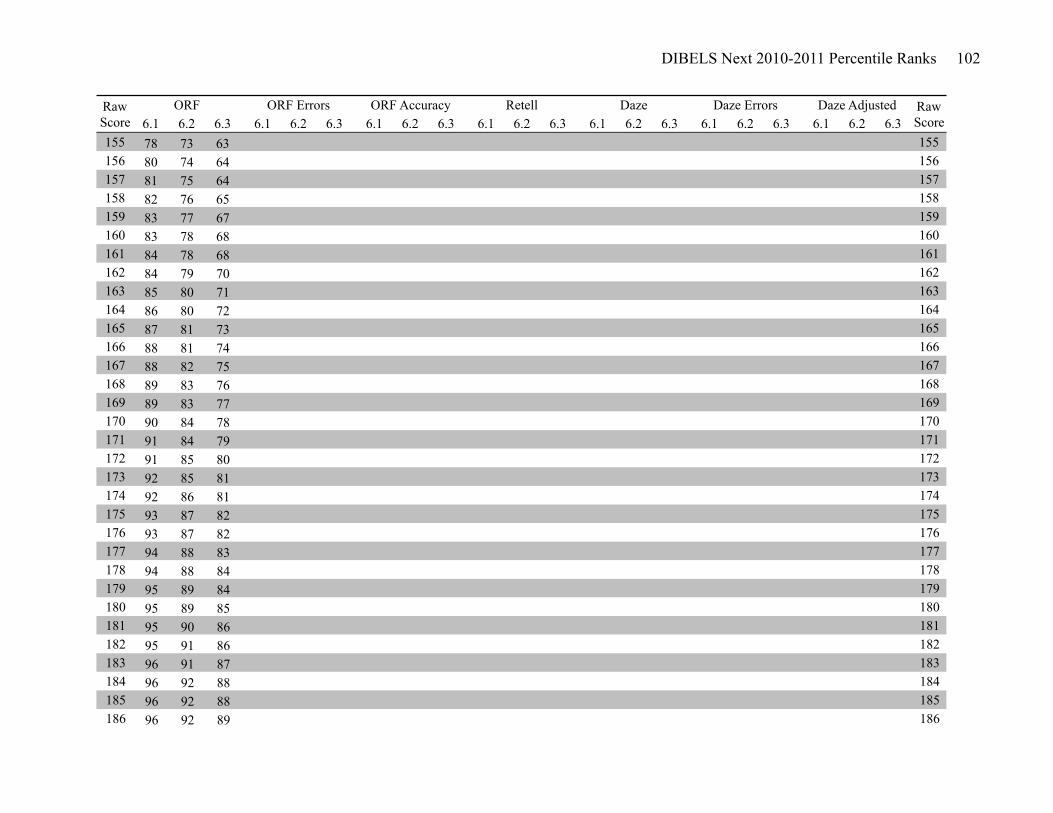
DIBELS Next 2010-2011 Percentile Ranks 102
6.1 6.2 6.3 6.1 6.2 6.3 6.1 6.2 6.3 6.1 6.2 6.3 6.1 6.2 6.3 6.1 6.2 6.3 6.1 6.2 6.3Daze Errors Daze Adjusted Raw
ScoreRaw Score
ORF ORF Errors ORF Accuracy Retell Daze
155 78 73 63 155156 80 74 64 156157 81 75 64 157158 82 76 65 158159 83 77 67 159160 83 78 68 160161 84 78 68 161162 84 79 70 162163 85 80 71 163164 86 80 72 164165 87 81 73 165166 88 81 74 166167 88 82 75 167168 89 83 76 168169 89 83 77 169170 90 84 78 170171 91 84 79 171172 91 85 80 172173 92 85 81 173174 92 86 81 174175 93 87 82 175176 93 87 82 176177 94 88 83 177178 94 88 84 178179 95 89 84 179180 95 89 85 180181 95 90 86 181182 95 91 86 182183 96 91 87 183184 96 92 88 184185 96 92 88 185186 96 92 89 186
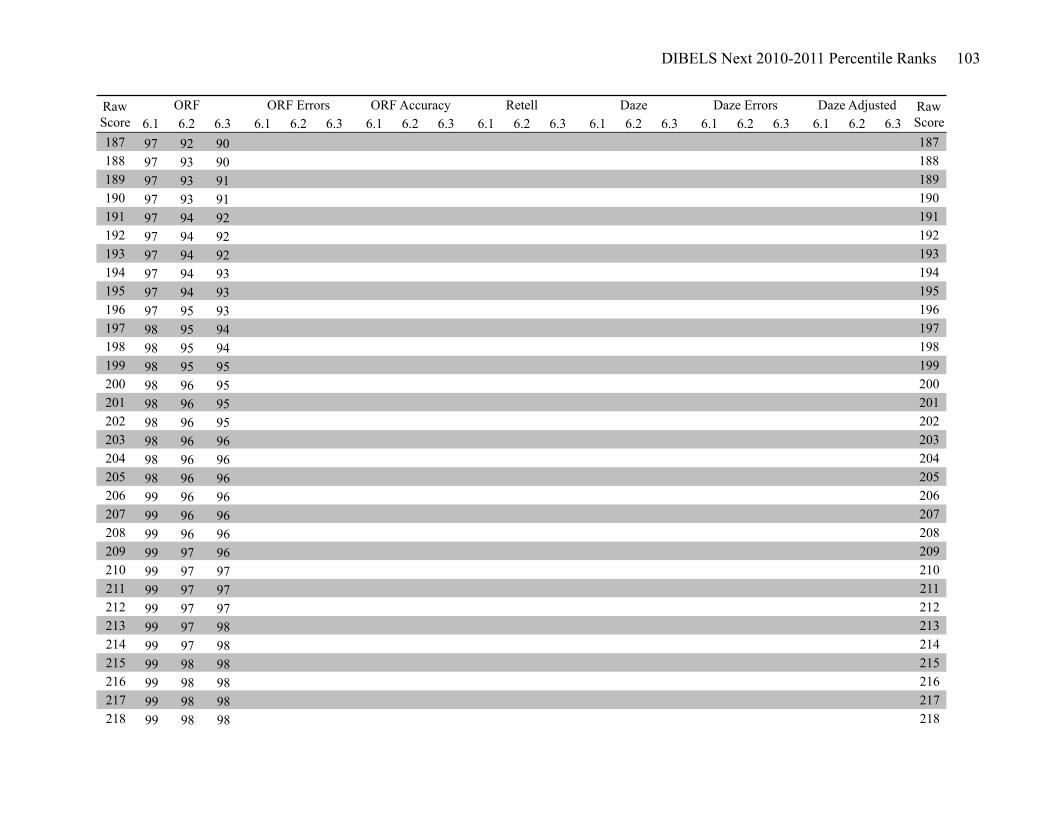
DIBELS Next 2010-2011 Percentile Ranks 103
6.1 6.2 6.3 6.1 6.2 6.3 6.1 6.2 6.3 6.1 6.2 6.3 6.1 6.2 6.3 6.1 6.2 6.3 6.1 6.2 6.3Daze Errors Daze Adjusted Raw
ScoreRaw Score
ORF ORF Errors ORF Accuracy Retell Daze
187 97 92 90 187188 97 93 90 188189 97 93 91 189190 97 93 91 190191 97 94 92 191192 97 94 92 192193 97 94 92 193194 97 94 93 194195 97 94 93 195196 97 95 93 196197 98 95 94 197198 98 95 94 198199 98 95 95 199200 98 96 95 200201 98 96 95 201202 98 96 95 202203 98 96 96 203204 98 96 96 204205 98 96 96 205206 99 96 96 206207 99 96 96 207208 99 96 96 208209 99 97 96 209210 99 97 97 210211 99 97 97 211212 99 97 97 212213 99 97 98 213214 99 97 98 214215 99 98 98 215216 99 98 98 216217 99 98 98 217218 99 98 98 218
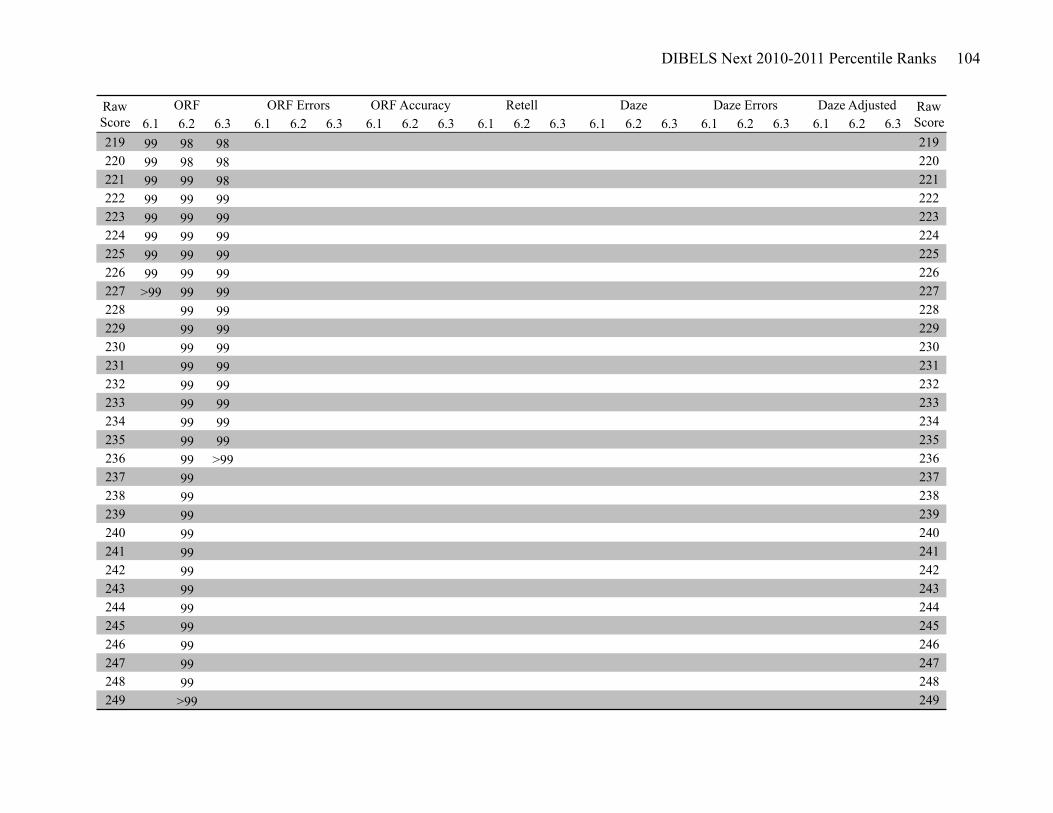
DIBELS Next 2010-2011 Percentile Ranks 104
6.1 6.2 6.3 6.1 6.2 6.3 6.1 6.2 6.3 6.1 6.2 6.3 6.1 6.2 6.3 6.1 6.2 6.3 6.1 6.2 6.3Daze Errors Daze Adjusted Raw
ScoreRaw Score
ORF ORF Errors ORF Accuracy Retell Daze
219 99 98 98 219220 99 98 98 220221 99 99 98 221222 99 99 99 222223 99 99 99 223224 99 99 99 224225 99 99 99 225226 99 99 99 226227 >99 99 99 227228 99 99 228229 99 99 229230 99 99 230231 99 99 231232 99 99 232233 99 99 233234 99 99 234235 99 99 235236 99 >99 236237 99 237238 99 238239 99 239240 99 240241 99 241242 99 242243 99 243244 99 244245 99 245246 99 246247 99 247248 99 248249 >99 249
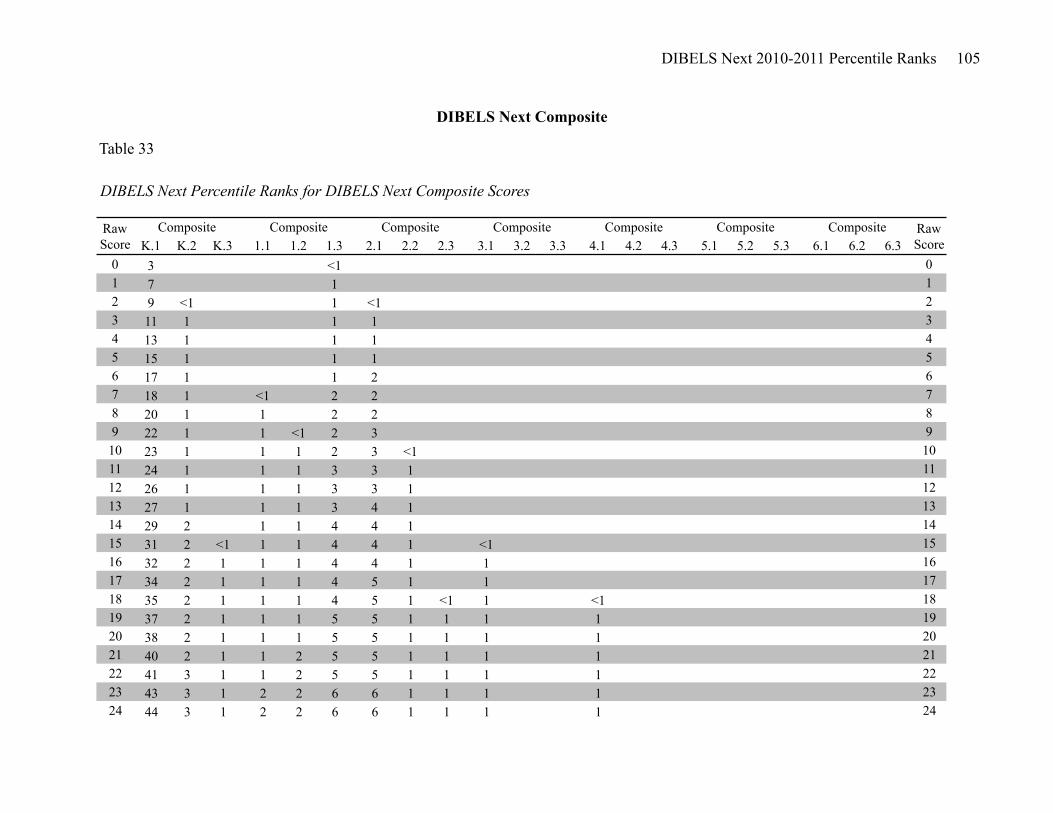
DIBELS Next 2010-2011 Percentile Ranks 105
K.1 K.2 K.3 1.1 1.2 1.3 2.1 2.2 2.3 3.1 3.2 3.3 4.1 4.2 4.3 5.1 5.2 5.3 6.1 6.2 6.30 3 <1 01 7 1 12 9 <1 1 <1 23 11 1 1 1 34 13 1 1 1 45 15 1 1 1 56 17 1 1 2 67 18 1 <1 2 2 78 20 1 1 2 2 89 22 1 1 <1 2 3 910 23 1 1 1 2 3 <1 1011 24 1 1 1 3 3 1 1112 26 1 1 1 3 3 1 1213 27 1 1 1 3 4 1 1314 29 2 1 1 4 4 1 1415 31 2 <1 1 1 4 4 1 <1 1516 32 2 1 1 1 4 4 1 1 1617 34 2 1 1 1 4 5 1 1 1718 35 2 1 1 1 4 5 1 <1 1 <1 1819 37 2 1 1 1 5 5 1 1 1 1 1920 38 2 1 1 1 5 5 1 1 1 1 2021 40 2 1 1 2 5 5 1 1 1 1 2122 41 3 1 1 2 5 5 1 1 1 1 2223 43 3 1 2 2 6 6 1 1 1 1 2324 44 3 1 2 2 6 6 1 1 1 1 24
Composite Composite Composite
DIBELS Next Composite
Table 33
DIBELS Next Percentile Ranks for DIBELS Next Composite Scores
Composite Composite Raw Score
Raw Score
Composite Composite
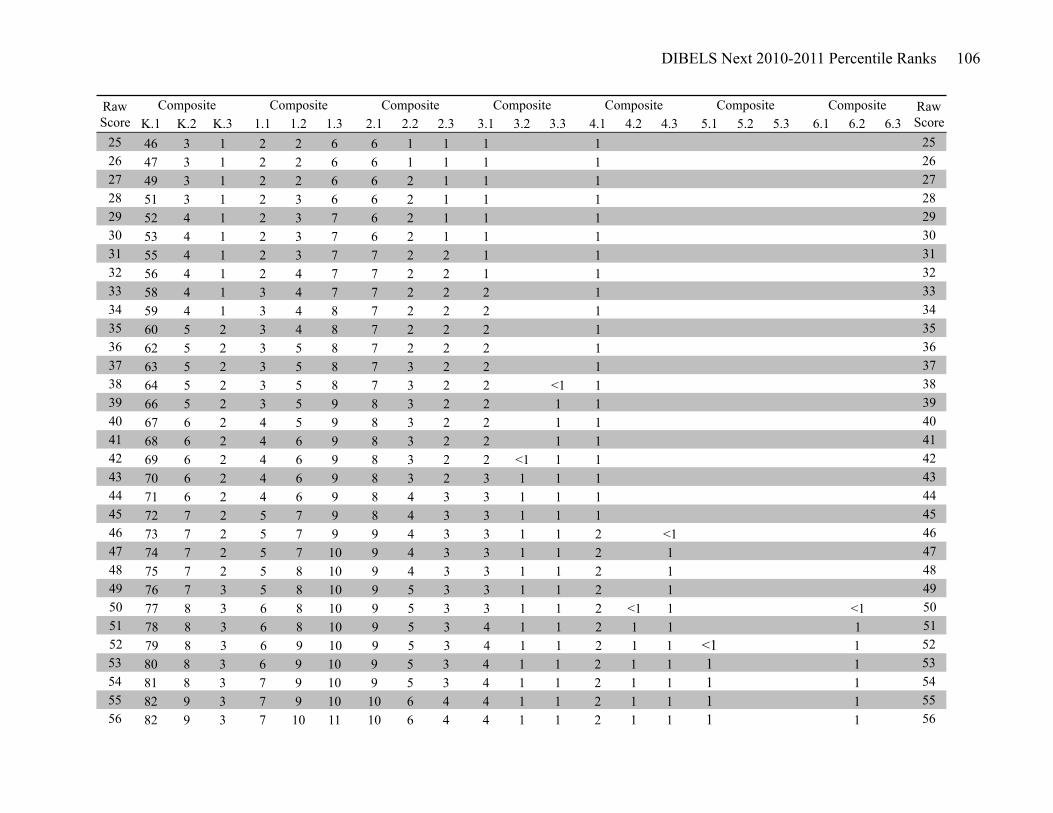
DIBELS Next 2010-2011 Percentile Ranks 106
K.1 K.2 K.3 1.1 1.2 1.3 2.1 2.2 2.3 3.1 3.2 3.3 4.1 4.2 4.3 5.1 5.2 5.3 6.1 6.2 6.3Composite Composite Composite Composite Composite Raw
ScoreRaw Score
Composite Composite
25 46 3 1 2 2 6 6 1 1 1 1 2526 47 3 1 2 2 6 6 1 1 1 1 2627 49 3 1 2 2 6 6 2 1 1 1 2728 51 3 1 2 3 6 6 2 1 1 1 2829 52 4 1 2 3 7 6 2 1 1 1 2930 53 4 1 2 3 7 6 2 1 1 1 3031 55 4 1 2 3 7 7 2 2 1 1 3132 56 4 1 2 4 7 7 2 2 1 1 3233 58 4 1 3 4 7 7 2 2 2 1 3334 59 4 1 3 4 8 7 2 2 2 1 3435 60 5 2 3 4 8 7 2 2 2 1 3536 62 5 2 3 5 8 7 2 2 2 1 3637 63 5 2 3 5 8 7 3 2 2 1 3738 64 5 2 3 5 8 7 3 2 2 <1 1 3839 66 5 2 3 5 9 8 3 2 2 1 1 3940 67 6 2 4 5 9 8 3 2 2 1 1 4041 68 6 2 4 6 9 8 3 2 2 1 1 4142 69 6 2 4 6 9 8 3 2 2 <1 1 1 4243 70 6 2 4 6 9 8 3 2 3 1 1 1 4344 71 6 2 4 6 9 8 4 3 3 1 1 1 4445 72 7 2 5 7 9 8 4 3 3 1 1 1 4546 73 7 2 5 7 9 9 4 3 3 1 1 2 <1 4647 74 7 2 5 7 10 9 4 3 3 1 1 2 1 4748 75 7 2 5 8 10 9 4 3 3 1 1 2 1 4849 76 7 3 5 8 10 9 5 3 3 1 1 2 1 4950 77 8 3 6 8 10 9 5 3 3 1 1 2 <1 1 <1 5051 78 8 3 6 8 10 9 5 3 4 1 1 2 1 1 1 5152 79 8 3 6 9 10 9 5 3 4 1 1 2 1 1 <1 1 5253 80 8 3 6 9 10 9 5 3 4 1 1 2 1 1 1 1 5354 81 8 3 7 9 10 9 5 3 4 1 1 2 1 1 1 1 5455 82 9 3 7 9 10 10 6 4 4 1 1 2 1 1 1 1 5556 82 9 3 7 10 11 10 6 4 4 1 1 2 1 1 1 1 56

DIBELS Next 2010-2011 Percentile Ranks 107
K.1 K.2 K.3 1.1 1.2 1.3 2.1 2.2 2.3 3.1 3.2 3.3 4.1 4.2 4.3 5.1 5.2 5.3 6.1 6.2 6.3Composite Composite Composite Composite Composite Raw
ScoreRaw Score
Composite Composite
57 83 9 3 7 10 11 10 6 4 4 1 1 2 1 1 1 1 5758 84 10 3 8 10 11 10 6 4 4 1 1 2 1 1 1 <1 1 5859 85 10 4 8 11 11 10 6 4 5 1 1 2 1 1 1 1 <1 1 5960 86 10 4 8 11 11 10 6 4 5 1 1 2 1 1 1 1 1 1 6061 87 10 4 8 11 12 10 7 4 5 1 1 2 1 1 1 1 1 1 6162 87 11 4 8 11 12 11 7 4 5 2 1 2 1 1 1 1 1 1 6263 88 11 4 9 12 12 11 7 4 5 2 1 3 1 1 1 1 1 1 6364 89 11 5 9 12 12 11 7 5 5 2 1 3 1 1 1 1 1 1 6465 89 12 5 10 12 12 11 7 5 5 2 1 3 1 1 1 1 1 1 6566 90 12 5 10 12 12 11 7 5 6 2 1 3 1 1 1 1 1 1 6667 91 12 5 10 13 12 11 8 5 6 2 1 3 1 1 1 1 1 1 6768 91 12 6 10 13 13 11 8 5 6 2 1 3 1 1 1 1 1 1 6869 92 13 6 11 13 13 11 8 5 6 2 2 3 1 1 1 1 1 1 6970 92 13 6 11 14 13 12 8 5 6 2 2 3 1 1 1 1 1 1 7071 93 13 6 12 14 13 12 8 5 6 2 2 3 1 1 1 1 1 1 7172 93 14 7 12 14 13 12 8 5 7 2 2 3 1 1 1 1 1 1 7273 94 14 7 13 15 13 12 8 5 7 2 2 4 1 1 1 1 1 1 7374 94 14 8 13 15 14 12 8 6 7 3 2 4 1 1 1 1 1 1 7475 94 15 8 14 15 14 12 9 6 7 3 2 4 1 1 1 1 1 1 7576 95 15 8 14 16 14 13 9 6 7 3 2 4 1 1 1 1 1 1 7677 95 16 8 15 16 14 13 9 6 7 3 2 4 1 1 1 1 1 1 7778 95 16 9 15 16 14 13 9 6 7 3 2 4 1 1 1 1 1 1 7879 96 16 9 15 17 14 13 9 6 7 3 2 4 1 1 1 1 1 1 7980 96 17 9 16 17 15 13 9 6 7 3 2 4 1 1 1 1 1 1 8081 96 17 9 17 18 15 13 10 6 8 3 2 4 1 1 1 1 1 1 8182 97 17 10 17 18 15 14 10 6 8 3 2 4 2 1 1 1 1 1 8283 97 18 10 18 18 15 14 10 6 8 3 2 4 2 1 2 1 1 1 8384 97 18 10 18 19 16 14 10 7 8 3 3 5 2 1 2 1 <1 1 1 8485 97 19 11 19 19 16 14 10 7 8 3 3 5 2 1 2 1 1 1 1 8586 98 19 11 19 20 16 15 10 7 8 3 3 5 2 1 2 1 1 1 1 8687 98 20 11 20 20 16 15 10 7 9 3 3 5 2 1 2 1 1 1 1 <1 8788 98 20 12 21 20 17 15 10 7 9 3 3 5 2 1 2 1 1 1 1 1 88
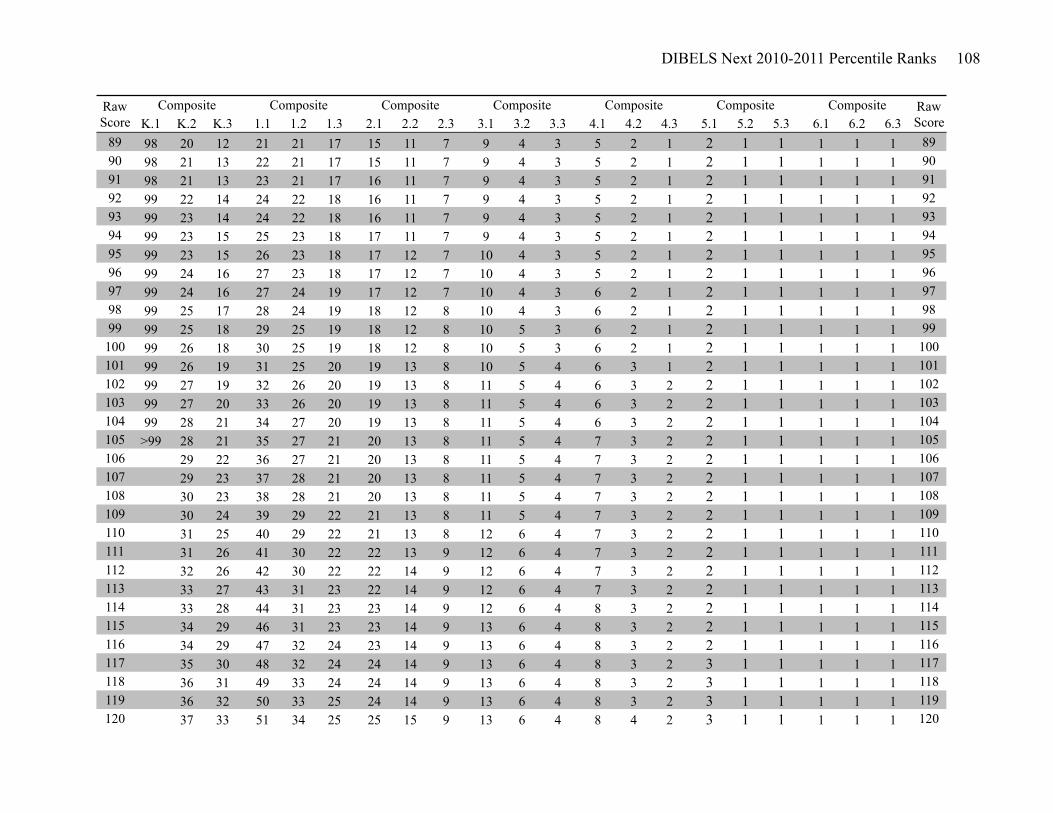
DIBELS Next 2010-2011 Percentile Ranks 108
K.1 K.2 K.3 1.1 1.2 1.3 2.1 2.2 2.3 3.1 3.2 3.3 4.1 4.2 4.3 5.1 5.2 5.3 6.1 6.2 6.3Composite Composite Composite Composite Composite Raw
ScoreRaw Score
Composite Composite
89 98 20 12 21 21 17 15 11 7 9 4 3 5 2 1 2 1 1 1 1 1 8990 98 21 13 22 21 17 15 11 7 9 4 3 5 2 1 2 1 1 1 1 1 9091 98 21 13 23 21 17 16 11 7 9 4 3 5 2 1 2 1 1 1 1 1 9192 99 22 14 24 22 18 16 11 7 9 4 3 5 2 1 2 1 1 1 1 1 9293 99 23 14 24 22 18 16 11 7 9 4 3 5 2 1 2 1 1 1 1 1 9394 99 23 15 25 23 18 17 11 7 9 4 3 5 2 1 2 1 1 1 1 1 9495 99 23 15 26 23 18 17 12 7 10 4 3 5 2 1 2 1 1 1 1 1 9596 99 24 16 27 23 18 17 12 7 10 4 3 5 2 1 2 1 1 1 1 1 9697 99 24 16 27 24 19 17 12 7 10 4 3 6 2 1 2 1 1 1 1 1 9798 99 25 17 28 24 19 18 12 8 10 4 3 6 2 1 2 1 1 1 1 1 9899 99 25 18 29 25 19 18 12 8 10 5 3 6 2 1 2 1 1 1 1 1 99
100 99 26 18 30 25 19 18 12 8 10 5 3 6 2 1 2 1 1 1 1 1 100101 99 26 19 31 25 20 19 13 8 10 5 4 6 3 1 2 1 1 1 1 1 101102 99 27 19 32 26 20 19 13 8 11 5 4 6 3 2 2 1 1 1 1 1 102103 99 27 20 33 26 20 19 13 8 11 5 4 6 3 2 2 1 1 1 1 1 103104 99 28 21 34 27 20 19 13 8 11 5 4 6 3 2 2 1 1 1 1 1 104105 >99 28 21 35 27 21 20 13 8 11 5 4 7 3 2 2 1 1 1 1 1 105106 29 22 36 27 21 20 13 8 11 5 4 7 3 2 2 1 1 1 1 1 106107 29 23 37 28 21 20 13 8 11 5 4 7 3 2 2 1 1 1 1 1 107108 30 23 38 28 21 20 13 8 11 5 4 7 3 2 2 1 1 1 1 1 108109 30 24 39 29 22 21 13 8 11 5 4 7 3 2 2 1 1 1 1 1 109110 31 25 40 29 22 21 13 8 12 6 4 7 3 2 2 1 1 1 1 1 110111 31 26 41 30 22 22 13 9 12 6 4 7 3 2 2 1 1 1 1 1 111112 32 26 42 30 22 22 14 9 12 6 4 7 3 2 2 1 1 1 1 1 112113 33 27 43 31 23 22 14 9 12 6 4 7 3 2 2 1 1 1 1 1 113114 33 28 44 31 23 23 14 9 12 6 4 8 3 2 2 1 1 1 1 1 114115 34 29 46 31 23 23 14 9 13 6 4 8 3 2 2 1 1 1 1 1 115116 34 29 47 32 24 23 14 9 13 6 4 8 3 2 2 1 1 1 1 1 116117 35 30 48 32 24 24 14 9 13 6 4 8 3 2 3 1 1 1 1 1 117118 36 31 49 33 24 24 14 9 13 6 4 8 3 2 3 1 1 1 1 1 118119 36 32 50 33 25 24 14 9 13 6 4 8 3 2 3 1 1 1 1 1 119120 37 33 51 34 25 25 15 9 13 6 4 8 4 2 3 1 1 1 1 1 120
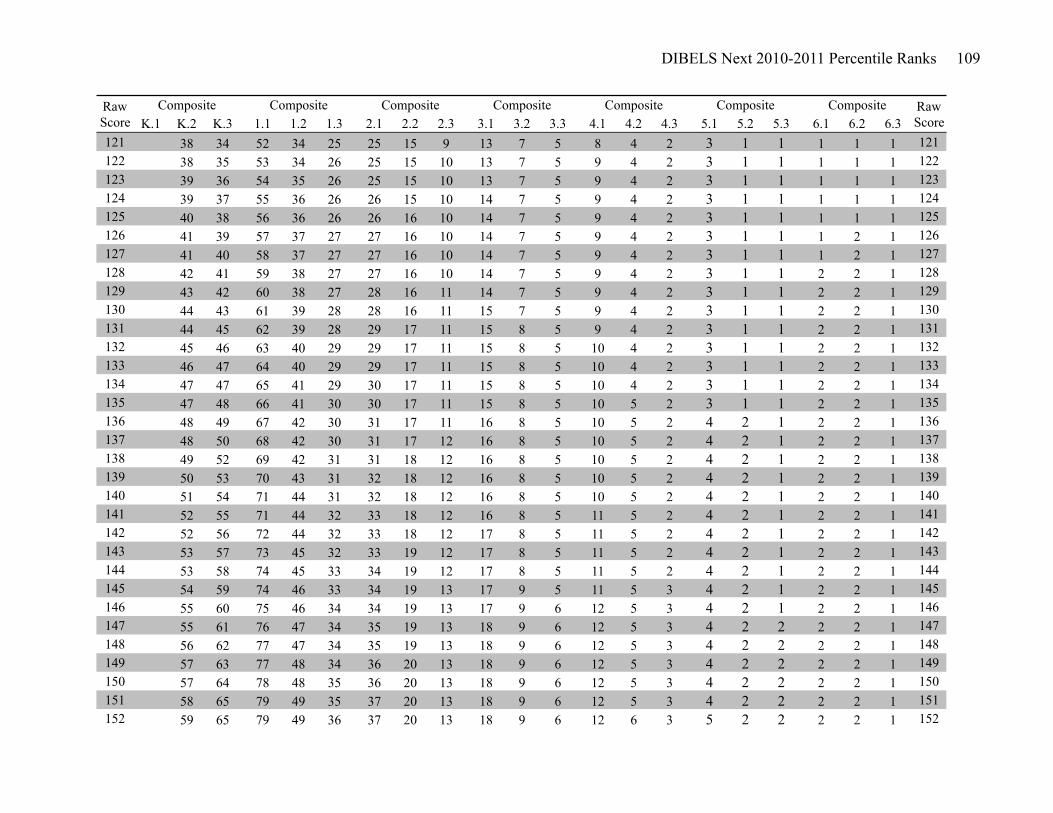
DIBELS Next 2010-2011 Percentile Ranks 109
K.1 K.2 K.3 1.1 1.2 1.3 2.1 2.2 2.3 3.1 3.2 3.3 4.1 4.2 4.3 5.1 5.2 5.3 6.1 6.2 6.3Composite Composite Composite Composite Composite Raw
ScoreRaw Score
Composite Composite
121 38 34 52 34 25 25 15 9 13 7 5 8 4 2 3 1 1 1 1 1 121122 38 35 53 34 26 25 15 10 13 7 5 9 4 2 3 1 1 1 1 1 122123 39 36 54 35 26 25 15 10 13 7 5 9 4 2 3 1 1 1 1 1 123124 39 37 55 36 26 26 15 10 14 7 5 9 4 2 3 1 1 1 1 1 124125 40 38 56 36 26 26 16 10 14 7 5 9 4 2 3 1 1 1 1 1 125126 41 39 57 37 27 27 16 10 14 7 5 9 4 2 3 1 1 1 2 1 126127 41 40 58 37 27 27 16 10 14 7 5 9 4 2 3 1 1 1 2 1 127128 42 41 59 38 27 27 16 10 14 7 5 9 4 2 3 1 1 2 2 1 128129 43 42 60 38 27 28 16 11 14 7 5 9 4 2 3 1 1 2 2 1 129130 44 43 61 39 28 28 16 11 15 7 5 9 4 2 3 1 1 2 2 1 130131 44 45 62 39 28 29 17 11 15 8 5 9 4 2 3 1 1 2 2 1 131132 45 46 63 40 29 29 17 11 15 8 5 10 4 2 3 1 1 2 2 1 132133 46 47 64 40 29 29 17 11 15 8 5 10 4 2 3 1 1 2 2 1 133134 47 47 65 41 29 30 17 11 15 8 5 10 4 2 3 1 1 2 2 1 134135 47 48 66 41 30 30 17 11 15 8 5 10 5 2 3 1 1 2 2 1 135136 48 49 67 42 30 31 17 11 16 8 5 10 5 2 4 2 1 2 2 1 136137 48 50 68 42 30 31 17 12 16 8 5 10 5 2 4 2 1 2 2 1 137138 49 52 69 42 31 31 18 12 16 8 5 10 5 2 4 2 1 2 2 1 138139 50 53 70 43 31 32 18 12 16 8 5 10 5 2 4 2 1 2 2 1 139140 51 54 71 44 31 32 18 12 16 8 5 10 5 2 4 2 1 2 2 1 140141 52 55 71 44 32 33 18 12 16 8 5 11 5 2 4 2 1 2 2 1 141142 52 56 72 44 32 33 18 12 17 8 5 11 5 2 4 2 1 2 2 1 142143 53 57 73 45 32 33 19 12 17 8 5 11 5 2 4 2 1 2 2 1 143144 53 58 74 45 33 34 19 12 17 8 5 11 5 2 4 2 1 2 2 1 144145 54 59 74 46 33 34 19 13 17 9 5 11 5 3 4 2 1 2 2 1 145146 55 60 75 46 34 34 19 13 17 9 6 12 5 3 4 2 1 2 2 1 146147 55 61 76 47 34 35 19 13 18 9 6 12 5 3 4 2 2 2 2 1 147148 56 62 77 47 34 35 19 13 18 9 6 12 5 3 4 2 2 2 2 1 148149 57 63 77 48 34 36 20 13 18 9 6 12 5 3 4 2 2 2 2 1 149150 57 64 78 48 35 36 20 13 18 9 6 12 5 3 4 2 2 2 2 1 150151 58 65 79 49 35 37 20 13 18 9 6 12 5 3 4 2 2 2 2 1 151152 59 65 79 49 36 37 20 13 18 9 6 12 6 3 5 2 2 2 2 1 152
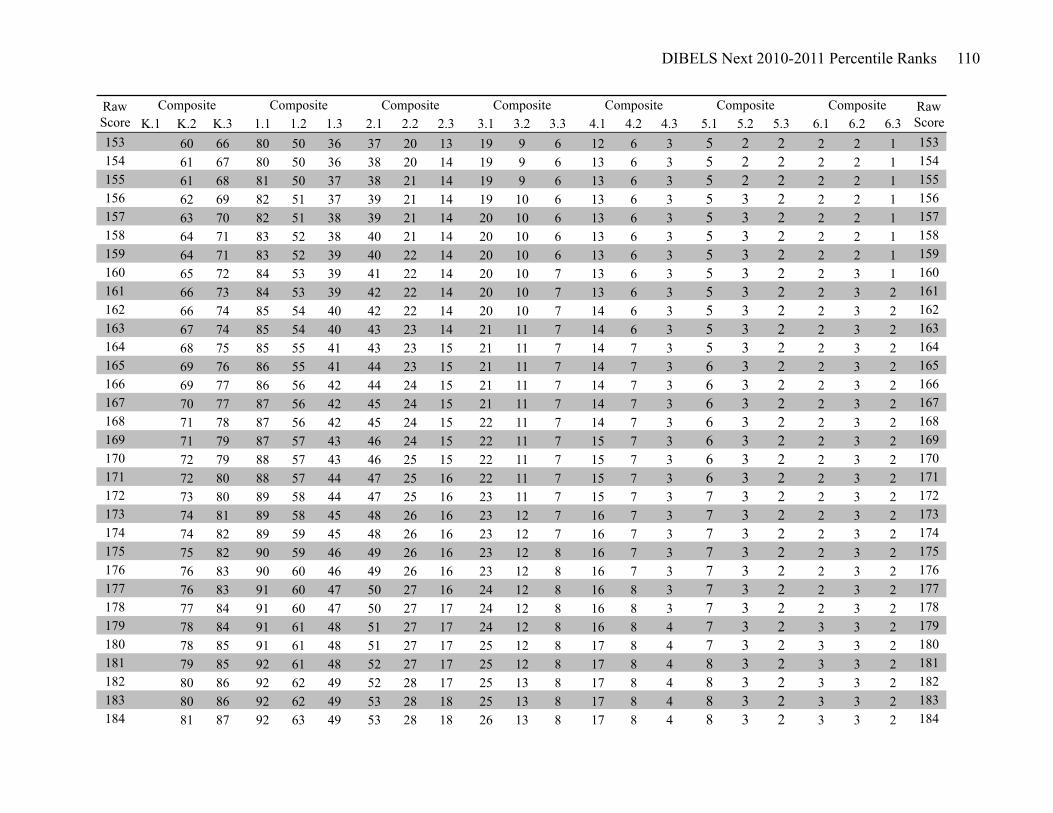
DIBELS Next 2010-2011 Percentile Ranks 110
K.1 K.2 K.3 1.1 1.2 1.3 2.1 2.2 2.3 3.1 3.2 3.3 4.1 4.2 4.3 5.1 5.2 5.3 6.1 6.2 6.3Composite Composite Composite Composite Composite Raw
ScoreRaw Score
Composite Composite
153 60 66 80 50 36 37 20 13 19 9 6 12 6 3 5 2 2 2 2 1 153154 61 67 80 50 36 38 20 14 19 9 6 13 6 3 5 2 2 2 2 1 154155 61 68 81 50 37 38 21 14 19 9 6 13 6 3 5 2 2 2 2 1 155156 62 69 82 51 37 39 21 14 19 10 6 13 6 3 5 3 2 2 2 1 156157 63 70 82 51 38 39 21 14 20 10 6 13 6 3 5 3 2 2 2 1 157158 64 71 83 52 38 40 21 14 20 10 6 13 6 3 5 3 2 2 2 1 158159 64 71 83 52 39 40 22 14 20 10 6 13 6 3 5 3 2 2 2 1 159160 65 72 84 53 39 41 22 14 20 10 7 13 6 3 5 3 2 2 3 1 160161 66 73 84 53 39 42 22 14 20 10 7 13 6 3 5 3 2 2 3 2 161162 66 74 85 54 40 42 22 14 20 10 7 14 6 3 5 3 2 2 3 2 162163 67 74 85 54 40 43 23 14 21 11 7 14 6 3 5 3 2 2 3 2 163164 68 75 85 55 41 43 23 15 21 11 7 14 7 3 5 3 2 2 3 2 164165 69 76 86 55 41 44 23 15 21 11 7 14 7 3 6 3 2 2 3 2 165166 69 77 86 56 42 44 24 15 21 11 7 14 7 3 6 3 2 2 3 2 166167 70 77 87 56 42 45 24 15 21 11 7 14 7 3 6 3 2 2 3 2 167168 71 78 87 56 42 45 24 15 22 11 7 14 7 3 6 3 2 2 3 2 168169 71 79 87 57 43 46 24 15 22 11 7 15 7 3 6 3 2 2 3 2 169170 72 79 88 57 43 46 25 15 22 11 7 15 7 3 6 3 2 2 3 2 170171 72 80 88 57 44 47 25 16 22 11 7 15 7 3 6 3 2 2 3 2 171172 73 80 89 58 44 47 25 16 23 11 7 15 7 3 7 3 2 2 3 2 172173 74 81 89 58 45 48 26 16 23 12 7 16 7 3 7 3 2 2 3 2 173174 74 82 89 59 45 48 26 16 23 12 7 16 7 3 7 3 2 2 3 2 174175 75 82 90 59 46 49 26 16 23 12 8 16 7 3 7 3 2 2 3 2 175176 76 83 90 60 46 49 26 16 23 12 8 16 7 3 7 3 2 2 3 2 176177 76 83 91 60 47 50 27 16 24 12 8 16 8 3 7 3 2 2 3 2 177178 77 84 91 60 47 50 27 17 24 12 8 16 8 3 7 3 2 2 3 2 178179 78 84 91 61 48 51 27 17 24 12 8 16 8 4 7 3 2 3 3 2 179180 78 85 91 61 48 51 27 17 25 12 8 17 8 4 7 3 2 3 3 2 180181 79 85 92 61 48 52 27 17 25 12 8 17 8 4 8 3 2 3 3 2 181182 80 86 92 62 49 52 28 17 25 13 8 17 8 4 8 3 2 3 3 2 182183 80 86 92 62 49 53 28 18 25 13 8 17 8 4 8 3 2 3 3 2 183184 81 87 92 63 49 53 28 18 26 13 8 17 8 4 8 3 2 3 3 2 184
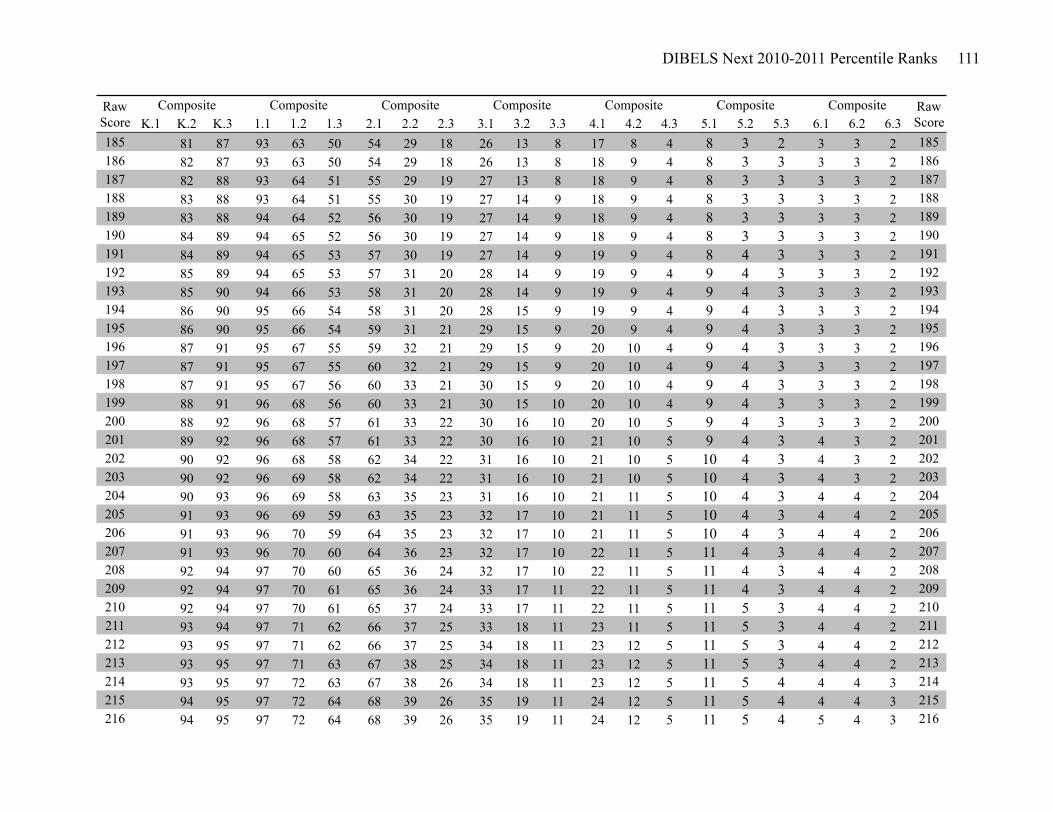
DIBELS Next 2010-2011 Percentile Ranks 111
K.1 K.2 K.3 1.1 1.2 1.3 2.1 2.2 2.3 3.1 3.2 3.3 4.1 4.2 4.3 5.1 5.2 5.3 6.1 6.2 6.3Composite Composite Composite Composite Composite Raw
ScoreRaw Score
Composite Composite
185 81 87 93 63 50 54 29 18 26 13 8 17 8 4 8 3 2 3 3 2 185186 82 87 93 63 50 54 29 18 26 13 8 18 9 4 8 3 3 3 3 2 186187 82 88 93 64 51 55 29 19 27 13 8 18 9 4 8 3 3 3 3 2 187188 83 88 93 64 51 55 30 19 27 14 9 18 9 4 8 3 3 3 3 2 188189 83 88 94 64 52 56 30 19 27 14 9 18 9 4 8 3 3 3 3 2 189190 84 89 94 65 52 56 30 19 27 14 9 18 9 4 8 3 3 3 3 2 190191 84 89 94 65 53 57 30 19 27 14 9 19 9 4 8 4 3 3 3 2 191192 85 89 94 65 53 57 31 20 28 14 9 19 9 4 9 4 3 3 3 2 192193 85 90 94 66 53 58 31 20 28 14 9 19 9 4 9 4 3 3 3 2 193194 86 90 95 66 54 58 31 20 28 15 9 19 9 4 9 4 3 3 3 2 194195 86 90 95 66 54 59 31 21 29 15 9 20 9 4 9 4 3 3 3 2 195196 87 91 95 67 55 59 32 21 29 15 9 20 10 4 9 4 3 3 3 2 196197 87 91 95 67 55 60 32 21 29 15 9 20 10 4 9 4 3 3 3 2 197198 87 91 95 67 56 60 33 21 30 15 9 20 10 4 9 4 3 3 3 2 198199 88 91 96 68 56 60 33 21 30 15 10 20 10 4 9 4 3 3 3 2 199200 88 92 96 68 57 61 33 22 30 16 10 20 10 5 9 4 3 3 3 2 200201 89 92 96 68 57 61 33 22 30 16 10 21 10 5 9 4 3 4 3 2 201202 90 92 96 68 58 62 34 22 31 16 10 21 10 5 10 4 3 4 3 2 202203 90 92 96 69 58 62 34 22 31 16 10 21 10 5 10 4 3 4 3 2 203204 90 93 96 69 58 63 35 23 31 16 10 21 11 5 10 4 3 4 4 2 204205 91 93 96 69 59 63 35 23 32 17 10 21 11 5 10 4 3 4 4 2 205206 91 93 96 70 59 64 35 23 32 17 10 21 11 5 10 4 3 4 4 2 206207 91 93 96 70 60 64 36 23 32 17 10 22 11 5 11 4 3 4 4 2 207208 92 94 97 70 60 65 36 24 32 17 10 22 11 5 11 4 3 4 4 2 208209 92 94 97 70 61 65 36 24 33 17 11 22 11 5 11 4 3 4 4 2 209210 92 94 97 70 61 65 37 24 33 17 11 22 11 5 11 5 3 4 4 2 210211 93 94 97 71 62 66 37 25 33 18 11 23 11 5 11 5 3 4 4 2 211212 93 95 97 71 62 66 37 25 34 18 11 23 12 5 11 5 3 4 4 2 212213 93 95 97 71 63 67 38 25 34 18 11 23 12 5 11 5 3 4 4 2 213214 93 95 97 72 63 67 38 26 34 18 11 23 12 5 11 5 4 4 4 3 214215 94 95 97 72 64 68 39 26 35 19 11 24 12 5 11 5 4 4 4 3 215216 94 95 97 72 64 68 39 26 35 19 11 24 12 5 11 5 4 5 4 3 216
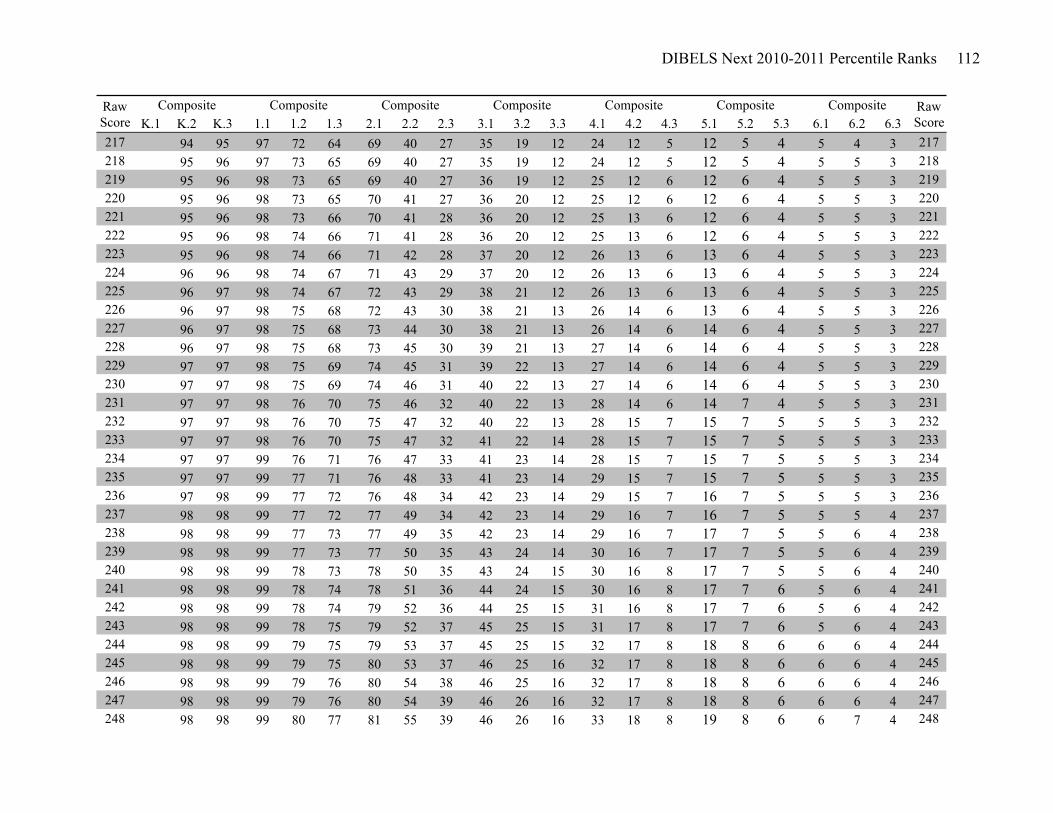
DIBELS Next 2010-2011 Percentile Ranks 112
K.1 K.2 K.3 1.1 1.2 1.3 2.1 2.2 2.3 3.1 3.2 3.3 4.1 4.2 4.3 5.1 5.2 5.3 6.1 6.2 6.3Composite Composite Composite Composite Composite Raw
ScoreRaw Score
Composite Composite
217 94 95 97 72 64 69 40 27 35 19 12 24 12 5 12 5 4 5 4 3 217218 95 96 97 73 65 69 40 27 35 19 12 24 12 5 12 5 4 5 5 3 218219 95 96 98 73 65 69 40 27 36 19 12 25 12 6 12 6 4 5 5 3 219220 95 96 98 73 65 70 41 27 36 20 12 25 12 6 12 6 4 5 5 3 220221 95 96 98 73 66 70 41 28 36 20 12 25 13 6 12 6 4 5 5 3 221222 95 96 98 74 66 71 41 28 36 20 12 25 13 6 12 6 4 5 5 3 222223 95 96 98 74 66 71 42 28 37 20 12 26 13 6 13 6 4 5 5 3 223224 96 96 98 74 67 71 43 29 37 20 12 26 13 6 13 6 4 5 5 3 224225 96 97 98 74 67 72 43 29 38 21 12 26 13 6 13 6 4 5 5 3 225226 96 97 98 75 68 72 43 30 38 21 13 26 14 6 13 6 4 5 5 3 226227 96 97 98 75 68 73 44 30 38 21 13 26 14 6 14 6 4 5 5 3 227228 96 97 98 75 68 73 45 30 39 21 13 27 14 6 14 6 4 5 5 3 228229 97 97 98 75 69 74 45 31 39 22 13 27 14 6 14 6 4 5 5 3 229230 97 97 98 75 69 74 46 31 40 22 13 27 14 6 14 6 4 5 5 3 230231 97 97 98 76 70 75 46 32 40 22 13 28 14 6 14 7 4 5 5 3 231232 97 97 98 76 70 75 47 32 40 22 13 28 15 7 15 7 5 5 5 3 232233 97 97 98 76 70 75 47 32 41 22 14 28 15 7 15 7 5 5 5 3 233234 97 97 99 76 71 76 47 33 41 23 14 28 15 7 15 7 5 5 5 3 234235 97 97 99 77 71 76 48 33 41 23 14 29 15 7 15 7 5 5 5 3 235236 97 98 99 77 72 76 48 34 42 23 14 29 15 7 16 7 5 5 5 3 236237 98 98 99 77 72 77 49 34 42 23 14 29 16 7 16 7 5 5 5 4 237238 98 98 99 77 73 77 49 35 42 23 14 29 16 7 17 7 5 5 6 4 238239 98 98 99 77 73 77 50 35 43 24 14 30 16 7 17 7 5 5 6 4 239240 98 98 99 78 73 78 50 35 43 24 15 30 16 8 17 7 5 5 6 4 240241 98 98 99 78 74 78 51 36 44 24 15 30 16 8 17 7 6 5 6 4 241242 98 98 99 78 74 79 52 36 44 25 15 31 16 8 17 7 6 5 6 4 242243 98 98 99 78 75 79 52 37 45 25 15 31 17 8 17 7 6 5 6 4 243244 98 98 99 79 75 79 53 37 45 25 15 32 17 8 18 8 6 6 6 4 244245 98 98 99 79 75 80 53 37 46 25 16 32 17 8 18 8 6 6 6 4 245246 98 98 99 79 76 80 54 38 46 25 16 32 17 8 18 8 6 6 6 4 246247 98 98 99 79 76 80 54 39 46 26 16 32 17 8 18 8 6 6 6 4 247248 98 98 99 80 77 81 55 39 46 26 16 33 18 8 19 8 6 6 7 4 248
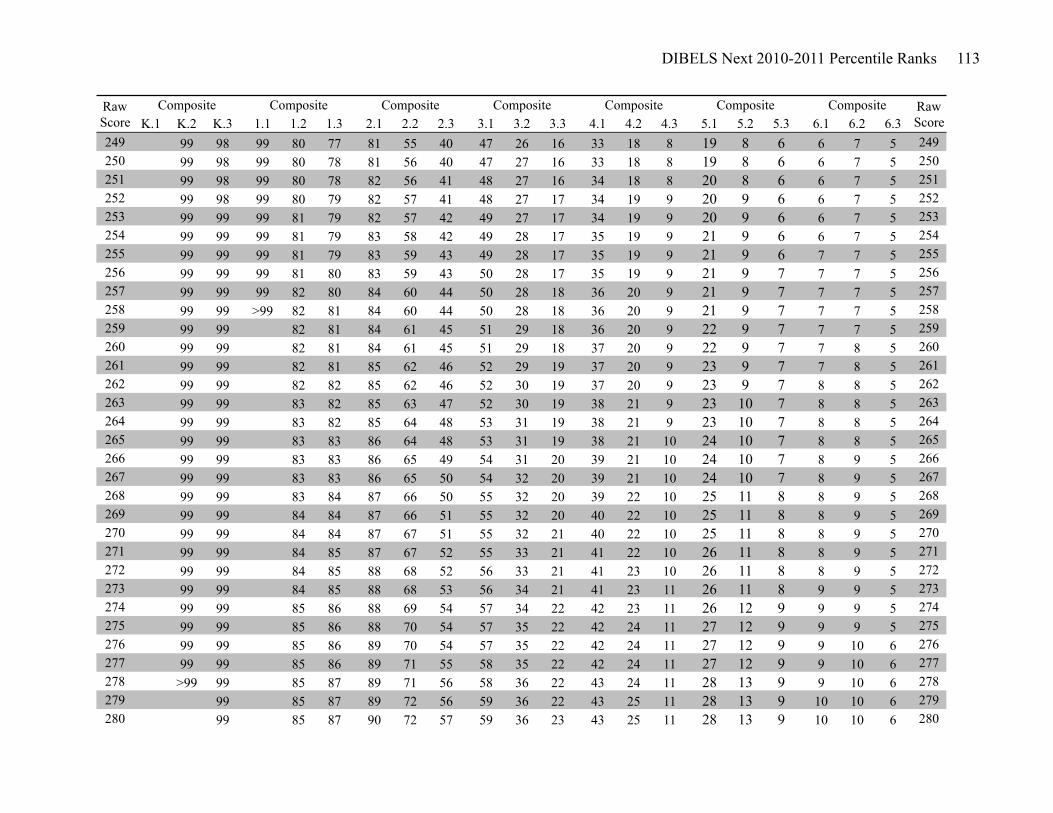
DIBELS Next 2010-2011 Percentile Ranks 113
K.1 K.2 K.3 1.1 1.2 1.3 2.1 2.2 2.3 3.1 3.2 3.3 4.1 4.2 4.3 5.1 5.2 5.3 6.1 6.2 6.3Composite Composite Composite Composite Composite Raw
ScoreRaw Score
Composite Composite
249 99 98 99 80 77 81 55 40 47 26 16 33 18 8 19 8 6 6 7 5 249250 99 98 99 80 78 81 56 40 47 27 16 33 18 8 19 8 6 6 7 5 250251 99 98 99 80 78 82 56 41 48 27 16 34 18 8 20 8 6 6 7 5 251252 99 98 99 80 79 82 57 41 48 27 17 34 19 9 20 9 6 6 7 5 252253 99 99 99 81 79 82 57 42 49 27 17 34 19 9 20 9 6 6 7 5 253254 99 99 99 81 79 83 58 42 49 28 17 35 19 9 21 9 6 6 7 5 254255 99 99 99 81 79 83 59 43 49 28 17 35 19 9 21 9 6 7 7 5 255256 99 99 99 81 80 83 59 43 50 28 17 35 19 9 21 9 7 7 7 5 256257 99 99 99 82 80 84 60 44 50 28 18 36 20 9 21 9 7 7 7 5 257258 99 99 >99 82 81 84 60 44 50 28 18 36 20 9 21 9 7 7 7 5 258259 99 99 82 81 84 61 45 51 29 18 36 20 9 22 9 7 7 7 5 259260 99 99 82 81 84 61 45 51 29 18 37 20 9 22 9 7 7 8 5 260261 99 99 82 81 85 62 46 52 29 19 37 20 9 23 9 7 7 8 5 261262 99 99 82 82 85 62 46 52 30 19 37 20 9 23 9 7 8 8 5 262263 99 99 83 82 85 63 47 52 30 19 38 21 9 23 10 7 8 8 5 263264 99 99 83 82 85 64 48 53 31 19 38 21 9 23 10 7 8 8 5 264265 99 99 83 83 86 64 48 53 31 19 38 21 10 24 10 7 8 8 5 265266 99 99 83 83 86 65 49 54 31 20 39 21 10 24 10 7 8 9 5 266267 99 99 83 83 86 65 50 54 32 20 39 21 10 24 10 7 8 9 5 267268 99 99 83 84 87 66 50 55 32 20 39 22 10 25 11 8 8 9 5 268269 99 99 84 84 87 66 51 55 32 20 40 22 10 25 11 8 8 9 5 269270 99 99 84 84 87 67 51 55 32 21 40 22 10 25 11 8 8 9 5 270271 99 99 84 85 87 67 52 55 33 21 41 22 10 26 11 8 8 9 5 271272 99 99 84 85 88 68 52 56 33 21 41 23 10 26 11 8 8 9 5 272273 99 99 84 85 88 68 53 56 34 21 41 23 11 26 11 8 9 9 5 273274 99 99 85 86 88 69 54 57 34 22 42 23 11 26 12 9 9 9 5 274275 99 99 85 86 88 70 54 57 35 22 42 24 11 27 12 9 9 9 5 275276 99 99 85 86 89 70 54 57 35 22 42 24 11 27 12 9 9 10 6 276277 99 99 85 86 89 71 55 58 35 22 42 24 11 27 12 9 9 10 6 277278 >99 99 85 87 89 71 56 58 36 22 43 24 11 28 13 9 9 10 6 278279 99 85 87 89 72 56 59 36 22 43 25 11 28 13 9 10 10 6 279280 99 85 87 90 72 57 59 36 23 43 25 11 28 13 9 10 10 6 280
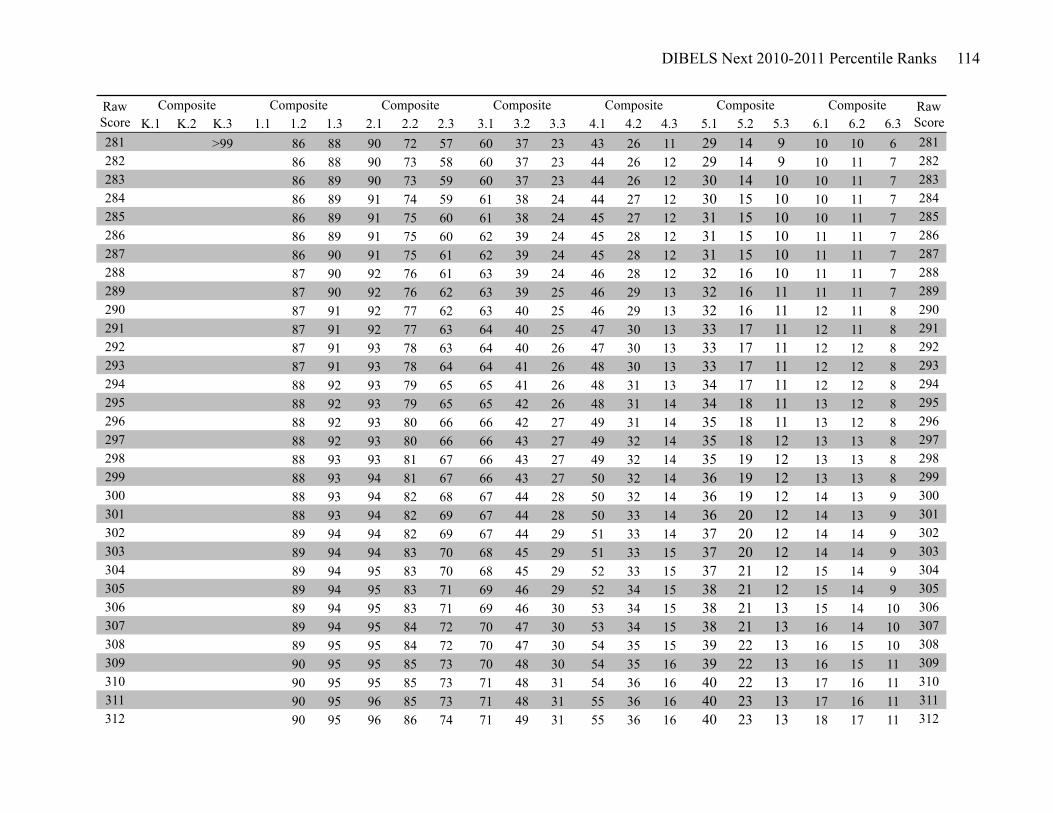
DIBELS Next 2010-2011 Percentile Ranks 114
K.1 K.2 K.3 1.1 1.2 1.3 2.1 2.2 2.3 3.1 3.2 3.3 4.1 4.2 4.3 5.1 5.2 5.3 6.1 6.2 6.3Composite Composite Composite Composite Composite Raw
ScoreRaw Score
Composite Composite
281 >99 86 88 90 72 57 60 37 23 43 26 11 29 14 9 10 10 6 281282 86 88 90 73 58 60 37 23 44 26 12 29 14 9 10 11 7 282283 86 89 90 73 59 60 37 23 44 26 12 30 14 10 10 11 7 283284 86 89 91 74 59 61 38 24 44 27 12 30 15 10 10 11 7 284285 86 89 91 75 60 61 38 24 45 27 12 31 15 10 10 11 7 285286 86 89 91 75 60 62 39 24 45 28 12 31 15 10 11 11 7 286287 86 90 91 75 61 62 39 24 45 28 12 31 15 10 11 11 7 287288 87 90 92 76 61 63 39 24 46 28 12 32 16 10 11 11 7 288289 87 90 92 76 62 63 39 25 46 29 13 32 16 11 11 11 7 289290 87 91 92 77 62 63 40 25 46 29 13 32 16 11 12 11 8 290291 87 91 92 77 63 64 40 25 47 30 13 33 17 11 12 11 8 291292 87 91 93 78 63 64 40 26 47 30 13 33 17 11 12 12 8 292293 87 91 93 78 64 64 41 26 48 30 13 33 17 11 12 12 8 293294 88 92 93 79 65 65 41 26 48 31 13 34 17 11 12 12 8 294295 88 92 93 79 65 65 42 26 48 31 14 34 18 11 13 12 8 295296 88 92 93 80 66 66 42 27 49 31 14 35 18 11 13 12 8 296297 88 92 93 80 66 66 43 27 49 32 14 35 18 12 13 13 8 297298 88 93 93 81 67 66 43 27 49 32 14 35 19 12 13 13 8 298299 88 93 94 81 67 66 43 27 50 32 14 36 19 12 13 13 8 299300 88 93 94 82 68 67 44 28 50 32 14 36 19 12 14 13 9 300301 88 93 94 82 69 67 44 28 50 33 14 36 20 12 14 13 9 301302 89 94 94 82 69 67 44 29 51 33 14 37 20 12 14 14 9 302303 89 94 94 83 70 68 45 29 51 33 15 37 20 12 14 14 9 303304 89 94 95 83 70 68 45 29 52 33 15 37 21 12 15 14 9 304305 89 94 95 83 71 69 46 29 52 34 15 38 21 12 15 14 9 305306 89 94 95 83 71 69 46 30 53 34 15 38 21 13 15 14 10 306307 89 94 95 84 72 70 47 30 53 34 15 38 21 13 16 14 10 307308 89 95 95 84 72 70 47 30 54 35 15 39 22 13 16 15 10 308309 90 95 95 85 73 70 48 30 54 35 16 39 22 13 16 15 11 309310 90 95 95 85 73 71 48 31 54 36 16 40 22 13 17 16 11 310311 90 95 96 85 73 71 48 31 55 36 16 40 23 13 17 16 11 311312 90 95 96 86 74 71 49 31 55 36 16 40 23 13 18 17 11 312

DIBELS Next 2010-2011 Percentile Ranks 115
K.1 K.2 K.3 1.1 1.2 1.3 2.1 2.2 2.3 3.1 3.2 3.3 4.1 4.2 4.3 5.1 5.2 5.3 6.1 6.2 6.3Composite Composite Composite Composite Composite Raw
ScoreRaw Score
Composite Composite
313 90 96 96 86 74 72 49 32 56 37 16 41 23 14 18 17 11 313314 90 96 96 86 75 72 50 32 56 37 17 41 23 14 19 17 12 314315 90 96 96 87 75 72 50 32 56 37 17 42 24 14 19 17 12 315316 90 96 96 87 76 73 50 33 57 38 17 42 24 14 19 18 12 316317 90 96 96 87 76 73 51 33 57 38 17 43 24 15 19 18 12 317318 91 96 96 87 77 73 51 33 58 38 18 43 25 15 20 18 12 318319 91 97 97 88 77 74 51 33 58 39 18 43 25 15 21 19 12 319320 91 97 97 88 78 74 52 34 58 39 18 44 26 15 21 19 13 320321 91 97 97 88 78 74 52 34 59 39 18 45 26 15 22 19 13 321322 91 97 97 89 78 74 53 34 59 40 18 45 27 16 22 19 13 322323 91 97 97 89 79 75 53 35 59 40 19 46 27 16 22 20 13 323324 91 97 97 89 79 75 53 35 60 40 19 46 27 16 23 20 13 324325 91 97 97 89 79 75 54 35 60 41 19 47 28 16 23 20 14 325326 92 97 97 89 80 76 54 36 61 41 20 47 28 17 24 20 14 326327 92 97 97 90 80 76 54 36 61 41 20 47 28 17 24 20 14 327328 92 98 98 90 81 76 55 36 61 42 20 48 29 17 25 21 15 328329 92 98 98 90 81 76 55 37 62 42 20 48 29 17 25 21 15 329330 92 98 98 90 81 77 55 37 62 43 21 48 30 18 25 21 15 330331 92 98 98 91 81 77 56 37 62 43 21 49 31 18 26 22 15 331332 92 98 98 91 82 77 56 37 63 43 21 49 31 18 26 22 15 332333 92 98 98 91 82 78 56 38 63 44 21 49 32 18 27 22 15 333334 92 98 98 91 82 78 57 38 63 44 22 50 32 18 27 23 15 334335 93 98 98 91 83 78 58 39 63 45 22 50 33 19 28 23 15 335336 93 98 98 92 83 78 58 39 64 45 22 51 33 19 28 23 15 336337 93 98 98 92 83 79 58 39 64 46 22 51 34 20 29 24 16 337338 93 98 98 92 84 79 59 40 65 46 23 52 34 20 29 24 16 338339 93 98 98 93 84 80 59 40 65 47 23 52 35 20 29 24 16 339340 93 99 98 93 84 80 60 40 65 47 23 53 36 21 30 25 16 340341 93 99 99 93 85 80 60 41 66 47 23 53 36 21 30 25 17 341342 93 99 99 93 85 81 61 41 66 48 24 54 37 21 31 25 17 342343 94 99 99 93 85 81 61 42 66 48 24 54 37 22 31 25 17 343344 94 99 99 93 86 81 61 42 67 49 24 55 38 22 32 25 17 344

DIBELS Next 2010-2011 Percentile Ranks 116
K.1 K.2 K.3 1.1 1.2 1.3 2.1 2.2 2.3 3.1 3.2 3.3 4.1 4.2 4.3 5.1 5.2 5.3 6.1 6.2 6.3Composite Composite Composite Composite Composite Raw
ScoreRaw Score
Composite Composite
345 94 99 99 93 86 81 61 42 67 49 25 55 38 22 32 26 17 345346 94 99 99 94 86 82 62 43 67 50 25 55 39 23 33 26 18 346347 94 99 99 94 86 82 62 43 68 50 25 56 39 23 33 26 18 347348 94 99 99 94 87 82 63 44 68 51 26 56 40 23 33 26 18 348349 94 99 99 94 87 83 63 44 68 51 26 57 40 24 34 27 19 349350 95 99 99 94 87 83 63 44 69 51 26 57 40 24 34 27 19 350351 95 99 99 94 88 83 64 45 69 52 27 57 41 24 35 28 19 351352 95 99 99 94 88 83 64 45 69 52 27 58 41 24 36 28 20 352353 95 99 99 95 88 84 64 45 70 53 27 58 42 24 36 28 20 353354 95 99 99 95 89 84 65 46 70 53 27 58 42 25 37 28 20 354355 95 >99 99 95 89 84 65 46 70 53 28 59 43 25 37 29 20 355356 95 99 95 89 85 66 46 70 53 28 59 43 25 37 29 21 356357 95 99 95 89 85 66 47 71 54 28 59 43 25 38 30 21 357358 95 99 95 90 85 66 47 71 54 29 60 44 26 38 30 21 358359 95 99 95 90 86 67 48 72 55 29 60 44 26 39 31 22 359360 95 >99 95 90 86 67 48 72 55 29 61 45 26 39 31 22 360361 95 95 90 86 67 49 72 55 30 61 45 27 40 31 22 361362 95 95 91 86 68 49 73 56 30 61 45 27 40 32 22 362363 96 95 91 86 68 49 73 56 30 61 46 27 41 32 23 363364 96 95 91 86 68 50 74 57 31 62 47 28 41 32 23 364365 96 95 91 87 69 50 74 57 31 62 48 28 41 32 23 365366 96 96 92 87 69 51 74 58 32 62 48 29 42 33 24 366367 96 96 92 87 69 51 75 58 32 62 48 29 42 33 24 367368 96 96 92 87 70 51 75 58 32 63 49 29 42 34 25 368369 96 96 92 87 70 52 75 59 33 63 49 30 43 34 25 369370 96 96 93 88 71 52 76 59 33 63 50 30 43 34 26 370371 96 96 93 88 71 52 76 60 34 64 50 30 44 35 26 371372 96 96 93 88 71 53 76 60 34 64 51 31 45 35 26 372373 96 96 93 88 71 53 76 60 34 64 51 31 45 35 27 373374 97 97 93 89 72 53 77 61 35 65 51 32 46 36 27 374375 97 97 93 89 72 54 77 61 35 66 52 32 46 36 27 375376 97 97 94 89 72 54 77 62 35 66 53 32 46 37 27 376
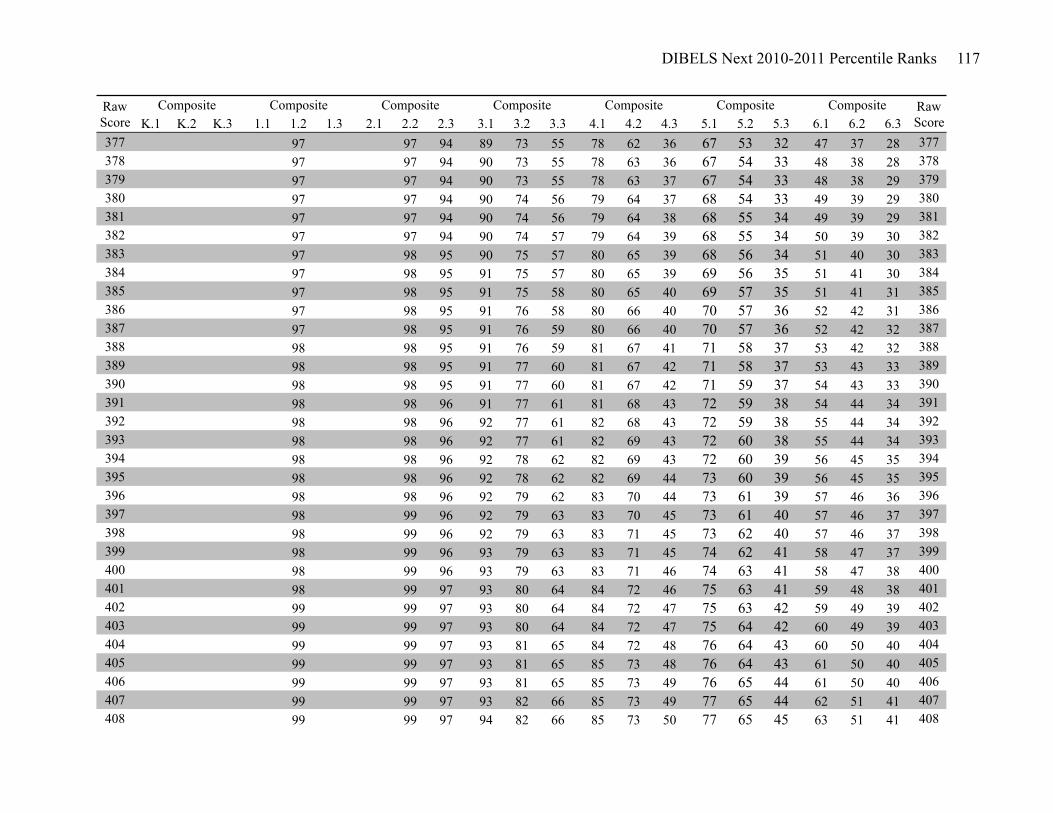
DIBELS Next 2010-2011 Percentile Ranks 117
K.1 K.2 K.3 1.1 1.2 1.3 2.1 2.2 2.3 3.1 3.2 3.3 4.1 4.2 4.3 5.1 5.2 5.3 6.1 6.2 6.3Composite Composite Composite Composite Composite Raw
ScoreRaw Score
Composite Composite
377 97 97 94 89 73 55 78 62 36 67 53 32 47 37 28 377378 97 97 94 90 73 55 78 63 36 67 54 33 48 38 28 378379 97 97 94 90 73 55 78 63 37 67 54 33 48 38 29 379380 97 97 94 90 74 56 79 64 37 68 54 33 49 39 29 380381 97 97 94 90 74 56 79 64 38 68 55 34 49 39 29 381382 97 97 94 90 74 57 79 64 39 68 55 34 50 39 30 382383 97 98 95 90 75 57 80 65 39 68 56 34 51 40 30 383384 97 98 95 91 75 57 80 65 39 69 56 35 51 41 30 384385 97 98 95 91 75 58 80 65 40 69 57 35 51 41 31 385386 97 98 95 91 76 58 80 66 40 70 57 36 52 42 31 386387 97 98 95 91 76 59 80 66 40 70 57 36 52 42 32 387388 98 98 95 91 76 59 81 67 41 71 58 37 53 42 32 388389 98 98 95 91 77 60 81 67 42 71 58 37 53 43 33 389390 98 98 95 91 77 60 81 67 42 71 59 37 54 43 33 390391 98 98 96 91 77 61 81 68 43 72 59 38 54 44 34 391392 98 98 96 92 77 61 82 68 43 72 59 38 55 44 34 392393 98 98 96 92 77 61 82 69 43 72 60 38 55 44 34 393394 98 98 96 92 78 62 82 69 43 72 60 39 56 45 35 394395 98 98 96 92 78 62 82 69 44 73 60 39 56 45 35 395396 98 98 96 92 79 62 83 70 44 73 61 39 57 46 36 396397 98 99 96 92 79 63 83 70 45 73 61 40 57 46 37 397398 98 99 96 92 79 63 83 71 45 73 62 40 57 46 37 398399 98 99 96 93 79 63 83 71 45 74 62 41 58 47 37 399400 98 99 96 93 79 63 83 71 46 74 63 41 58 47 38 400401 98 99 97 93 80 64 84 72 46 75 63 41 59 48 38 401402 99 99 97 93 80 64 84 72 47 75 63 42 59 49 39 402403 99 99 97 93 80 64 84 72 47 75 64 42 60 49 39 403404 99 99 97 93 81 65 84 72 48 76 64 43 60 50 40 404405 99 99 97 93 81 65 85 73 48 76 64 43 61 50 40 405406 99 99 97 93 81 65 85 73 49 76 65 44 61 50 40 406407 99 99 97 93 82 66 85 73 49 77 65 44 62 51 41 407408 99 99 97 94 82 66 85 73 50 77 65 45 63 51 41 408

DIBELS Next 2010-2011 Percentile Ranks 118
K.1 K.2 K.3 1.1 1.2 1.3 2.1 2.2 2.3 3.1 3.2 3.3 4.1 4.2 4.3 5.1 5.2 5.3 6.1 6.2 6.3Composite Composite Composite Composite Composite Raw
ScoreRaw Score
Composite Composite
409 99 99 97 94 82 66 86 74 50 77 66 45 63 51 42 409410 99 99 97 94 82 67 86 74 51 77 66 46 64 52 42 410411 99 99 97 94 83 67 86 74 51 77 67 46 65 52 43 411412 99 99 97 94 83 67 86 75 52 78 67 46 65 52 43 412413 99 99 97 94 84 68 86 75 52 78 68 47 66 53 44 413414 99 99 98 94 84 68 87 75 53 78 68 47 66 53 44 414415 99 99 98 94 84 69 87 76 53 78 69 48 67 53 45 415416 99 99 98 95 84 69 87 76 54 79 69 48 67 54 45 416417 99 99 98 95 84 69 87 76 54 79 70 49 67 54 45 417418 99 99 98 95 84 70 87 76 55 79 70 49 68 55 45 418419 99 99 98 95 85 70 88 77 55 80 70 50 69 55 46 419420 99 99 98 95 85 70 88 77 55 80 71 50 69 55 46 420421 99 99 98 95 85 70 88 77 56 80 71 50 70 55 46 421422 99 99 98 95 85 71 88 78 56 80 71 51 70 56 46 422423 99 99 98 95 86 71 88 78 57 81 72 51 70 56 47 423424 99 99 98 95 86 72 88 78 57 81 72 51 70 57 48 424425 >99 99 98 95 86 72 89 79 57 81 72 52 70 57 48 425426 99 98 95 86 72 89 79 58 82 73 52 71 57 49 426427 99 98 95 86 73 89 79 58 82 73 53 71 58 50 427428 99 98 96 87 73 89 79 59 82 73 53 72 58 50 428429 99 98 96 87 73 89 80 59 82 73 54 73 58 50 429430 >99 98 96 87 74 90 80 59 82 74 54 73 59 51 430431 98 96 87 74 90 80 60 82 74 54 73 59 51 431432 98 96 87 74 90 81 60 83 74 55 74 60 52 432433 99 96 87 74 90 81 61 83 74 55 75 60 52 433434 99 96 88 75 90 81 61 83 75 55 75 60 52 434435 99 96 88 75 90 81 61 83 75 56 75 61 53 435436 99 96 88 75 90 82 62 84 75 56 75 61 54 436437 99 96 88 75 91 82 62 84 75 56 75 62 54 437438 99 96 88 76 91 82 63 84 76 57 76 62 54 438439 99 97 88 76 91 82 63 84 76 57 76 63 55 439440 99 97 89 76 91 83 64 85 76 58 76 63 55 440

DIBELS Next 2010-2011 Percentile Ranks 119
K.1 K.2 K.3 1.1 1.2 1.3 2.1 2.2 2.3 3.1 3.2 3.3 4.1 4.2 4.3 5.1 5.2 5.3 6.1 6.2 6.3Composite Composite Composite Composite Composite Raw
ScoreRaw Score
Composite Composite
441 99 97 89 77 92 83 64 85 76 58 77 63 55 441442 99 97 89 77 92 83 64 85 77 58 77 64 55 442443 99 97 89 77 92 83 65 85 77 59 77 64 56 443444 99 97 89 77 92 84 65 85 77 59 78 65 56 444445 99 97 89 78 92 84 65 85 77 59 78 65 56 445446 99 97 89 78 92 84 66 86 78 60 79 65 57 446447 99 97 90 78 92 84 66 86 78 60 79 65 57 447448 99 97 90 78 93 85 67 86 78 60 79 66 57 448449 99 97 90 79 93 85 67 86 78 61 80 66 58 449450 99 97 90 79 93 85 68 87 78 62 80 67 58 450451 99 97 90 80 93 85 68 87 79 62 80 67 59 451452 99 97 91 80 93 86 68 87 79 62 80 68 60 452453 99 98 91 80 93 86 69 87 79 63 81 68 60 453454 99 98 91 81 93 86 69 87 79 63 81 68 60 454455 99 98 91 81 93 87 70 87 80 63 81 69 61 455456 99 98 91 81 93 87 70 87 80 64 82 69 61 456457 99 98 92 81 93 87 70 88 80 64 82 69 61 457458 99 98 92 81 94 87 71 88 81 65 82 69 62 458459 99 98 92 82 94 87 71 88 81 65 82 69 62 459460 99 98 92 82 94 88 71 88 81 65 83 70 63 460461 >99 98 92 82 94 88 71 89 82 66 83 70 63 461462 98 92 82 94 88 72 89 82 66 83 70 63 462463 98 92 83 94 88 72 89 82 66 83 71 63 463464 98 93 83 94 88 73 89 82 67 84 71 64 464465 98 93 83 94 88 73 90 82 67 84 71 64 465466 98 93 83 95 88 73 90 82 67 84 71 64 466467 98 93 83 95 89 73 90 83 68 85 72 65 467468 98 93 84 95 89 74 90 83 68 85 72 65 468469 98 93 84 95 89 74 90 83 69 85 73 66 469470 98 93 84 95 89 75 90 83 69 85 73 66 470471 98 93 84 95 90 75 90 83 69 85 73 66 471472 98 94 84 96 90 75 91 84 70 85 74 67 472
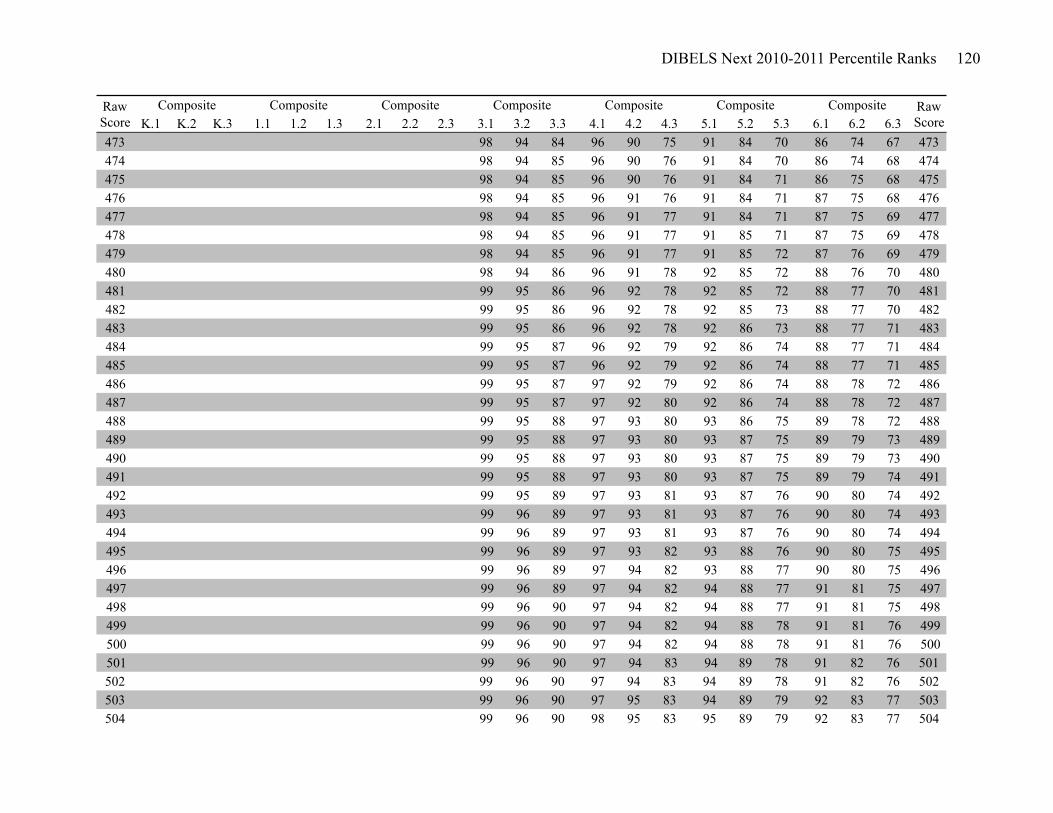
DIBELS Next 2010-2011 Percentile Ranks 120
K.1 K.2 K.3 1.1 1.2 1.3 2.1 2.2 2.3 3.1 3.2 3.3 4.1 4.2 4.3 5.1 5.2 5.3 6.1 6.2 6.3Composite Composite Composite Composite Composite Raw
ScoreRaw Score
Composite Composite
473 98 94 84 96 90 75 91 84 70 86 74 67 473474 98 94 85 96 90 76 91 84 70 86 74 68 474475 98 94 85 96 90 76 91 84 71 86 75 68 475476 98 94 85 96 91 76 91 84 71 87 75 68 476477 98 94 85 96 91 77 91 84 71 87 75 69 477478 98 94 85 96 91 77 91 85 71 87 75 69 478479 98 94 85 96 91 77 91 85 72 87 76 69 479480 98 94 86 96 91 78 92 85 72 88 76 70 480481 99 95 86 96 92 78 92 85 72 88 77 70 481482 99 95 86 96 92 78 92 85 73 88 77 70 482483 99 95 86 96 92 78 92 86 73 88 77 71 483484 99 95 87 96 92 79 92 86 74 88 77 71 484485 99 95 87 96 92 79 92 86 74 88 77 71 485486 99 95 87 97 92 79 92 86 74 88 78 72 486487 99 95 87 97 92 80 92 86 74 88 78 72 487488 99 95 88 97 93 80 93 86 75 89 78 72 488489 99 95 88 97 93 80 93 87 75 89 79 73 489490 99 95 88 97 93 80 93 87 75 89 79 73 490491 99 95 88 97 93 80 93 87 75 89 79 74 491492 99 95 89 97 93 81 93 87 76 90 80 74 492493 99 96 89 97 93 81 93 87 76 90 80 74 493494 99 96 89 97 93 81 93 87 76 90 80 74 494495 99 96 89 97 93 82 93 88 76 90 80 75 495496 99 96 89 97 94 82 93 88 77 90 80 75 496497 99 96 89 97 94 82 94 88 77 91 81 75 497498 99 96 90 97 94 82 94 88 77 91 81 75 498499 99 96 90 97 94 82 94 88 78 91 81 76 499500 99 96 90 97 94 82 94 88 78 91 81 76 500501 99 96 90 97 94 83 94 89 78 91 82 76 501502 99 96 90 97 94 83 94 89 78 91 82 76 502503 99 96 90 97 95 83 94 89 79 92 83 77 503504 99 96 90 98 95 83 95 89 79 92 83 77 504
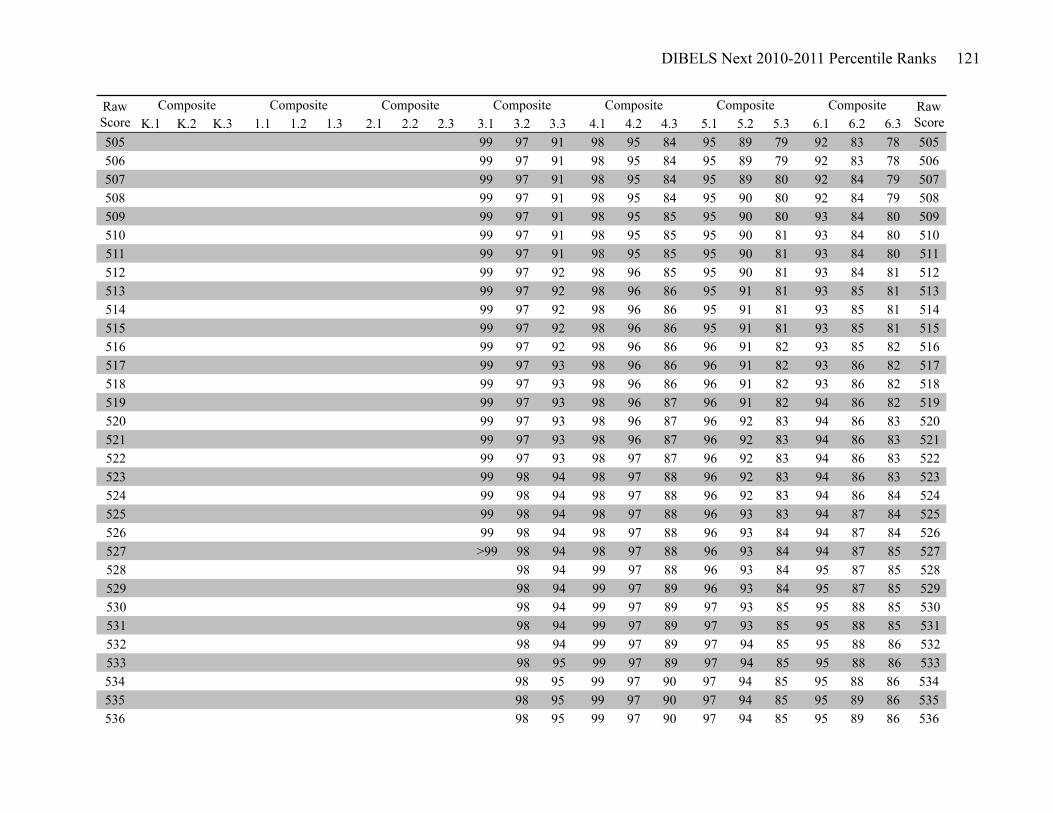
DIBELS Next 2010-2011 Percentile Ranks 121
K.1 K.2 K.3 1.1 1.2 1.3 2.1 2.2 2.3 3.1 3.2 3.3 4.1 4.2 4.3 5.1 5.2 5.3 6.1 6.2 6.3Composite Composite Composite Composite Composite Raw
ScoreRaw Score
Composite Composite
505 99 97 91 98 95 84 95 89 79 92 83 78 505506 99 97 91 98 95 84 95 89 79 92 83 78 506507 99 97 91 98 95 84 95 89 80 92 84 79 507508 99 97 91 98 95 84 95 90 80 92 84 79 508509 99 97 91 98 95 85 95 90 80 93 84 80 509510 99 97 91 98 95 85 95 90 81 93 84 80 510511 99 97 91 98 95 85 95 90 81 93 84 80 511512 99 97 92 98 96 85 95 90 81 93 84 81 512513 99 97 92 98 96 86 95 91 81 93 85 81 513514 99 97 92 98 96 86 95 91 81 93 85 81 514515 99 97 92 98 96 86 95 91 81 93 85 81 515516 99 97 92 98 96 86 96 91 82 93 85 82 516517 99 97 93 98 96 86 96 91 82 93 86 82 517518 99 97 93 98 96 86 96 91 82 93 86 82 518519 99 97 93 98 96 87 96 91 82 94 86 82 519520 99 97 93 98 96 87 96 92 83 94 86 83 520521 99 97 93 98 96 87 96 92 83 94 86 83 521522 99 97 93 98 97 87 96 92 83 94 86 83 522523 99 98 94 98 97 88 96 92 83 94 86 83 523524 99 98 94 98 97 88 96 92 83 94 86 84 524525 99 98 94 98 97 88 96 93 83 94 87 84 525526 99 98 94 98 97 88 96 93 84 94 87 84 526527 >99 98 94 98 97 88 96 93 84 94 87 85 527528 98 94 99 97 88 96 93 84 95 87 85 528529 98 94 99 97 89 96 93 84 95 87 85 529530 98 94 99 97 89 97 93 85 95 88 85 530531 98 94 99 97 89 97 93 85 95 88 85 531532 98 94 99 97 89 97 94 85 95 88 86 532533 98 95 99 97 89 97 94 85 95 88 86 533534 98 95 99 97 90 97 94 85 95 88 86 534535 98 95 99 97 90 97 94 85 95 89 86 535536 98 95 99 97 90 97 94 85 95 89 86 536

DIBELS Next 2010-2011 Percentile Ranks 122
K.1 K.2 K.3 1.1 1.2 1.3 2.1 2.2 2.3 3.1 3.2 3.3 4.1 4.2 4.3 5.1 5.2 5.3 6.1 6.2 6.3Composite Composite Composite Composite Composite Raw
ScoreRaw Score
Composite Composite
537 98 95 99 97 90 97 94 86 95 89 86 537538 98 95 99 98 90 97 94 86 95 89 87 538539 98 95 99 98 90 97 94 86 96 89 87 539540 98 95 99 98 91 97 95 86 96 89 87 540541 98 95 99 98 91 97 95 86 96 89 87 541542 98 96 99 98 91 97 95 87 96 90 88 542543 98 96 99 98 91 97 95 87 96 90 88 543544 98 96 99 98 91 98 95 87 96 90 88 544545 98 96 99 98 91 98 95 87 96 90 88 545546 98 96 99 98 92 98 95 88 96 90 88 546547 98 96 99 98 92 98 95 88 96 90 88 547548 98 96 99 98 92 98 95 88 96 90 88 548549 98 96 99 98 92 98 96 88 96 90 88 549550 98 96 99 98 92 98 96 88 96 91 89 550551 98 96 99 98 92 98 96 88 96 91 89 551552 99 96 99 98 92 98 96 88 96 91 89 552553 99 96 99 98 92 98 96 88 96 91 89 553554 99 96 99 98 93 98 96 89 96 91 89 554555 99 96 99 98 93 98 96 89 96 91 89 555556 99 97 99 98 93 98 96 89 96 92 89 556557 99 97 99 98 93 98 96 89 96 92 90 557558 99 97 99 98 93 98 97 89 96 92 90 558559 99 97 >99 98 93 98 97 90 96 92 90 559560 99 97 98 93 98 97 90 96 92 90 560561 99 97 98 94 98 97 90 96 92 90 561562 99 97 98 94 98 97 90 96 92 90 562563 99 97 98 94 99 97 90 96 92 90 563564 99 97 99 94 99 97 90 96 92 90 564565 99 97 99 94 99 97 91 96 92 91 565566 99 97 99 94 99 97 91 96 92 91 566567 99 97 99 94 99 97 91 97 93 91 567568 99 97 99 94 99 97 91 97 93 91 568
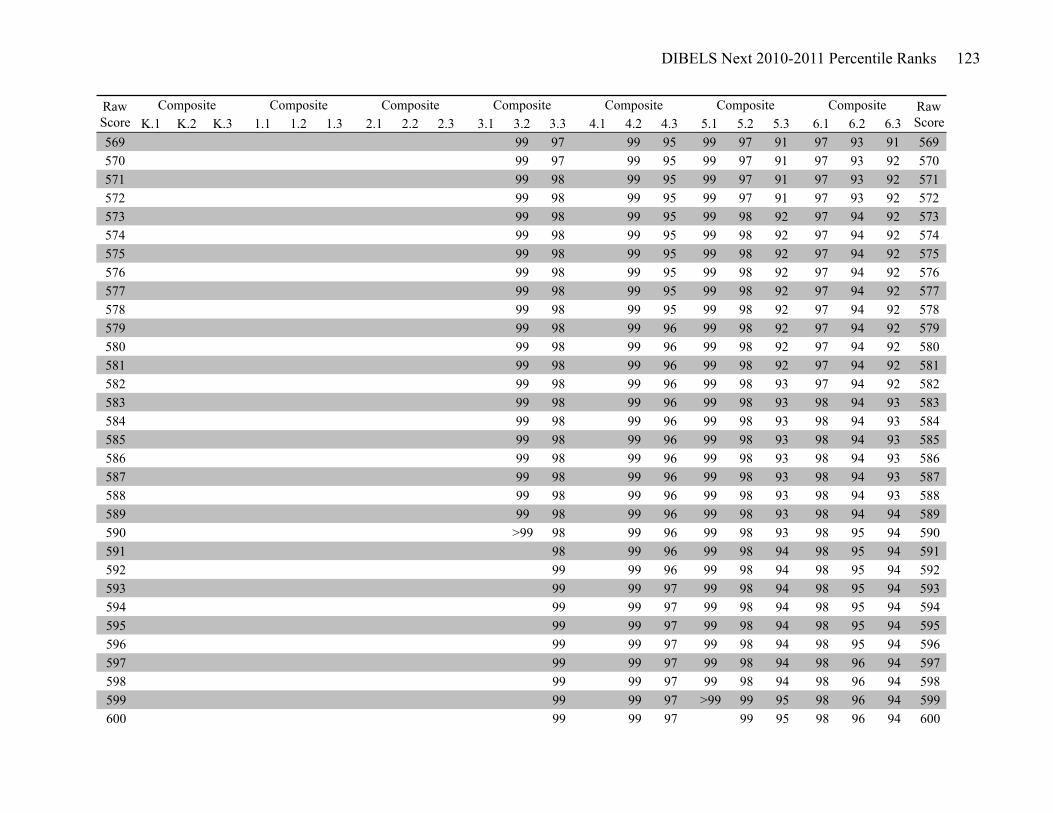
DIBELS Next 2010-2011 Percentile Ranks 123
K.1 K.2 K.3 1.1 1.2 1.3 2.1 2.2 2.3 3.1 3.2 3.3 4.1 4.2 4.3 5.1 5.2 5.3 6.1 6.2 6.3Composite Composite Composite Composite Composite Raw
ScoreRaw Score
Composite Composite
569 99 97 99 95 99 97 91 97 93 91 569570 99 97 99 95 99 97 91 97 93 92 570571 99 98 99 95 99 97 91 97 93 92 571572 99 98 99 95 99 97 91 97 93 92 572573 99 98 99 95 99 98 92 97 94 92 573574 99 98 99 95 99 98 92 97 94 92 574575 99 98 99 95 99 98 92 97 94 92 575576 99 98 99 95 99 98 92 97 94 92 576577 99 98 99 95 99 98 92 97 94 92 577578 99 98 99 95 99 98 92 97 94 92 578579 99 98 99 96 99 98 92 97 94 92 579580 99 98 99 96 99 98 92 97 94 92 580581 99 98 99 96 99 98 92 97 94 92 581582 99 98 99 96 99 98 93 97 94 92 582583 99 98 99 96 99 98 93 98 94 93 583584 99 98 99 96 99 98 93 98 94 93 584585 99 98 99 96 99 98 93 98 94 93 585586 99 98 99 96 99 98 93 98 94 93 586587 99 98 99 96 99 98 93 98 94 93 587588 99 98 99 96 99 98 93 98 94 93 588589 99 98 99 96 99 98 93 98 94 94 589590 >99 98 99 96 99 98 93 98 95 94 590591 98 99 96 99 98 94 98 95 94 591592 99 99 96 99 98 94 98 95 94 592593 99 99 97 99 98 94 98 95 94 593594 99 99 97 99 98 94 98 95 94 594595 99 99 97 99 98 94 98 95 94 595596 99 99 97 99 98 94 98 95 94 596597 99 99 97 99 98 94 98 96 94 597598 99 99 97 99 98 94 98 96 94 598599 99 99 97 >99 99 95 98 96 94 599600 99 99 97 99 95 98 96 94 600
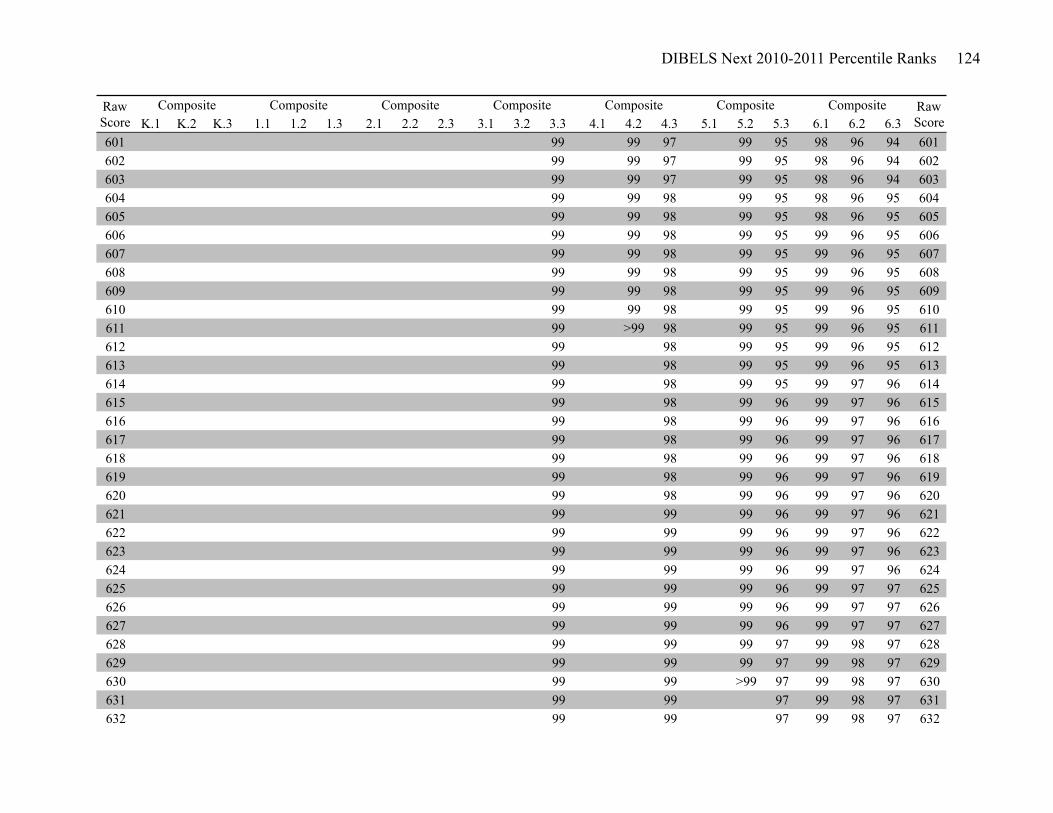
DIBELS Next 2010-2011 Percentile Ranks 124
K.1 K.2 K.3 1.1 1.2 1.3 2.1 2.2 2.3 3.1 3.2 3.3 4.1 4.2 4.3 5.1 5.2 5.3 6.1 6.2 6.3Composite Composite Composite Composite Composite Raw
ScoreRaw Score
Composite Composite
601 99 99 97 99 95 98 96 94 601602 99 99 97 99 95 98 96 94 602603 99 99 97 99 95 98 96 94 603604 99 99 98 99 95 98 96 95 604605 99 99 98 99 95 98 96 95 605606 99 99 98 99 95 99 96 95 606607 99 99 98 99 95 99 96 95 607608 99 99 98 99 95 99 96 95 608609 99 99 98 99 95 99 96 95 609610 99 99 98 99 95 99 96 95 610611 99 >99 98 99 95 99 96 95 611612 99 98 99 95 99 96 95 612613 99 98 99 95 99 96 95 613614 99 98 99 95 99 97 96 614615 99 98 99 96 99 97 96 615616 99 98 99 96 99 97 96 616617 99 98 99 96 99 97 96 617618 99 98 99 96 99 97 96 618619 99 98 99 96 99 97 96 619620 99 98 99 96 99 97 96 620621 99 99 99 96 99 97 96 621622 99 99 99 96 99 97 96 622623 99 99 99 96 99 97 96 623624 99 99 99 96 99 97 96 624625 99 99 99 96 99 97 97 625626 99 99 99 96 99 97 97 626627 99 99 99 96 99 97 97 627628 99 99 99 97 99 98 97 628629 99 99 99 97 99 98 97 629630 99 99 >99 97 99 98 97 630631 99 99 97 99 98 97 631632 99 99 97 99 98 97 632
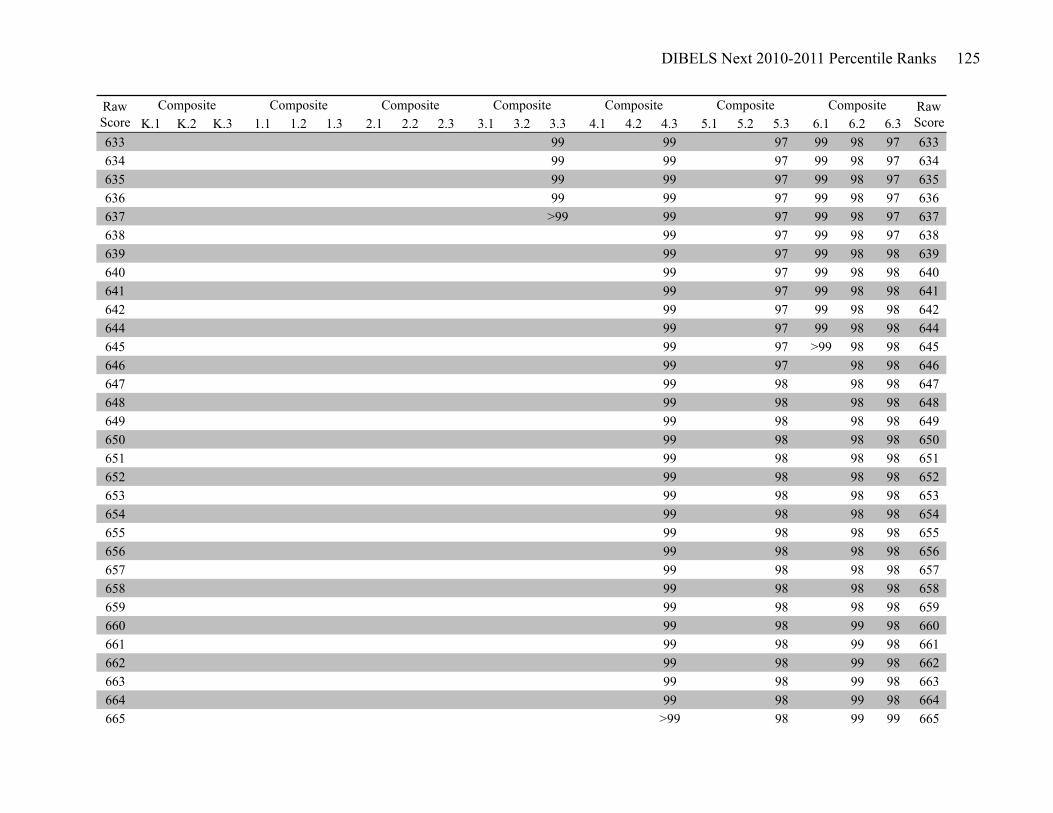
DIBELS Next 2010-2011 Percentile Ranks 125
K.1 K.2 K.3 1.1 1.2 1.3 2.1 2.2 2.3 3.1 3.2 3.3 4.1 4.2 4.3 5.1 5.2 5.3 6.1 6.2 6.3Composite Composite Composite Composite Composite Raw
ScoreRaw Score
Composite Composite
633 99 99 97 99 98 97 633634 99 99 97 99 98 97 634635 99 99 97 99 98 97 635636 99 99 97 99 98 97 636637 >99 99 97 99 98 97 637638 99 97 99 98 97 638639 99 97 99 98 98 639640 99 97 99 98 98 640641 99 97 99 98 98 641642 99 97 99 98 98 642644 99 97 99 98 98 644645 99 97 >99 98 98 645646 99 97 98 98 646647 99 98 98 98 647648 99 98 98 98 648649 99 98 98 98 649650 99 98 98 98 650651 99 98 98 98 651652 99 98 98 98 652653 99 98 98 98 653654 99 98 98 98 654655 99 98 98 98 655656 99 98 98 98 656657 99 98 98 98 657658 99 98 98 98 658659 99 98 98 98 659660 99 98 99 98 660661 99 98 99 98 661662 99 98 99 98 662663 99 98 99 98 663664 99 98 99 98 664665 >99 98 99 99 665
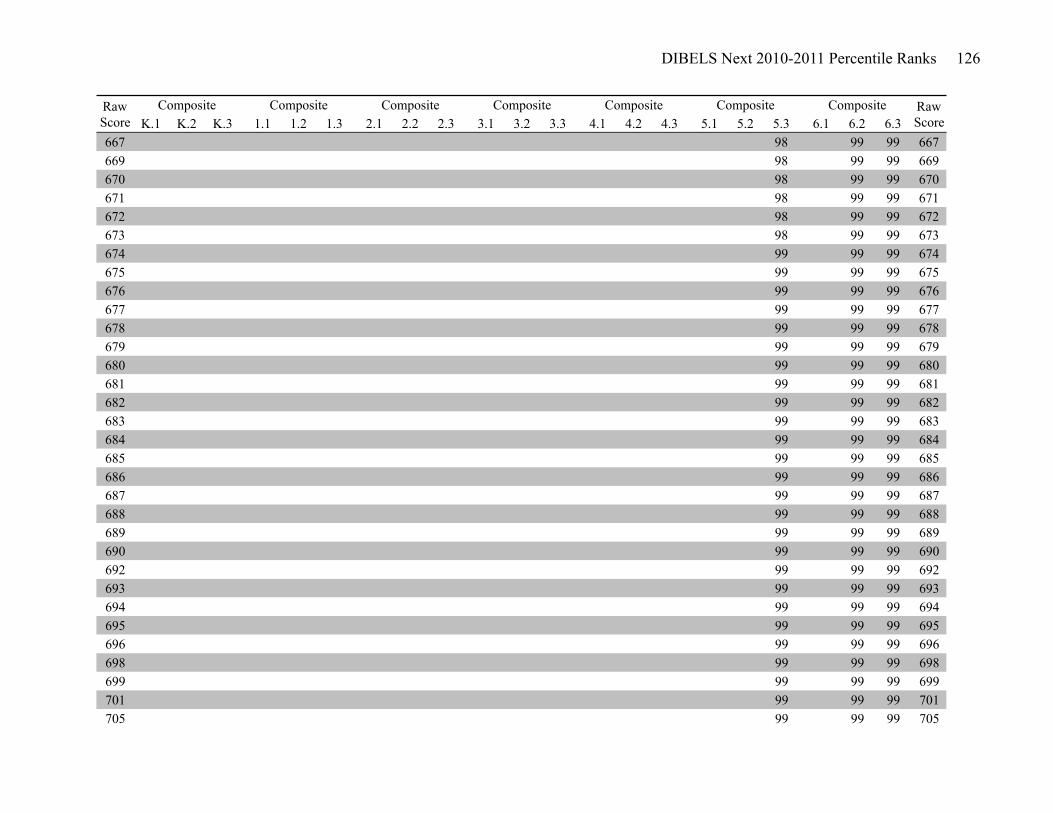
DIBELS Next 2010-2011 Percentile Ranks 126
K.1 K.2 K.3 1.1 1.2 1.3 2.1 2.2 2.3 3.1 3.2 3.3 4.1 4.2 4.3 5.1 5.2 5.3 6.1 6.2 6.3Composite Composite Composite Composite Composite Raw
ScoreRaw Score
Composite Composite
667 98 99 99 667669 98 99 99 669670 98 99 99 670671 98 99 99 671672 98 99 99 672673 98 99 99 673674 99 99 99 674675 99 99 99 675676 99 99 99 676677 99 99 99 677678 99 99 99 678679 99 99 99 679680 99 99 99 680681 99 99 99 681682 99 99 99 682683 99 99 99 683684 99 99 99 684685 99 99 99 685686 99 99 99 686687 99 99 99 687688 99 99 99 688689 99 99 99 689690 99 99 99 690692 99 99 99 692693 99 99 99 693694 99 99 99 694695 99 99 99 695696 99 99 99 696698 99 99 99 698699 99 99 99 699701 99 99 99 701705 99 99 99 705
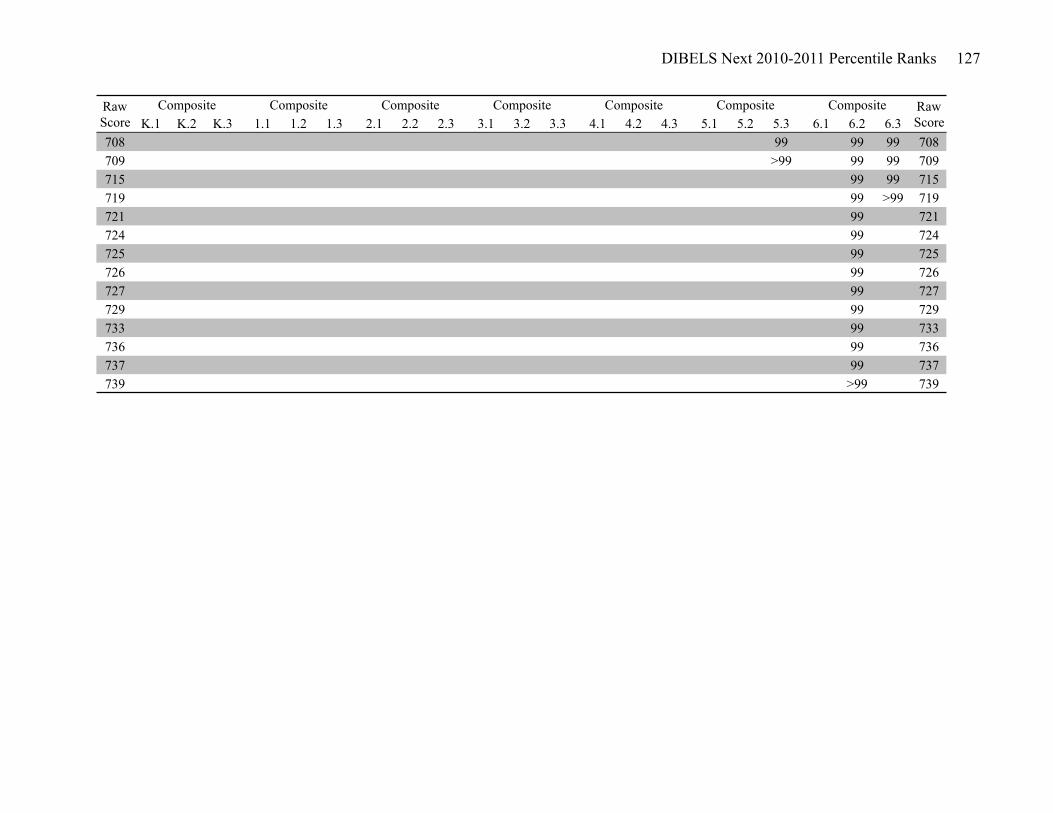
DIBELS Next 2010-2011 Percentile Ranks 127
K.1 K.2 K.3 1.1 1.2 1.3 2.1 2.2 2.3 3.1 3.2 3.3 4.1 4.2 4.3 5.1 5.2 5.3 6.1 6.2 6.3Composite Composite Composite Composite Composite Raw
ScoreRaw Score
Composite Composite
708 99 99 99 708709 >99 99 99 709715 99 99 715719 99 >99 719721 99 721724 99 724725 99 725726 99 726727 99 727729 99 729733 99 733736 99 736737 99 737739 >99 739
DIBELS Next 2010-2011 Percentile Ranks
128
References
Centers for Disease Control and Prevention (1999). Framework for program evaluation in public
health. Morbidity and Mortality Weekly Report, 48, RR-11.
Children's Educational Services. (1987). Test of reading fluency. Minneapolis, MN: Author.
Cohen, J. (1992). A power primer. Psychological Bulletin, 112(1), 155-159.
Cummings, K.D., Bousselot, T., Smith, J.M., Brown, M., Beemer, N., Kennedy, P.C., Munir-
McHill, S., Baker, S.K., & Kame’enui, E.J. (2011). Sentinel Schools in the DIBELS Data
System (2010-2011): A description of Methods (Technical Report 1103). Eugene, OR:
University of Oregon.
Cummings, K.D., Kaminski, R.A., Good, R.H., & O'Neil, M. (2011). Assessing phonemic
awareness in early kindergarten: Development and initial validation of first sound fluency
(FSF). Assessment for Effective Intervention, 36(2), 94-106.
Cummings, K.D., Otterstedt, J., Kennedy, P.C., Kame’enui, E.J. & Baker, S.K. (2011).
DIBELS Data System: 2009-2010 Percentile Ranks for DIBELS 6th Edition Benchmark
Assessments (Technical Report 1102). Eugene, OR: University of Oregon Center on
Teaching and Learning.
Dynamic Measurement Group. (2008). DIBELS 6th Edition Technical Adequacy Information
(Tech. Rep. No. 6). Eugene, OR: Author. Available: https://dibels.org.
Dynamic Measurement Group (2010). DIBELS Next Benchmark Goals and Composite Score.
Available: https://dibels.org/.
Good, R.H., & Kaminski, R.A., (with Cummings, K., Dufour-Martel, C., Petersen, K., Powell-
Smith, K., Stollar, S. & Wallin, J.) (2011). DIBELS Next assessment manual. Eugene, OR:
Dynamic Measurement Group. Available: https://dibels.org/.
DIBELS Next 2010-2011 Percentile Ranks
129
Good, R.H. & Kaminski, R.A. (2002). Dynamic Indicators of Basic early Literacy Skills. (6th
ed.). Eugene, OR: Institute for the Development of Educational Achievement. Available:
https://dibels.uoregon.edu/.
Good, R.H., Kaminski, R.A., & Dill, S. (2002). DIBELS Oral Reading Fluency. In. R.H. Good &
R.A. Kaminski (Eds.), Dynamic Indicators of Basic Early Literacy Skills (6th ed.). Eugene,
OR: Institute for the Development of Educational Achievement. Available:
https://dibels.uoregon.edu/.
Good, R.H., Powell-Smith, K.A., & Kaminski, R.A. (2011, February). Developing benchmark
goals and cut-points for risk: Odds of achieving subsequent reading goals. Paper presented at
the 19th Annual Pacific Coast Research Conference, San Diego, CA.
Good, R. H., Wallin, J. U., Simmons, D. C., Kame'enui, E. J., & Kaminski, R. A. (2002). System-
wide Percentile Ranks for DIBELS Benchmark Assessment (Technical Report No. 9).
Eugene, OR: University of Oregon. Available: https://dibels.uoregon.edu.
Halls, S. B. & Hanson, J. (2000). Average height and weight charts. Retrieved August 31, 2011
from http://www.halls.md/chart/height-weight.htm
Kaminski, R.A., Baker, S.K., Chard, D., Clarke, B., & Smith, S. (2006). Final report: Reliability,
validity, and sensitivity of Houghton Mifflin Early Growth Indicators (Technical Report).
Eugene, OR: Dynamic Measurement Group and Pacific Institutes for Research.
Kaminski, R.A. & Good, R.H. (1996). Toward a technology for assessing early basic literacy
skills. School Psychology Review, 25, 215-217.
DIBELS Next 2010-2011 Percentile Ranks
130
Marston, D., & Magnusson, D. (1988). Curriculum-based measurement: District level
implementation. In J. Graden, J. Zins, & M. Curtis (Eds.), Alternative educational delivery
systems: Enhancing instructional options for all students (pp. 137-172). Washington, DC:
National Association of School Psychologists.
McGraw, K.A. (2006). Identifying valid measures of reading comprehension: comparing the
validity of oral reading fluency, retell fluency, and maze procedures (Unpublished doctoral
dissertation). University of Oregon: Eugene, OR.
National Center for Education Statistics (2011). Common core of data: Public
elementary/secondary school universe survey 2009-10 (Version 1a) [Data file and
documentation]. Available: http://nces.ed.gov/ccd/pubschuniv.asp.
National Center for Health Statistics & National Center for Chronic Disease Prevention and
Health Promotion (2000). 2 to 20 years: Boys stature-for-age and weight-for-age percentiles.
Retrieved August 31, 2011 from
http://www.cdc.gov/growthcharts/data/set1clinical/cj41l021.pdf
National Reading Panel (2000). Teaching children to read: An evidence-based assessment of the
scientific research literature on reading and its implications for reading instruction. Reports
of the subgroups. Washington, DC: National Institute of Child Health and Human
Development. Available: http://www.nationalreadingpanel.org
Powell-Smith, K.A., Good, R.H., & Atkins, T. (2010) DIBELS next oral reading fluency
readability study (Technical Report No. 7). Eugene, OR: Dynamic Measurement Group.
Salvia, J. & Ysseldyke, J. (2004). Assessment in special and inclusive education. (9th ed.).
Boston: Houghton Mifflin Company.
DIBELS Next 2010-2011 Percentile Ranks
131
Sattler, J. (2001). Assessment of children: Cognitive applications. (4th ed.). San Diego, CA:
Jerome M. Sattler, Publisher, Inc.
Smith, J.M., Cummings, K.D., Bousselot, T., Beemer, N., Baker, S.K., & Kame'enui, E.J.
(2011). Assessment Practices of Schools Using the DIBELS Data System: Results from a
Nationally Representative Survey. Manuscript in preparation.
University of Oregon Center on Teaching and Learning (n.d.) DIBELS data system description
and sample reports. Retrieved from https://dibels.uoregon.edu/.
University of Oregon Center on Teaching and Learning (n.d.) DIBELS measures. Retrieved from
https://dibels.uoregon.edu