technical report 00-08 - nagradefault... · technical report 00-08 7) 8) grimsel test site...
TRANSCRIPT

nagra
TECHNICALREPORT 00-08
A. Möri, M. Mazurek, M. Adler, M. Schild, S. Siegesmund, A. Vollbrecht, K. Ota, T. Ando,W.R. Alexander, P.A. Smith, P. Haag, Ch. Bühler
May 2003
National Cooperative for theDisposal of Radioactive Waste
Hardstrasse 73, CH-5430 Wettingen/Switzerland, Telephone +41-56-437 11 11
Grimsel Test SiteInvestigation Phase IV (1994-1996)
The Nagra-JNC in situ study of safetyrelevant radionuclide retardationin fractured crystalline rock
IV: The in situ study of matrix porosity in the vicinity of a water conducting fracture


National Cooperative for theDisposal of Radioactive Wastenagra
Hardstrasse 73, CH-5430 Wettingen/Switzerland, Telephone +41-56-437 11 11
1)
2)
3)
4)
5)
6)
Geotechnisches Institut AG, Bern, Switzerland
GGWW (Rock-Water Interaction Group), University of Berne, Switzerland
Institut für Geologie und Dynamik der Lithosphäre, University of Göttingen, Germany
JNC (Japan Nuclear Cycle Development Institute), Tono Geoscience Centre, Gifu, Japan
Nagra, Wettingen, Switzerland
SAM (Safety Assessment Management), Edinburgh, Scotland
SIKA AG, Zürich, Switzerland
Solexperts AG, Schwerzenbach, Switzerland
1) 2) 2) 3)A. Möri , M. Mazurek , M. Adler , M. Schild , 3) 3) 4) 4)S. Siegesmund , A. Vollbrecht , K. Ota , T. Ando ,5) 6) 7) 8)W.R. Alexander , P.A. Smith , P. Haag , Ch. Bühler
May 2003
TECHNICALREPORT 00-08
7)
8)
Grimsel Test SiteInvestigation Phase IV (1994-1996)
The Nagra-JNC in situ study of safetyrelevant radionuclide retardationin fractured crystalline rock
IV: The in situ study of matrix porosity in the vicinity of a water conducting fracture

This report was prepared on behalf of Nagra. The viewpoints presented and conclusions reached are those of
the author(s) and do not necessarily represent those of Nagra.
"Copyright © 2003 by Nagra, Wettingen (Switzerland) / All rights reserved.
All parts of this work are protected by copyright. Any utilisation outwith the remit of the copyright law is unlawful
and liable to prosecution. This applies in particular to translations, storage and processing in electronic
systems and programs, microfilms, reproductions, etc."
ISSN 1015-2636

FOREWORD
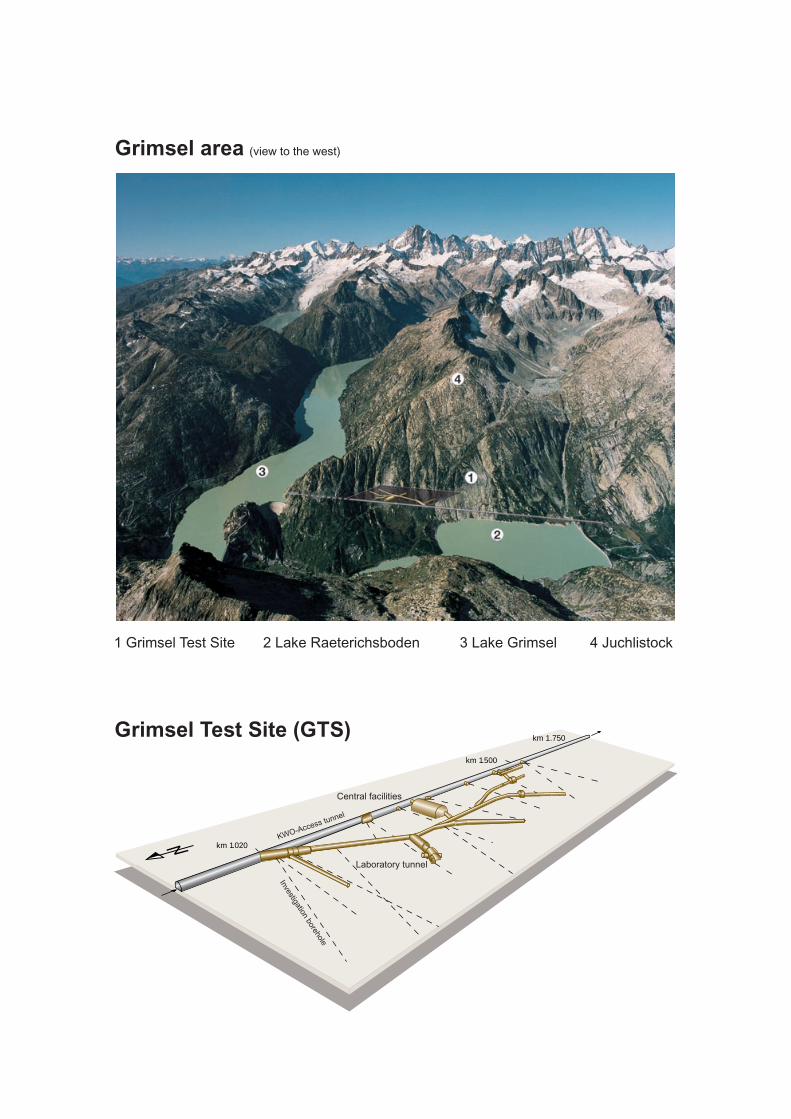
Concepts for the disposal of radioactive waste in geological formations depend crucially on athorough knowledge of relevant processes in the host rock and on an understanding of the wholerepository system, comprising both engineered and geological barriers. The Grimsel Test Site(GTS) is an underground rock laboratory which is used to investigate many of these processesin hard, fractured rocks. It has been operated since 1984 by the Swiss National Cooperative forthe Disposal of Radioactive Waste (NAGRA).
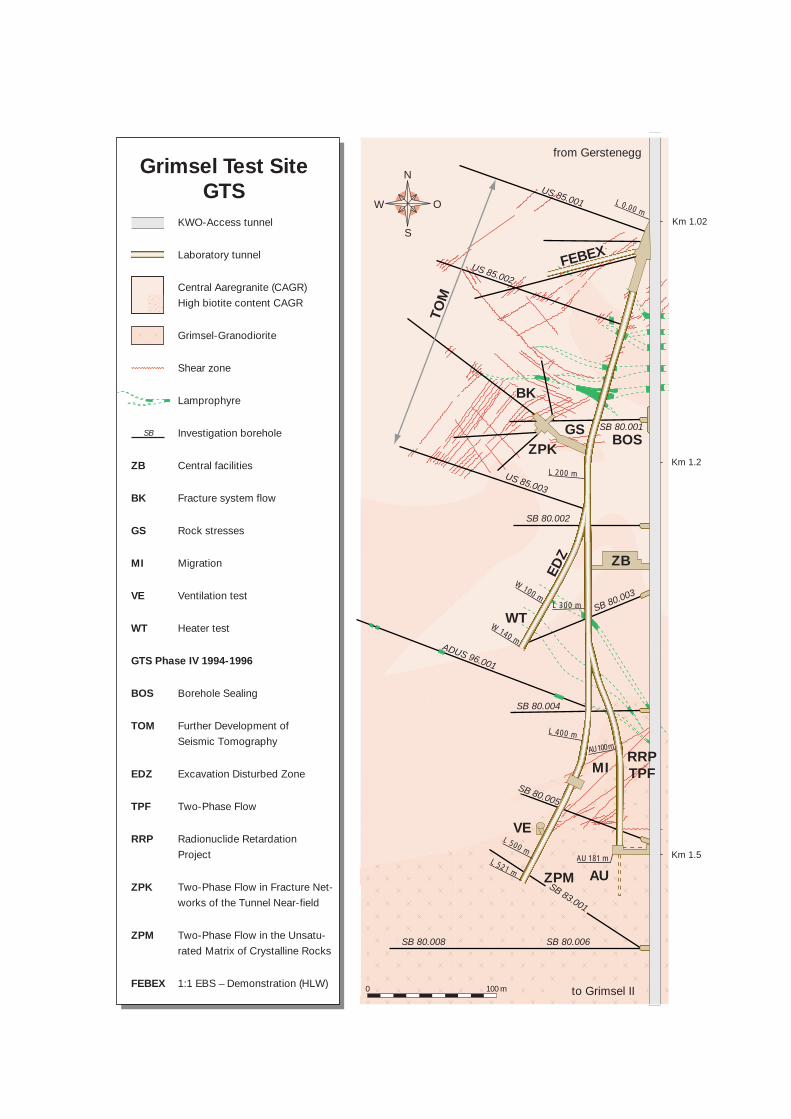
The laboratory is located in the crystalline rock of the Central Aare Massif, 450 m below theeastern flank of the Juchlistock at an altitude of 1730 m asl. It is reached via a 1200 m longhorizontal access tunnel, operated by the hydro-electric power company KWO. The layout ofthe tunnels that comprise the GTS allowed the establishment of a radiation controlled zone(IAEA type C in 1990, being upgraded to Type B in 1996) in which experiments with radio-active tracers are carried out. With increasing experience in the implementation of in situexperiments, improved process understanding and more advanced repository concepts, theexperimental programmes at the GTS have gradually become more complex and more directlyrelated to open questions defined by performance assessors or by regulatory bodies. Demon-stration of disposal concepts by performing large- or full-scale, long-term experiments has alsobecome a key aspect of investigations in the rock laboratory. The GTS Phase IV, 1994 – 1996,was initiated in close co-operation with a number of international partner organisations. Theperformed programmes focused on the characterisation and conceptualisation of the tunnelnearfield, geophysical investigations and experiments related on in situ radionuclide retardation.
Within the current investigation phase (Phase V; 1997 – 2002) seven experimental programmesand projects are included (see www.grimsel.com for details).
Within GTS Phase IV, the Nagra-JNC Radionuclide Migration Programme (RMP) exam-ined the behaviour of a large suite of radionuclides in the geosphere. The ConnectedPorosity project (CP), which began in 1996 and continued until 2000, is an integral part ofRMP. This report summarises the results of the work. The main aim of CP was to examinethe magnitude and extent of connectivity of the rock matrix porosity in situ. To this end, anacrylic resin was specially developed for rock matrix impregnation and methods to recoverthe impregnated rock matrix with the minimum of disturbance were tested in the GTS and inJNC's Kamaishi In Situ Test Site (KTS) in Japan. Three independent techniques (includingthe application of a novel porosimetry method) were then applied to the samples to assessthe extent of in situ pore connectivity and the implications of the results to calculatedradionuclide retardation in the geosphere were assessed.
This report is one of four Nagra Technical Reports (NTBs) on the RMP, that includes theRadionuclide Retardation Project (RRP) methodology (ALEXANDER et al. 2001b), theRRP final report (MÖRI et al. 2001), and the Migration Experiment final report (SMITH etal. 2001), all of which will be synthesised in ALEXANDER et al. (2002).
VORWORT
Bei Lagerkonzepten für die Entsorgung radioaktiver Abfälle in geologischen Formationen sindeine vertiefte Kenntnis der relevanten Prozesse im Wirtgestein sowie ein Verständnis desgesamten Lagersystems mit den technischen und geologischen Barrieren von entscheidenderBedeutung. Das Felslabor Grimsel (FLG) ist ein standortunabhängiges Felslabor, in welchemzahlreiche dieser Prozesse in geklüftetem Festgestein untersucht werden. Es wird seit 1984 vonder Nagra (Nationale Genossenschaft für die Lagerung radioaktiver Abfälle) betrieben.
Das FLG befindet sich im Kristallingestein des Zentralen Aarmassives 450 m unterhalb der Ost-flanke des Juchlistocks auf einer Höhe von 1730 m ü.M. und kann durch einen 1200 m langenhorizontalen Zugangsstollen der Kraftwerke Oberhasli AG (KWO) erreicht werden. 1990 wurdein einem Stollenabschnitt des FLG eine kontrollierte Zone (IAEA Typ B 1990, höher gestuft aufTyp C 1996) für Versuche mit radioaktiven Tracern eingerichtet. Mit zunehmender Erfahrungbei der Durchführung von In-situ-Feldversuchen und verbessertem Systemverständnis der wie-ter entwickelten Lagerkonzepte, verlagerten sich die experimentellen Programmschwerpunktehin zu komplexen, direkt auf die Anforderungen der Sicherheitsanalyse und Behörden ausge-richteten Versuche. Langzeit-Demonstrationsversuche in grösserem oder Originalmassstab ge-wannen bei den durchgeführten Untersuchungen im Felslabor zunehmend an Bedeutung. DieFLG Untersuchungsphase IV (1994 – 1996) wurde in enger Zusammenarbeit mit einer Anzahlinternationaler Partnerorganisationen geplant. Die durchgeführten Versuchsprogramme konzen-trierten sich auf die Charakterisierung und Konzeptualisierung des Tunnelnahfeldbereichs mitgeophysikalischen Methoden und Versuchen zur Radionuklidrückhaltung.
Die jetzige Untersuchungsphase (Phase V, 1997 – 2002) umfasst sieben Versuchsprogrammeund -projekte (siehe auch www.grimsel.com für Einzelheiten).
Innerhalb der FLG Phase IV wurde mit dem Nagra-JNC Radionuklid-Migrationsprogramm(Radionuclide Migration Programme, RMP) das Verhalten einer Reihe von Radionuklidenin der Geosphäre untersucht. Das Projekt 'Verbundene Porosität' (Connected Porosityproject, CP), ist ein eigenständiges Teilprojekt von RMP, das 1996 begonnen und bis 2000fortgeführt wurde. Der vorliegende Bericht fasst die Ergebnisse dieser Arbeiten zusammen.Die Hauptzielsetzung von CP war die In-situ-Untersuchung der Grösse und des Verbin-dungsgrads der Porosität der Gesteinsmatrix. Für die Imprägnierung der Gesteinsmatrixwurde speziell ein Acrylharz entwickelt und es wurden Methoden für die Gewinnung vonmöglichst wenig gestörten Gesteinsmatrixproben im FLG und am Kamaishi In situ-Test-standort (KTS) von JNC in Japan getestet. Bei den auf diese Weise gewonnenen Probenwurden drei unabhängige Techniken (inklusive der Anwendung eines neuartigen Porosi-metrieverfahrens) angewendet, um das Ausmass der In-situ-Probenverbindung und die Aus-wirkungen dieser Resultate auf die berechnete Radionuklidretardierung in der Geosphäreabzuschätzen/zu bewerten.
Der vorliegenden Bericht ist Teil einer Reihe von vier Nagra Technischen Berichten (NTBs)zum Thema RMP, zusammen mit der Methodik des Radionuklidretardierungsprojekts(Radionuclide Retardation Project, RRP; ALEXANDER et al. 2001b), dem RRP Schluss-bericht (MÖRI et al. 2001) und dem Schlussbericht zum Migrationsversuch (SMITH et al.2001), deren Synthese in ALEXANDER et al. (2002) dargelegt ist.

PRÉFACE
Les concepts élaborés pour le dépôt de déchets radioactifs dans des formations géologiquesdépendent fondamentalement d'une connaissance approfondie des processus significatifs qui ontlieu dans la roche d'accueil et sur la compréhension du système de dépôt dans son ensemble,comprenant à la fois les barrières techniques et les barrières géologiques. Le laboratoire sou-terrain du Grimsel (Grimsel Test Site GTS) est un laboratoire souterrain de première générationdestiné à étudier nombre de processus dans les roches consolidées fracturées. Il est en fonctiondepuis 1984, dirigé par la NAGRA, la Société coopérative nationale suisse pour l'entreposage dedéchets radioactifs.
Le laboratoire est situé dans les roches cristallines du massif central de l'Aar, à une altitude de1'730 m s.m., 450 m sous le flanc est du Juchlistock. On l'atteint par une galerie d'accès horizon-tale longue de 1200 m, exploitée par l'entreprise d'électricité hydraulique KWO. La dispositiondes galeries qui constituent le GTS a permis l'installation en 1990 d'une zone de radiation con-trôlée (AIEA type B) dans laquelle sont conduites les expériences avec des traceurs radioactifs.Avec une expérience croissante dans la mise en œuvre d'essais in situ, la compréhension accruedes processus et des concepts de dépôts plus avancés, les programmes expérimentaux conduitsau GTS ont gagné en complexité et se sont calqués plus directement sur les questions à éluciderposées par les spécialistes en évaluation de performance et par les autorités compétentes. L'essaià grande échelle ou en vraie grandeur de concepts de dépôt, ainsi que des essais à long terme,sont également devenus un aspect clé des investigations au laboratoire souterrain. La phase IVdu GTS, conduite de 1994 à 1996, a été mise en œuvre en coopération étroite avec des organisa-tions partenaires internationales. Les programmes ont été focalisés sur la caractérisation et laconceptualisation du champ proche du tunnel, sur des recherches géophysiques et sur des expé-riences liées à l'étude du retardement in situ des radioéléments.
La phase actuelle des investigations (phase V, 1997 – 2002) comprend sept programmes et pro-jets expérimentaux (voir www.grimsel.com pour le détail).
Au cours de la phase IV du GTS, le programme d'étude de la migration des radioéléments(Radionuclide Migration Programme RMP), conduit conjointement par la Nagra et le JNC, aétudié le comportement de toute une série de radioéléments dans la géosphère. Le projetd'étude de la porosité interconnectée (Connected Porosity project CP), commencé en 1996 etpoursuivi jusqu'en 2000, fait partie intégrante du RMP. Le présent rapport résume lesrésultats de ces travaux. Le CP avait comme objectif principal d'examiner in situ l'ampleuret l'extension de l'interconnection des pores dans la matrice rocheuse. Une résine acrylique aspécialement été développée dans ce but pour l'imprégnation de la matrice rocheuse, et on atesté au GTS et au site de test in situ de Kamaishi (KTS) du JNC au Japon des méthodespour la récupération de la roche imprégnée avec le moins de dommage possible. Troistechniques indépendantes ont ensuite été appliquées aux échantillons pour évaluerl'extension in situ de l'interconnection des pores, et les conséquences des résultats sur lecalcul du retardement des radioéléments dans la géosphère ont été évaluées.
Le présent rapport est un des quatre rapports techniques de la Nagra (Nagra TechnicalReports NTB) sur le RMP. Cet ensemble comprend aussi un rapport (ALEXANDER et al.2001b) sur la méthodologie du projet de retardement des radioéléments (RRP, RadionuclideRetardation Project), le rapport final du RRP (MÖRI et al. 2001), et le rapport final surl'expérience de migration (Migration Experiment, SMITH et al. 2001). Tous ces rapportsseront présentés sous forme synthétique dans ALEXANDER et al. (2002).

Location of Nagra’s underground test facility at the Grimsel Pass in the Central Alps(BerneseAlps) of Switzerland
50 km
ZurichZurich
LucerneLucerne
GrimselGrimsel
BerneBerne
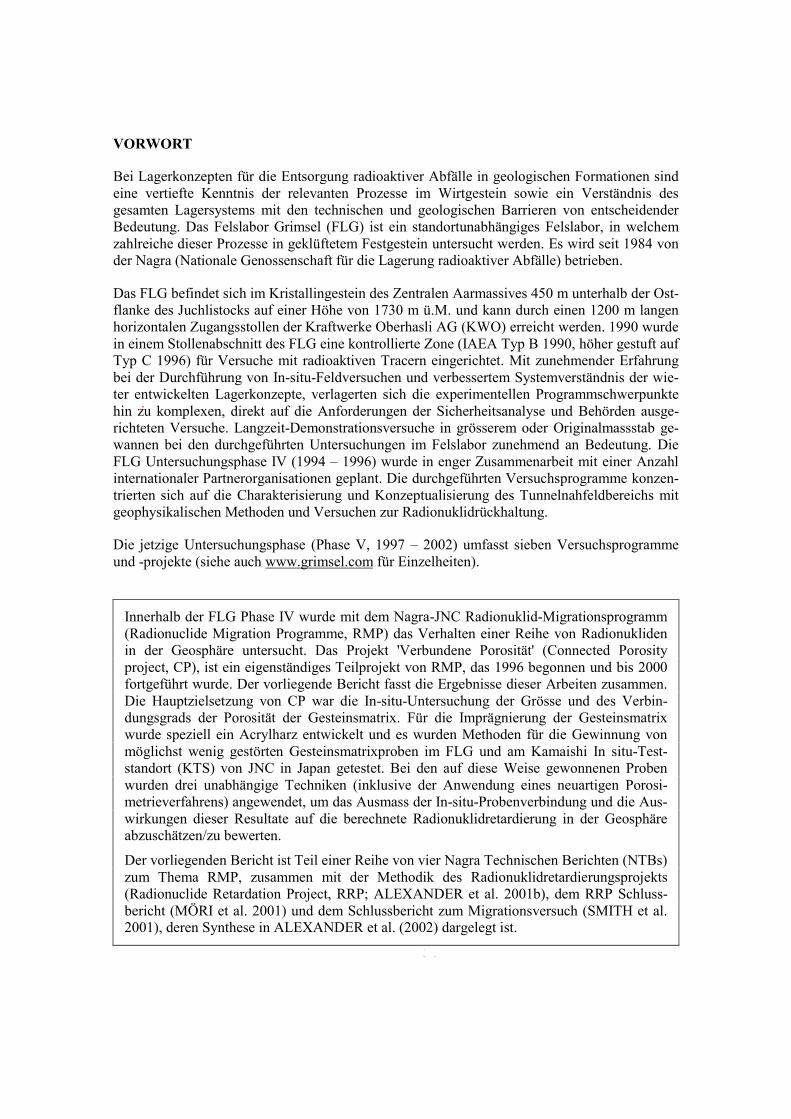
Grimsel area (view to the west)
Grimsel Test Site (GTS)
1 Grimsel Test Site 2 Lake Raeterichsboden 3 Lake Grimsel 4 Juchlistock
km 1.020
km 1.500
km 1.750
Central facilities
Laboratory tunnel
KWO-Access tunnel
Investigation borehole
US 85.001
US 85.002
US 85.003
SB 80.001
SB 80.002
SB 80.004
SB 80.006SB 80.008
SB 83.001
SB 80.005
SB 80.003
ADUS 96.001
Km 1.2
Km 1.02
Km 1.5
GSZPK
TOM
BOS
EDZ
RRPTPF
BK
ZB
FEBEX
WT
MI
AUZPM
VE
L 521 m
L 500 m
L 400 m
L 300 m
W 100 m
W 140 m
L 200 m
L 0.00 m
AU 100 m
AU 181 m
0 100 m
SB
N
S
W O
Grimsel Test SiteGTS
KWO-Access tunnel
Laboratory tunnel
Central Aaregranite (CAGR)
High biotite content CAGR
Grimsel-Granodiorite
Shear zone
Lamprophyre
Investigation borehole
ZB Central facilities
BK Fracture system flow
GS Rock stresses
MI Migration
VE Ventilation test
WT Heater test
GTS Phase IV 1994-1996
BOS Borehole Sealing
TOM Further Development of
Seismic Tomography
EDZ Excavation Disturbed Zone
TPF Two-Phase Flow
RRP Radionuclide Retardation
Project
ZPK Two-Phase Flow in Fracture Net-
works of the Tunnel Near-field
ZPM Two-Phase Flow in the Unsatu-
rated Matrix of Crystalline Rocks
FEBEX 1:1 EBS – Demonstration (HLW)
from Gerstenegg
to Grimsel II

I NAGRA NTB 00-08
SUMMARY
Matrix porosity is a key parameter for the evaluation of various scenarios in the estimation ofradionuclide retardation in the geosphere. The amount, shape and size of the pores certainlyinfluence radionuclide retardation, but the degree of connectivity (and therefore the accessibilityfor contaminants to these pores) must also be taken into consideration.
To date, most assessments of the role of matrix porosity have generally neglected (or haveassessed the effects only qualitatively) to quantify the influence of sample disturbance on thegeometry and the connectivity of pores, and its impact on the evaluation of total porosity, geo-physical and hydraulical parameters. This being the case, this study was initiated to characterisethe connectivity of in situ matrix porosity, to quantify the influence of sample preparation ontotal porosity and to assess the influence of the results on transport models used for performanceassessment purposes.
A new technique for in situ impregnation of the diffusion-accessible rock matrix has beenjointly developed by Nagra and JNC1 and successfully applied to the granodiorite matrix behinda water conducting feature at Nagra's Grimsel Test Site (GTS) in Switzerland and JNC'sKamaishi In Situ Test Site (KTS) in Japan. After excavating the conserved rock matrix by over-coring, a large programme of petrographical, petrophysical and chemical analysis was applied tosub-samples taken from the core material outwith any disturbed zone in the rock (e.g. theinfluence of the injection borehole to the surrounding rock matrix, the tunnel excavationdisturbed zone etc.).
The study revealed that the structural and mineralogical heterogeneity in the undeformed matrixof the Grimsel granodiorite is significant and strongly influences type and amount of thedominating porosity. Four different pore types could be distinguished: grain boundary pores,sheet silicate pores, solution pores and microfractures. All these pore types represent aconnected network which was accessible for resin within the experimental time scales. Seismicvelocity measurements (Vp) on in situ and laboratory-impregnated rock samples as a function ofconfining pressure, water saturation and spatial direction revealed constraints on the distinctionbetween in situ matrix pores and artificially induced pores. The comparison of conventionalporosity determination techniques with a newly developed method to chemically analyse theamount of resin filled pores showed that conventional laboratory determinations on rocksamples overestimate the matrix porosity by a factor of 2 to 2.5.
To define the implications of these new data on the efficiency of geosphere retardation of radio-nuclides released from a repository near-field, scoping calculations based on two existingrepository performance assessments were carried out. These revealed that the calculations ofradionuclide retardation are relatively insensitive to the magnitude of both the porosity and thepore diffusion coefficient (in the ranges observed in typical repository host rocks). However, thedepth of connectivity of the porosity does play an important role, potentially leading to a signifi-cant increase in the time of radionuclide breakthrough to the biosphere and to a significantdecrease in peak activity of the radionuclides concerned.
The results of this study indicate that, for the two rock types studied here, connected porositycan be shown to exist at significant depths (at least up to several metres) into the matrix behindwater conducting features in the rock. Although this work must be repeated in other rock types
1 The Japan Nuclear Cycle Development Institute (previously PNC, Power Reactor and Nuclear Fuel Development
Corporation).

NAGRA NTB 00-08 II
(and eventually in repository host rocks) to obtain statistically meaningful results, the clearimplications are that current assumptions about the retardation properties of the host rock matrixare over-conservative and probably need to be re-evaluated in future repository performanceassessments. In addition, the results highlight the dangers of simply transferring laboratory-derived data on geosphere properties to in situ conditions.
III NAGRA NTB 00-08
ZUSAMMENFASSUNG
Die Matrixporosität ist ein Schlüsselparameter für die Bewertung verschiedener Szenarien beider Abschätzung der Radionuklidrückhaltung in der Geosphäre. Die Anzahl, Form und Grösseder Poren beeinflusst direkt die Radionuklidrückhaltung, der Verbindungsgrad dieser Poren(und folglich die Zugänglichkeit für Schadstoffe zu solchen Poren) muss jedoch ebenfalls inBetracht gezogen werden.
Bisher wurde bei der Bewertung der Rolle der Matrixporosität in der Sicherheitsanalysemeistens die Quantifizierung des Einflusses gestörter Proben auf die Geometrie und den Verbin-dungsgrad der Poren und deren Auswirkung auf die Abschätzung der Gesamtporosität sowie dergeophysikalischen und hydraulischen Parameter generell vernachlässigt (oder die Effekte aus-schliesslich qualitativ bewertet). Daher wurde die folgende Studie initiiert, mit der Zielsetzung,die Verbundenheit der In-Situ-Matrixporosität zu charakterisieren, den Einfluss der Probenauf-arbeitung auf die Gesamtporosität zu quantifizieren und den Einfluss der Resultate auf Trans-portmodelle, die bei der Sicherheitsanalyse verwendet werden, zu bewerten.
Für die In-situ-Imprägnierung der für die Diffusion zugänglichen Gesteinsmatrix wurde eineneue Technik gemeinsam von der Nagra und JNC2 entwickelt und erfolgreich im Bereich derGranodioritmatrix hinter einer wasserführenden Kluft im Felslabor Grimsel (FLG) der Nagra inder Schweiz und am Kamaishi In-Situ-Teststandort (KTS) von JNC in Japan angewendet.Nachdem die konservierte Gesteinsmatrix überbohrt worden war, wurde ein umfangreichespetrographisches, petropysikalisches und chemisches Untersuchungsprogramm an Proben ausallen gestörten Gesteinsbereichen durchgeführt (z. B. die vom Injektionsbohrloch beeinflussteumgebende Gesteinsmatrix, die vom Tunnelausbruch gestörte Zone etc.).
Die Ergebnisse dieser Studie ergaben, dass die strukturelle und mineralogische Heterogenität inder undeformierten Matrix des Grimsel-Granodiorits wichtig ist und den Typ und die Grösse dervorherrschenden Porosität beeinflusst. Es konnten vier verschiedene Porentypen unterschiedenwerden: Korngrenzenporen, Schichtsilikatporen, Lösungsporen und Mikroklüfte. Sämtliche die-ser Porentypen stellen ein verbundenes Netzwerk dar, das innerhalb des experimentellen Zeit-rahmens für Harz zugänglich ist. Messungen der seismischen Geschwindigkeit (Vp) als Funk-tion des Porenwasserdrucks, der Wassersättigung und Raumrichtung an in situ und im Laborimprägnierten Gesteinsproben ergaben Einschränkungen bei der Unterscheidung zwischen In-situ-Matrixporen und künstlich verursachten Poren. Der Vergleich der konventionellen Techni-ken zur Bestimmung der Porosität mit einer neu entwickelten Methode einer chemischenAnalyse von Harz-erfüllten Poren zeigte, dass konventionelle Laborbestimmungen an Gesteins-proben die Matrixporosität um einen Faktor 2 bis 2.5 überschätzen.
Um die Auswirkungen dieser neu gewonnenen Daten auf das Rückhaltevermögen von auseinem Lagernahfeld freigesetzten Radionukliden in der Geosphäre zu definieren, wurden Über-schlagsrechnungen basierend auf zwei bestehenden Sicherheitsanalysen für ein Tiefenlagerdurchgeführt. Diese ergaben, dass die Berechnung der Radionuklidrückhaltung relativ unem-pfindlich ist gegenüber der Grössenordnung von sowohl der Porosität als auch des Porendiffu-sionskoeffizienten (in den für typische Wirtgesteine beobachteten Wertebereichen). Jedochspielt der Grad der verbundenen Porosität eine wichtige Rolle und führt möglicherweise zueiner deutlichen Zunahme der Radionukliddurchbruchszeit in die Biosphäre und zu einemdeutlichen Rückgang der Peakaktivität der betroffenen Radionuklide.
2 The Japan Nuclear Cycle Development Institute (früher PNC, Power Reactor and Nuclear Fuel Development
Corporation).

NAGRA NTB 00-08 IV
Die Ergebnisse der vorliegenden Studie an den beiden untersuchten Gesteinstypen zeigen, dasseine verbundene Porosität in der Matrix hinter wasserführenden Klüften im Gestein in bestimm-ten Tiefenbereichen existiert (zumindest bis in einigen Metern Tiefe). Obwohl diese Arbeiten inanderen Gesteinstypen (und schliesslich auch in Wirtgesteinen) wiederholt werden müssen, umstatistisch aussagekräftige Ergebnisse zu erhalten, kann aus den bisherigen Ergebnissen ge-schlossen werden, dass die gängigen Annahmen zu den Eigenschaften der Radionuklidrück-haltung der Wirtgesteinsmatrix zu konservativ sind und daher in künftigen Sicherheitsanalysenneu evaluiert werden müssen. Zusätzlich weisen die Ergebnisse auf die Gefahren einer simplenÜbertragung von Labordaten bezüglich der Eigenschaften der Geosphäre auf In-situ-Bedingun-gen hin.

V NAGRA NTB 00-08
RÉSUMÉ
La porosité de matrice est un paramètre clé lors de l'évaluation de différents scénarios pour l'es-timation du retardement de radionucléides dans la géosphère. La quantité, la forme et la gran-deur des pores influencent certainement le retardement des radioéléments, mais le degré d'inter-connection entre les pores (et par là l'accessibilité des contaminants aux pores) doit aussi êtrepris en considération.
Jusqu'ici, la plupart des études sur le rôle de la porosité de matrice se sont passées de quantifierl'influence (ou l'ont évaluée seulement qualitativement) du dérangement de l'échantillon sur lagéométrie et l'interconnection des pores, ainsi que son impact sur l'estimation de la porositétotale et des paramètres géophysiques et hydrauliques. C'est pourquoi cette étude a été mise enplace, avec pour objectifs la caractérisation in situ du degré d'interconnection de la porosité dematrice, la quantification de l'influence de la préparation de l'échantillon sur la porosité totale,enfin l'estimation de l'impact des résultats sur les modèles de transport utilisés pour les évalua-tions de performance.
Une nouvelle technique d'imprégnation in situ de la matrice rocheuse accessible à la diffusion aété développée en commun par la Nagra et le JNC3, et mise en œuvre avec succès deux types degranodiorite, l'une située derrière une structure aquifère au laboratoire souterrain du Grimsel(GTS) en Suisse, l'autre au site de test in situ de Kamaishi (KTS) du JNC au Japon. Après avoirextrait la matrice rocheuse intacte par surcarottage, un vaste programme d'analyses pétro-graphiques, pétrophysiques et chimiques a été conduit sur des échantillons du matériel carottéhors de toute zone endommagée de la matrice rocheuse (p. ex. par le forage d'injection ou parl'excavation du tunnel).
L'étude a montré que l'hétérogénéité minéralogique et structurale de la matrice non déformée dela granodiorite du Grimsel est significative et qu'elle influence fortement le type et le déve-loppement de la porosité dominante. On a pu distinguer quatre types différents de pores: despores aux limites de grains, des pores de feuillets silicatés, des pores de dissolution et des poresde microfractures. Tous ces types de pores présentent un réseau interconnecté accessible à larésine en des laps de temps comme ceux des expérimentations. Des mesures de vitesse sismique(Vp) effectuées sur la roche imprégnée in situ et sur des échantillons au laboratoire, en fonctionde la pression de confinement, de la saturation en eau et de l'orientation spatiale ont révélé unedistinction nécessaire entre les pores de la matrice in situ et les pores induits artificiellement. Lacomparaison entre les techniques conventionnelles de détermination de la porosité et la nouvelleméthode consistant à analyser chimiquement la quantité de résine remplissant les pores a montréque les méthodes conventionnelles surestiment la porosité de matrice d'un facteur 2 à 2.5.
Afin d'évaluer les implications de ces nouvelles données sur l'efficacité du retardement dans lagéosphère des radioéléments relâchés au voisinage d'un dépôt, on a effectué des calculs de por-tée sur les évaluations de performance existantes pour deux dépôts. Ils ont montré que le calculdu retardement des radioéléments est relativement peu influencé par l'ampleur et de la porositéet du coefficient de diffusion dans les pores (pour les fourchettes de valeur observées dans lesroches d'accueil typiques pour des dépôts). Toutefois, la distance de pénétration de la porositéinterconnectée joue un rôle important, car une plus grande distance peut conduire à un retardsignificatif du moment d'apparition des radioéléments dans la biosphère et à une diminutionsignificative du pic d'activité des radioéléments concernés.
3 The Japan Nuclear Cycle Development Institute (autrefois PNC, Power Reactor and Nuclear Fuel Development
Corporation).

NAGRA NTB 00-08 VI
Cette étude montre que pour les deux types de granodiorites étudiées la porosité interconnectéepeut être présente dans la matrice à des distances significatives (au moins plusieurs mètres) desstructures aquifères. Bien qu'il faille encore répéter de telles investigations sur d'autres types deroche pour obtenir des résultats statistiquement significatifs, on peut déjà relever que les hypo-thèses actuellement admises sur les propriétés de retardement dans la matrice des roches d'ac-cueil sont trop prudentes (pessimistes) et devront probablement être ajustées pour les futuresévaluations de performance de dépôts. En outre, les résultats mettent en lumière le danger qu'il ya à simplement transposer des résultats de laboratoire sur les propriétés de la géosphère aux con-ditions in situ.

VII NAGRA NTB 00-08
TABLE OF CONTENTS
SUMMARY .................................................................................................................................... I
ZUSAMMENFASSUNG.............................................................................................................III
RÉSUMÉ ..................................................................................................................................V
TABLE OF CONTENTS...........................................................................................................VII
LIST OF TABLES ........................................................................................................................X
LIST OF FIGURES..................................................................................................................... XI
1 INTRODUCTION .................................................................................................... 1
1.1 Background to the project......................................................................................... 1
1.2 Radionuclide retardation in the rock matrix ............................................................. 2
1.3 The Connected Porosity project (CP) ....................................................................... 3
2 DEVELOPMENT OF AN IN SITU IMPREGNATION TECHNIQUE FORCRYSTALLINE ROCK MATRICES...................................................................... 5
2.1 Aims and procedures ................................................................................................ 5
2.2 Design calculations and hydrotesting ....................................................................... 6
2.3 Evaluation of resin and injection techniques ............................................................ 8
2.3.1 General characteristics of acrylic resins ................................................................... 8
2.3.2 Methods for resin stability evaluation ...................................................................... 8
2.3.3 Evaluation procedure.............................................................................................. 10
2.4 Heating experiments ............................................................................................... 13
2.5 Conclusions ............................................................................................................ 15
3 IN SITU PORE SPACE IMPREGNATION EXPERIMENT................................. 17
3.1 Site description and geological overview ............................................................... 17
3.2 Experimental layout................................................................................................ 18
3.3 Injection of resin and heating ................................................................................. 20
3.4 Overcoring and sub-sampling................................................................................. 22
3.5 Summary................................................................................................................. 23
4 PETROGRAPHY OF GRIMSEL GRANODIORITE AND DEFINITIONOF STRUCTURAL ELEMENTS AND PORE TYPES ........................................ 25
4.1 Petrography of Grimsel granodiorite matrix........................................................... 25
4.2 Structural elements ................................................................................................. 26
4.3 Pore types ............................................................................................................... 27
4.4 Summary................................................................................................................. 30
NAGRA NTB 00-08 VIII
5 PORE SPACE DESCRIPTION UNDER UV LIGHT AT DIFFERENTSCALES AND FREQUENCY COUNTING METHODS..................................... 31
5.1 Methods .................................................................................................................. 31
5.2 Results .................................................................................................................... 31
5.2.1 Pore space distribution on macroscopic scale......................................................... 31
5.2.2 Pore space distribution on microscopic scale ......................................................... 34
5.3 Conclusions ............................................................................................................ 37
6 SCANNING ELECTRON MICROSCOPE INVESTIGATIONS OFIN SITU POROSITY .............................................................................................. 41
6.1 Methods .................................................................................................................. 41
6.2 Results and discussion ............................................................................................ 42
6.2.1 Visualisation of impregnated pore spaces with SEM ............................................. 42
6.2.2 3-D reconstruction of impregnated pore space ....................................................... 43
6.3 Conclusions ............................................................................................................ 45
7 UNIVERSAL-STAGE MEASUREMENTS AND DETERMINATION OFPOROSITY, PERMEABILITY AND SEISMIC VELOCITIES ........................... 49
7.1 Methods .................................................................................................................. 49
7.1.1 Sample reference system ........................................................................................ 49
7.1.2 Universal-stage measurements ............................................................................... 49
7.1.3 Porosity and permeability measurements ............................................................... 50
7.1.4 Seismic velocities ................................................................................................... 50
7.2 Results .................................................................................................................... 51
7.2.1 Petrography............................................................................................................. 51
7.2.2 Pore space fabrics ................................................................................................... 51
7.2.3 Porosity................................................................................................................... 55
7.2.4 Hydraulic conductivity ........................................................................................... 56
7.2.5 Seismic velocities ................................................................................................... 57
7.3 Conclusions ............................................................................................................ 61
8 WATER SATURATION GRAVIMETRY, MERCURY INJECTIONPOROSIMETRY AND CHEMICAL ANALYSIS POROSIMETRY................... 63
8.1 Methods .................................................................................................................. 63
8.1.1 Sample preparation ................................................................................................. 63
8.1.2 Water saturation gravimetry ................................................................................... 64
8.1.3 Mercury injection porosimetry ............................................................................... 65
8.1.4 Chemical analysis porosimetry............................................................................... 66

IX NAGRA NTB 00-08
8.2 Results and discussion ............................................................................................ 67
8.2.1 Comparison of porosimetrical measurements on non-impregnated samples ......... 68
8.2.2 Connected porosity and pore-size distribution of laboratory samples.................... 69
8.2.3 Comparison of connected porosities for in situ and laboratory samples ................ 70
8.3 Conclusions ............................................................................................................ 72
9 ILLUSTRATING THE EFFECTS OF THE MAGNITUDE AND EXTENTOF CONNECTED MATRIX POROSITY ON RADIONUCLIDETRANSPORT IN A FRACTURED GEOLOGICAL MEDIUM........................... 73
9.1 Introduction ............................................................................................................ 73
9.2 Model representation of the geosphere................................................................... 73
9.3 Parameter values..................................................................................................... 74
9.4 Results .................................................................................................................... 74
9.5 Discussion............................................................................................................... 76
9.6 Conclusions ............................................................................................................ 76
10 CONCLUSIONS .................................................................................................... 81
11 ACKNOWLEDGEMENTS.................................................................................... 84
12 REFERENCES ....................................................................................................... 85

NAGRA NTB 00-08 X
LIST OF TABLES
Tab. 2.4.1: Properties of heating oil Parapharm 68................................................................... 14
Tab. 2.5.1: Properties of NHC-9 acrylic resin .......................................................................... 15
Tab. 3.2.1: Technical data for the boreholes drilled for the final in situ experiment; allboreholes have an orientation subparallel to 144 / 07 ............................................ 18
Tab. 3.3.1: Total mass of resin injected after 6 weeks.............................................................. 20
Tab. 3.4.1: Dimensions of overcores BOVE 97.004 to 007 with the positions of the slabsurfaces ................................................................................................................... 22
Tab. 4.3.1: Summary of pore type characteristics..................................................................... 27
Tab. 5.3.1: Summary of quantified parameters for all pore types............................................. 39
Tab. 7.2.2: Pressure dependent permeability and hydraulic conductivity of impregnated(imp) and non-impregnated (ni) samples in the direction parallel to thelineation (x) and perpendicular to the foliation (z) ................................................. 57
Tab. 8.2.1: Porosimetry data for the Grimsel granodiorite matrix, obtained throughquantitative investigations; analytical errors listed were assessed for eachtechnique as described in the preceding sections.................................................... 68
Tab. 9.3.1: Nuclide-independent geosphere parameters ........................................................... 75
Tab. 9.3.2: Nuclide-dependent geosphere parameters .............................................................. 75

XI NAGRA NTB 00-08
LIST OF FIGURES
Fig. 1.1.1: Methodology of in situ resin impregnation .............................................................. 4
Fig. 2.1.1: Flow chart illustrating the procedure from the experimental concept to themain experiment ....................................................................................................... 7
Fig. 2.3.1: Setup for the on site resin stability experiments on different tubing materials ........ 9
Fig. 2.3.2: Schematic illustration of the chronology of the feasibility experiments andtheir results ............................................................................................................. 11
Fig. 2.4.1: Comparison of calculated and measured matrix temperature................................. 14
Fig. 3.1.1: Overview of ventilation drift at GTS...................................................................... 17
Fig. 3.2.1: Layout of the final in situ experiment in the ventilation drift................................. 19
Fig. 3.3.1: Injection pressure and mass of injected resin (top); heating curves oftemperature sensors in observation boreholes and of the heating element(below).................................................................................................................... 21
Fig. 3.4.1: Intersections of the boreholes with the shear zone T.............................................. 23
Fig. 4.3.1: Thin section photomicrographs of pore types under crossed nicols (left) andunder UV light (right)............................................................................................. 29
Fig. 4.4.1: Pore type distribution in granodiorite matrix.......................................................... 30
Fig. 5.1.1: Drillcore mapping and position of slab surfaces .................................................... 32
Fig. 5.2.1: General orientation of elliptic resin halo on slab surfaces...................................... 33
Fig. 5.2.2: x' and y' axis of ellipsoids of macroscopically visible pore space filling [cm]....... 34
Fig. 5.2.3: Slab surfaces photographed under UV light (position of surface is indicatedin photograph): a) BOVE 97.004, b) BOVE 97.005, c) BOVE 97.006, d)BOVE 97.007 ......................................................................................................... 35
Fig. 5.2.4: a) Cross-section of the impregnated interval of overcore BOVE 97.006between 1.28 m and 1.88 m, numbers 1 to 4 indicate the position of thinsections used for microscopic analyses; b) Cross-section of the same intervalunder UV light, the bright central partly reflects the injection borehole ................ 36
Fig. 5.2.5: Distribution of different pore types perpendicular to injection borehole(vertical axis) and with increasing distance from the shear zone (horizontalaxis): a) Grain boundary pores, b) sheet silicate pores, c) solution pores andd) microfractures..................................................................................................... 38
Fig. 6.2.1: BSE image of microfractures (orange arrows) within the Grimselgranodiorite matrix; the microfractures with apertures of larger than a fewµm were fully filled with resin ............................................................................... 42
Fig. 6.2.2: BSE image of grain boundary pores showing various resin-filled pore spaces(orange arrows) with apertures ranging in size from about 100 nm up to afew µm; resin-free pore spaces (black arrows) are also identified along grainboundaries............................................................................................................... 42

NAGRA NTB 00-08 XII
Fig. 6.2.3: BSE images (a1 and a2) and corresponding photomicrograph (b) of poretypes in the Grimsel granodiorite matrix, a disagreement in the appearanceof the pore spaces is obviously seen between (a) and (b); (a) All pore spacesare not accessible to the resin (orange arrow: resin-filled pore space, blackarrow: resin-free pore space), b) Labelled A, B and C are corresponding tothe cases A, B and C, respectively, shown in Fig. 6.2.4......................................... 44
Fig. 6.2.4: Schematic representations of three possible cases of resin impregnation,which could cause differences in the appearance of the pores between SEMexamination and fluorescent microscopy ............................................................... 45
Fig. 6.2.5a: Top, left and bottom views of 3-D reconstructions of rock sample (top) andin situ connected porosity (bottom); these 3-D images consist of 51 2-Dimages that are 10 µm apart.................................................................................... 46
Fig. 6.2.5b: 3-D representations of in situ connected porosity from different viewpoints,showing the "microchannel and barrier" structure that reflects theconstrictive and tortuous geometry of the rock matrix ........................................... 47
Fig. 6.2.5c: 3-D representations of in situ connected porosity in 3 segmented portions ofthe rock volume; the whole 3-D image from the same viewpoint is shown inFig. 6.2.5b (middle) ................................................................................................ 48
Fig. 7.1.1: Reference system of the sample orientation; a) schematic cube with foliation(XY-cleavage-plane) and lineation (x-direction), the arrows indicate theorientation of the thin sections, b) orientation of cylindrical samples for thepermeability measurements, c) projection of the foliation and lineation in theSchmidt net, lower hemisphere, as used in the following....................................... 50
Fig. 7.2.1: Pole figures of pores for the samples HS, SZ and LS in: (a) to (c) (001)cleavage planes of micas; (d) to (f) grain boundary pores in quartz; (g) to (i)microfractures in feldspars; and (j) to (l) bulk microfractures fabric ..................... 52
Fig. 7.2.2: Schematic illustrations of pore orientation (coloured planes) in sample cubesfor HS, SZ and LS with reference axes (x, y, z) ..................................................... 54
Fig. 7.2.3: Porosity of impregnated and non-impregnated (ni) samples .................................. 55
Fig. 7.2.4: Pressure dependent permeability/hydraulic conductivity of HS impregnatedand non-impregnated (ni) in X- and Z-direction .................................................... 56
Fig. 7.2.5: Pressure dependent seismic velocity of the non-impregnated sample SZ andthe impregnated sample HS of two selected propagation directions ...................... 59
Fig. 7.2.6: Experimentally determined directional dependence of compressional wavevelocities [km s-1] for the impregnated samples HS, SZ and LS: (a) and (b)Vp as a function of confining pressure, (c) ∆Vp between 100 and 3 MPaconfining pressure, (d) and (g) Vp under dry conditions, (e) and (h) Vp undersaturated conditions; and (f) and (i) ∆Vp (sat - dry) as a measure of themicrofracture induced anisotropy; Schmidt net, lower hemisphere ....................... 60
Fig. 7.2.7: Seismic velocity [km s-1] of the non-impregnated sample SZ: (a) at a con-fining pressure of 3 MPa, (b) at a confining pressure of 100 MPa, (c) ∆Vpbetween 100 and 3 MPa confining pressure, (d) Vp under dry conditions, (e)Vp under saturated conditions, and (f) ∆Vp (sat - dry) as a measure of theanisotropy induced by microfractures; Schmidt net, lower hemisphere................. 61

XIII NAGRA NTB 00-08
Fig. 8.1.1: Sub-samples A – G and the reference material, used for quantitativeporosimetry investigations...................................................................................... 63
Fig. 8.2.1: Size distribution of mercury injectable porosity in the Grimsel granodiorite;vertical axis corresponds to the relative abundance of pore size ............................ 69
Fig. 8.2.2: Estimated size distribution of in situ porosity in the Grimsel granodioritematrix; calculation based upon results from mercury injection porosimetryon sub-samples C, D and E..................................................................................... 72
Fig. 9.2.1: Schematic illustration of the geosphere model, showing an area A in a planarsection through the host rock normal to the direction of groundwater flowand channels passing through the plane that convey the groundwater (largearrows); matrix diffusion is assumed to occur within the shaded regionsadjacent to the channels .......................................................................................... 76
Fig. 9.4.1: The geosphere releases of 79Se for the cases J-2-1 to 6 (upper figure) andK-1-1 to 6 (lower figure), compared to the near-field release of thisradionuclide ............................................................................................................ 77
Fig. 9.4.2: The geosphere releases of 135Cs for the cases J-2-1 to 6 (upper figure) andK-1-1 to K-1-6 (lower figure), compared to the near-field release of thisradionuclide ............................................................................................................ 78
Fig. 9.4.3: The geosphere releases of 237Np (upper figure) and 99Tc (lower figure) forthe cases K-1-1 to K-1-6, compared to the near-field releases of theseradionuclides........................................................................................................... 79


1 NAGRA NTB 00-08
1 INTRODUCTIONW.R. Alexander, A. Möri and M. Adler
1.1 Background to the projectThe joint Nagra-JNC Radionuclide Migration Programme (RMP4) has been running for over tenyears in Nagra's Grimsel Test Site in the central Swiss Alps (KICKMAIER et al. 2001). Theprogramme is specifically aimed at the further development of conceptual models ofradionuclide transport in the geosphere, rigorously testing the applicability of current transportcodes to quantify radionuclide migration in situ and assessing how successfully laboratorysorption data may be extrapolated to in situ conditions to predict radionuclide retardation in thegeosphere (see McKINLEY et al. 1988, ALEXANDER et al. 1992, FRICK et al. 1992, SMITHet al. 2001a and b, OTA et al. 2003 for an overview). A large series of field tracer migrationexperiments (the MI project) has been carried out in a hydrologically well characterised water-bearing, complex fracture (or shear zone). The work began with simple, non-sorbingfluoresceine (a fluorescent dye, also known as uranine), 3H, 3,4He, 82Br and 123I and increased incomplexity through weakly sorbing 22,24Na, 85Sr and 86Rb to a final, long-term experiment withmoderately sorbing 134,137Cs. The radionuclides were injected into a dipole flow field where theflow path length, dipole width (or shape) and flow velocity were all varied. After a considerablelearning period, generally good fits could be obtained between transport code blind predictionsand subsequent field tracer breakthrough curves, suggesting that the transport codes testedprovided a reasonable representation of in situ conditions.
The programme then went further in two main respects: first, strongly retarded, chemicallymore complex radionuclides (60Co, 75Se, 99Tc, 113Sn, 152Eu, 234,235U, 237Np and stable Mo) wereinjected into the same water-conducting shear zone which has been used for the previous tenyears work and second, the sites of in situ radionuclide retardation were physically defined (inthe excavation project EP) and not just assumed from the breakthrough curves as previously.The second part follows on partly from the first in that the injected strongly retarding radio-nuclides travel through the experimental shear zone so slowly (taking years to decades forcomplete breakthrough compared with hours to months for weakly sorbing tracers) that it wasimpossible to sit back and wait for their appearance at the extraction borehole as was previouslythe case. Following the injection of the radionuclides, a specially developed epoxy resin wasinjected into the experimental shear zone to immobilise the shear zone without either physical orchemical disturbance (see ALEXANDER et al. 2001 for details). The entire experimental zone(approximately one tonne of rock) was excavated and sub-samples taken to the laboratory toassess the extent of heterogeneity of transport of each radionuclide within the shear zone, basedon both laboratory data and model assumptions about the distribution of flowpaths (see MÖRIet al. 2001 for details).
In addition, a second retardation mechanism was studied in the programme, namely matrixdiffusion. Work carried out on natural decay series disequilibria showed that matrix diffusionoccurs in the low-porosity rock matrix close behind the experimental shear zone (ALEXAN-DER et al. 1990a and b). It was decided that this merited further, detailed study but, in a breakfrom traditional laboratory-based studies of matrix porosity (due to the desire to avoid artefactsassociated with sample disturbance: see, for example comments in CHERNIS 1981, 1983, 1984and FRICK et al. 1993), a technique for the examination of in situ porosity was developed andimplemented and provides the basis for this report. 4 The RMP includes the MI (migration), EP (excavation) and CP (connected porosity) projects. Previously, EP and
CP have been labelled RRP (Radionuclide Retardation Project).
NAGRA NTB 00-08 2
1.2 Radionuclide retardation in the rock matrixThe term matrix diffusion is applied to the process by which a solute, flowing in distinctfractures, penetrates the surrounding rock. Diffusion into this rock occurs in a connected systemof pores or microfractures, and diffusion through the solid phase is insignificant by comparison(see the review of VALKIANEN 1992, for example). The importance of matrix diffusion in thecontext of a radioactive waste repository is that it greatly enlarges the area of rock surface incontact with advecting radionuclides from just the fracture surface to a portion of the bulk rock(NERETNIEKS 1980, GRISAK & PICKENS 1980, RASMUSON & NERETNIEKS 1981,HADERMANN & RÖSEL 1985).
The matrix diffusion theory proposes that dissolved radionuclides will diffuse from a water-filled fracture, through any fracture coating layer, into the rock matrix and, if they are reactive,sorb onto the inner surface of the pores or else remain dissolved within the immobile pore-water. This process can be envisaged as an extreme case of a dual porosity medium, in whichadvective flow occurs entirely within the fracture system, or primary porosity, whilst all solutetransport in the bulk rock, the secondary porosity, takes place by diffusion (see, for example,BARENBLATT et al. 1960, GRISAK & PICKENS 1980). The porosity of the rock matrix canbe very small (about 0.1 to 1 %) in many hard rocks and solute loss by diffusion into the matrixis likely to be slow. The impact of matrix diffusion will, as a consequence, not be significantalong short or rapid flow paths but, for the longer and slower paths likely in a repository hostrock, may result in a significant reduction in the maximum concentration of radionuclides in thegroundwater entering the biosphere. This process is particularly important if the resulting trans-port time to the biosphere is greater than the half life of the radionuclide, since the total releasecan be reduced by several orders of magnitude (see for example, NERETNIEKS 1980, fordiscussion). In addition, pulse releases can be spread over longer time periods, therebydecreasing release concentrations by a process of temporal dilution (NAGRA 1985). For non-sorbed radionuclides, this process also represents an important retardation mechanism, sincethese radionuclides would otherwise be transported at the advection rate of the groundwater. Forsorbing nuclides, the importance of matrix diffusion lies in the fact that it provides a mechanismfor enlarging the rock surface in contact with the advecting solute, from that of the fracturesurfaces and their infills, to a much larger portion of the bulk rock.
The theoretical basis for matrix diffusion is thus fairly well established. There are, however,different views regarding the volume of rock that would be available for matrix diffusion; ie theextent of connected porosity. In the KBS-3 performance assessment (KBS 1983) for example, itwas assumed that matrix diffusion is limited only to dead-end pores whilst the Project Gewährperformance assessment (NAGRA 1985) assumed the matrix diffusion was limited to a micro-fractured damage zone (e.g. taken as 1 mm for calculations with limited matrix diffusion, basedon the altered zone in aplite/pegmatite dykes).
Clearly then, the matrix diffusion concept required experimental verification and work has beencarried out on limestone (GARRELS et al. 1949), sandstone (KLINKENBERG 1951, BRAD-BURY et al. 1986), claystone (MAZUREK et al. 1996) and crystalline rocks (SKAGIUS &NERETNIEKS 1982, 1983, 1985a and b, 1986, TORSTENFELT et al. 1982, BRADBURY &STEPHEN 1986, MONTOTO et al. 1992, HEATH & MONTOTO 1996). One significant prob-lem, however, is that the work is conducted, out of necessity, on samples disturbed by collectionand preparation. This leads, for example, to de-stressing of the rock (an inevitable consequenceof removal to the laboratory) inducing non-reproducible changes to the pore geometry.
Other perturbations due to sample cutting or grinding will also change both the pore geometryand sorption properties of the rock, indicating that the laboratory results must be treated withsome caution. In general, all of the changes induced in the samples (see McKINLEY 1989a and

3 NAGRA NTB 00-08
1989b for further details) tend to cause overestimation of the rock diffusivity, leading to anoverestimation of matrix diffusion which is, in turn, non-conservative in the performanceassessment sense as it leads to an apparently greater degree of radionuclide immobilisation inthe far field.
Attempts have also been made to verify matrix diffusion by more complex experiments which,by confining the (larger) rock samples under high pressures (e.g. BRACE et al. 1968,BISCHOFF et al. 1987, DREW & VANDERGRAAF 1989), hoped to re-create the in situ con-ditions more precisely. There are still many problems with such experiments: the low hydraulicconductivity means that unrealistically high pressure gradients have to be applied to theinfiltrating fluids in order to produce breakthrough of radionuclides within reasonable timescales plus there is no way to guarantee that the re-established confining pressures will recreateanything like the original pore geometry. In fact, in one study (SKAGIUS & NERETNIEKS1986) which attempted to quantify the degree of disturbance, it was estimated that laboratoryproduced data probably overestimate in situ diffusion coefficients by several orders of magni-tude. These overestimates should be treated as minimum values, however, as the study wasconceptually simplistic, assuming that re-stressing core samples with simulated overburdenpressures would represent undisturbed in situ conditions.
1.3 The Connected Porosity project (CP)In the Connected Porosity (CP) project, resin impregnation of the rock matrix with a very lowviscosity acrylic resin has been carried out, followed by the recovery of samples from the undis-turbed rock matrix, to allow the form and distribution of porosity in the undisturbed rock matrixto be investigated in detail. Specifically, the depth of matrix porosity connected to the experi-mental shear zone has been studied as well the form of pore connectivity. This has providednew information on the pore volumes which could be available to retard radionuclides movingthrough repository host rocks, and a direct comparison between the new experimental dataproduced in CP with that from EP should produce a detailed description of porosity distributionin and around a water conducting feature.
The CP Project started in 1996 with a suite of different feasibility studies. Significant effortswere required to determine the optimum composition of the resin and the conditions of resininjection which would induce no damage to the rock structure. The preparatory work includedlaboratory and in situ experiments (see Chapter 2) which provided the basis for the final in siturock matrix immobilisation experiment (Chapter 3). Fig. 1.1.1 gives an overview of the experi-mental layout of the in situ impregnation procedure. Different analytical techniques were thenassessed and applied in order to characterise and conceptualise in situ pore space geometry anddistribution in the excavated rock matrix (Chapters 4 to 8). Scoping calculations based on thenew data were carried out (Chapter 9) to assess the likely implications on estimates of radio-nuclide retardation in repository host rocks. Finally, the results were summarised (Chapter 10)and the implications for repository performance assessments noted along with recommendationsfor future areas of work. It should be noted that no attempt is made to synthesis the four RMPreports here, rather this is left to ALEXANDER et al. (2002).
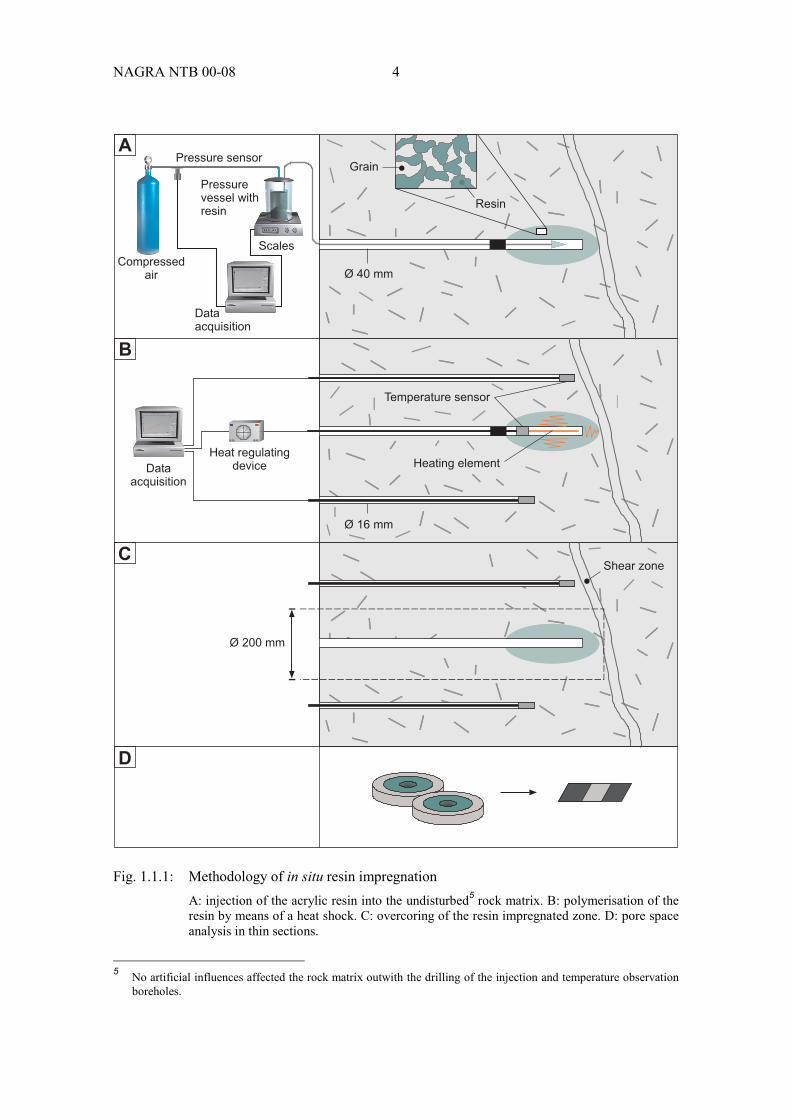
NAGRA NTB 00-08 4
Fig. 1.1.1: Methodology of in situ resin impregnationA: injection of the acrylic resin into the undisturbed5 rock matrix. B: polymerisation of theresin by means of a heat shock. C: overcoring of the resin impregnated zone. D: pore spaceanalysis in thin sections.
5 No artificial influences affected the rock matrix outwith the drilling of the injection and temperature observation
boreholes.
Pressure sensor
Pressurevessel withresin
Compressedair
Dataacquisition
Heat regulatingdevice
Scales
Dataacquisition
Ø 200 mm
A
B
C
D
Grain
Resin
Ø 40 mm
Temperature sensor
Ø 16 mm
Heating element
Shear zone

5 NAGRA NTB 00-08
2 DEVELOPMENT OF AN IN SITU IMPREGNATION TECHNIQUE FORCRYSTALLINE ROCK MATRICESA. Möri, C. Bühler, P. Haag, K. Ota and M. Mazurek
2.1 Aims and proceduresInvestigation of true matrix porosity requires in situ conservation of the pore spaces in the rockprior to excavating the impregnated rock mass for laboratory analysis. Several potentialmethods for in situ impregnation of a granitic rock matrix were envisaged at the beginning ofthis experiment, including freezing of the water saturated rock matrix, injection of cementgrouts and injection of resin. In the end, both immobilisation by freezing and by injection ofcement grouts were rejected in favour of resin injection. In the case of the freezing technique,the expansion of water on freezing was found to damage the rock with disruption of the porespaces and extension of fractures (WATANABE et al. 1993). Cementitious grouts were rejectedbecause they cannot penetrate the fine pore spaces in the rock matrix and they producehyperalkaline fluids which can react with the pore waters and minerals. The selection anddevelopment of a suitable resin was found to be the most promising approach due to the possi-bility to easily modify the physical properties of a basis resin formula in order to obtain goodpenetration into fine pore space combined with ease of handling, significant structural strengthand a polymerisation (hardening) which is not affected by the rock or the pore water. It should,however, be noted that the specific resin formulation used reflects the physico-chemicalconditions in the two rock types studied and so application of the resin to other rock typeswould have to take this into account.
As part of the assessment procedure for resin impregnation, the C-14-PMMA (14C-Polymethyl-methacrylate) method applied to Grimsel granite matrix samples in laboratory experiments byHELLMUTH & SIITARI-KAUPPI (1998) was also evaluated. The advantages of this methodare the good impregnation properties of the resin and the post impregnation analytical methods(e.g. autoradiography combined with digital image processing) with image definition below the0.5 µm resolution limit of optical procedures. However, regarding in situ applications, the use ofactive tracer (14C) in the PMMA resin and polymerisation initiation by radiation greatlyincreases complexity in the field6. Therefore it was decided to develop an acrylic resin in whichpolymerisation is initiated by heat as this promised to be the most practicable technique in thefield.
Resin impregnation is routinely used in geological laboratories to stabilise rock samples beforesub-sampling, grinding and polishing. However, the requirements of its use in the final CPexperiment were more stringent and significant effort was put into determining the optimumresin composition. Given the physical properties of the rock and the need for completeimpregnation and visualisation of pore space, the resin required the following characteristics:
• A low viscosity, allowing penetration into fine pore space of the matrix.
• A long processing time (potlife) in order to allow for long injection times which arerequired by the very low hydraulic conductivity of the matrix of around 10-10 to 10-12 m s-1
(VOMVORIS & FRIEG 1992).
• Constancy of volume during polymerisation in order to avoid deformation of the originalpore space.
6 To achieve polymerisation at depth in the rock matrix will, in any case, probably require an unreasonably active
60Co source. However, new experiments with a chemical initiation of PMMA polymerisation are under way atSTUK (Finland) in order to increase in situ applicability of this method (K.-H. HELLMUTH, pers. comm. 2001).

NAGRA NTB 00-08 6
• Miscibility with a fluorescent agent for visualisation of the pore space under UV light.
• Minimum tensile strength of 3 MPa after hardening to allow overcoring and samplepreparation.
• Minimal uptake of water after polymerisation in order to preserve impregnation duringovercoring and preparing this sections.
Heat flux calculations in the granodiorite and design calculations of the expected resin injectiontime were performed prior to the evaluation of the resin composition, appropriate injectionequipment materials and injection and heating techniques.
The optimum composition of the resin was developed in a step-wise procedure: different resinswere tested on Grimsel granodiorite specimens in the laboratory and in situ at the Grimsel TestSite (GTS). In case of failure, the formulation of the resin was modified and the new resin wasagain tested in the laboratory and in situ. The in situ experiments also aimed at the developmentof appropriate injection techniques and equipment. The results of the feasibility experiments arediscussed below and formed the basis of the final in situ impregnation experiments in the GTSand in JNC's Kamaishi In Situ Test Site (KTS) in Japan which provided the sample material foranalytical work. The procedure from the planning phases to the final experiment is illustrated inFig. 2.1.1.
2.2 Design calculations and hydrotesting
To begin the heat flux calculations, the average thermal conductivity of the Grimsel granodioriteand of the acrylic resin was determined by the Swiss Federal Institute of Technology (ETH),Zürich (for details see MÖRI et al. 1996). The measurements revealed values between 2.30 and3.23 W m-1 K-1 for the Grimsel granodiorite and a value of 0.55 W m-1 K-1 for the acrylic resin.The measurements on the rock samples gave no indication of a direction dependence in thethermal conductivity, despite evidence of slight cleavage and stretching lineation observed onmatrix samples near the shear zone.
Two approaches for heat flux calculations were followed, both assuming a working temperatureof the heating element of 80 °C and a resin polymerisation temperature of 40 °C (for details seeMÖRI et al. 1996). A first approach assumed that the heating element would be in direct contactwith the borehole walls. These calculations showed that, after two days of heating, the requiredpolymerisation temperature of 40 °C could be achieved up to a distance of 10 cm into the rockmatrix. A second calculation took the remaining resin in the injection borehole between theborehole wall and the heating element into account. The result is a much lower temperature atthe transition into the granodiorite due to the insulating effect of the resin. These calculationsgave a stable maximum temperature of only 24 °C at a distance of 20 cm from the borehole wallafter about 72 hours. This heating / polymerisation temperature was found to be too close to thegiven mean rock temperature of about 14 °C and spontaneous early polymerisation could not beexcluded due to the low difference in working and heating temperature. In order to fullyevaluate the effective heat distribution in the rock and to increase rock temperature duringheating, it was decided to perform heating tests during the in situ feasibility experiments (seeChap. 2.4 and Fig. 2.4.1).
Transmissivity of the rock matrix at the experimental site was determined by two pulse tests inthe injection borehole of the first in situ feasibility experiment at 5 and 10 bar injection pressure.Apart from compliance effects, the injected volume in both tests was below 1 g and the cal-culated transmissivities for the rock matrix in Grimsel granodiorite were found to be between1.0 × 10-11 and 6.6 × 10⁻¹¹ m2 m-1 at the test location.

7 NAGRA NTB 00-08
Rough design calculations based on an estimation of the amount of resin to be injected and theexpected injection time were performed with the numerical well-test-simulation model GTFM7
from Solexperts (for details see GRISAK et al. 1985). With a K-value of 1 × 10-12 m s-1 and aninjection pressure of 10 bars, the resulting injection mass was determined to be about 0.21 litresfor a cylindrical pore volume with a radius of 10 cm around the injection interval (l = 70 cm).Simulated injection time would be 19 days (assuming 1 % porosity).
Fig. 2.1.1: Flow chart illustrating the procedure from the experimental concept to the mainexperiment
7 Note that these calculations do not include the influence of capillary suction effects (for details see
NERETNIEKS 1985).
Experimental aims: in-situ impregnation andvisualisation of pore spacein the matrix of theGrimsel granodiorite
Formulating afluorescent resin with
a low viscosity
Defining the experimentallayout and development
of equipment
Laboratory testsat the University
of Berne
Resin stabilityexperimentsat the GTS
In-situ tests inboreholesat the GTS
Successfulimpregnation
of matrix pore spaceno
yes
Final experiment at GTS:- drilling of injection boreholes- resin injection- heating- overcoring- analysing- reporting
Mo
dific
atio
ns
inth
ere
sin
form
ula
an
de
qu
ipm
en
t
Fin
ale
xp
erim
en
tF
ea
sib
ility
stu
die
sP
lan
nin
g

NAGRA NTB 00-08 8
2.3 Evaluation of resin and injection techniques
2.3.1 General characteristics of acrylic resins
Unlike epoxy resins or polyurethanes, some acrylic resins are completely miscible with waterwhich allows formulation of a resin with a very low viscosity. The polar molecules of theacrylic resins have very good wetting properties leading to a high penetration capacity whichplays a key role in the impregnation of matrix pores.
Acrylic resins have the ability to harden by a free radical initiated chain reaction of only onemonomer (polymerisation). This polymerisation can run spontaneously or be triggered byadding an initiator which, in turn, can be activated by heat, irradiation (e.g. UV, γ-radioactivityor microwaves) or by redox reactions. The decrease in volume (shrinkage) of acrylic resins canbe compensated for by the addition of free water into the system. The use of different types ofinitiators provides the possibility to modify the potlife of acrylic resins (time span where theresin remains at low viscosity and can be processed with the injection equipment) under thegiven boundary conditions such as ambient temperature, pore water chemistry or types ofmaterial which are in contact with the resin.
On the other hand, acrylic resins always need an inhibitor in order to prevent spontaneouspolymerisation which could interrupt injection. Common inhibitors for resins with the necessarycharacteristics for the planned field experiment require the presence of oxygen in the system tofulfil their task.
An optimal balance between initiator and inhibitor must be found, on the one hand to preventearly polymerisation of the resin in the rock at the given ambient temperature as long as theinjection lasts and, on the other hand, to ensure full polymerisation at the achieved rocktemperature during heating. The target temperature for polymerisation was set at 40 °C whichwas found to be realistic with regard to the expected rock temperature to be achieved by heatingand which is not too close to the ambient temperature in the GTS tunnels.
2.3.2 Methods for resin stability evaluationImpregnation tests were first performed in the laboratory under conditions similar to thoseenvisaged for the in situ tests. Successful impregnation under laboratory conditions was con-sidered to be a pre-requisite for field tests (resin stability experiments in the gallery and in situinjections) at the GTS.
Laboratory experimentsThe laboratory experiments were conducted on both air-dried and water-saturated Grimselgranodiorite samples. Water saturation was achieved by leaving the sample in a bucket of waterfor about one week. Saturation by this method clearly is not fully achieved, but this was deemedof little relevance for the scope of the tests. It was planned to evacuate air-dried samples prior toresin impregnation but the acrylic resin quickly evaporated under vacuum conditions anddamaged the pressure chamber and vacuum pump system. Although other techniques for rocksample impregnation under vacuum are known (see, for example, SKAGIUS & NERETNIEKS1982), it was decided that all subsequent tests would be performed without evacuation as thiswas, in any case, more appropriate to the in situ conditions. The pressure for the laboratoryimpregnations was in the range of 6 to 13 bars and impregnation time was 16 hours. Thesamples were then put in an oven and heated at 70 °C for 1 hour in order to achieve full poly-

9 NAGRA NTB 00-08
merisation. Standard thin-sections were then prepared and the rock was cut such that eachsection contained a profile from the sample surface into the matrix.
On site resin stability experimentsIn addition to the in situ impregnation experiments, some resin stability experiments wereperformed at the GTS. The aim of these tests was to check the long term influence of ambienttemperatures in the tunnel, assess potential reaction with equipment and define the effects ofGrimsel granodiorite on polymerisation of the resin. A set consisting of four stainless steel tubesand one polyamide tube (Fig. 2.3.1) was filled with the resin and pressurised with compressedair to 10 bars. The tubes were reopened after a few weeks and the polymerisation behaviour ofthe resin checked. For the resin stability experiments performed directly in the granodiorite, theresin was poured into vertical boreholes (∅ 40 mm) closed with a plastic lid and reopened aftersome weeks to check the polymerisation behaviour of the resin.
Fig. 2.3.1: Setup for the on site resin stability experiments on different tubing materials
In situ feasibility experiments
The in situ feasibility experiments were performed at the GTS in the granodiorite matrix (in azone with a weak cleavage). Sub-horizontal injection boreholes (∅ 35 mm) with a length of 0.7– 1.3 m were drilled. Parallel observation boreholes (∅ 16 mm) were drilled at differingdistances from the injection borehole. The injection borehole was equipped with a single packersystem containing a heating system (heating wire and thermocouple). The borehole was filledwith resin prior to packing-off the interval and connection to the injection vessel. The resin waspressurised by nitrogen or compressed air at pressures up to 10 bars. During the injection
T-connector
Compressed air End cap: stainless steel
Stainlesssteeltubing6/4 mm
Valve
Polyamide tubing6/3 mm- surface coveredwith plastic tapefor light protection
1m

NAGRA NTB 00-08 10
period, which lasted between 4 to 15 days depending on the resin tested, the resin flow rate intothe rock matrix was automatically monitored via weight loss measurement of the resin in thevessel. The injection phase was followed by a heating period where the temperature in theheating element was set to 80 °C and temperatures in the observation boreholes was monitored.The duration of the heating period was in the range of 2 to 4 weeks after which the packersystem was removed and the injection borehole was overcored. The recovered core sampleswere then macroscopically and microscopically analysed under UV light in order to assess theextent and quality of resin impregnation of the pore space within the rock matrix (seeFig. 1.1.1).
2.3.3 Evaluation procedure
A total of 12 feasibility tests were performed until the optimum resin composition, appropriateinjection equipment materials and injection and heating techniques were defined. The resinswere named 'NHC' followed by a number indicating the version of the modification. Success-fully impregnated rock samples have been analysed by UV microscopy to assess the quality andextent of resin impregnation (for details see also MÖRI et al. 1996). The experimental chro-nology and results are shown in Fig. 2.3.2.
Step 1: Laboratory investigation of the impregnation properties of two fluoresceine-doped acrylic resins NHC-1 and NHC-28
These two single component resins showed no visible impregnation of pore space and this wasthought to be mainly due to the following effects: i) a high surface tension at the resin rockinterface prevents the resin from entering the pore spaces and / or ii) due to solubility problems,the fluorescent agent in the resin coagulates into aggregates whose size exceeds that of thematrix pores (in this case the resin enters the pore space but the fluorescent agent does not).Closer examination of the samples clearly showed that the latter effect had occured, namely theresin had indeed filled all the pores but the dye had been filtered out and excluded from thesmaller pores. As far as the authors were aware, no reports of such observations exist in theliterature and so this mechanism was not expected to occur.
As yet, the process is not fully understood, but it was decided to change the procedure and thefollowing changes in resin composition were initiated: addition of a surfactant to improve thewetting properties of the resin and the use of eosine instead of fluoresceine (Fluorol yellow-088,BASF) as fluorescent agent because eosine is more readily soluble in water and was thereforeexpected to be also in acrylic resins.
Step 2: Laboratory investigation of the impregnation properties of eosine-doped acrylicresin NHC-3
The new resin NHC-3 (based on NHC-1) showed good impregnation of pore space for both air-dried and water-saturated samples and was thus considered to be suitable for a preliminary insitu experiment.
8 NHC-2 is based on NHC-1 but with a different cross-linking agent, responsible for polymerisation (chain
forming).
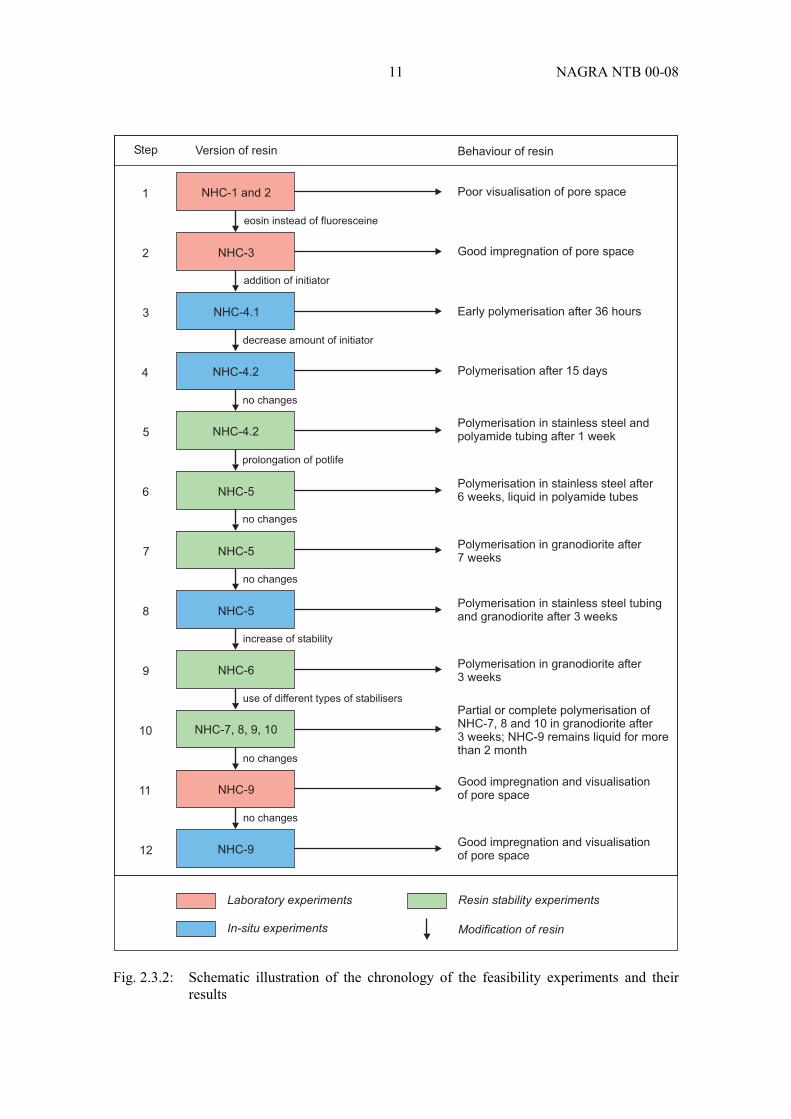
11 NAGRA NTB 00-08
Fig. 2.3.2: Schematic illustration of the chronology of the feasibility experiments and theirresults
NHC-1 and 2
NHC-3
NHC-4.1
NHC-5
NHC-4.2
NHC-4.2
NHC-5
NHC-5
NHC-6
NHC-7, 8, 9, 10
NHC-9
NHC-9
1
2
3
4
5
6
7
8
9
10
11
12
Poor visualisation of pore space
Good impregnation of pore space
Early polymerisation after 36 hours
Polymerisation after 15 days
Polymerisation in stainless steel andpolyamide tubing after 1 week
Polymerisation in stainless steel after6 weeks, liquid in polyamide tubes
Polymerisation in granodiorite after7 weeks
Polymerisation in stainless steel tubingand granodiorite after 3 weeks
Polymerisation in granodiorite after3 weeks
Partial or complete polymerisation ofNHC-7, 8 and 10 in granodiorite after3 weeks; NHC-9 remains liquid for morethan 2 month
Good impregnation and visualisationof pore space
Good impregnation and visualisationof pore space
Laboratory experiments
In-situ experiments
Resin stability experiments
Modification of resin
Step Version of resin Behaviour of resin
eosin instead of fluoresceine
addition of initiator
decrease amount of initiator
no changes
prolongation of potlife
no changes
no changes
increase of stability
use of different types of stabilisers
no changes
no changes
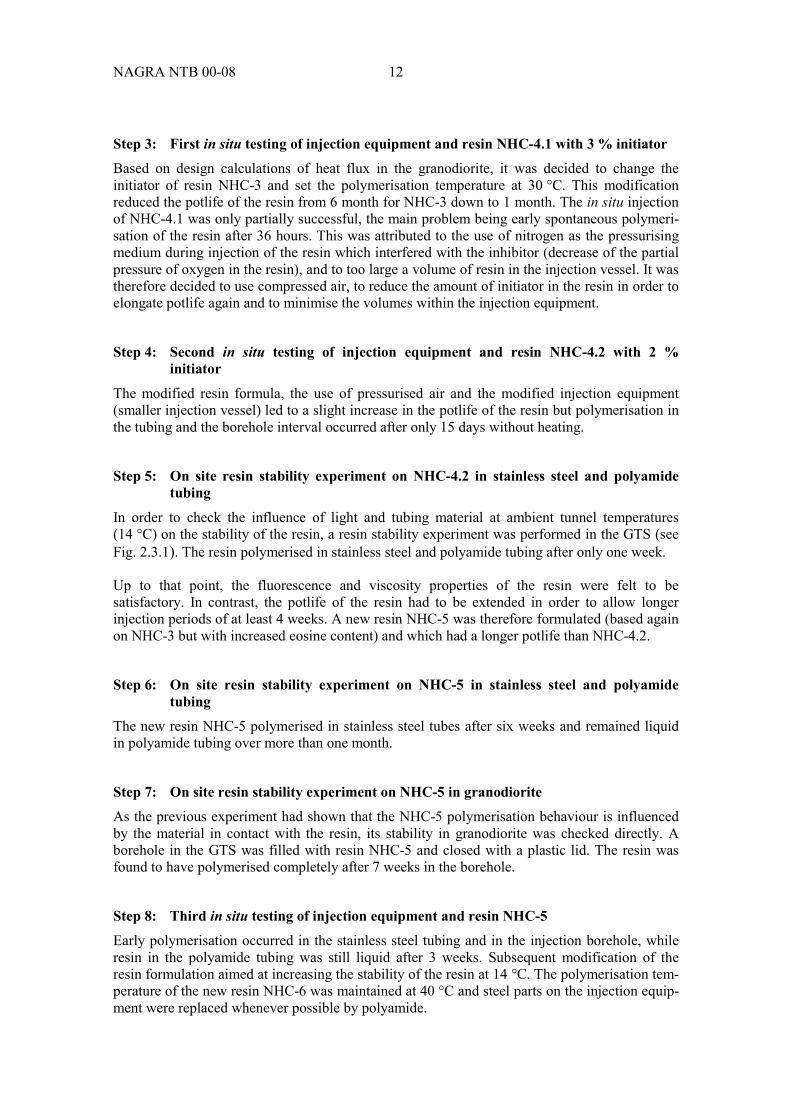
NAGRA NTB 00-08 12
Step 3: First in situ testing of injection equipment and resin NHC-4.1 with 3 % initiatorBased on design calculations of heat flux in the granodiorite, it was decided to change theinitiator of resin NHC-3 and set the polymerisation temperature at 30 °C. This modificationreduced the potlife of the resin from 6 month for NHC-3 down to 1 month. The in situ injectionof NHC-4.1 was only partially successful, the main problem being early spontaneous polymeri-sation of the resin after 36 hours. This was attributed to the use of nitrogen as the pressurisingmedium during injection of the resin which interfered with the inhibitor (decrease of the partialpressure of oxygen in the resin), and to too large a volume of resin in the injection vessel. It wastherefore decided to use compressed air, to reduce the amount of initiator in the resin in order toelongate potlife again and to minimise the volumes within the injection equipment.
Step 4: Second in situ testing of injection equipment and resin NHC-4.2 with 2 %initiator
The modified resin formula, the use of pressurised air and the modified injection equipment(smaller injection vessel) led to a slight increase in the potlife of the resin but polymerisation inthe tubing and the borehole interval occurred after only 15 days without heating.
Step 5: On site resin stability experiment on NHC-4.2 in stainless steel and polyamidetubing
In order to check the influence of light and tubing material at ambient tunnel temperatures(14 °C) on the stability of the resin, a resin stability experiment was performed in the GTS (seeFig. 2.3.1). The resin polymerised in stainless steel and polyamide tubing after only one week.
Up to that point, the fluorescence and viscosity properties of the resin were felt to besatisfactory. In contrast, the potlife of the resin had to be extended in order to allow longerinjection periods of at least 4 weeks. A new resin NHC-5 was therefore formulated (based againon NHC-3 but with increased eosine content) and which had a longer potlife than NHC-4.2.
Step 6: On site resin stability experiment on NHC-5 in stainless steel and polyamidetubing
The new resin NHC-5 polymerised in stainless steel tubes after six weeks and remained liquidin polyamide tubing over more than one month.
Step 7: On site resin stability experiment on NHC-5 in granodioriteAs the previous experiment had shown that the NHC-5 polymerisation behaviour is influencedby the material in contact with the resin, its stability in granodiorite was checked directly. Aborehole in the GTS was filled with resin NHC-5 and closed with a plastic lid. The resin wasfound to have polymerised completely after 7 weeks in the borehole.
Step 8: Third in situ testing of injection equipment and resin NHC-5Early polymerisation occurred in the stainless steel tubing and in the injection borehole, whileresin in the polyamide tubing was still liquid after 3 weeks. Subsequent modification of theresin formulation aimed at increasing the stability of the resin at 14 °C. The polymerisation tem-perature of the new resin NHC-6 was maintained at 40 °C and steel parts on the injection equip-ment were replaced whenever possible by polyamide.
13 NAGRA NTB 00-08
Step 9: Resin stability experiment on NHC-6 in granodioriteThe new resin, NHC-6, polymerised in the borehole after 3 weeks. After this negative result,four new resins NHC-7, 8, 9, 10 were formulated with different types of stabilisers and tested atGTS.
Step 10: Resin stability experiment on NHC-7, 8, 9, 10 in granodiorite
After 3 weeks, the resins NHC-7 and 8 showed an increase in viscosity, while NHC-10 wascompletely polymerised. In contrast, NHC-9 was still liquid after 2 months.
Step 11: Investigation of impregnation properties of resin NHC-9 in the laboratoryResin NHC-9 showed good impregnation of pore space for both air-dried and water-saturatedsamples.
Step 12: Fourth in situ testing of injection equipment and resin NHC-9Injection of the resin was carried out at an increased pressure of 15 bars to increase the injectionrate. The resin remained liquid during the entire injection period of 4 weeks and polymerisedafter heating. Microscopic analysis showed good impregnation and visualisation of pore spacein an area of about 5 cm around the injection borehole.
2.4 Heating experimentsTo heat the rock, it was planned to introduce a heating element (which could attain a maximumtemperature of about 200 °C) into the packed off interval of the injection boreholes. Thetemperature sensors were introduced into small diameter observation boreholes (at radialdistances of 5.2, 7.2 and 15.7 cm from the wall of the injection borehole), which were filledwith an epoxy resin after instrumentation.
The first in situ heating tests (performed in step 3 and 4 in Fig. 2.3.2) showed that, with theheating element set at a constant temperature of 80 °C, maximum rock temperature in the threeobservation boreholes varied from 32.7 °C at 5.2 cm to 23.3 °C at 15.7 cm from the injectionborehole. These temperatures were reached after 72 h and were not exceeded even after 12 dayswhen the experiment was stopped. These results were in good agreement with the modelcalculations, taking into account the presence of the resin between the heating element and theborehole wall. The comparison between the calculated and the measured matrix temperature isshown in Fig. 2.4.1. The lower temperatures obtained by the calculations of about 3 °C may be aconsequence of an underestimation of the values for specific heat capacity of the resin whichwas not precisely known. Nevertheless, the calculated temperature curve represents the shape ofthe actual temperature curve quite well. Calculations and the field experiments showed that thenecessary polymerisation temperature of 40 °C around the injection borehole could not bereached with the selected layout. It was therefore decided to optimise heat conduction into therock matrix by replacing the resin left over in the borehole after injection with heating oil. Thetemperature of the heating element was set to 180 °C in order to attain a temperature of at least40 °C in the adjacent rock matrix aiding complete polymerisation of the resin. The relatedtemperature curves of the heating elements and the temperature sensors are shown in Fig. 3.3.1.
NAGRA NTB 00-08 14
Fig. 2.4.1: Comparison of calculated and measured matrix temperature
The heating oil used was a standard product from Shell Asea called Parapharm 68 and isnormally used for greasing fine mechanical tools. The properties of the oil are shown inTab. 2.4.1. The heating oil was emplaced in the injection boreholes after removing the injectionpacker system and before replacing them with the heating packers.
Tab. 2.4.1: Properties of heating oil Parapharm 68
Property Unit Value / Description
Colour [-] whiteDensity at 20 °C [kg m-3] 870Flashpoint [°C] 215Pourpoint [°C] -12Kinematic viscosity at 40 °C
at 100 °C[mm2 s-1] 68
7.8Toxicity class [-] none
0 20 40 60 80 100 120 14010.0
15.0
20.0
25.0
30.0
Ma
trix
tem
pe
ratu
re[°
C]
First in situ heatingexperiment (r = 0.176 m)
Time [h]
Measured
Calculated
14°C

15 NAGRA NTB 00-08
2.5 ConclusionsThe acrylic resin NHC-9 with the eosine dye proved to be the most appropriate resin for thefinal in situ impregnation experiment, providing complete impregnation (no shrinkage of theresin was observed in the investigated rock samples; see also comments in Chapter 8) and goodvisualisation of the pore space. It exhibited a minimum in situ potlife of 40 days at ambienttemperature in the 14 °C tunnel as well as in the equipment and in contact with the Grimselgranodiorite. The relevant physical properties of resin NHC-9 are summarised in Tab. 2.5.1. Inorder to avoid early polymerisation, direct contact of the resin with metallic parts in theinjection equipment was avoided and compressed air was used as the pressurising medium. Toattain the required heat flux from the heating element into the surrounding rock mass, theborehole was filled with heating oil and the output temperature of the heating element was set at180 °C to reach the polymerisation temperature of at least 40 °C in the rock matrix around theborehole.
Tab. 2.5.1: Properties of NHC-9 acrylic resin
Properties NHC-9 acrylic resin
Material basis Single component acrylate + dye (eosine) + heat initiatorPolymerisation start by heat (> 40 °C)Density (20 °C) [kg m-3] 1070Viscosity [mPa s] 5 °C: ≈ 30; 20 °C: < 10Tensile strength [MPa] 6Compressive strength [MPa] 16Gel time 6 months (room temperature); 36 h (50 °C); 6 h (70 °C)Boiling point [°C] > 100Melting point [°C] < -10Storage stability 6 months


17 NAGRA NTB 00-08
3 IN SITU PORE SPACE IMPREGNATION EXPERIMENTA. Möri, M. Adler and C. Bühler
3.1 Site description and geological overviewThe final in situ impregnation experiment was performed in the rear chamber of the ventilationdrift (VE) at the GTS (Fig. 3.1.1). Six boreholes were drilled into the eastern tunnel wallbetween tunnel metre 488.85 and 490.92. A shear zone intersects the ventilation drift at tunnelmetre 494 with an orientation of 144 / 80 (dip direction / dip angle). The same shear zone can betraced into the AU gallery, where it is called 'AU126'.
Fig. 3.1.1: Overview of ventilation drift at GTS
20
VE 521
VE 445
Rear chamber
Acce
ss
tun
ne
l
Location ofCP test site
Tunnel ofventilation test
30 40 50 m100
1
2 3
Major shear zone
Cleavage strike trend
Lamprophyre dike
1
2
3
Migration shear zone
Ventilation shear zone
Gas test shear zone
VE 480.5
AUGallery
Frontchamber
NAGRA NTB 00-08 18
The granodiorite rocks at GTS show varying degrees of deformation (detailed petrographicdescription is given in Chap. 4.1). Ductile deformation of the granodiorite during Alpinegreenschist facies metamorphism produced weak cleavage and discrete shear zones. The shearzone in the ventilation drift is characterised by drastic grain size reduction and growth ofgreenschist facies mineral assemblage consisting of muscovite, chlorite and epidote. It containsa fine-grained mylonitic zone in its centre, which underwent brittle reactivation.
A lamprophyre dike intersects the ventilation tunnel at the same position as the shear zone. Ithas an orientation almost perpendicular to the shear zone and has no influence on the experi-ment.
3.2 Experimental layout
Four parallel injection boreholes were drilled almost perpendicular to the shear zone and twoparallel temperature observation boreholes were drilled between the injection holes. Intervalswithin the injection boreholes were isolated with mechanical packer systems in a way that nointerval intersects the shear zone, that the intervals are at least one metre beyond the tunnel wall(avoid effects of excavation disturbed zone EDZ of the tunnel and desaturation of the matrix)and, finally, that there is a continuous profile through matrix rock on both sides of the shearzone. The positions of the boreholes and the packed-off intervals are illustrated in Fig. 3.2.1.The boreholes were drilled with a HILTI drilling machine using water-cooled single corebarrels. The technical data for all boreholes are given in Tab. 3.2.1.
Tab. 3.2.1: Technical data for the boreholes drilled for the final in situ experiment; allboreholes have an orientation subparallel to 144 / 07
Borehole(BOVE)
Tunnelmetre
Diameter Length
[m]
Purpose Packed-offinterval
[cm]
Length orpacked-off
interval[cm]
97.004 490.92 40 mm 2.48 Injection 170 – 248 7897.005 490.25 40 mm 2.21 Injection 160 – 221 6197.006 489.54 40 mm 2.12 Injection 128 – 188 6097.007 488.85 40 mm 1.82 Injection 120 – 182 62
97.008 490.65 16 mm 2.65 Temperatureobservation none -
97.009 489.22 16 mm 2.05 Temperatureobservation none -
97.0109 ~ 490.00 200 1.50Drillcore forlaboratory
experimentsnone -
9 not shown in Fig. 3.2.1.

19 NAGRA NTB 00-08
Fig. 3.2.1: Layout of the final in situ experiment in the ventilation drift
49
2m
49
3m
49
4m
49
1m
49
0m
48
9m
BOVE97.007
BOVE97.006
BOVE97.005
BOVE97.004BOVE97.008
BOVE97.009
Sh
ea
rzo
ne
Tre
nd
:~
05
4°
Orie
nta
tio
n:
~1
44
/80
(va
lue
sca
lcu
late
dfr
om
inte
rse
ctio
no
fth
esh
ea
rzo
ne
with
the
tun
ne
lw
all)
Experim
enta
lla
yout
(ho
rizo
nta
lse
ctio
ns)
1.82m
2.05m
2.12m
2.21m
2.65m
2.48m
Me
ch
an
ica
lpa
cke
r
Inje
ctio
nin
terv
al
20
m
VE
521
VE
445
Rear
cham
ber
Accesstunnel
Location
of
CP
testsite
Tunnelof
ventila
tion
test
0
VE
480.5
AU
Ga
llery
Fro
nt
cham
ber
1m

NAGRA NTB 00-08 20
3.3 Injection of resin and heating
The three boreholes 97.004, 97.005 and 97.007 were equipped with mechanical single packersystems and borehole 97.006 with a double packer system, each equipped with lines for resininjection. Each packer system was connected to a pressure vessel containing the resin and eachvessel was placed on a digital balance connected to a data acquisition system to monitor resinflow during injection. The resin was injected into the four boreholes using compressed air as thepressurising medium and applying a constant pressure of 10 bars.
The injection period ended after 6 weeks and at that time the resin in the tubing and the boreholewas still liquid. The total mass of resin injected into each borehole is listed in Tab. 3.3.1 and theinjection curves are shown in Fig. 3.3.1.
The total mass injected into borehole 97.004 is much higher than that for the other boreholes.This is because large amounts of resin were lost at the beginning of the injection phase due tothe presence of a couple of open fractures in the bottom part of the injection interval. In order tostop this resin loss and to force the resin to penetrate the matrix, it was decided to pack off thispart of the injection interval with an additional packer which reduced the length of the intervalto 58 cm. After that, the injection rates for 97.004 were in the same range as in the otherboreholes.
A rough estimation of impregnation depth revealed a value of about 8 cm, assuming 1 vol% ofmatrix porosity around the injection interval.
Tab. 3.3.1: Total mass of resin injected after 6 weeks
Borehole Injected mass[g]
Injected mass / interval length[g cm-1]
97.004 692 8.997.005 194 3.297.006 162 2.797.007 83 1.3
After termination of the injection phase, the remaining resin in each borehole was replaced byheating oil and the heating element was inserted. The heating oil was added to enhance heatconduction between the heating element and the borehole wall During the heating phase, theheating element temperature in the boreholes was set to 180 °C. Temperatures between 40 and60 °C were attained, as monitored in observation boreholes in the rock matrix at a distance of25 cm from the heating borehole (this distance was chosen in order to minimise rock damage tothe rock matrix in the vicinity of the injection borehole). The heating phase was terminated after37 days (see Fig. 3.3.1).
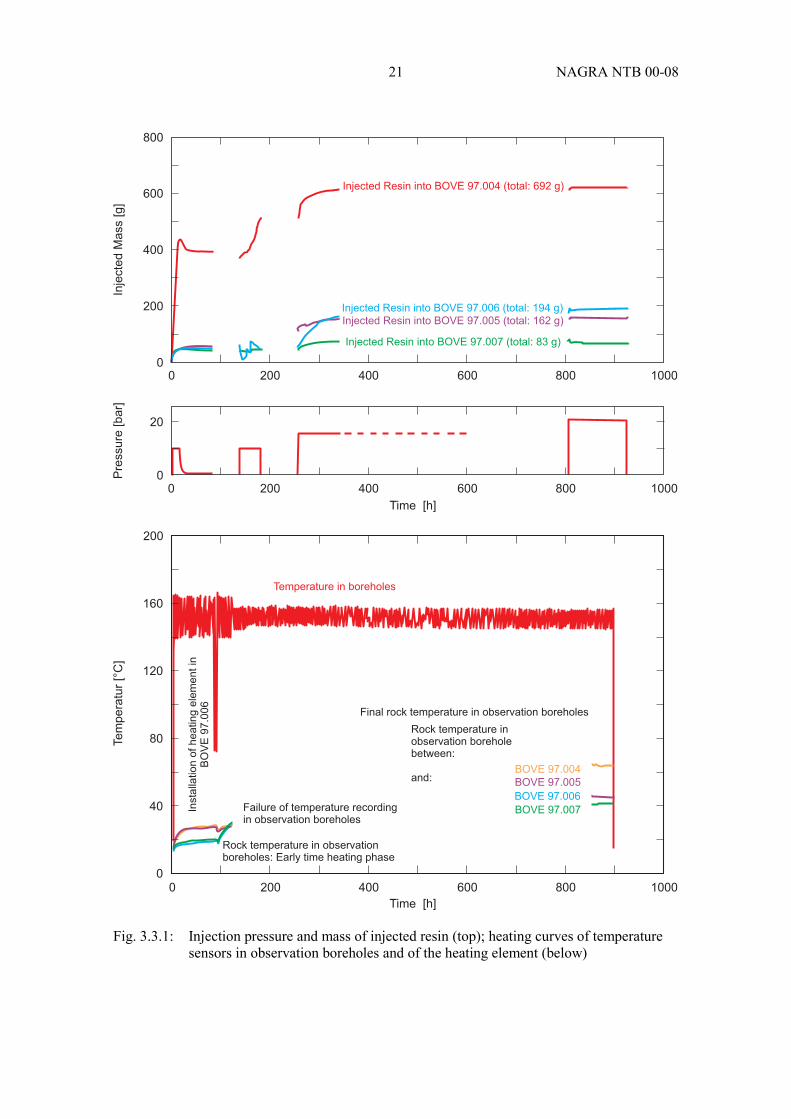
21 NAGRA NTB 00-08
Fig. 3.3.1: Injection pressure and mass of injected resin (top); heating curves of temperaturesensors in observation boreholes and of the heating element (below)
BOVE 97.005
BOVE 97.004
BOVE 97.006
BOVE 97.007
Temperature in boreholes
Final rock temperature in observation boreholes
Rock temperature inobservation boreholebetween:
and:
Failure of temperature recordingin observation boreholes
Rock temperature in observationboreholes: Early time heating phase
Insta
llatio
no
fh
ea
tin
ge
lem
en
tin
BO
VE
97
.00
6
200
160
120
80
40
02000 400 600 800 1000
Injected Resin into BOVE 97.005 (total: 162 g)
Injected Resin into BOVE 97.004 (total: 692 g)
Injected Resin into BOVE 97.006 (total: 194 g)
Injected Resin into BOVE 97.007 (total: 83 g)
Inje
cte
dM
ass
[g]
Pre
ssu
re[b
ar]
Time [h]
800
600
400
200
00 200 400 600 800 1000
0 200 400 600 800 1000
20
0
Te
mp
era
tur
[°C
]
Time [h]

NAGRA NTB 00-08 22
3.4 Overcoring and sub-samplingThe four injection boreholes were overcored with a 200 mm single core barrel. The impregnatedparts in overcores BOVE 97.004, 97.005, 97.006 and 97.007 were sawn into slabs normal to theaxis of the injection borehole and were used for macroscopic analyses. Some of these slabs weresub-sampled for preparation of thin sections10. The relative orientations of overcore, slabs andthin sections with regard to the three principal planes (x'y'-, x'z'- and y'z'- plane) are shown inFig. 3.4.1. Tab. 3.4.1 provides the dimensions of the four overcores as well as the exact positionof sawed slab surfaces.
Tab. 3.4.1: Dimensions of overcores BOVE 97.004 to 007 with the positions of the slabsurfaces
Borehole Diameter
[mm]
Length
[m]
Packed -offinterval during
injection[m]
Position of slabsurfaces
[m]*
Distance fromthe shear zone
[cm]*
BOVE 97.004 200 2.75 1.70 – 2.48 1.631.802.002.132.45
36507286
116BOVE 97.005 200 2.40 1.60 – 2.21 1.58
1.651.802.20
2102464
BOVE 97.006 200 1.98 1.28 – 1.88 1.281.601.751.88
5826122
BOVE 97.007 200 1.94 1.20 – 1.82 1.201.401.601.80
98765648
* Bold numbers indicate slab surfaces which were broken during drilling and normal style numbersindicate sawn slab surfaces.
10 Note that sub-sampling for microspospic, geophysical and porosimetry investigations were taken outwith the
range of influence of the borehole disturbed zone (BDZ) which was observed around the injection boreholes andoutwith the contact surface of the heating oil to the matrix (see details below).
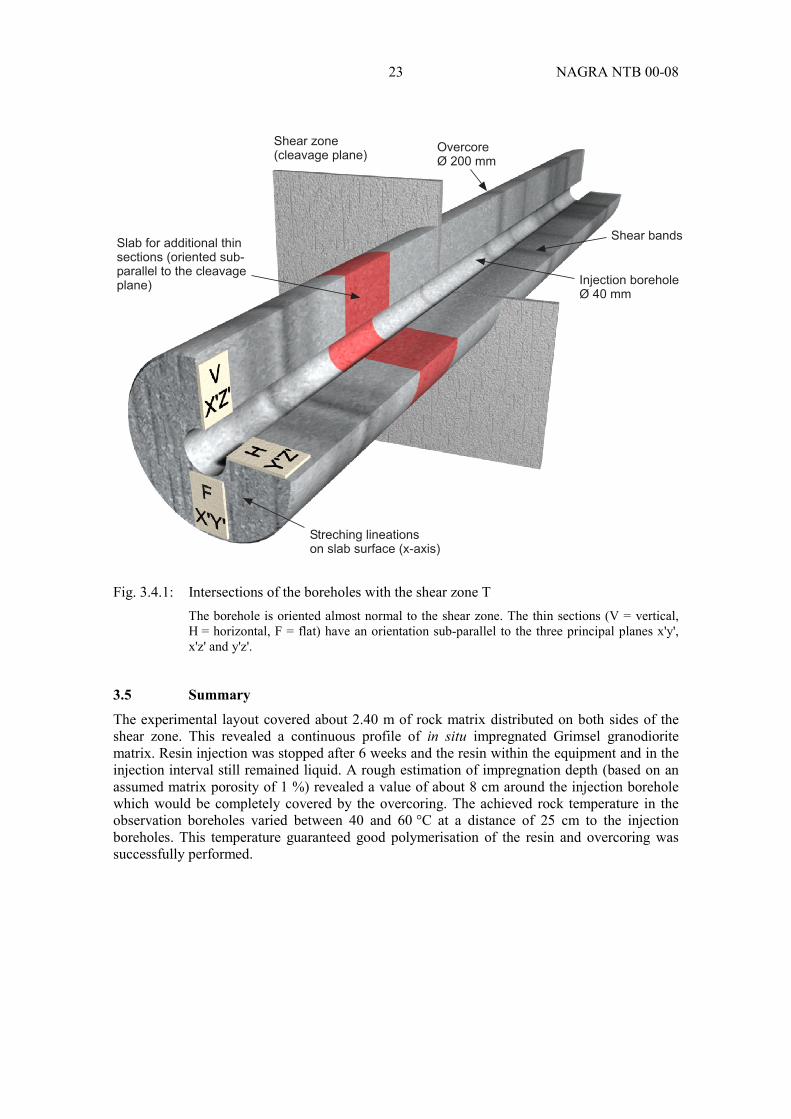
23 NAGRA NTB 00-08
Fig. 3.4.1: Intersections of the boreholes with the shear zone TThe borehole is oriented almost normal to the shear zone. The thin sections (V = vertical,H = horizontal, F = flat) have an orientation sub-parallel to the three principal planes x'y',x'z' and y'z'.
3.5 Summary
The experimental layout covered about 2.40 m of rock matrix distributed on both sides of theshear zone. This revealed a continuous profile of in situ impregnated Grimsel granodioritematrix. Resin injection was stopped after 6 weeks and the resin within the equipment and in theinjection interval still remained liquid. A rough estimation of impregnation depth (based on anassumed matrix porosity of 1 %) revealed a value of about 8 cm around the injection boreholewhich would be completely covered by the overcoring. The achieved rock temperature in theobservation boreholes varied between 40 and 60 °C at a distance of 25 cm to the injectionboreholes. This temperature guaranteed good polymerisation of the resin and overcoring wassuccessfully performed.
Streching lineationson slab surface (x-axis)
Shear zone(cleavage plane)
OvercoreØ 200 mm
Shear bandsSlab for additional thinsections (oriented sub-parallel to the cleavageplane) Injection borehole
Ø 40 mm

25 NAGRA NTB 00-08
4 PETROGRAPHY OF GRIMSEL GRANODIORITE AND DEFINITION OFSTRUCTURAL ELEMENTS AND PORE TYPESA. Möri, M. Adler, M. Mazurek, M. Schild and K. Ota
In the previous chapter, the development of a suitable resin formulation and a methodology forimpregnation and immobilisation of matrix rock was described. The in situ matrix impregnationwas successfully carried out and provided matrix samples that enabled the investigation of the insitu pore structure of granodiorite matrix.
The main focus of analytical work was the investigation of the form, distribution and connect-ivity of the porosity in the undisturbed rock matrix and comparison of these features with thosefrom "disturbed" rock samples. The investigations were carried out at different scales (macro-scopic, microscopic, nanometre scale). Standard thin section petrography under normal and UVlight, cathodo-luminescence microscopy and SEM (Scanning Electron Microscope) were allused to characterise samples. Frequency counting methods, orientation measurements on micro-structures and determination of seismic velocities in the rock matrix were aimed at investigatingthe spatial distribution of pore space and are reported in Chapters 5 and 7.
4.1 Petrography of Grimsel granodiorite matrixThe Grimsel Test Site (GTS) is situated in the Aare Massif, a basement high in the Helveticrealm of the Alps. The Aare Massif consists of a metasedimentary envelope that was intrudedby Hercynian granitoids (320 – 280 Ma) such as the Central Aare granite and the Grimselgranodiorite (the host rocks of the GTS). All rocks of the Aare Massif have been affected byAlpine greenschist metamorphism and deformation at about 25 Ma BP and the plutonic rockswere metamorphosed to gneisses. Structures in the Hercynian plutonic rocks are mostlyattributed to Alpine deformation (STECK 1968, MARQUER & GAPAIS 1985).
Peak Alpine metamorphic conditions in the vicinity of the GTS are estimated at 400 °C and 2.5to 3 kbar (CHOUKROUNE & GAPAIS 1983, MARQUER et al. 1985). The following struc-tural features can be assigned to this greenschist facies metamorphism and associated ductiledeformation: cleavage, mylonitisation (including formation of quartz ribbons), mineral stretch-ing lineation, extension fractures and quartz recrystallisation.
The formation of brittle structures, which are common in the crystalline rocks at Grimsel, post-dates the ductile deformation and can be attributed to the post-metamorphic regional uplift thatstill operates to the present day (current uplift of 1 – 2 mm/a). In most cases, faults run alongpre-existing mylonitic zones and are parallel to metamorphic cleavage. Brittle structural featuresinclude both cataclastic fault breccias and discrete faults and deformation occurred at signifi-cantly lower temperatures and pressures compared with the preceding ductile deformation (seealso BOSSART & MAZUREK 1991 for details).
All samples that were investigated show a rather uniform mineralogical composition of K-feldspar (12 – 24 vol%), plagioclase (29 – 33 vol%), quartz (27 – 28 vol%) and biotite (7 –11 vol%), with accessory muscovite/sericite, apatite, sphene, epidote, zircon, chlorite, calciteand ore minerals.
In the weakly to undeformed matrix of Grimsel granodiorite, medium-grained quartz showsundulatory extinction as well as sub-grain formation. Highly deformed rock portions compriserecrystallised, mosaic textured quartz which forms elongated quartz ribbons parallel to thecleavage. In shear bands, quartz is extremely fine-grained and shows lobate to round grainboundaries indicating dynamic recrystallisation.

NAGRA NTB 00-08 26
Plagioclase occurs as coarse grains with polysynthetic twinning in undeformed rock portionsand most grains are intensely altered to sericite and epidote. Growth zonation of the plagioclase(albite growth seams) and alteration of the feldspars was detected by cathodo-luminescence.The different cathodo-luminescence colours of the feldspars can be explained by chemicalalterations: with progressing deformation, the Na2O, CaO and MgO concentrations increase,while the K2O concentrations decrease (KEUSEN et al. 1989). Unlike quartz, plagioclase under-went cataclastic deformation indicated either by brittle cracks or by fragmentation of plagioclasegrains in shear bands. K-feldspar appears as porphyroblasts with grain sizes of up to a few cm inweakly deformed rock matrix. The porphyroblasts exhibit perthitic exsolution lamellae as wellas carlsbad and microcline twinning. Angular to roundish K-feldspar clasts in shear bandsindicate cataclastic deformation of K-feldspar. A weak stretching lineation of K-feldspar grainsoccurs in the cleavage plane. Primary magmatic biotite appears as single sheets in undeformedrock portions and the sheets show ilmenite exsolution phenomena and weak chloritisation.Biotite in shear bands forms aggregates with chlorite and muscovite. In undeformed rockmatrix, fine-grained muscovite occurs as sericite in altered plagioclase. In shear bands, musco-vite is a major component forming aggregates with biotite and chlorite. Readily oriented andsyntaxially grown muscovite also forms narrow mica bands that outline grain boundaries of K-feldspar, plagioclase and quartz. Epidote either occurs as an alteration product in plagioclasegrains or as a major component in shear bands, where it often forms large aggregates.
4.2 Structural elementsAs pointed out earlier, the CP experiment focuses on the in situ porosity of the matrix of theGrimsel granodiorite in the vicinity of a water-conducting shear zone. A weak foliation isdeveloped in all matrix samples that were excavated for the CP experiment, and it is defined bycompositional banding of alternating dark biotite layers and bright, quartz-rich layers. Theextent of this weak cleavage varies in cm scale between undeformed to weakly and, near theshear zone, to highly deformed rock portions. The degree of metamorphism of the rock matrix isasymmetrical about the shear zone. On the northern side, there is little deformation outside anarrow intensely deformed zone of several cm width immediately in the vicinity of the shearzone. On the southern side, the degree of deformation is less intense but can be traced up toseveral metres from the shear zone.
The textures found in the drillcores from Grimsel granodiorite matrix have been subdivided intothe following structural elements:
• Weakly to undeformed rock matrix shows granoblastic textures with medium- to coarse-grained plagioclase, K-feldspar and quartz. Faint cleavage is displayed by scattered align-ment of biotite.
• Shear bands are 0.5 to 10 mm in width and define the main cleavage. They are character-ised by an extreme reduction in grain sizes and dynamic recrystallisation. Major compo-nents in shear bands include aggregates of muscovite, biotite and chlorite, aggregates ofextremely fine-grained quartz, feldspar clasts and coarse idiomorphic epidote and sphene.Fragments of plagioclase and K-feldspar often show asymmetric pressure shadows.
• Quartz ribbons consist of recrystallised, mosaic textured quartz and single grains ofmuscovite. They are stretched out parallel to the cleavage. No preferred orientation of thecrystallographic c-axes of quartz in the ribbons was found. Quartz ribbons often extend intoshear bands.
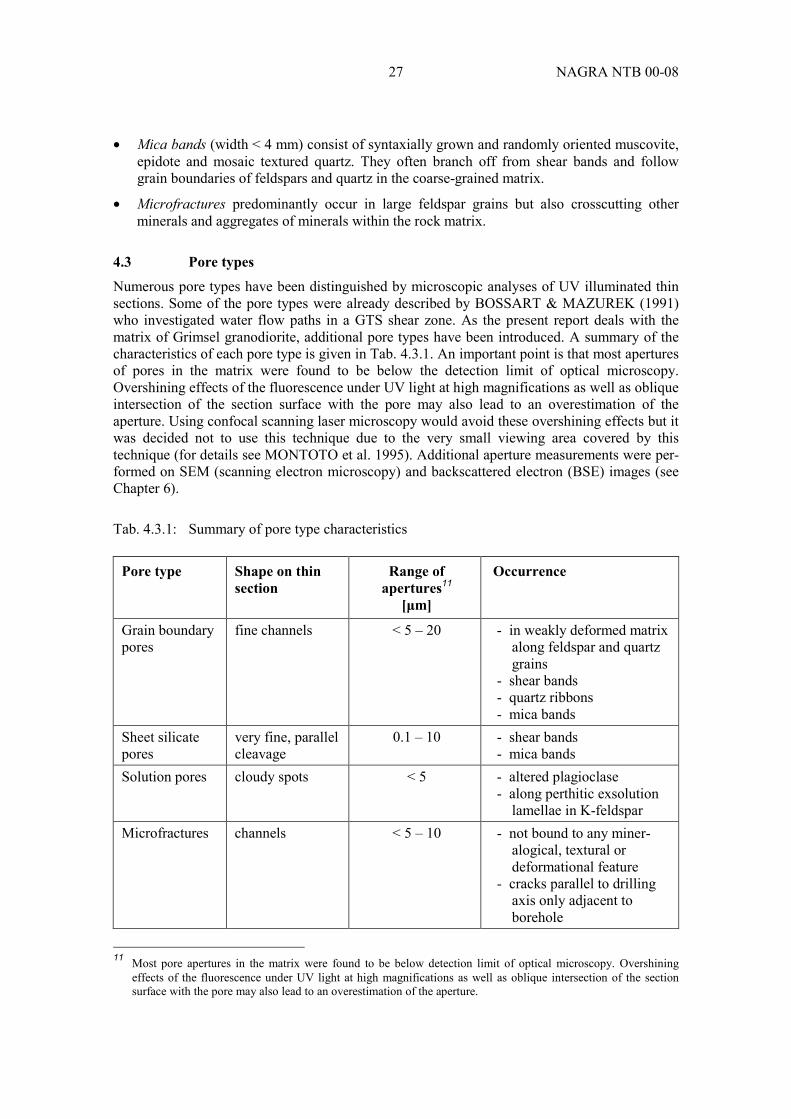
27 NAGRA NTB 00-08
• Mica bands (width < 4 mm) consist of syntaxially grown and randomly oriented muscovite,epidote and mosaic textured quartz. They often branch off from shear bands and followgrain boundaries of feldspars and quartz in the coarse-grained matrix.
• Microfractures predominantly occur in large feldspar grains but also crosscutting otherminerals and aggregates of minerals within the rock matrix.
4.3 Pore typesNumerous pore types have been distinguished by microscopic analyses of UV illuminated thinsections. Some of the pore types were already described by BOSSART & MAZUREK (1991)who investigated water flow paths in a GTS shear zone. As the present report deals with thematrix of Grimsel granodiorite, additional pore types have been introduced. A summary of thecharacteristics of each pore type is given in Tab. 4.3.1. An important point is that most aperturesof pores in the matrix were found to be below the detection limit of optical microscopy.Overshining effects of the fluorescence under UV light at high magnifications as well as obliqueintersection of the section surface with the pore may also lead to an overestimation of theaperture. Using confocal scanning laser microscopy would avoid these overshining effects but itwas decided not to use this technique due to the very small viewing area covered by thistechnique (for details see MONTOTO et al. 1995). Additional aperture measurements were per-formed on SEM (scanning electron microscopy) and backscattered electron (BSE) images (seeChapter 6).
Tab. 4.3.1: Summary of pore type characteristics
Pore type Shape on thinsection
Range ofapertures11
[µm]
Occurrence
Grain boundarypores
fine channels < 5 – 20 - in weakly deformed matrixalong feldspar and quartzgrains
- shear bands- quartz ribbons- mica bands
Sheet silicatepores
very fine, parallelcleavage
0.1 – 10 - shear bands- mica bands
Solution pores cloudy spots < 5 - altered plagioclase- along perthitic exsolution
lamellae in K-feldsparMicrofractures channels < 5 – 10 - not bound to any miner-
alogical, textural ordeformational feature
- cracks parallel to drillingaxis only adjacent toborehole
11 Most pore apertures in the matrix were found to be below detection limit of optical microscopy. Overshining
effects of the fluorescence under UV light at high magnifications as well as oblique intersection of the sectionsurface with the pore may also lead to an overestimation of the aperture.
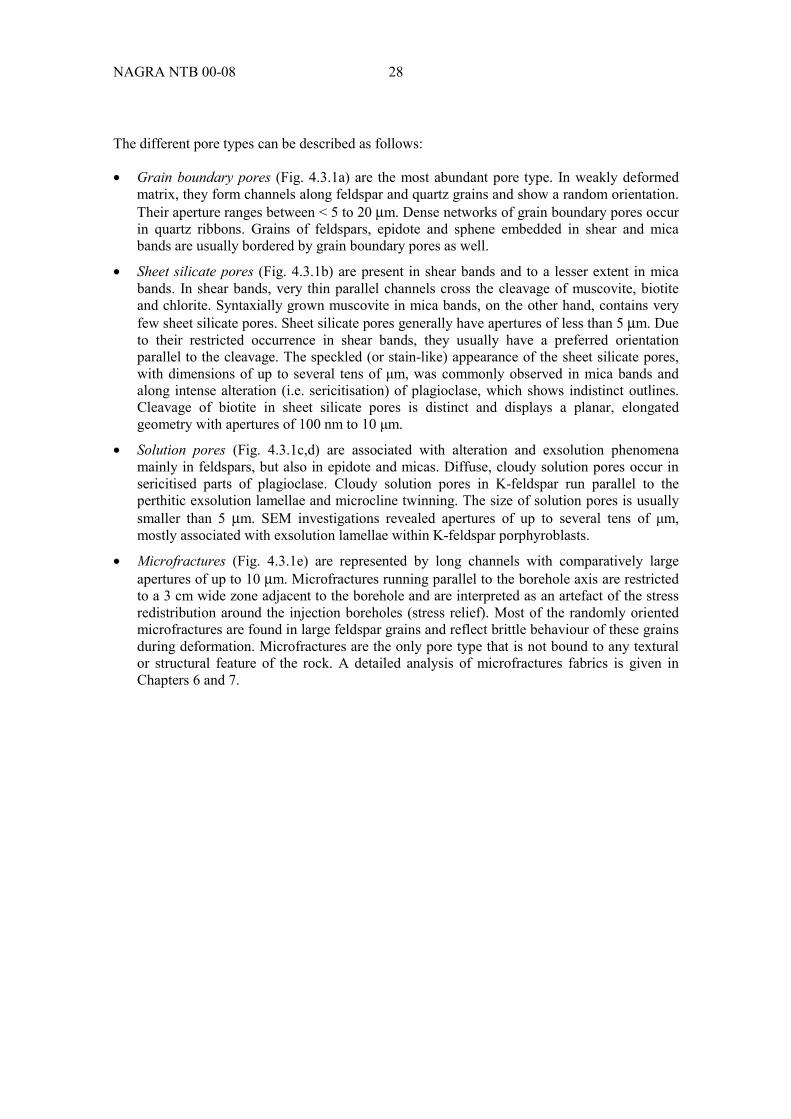
NAGRA NTB 00-08 28
The different pore types can be described as follows:
• Grain boundary pores (Fig. 4.3.1a) are the most abundant pore type. In weakly deformedmatrix, they form channels along feldspar and quartz grains and show a random orientation.Their aperture ranges between < 5 to 20 µm. Dense networks of grain boundary pores occurin quartz ribbons. Grains of feldspars, epidote and sphene embedded in shear and micabands are usually bordered by grain boundary pores as well.
• Sheet silicate pores (Fig. 4.3.1b) are present in shear bands and to a lesser extent in micabands. In shear bands, very thin parallel channels cross the cleavage of muscovite, biotiteand chlorite. Syntaxially grown muscovite in mica bands, on the other hand, contains veryfew sheet silicate pores. Sheet silicate pores generally have apertures of less than 5 µm. Dueto their restricted occurrence in shear bands, they usually have a preferred orientationparallel to the cleavage. The speckled (or stain-like) appearance of the sheet silicate pores,with dimensions of up to several tens of µm, was commonly observed in mica bands andalong intense alteration (i.e. sericitisation) of plagioclase, which shows indistinct outlines.Cleavage of biotite in sheet silicate pores is distinct and displays a planar, elongatedgeometry with apertures of 100 nm to 10 µm.
• Solution pores (Fig. 4.3.1c,d) are associated with alteration and exsolution phenomenamainly in feldspars, but also in epidote and micas. Diffuse, cloudy solution pores occur insericitised parts of plagioclase. Cloudy solution pores in K-feldspar run parallel to theperthitic exsolution lamellae and microcline twinning. The size of solution pores is usuallysmaller than 5 µm. SEM investigations revealed apertures of up to several tens of µm,mostly associated with exsolution lamellae within K-feldspar porphyroblasts.
• Microfractures (Fig. 4.3.1e) are represented by long channels with comparatively largeapertures of up to 10 µm. Microfractures running parallel to the borehole axis are restrictedto a 3 cm wide zone adjacent to the borehole and are interpreted as an artefact of the stressredistribution around the injection boreholes (stress relief). Most of the randomly orientedmicrofractures are found in large feldspar grains and reflect brittle behaviour of these grainsduring deformation. Microfractures are the only pore type that is not bound to any texturalor structural feature of the rock. A detailed analysis of microfractures fabrics is given inChapters 6 and 7.

29 NAGRA NTB 00-08
Fig. 4.3.1: Thin section photomicrographs of pore types under crossed nicols (left) and underUV light (right)a) Grain boundary pores around mosaic textured quartz in quartz ribbons (width of image is5 mm), b) Sheet silicate pores in shear band (width of image is 10 mm), c) Cloudy solutionpores in K-feldspar grain with perthitic exsolution lamellae and microcline twinning (widthof image is 10 mm), d) Solution pores in sericitised parts in plagioclase (width of image is10 mm), e) Microfractures in large K-feldspar grain with perthitic exsolution lamellae(width of image is 10 mm).
NAGRA NTB 00-08 30
4.4 SummaryWeakly to undeformed rock matrix displays granoblastic textures with medium- to coarse-grained plagioclase, K-feldspar and quartz. Here, zones of enhanced porosity occur along grainboundaries (grain boundary pores) and, along with exsolution and twinning phenomena, in largefeldspar grains (solution pores). In zones of enhanced ductile deformation, the amount of largefeldspar grains is smaller due to grain size reduction, and the abundance of solution porositytherefore decreases. Sheet silicate porosity in weakly to undeformed matrix is bound to micabands. High sheet silicate porosity is found in shear bands, i.e. in zones of ductile deformation.Quartz ribbons usually contain a dense network of grain boundary pores, and occur in shearbands as well as weakly deformed rock matrix. Microfractures were mainly found in weakly toundeformed matrix and in feldspar grains. Fig. 4.4.1 illustrates the distribution of the differentpore types at their typical position in the matrix rock.
Fig. 4.4.1: Pore type distribution in granodiorite matrix
Matrix s.s. Quartz ribbons Shear bandsMica bands
Shear zone
0.1 m
0.1 mCleavage
Matrix
Grain boundary pores
Sheet silicate pores
Solution pores
Crack pores
Quartz
Feldspar
Micas
Epidote, chlorite
Legend:
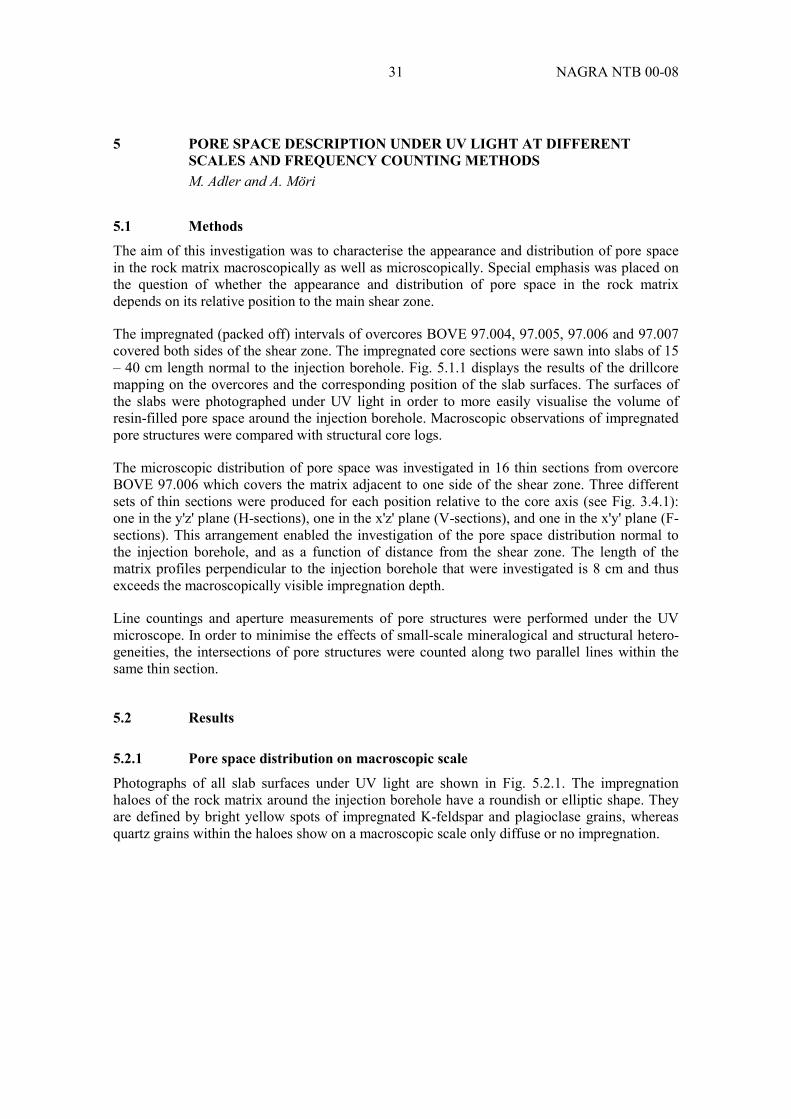
31 NAGRA NTB 00-08
5 PORE SPACE DESCRIPTION UNDER UV LIGHT AT DIFFERENTSCALES AND FREQUENCY COUNTING METHODSM. Adler and A. Möri
5.1 MethodsThe aim of this investigation was to characterise the appearance and distribution of pore spacein the rock matrix macroscopically as well as microscopically. Special emphasis was placed onthe question of whether the appearance and distribution of pore space in the rock matrixdepends on its relative position to the main shear zone.
The impregnated (packed off) intervals of overcores BOVE 97.004, 97.005, 97.006 and 97.007covered both sides of the shear zone. The impregnated core sections were sawn into slabs of 15– 40 cm length normal to the injection borehole. Fig. 5.1.1 displays the results of the drillcoremapping on the overcores and the corresponding position of the slab surfaces. The surfaces ofthe slabs were photographed under UV light in order to more easily visualise the volume ofresin-filled pore space around the injection borehole. Macroscopic observations of impregnatedpore structures were compared with structural core logs.
The microscopic distribution of pore space was investigated in 16 thin sections from overcoreBOVE 97.006 which covers the matrix adjacent to one side of the shear zone. Three differentsets of thin sections were produced for each position relative to the core axis (see Fig. 3.4.1):one in the y'z' plane (H-sections), one in the x'z' plane (V-sections), and one in the x'y' plane (F-sections). This arrangement enabled the investigation of the pore space distribution normal tothe injection borehole, and as a function of distance from the shear zone. The length of thematrix profiles perpendicular to the injection borehole that were investigated is 8 cm and thusexceeds the macroscopically visible impregnation depth.
Line countings and aperture measurements of pore structures were performed under the UVmicroscope. In order to minimise the effects of small-scale mineralogical and structural hetero-geneities, the intersections of pore structures were counted along two parallel lines within thesame thin section.
5.2 Results
5.2.1 Pore space distribution on macroscopic scale
Photographs of all slab surfaces under UV light are shown in Fig. 5.2.1. The impregnationhaloes of the rock matrix around the injection borehole have a roundish or elliptic shape. Theyare defined by bright yellow spots of impregnated K-feldspar and plagioclase grains, whereasquartz grains within the haloes show on a macroscopic scale only diffuse or no impregnation.

NAGRA NTB 00-08 32
Fig. 5.1.1: Drillcore mapping and position of slab surfacesNote the asymmetric shape of the ductile deformation on both sides of the shear zone.
492
m493
m494
m491
m490
m489
m
Com
pre
ssed
air
Pre
ssure
vessel
Pre
ssure
sensor
Shear
zone
Data
Acquis
iton
Syste
m
Offsite
Contr
ol
via
Modem M
odem
PE
TC
onta
iner
Teflon
tubin
g
Scale
s
BOVE97.007
BOVE97.006
BOVE97.005
BOVE97.004
Positio
nofsla
bsurf
ace
Shear
band
Open
fractu
re
Very
weak
cle
avage
Weak
cle
avage
Mediu
mcle
avage
Packer 1
m

33 NAGRA NTB 00-08
The most intensive and extended impregnation occurred in the bottom part of BOVE 97.004 at2.45 m (Fig. 5.2.1, see also Fig. 5.1.1), where a lot of resin was lost at the beginning of theinjection phase (see Chap. 3.3). Structural analysis of the core shows that this section ischaracterised by a high density of shear bands, which partially underwent brittle reactivationindicated by open fractures and cohesionless rock parts (breccia components, fault gouge wasnot preserved/present). Brittly reactivated shear bands therefore induce a high transmissivitycompared to the surrounding rock matrix.
The horizontal and vertical extent of the impregnation haloes were measured on each of the slabsurfaces. On most of the slab surfaces, the longer axis of the fluorescent halo runs parallel to themineral stretching lineation of the rock, which is defined by elongated feldspar grains, quartzribbons and aligned sheet silicates.
Fig. 5.2.1: General orientation of elliptic resin halo on slab surfaces
This trend is also obvious when plotting absolute x- and y-values of the measurements againsteach other (Fig. 5.2.2). Surfaces which were broken during overcoring showed the strongestelongation of the ellipse, reflecting the ductile precursor structures (shear bands) and the (weak)brittle reactivation. A systematic change in shape and extent of the impregnated holes withincreasing distance to the shear zone could not be observed.
The impregnated section of overcore 97.006 was cut along its axis in order to investigatemacroscopically visible rock matrix impregnation as a function of distance to the shear zone.Fig. 5.2.3 shows the core under normal and UV light as well as the positions of the shear zoneand thin sections which were used for microscopic analyses. Although the shear zone and thematrix beyond (south part of the shear zone in Fig. 5.2.3) were isolated from the injectionborehole by a packer, they have been affected by resin-impregnation and exhibit yellowcoloured feldspar grains. However, there is a slight decrease in brightness and penetration depthof resin into the rock matrix with increasing vicinity to the shear zone. The poor impregnationclose to the shear zone may be related to the lack of shear bands in the northern part of thematrix close to the shear zone (see Fig. 5.1.1).
V
H
Reference line
Stretching lineation
Injection borehole
Shape of resin-impregnated area
x-axis
y-axis
Surface of impregnated slab:
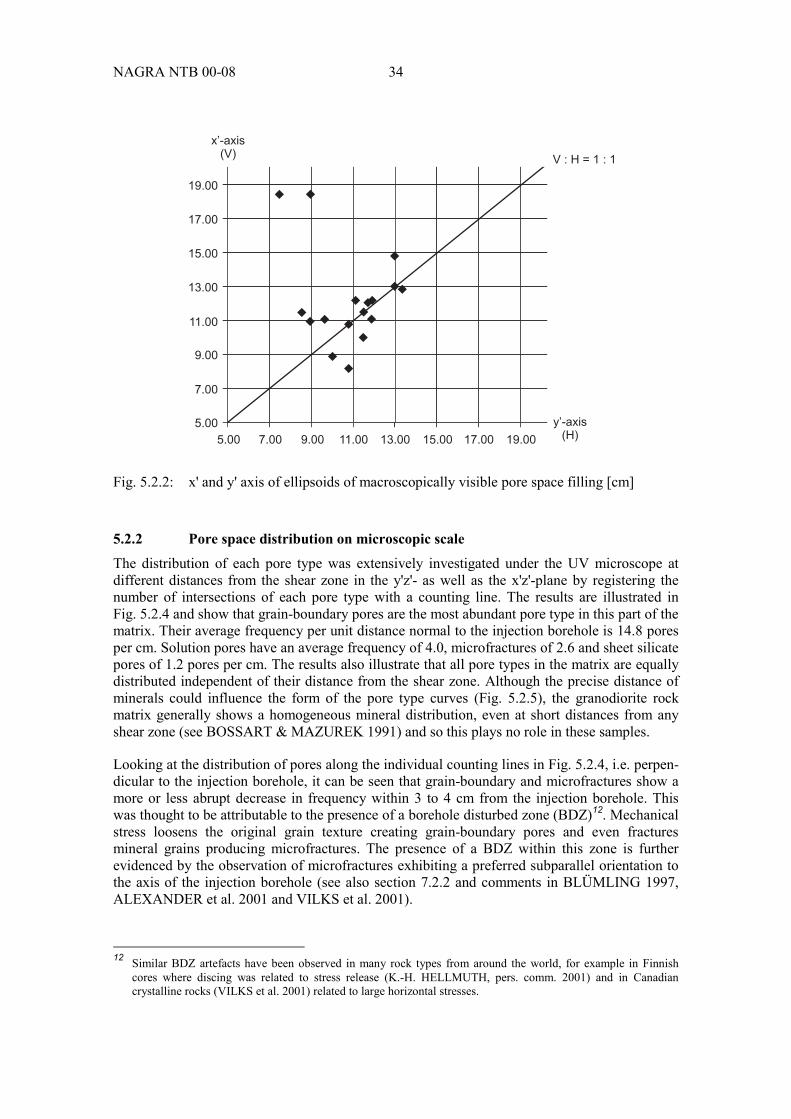
NAGRA NTB 00-08 34
Fig. 5.2.2: x' and y' axis of ellipsoids of macroscopically visible pore space filling [cm]
5.2.2 Pore space distribution on microscopic scaleThe distribution of each pore type was extensively investigated under the UV microscope atdifferent distances from the shear zone in the y'z'- as well as the x'z'-plane by registering thenumber of intersections of each pore type with a counting line. The results are illustrated inFig. 5.2.4 and show that grain-boundary pores are the most abundant pore type in this part of thematrix. Their average frequency per unit distance normal to the injection borehole is 14.8 poresper cm. Solution pores have an average frequency of 4.0, microfractures of 2.6 and sheet silicatepores of 1.2 pores per cm. The results also illustrate that all pore types in the matrix are equallydistributed independent of their distance from the shear zone. Although the precise distance ofminerals could influence the form of the pore type curves (Fig. 5.2.5), the granodiorite rockmatrix generally shows a homogeneous mineral distribution, even at short distances from anyshear zone (see BOSSART & MAZUREK 1991) and so this plays no role in these samples.
Looking at the distribution of pores along the individual counting lines in Fig. 5.2.4, i.e. perpen-dicular to the injection borehole, it can be seen that grain-boundary and microfractures show amore or less abrupt decrease in frequency within 3 to 4 cm from the injection borehole. Thiswas thought to be attributable to the presence of a borehole disturbed zone (BDZ)12. Mechanicalstress loosens the original grain texture creating grain-boundary pores and even fracturesmineral grains producing microfractures. The presence of a BDZ within this zone is furtherevidenced by the observation of microfractures exhibiting a preferred subparallel orientation tothe axis of the injection borehole (see also section 7.2.2 and comments in BLÜMLING 1997,ALEXANDER et al. 2001 and VILKS et al. 2001).
12 Similar BDZ artefacts have been observed in many rock types from around the world, for example in Finnish
cores where discing was related to stress release (K.-H. HELLMUTH, pers. comm. 2001) and in Canadiancrystalline rocks (VILKS et al. 2001) related to large horizontal stresses.
19.00
17.00
15.00
13.00
11.00
9.00
7.00
5.00
5.00 7.00 9.00 11.00 13.00 15.00 17.00 19.00
x’-axis(V)
y’-axis(H)
V : H = 1 : 1

35 NAGRA NTB 00-08
Fig. 5.2.3: Slab surfaces photographed under UV light (position of surface is indicated in pho-tograph): a) BOVE 97.004, b) BOVE 97.005, c) BOVE 97.006, d) BOVE 97.007
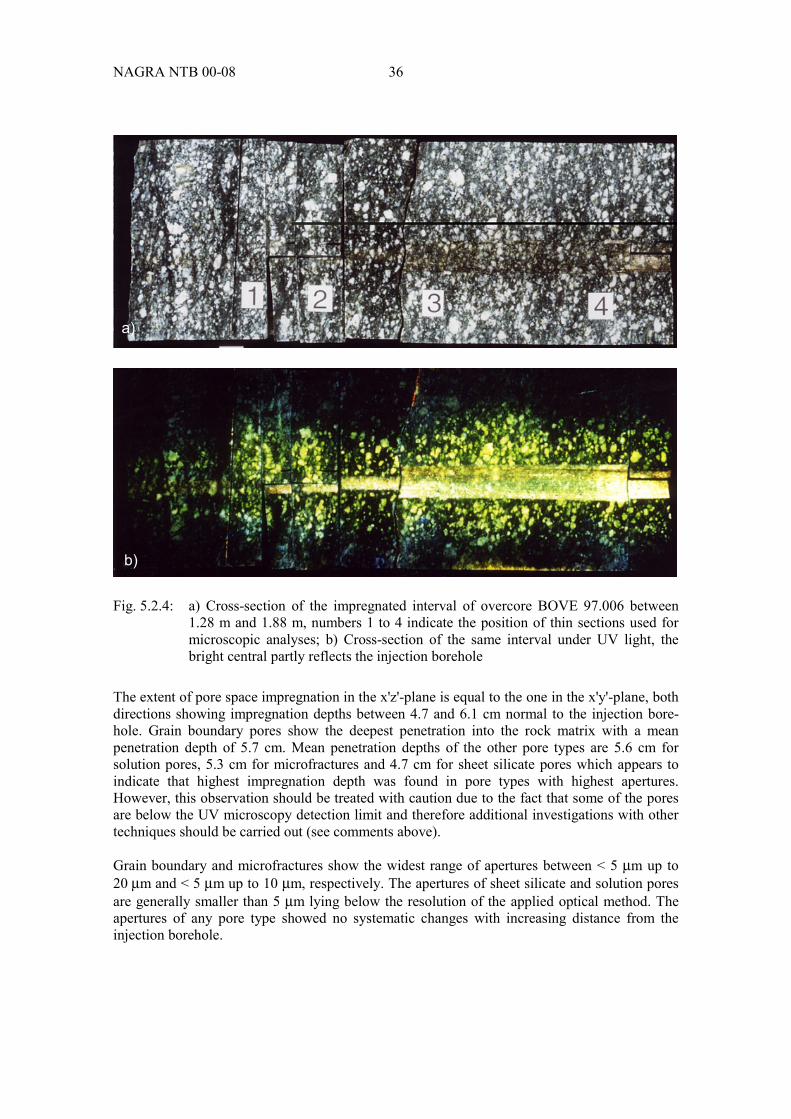
NAGRA NTB 00-08 36
Fig. 5.2.4: a) Cross-section of the impregnated interval of overcore BOVE 97.006 between1.28 m and 1.88 m, numbers 1 to 4 indicate the position of thin sections used formicroscopic analyses; b) Cross-section of the same interval under UV light, thebright central partly reflects the injection borehole
The extent of pore space impregnation in the x'z'-plane is equal to the one in the x'y'-plane, bothdirections showing impregnation depths between 4.7 and 6.1 cm normal to the injection bore-hole. Grain boundary pores show the deepest penetration into the rock matrix with a meanpenetration depth of 5.7 cm. Mean penetration depths of the other pore types are 5.6 cm forsolution pores, 5.3 cm for microfractures and 4.7 cm for sheet silicate pores which appears toindicate that highest impregnation depth was found in pore types with highest apertures.However, this observation should be treated with caution due to the fact that some of the poresare below the UV microscopy detection limit and therefore additional investigations with othertechniques should be carried out (see comments above).
Grain boundary and microfractures show the widest range of apertures between < 5 µm up to20 µm and < 5 µm up to 10 µm, respectively. The apertures of sheet silicate and solution poresare generally smaller than 5 µm lying below the resolution of the applied optical method. Theapertures of any pore type showed no systematic changes with increasing distance from theinjection borehole.
a)
b)
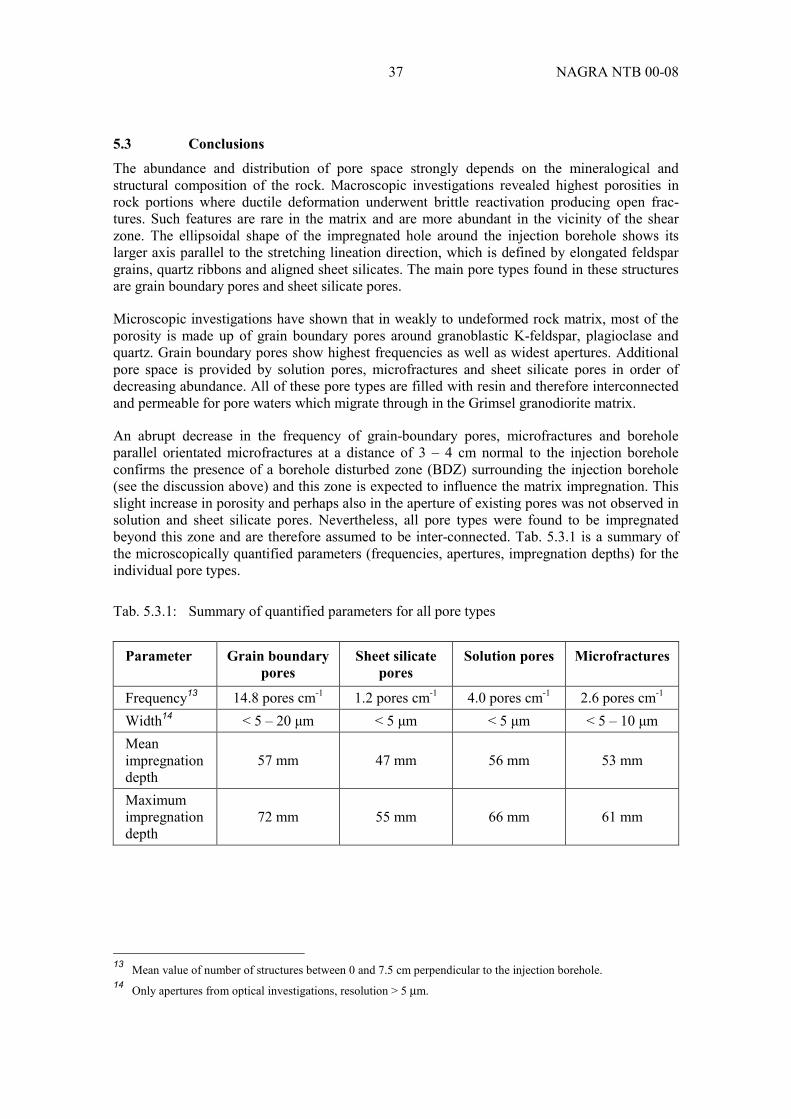
37 NAGRA NTB 00-08
5.3 ConclusionsThe abundance and distribution of pore space strongly depends on the mineralogical andstructural composition of the rock. Macroscopic investigations revealed highest porosities inrock portions where ductile deformation underwent brittle reactivation producing open frac-tures. Such features are rare in the matrix and are more abundant in the vicinity of the shearzone. The ellipsoidal shape of the impregnated hole around the injection borehole shows itslarger axis parallel to the stretching lineation direction, which is defined by elongated feldspargrains, quartz ribbons and aligned sheet silicates. The main pore types found in these structuresare grain boundary pores and sheet silicate pores.
Microscopic investigations have shown that in weakly to undeformed rock matrix, most of theporosity is made up of grain boundary pores around granoblastic K-feldspar, plagioclase andquartz. Grain boundary pores show highest frequencies as well as widest apertures. Additionalpore space is provided by solution pores, microfractures and sheet silicate pores in order ofdecreasing abundance. All of these pore types are filled with resin and therefore interconnectedand permeable for pore waters which migrate through in the Grimsel granodiorite matrix.
An abrupt decrease in the frequency of grain-boundary pores, microfractures and boreholeparallel orientated microfractures at a distance of 3 – 4 cm normal to the injection boreholeconfirms the presence of a borehole disturbed zone (BDZ) surrounding the injection borehole(see the discussion above) and this zone is expected to influence the matrix impregnation. Thisslight increase in porosity and perhaps also in the aperture of existing pores was not observed insolution and sheet silicate pores. Nevertheless, all pore types were found to be impregnatedbeyond this zone and are therefore assumed to be inter-connected. Tab. 5.3.1 is a summary ofthe microscopically quantified parameters (frequencies, apertures, impregnation depths) for theindividual pore types.
Tab. 5.3.1: Summary of quantified parameters for all pore types
Parameter Grain boundarypores
Sheet silicatepores
Solution pores Microfractures
Frequency13 14.8 pores cm-1 1.2 pores cm-1 4.0 pores cm-1 2.6 pores cm-1
Width14 < 5 – 20 µm < 5 µm < 5 µm < 5 – 10 µmMeanimpregnationdepth
57 mm 47 mm 56 mm 53 mm
Maximumimpregnationdepth
72 mm 55 mm 66 mm 61 mm
13 Mean value of number of structures between 0 and 7.5 cm perpendicular to the injection borehole.14 Only apertures from optical investigations, resolution > 5 µm.
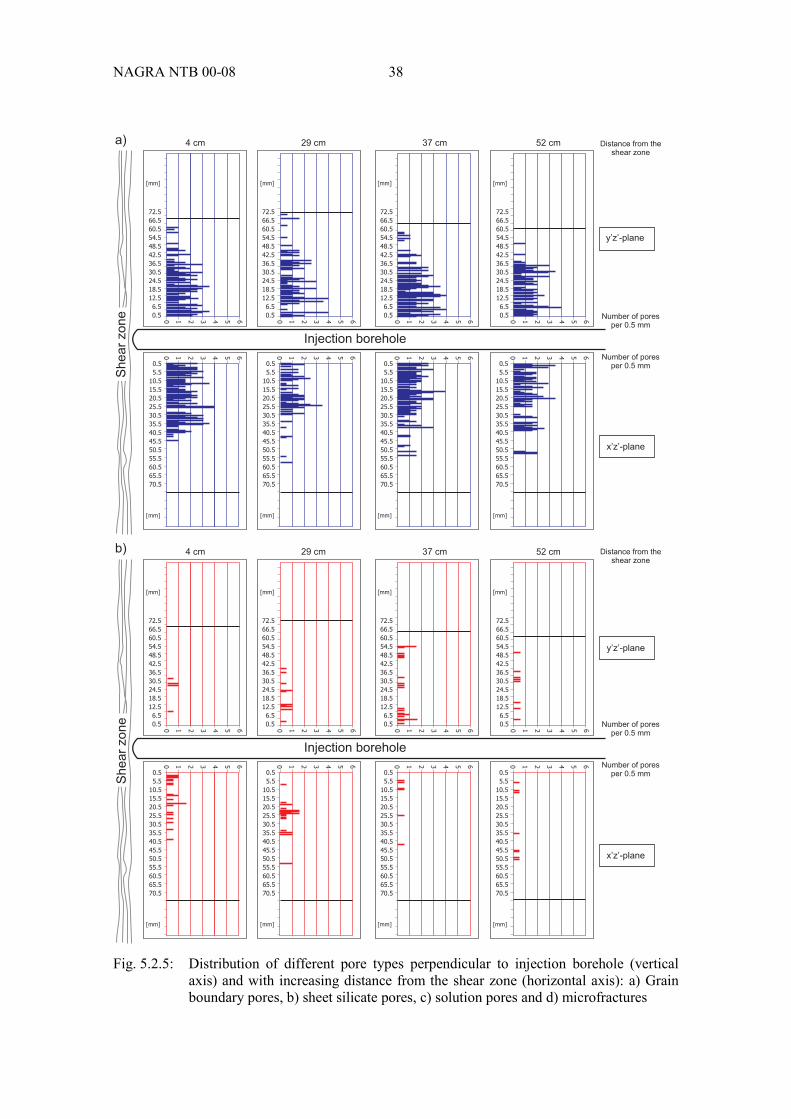
NAGRA NTB 00-08 38
Fig. 5.2.5: Distribution of different pore types perpendicular to injection borehole (verticalaxis) and with increasing distance from the shear zone (horizontal axis): a) Grainboundary pores, b) sheet silicate pores, c) solution pores and d) microfractures
a)
b)
y’z’-plane
x’z’-plane
Injection borehole
4 cm 29 cm 37 cm 52 cm
y’z’-plane
x’z’-plane
Distance from theshear zone
Injection borehole
4 cm 29 cm 37 cm 52 cm
Number of poresper 0.5 mm
Number of poresper 0.5 mm
Distance from theshear zone
Number of poresper 0.5 mm
Number of poresper 0.5 mm
6543210 6543210 6543210 6543210
6543210 6543210 6543210 6543210
6543210 6543210 6543210 6543210
6543210 6543210 6543210 6543210
72.5
66.5
60.5
54.5
48.5
42.5
36.5
30.5
24.5
18.5
12.5
6.5
0.5
0.5
5.5
10.5
15.5
20.5
25.5
30.5
35.5
40.5
45.5
50.5
55.5
60.5
65.5
70.5
0.5
5.5
10.5
15.5
20.5
25.5
30.5
35.5
40.5
45.5
50.5
55.5
60.5
65.5
70.5
0.5
5.5
10.5
15.5
20.5
25.5
30.5
35.5
40.5
45.5
50.5
55.5
60.5
65.5
70.5
0.5
5.5
10.5
15.5
20.5
25.5
30.5
35.5
40.5
45.5
50.5
55.5
60.5
65.5
70.5
72.5
66.5
60.5
54.5
48.5
42.5
36.5
30.5
24.5
18.5
12.5
6.5
0.5
72.5
66.5
60.5
54.5
48.5
42.5
36.5
30.5
24.5
18.5
12.5
6.5
0.5
72.5
66.5
60.5
54.5
48.5
42.5
36.5
30.5
24.5
18.5
12.5
6.5
0.5
72.5
66.5
60.5
54.5
48.5
42.5
36.5
30.5
24.5
18.5
12.5
6.5
0.5
0.5
5.5
10.5
15.5
20.5
25.5
30.5
35.5
40.5
45.5
50.5
55.5
60.5
65.5
70.5
0.5
5.5
10.5
15.5
20.5
25.5
30.5
35.5
40.5
45.5
50.5
55.5
60.5
65.5
70.5
0.5
5.5
10.5
15.5
20.5
25.5
30.5
35.5
40.5
45.5
50.5
55.5
60.5
65.5
70.5
0.5
5.5
10.5
15.5
20.5
25.5
30.5
35.5
40.5
45.5
50.5
55.5
60.5
65.5
70.5
72.5
66.5
60.5
54.5
48.5
42.5
36.5
30.5
24.5
18.5
12.5
6.5
0.5
72.5
66.5
60.5
54.5
48.5
42.5
36.5
30.5
24.5
18.5
12.5
6.5
0.5
72.5
66.5
60.5
54.5
48.5
42.5
36.5
30.5
24.5
18.5
12.5
6.5
0.5
[mm][mm] [mm] [mm]
[mm][mm] [mm] [mm]
[mm][mm] [mm] [mm]
[mm][mm] [mm] [mm]
Sh
ea
rzo
ne
Sh
ea
rzo
ne

39 NAGRA NTB 00-08
Fig. 5.2.5: (Continuation)
Injection borehole
4 cm 29 cm 37 cm 52 cm
Injection borehole
0.5
5.5
10.5
15.5
20.5
25.5
30.5
35.5
40.5
45.5
50.5
55.5
60.5
65.5
70.5
0.5
5.5
10.5
15.5
20.5
25.5
30.5
35.5
40.5
45.5
50.5
55.5
60.5
65.5
70.5
0.5
5.5
10.5
15.5
20.5
25.5
30.5
35.5
40.5
45.5
50.5
55.5
60.5
65.5
70.5
0.5
5.5
10.5
15.5
20.5
25.5
30.5
35.5
40.5
45.5
50.5
55.5
60.5
65.5
70.5
72.5
66.5
60.5
54.5
48.5
42.5
36.5
30.5
24.5
18.5
12.5
6.5
0.5
72.5
66.5
60.5
54.5
48.5
42.5
36.5
30.5
24.5
18.5
12.5
6.5
0.5
72.5
66.5
60.5
54.5
48.5
42.5
36.5
30.5
24.5
18.5
12.5
6.5
0.5
72.5
66.5
60.5
54.5
48.5
42.5
36.5
30.5
24.5
18.5
12.5
6.5
0.5
0.5
5.5
10.5
15.5
20.5
25.5
30.5
35.5
40.5
45.5
50.5
55.5
60.5
65.5
70.5
0.5
5.5
10.5
15.5
20.5
25.5
30.5
35.5
40.5
45.5
50.5
55.5
60.5
65.5
70.5
0.5
5.5
10.5
15.5
20.5
25.5
30.5
35.5
40.5
45.5
50.5
55.5
60.5
65.5
70.5
0.5
5.5
10.5
15.5
20.5
25.5
30.5
35.5
40.5
45.5
50.5
55.5
60.5
65.5
70.5
72.5
66.5
60.5
54.5
48.5
42.5
36.5
30.5
24.5
18.5
12.5
6.5
0.5
72.5
66.5
60.5
54.5
48.5
42.5
36.5
30.5
24.5
18.5
12.5
6.5
0.5
72.5
66.5
60.5
54.5
48.5
42.5
36.5
30.5
24.5
18.5
12.5
6.5
0.5
72.5
66.5
60.5
54.5
48.5
42.5
36.5
30.5
24.5
18.5
12.5
6.5
0.5
6543210 6543210 6543210 6543210
6543210 6543210 6543210 6543210
6543210 6543210 6543210 6543210
6543210 6543210 6543210 6543210
[mm][mm] [mm] [mm]
[mm][mm] [mm] [mm]
[mm][mm] [mm] [mm]
[mm][mm] [mm] [mm]
y’z’-plane
x’z’-plane
y’z’-plane
x’z’-plane
Distance from theshear zone
Number of poresper 0.5 mm
Number of poresper 0.5 mm
Number of poresper 0.5 mm
Number of poresper 0.5 mm
4 cm 29 cm 37 cm 52 cm Distance from theshear zone
c)
d)
Sh
ea
rzo
ne
Sh
ea
rzo
ne

41 NAGRA NTB 00-08
6 SCANNING ELECTRON MICROSCOPE INVESTIGATIONS OF IN SITUPOROSITYK. Ota and T. Ando
6.1 MethodsNumerous techniques exist for 2-D and 3-D imaging of pore space geometry so a literaturestudy was conducted to evaluate the most appropriate method for the CP project. In the end, itwas decided to evaluate a novel system with serial sectioning combined with scanning electronmicroscope (SEM) imaging, where the minimum pore size detectable is about 100 nm. Incomparison to this technique, the shortcomings of the other methods may be summarised asfollows:
1. CLSM (confocal laser scanning microscopy): see FREDRICH (1999) for a detaileddiscussion of the method, and FREDRICH et al. (1995) and HEATH & MONTOTO (1996)for examples of the application of the technique on rock samples. Resolution is only ~ 200nm and the volume of rock sample examined in each sweep is 2 to 3 orders of magnitudeless than with the SEM.
2. 3-D reconstruction of sequential optical photomicrographs obtained by repeated polishing:while this method is effective, it is very time-consuming/tedious (see, for example,KOPLIK et al. 1984, LIN et al. 1986 and BYEGÅRD et al. 2001).
3. X-ray CT (computer tomography) and gamma-ray CT: according to BROWN et al. (1993)both methods have a lower resolution than SEM (100 µm – 1 mm and 1 mm, respectively).
4. MRI (magnetic resonance imaging): also has a lower resolution (~ 25 µm).
5. Synchrotron computed microtomography: has a slightly higher resolution (7.5 – 10 µm,SPANNE et al. 1994, AUZERAIS et al. 1996), but is presently not applicable to rocksamples.
Here, detailed SEM examinations were performed on the sub-samples of core slab BOVE97.007 at 1.40 m. The sub-samples at 30 to 55 mm from the injection borehole were examined,and those free of BDZ artefacts15 were used for further study. Unpolished, broken surfaces andthin section (i.e. polished) surfaces were carefully examined in order to understand the nature ofin situ connected porosity. Standard petrological observation was performed on the thin sectionby fluorescent microscopy for direct comparison with the SEM examination results.
A series of successive 2-D images of the resin-filled pore space was obtained by repeatedlygrinding / polishing 10 µm off the sub-sample and capturing backscattered electron (BSE)images using the SEM. The BSE images clearly show atomic number contrast, which enable theeasy distinction of resin-filled pore spaces from constituent minerals. 3-D reconstruction of thein situ connected porosity was created after a total of 51 pictures were digitised and appropriate2-D images were processed through several steps of data treatment (e.g. line-thinning andthresholding) using commercially available visualisation software, which had been developedthrough JNC's Kamaishi In Situ Experiments (OTA et al. 1999). These images were finally usedto produce a 3-D reconstruction of the in situ connected porosity.
15 Core examinations in UV light revealed a 30 – 40 mm BDZ around the injection borehole.
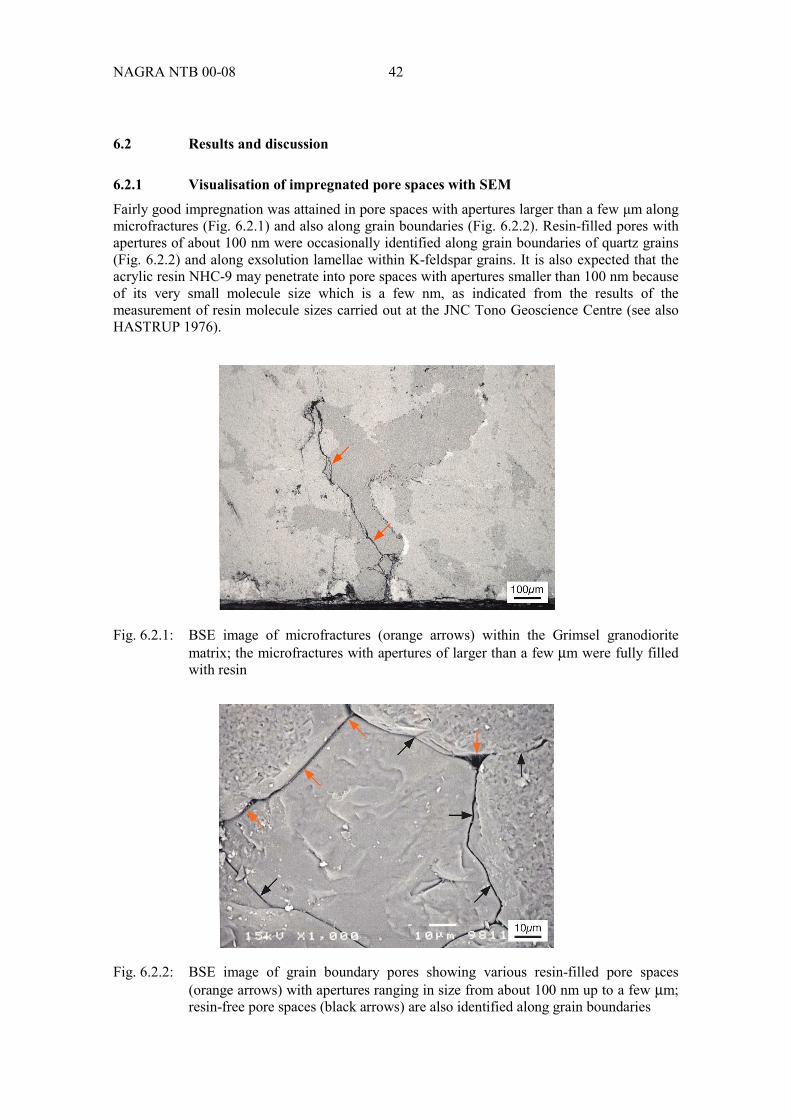
NAGRA NTB 00-08 42
6.2 Results and discussion
6.2.1 Visualisation of impregnated pore spaces with SEM
Fairly good impregnation was attained in pore spaces with apertures larger than a few µm alongmicrofractures (Fig. 6.2.1) and also along grain boundaries (Fig. 6.2.2). Resin-filled pores withapertures of about 100 nm were occasionally identified along grain boundaries of quartz grains(Fig. 6.2.2) and along exsolution lamellae within K-feldspar grains. It is also expected that theacrylic resin NHC-9 may penetrate into pore spaces with apertures smaller than 100 nm becauseof its very small molecule size which is a few nm, as indicated from the results of themeasurement of resin molecule sizes carried out at the JNC Tono Geoscience Centre (see alsoHASTRUP 1976).
Fig. 6.2.1: BSE image of microfractures (orange arrows) within the Grimsel granodioritematrix; the microfractures with apertures of larger than a few µm were fully filledwith resin
Fig. 6.2.2: BSE image of grain boundary pores showing various resin-filled pore spaces(orange arrows) with apertures ranging in size from about 100 nm up to a few µm;resin-free pore spaces (black arrows) are also identified along grain boundaries

43 NAGRA NTB 00-08
The SEM examination, however, revealed that the entire pore space was not filled with resin,even though the same pores were identified as thin yellow lines on the thin sections investigatedunder the fluorescent microscope at lower resolutions (Figs. 6.2.3a and b). This disagreementmight be caused by partial resin lost from the sample surface during thin section preparation orby the effect that, even though resin impregnation is not complete through the whole thinsection, UV illumination passes through and might induce fluorescence in the "hidden" part ofthe resin, giving the appearance of complete resin impregnation of the pore space on the surface(Fig. 6.2.4, case A; see Fig. 6.2.3a and b).
A similar appearance will also be produced when a pore space fully filled with the resin existsjust below the surface (Fig. 6.2.4, case B; see Fig. 6.2.3a and b). Hence, in some cases, imagesobtained under UV illumination may represent neither the actual distribution, geometry norinterconnection of pore spaces in the matrix, tending to overestimate pore space frequency,aperture and availability. For example, the results of image analysis on both the BSE image (topimage of Fig. 6.2.3a) and corresponding thin section photomicrograph (clipped image out ofFig. 6.2.3b) demonstrate that the percentage of the total area of resin-filled spaces estimated onthe photomicrograph (0.023 ± 0.007) is approximately 2.6 times higher than that given by theBSE image (0.0089 ± 0.0027).
6.2.2 3-D reconstruction of impregnated pore spaceMatrix porosity is made up of a network of four interconnected pore types: grain boundarypores, solution pores, sheet silicate pores and microfractures. It was shown that not all porespaces along a certain pore type are accessible to the acrylic resin. The grain boundary poresand the microfractures have thin and elongated pore shapes in which "microchannels" (i.e.accessible spaces) and "barriers" (i.e. non-accessible spaces) certainly exist. In particular, 3-Dreconstructions of matrix porosity revealed in detail its non-planar geometry and the"microchannel and barrier" structure (Fig. 6.2.5a).
An uneven microfracture plane is irregularly bent and often locally kinked and the barriers aremostly defined by sharp angular hinges, which suggests that such changes of the microporosityprobably affect its accessibility to contaminants (Fig. 6.2.5b and c). Specifically, the followingchanges of pore space geometry can be considered:
• Pore spaces might be rather constricted near and at the hinge, reducing accessibility tocontaminants.
• High tortuousity of pore spaces would lengthen pathways, causing a significant delay in thediffusion of contaminants into the barrier16.
• Rough surface of pore spaces might hinder the resin from diffusing into the barrier.
16 Such tortuosity and constrictivity in the matrix pore space is usually treated simply in transport codes and
combined into a single factor, G, the geometry factor. This is usually taken to be G = б t-2 where б is constrictivityand t is tortuosity. The pore diffusion coefficient, Dp, is simply the quotient of the free water diffusion coeffi-cient, Dw, and the geometry factor, G. This being the case, changes in G are normally treated by varying Dp inthe transport codes (see also treatment in Chapter 9 and comments in Chapter 10).

NAGRA NTB 00-08 44
Fig. 6.2.3: BSE images (a1 and a2) and corresponding photomicrograph (b) of pore types in theGrimsel granodiorite matrix, a disagreement in the appearance of the pore spaces isobviously seen between (a) and (b); (a) All pore spaces are not accessible to theresin (orange arrow: resin-filled pore space, black arrow: resin-free pore space), b)Labelled A, B and C are corresponding to the cases A, B and C, respectively,shown in Fig. 6.2.4
a )1
a )2
b)50 m�
50 m�
10 m�

45 NAGRA NTB 00-08
Fig. 6.2.4: Schematic representations of three possible cases of resin impregnation, whichcould cause differences in the appearance of the pores between SEM examinationand fluorescent microscopy UVOrange arrow: resin-filled pore space, black arrow: resin-free pore space.
6.3 Conclusions
Only part of the pore space within the matrix was found to be accessible for the resin due to thepresence of "channel and barrier" structures with dimensions less than 1 µm. 3-D images of thematrix porosity showed that the constrictive and/or tortuous geometry of the pore space is likelyto reduce accessibility to diffusing contaminants and resin. Characterisation of the matrixporosity by standard petrological techniques may, in some cases, cause an overestimation ofapertures, frequency and availability of pore space. Consequently, additional techniques wereevaluated for the determination of the parameters so allowing estimation of the diffusion-accessible rock volume in the matrix (e.g. microscopic examinations in the order of nm to µm orchemical analysis of resin-filled pore space, see Chapters 7 and 8).
SEM
UV

NAGRA NTB 00-08 46
Fig. 6.2.5a: Top, left and bottom views of 3-D reconstructions of rock sample (top) and in situconnected porosity (bottom); these 3-D images consist of 51 2-D images that are10 µm apart
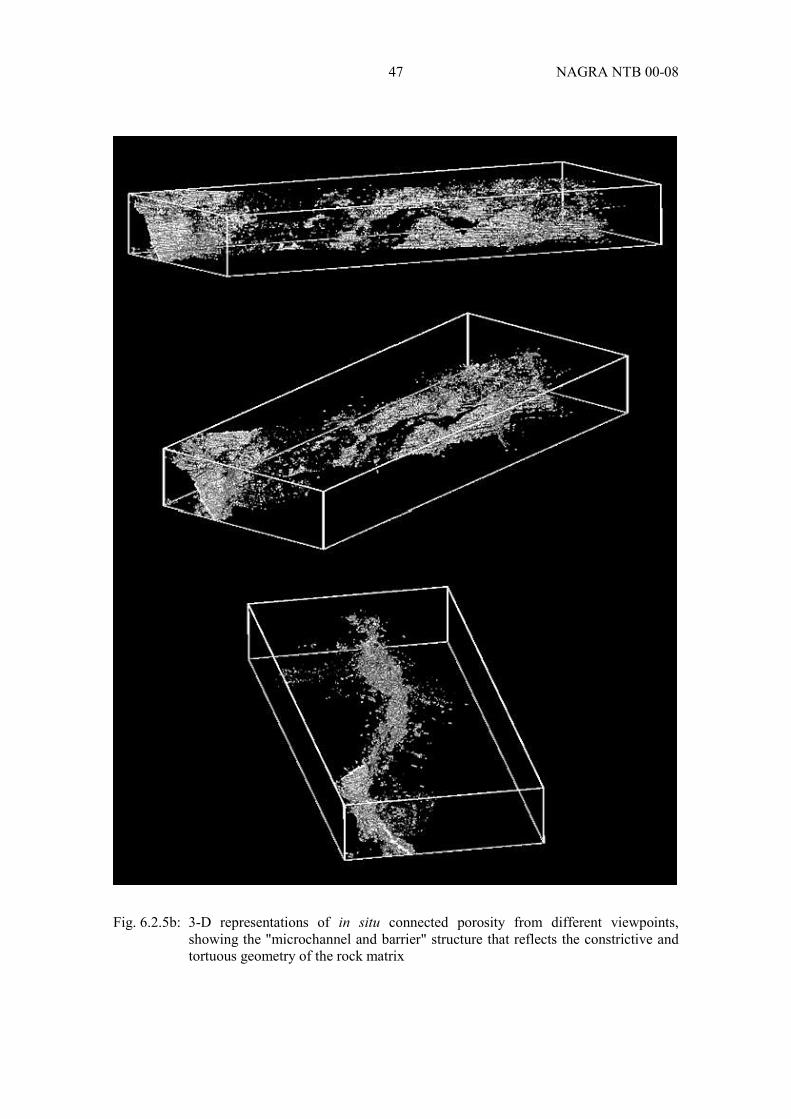
47 NAGRA NTB 00-08
Fig. 6.2.5b: 3-D representations of in situ connected porosity from different viewpoints,showing the "microchannel and barrier" structure that reflects the constrictive andtortuous geometry of the rock matrix

NAGRA NTB 00-08 48
Fig. 6.2.5c: 3-D representations of in situ connected porosity in 3 segmented portions of therock volume; the whole 3-D image from the same viewpoint is shown inFig. 6.2.5b (middle)

49 NAGRA NTB 00-08
7 UNIVERSAL-STAGE MEASUREMENTS AND DETERMINATION OFPOROSITY, PERMEABILITY AND SEISMIC VELOCITIESM. Schild, S. Siegesmund, A. Vollbrecht and M. Mazurek
A large laboratory programme of optical and petrophysical techniques was carried out at theUniversity of Göttingen, Germany. The investigations were aimed at:
• determining the general orientations and frequencies of pore types
• determining the variation in permeability as a function of rock fabric
• determining the effective porosity on in situ impregnated and laboratory-impregnatedsamples
• determining the P-wave pattern
as a function of rock fabric, particularly with increasing ductile deformation in the vicinity of ashear zone. This work was intended to complement the work carried out in Switzerland andJapan by employing additional methods to assess the same questions being addressed by thesetwo groups.
7.1 MethodsIn addition to the analytical techniques mentioned below, the mineralogical composition of thesamples was determined by transmitted light microscopy in combination with point countingand scanning electron microscopy (SEM) and cathodo-luminescence microscopy (see alsoChapter 4).
7.1.1 Sample reference systemThe three samples examined for these studies came from sub-samples of the cores BOVE97.004 and 97.005 and were named LS, SZ and HS. Sample SZ was taken from the immediateshear zone, sample LS from the southern side of the shear zone and sample HS from thenorthern side of the shear zone in order to check whether matrix porosity is a function ofdistance to the shear zone. All samples (thin sections, cylinders and spheres) were oriented withrespect to the macroscopic fabric elements (cleavage, stretching lineation) as shown in Fig.7.1.1. Like all other fabric diagrams, the pole figures were plotted on a Schmidt net (lowerhemisphere) with the X axis oriented parallel to the stretching lineation, and Z axis lying coaxialto the foliation pole, and the XY plane parallel cleavage or foliation.
7.1.2 Universal-stage measurementsThe 3-D pattern (orientations and frequencies) of different pore types was measured on standardthin sections using a fluorescence microscope equipped with an Universal-stage. Around 200pores in quartz, about 150 in feldspar, and about 200 mica cleavage planes were measured persection. In order to record all pore orientations, the measurements for each sample were carriedout in three mutually perpendicular sections.
Composite pole figures were computed from the three sections and errors induced by theoverlap of Schmidt net areas were eliminated statistically (for details see VOLLBRECHT et al.1991). During Universal-stage measurements, the pore types are classified (SCHILD 1999)according to their host grain, their position (inter- or intragranular, interphase), and their state
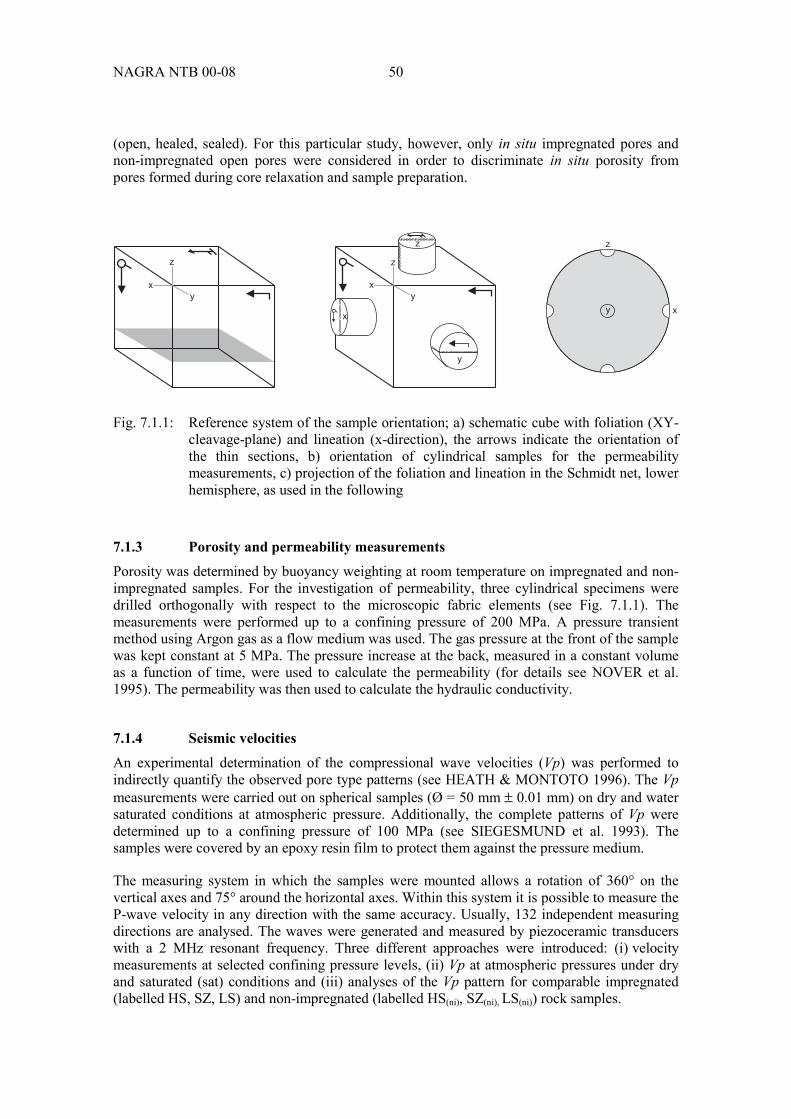
NAGRA NTB 00-08 50
(open, healed, sealed). For this particular study, however, only in situ impregnated pores andnon-impregnated open pores were considered in order to discriminate in situ porosity frompores formed during core relaxation and sample preparation.
Fig. 7.1.1: Reference system of the sample orientation; a) schematic cube with foliation (XY-cleavage-plane) and lineation (x-direction), the arrows indicate the orientation ofthe thin sections, b) orientation of cylindrical samples for the permeabilitymeasurements, c) projection of the foliation and lineation in the Schmidt net, lowerhemisphere, as used in the following
7.1.3 Porosity and permeability measurementsPorosity was determined by buoyancy weighting at room temperature on impregnated and non-impregnated samples. For the investigation of permeability, three cylindrical specimens weredrilled orthogonally with respect to the microscopic fabric elements (see Fig. 7.1.1). Themeasurements were performed up to a confining pressure of 200 MPa. A pressure transientmethod using Argon gas as a flow medium was used. The gas pressure at the front of the samplewas kept constant at 5 MPa. The pressure increase at the back, measured in a constant volumeas a function of time, were used to calculate the permeability (for details see NOVER et al.1995). The permeability was then used to calculate the hydraulic conductivity.
7.1.4 Seismic velocitiesAn experimental determination of the compressional wave velocities (Vp) was performed toindirectly quantify the observed pore type patterns (see HEATH & MONTOTO 1996). The Vpmeasurements were carried out on spherical samples (Ø = 50 mm ± 0.01 mm) on dry and watersaturated conditions at atmospheric pressure. Additionally, the complete patterns of Vp weredetermined up to a confining pressure of 100 MPa (see SIEGESMUND et al. 1993). Thesamples were covered by an epoxy resin film to protect them against the pressure medium.
The measuring system in which the samples were mounted allows a rotation of 360° on thevertical axes and 75° around the horizontal axes. Within this system it is possible to measure theP-wave velocity in any direction with the same accuracy. Usually, 132 independent measuringdirections are analysed. The waves were generated and measured by piezoceramic transducerswith a 2 MHz resonant frequency. Three different approaches were introduced: (i) velocitymeasurements at selected confining pressure levels, (ii) Vp at atmospheric pressures under dryand saturated (sat) conditions and (iii) analyses of the Vp pattern for comparable impregnated(labelled HS, SZ, LS) and non-impregnated (labelled HS(ni), SZ(ni), LS(ni)) rock samples.
y
z
x
z
x
y
z
x
y
y
x
z

51 NAGRA NTB 00-08
7.2 Results
7.2.1 Petrography
The three investigated samples (HS, SZ and LS) show a comparable mineralogical composition.They are mainly composed of K-feldspar (12 – 24 vol%), plagioclase (29 – 30 vol%), quartz (27– 28 vol%) and biotite (7 – 11 vol%) with accessory muscovite / sericite, apatite, sphene,epidote, zircon, chlorite, calcite and opaques. The samples show a clear foliation, which is mostclearly pronounced in SZ samples. The foliation is indicated by quartz lenses and micaceousminerals with preferred orientation. Besides the various forms of the foliation the samples alsoshow differences in terms of their brittle deformation fabric. The sample (LS) with the weakestfoliation has a more marked cataclasis of the feldspars. These observations were confirmed bymicroscopic investigations.
7.2.2 Pore space fabrics
The pore types observed in these samples are sheet silicate pores, grain boundary pores withinquartz polycrystals and microfractures in feldspars formed along cleavage planes. In addition,grain boundary pores between quartz and feldspars have been detected. There is no evidencethat a significant number of open fractures were produced during sample preparation, since theyshow a consistent orientation in different thin sections. Moreover, the orientation and geometryof the micro-fractures is independent of the sample geometry.
A larger number of open non-impregnated sheet silicate pores were only observed parallel to the(001)-cleavage planes of micas and a distinction between open and non-impregnated pores wasonly possible by fluorescence microscopy at high magnification. Because alteration phenomenaor mineral coatings along open non-impregnated cleavage planes are lacking, it is assumed thatthey mostly formed during core relaxation or sample preparation. It cannot be excluded thatindividual open cleavage planes formed earlier but were isolated from the interconnectednetwork. The corresponding pole figures for grain boundary pores and microfractures aredirectly correlated with the mica textures and show comparable patterns for the three samples,i.e., a concentration close to the foliation normal (Z) and tendency to form a girdle around thelineation (Fig. 7.2.1a-c). The sample from the immediate shear zone (SZ) shows the strongestpreferred orientation which corresponds to the distinct mylonitic foliation and the related micatextures. The scattering of poles from the Z- to the X-direction may be explained by lens-shapedfeldspar porphyroclasts which control the shape orientation of the mica flakes. Accordingly, forsample SZ the stronger concentration of poles around Z can be related to increasingmylonitisation which causes a flattering and grain size reduction of the porphyroclasts.
Grain boundary pores around quartz polycrystals form a well developed inter-connectednetwork which is almost completely impregnated indicating that these existed in situ. Theirlengths range approximately between 100 and 200 µm. Scanning electron microscopy revealsthat these pores display rather rough surfaces. In contrast, non-impregnated open grain boundarypores in quartz are comparatively rare and show maximum length of only 100 µm and smallerwidths. In addition, few open microfractures were observed. The pole figures for openinterconnected in situ pores (Fig. 7.2.1d-f) which are controlled by the prevailing grainboundary network show for all three samples an orthogonal pattern with a tendency of girdlesaround the reference axes (X, Y, Z). The intensity of preferred orientation, however, is low ascompared with other pore types. The lowest intensity and a comparably diffuse pattern isdeveloped in sample LS.

NAGRA NTB 00-08 52
Fig. 7.2.1: Pole figures of pores for the samples HS, SZ and LS in: (a) to (c) (001) cleavageplanes of micas; (d) to (f) grain boundary pores in quartz; (g) to (i) microfracturesin feldspars; and (j) to (l) bulk microfractures fabricSchmidt net, lower hemisphere; n = number of measured cracks and vgv = multiple ofrandom distribution
1.02.03.04.05.06.07.07.5
1.02.03.04.04.8
1.02.03.04.05.05.4
1.02.03.03.5
1.01.52.02.5
1.02.03.04.04.5
1.02.03.04.05.06.06.5
1.02.03.04.05.05.8
1.02.03.04.05.05.5
1.02.03.04.04.5
1.02.02.53.0
1.02.03.03.5
n: 831 n: 838n: 720
n: 525 n: 517n: 494
n: 267 n: 360n: 348
n: 1623 n: 1715n: 1562
Z
X
Z
X
Z
X
Z
X
Z
X
Z
X
Z
X
Z
X
Z
X
Z
X
Z
X
Z
X
Maximum: 7.7 vgv Maximum: 5.0 vgvMaximum: 5.5 vgv
Maximum: 3.7 vgv Maximum: 2.8 vgvMaximum: 4.7 vgv
Maximum: 6.6 vgv Maximum: 6.0 vgvMaximum: 5.8 vgv
Maximum: 4.7 vgv Maximum: 3.1 vgvMaximum: 3.8 vgv
(b) (c)(a)
(e) (f)(d)
(h) (i)(g)
(k) (l)(j)
SZ LSHS
SZ LSHS
SZ LSHS
SZ LSHS

53 NAGRA NTB 00-08
The population of impregnated microfractures in K-feldspar comprises one or two sets ofcleavage-parallel fracture sets and, in addition, irregular-shaped micro fractures often form ananastomising network which usually cuts the cleavage parallel fractures at high angles(Fig. 7.2.1g-i). The widths of these irregular pores vary from section to section. For cleavage-parallel microfractures, it is apparent that in situ opening and impregnation preferentiallyoccurred on pores which are inclined at high angle to the foliation (XY plane). In a few cases,impregnated microfractures were observed along K-feldspar phase boundaries too. The lengthsof both cleavage parallel and irregular microfractures vary extremely with a maximum of aboutsome 100 µm, while the length of grain boundary pores is strongly dependent on the grain size.In contrast, non-impregnated microfractures in K-feldspar are very rare and often lack anyconnection with grain boundaries (as indicated by 2D observation in thin sections).
The impregnated microfractures in plagioclase display the same features as those in K-feldsparalthough the relative frequencies of the considered microfractures are different. In plagioclase,microfractures are less frequent, while grain boundary pores are more frequent than in K-feldspar. The intragranular microfractures are dominated by the irregular type described above.In contact zones between plagioclase and quartz polycrystals, the grain boundary pores of bothphases form a common interconnected network, which sometimes also comprises micro-fractures in plagioclase. Plagioclase grain boundary pores are often decorated by mica flakes,these also contain minute microfractures which are connected with this network. As observedfor K-feldspar, plagioclase also displays only few non-impregnated open pores. Most of themare very small isolated microfractures with irregular curved shapes. In addition, very few non-impregnated open microfractures parallel to twin lamellae have been observed.
In addition to the pores in the principal minerals of the rock described above, microfractureswhich run perpendicularly through the tight foliation also play an important role for theconnected porosity, although they are rarely observed. Particularly in the sample SZ, theyrepresent a more direct connection of the areas above and below mylonitic zones since, in thesefine-grained areas the pore spaces are greatly reduced. Compared to the typical grain boundary-parallel fissures in quartz, they have a noticeably larger aperture, although the fissure generallyruns parallel to the grain boundary.
Considering impregnated pores in K-feldspar and plagioclase together (Fig. 7.2.1j-l), the com-posite microfracture pole figures display orthogonal patterns which are comparable with thosedescribed for quartz (Fig. 7.2.1d-f). The intensity of preferred orientation, however is slightlylower for quartz. A significant deviation from this pattern is only given for sample LS.
All investigated samples of the granodiorite show a range of different in situ impregnated poretypes. For non-impregnated open pores, however, it is still questionable whether they existed insitu but were not interconnected with the pore network or formed during core relaxation or latersample treatment. Microstructural features which are unequivocally indicative of an artificialorigin of open pores in the prolongation of impregnated fractures were not observed. It waspossible to identify distinct sets of pore patterns which strongly depend on the size, shape para-meters and texture of their host minerals. For this reason, the geometry of the pore types isclosely related to the bulk rock fabrics, i.e. it varies significantly from the shear zone into theless deformed wall rocks. The relative frequency and orientation of the different sets of poretypes are schematically illustrated for each sample in Fig. 7.2.2 which is based on the intensityand the position of maxima in the corresponding pole figures (Fig. 7.2.1). Only the pores infeldspars and micas could be represented in this way because of the weak preferred orientationof the microfractures and grain boundary pores in quartz.

NAGRA NTB 00-08 54
Fig. 7.2.2: Schematic illustrations of pore orientation (coloured planes) in sample cubes forHS, SZ and LS with reference axes (x, y, z)
Mica
Feldspar
Mica &Feldspar
Mica
Feldspar
Mica &Feldspar
Feldspar
Mica
HS
SZ
LS
z
x
y
more frequent
less frequent
Frequency of thedifferent pore types

55 NAGRA NTB 00-08
From direct observation in thin sections, it is obvious that in all samples the intersections ofdifferent pore types build an interconnected network, which may allow diffusion of conta-minants in all directions (see also SARDINI et al. 1999). Nevertheless, the main flow directionswill be parallel to the cleavage planes, which represent favoured planar pathways due to theirsmooth surface. Rough microfracture surfaces induce a lower hydraulic aperture. A secondsubordinate flow direction may be given by intersection lines between prominent microfracturesets. As mentioned above, the preferred orientation of the (001)-cleavage parallel microfracturesin the micas is an indicator for the foliation strength. It is most clearly developed in the sampleof the immediate shear zone (SZ) and the sample from the southern side of the shear zone (LS).
Quartz-related microfractures and grain boundary pores should have no significant influence onany anisotropic properties (e.g., canalised fluid flow, mechanical behaviour) because of theirweak preferred orientation, as mentioned above. However, their high frequency must beconsidered for potential nuclide retardation.
7.2.3 Porosity
The results of the porosity measurements are shown in Fig. 7.2.3. The porosity in the standardnon-impregnated (ni) samples covers at GTS usually the range of 0.8 to 1.5 vol% (BOSSART &MAZUREK 1991). The in situ impregnated samples clearly show a lower porosity for allsamples with values between 0.55 and 0.59 %.
Fig. 7.2.3: Porosity of impregnated and non-impregnated (ni) samples
In crystalline rocks in general, porosity determined in the laboratory usually yields consistentresults, irrespective of the applied analytical method (e.g. RASILAINEN et al. 1996). However,all laboratory methods suffer from the same systematic errors, namely the effects of stressrelaxation, sampling procedures and sample preparation methods on the results.
Hg injection porosity measurements on undeformed Grimsel granodiorite samples in the labora-tory revealed porosities in the range of 0.8 – 1.5 vol% (BOSSART & MAZUREK 1991). Forcrystalline rocks that were not subjected to hydrothermal alteration, these are relatively highvalues and are explained by the abundance of a natural system of different pore types and thesubstantial albitisation of magmatic plagioclase during greenschist-stage metamorphism. Thesevalues are consistent with the data presented in Fig. 7.2.3 for samples that were not impregnatedin situ.
HS HSni SZ SZni LS LSni
0
0.2
0.4
0.6
0.8
1.0
1.2
Poro
sity
[%]
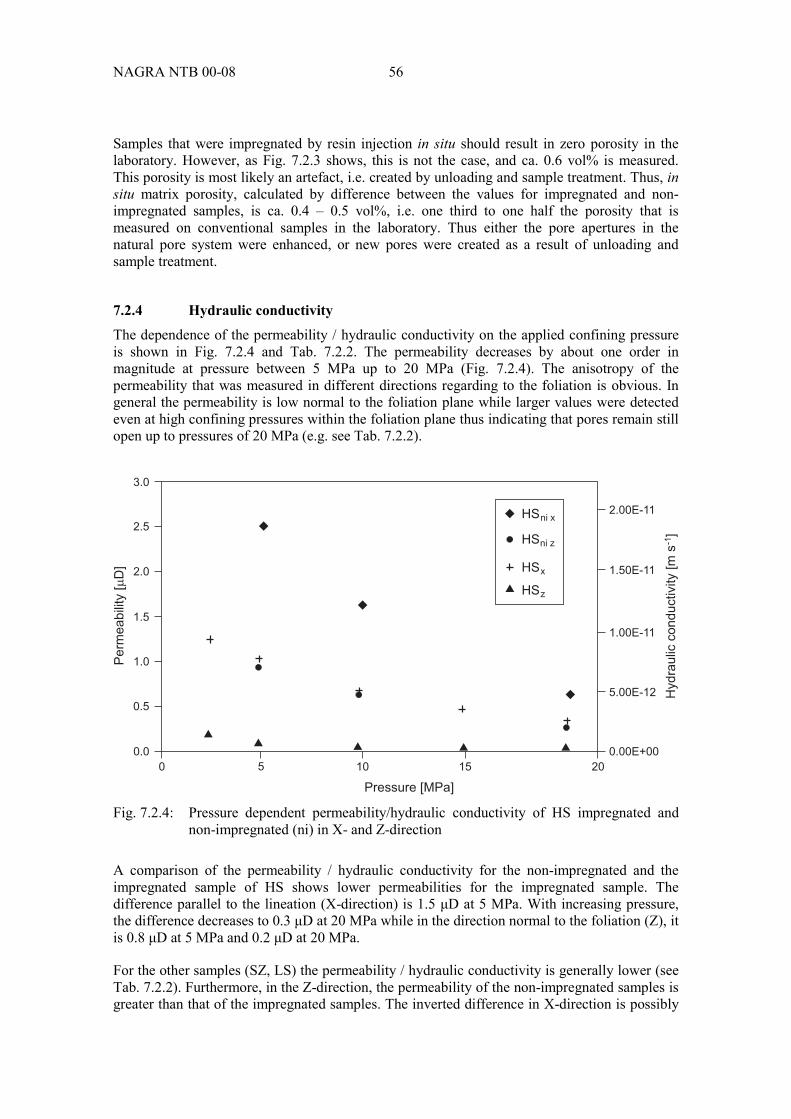
NAGRA NTB 00-08 56
Samples that were impregnated by resin injection in situ should result in zero porosity in thelaboratory. However, as Fig. 7.2.3 shows, this is not the case, and ca. 0.6 vol% is measured.This porosity is most likely an artefact, i.e. created by unloading and sample treatment. Thus, insitu matrix porosity, calculated by difference between the values for impregnated and non-impregnated samples, is ca. 0.4 – 0.5 vol%, i.e. one third to one half the porosity that ismeasured on conventional samples in the laboratory. Thus either the pore apertures in thenatural pore system were enhanced, or new pores were created as a result of unloading andsample treatment.
7.2.4 Hydraulic conductivityThe dependence of the permeability / hydraulic conductivity on the applied confining pressureis shown in Fig. 7.2.4 and Tab. 7.2.2. The permeability decreases by about one order inmagnitude at pressure between 5 MPa up to 20 MPa (Fig. 7.2.4). The anisotropy of thepermeability that was measured in different directions regarding to the foliation is obvious. Ingeneral the permeability is low normal to the foliation plane while larger values were detectedeven at high confining pressures within the foliation plane thus indicating that pores remain stillopen up to pressures of 20 MPa (e.g. see Tab. 7.2.2).
Fig. 7.2.4: Pressure dependent permeability/hydraulic conductivity of HS impregnated andnon-impregnated (ni) in X- and Z-direction
A comparison of the permeability / hydraulic conductivity for the non-impregnated and theimpregnated sample of HS shows lower permeabilities for the impregnated sample. Thedifference parallel to the lineation (X-direction) is 1.5 µD at 5 MPa. With increasing pressure,the difference decreases to 0.3 µD at 20 MPa while in the direction normal to the foliation (Z), itis 0.8 µD at 5 MPa and 0.2 µD at 20 MPa.
For the other samples (SZ, LS) the permeability / hydraulic conductivity is generally lower (seeTab. 7.2.2). Furthermore, in the Z-direction, the permeability of the non-impregnated samples isgreater than that of the impregnated samples. The inverted difference in X-direction is possibly
Perm
eabili
ty[
D]
�
Pressure [MPa]
Hydra
ulic
conductivity
[ms
]-1
HSni x
HSni z
HSz
HSx
2.00E-11
1.50E-11
1.00E-11
5.00E-12
0.00E+00
3.0
2.5
2.0
1.5
1.0
0.5
0.0
0 5 10 15 20
�
�
�
�

57 NAGRA NTB 00-08
caused by larger crystals of feldspar within the cylindrical specimen. This would also affect thepreferred orientation of microfractures which may serve as pathways for the flow medium.
Tab. 7.2.2: Pressure dependent permeability and hydraulic conductivity of impregnated (imp)and non-impregnated (ni) samples in the direction parallel to the lineation (x) andperpendicular to the foliation (z)
Sample Permeability[µD]
Conductivity[m s-1]
Permeability[µD]
Conductivity[m s-1]
Pressure [MPa]HS xHS z
HSni xHSni z
51.05060.11892.52410.8947
57.89 × 10-128.93 × 10-131.90 × 10-116.72 × 10⁻¹²
200.38410.03550.65130.2247
202.89 × 10⁻¹²
2.67 × 10⁻¹³
4.89 × 10⁻¹²
1.69 × 10⁻¹²
Pressure [MPa]SZ xSZ z
SZni xSZni z
2.50.76540.17430.57830.3487
2.55.75 × 10-12
1.31 × 10⁻¹²
4.35 × 10⁻¹²
2.62 × 10⁻¹²
200.21520.057
0.15220.0948
201.62 × 10⁻¹²
4.28 × 10⁻¹³
1.14 × 10⁻¹²
7.12 × 10⁻¹³
Pressure [MPa]LS xLS z
LSni xLSni z
50.79980.2130.51290.433
56.01 × 10⁻¹²
1.60 × 10⁻¹²
3.85 × 10⁻¹²
3.25 × 10⁻¹²
200.20460.06020.07530.1334
201.52 × 10⁻¹²
4.52 × 10⁻¹³
5.66 × 10⁻¹³
1.00 × 10⁻¹²
In order to estimate the in situ permeability / hydraulic conductivity, it is necessary to considerthe in situ stress field. In the GTS, the maximum principle stress (σH) ranges between 18 and 45MPa, the minimum horizontal stress (σh) is almost 10 MPa less (KEUSEN et al. 1989). Thelithostatic principal stress (σV) reaches 8 to 12 MPa, the hydrostatic pressure (P) is 4 MPa. Foraverage values, the effective stress (σeff = σ − P) is estimated to σHeff = 30 MPa, σheff = 19 MPaand σVeff = 7 MPa. Hence measurements at a confining pressure of 20 MPa and 30 MPa shouldgive the most appropriate approximation of in situ conditions (although this is obviously onlyapplicable for the non-impregnated samples, because in the impregnated samples only theartificial component was measured).
The hydraulic conductivity at a confining pressure of 20 MPa ranges between 4.9 × 10⁻¹² m s-1 inx-direction and 1.7 × 10⁻¹² m s-1 in z-direction for the non-impregnated sample HSni. For SZni thepermeability is 1.14 × 10⁻¹² m s-1 and 7.12 × 10⁻¹³ m s-1, respectively, and for LSni 5.7 × 10⁻¹³ m s-1
and 1.0 × 10⁻¹² m s-1, respectively (see Tab. 7.2.2).
The dependence of hydraulic conductivity on confining pressure is relatively small. As shownin Fig. 7.2.4, the hydraulic conductivity of impregnated samples is less than half that of non-impregnated samples and the measured values are on the order of 1 × 10-11 m s-1. KULL et al.(1993) derived large-scale (decametres along tunnel) matrix conductivities by measuring theevaporative water discharge from the unfractured tunnel surface and obtains typical values of 1to 3 × 10-11 m s-1. Thus the large-scale in situ measurements are quite consistent with the small-scale laboratory values presented here. It appears that unloading / sample preparation does notcritically affect laboratory measurements and applying confining pressure for laboratory testsappears to yield hydraulic conductivities similar to those measured in situ.
NAGRA NTB 00-08 58
7.2.5 Seismic velocitiesA characteristic experimental data set for P-wave velocities as a function of the confiningpressure at room temperature is shown in Fig. 7.2.5. The general behaviour of Vp for the appliedapproaches can be inferred by comparing Fig. 7.2.6 and 7.2.7. The P wave velocities atatmospheric pressure are higher in saturated rocks than unsaturated rocks due to the limitedcompressibility of water-saturated pores in contrast to air-filled ones (MONTOTO et al. 1992obtained the same results for a variety of crystalline rocks). At higher confining pressures, thecurves are only slightly different (see NUR & SIMMONS 1969, POPP 1994). The degree ofinfluence of saturation depends on the matrix porosity. For impregnated rock samples, the Vpmay be higher due to the higher Young's modulus of the acrylic resin compared to water (seeFig. 7.2.6d-e and Fig. 7.2.7d-e).
The Grimsel granodiorite samples show, at low confining pressure, a pronounced directionaldependence (Fig. 7.2.6a, Fig. 7.2.7a). Vpmin can be observed normal to the foliation (3.22 kms-1)whereas Vpmax is parallel to the lineation (4.85 km s-1) for SZni. This sample shows a remarkablepressure dependence. The velocities of elastic waves increase with confining pressure which isusually attributed to progressive closure of pores (see Fig. 7.2.6b, Fig. 7.2.7b). The maximumpressure-dependent increase of Vp can be observed for the Z-direction. In order to explain thelow pressure phenomena, ∆Vp (given by the difference between Vp values measured at 100MPa and at 3 MPa) were calculated for SZni (Fig. 7.2.7c). As mentioned above, thecorresponding pore types are dominated by microfractures and grain boundary pores in biotiteand muscovite. Grain boundary pores commonly extend into the (001)-mica cleavage planes asrepresented by the pole figures (Fig. 7.2.1a-c). For water saturated conditions, the mostpronounced Vp increase as compared with dry conditions is observed sub-parallel to thefoliation pole which can be related to the saturation of grain boundary pores. This is clearlydemonstrated in the ∆Vp stereogram (Fig. 7.2.7f) where the difference is given for saturated anddry conditions. To illustrate the effect of impregnation samples, SZ and SZni can be directlycompared: VpSZni max = 4.70 km s-1 (dry), 5.56 km s-1 (sat), VpSZ max = 5.14 km s-1 (dry) and 5.66km s-1 (sat), respectively. Both samples (impregnated and non-impregnated) show comparablevelocity distributions (Fig. 7.2.6d-f). The velocity patterns agree with those obtained from thenon-impregnated ones. However, the impregnated sample shows a significantly higher velocity,especially normal to the foliation, while the high velocity direction is less affected (Fig. 7.2.6d-f). Comparing Fig. 7.2.6f and Fig. 7.2.7f, it becomes evident that the observed pore typepopulation was sealed with acrylic resin. The grain boundary pores which are mainly orientedparallel to the foliation reflect the in situ connected porosity.
A quantitative estimate of the total in situ open interconnected porosity in relation to theirposition to the shear zone, i.e. southern part of the shear zone (LS), northern part of the shearzone (HS) and directly from the centre of the shear zone (SZ), the maximum anisotropy[AVp (%) = (Vpmax – Vpmin) / Vpmax × 100] can be used; AVp: 21.8 % (SZ), 10.3 % (LS) and 17.0% (HS), respectively.
The rapid Vp increase at lower pressures up to 100 MPa (as shown in Fig. 7.2.5) is associatedwith the progressive closure of pores (e.g. BIRCH 1960a and b, BRACE 1965). At higherpressures, the curves become nearly linear, indicating that intrinsic velocities are approached,reflecting the properties of a nearly pore-free rock volume. The assumption of isotropy is validonly for rocks with a random distribution of minerals, pores etc., a very special case andgenerally not realised in natural rocks. Commonly, most of the rocks are anisotropic whenconsidering physical rock parameters as well as fabrics. It is important to note that the intrinsicelastic properties and its anisotropy at higher pressures originate from the elastic properties ofthe constituent minerals and their crystallographic fabrics. The difference of velocities measuredat high and low confining pressures (below the pore-closing pressure) should be mainly attrib-

59 NAGRA NTB 00-08
uted to the contribution of pores. Therefore, the spatial dependence of Vp has been studiedexclusively on spherical samples, allowing the determination in any direction.
Fig. 7.2.5: Pressure dependent seismic velocity of the non-impregnated sample SZ and theimpregnated sample HS of two selected propagation directions
The correspondence between the pressure dependence of the complete Vp distribution and theobserved dominant pore type populations shows that they control the seismic anisotropy at lowconfining pressures. The most important observation is that the symmetry of the Vp distributiondoes not change with either pressure or saturation in both the impregnated and non-impregnatedsamples. At high pressures, where most of the pores are closed, the residual anisotropy is main-ly controlled by the texture of biotite and muscovite. The significance and effective influence ofthe bulk microfracture fabrics on Vp can be best demonstrated by the ∆Vp patterns. This isclearly indicated by the very good correlation between pole figures and the corresponding Vpstereograms (compare Fig. 7.2.2 and 7.2.6). Therefore, the influence of the preferred orientationof biotite and muscovite is twofold. They control the intrinsic properties and the orientation ofthe most significant pore types, i.e., sheet silicate pores parallel to the (001)-cleavage planes.Moreover, from comparison of the Vp characteristics of impregnated and non-impregnatedsamples and their saturation behaviour, it follows that the in situ pores are mostly inter-connected.
Pressure [MPa]
HSmin
HSmax
SZni min
SZni max
Vp
[km
s]
-1
3
0 4020 60 80 100 120
4
5
6
7
�
�
�
�
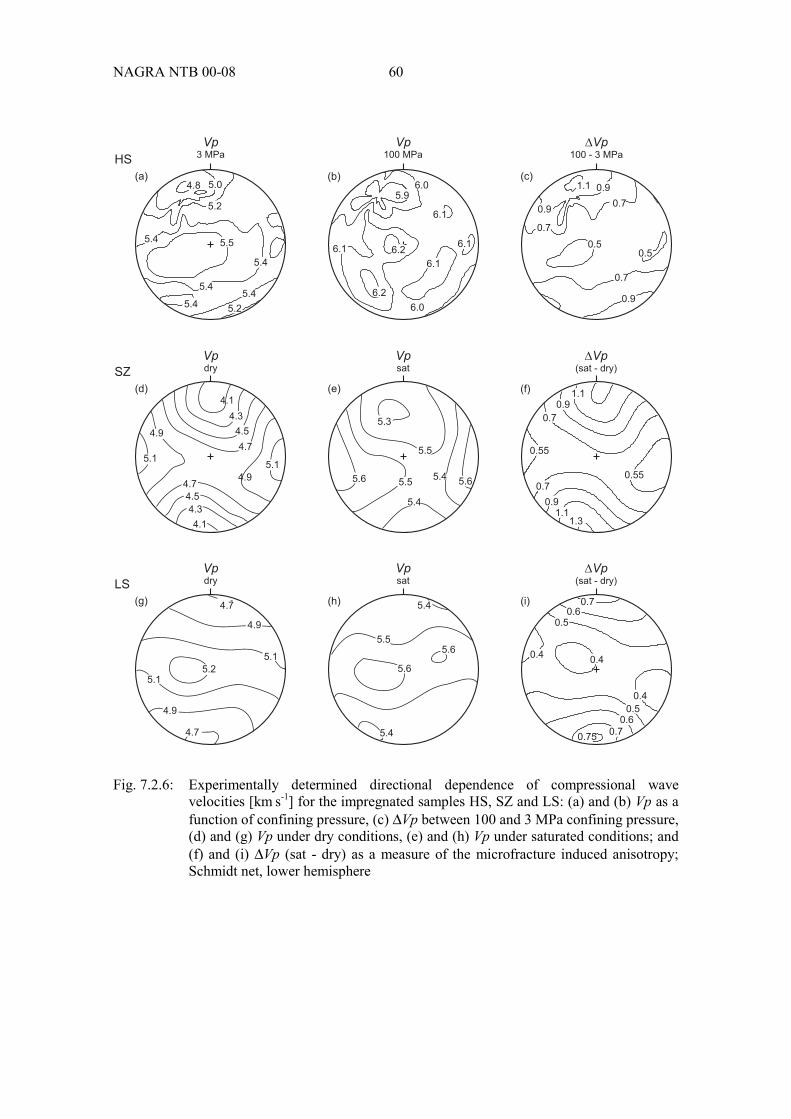
NAGRA NTB 00-08 60
Fig. 7.2.6: Experimentally determined directional dependence of compressional wavevelocities [km s-1] for the impregnated samples HS, SZ and LS: (a) and (b) Vp as afunction of confining pressure, (c) ∆Vp between 100 and 3 MPa confining pressure,(d) and (g) Vp under dry conditions, (e) and (h) Vp under saturated conditions; and(f) and (i) ∆Vp (sat - dry) as a measure of the microfracture induced anisotropy;Schmidt net, lower hemisphere
5.5
5.4
5.4
5.2
5.2
5.4
5.4
5.04.8
5.4
5.9
6.1
6.0
6.0
6.16.1
6.1
6.2
6.2
0.5
0.50.6
0.75
0.7
0.7
0.6
0.4
0.40.4
4.3
4.3
4.1
4.5
4.7
4.7
4.5
4.1
4.9
4.9
5.15.1
5.2
5.1
5.1
4.9
4.9
4.7
4.7
5.4
5.4
5.5
5.55.6 5.6
5.3
5.4
5.4
5.6
5.6
5.5
1.31.1
0.9
0.7
0.55
0.55
1.10.9
0.7
0.50.5
0.7
0.7
1.1 0.9
0.9
0.9
0.7
(a)
HS
(b) (c)
(d)
SZ
(e) (f)
(g)
LS
(h) (i)
Vp3 MPa
Vp100 MPa
Vp100 - 3 MPa
Vpdry
Vpsat
Vp(sat - dry)
Vpdry
Vpsat
Vp(sat - dry)

61 NAGRA NTB 00-08
Fig. 7.2.7: Seismic velocity [km s-1] of the non-impregnated sample SZ: (a) at a confiningpressure of 3 MPa, (b) at a confining pressure of 100 MPa, (c) ∆Vp between 100and 3 MPa confining pressure, (d) Vp under dry conditions, (e) Vp under saturatedconditions, and (f) ∆Vp (sat - dry) as a measure of the anisotropy induced bymicrofractures; Schmidt net, lower hemisphere
To quantify the influence of the in situ pores on the Vp pattern, ∆Vp as a difference between
drySZVp and drySZniVp has to be calculated. In this case, the residual Vp pattern only reflects the
contributions of impregnated pores because the effect of the intrinsic properties of isolated (andtherefore not impregnated) open pores originated by stress release after core extraction andsample treatment is eliminated. The ∆Vp diagram indicate that, beside the sheet silicate pores,connected microfractures in quartz and, especially, in feldspar also contribute significantly.However, this observation is only valid if the core relaxation after impregnation and extractionis comparable for the samples SD and SZni because the velocity difference between dry andsaturated impregnated rock samples (Fig. 7.2.6d-e, 7.2.7d-e) indicates a distinct amount of poreopening. As a total, the in situ impregnated pores are responsible for a porosity of about 0.5 %(given as the difference between SZni and SD).
7.3 ConclusionsDetailed microfabric analysis clearly revealed that the orientation and relative frequency ofindividual sets of pore types strongly depends on the fabric and texture of the related host rockminerals. The increase in intensity of planar (001)-cleavage planes towards the shear zone wasobserved and leads to an increase in the corresponding sheet silicate pores and intergranularmicrofractures. Similar conclusions could be drawn for matrix permeability where permeability/
2.0
2.0
1.8
1.8
1.21.5
1.5
1.2
0.90.95.5
5.5
5.4
5.4
5.3
5.3
5.2
5.2
3.7
3.7
4.2
4.2
4.7
3.2
3.2
4.54.2
3.9
3.6
3.3
4.84.8
3.6
4.23.9
4.5
3.3
6.0
6.1
6.1
6.2
5.9
5.8
5.9
6.0
6.2
2.1
2.6
1.5
2.6
2.3
2.11.8
1.8
1.5
2.3
(a)
SZ
(b) (c)
(d)
SZ
(e) (f)
Vpdry
Vpsat
Vp(sat - dry)
Vp100 - 3 MPa
Vp100 MPa
Vp3 MPa

NAGRA NTB 00-08 62
hydraulic conductivity are strongly related to the rock foliation and are usually minimal perpen-dicular to the foliation. Assuming a confining pressure of 20 MPa, which closely approximatesthe in situ conditions, a hydraulic conductivity of about 1 × 10-12 m s-1 was evaluated as realistic.The comparison of standard laboratory determinations of matrix porosity with the in situ valuesderived here indicate that stress release and sample preparation in the laboratory enhance in situporosity values by a factor of 2 to 2.5. One additional unknown remains in the unquantifiedeffects of drilling of the injection boreholes, such that the real in situ values could be evensmaller (although, as the samples were taken from outwith the BDZ, this is unlikely). Vp datareflect a strong geometric relationship between the ∆Vp stereograms and the microcrack polefigures considering the impregnated and non-impregnated samples under dry and water satu-rated conditions. The ∆Vp values between impregnated and non-impregnated samples reflect thebulk microcrack patterns which effectively influence the Vp anisotropy at lower confiningpressures (below 20 MPa). An influence especially on the cracks in mica, connected cracks inquartz and those in feldspar could be recognised in the ∆Vp stereogram, too. These crack setswhich are mainly oriented parallel to the foliation produce a marked open connected porosityalso at in situ conditions at the Grimsel Test Site. Moreover, the direct comparison of Vp be-tween dry and saturated conditions allow a quantitative measure between open in situ cracks andthose effects originated by stress release after core extraction as well as sample treatment.
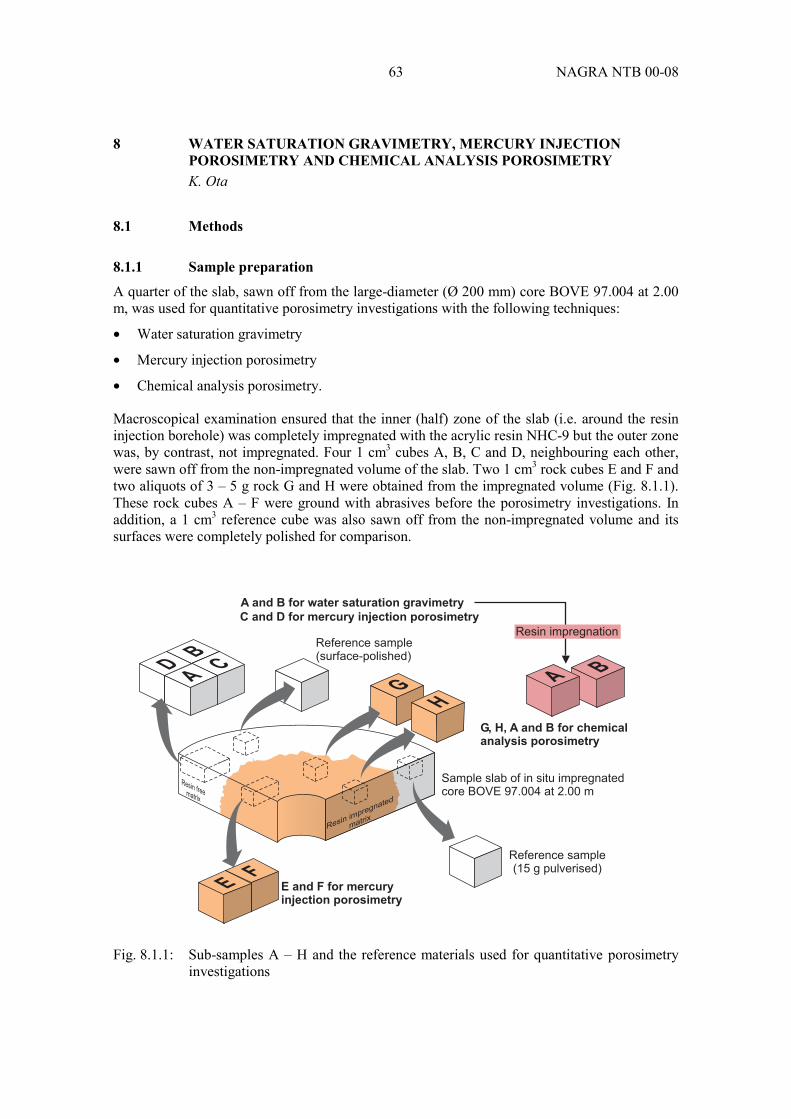
63 NAGRA NTB 00-08
8 WATER SATURATION GRAVIMETRY, MERCURY INJECTIONPOROSIMETRY AND CHEMICAL ANALYSIS POROSIMETRYK. Ota
8.1 Methods
8.1.1 Sample preparation
A quarter of the slab, sawn off from the large-diameter (Ø 200 mm) core BOVE 97.004 at 2.00m, was used for quantitative porosimetry investigations with the following techniques:
• Water saturation gravimetry
• Mercury injection porosimetry
• Chemical analysis porosimetry.
Macroscopical examination ensured that the inner (half) zone of the slab (i.e. around the resininjection borehole) was completely impregnated with the acrylic resin NHC-9 but the outer zonewas, by contrast, not impregnated. Four 1 cm3 cubes A, B, C and D, neighbouring each other,were sawn off from the non-impregnated volume of the slab. Two 1 cm3 rock cubes E and F andtwo aliquots of 3 – 5 g rock G and H were obtained from the impregnated volume (Fig. 8.1.1).These rock cubes A – F were ground with abrasives before the porosimetry investigations. Inaddition, a 1 cm3 reference cube was also sawn off from the non-impregnated volume and itssurfaces were completely polished for comparison.
Fig. 8.1.1: Sub-samples A – H and the reference materials used for quantitative porosimetryinvestigations
F
BCA
DB
GH
A
E
A and B for water saturation gravimetry
C and D for mercury injection porosimetry
Resin impregnation
G, H, A and B for chemicalanalysis porosimetry
Sample slab of in situ impregnatedcore BOVE 97.004 at 2.00 m
Reference sample(15 g pulverised)
Resin impregnated
matrix
E and F for mercuryinjection porosimetry
Resin freematrix
Reference sample(surface-polished)

NAGRA NTB 00-08 64
The non-impregnated sub-samples A and B were utilised for two measurements: water satura-tion gravimetry and, after impregnation with resin in the laboratory, further chemical analysisporosimetry in order to check the consistency of two different techniques. The non-impregnatedsub-samples C and D, the impregnated sub-sample E and F and the reference sample were usedfor mercury injection porosimetry. The use of both the impregnated and the non-impregnatedsub-samples along with the surface-polished rock cube would allow the evaluation of sampling(overcoring, sawing, etc.) artefacts. For chemical analysis porosimetry, the sub-samples G andH (in situ impregnated matrix) and A and B (laboratory-impregnated matrix) were pulverised. Anon-impregnated sub-sample of about 15 g was also taken and pulverised, as a referencesample, for chemical analysis porosimetry.
8.1.2 Water saturation gravimetryThe procedure for porosity and density determination follows basically the water saturationmethod proposed by FRANKLIN et al. (1979). Two sub-samples A and B were first dried in anoven at 105 °C for about 24 hours and were stored in a desiccator during cooling. The weight ofdried samples was determined using a balance with an accuracy of 0.0001 g. Then the sampleswere immersed in de-ionised water for about 12 hours and were held under reduced pressure(below 0.01 MPa) for 12 hours, allowing them to be slowly saturated with de-ionised water.After the samples were wiped with a dry cloth, the weight of water-saturated sample was re-determined. Water temperature (T1) was measured simultaneously, providing water density. Thevolume of the sample was derived from the weight of water displaced by the sample (assuminga temperature (T2) corrected density). The surfaces of the water-saturated sample were dried andsubmerged in a volumetric flask containing a known volume of deionised water. The waterdisplaced above a marked line on the flask was carefully extracted and weighed. Watertemperature was also measured at each measurement step. Each of the measurements mentionedabove was repeated at least five times (and up to forty-five times) to attain weight constancy.The connected porosity (φ), the bulk density (ρbulk) and the skeletal density (ρskeletal) of thesamples can be given respectively by:
100100 ×
−
=×=
2
1
waterwater
water
drysat
bulk
poreW
WW
VV
ρ
ρΦ [%] (8.1)
2waterwater
dry
bulk
drybulk W
WVW
ρ
ρ == [kg dm-3] (8.2)
12
skeletal
water
drysat
waterwater
dry
porebulk
dryWWW
WVV
W
ρρ
ρ −−
=−= [kg dm-3] (8.3)
65 NAGRA NTB 00-08
where
φ: connected porosity [%]ρbulk: bulk density [kg dm-3]ρskeletal : skeletal density [kg dm-3]Vpore: total water-accessible pore volume of sample [dm3]Vbulk: bulk volume of sample [dm3]Wdry: weight of dried sample [kg]Wsat: weight of water-saturated sample at temperature T1 [kg]Wwater: weight of water displaced by sample at temperature T2 [kg]ρwater 1,2: density of water sample at temperature T1,2 [kg dm-3].
Analytical error (or precision, in this case) in the technique employed was statistically assessedfollowing the measurement sequence and amounted to up to 23 % and 2 % for porosity anddensity determinations, respectively.
8.1.3 Mercury injection porosimetryThe connected porosity, pore size distribution, total pore area and density of four sub-samplesC, D, E and F and the surface-polished reference sample were determined by a standardmercury injection porosimetry technique. A commercially available porosimeter was used withmaximum injection pressures of about 230 MPa (for sub-samples C and D) and about 400 MPa(for sub-samples E and F). These maximum injection pressures allow mercury to intrude intoonly pores with equivalent (cylindrical) pore diameters over 6.4 nm and over 4.0 nm respec-tively. In each measurement, mercury injection pressure was stepped up and the volume ofinjected mercury into the sample at each step was directly monitored. The pore size distributionwas then derived using the Washburn equation giving the relationship between the mercuryinjection pressure and the cylindrical pore diameter of mercury-injectable porosity:
P4D θγ cos−= (8.4)
where
D: equivalent (cylindrical) pore diameter [m]γ : surface tension of mercury at 25 °C = 0.480 [N m-1]θ : contact angle of mercury = 140 [°]P: injection pressure of mercury [MPa].
As these measurements yield the total intrusion volume of mercury to the sample, the connectedporosity (φ) of the sample is derived from the total intrusion volume of mercury and the bulkvolume of the sample, determined prior to mercury injection:
100WV
VVV
Hg
Hgcell
Hg
bulk
Hg ×−
=×=
ρ
Φ 100 [%] (8.5)

NAGRA NTB 00-08 66
where
VHg: total intrusion volume of Hg [dm3 kg-1]Vbulk: bulk volume of sample [dm3]Vcell: cell volume [dm3]WHg: weight of Hg filled in cell [kg]ρHg: density of Hg at 25 °C = 13.5335 [kg dm-3].
Here the bulk density (ρbulk) and the skeletal density (ρskeletal) of the sample can also becalculated respectively by the following equations:
bulk
drybulk V
W=ρ [kg dm-3] (8.6)
Hgbulk
dryskeletal VV
W−=ρ [kg dm-3] (8.7)
where
Wdry: weight of dried sample [kg].
Analytical error (or precision, in this case) in this mercury injection porosimetrical techniqueemployed is small and amounts to below 1.5 % for all measurements17.
8.1.4 Chemical analysis porosimetryFollowing in situ resin impregnation, the connected porosity of the rock matrix was determinedby directly quantifying the resin content of the sub-sample using a novel analytical technique.Specifically, since the acrylic resin NHC-9 employed in situ contains carbon as a major con-stituent element but the rock matrix is, by contrast, originally poor in carbon, the resin-derivedcarbon content of the impregnated sample was determined.
To prepare standard materials for a calibration curve, a known amount of the resin powder wasfirst homogeneously mixed with the pulverised reference sample. Standard additions of 0.1, 0.5and 1.0 wt% of resin were made to obtain a linear relationship between the amount of resin andthe resin-derived carbon content. After sample preparation and treatment, carbon analysis wascarried out on 100 – 400 mg aliquots of the reference sample (with no added resin), on thestandard materials and on the impregnated sub-samples G and H by the technique of thermalconductivity gas analysis, using a specialised NCH analyser, following the oxygen-enrichedcombustion of the sample at 850 °C. Each analysis was triplicated. The calibration curve withina 1σ deviation, obtained by a least squares fit, gives the weight fraction of the resin-derivedcarbon content in impregnated samples, corresponding to the resin content. The connectedporosity (φ) of the in situ impregnated matrix can be calculated by converting weight fractioninto volume fraction:
17 Note that the application of mercury injection porosimetry is rock type dependent and so other aspects may need
to be considered in other cases (see, for example, the comments in HELLMUTH et al. 1995).

67 NAGRA NTB 00-08
100)1(100 ×−+=×=
skeletalsinre
sinresinre
sinresinre
bulk
sinreWW
W
VV
ρρ
ρΦ [%] (8.8)
where
Vresin: total intrusion volume of resin [dm3 kg-1]Vbulk: bulk volume of sample [dm3]Wresin: weight fraction of resin per 1 kg sample [kg]ρ
resin: density of resin at 20 °C = 1.118 [kg dm-3]ρ skeletal: skeletal density of sample [kg dm-3].
Here the skeletal density of the sample (ρskeletal) was given by both water saturation gravimetryand mercury injection porosimetry as described before. This technique was also applied to thesamples A and B, impregnated with different acrylic resin in the laboratory following theporosity measurements by water saturation gravimetry. The density of polymerised NHC-9resin was found to be 1.118 ± 0.034 kg dm-3 and is slightly higher than that of the liquid NHC-9(1.070 kg dm-3 reported by SIKA AG). This difference in density indicates that very minorshrinkage18 actually occurred and that about 4 % of volume was lost during polymerisation.However, this small volume change does not affect the calculations of the chemical analysisporosimetry because the liquid density was used to convert the resin-derived carbon content intovolume fraction.
Error propagation in this analytical technique was statistically assessed following the analyticalsequence. Although the analytical error (or precision, in this case) itself is generally small, itmay be estimated to be up to 8 % due to effects associated with data treatment. Although this isa well-established technique, the application in this case is rather novel. It is thereforerecommended that further method development be carried out in future to assess potentialartefacts (e.g. optimum combustion times or effects of grain size). However, the goodagreement with porosity values determined with water-saturation gravimetry on the same rocksamples (see Tab. 8.2.1) is very encouraging and suggests that this technique is probablyapplicable to rock samples.
8.2 Results and discussion
A total of 10 porosimetry measurements were conducted on in situ impregnated, laboratory-impregnated and non-impregnated sub-samples A – H obtained from the Grimsel granodioritematrix. The results of the measurements are listed in Tab. 8.2.1.
18 Unlike some of the cases reported in ALEXANDER et al. (2001), no shrinkage damage was observed in the
samples investigated here.
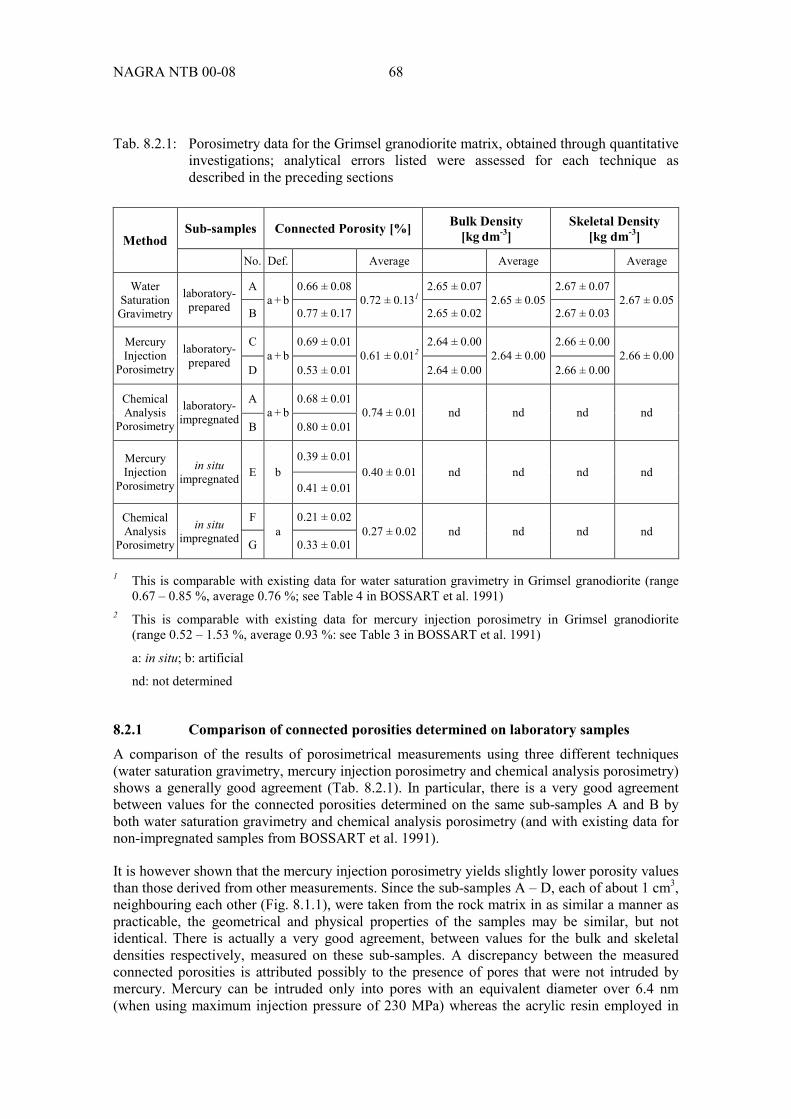
NAGRA NTB 00-08 68
Tab. 8.2.1: Porosimetry data for the Grimsel granodiorite matrix, obtained through quantitativeinvestigations; analytical errors listed were assessed for each technique asdescribed in the preceding sections
Sub-samples Connected Porosity [%] Bulk Density[kg dm-3]
Skeletal Density[kg dm-3]Method
No. Def. Average Average Average
A 0.66 ± 0.08 2.65 ± 0.07 2.67 ± 0.07WaterSaturationGravimetry
laboratory-prepared B
a + b0.77 ± 0.17
0.72 ± 0.131
2.65 ± 0.022.65 ± 0.05
2.67 ± 0.032.67 ± 0.05
C 0.69 ± 0.01 2.64 ± 0.00 2.66 ± 0.00MercuryInjection
Porosimetry
laboratory-prepared D
a + b0.53 ± 0.01
0.61 ± 0.012
2.64 ± 0.002.64 ± 0.00
2.66 ± 0.002.66 ± 0.00
A 0.68 ± 0.01ChemicalAnalysis
Porosimetry
laboratory-impregnated B
a + b0.80 ± 0.01
0.74 ± 0.01 nd nd nd nd
0.39 ± 0.01MercuryInjection
Porosimetry
in situimpregnated E b
0.41 ± 0.010.40 ± 0.01 nd nd nd nd
F 0.21 ± 0.02ChemicalAnalysis
Porosimetry
in situimpregnated G
a0.33 ± 0.01
0.27 ± 0.02 nd nd nd nd
1 This is comparable with existing data for water saturation gravimetry in Grimsel granodiorite (range0.67 – 0.85 %, average 0.76 %; see Table 4 in BOSSART et al. 1991)
2 This is comparable with existing data for mercury injection porosimetry in Grimsel granodiorite(range 0.52 – 1.53 %, average 0.93 %: see Table 3 in BOSSART et al. 1991)
a: in situ; b: artificial
nd: not determined
8.2.1 Comparison of connected porosities determined on laboratory samplesA comparison of the results of porosimetrical measurements using three different techniques(water saturation gravimetry, mercury injection porosimetry and chemical analysis porosimetry)shows a generally good agreement (Tab. 8.2.1). In particular, there is a very good agreementbetween values for the connected porosities determined on the same sub-samples A and B byboth water saturation gravimetry and chemical analysis porosimetry (and with existing data fornon-impregnated samples from BOSSART et al. 1991).
It is however shown that the mercury injection porosimetry yields slightly lower porosity valuesthan those derived from other measurements. Since the sub-samples A – D, each of about 1 cm3,neighbouring each other (Fig. 8.1.1), were taken from the rock matrix in as similar a manner aspracticable, the geometrical and physical properties of the samples may be similar, but notidentical. There is actually a very good agreement, between values for the bulk and skeletaldensities respectively, measured on these sub-samples. A discrepancy between the measuredconnected porosities is attributed possibly to the presence of pores that were not intruded bymercury. Mercury can be intruded only into pores with an equivalent diameter over 6.4 nm(when using maximum injection pressure of 230 MPa) whereas the acrylic resin employed in

69 NAGRA NTB 00-08
the laboratory is presumed to be injected deeper into very fine pores down to about 2 nm in sizebecause of its very small molecular size (maximum 1.5 nm) and very low viscosity and surfacetension (see ALEXANDER et al. 2001 for details).
8.2.2 Connected porosity and pore-size distribution of laboratory samplesTaking account of the sampling limitations, the agreement provides a convincing demonstrationof the consistency of the porosimetrical measurement techniques. The laboratory-preparedsamples A – D have connected porosities between 0.53 and 0.80 vol% (Tab. 8.2.1; mean valueof 0.69 vol%), irrespective of the technique applied, which is consistent with mercury injectionporosimetry data (0.67 – 1.53 vol%) previously reported for non-impregnated, undeformedGrimsel granodiorites (BOSSART & MAZUREK 1991). The size distribution of pores in thelaboratory samples can be represented as that of mercury injectable porosity. The laboratory-prepared samples give the maximum relative abundance of pore sizes around 0.4 µm and arealso abundant in larger pores with equivalent diameters over 10 µm (Fig. 8.2.1).
Fig. 8.2.1: Size distribution of mercury injectable porosity in the Grimsel granodioriteVertical axis corresponds to the relative abundance of pore size. C and D: non-impregnatedsamples, E and F: in situ impregnated samples.
0.0
064
Log
diffe
rentialin
trusio
n[m
lg
]-1
Equivalent pore diameter [ m]�0.01 0.1 1 10 100
0.0
036
200
0
0.0005
0.0015
0.0020
0.0010
0.0025
C
D
E
F
NAGRA NTB 00-08 70
8.2.3 Comparison of connected porosities for in situ and laboratory samplesConnected porosities, determined on the in situ impregnated samples G and H by chemicalanalysis porosimetry, have an average value of 0.27 vol%, which is 2 to 3 times lower thanthose measured on the laboratory-prepared samples (Tab. 8.2.1). Since the acrylic resin NHC-9used in situ is similar in physical properties to the acrylic resin employed in the laboratory (i.e.very low viscosity and surface tension and, presumably, very small molecular size of about afew nm), it can penetrate fully into accessible pores greater than a few nm in size, which exist insitu.
It is of note that the architecture of the interconnected matrix porosity identified in the in situimpregnated samples is found to be similar, but not identical, to that observed in the laboratory-impregnated samples and this is presumably responsible for the disagreement between thevalues for the measured connected porosities.
The in situ impregnated sample E and F were further impregnated with mercury in the labor-atory, producing mercury-injectable porosities of 0.39 and 0.41 vol% respectively (Tab. 8.2.1;average value of 0.40 vol%). If it is assumed that accessible matrix porosity in situ must be fullyimpregnated with the acrylic resin (as discussed above), this 'extra' porosity is an obviousindication of the extent of destressing and damage induced in the rock during sampling. Clearly,this fact supports the thesis that the geometry and structures of matrix porosity in the laboratory-impregnated samples are no longer identical to those in the undisturbed in situ rock matrix. Inaddition, the value of 0.40 vol% for the 'extra' is consistent with the difference between valuesfor the connected porosities, determined on the in situ impregnated samples G and H (0.21 and0.33 vol% respectively) and the laboratory-impregnated samples A – D (0.53 – 0.80 vol%).Combined with the observations on the differences in pore geometry between in situ impreg-nated and laboratory-prepared samples, this strongly suggests that the higher connected porosi-ties given in the laboratory-prepared samples are due to the complex effects of the alteration ofthe existing matrix porosity and the creation of new types of pores, which were, most likely,induced by artefacts of stress release and sample preparation. Fig. 8.2.1 shows the size distri-bution of the 'extra' pores (in samples D and F), which gives the maximum relative abundanceof pore sizes around 8 µm and higher abundance of larger pores with equivalent diameters over15 µm (i.e. macroporosity).
A comparison of the pore size distribution curves in Fig. 8.2.1 shows that larger pores, with dia-meters over several µm, observed in all the laboratory-prepared samples are certainly samplingartefacts. Specifically, the macroporosity is most likely influenced by artefacts on the samplesurfaces. This is supported by pore size distribution data produced on both the surface-groundand -polished samples: the abundance of macropores in the surface-ground samples C and D isquite high in comparison with that in the surface-polished reference sample (Fig. 8.2.2).Although the effects of the sample surface artefacts on the measured porosity can be excluded,other potential artefacts should be specified and the degree of change induced by such effectsshould be quantified. In this respect, it is necessary to carry out additional investigations such asa comparison of mercury injection porosimetry curves from laboratory and in situ impregnatedsamples.

71 NAGRA NTB 00-08
Fig. 8.2.2: Size distribution of mercury injectable porosity in the surface-ground samples andthe surface-polished reference sampleVertical axis corresponds to the relative abundance of pore size. Curves: surface-groundsamples (sub-samples C and D), dashed curve: surface-polished sample.
8.2.4 In situ connected porosity and pore-size distributionDifferences in the pore size distribution between the laboratory-prepared sample, in which bothin situ and 'extra' porosities exist, and the in situ impregnated sample that has only the 'extra'porosity are attributed to the distribution of the in situ porosity. Fig. 8.2.3 shows the sizedistribution of the in situ porosity, which was estimated based upon the differences betweenboth sample sets. The undisturbed in situ rock matrix, in comparison, has pores with diametersbelow 20 nm and between 0.1 µm and up to 10 µm with the maximum relative abundance ofpore sizes around 0.4 µm.
D
C
0.0
06
4
Log
diffe
rentialin
trusio
n[m
lg
]-1
Equivalent pore diameter [ m]�0.01 0.1 1 10 100
0.0
03
6
20
0
0
0.0005
0.0015
0.0020
0.0010
0.0025

NAGRA NTB 00-08 72
Fig. 8.2.3: Estimated size distribution of in situ porosity in the Grimsel granodiorite matrixCalculation based upon results from mercury injection porosimetry on sub-samples C, D, Eand F.
8.3 Conclusions
Although this work has been conducted on a limited number of samples, it seems likely thatconnected porosity values measured by standard laboratory techniques are too high. Here, up to50 % of the porosity value measured on laboratory-prepared samples is probably an artefact ofstress release and sample preparation. This will clearly influence subsequent laboratoryparameter evaluations based on matrix porosity (e.g. diffusion coefficients) and should thereforebe considered when assessing the likely retardation capacity of a repository host rock usingcalculations based purely on laboratory-derived data (see Chapter 9).
0.01 0.1 1 10 100
20
0
0.0
06
4
Re
lative
fre
qu
en
cy
Pore diameter [ m]�
73 NAGRA NTB 00-08
9 ILLUSTRATING THE EFFECTS OF THE MAGNITUDE AND EXTENTOF CONNECTED MATRIX POROSITY ON RADIONUCLIDE TRANS-PORT IN A FRACTURED GEOLOGICAL MEDIUMP.A. Smith
9.1 Introduction
The purpose of this chapter is to illustrate the effects of the assumed magnitude and extent ofconnected matrix porosity on radionuclide transport in fractured geological media as calculatedin performance assessment (PA) geosphere transport models. Here, the particular model is thatused to analyse the Reference Case in the Nagra Kristallin-1 (or K-1) PA (NAGRA 1994), withalternative datasets based on both the K-1 and JNC Second Progress Report (or J-2) PA (JNC2000) Reference Cases. Since the purpose is to illustrate the sensitivity to geosphere parametersrelated to the matrix porosity, the differences between the J-2 and K-1 near-field models anddata are not considered here (see, rather, NEALL 2001, for details). Releases from the near-fieldfor all calculations here are carried out with the K-1 Reference Case model and data so that, ineffect the repository considered in K-1 is assumed for all calculational cases, irrespective ofwhether the geosphere data are based on K-1 or J-2.
9.2 Model representation of the geosphere
The geosphere model is illustrated in Fig. 9.2.1 and shows an area, A, in a planar sectionthrough the host rock normal to the assumed direction of groundwater flow. The groundwater,containing radionuclides released from the near-field to the geosphere, is assumed to flowthough discrete channels, also shown schematically in the figure.
In the geosphere transport model used in the present study (and used to analyse the ReferenceCase in K-1), it is assumed that all channels are identical and are described by the followingparameters:
• the solid density of the matrix, ρ [kg m-3],
• the channel aperture, 2b [m],
• the hydraulic gradient, i,
• the transmissivities of the channels, T [m2 a-1],
• the length of the channels, L [m],
• the depth of the diffusion-accessible matrix, measured from the centre of a channel, yp [m],
• the matrix porosity, ε,
• the pore diffusion coefficient of the matrix, Dp [m2 a-1],
• the Peclet number describing longitudinal dispersion, Pe,
• the nuclide-dependent sorption (or distribution) constants describing sorption on matrixpore surfaces, Kd [m3 kg-1],
• the channel width, gi [m].
The total number of channels and the specific widths of individual channels within the plane arenot relevant to the geosphere transport model. The total flow at the near-field/geosphere
NAGRA NTB 00-08 74
interface (Q [m3 a-1]), a parameter of the near-field model, is, however, proportional to thesummed widths of channels in the area A:
�=Aarea in channels
igTiQ (9.1)
In the K-1 Reference Case, and in all the following calculations, it is assumed that Q = 3 m3 a-1.
9.3 Parameter valuesGeosphere parameter sets based on the Reference Cases of K-1 and J-2, as well as variations onthese to illustrate the effects of the magnitude and extent of connected matrix porosity and themagnitude of the pore diffusion coefficient, are given in Tab. 9.3.1 and 9.3.2. For simplicity,cases based on J-2 consider only the undisturbed host rock. Transport through a fault zone,which was included in the J-2 Reference Case, is not considered in the present study.
Cases K-1-1 and J-2-1 are based on the K-1 and J-2 Reference Cases, respectively. Cases K-1-2and J-2-2 illustrate the effects of reduced matrix porosity. Cases K-1-3 and J-2-3 illustrate theeffects of increased matrix porosity. Cases K-1-4 and J-2-4 illustrate the effects of reducing thedepth of diffusion-accessible matrix from the centre of the channels whereas cases K-1-5 and J-2-5 illustrate the effects of increasing the depth of diffusion-accessible matrix. Finally, cases K-1-6 and J-2-6 illustrate the effects of a reduced pore diffusion coefficient in the matrix.
The radionuclides considered are the fission products 79Se, 135Cs and 99Tc which, in K-1,dominated the calculated doses at times up to about 2 Ma after repository closure. 237Np is alsoconsidered as an example of a long-lived actinide as, in K-1, the actinide chains dominated thecalculated doses at times beyond about 2 Ma (see NAGRA 1994, for details).
Considering Tab. 9.3.1 and 9.3.2, the most significant differences in the geosphere data for allcases are the lower channel transmissivity and lower fracture aperture used in the cases based onJ-2 data. While fracture aperture is known to be an insensitive parameter (as discussed inNAGRA 1994 and JNC 2000), the calculated results clearly show that the lower channeltransmissivity for the J-2 cases gives rise to longer transport times, more time for radioactivedecay, and lower geosphere releases when compared to the K-1 cases.
9.4 ResultsThe effects of varying the main geosphere parameters on radionuclide reatrdation in thegeosphere can be represented graphically by comparing the time dependent release ofradionuclides from the geosphere to the biosphere (the so-called 'geosphere release') to that ofthe time dependent release of radionuclides from the engineered barriers in the repository (theso-called 'near-field release'). The comparison of geosphere and near-field releases for all J-2and K-1 cases are shown in the upper and lower parts of Fig. 9.4.1 (79Se) and 9.4.2 (135Cs).Fig. 9.4.3 shows the geosphere releases of 99Tc and 237Np for all K-1 cases only as all J-2 caseswere too small to calculate reliably and consequently are not shown graphically19.
19 Note that this differs from the J-2 PA results (see JNC 2000) because a different geosphere model was used that
considered a distribution of channel transmissivities, rather than the single, geometric mean value used here andthis gives rise to higher calculated geosphere releases.

75 NAGRA NTB 00-08
Tab. 9.3.1: Nuclide-independent geosphere parameters
Cases based on K-I1 Cases based on J-22Para-meter
K-1-1 K-1-2 K-1-3 K-1-4 K-1-5 K-1-6 J-2-1 J-2-2 J-2-3 J-2-4 J-2-5 J-2-6
ρ[kg m-3]
2600 2700
b [m] 5 × 10⁻⁴ 10-5
i 0.04 0.01
T[m2 a-1]
0.275 0.0065
L [m] 200 100
Dp 3
[m2 a-1]0.001 10-4 0.0047 0.00047
Pe 10 10
ε 0.05 0.01 0.20 0.05 0.02 0.005 0.1 0.02
yp [m] 0.05 0.01 0.20 0.05 0.1 0.05 0.5 0.1
1 Values based on Table 5.3.4 of NAGRA (1994).2 Values based on undisturbed host rock, Table 5.3.2-3 in JNC (2000). Channel transmissivity is taken to be the
geometric mean transmissivity of a fracture (Tm = 10-9.99 m2 s-1), multiplied by a factor of 2 to account forchannelling within the fracture. In J-2, b = √Tm.
3 See also footnote 16 on the treatment of tortuosity variations within Dp.
Tab. 9.3.2: Nuclide-dependent geosphere parameters
Nuclide Half life
[a]
Kd for cases based onK-1
[m3 kg-1] 2
Kd for cases based onJ-2
[m3 kg-1] 3
79Se 1.1 × 10⁶ 1 0.01 0.01135Cs 2.3 × 10⁶ 0.042 4 0.0599Tc 2.1 × 10⁵ 0.5 1237Np 2.1 × 10⁶ 1 1
1 The value used in K-1 and J-2 was 6.5 × 10⁴. This value has been revised since these assessments were carriedout20.
2 Values taken from Table 3.7.8 of Nagra (1994), "Realistic-conservative" values, Area West.3 Values taken from Table 5.3.2-2 of JNC (2000).4 Calculated from derived Freundlich isotherm (subsection 5.3.3.2 of NAGRA 1994).
20 New value is based on the ENSDF data which can be viewed directly at the Brookhaven National Laboratory web
site: http://www.nndc.bnl.gov/nndc/ensdf/#001.
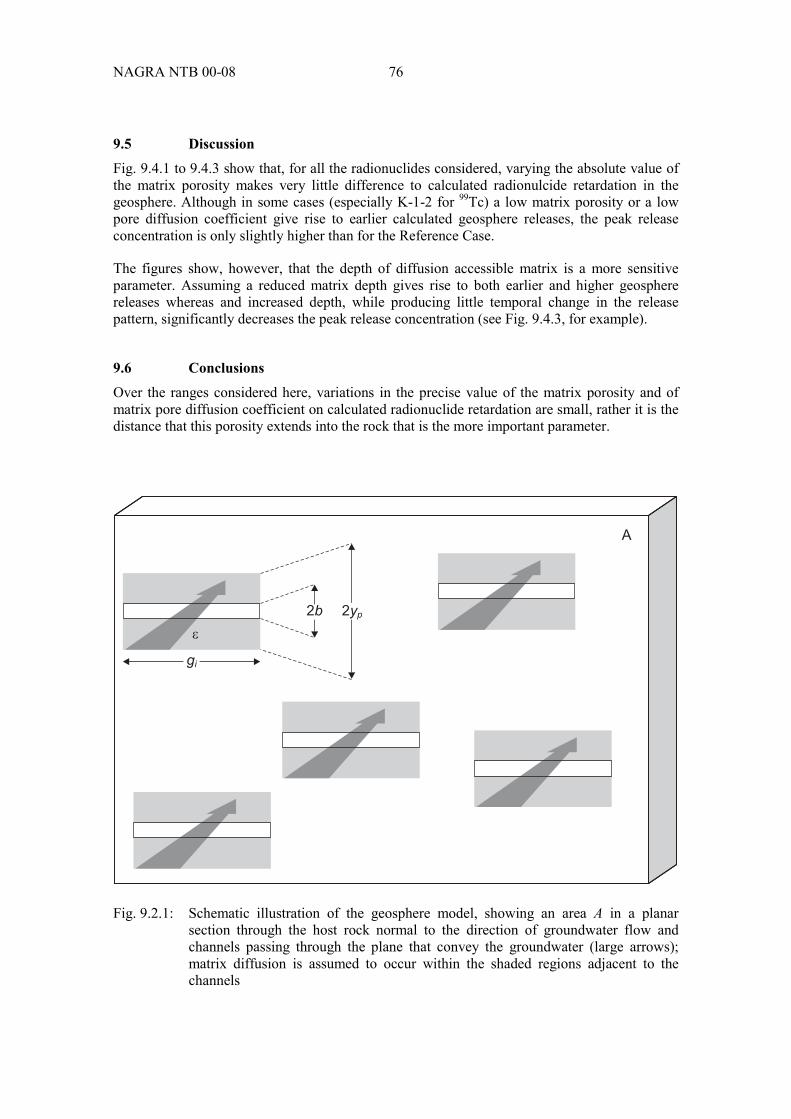
NAGRA NTB 00-08 76
9.5 DiscussionFig. 9.4.1 to 9.4.3 show that, for all the radionuclides considered, varying the absolute value ofthe matrix porosity makes very little difference to calculated radionulcide retardation in thegeosphere. Although in some cases (especially K-1-2 for 99Tc) a low matrix porosity or a lowpore diffusion coefficient give rise to earlier calculated geosphere releases, the peak releaseconcentration is only slightly higher than for the Reference Case.
The figures show, however, that the depth of diffusion accessible matrix is a more sensitiveparameter. Assuming a reduced matrix depth gives rise to both earlier and higher geospherereleases whereas and increased depth, while producing little temporal change in the releasepattern, significantly decreases the peak release concentration (see Fig. 9.4.3, for example).
9.6 ConclusionsOver the ranges considered here, variations in the precise value of the matrix porosity and ofmatrix pore diffusion coefficient on calculated radionuclide retardation are small, rather it is thedistance that this porosity extends into the rock that is the more important parameter.
Fig. 9.2.1: Schematic illustration of the geosphere model, showing an area A in a planarsection through the host rock normal to the direction of groundwater flow andchannels passing through the plane that convey the groundwater (large arrows);matrix diffusion is assumed to occur within the shaded regions adjacent to thechannels

77 NAGRA NTB 00-08
Fig. 9.4.1: The geosphere releases of 79Se for the cases J-2-1 to 6 (upper figure) and K-1-1 to6 (lower figure), compared to the near-field release of this radionuclide
103
104
105
106
107
108
10-9
10-8
10-7
10-6
10-5
10-10
10-11
10-12
103
104
105
106
107
108
10-5
10-4
10-7
10-6
Time [a]
Time [a]
79
-1S
ere
leases
[mola
]79
-1S
ere
lea
se
s[m
ola
]
Near-field releaseK-1-1 (Reference case)K-1-2 (reduced porosity)K-1-3 (increased porosity)K-1-4 (reduced matrix extent)K-1-5 (increased matrix extent)K-1-6 (reduced diffusion coefficient)
Near-field releaseJ-2-1 (Reference case)J-2-2 (reduced porosity)J-2-3 (increased porosity)J-2-4 (reduced matrix extent)J-2-5 (increased matrix extent)J-2-6 (reduced diffusion coefficient)

NAGRA NTB 00-08 78
Fig. 9.4.2: The geosphere releases of 135Cs for the cases J-2-1 to 6 (upper figure) and K-1-1 toK-1-6 (lower figure), compared to the near-field release of this radionuclide
103
104
105
106
107
108
135
-1C
sre
lea
se
s[m
ola
]
10-9
10-8
10-7
10-6
10-5
10-4
10-1
10-2
10-3
10-10
10-11
10-12
10-13
103
104
105
106
107
108
10-2
10-1
10-3
135
-1C
sre
lea
se
s[m
ola
]
Time [a]
Time [a]
Near-field releaseJ-2-1 (Reference case)J-2-2 (reduced porosity)J-2-3 (increased porosity)J-2-4 (reduced matrix extent)J-2-5 (increased matrix extent)J-2-6 (reduced diffusion coefficient)
Near-field releaseK-1-1 (Reference case)K-1-2 (reduced porosity)K-1-3 (increased porosity)K-1-4 (reduced matrix extent)K-1-5 (increased matrix extent)K-1-6 (reduced diffusion coefficient)
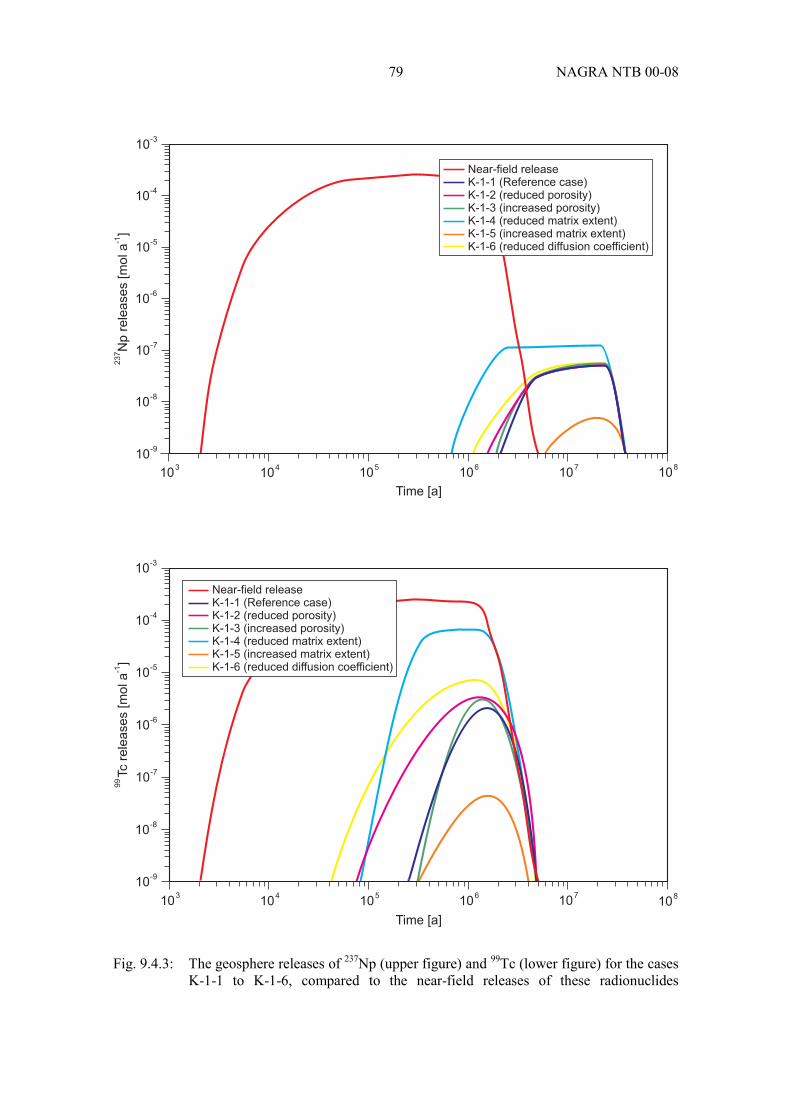
79 NAGRA NTB 00-08
Fig. 9.4.3: The geosphere releases of 237Np (upper figure) and 99Tc (lower figure) for the casesK-1-1 to K-1-6, compared to the near-field releases of these radionuclides
103
104
105
106
107
108
10-9
10-8
10-8
10-7
10-7
10-6
10-6
10-5
10-5
10-4
10-4
10-3
10-3
10-9
103
104
105
106
107
108
Time [a]
Time [a]
237
-1N
pre
lea
se
s[m
ola
]99
-1Tc
rele
ase
s[m
ola
]
Near-field releaseK-1-1 (Reference case)K-1-2 (reduced porosity)K-1-3 (increased porosity)K-1-4 (reduced matrix extent)K-1-5 (increased matrix extent)K-1-6 (reduced diffusion coefficient)
Near-field releaseK-1-1 (Reference case)K-1-2 (reduced porosity)K-1-3 (increased porosity)K-1-4 (reduced matrix extent)K-1-5 (increased matrix extent)K-1-6 (reduced diffusion coefficient)

81 NAGRA NTB 00-08
10 CONCLUSIONSW.R. Alexander, A. Möri and K.Ota
The present study has demonstrated that, by combining microfabric analyses, petrophysicalinvestigations and in situ field observations, a quantitative evaluation of the matrix porosity canbe obtained and this represents an important step towards the more realistic representation of insitu matrix properties in contaminant transport codes. In this project, a suitable resin formulationhas been developed to impregnate undisturbed crystalline matrix rock in situ. The low viscosityacrylic resin that was developed provides adequate penetration at low pressures, which ensuresminimal disruption of fine pore structures. Hardening is sufficient to allow overcoring andpreparation of standard petrographic thin sections and other samples for subsequent analysis.Eosine as fluorescent agent in the resin was found to be appropriate for pore space impreg-nation.
The macroscopic distribution of pore space in the matrix was found to strongly depend on themineralogical and structural composition. The shape of the impregnated area (observed on thesurfaces of slabs cut from rock cores) indicated a mean resin impregnation depth of about 6 cmperpendicular to the injection borehole21, with a preferred matrix penetration direction parallelto the stretching lineation.
A borehole disturbed zone (BDZ) in the matrix around the injection boreholes was also iden-tified. The BDZ is characterised by a relatively high density of pore space around boundaries ofmineral grains and by open microfractures extending sub-parallel to the borehole axis. Theextent of the BDZ into the rock matrix normal to the borehole axis is 3 to 4 cm.
Most intensive impregnation, indicating highest porosities, occurs in rock portions where initialductile deformation subsequently underwent brittle reactivation, locally producing open frac-tures. Such structures are rare in the undisturbed matrix but become more abundant in the vici-nity of shear zones. Several pore types have been distinguished microscopically:
• the majority are associated with mineralogical, structural or textural features of the rocksuch as grain boundary pores bordering mainly quartz and feldspar grains,
• sheet silicate pores, which are mainly bound to shear bands consisting of muscovite, biotiteand chlorite and which are mainly orientated parallel to the (001)-cleavage planes
• microfractures which were observed as fine cracks within larger quartz and feldspar grainsbut also cross-cutting several mineral grains disregarding any textural or structural featurewithin the rock
• solution pores were defined as diffuse, cloudy impregnated sections of altered and exsolutedfeldspar, epidote and mica grains.
Since all of the different pore types distinguished in the matrix of both the Grimsel andKurihashi granodiorites (see OTA et al. 2003) can be filled with acrylic resin, it can be assumedthat they build an interconnected and permeable network and are, therefore, readily accessible tocontaminants diffusing into the matrix from associated water-conducting features. The orienta-tion and relative frequency of individual pore sets strongly depends on the fabric and texture ofthe related host minerals since microfractures and grain boundary pores predominate. The mostsignificant fabric change from the wall rocks towards the centre of the shear zone is an increaseof the intensity of the planar fabric which is best reflected by the orientation pattern of the
21 c.f. penetration depth of 2 – 8 cm for the in situ diffusion of iodide from boreholes in VILKS et al. (2001).
NAGRA NTB 00-08 82
(001)-cleavage planes. It can be assumed that the connectivity of the corresponding micro-fractures increases in the same direction. As a consequence, within the shear zone a channelledfluid flow through microfractures parallel to the foliation has to be expected.
A 3-D model of pore space distribution within the matrix revealed a constrictive and/or tortuousgeometry of the matrix porosity caused by resin accessible pore spaces ("microchannels") andnon-accessible spaces ("barriers") with pore dimensions of less than 1 µm.
The diffusion accessible rock volume, described as connected/resin impregnated porosity, wasdetermined by different techniques and the results were in good agreement: buoyancy weight-ing, water saturation gravimetry, mercury injection porosimetry and chemical analysis porosi-metry. Buoyancy weighting on samples previously resin impregnated in situ, revealed porositiesof about 0.6 vol%. Assuming that all accessible in situ porosity was already filled by resin, thisadditional (or residual) porosity can be assumed to be an indication of drilling / sub-samplingdamage. The subtraction of this residual porosity from porosities derived from non-impregnatedlaboratory samples resulted in an in situ porosity of 0.4 to 0.5 vol%, or a third to a half of theporosity that is measured on conventionally sampled (i.e. non-impregnated) rock specimens inthe laboratory. The results from water saturation gravimetry, mercury injection porosimetry andchemical analysis porosimetry on non-impregnated samples revealed porosity values of between0.53 and 0.80 vol% (comparable to existing data for the Grimsel granodiorite). Mercury injec-tion porosimetry and chemical analysis porosimetry on in situ impregnated samples revealedporosity values between 0.27 and 0.39 vol%, strongly suggesting that more than half of theconnected porosity determined by standard laboratory measurements is an artefact of stressrelease and sample preparation.
However, the significance of this result should not be overstressed as the number of samplesanalysed to date using this methodology are not statistically significant. Nevertheless, thesupport of independent data can increase confidence in these new data and, here, this is provi-ded by the results of the universal stage analyses.
Measurements of matrix permeability assuming a confining pressure of 20 MPa (which closelyapproximates the in situ conditions at both sites) revealed a hydraulic conductivity of between1.00 × 10-12 m s-1 and 7.12 × 10⁻¹³ m s-1. The anisotropy of the permeability/hydraulic conducti-vity was strongly related to the rock foliation, the smallest values were usually present normalto the foliation. From measured microfracture data, it was obvious that mainly the (001) clea-vage microfractures in mica, plus microfractures in feldspars and quartz control the directionaldependence of the hydraulic properties. This is also the case at higher confining pressures.
For both in situ impregnated and non-impregnated samples, a strong geometric relationship bet-ween the ∆Vp stereograms and the pole figures under dry, water-saturated conditions and higherconfining pressures indicated that the multi-directional Vp anisotropy was mainly caused by theobserved and quantified pore fabrics. In fact, the ∆Vp values between impregnated and non-impregnated samples reflect the bulk microfracture patterns which effectively influence the Vpanisotropy at lower confining pressure (below 20 MPa). An influence, especially on the micro-fractures in mica, connected microfractures in quartz and those in feldspar, could be recognisedin the ∆Vp stereogram, too. These pore sets which were mainly oriented parallel to the foliationproduced a marked open connected porosity also under in situ conditions (cf the results of the3-D pore space reconstruction discussed above). Moreover, the direct comparison of Vp be-tween dry and saturated conditions allowed a quantitative comparison between open in situpores and those effects produced by stress release after core extraction and sample treatment.This revealed an in situ porosity of about 0.5 %, in agreement with the upper limit of the diffe-rent porosity measurements discussed above.
83 NAGRA NTB 00-08
However, variations in the precise value of the matrix porosity and of the matrix pore diffusioncoefficient (and, therefore on tortuosity and constrictivity22) on calculated radionuclide retarda-tion in a repository host rock are small. Of much more significance is the distance that this poro-sity extends into the rock behind the water conducting features. Although the resin injected insitu penetrated only 6 – 8 cm away from the boreholes into the rock matrix, of much moreimportance is the simple fact that the matrix around the injection boreholes (and outwith theBDZ) could be successfully impregnated with resin at all. This clearly indicates the existance ofan interconnected system of different pore types and it can be reasonably assumed that this porespace is accessible to contaminants migrating through a repository host rock. Furthermore, itshould be remembered that the borehole layout was set-up such that there is a continuous profilethrough matrix rock on both sides of the shear zone for several metres. The clear implication,therefore, is that the pore connectivity spreads for at least this distance too. Indeed, once outwiththe zone of influence of the shear zone (a few decimetres deep at most), there is little obviousdifference in the pore space geometry (other than the constrictivity and tortuosity shown by the'barrier' and 'channel' effect discussed above) and it is therefore tempting to suggest that theentire rock matrix is, in principle, open to diffusive transport of contaminants.
There is certainly evidence from the Scandinavian Shield that connected porosity can extend for0.5 m behind fractures in some cases (see the discussions in SMELLIE & STUCKLESS 1985,and ALEXANDER et al. 1990a) and evidence from both granites and sediments for thepresence of connected porosity in the rock matrix several metres away from fractures (seeHOFMANN 1990 and MILLER et al. 2000, for discussion). These data are also consistent withrecent observations (SMELLIE 2000) from the Aspö site in Sweden on matrix pore fluids,which imply a connected porosity over distances of several metres (although it is speculatedhere that the form of connectivity may include microfracturing, there is, as yet, no hardevidence).
This being the case, it seems likely that the usual PA assumption of limited matrix diffusiondepth may well be over-conservative and that it is simply a case of looking systematically formore evidence of connected matrix porosity at depth in a repository host rock. Although it isaccepted that most repository designs can be shown to be safe without requiring the presence oflarge volumes of accessible host rock, it would certainly greatly increase confidence in thepotential retardation capacity of a host rock if unlimited matrix diffusion could be shown tooccur. Such a long-term, large scale demonstration experiment is currently under considerationfor the planned Grimsel Phase VI (more details on www.grimsel.com).
22 See also the comments in footnote 16 on the treatment of variations in tortuosity and constrictivity in transport
codes.

NAGRA NTB 00-08 84
11 ACKNOWLEDGEMENTS
The authors would like to extend their thanks to the many colleagues who contributed to thiswork in some capacity or another, especially to H. Dollinger and P. Bossart of the Geotech-nisches Institut, Switzerland. Thanks also to Nagra and JNC for funding this work as part of thejoint GTS radionuclide migration programme RMP.
85 NAGRA NTB 00-08
12 REFERENCES
ALEXANDER, W.R., SCOTT, R.D., MACKENZIE, A.B. & McKINLEY, I.G. (1990a):Natural analogue studies in crystalline rock: the influence of water bearing fractures onradionuclide immobilisation in a crystalline rock repository. Nagra Technical ReportNTB 87-08. Nagra, Wettingen, Switzerland.
ALEXANDER, W.R., McKINLEY, I.G., MACKENZIE, A.B. & SCOTT, R.D. (1990b):Verification of matrix diffusion in granite by means of natural decay series disequilibria.Sci. Basis Nucl. Waste Manag. XIII, 567-576.
ALEXANDER, W.R., BRADBURY, M.H., McKINLEY, I.G., HEER, W., EIKENBERG, J. &FRICK, U. (1992): The current status of the radionuclide migration experiment at theGrimsel underground rock laboratory. Sci. Basis Nucl. Waste Manag. XV, 721-728.
ALEXANDER, W.R., OTA, K. & FRIEG, B. (eds.) (2001): The Nagra-JNC in situ study ofsafety relevant radionuclide retardation in fractured crystalline rock II: the RRP projectmethodology development, field and laboratory tests. Nagra Technical Report NTB00-06. Nagra, Wettingen, Switzerland.
ALEXANDER, W.R., OTA, K., MÖRI, R. & McKINLEY, I.G. (2002): Synthesis of the resultsof the 15 year Nagra-JNC Radionuclide Migration Programme. Geochem. Trans. (inprep.).
AUZERAIS, F.M., DUNSMUIR, J., FERREOL, B.B., MARTYS, N., OLSON, J.,RAMAKRISHNAN, T.S., ROTHMAN, D.H. & SCHWARTZ, L.M. (1996): Transport insandstone: a study based on three dimensional microtomography. Geophys. Res. Lett. 23,705-708.
BARENBLATT, G.I., ZHELTOV IV, P. & KOCHINA, I.N. (1960): Basic concepts in thetheory of seepage of homogeneous liquids in fissured rock. J. Appl. Math. Mech. 24,1286.
BIRCH, F. (1960): The velocity of compressional waves in rocks to 10 kilobars – Part 1. J.Geophys. Res. 65, 1083-1102.
BIRCH, F. (1960): The velocity of compressional waves in rocks to 10 kilobars – Part 2. J.Geophys. Res. 66, 2199-2224.
BISCHOFF, K., WOLF, K. & HEIMGARTNER, B. (1987): Hydraulische Leitfähigkeit, Poro-sität und Uranrückhaltung von Kristallin und Mergel: Bohrkern-Infiltrationsversuche.Nagra Technical Report NTB 85-42. Nagra, Wettingen, Switzerland.
BLÜMLING, P. (1997): Borehole sealing project at the Grimsel Test Site. 3rd EuropeanEngineering Geology Conference, 33rd Annual Conference of the Engineering Group ofthe Geological Society. Geo-Engineering of Hazardous and Radioactive Waste Disposal.10 – 14 September 1997. Proc., edited by G.M. Reeves 19-36.
BOSSART, P. & MAZUREK, M. (1991): Structural geology and water flow paths in themigration shear zone. Nagra Technical Report NTB 91-12. Nagra, Wettingen, Switzer-land.
NAGRA NTB 00-08 86
BOSSART, P., MAZUREK, M. HELLMUTH, K.-H., SCHNEEBELI, M. & SIITARI-KAUPPI, M. (1991): Structural geology and water flow-paths in the Migration shear-zone. Nagra Technical Report NTB 91-12. Nagra, Wettingen, Switzerland.
BRACE, W.F. (1965): Some new measurements of linear compressibility of rocks. J. Geophys.Res. 70/2, 391-398.
BRACE, W.F., WALSH, J.B. & FRANGOS, W.T. (1968): Permeability of granite under highpressure. J. Geophys. Res. 2225-2236.
BRADBURY, M.H. & STEPHEN, I.G. (1986): Diffusion and permeability based sorptionmeasurements in intact rock samples. Sci. Basis Nucl. Waste Manag. IX, 81-90.
BRADBURY, M.H., GREEN, A., LEVER, D. & STEPHEN, I.G. (1986): Diffusion andpermeability based sorption measurements in sandstone, anhydrite and Upper MagnesianLimestone samples. UKAEA Report AERE R 11995. AEA Technology, Harwell, UK.
BROWN, G.O., STONE, M.L. & GAZIN, J.E. (1993): Accuracy of gamma ray computerizedtopography in porous media. Water Resour. Res. 29, 479-486.
BYEGÅRD, J., WIDERSTRAND, H., SKALBERG, M., TULLBORG, E.-L. & SIITARI-KAUPPI, M. (2001): Complementary investigation of diffusivity, porosity and sorptivityof Feature A-site specific geologic material. Äspö International Co-operation ReportICR-01-04. SKB, Stockholm, Sweden.
CHERNIS, P.J. (1981): Scanning electron microscope study of the microcrack structure of agranite sample from Pinawa, Manitoba. AECL report TR-173. AECL, Whiteshell,Canada.
CHERNIS, P.J. (1983): Notes on the pore-microfracture structure of some granitic samplesfrom the Whiteshell Nuclear Research Establishment. AECL Report TR-226. AECL,Whiteshell, Canada.
CHERNIS, P.J. (1984): Comparison of the pore microcrack structure of shallow and deepsamples of the Lac Du Bonnet granite. AECL Report TR-223. AECL, Whiteshell,Canada.
CHOUKROUNE, P. & GAPAIS, D. (1983): Strain pattern in the Aar granite (Central Alps):orthogneis developed by bulk inhomogeneous flattening. J. Struct. Geol. 5, 411-418.
DREW, D.J. & VANDERGRAAF, T.T. (1989): Construction and operation of a high pressureradionuclide migration apparatus. AECL Report TR-476. AECL, Whiteshell, Canada.
FRANKLIN, J.A.M., VOGLER, U.W., SZLAVIN, J., EDMOND, J.M., BIENIAWSKI, Z.T.(1979): Suggested methods for determining water content, porosity, density, adsorptionand related properties and swelling and slake durability index properties. In: BROWN,E.T. (ed.): Rock characterization testing and monitoring, ISRM suggested methods, 81-94. Pergamon Press, Oxford.
FREDRICH, J.T., MENÉNDEZ, B. & WONG, T.-F. (1995): Imaging the pore structure of geo-materials. Science 268, 276-279.

87 NAGRA NTB 00-08
FREDRICH, J.T. (1999): 3-D imaging of porous media using laser scanning confocalmicroscopy with application to microscale transport processes. Phys. Chem. Earth A/24,551-561.
FRICK, U., ALEXANDER, W.R., BAEYENS, B., BOSSART, P., BRADBURY, M.H.,BÜHLER, CH., EIKENBERG, J., FIERZ, TH., HEER, W., HOEHN, E., McKINLEY,I.G. & SMITH, P.A. (1992): The radionuclide migration experiment – Overview of inves-tigations 1985-1990. Nagra Technical Report NTB 91-04. Nagra, Wettingen, Switzer-land.
FRICK, U., SKAGIUS, K. & ALEXANDER, W.R. (1993): An evaluation of diffusion in thegroundwater of crystalline rocks. Unpubl. Nagra Internal Report, translated January 1996.Nagra, Wettingen, Switzerland.
GARRELS, R.M., DREYER, R.M. & HOWLAND, A.L. (1949): Diffusion of ions throughintergranular spaces in water saturated rocks. Bull. Geol. Soc. Amer. 60, 1809-1924.
GRISAK, G.E. & PICKENS, J.F. (1980): Solute transport through fractured media. PartI: The effect of matrix diffusion. Water Resour. Res. 16, 719-730.
GRISAK, G.E., PICKENS, J.F., BELANGER, D.W. & AVIS, J.D. (1985): Hydrogeologictesting of crystalline rocks during the Nagra Deep Drilling Programme. Unpubl. NagraInternal Report. Nagra, Wettingen, Switzerland.
HADERMAN, J. & RÖSEL, F. (1985): Radionuclide chain transport in homogeneouscrystalline rocks: limited matrix diffusion and effective surface sorption. Nagra TechnicalReport NTB 85-40. Nagra, Wettingen, Switzerland.
HASTRUP, K (1976): Pore structure, mechanical properties and polymer characteristics ofporous materials impregnated with methylmethacrylate. Library of Danish AtomicEnergy Commission, Risö, Roskilde, Denmark.
HEATH, M.J. & MONTOTO, M. (1996): Rock matrix diffusion as a mechanism for radio-nuclide retardation: natural radio-element migration in relation to the microfractographyand petrophysics of fractured crystalline rock. CEC Report EUR 17121 EN, CECLuxembourg.
HEER, W. & SMITH, P.A. (1998): Modelling the radionuclide migration experiment at Grimsel– What have we learned? Sci. Basis Nucl. Waste Manag. XXI, 663-670.
HELLMUTH, K.-H. & SIITARI-KAUPPI, M. (1998): Imprägnation von Tongesteinen mitC-14-Polymethylmethacrylat (PMMA). Unpubl. Nagra Internal Report. Nagra,Wettingen, Switzerland.
HELLMUTH, K.-H., KLOBES, P., MEYER, K., RÖHL-KUHN, B., SIITARI-KAUPPI, M.,HARTIKAINEN, J., HARTIKAINEN, K. & TIMONEN, J. (1995): Matrix retardationstudies: size and structure of the accessible pore space in fresh and altered crystallinerock. Z. geol. Wiss. 23/(5/6), 691-706.
HOFMANN, B.A. (1990): Reduction spheres in haematitic rocks from northern Switzerland:implications for the mobility of some rare elements. Nagra Technical Report NTB 89-17.Nagra, Wettingen, Switzerland.
NAGRA NTB 00-08 88
JNC (2000): H12: Project to Establish the Scientific and Technical Basis for HLW Disposal inJapan. Supporting Report 3, Safety Assessment of the Geological Disposal System. JNCTechnical Report TN1410 2000-004. JNC, Tokai, Japan.
KBS (1983): Final storage of spent nuclear fuel. SKB/KBS 3. Stockholm, Sweden.
KEUSEN, H.R., GANGUIN, J., SCHULER, P. & BULETTI, M. (1989): Felslabor Grimsel –Geologie. Nagra Technical Report NTB 87-14. Nagra, Wettingen, Switzerland.
KICKMAIER, W., VOMVORIS, S., ALEXANDER, W.R., MARSHALL, P., FRIEG, B.,WANNER, W. & HUERTAS, F. (2001): GTS – Nagra's underground research laboratoryin crystalline rock: status of the scientific programme 1997 – 2002. Hydrology (in press).
KLINKENBERG, L.J. (1951): Analogy between diffusion and electrical conductivity in porousrocks. Bull. Geol. Soc. Amer. 62, 559-568.
KOPLIK, J., LIN, C. & VERMETTE, M. (1984): Conductivity and permeability from micro-geometry. J. Appl. Phys. 56, 3127-3131.
KULL, H., BREWITZ, W. & KLARR, K. (1993): Felslabor Grimsel – Ventilationstest: In-situ-Verfahren zur Permeabilitätsbestimmung im Kristallin. Nagra Technical Report NTB91-02. Nagra, Wettingen, Switzerland.
LIN, C., PIRIE, G. & TRIMMER, D.A. (1986): Low permeability rocks – Laboratory measure-ments and three-dimensional microstructural analysis. J. Geophys. Res. 91, 2173-2181.
McKINLEY, I.G. (1989a): Applying natural analogues in predictive performance assessment: 1.Principles and requirements. In: SALTELLI, A., STANNERS, D.A. & D'ALLESSAN-DRO, M. (eds.): Risk analysis in nuclear waste management, 377-396 (1989).
McKINLEY, I.G. (1989b): Applying natural analogues in predictive performance assessment:2. Examples and discussions. In: SALTELLI, A., STANNERS, D.A. & D'ALLESSAN-DRO, M. (eds.): Risk analysis in nuclear waste management, 377-396 (1989).
McKINLEY, I.G., ALEXANDER, W.R., BAJO, C., FRICK, U., HADERMANN J., HERZOG,F.A. & HOEHN, E. (1988): The radionuclide migration experiment at the Grimsel rocklaboratory, Switzerland. Sci. Basis Nucl. Waste Manag. XI, 170-187.
MARQUER, D. & GAPAIS, D. (1985): Les massifs cristallins externes sur une transversaleGuttannen – Val Bedretto (Alpes Centrales): Structures et histoire cinématique. Comptesrendus de l'Académie des Sciences, Paris, tome 301(II)/8, 543-546.
MARQUER, D., GAPAIS, D. & CAPDEVILA, R. (1985): Comportement chimique et ortho-gneissification d'une granodiorite en faciès schistes verts (Massif de l'Aar, AlpesCentrales). Bull. Mineral 108, 209-221.
MAZUREK, M., ALEXANDER, W.R. & MACKENZIE, A.B. (1996): Contaminant retardationin fractured shales: matrix diffusion and redox front entrapment. J. Contam. Hydrol. 21,71-84.
MILLER, W.M., ALEXANDER, W.R., CHAPMAN, N.A., McKINLEY, I.G. & SMELLIE,J.A.T. (2000): Geological disposal of radioactive wastes and natural analogues. Perga-mon, Amsterdam, The Netherlands.
89 NAGRA NTB 00-08
MÖRI, A., BÜHLER, C., HAAG, P. & OTA, K. (1996): Connected Porosity (CP) – visualisingthe pore space in crystalline rock matrix using fluorescent acrylic resin. Unpubl. NagraInternal Report. Nagra, Wettingen, Switzerland.
MÖRI, A., ALEXANDER, W.R., OTA, K. & FRIEG, B. (eds.) (2001): The Nagra-JNC in situstudy of safety relevant radionuclide retardation in fractured crystalline rock III: the RRPproject final report. Nagra Technical Report NTB 00-07 (in prep.). Nagra, Wettingen,Switzerland.
MONTOTO, M., HEATH, M.J., RODRIGUEZ REY, A., RUIZ DE ARGANDONA, V.G.,CALLEJA, L. & MENEDEZ, B. (1992): Natural analogue and microstructural studies inrelation to radionuclide retardation by rock matrix diffusion in granite. CEC Report EUR14352 EN, CEC Luxembourg.
MONTOTO, M., MARTIEZNISTAL, A., RODRIGUEZ REY, A., FERNANDEZ MERAYO,N. & SORIANO, P. (1995): Microfractography of granitic-rocks under confocal scanninglaser microscopy. J. of Microscopy 177, 138-149.
NAGRA (1985): Nukleare Entsorgung Schweiz: Konzept und Übersicht über das ProjektGewähr. Nagra Gewähr Reports NGB 85-01 to 85-08, NGB 85-09 (English Summary).Nagra, Wettingen, Switzerland.
NAGRA (1994): Kristallin-1 Safety Assessment Report. Nagra Technical Report NTB 93-22.Nagra, Wettingen, Switzerland.
NEALL, F.N. & SMITH, P.A. (2001): H12: a perspective on PA aims, procedures, data andresults. Unpubl. Nagra Project Report. Nagra, Wettingen, Switzerland.
NERETNIEKS, I. (1980): Diffusion in the rock matrix: an important factor in radionuclideretardation? J. Geophys. Res. 85, 4379-4397.
NERETNIEKS, I. (1985): Some Aspects of the use of iron canisters in deep lying repositoriesfor nuclear waste. Nagra Technical Report NTB 85-35. Nagra, Wettingen, Switzerland.
NOVER, G., HEIKAMP, S., KOTNY, A. & DUBA, A. (1995): The effect of pressure on theelectrical conductivity of KTB rocks. Surveys in Geophysics 16, 63-81.
NUR, A. & SIMMONS, F. (1969): The effect of saturation on velocity in low porosity rocks.Earth Planet Sci. Lett. 7, 183-193.
OTA, K., AMANO, K. & ANDO, T. (1999): Brief overview of in situ nuclide retardation in afractured crystalline rock, Kamaishi In Situ Test Site. In: Proceedings of an InternationalWorkshop for the Kamaishi Experiments, Kamaishi, Japan, August 1998. JNC TechnicalReport, JNC TN7400 99-00. JNC Tono Geosience Centre, Toki, Japan.
OTA, K., MÖRI, A., ALEXANDER, W. R., FRIEG, B. & SCHILD, M. (2003): Influence ofthe mode of matrix porosity determination on matrix diffusion calculations. J. Contam.Hydrol. 61, 131-145.
POPP, T. (1994): Der Einfluss von Gesteinsmatrix, Mikrorissgefügen und intergranularen Flui-den auf die elastischen Wellengeschwindigkeiten und die elektrische Leitfähigkeit krus-tenrelevanter Gesteine unter PT-Bedingungen – eine experimentelle Studie. PhD Thesis,Univ. Kiel, 167pp.

NAGRA NTB 00-08 90
RASILAINEN, K., HELLMUTH, K.H., KIVEKÄS, L., MELAMED, A., RUSKEENIEMI, T.,SIITARI-KAUPPI, M., TIMONEN, J. & VALKIAINEN, M. (1996): An interlaboratorycomparison of methods for measuring rock matrix porosity. VTT Research Notes 1776.Technical Research Center of Finland, Espoo, Finland.
RASMUSON, A. & NERETNIEKS, I. (1981): Migration of radionuclides in fissured rock: theinfluence of micropore diffusion and longitudinal dispersion. J. Geophys. Res. 86, 3749-3578.
SARDINI, P., SAMMARTINO, S., MEUNIER, A. & TEVISSEN, E. (1999): Evolution of fluidpathways of Charroux-Civray tonalite (Part II): numerical study of microcrack networks.Phys. Chem. Earth A 24/7, 621-625.
SCHILD, M. (1999): Verbundene Mikroporositäten in Kristallingesteinen. Fallstudie FelslaborGrimsel; PhD Thesis, Univ. Göttingen, 176pp.
SIEGESMUND, S., VOLLBRECHT, A., CHLUPAC, T., NOVER, G., DÜRRAST, H.,MÜLLER, J. & WEBER, K. (1993): Fabric-controlled anisotropy of orthophysical prop-erties observed in KTB core samples. Scientific Drilling 4, 31-54.
SKAGIUS, K. & NERETNIEKS, I. (1982): Diffusion in crystalline rocks of some sorbing andnon-sorbing species. SKB Technical Report TR 82-12. SKB, Stockholm, Sweden.
SKAGIUS, K. & NERETNIEKS, I. (1983): Diffusion measurements in crystalline rocks. SKBTechnical Report TR 83-15. SKB, Stockholm, Sweden.
SKAGIUS, K. & NERETNIEKS, I. (1985a): Diffusivities in crystalline rock materials. Sci.Basis Nucl. Waste Mang. IX, 73-80.
SKAGIUS, K. & NERETNIEKS, I. (1985b): Porosities and diffusivities of some non-sorbingspecies in crystalline rock. SKB Technical Report TR 85-03. SKB, Stockholm, Sweden.
SKAGIUS, K. & NERETNIEKS, I. (1986): Porosities and diffusivities of some non-sorbingspecies in crystalline rocks. Water Resour. Res. 22, 389-397.
SMELLIE, J.A.T. (2000): Aspö Hard Rock Laboratory: status report of the Matrix FluidExperiment, June 1998 – June 2000. Äspö Internal Progress Report IPR-00-35. SKB,Stockholm, Sweden.
SMELLIE, J.A.T. & STUCKLESS, J.S. (1985): Element mobility studies of two drillcores fromthe Götemar granite (Krakemala test site), SE Sweden. Chem. Geol. 51, 55-78.
SMITH, P.A., ALEXANDER, W.R., HEER, W., FIERZ, T., MEIER, P.M., BAEYENS, B., BRADBURY, M.H., MAZUREK, M. & McKINLEY, I.G. (2001a): The Nagra-JNC insitu study of safety relevant radionuclide retardation in fractured crystalline rock I: theradionuclide migration experiment – Overview of investigations 1990-1996. Nagra Tech-nical Report NTB 00-09. Nagra, Wettingen, Switzerland.
SMITH, P.A., ALEXANDER, W.R., KICKMAIER, W., OTA, K., FRIEG, B. & McKINLEY(2001b): Development and testing of radionuclide transport models for fractured rock:examples from the Nagra/JNC Radionuclide Migration Programme in the Grimsel TestSite, Switzerland. J. Contam. Hydrol. 47, 335-348.
91 NAGRA NTB 00-08
SPANNE, P., THOVERT, J.F., JACQUIN, C.J., LINDQUIST, W.B., JONES, K.W. & ADLER,P.M. (1994): Synchrotron computed microtomography of porous media: topology andtransports. Phys. Rev. Lett. 73, 2001-2004.
STECK, A. (1968): Die alpidischen Strukturen in den Zentralen Aaregraniten des westlichenAarmassivs. Eclogae geol. Helv. 61, 19-48.
TORSTENFELT, B., ITTNER, T., ALLARD, B., ANDERSSON, K. & OLOFSSON, U.(1982): Mobilities of radionuclides in fresh and fractured crystalline rock. SKB TechnicalReport TR 82-26. SKB, Stockholm, Sweden.
VALKIANEN, M. (1992): Diffusion in the rock matrix – A review of laboratorytests and field studies. YJT (Nuclear Waste Commission of Finnish Power Companies)Report 92-04. YJT, Helsinki, Finland.
VILKS, P., CRAMER, J.J., JENSEN, M., MILLER, N.H., MILLER, H.G. & STANCHELL,F.W. (2001): In-situ diffusion experiment in granite: Phase I. J. Contam. Hydrol.(submitted).
VOLLBRECHT, A., RUST, S. & WEBER, K. (1991): Development of microcracks in granitesduring cooling and uplift: examples from the Variscan basement in NE Bavaria (FRG). J.Struct. Geol. 7, 787-799.
VOMVORIS, S. & FRIEG, B. (eds.) (1992): Overview of Nagra field and modelling activitiesin the ventilation drift (1988-1990). Nagra Technical Report NTB 91-34. Nagra,Wettingen, Switzerland.
WATANABE, K., TAKEDA, S., YAMABE, T., ISHIYAMA, K. & BOSSART, P. (1993):Displacements of fractures during an in situ freezing and thawing test. I: Proceedings ofan International Symposium on the Assessment and Prevention of Failure Phenomena inRock Engineering, 5-7 April 1993. Istanbul, Turkey.