technical paper - unfcccunfccc.int/resource/docs/2013/tp/02.pdf · fccc/tp/2013/2 3 i. executive...
TRANSCRIPT

GE.13-63820
Non-economic losses in the context of the work programme on loss and damage
Technical paper
Summary
This technical paper provides a literature review and critical analysis on the following aspects of non-economic losses of climate change: the conceptual background, including how non-economic losses contribute to loss and damage and the total cost of climate change; the main types of non-economic losses that might occur and the ways in which they may materialize; various assessment techniques available to estimate non-economic losses, both generically and through concrete examples of current practice; and implications of the different assessment techniques for the identification of non-economic risks and the design of practical adaptation actions to manage them.
United Nations FCCC/TP/2013/2
Distr.: General 9 October 2013 English only

FCCC/TP/2013/2
2
Contents Paragraphs Page
I. Executive summary ................................................................................................. 1–24 3
A. Mandate .......................................................................................................... 1–2 3
B. What are non-economic losses and why are they important? ......................... 3–5 3
C. How do non-economic losses contribute to total climate costs? ..................... 6–7 3
D. What are the main types of non-economic losses? ......................................... 8–10 4
E. Can non-economic losses be valued? ............................................................. 11–16 4
F. How can decision makers take into account non-economic losses? ............... 17–19 5
G. What are the challenges for policymakers when managing the risk of non-economic loss? ....................................................................... 20–24 5
II. Background ............................................................................................................. 25–31 6
III. Non-economic losses in the context of climate change ........................................... 32–68 8
A. An explanation of terms .................................................................................. 32–49 8
B. Valuation, measurement and comparability of non-economic losses ............. 50–60 13
C. Non-economic losses in the context of human activity .................................. 61–68 17
IV. A typology and overview of non-economic losses .................................................. 69–104 21
A. The incidence of non-economic losses ........................................................... 69–73 21
B. The main types of non-economic losses ......................................................... 74–104 22
V. Methods for assessing non-economic losses ........................................................... 105–144 34
A. Frameworks for assessment and valuation of non-economic losses ............... 105–116 35
B. Valuing and evaluating non-economic losses ................................................. 117–144 38
VI. Managing the risks of non-economic losses ............................................................ 145–157 49
A. Incorporating non-economic value into economic decision-making .............. 145–150 49
B. Making good adaptation decisions in addressing non-economic losses ......... 151–153 50
C. Addressing practical limits to adaptation in non-economic sectors ................ 154–157 51
VII. Conclusions ............................................................................................................. 158–169 52
Annex
Frameworks for assessing non-economic losses ..................................................... 59

FCCC/TP/2013/2
3
I. Executive summary
A. Mandate
1. This technical paper responds to a request by the Conference of the Parties (COP) at its eighteenth session to carry out further activities under the work programme on loss and damage, including the preparation of a technical paper on non-economic losses (decision 3/CP.18, para. 10(b)). This technical paper seeks to:
(a) Provide the conceptual background on non-economic loss, including how non-economic losses contribute to loss and damage, and the total cost of climate change;
(b) Describe the main types of non-economic losses and the ways in which they may materialize;
(c) Discuss the various assessment techniques available to estimate non-economic losses;
(d) Indicate what the different assessment techniques imply for the identification of non-economic risks and the design of practical adaptation actions.
2. Consistent with the work programme on loss and damage, the main focus of this technical paper is on developing countries that are particularly vulnerable to the adverse effects of climate change.
B. What are non-economic losses and why are they important?
3. Climate change will affect a wide range of social, economic and environmental systems. It has become common to split these impacts into non-economic losses and economic losses. Economic losses can be understood as the loss of resources, goods and services that are commonly traded in markets. As such, economic losses should be recorded by and manifest in the system of national accounts (although they may not be in countries with large informal economies). Market prices can be used to value economic losses.
4. Non-economic losses can be understood as the remainder of items that are not economic items; that is to say that non-economic items are those that are not commonly traded in markets. The absence of a market price is one of the main reasons why assessing non-economic losses is challenging. However, their effect on human welfare is no less important.
5. In many developing countries, non-economic losses may well be more significant than economic losses. Recognizing and managing the risk of non-economic loss should therefore be a central aspect of climate change policy.
C. How do non-economic losses contribute to total climate costs?
6. The total costs of climate change can be categorized as follows:
(a) Mitigation costs: the cost of reducing greenhouse gas emissions to limit the extent of climate change;
(b) Adaptation costs: the cost of dealing with the consequences of unavoidable climate change;
(c) Loss and damage: the residual costs, which are not avoided through adaptation and mitigation, and which can be further split into:

FCCC/TP/2013/2
4
(i) Economic loss;
(ii) Non-economic loss.
7. Non-economic losses are therefore one of the cost elements that constitute the total cost of climate change. There is a link between the magnitude of adaptation cost, mitigation cost and loss and damage. Increasing the mitigation effort (higher mitigation costs) would reduce loss and damage and make adaptation cheaper. For example, greater mitigation should result in a smaller increase in sea levels and so less protection from sea level rise will be required. Increasing the amount of adaptation (higher adaptation cost) will also reduce loss and damage. For example, changing agricultural practices to suit the change in climate will cause less disruption than a failed crop.
D. What are the main types of non-economic losses?
8. Non-economic losses occur in three distinct areas: private individuals, society and the environment. More specifically, non-economic losses can be understood as losses of, inter alia, life, health, displacement and human mobility, territory, cultural heritage, indigenous/local knowledge, biodiversity and ecosystem services.
9. Non-economic losses may occur through many channels. They may be related to both slow onset impacts (e.g. the loss of territory to sea level rise) and extreme events (e.g. loss of life in a cyclone) associated with climate change. The loss may be directly linked to adverse climate change impacts (e.g. loss of ecosystems) or occur indirectly (e.g. malnutrition as a consequence of impacts in the agriculture sector).
10. The distinction between non-economic loss and economic loss will sometimes be blurred. For example, damage to natural ecosystems is primarily a non-economic loss, since ecosystem services are rarely traded on the market. However, there may be market impacts if one of the services the ecosystem provides is food or fibre, the provision of which is part of the market economy.
E. Can non-economic losses be valued?
11. While valuation in common parlance is associated with money and therefore economic methods, a broader interpretation of the act of valuation is simply to “compare
the relative merits of actions or objects”. There is a lot of experience worldwide with the assessment and valuation of non-economic impacts of human development and natural phenomena in this way.
12. This technical paper identifies four broad categories of valuation technique: economic valuation, multicriteria decision analysis (MCDA), composite risk indices and qualitative/semi-quantitative methods. All of them have been used in a climate change context.
13. The aim of economic valuation is to express non-economic impacts in monetary terms, rendering them comparable to economic impacts and costs. The main methods of non-market valuation are (a) revealed preference methods, which observe what people do (e.g. the money spent on visiting cultural sites) and (b) stated preference methods, which elicit valuations from surveys. Sometimes it is possible to derive values from existing studies, obviating the need for bespoke new analysis. This method is called benefits transfer.
14. MCDA, composite risk indices and qualitative /semi-quantitative approaches do not seek to put money values on non-economic losses. MCDA and composite risk indices use
FCCC/TP/2013/2
5
formal scoring and weighting to the same end. Qualitative/semi-quantitative methods do not attempt to aggregate to the same extent, so it is up to the users of the analysis to compare and evaluate the many effects of policy choices.
15. Whatever method is chosen, the assessment and valuation of non-economic impacts remains very difficult, due to the many uncertainties involved, as well as the essential role of value judgements. These difficulties are usually magnified where analytical capacity is limited.
16. Owing to this complexity, it is very difficult to express aggregate damage in a single number of “total non-economic loss”. Economic valuation techniques have been applied to
the problem, and there are indicative monetary estimates from integrated assessment models, but a detailed quantification of non-economic loss is more likely to rely on a number of different metrics, such as disability adjusted life-years (DALYs) in the case of health impacts.
F. How can decision makers take into account non-economic losses?
17. The assessment of non-economic losses is not the first time that policymakers have confronted the question of how to take into account the non-economic effects of human development and natural phenomena. Experience has accumulated over several decades and in many countries of the assessment of the environmental and social impacts (usually alongside the economic impacts) of new economic development, of existing economic activity and of natural environmental phenomena.
18. Many frameworks have been developed for these purposes, including environmental impact assessment (EIA), strategic environmental assessment (SEA), environmental risk assessment, cost–benefit analysis (CBA), wealth/capital accounting, vulnerability assessment, disaster loss/damage assessment and climate change impacts, adaptation and vulnerability assessment (CCIAV).
19. All these frameworks have their advantages and disadvantages. Their suitability depends on institutional contexts as well as the problem at hand. What they have in common is that they offer well-established toolkits and a rich body of experience in accounting for non-economic factors in economic and social decision-making.
G. What are the challenges for policymakers when managing the risk of
non-economic loss?
20. Managing potential non-economic losses from climate change combines two sets of challenges that policymakers may already be familiar with. The first challenge is the identification and quantification of non-economic value and its inclusion in decision-making, using the techniques introduced above. Incorporating non-economic values into economic decision-making would go a long way to ensure that non-economic systems are robust and healthy.
21. However, using these techniques as a matter of course requires institutional adjustments and a change in appraisal mentality. Monitoring, assessing and managing non-economic impact has to become standard practice, in the way financial and economic appraisal already are.
22. The second challenge is adaptation to climate change more broadly. Many of the issues faced by the adaptation community are the same whether the aim is to prevent economic loss or non-economic loss. Making good adaptation decisions will reduce the risk of economic and non-economic losses alike, as the two are often linked. For example, flood
FCCC/TP/2013/2
6
protection will help to avoid loss related to production interruptions (an economic loss) as well as distress and the outbreak of disease (a non-economic loss).
23. The literature on good adaption decisions stresses two immediate issues. The first is to set adaptation priorities for the immediate future, with a focus on win–win measures that yield immediate benefits (e.g. flood protection, environmental protection) and measures that affect the long-term vulnerability profile of countries (e.g. planning and infrastructure decisions).
24. The second immediate adaptation issue is to remove barriers to effective adaptation by both public and private decisions makers. It is important to recognize the practical limits to adaptation. Problems may be institutional, policy-related, market-related, cognitive or related to insufficient funding, information and skills. The way non-economic impacts are treated – measured, valued and assessed – in adaptation decision-making is one such barrier. The general barriers to adaptation may also be stronger for non-economic losses than for economic losses as institutions, policymakers and markets tend to be less aware of non-economic losses.
II. Background
25. This technical paper on non-economic losses from climate change is prepared under the UNFCCC work programme on loss and damage, and responds to a request made at COP 18.
26. The work programme on loss and damage was established at COP 16 in order to “consider approaches to address loss and damage associated with climate change impacts in developing countries that are particularly vulnerable to the adverse effects of climate change” (decision 1/CP.16). The work programme is part of the broader Cancun Adaptation
Framework, which aims to enhance action on adaptation, reduce vulnerability and build resilience in developing countries.
27. The Subsidiary Body for Implementation (SBI) was requested to agree activities under the work programme and make recommendations on loss and damage for consideration at COP 18. The SBI subsequently agreed that the work programme should have three broad thematic areas (FCCC/SBI/2011/7, para. 109):
(a) The risk of loss and damage associated with the adverse effects of climate change and the current knowledge on the same;
(b) Approaches to address loss and damage associated with the adverse effects of climate change, including impacts related to extreme weather events and slow onset events;
(c) The role of the Convention in enhancing the implementation of approaches to address loss and damage associated with the adverse effects of climate change.
28. A number of activities were agreed and carried out to generate a knowledge base for informed decision-making at COP 18. Based on this information, Parties at COP 18 identified areas for further work and agreed to establish, at COP 19, institutional arrangements to address loss and damage. They also requested the secretariat “to carry
out…interim activities under the work programme on loss and damage, prior to the thirty-ninth session of the Subsidiary Body for Implementation, [including] preparation of a technical paper on non-economic losses” (decision 3/CP.18, para. 10).
FCCC/TP/2013/2
7
29. This technical paper responds to this request. The aim of this technical paper is to:
(a) Analyse the range of non-economic losses associated with climate change impacts and how they fit within the concept of total climate change costs;
(b) Assess methodologies to value/assess the impacts of climate change that are considered non-economic and examine the application of these assessment methods for adaptation planning and practices;
(c) Identify challenges, gaps and priorities to advance the understanding of and action to address non-economic losses.
30. This technical paper is structured as follows:
(a) Chapter III below provides a conceptual overview on non-economic loss, including how non-economic losses contribute to loss and damage and the total cost of climate change;
(b) Chapter IV below describes the main types of non-economic losses that might occur, and explores the ways in which they may materialize;
(c) Chapter V below discusses various assessment techniques available to estimate non-economic losses, both generically and through concrete examples of current practice;
(d) Chapter VI below discusses what the different assessment techniques imply for the identification of non-economic risks and the design of practical adaptation actions.
31. Consistent with the work programme on loss and damage, the main focus of the paper is on developing countries that are particularly vulnerable to the adverse effects of climate change.
FCCC/TP/2013/2
8
III. Non-economic losses in the context of climate change
A. An explanation of terms
1. Loss and damage
32. Loss and damage describes the impact associated with the adverse effects of climate change. These adverse effects include those related to extreme events and slow onset events such as sea level rise, increasing temperatures, ocean acidification, glacial retreat and related impacts, salinization, land and forest degradation, loss of biodiversity and desertification.1 There is no clear distinction between losses and damages in either the literature or under the Convention (although see UNFCCC, 2012), and the two terms are treated as largely synonymous in this technical paper.
1 Decision 1/CP.16, paragraph 25.
Box 1 Summary of non-economic losses
Non-economic losses are one of the cost elements that constitute the total cost of
climate change. The total costs of climate change can be seen to consist of mitigation costs (the cost of reducing greenhouse gas emissions), adaptation costs (the cost of dealing with the consequences of unavoidable climate change) and loss and damage (the residual costs, which are not avoided through adaptation and mitigation), which can be further split into economic loss and non-economic loss.
There is a link between the magnitude of mitigation cost, adaptation cost and loss and damage. Increasing the mitigation effort (higher mitigation costs) would reduce loss and damage and make adaptation cheaper. Increasing the amount of adaptation (higher adaptation cost) will also reduce loss and damage.
It has become common to split impacts of climate change into non-economic losses and economic losses. Economic losses can be understood as the loss of resources, goods and services that are commonly traded in markets. Market prices can be used to value economic losses.
Non-economic losses can be understood as the remainder of items that are not economic items; that is to say that non-economic items are those that are not commonly traded in markets. The absence of a market price is one of the main reasons why assessing non-economic losses is challenging.
In many developing countries, non-economic losses may well be more significant than economic losses and in some cases may be irreversible, such as the loss of cultural items or territory. Recognizing and managing the risk of non-economic loss should therefore be a central aspect of climate change policy.
This technical paper is informed by our current understanding of loss and damage. This understanding is in turn limited to our knowledge of past events and what models tell us about future impacts of climate change. Thus, there may be additional non-economic losses which are not considered here due to conceptual, knowledge and data gaps.

FCCC/TP/2013/2
9
33. The impact of climate change that is of ultimate concern is not these physical effects, but the impact they have on people. Human systems are vulnerable to the physical impacts of the climate; loss and damage is a function of the physical impacts and the degree of vulnerability to these impacts (IPCC, 2012, chapter 1, page 32). Therefore, to understand loss and damage it is essential to understand the magnitude of physical impacts, the degree to which human systems are vulnerable to impacts and the way in which individuals and society value the impacts that they are vulnerable to. These together determine the magnitude of loss and damage arising from a given physical impact.
34. Figure 1 shows how climate change may increase the severity of climate-related loss and damage, represented by the dashed and dotted line. It also shows how adaptation, while reducing loss and damage (going from the dashed and dotted line to the solid line), also imposes costs, which means that the net cost, the dashed line, is higher than residual climate change damage but lower than climate change damage without adaptation. Stabilizing at a given global mean temperature will also entail mitigation costs.
Figure 1 Adaptation reduces gross damages, leaving residual damages
Cost of climate
change without
adaptation
Cost of adaptation
plus residual climate
change damage
Residual climate
change damage
Net benefit of
adaptation
Total cost of
climate change,
after adaptation
Gross benefit
of adaptation
Global mean temperature
Cost of
climate
change
Source: Adapted from Stern (2007).
35. An important simplification in figure 1 is that it does not consider uncertainty; that is, the wide range of possible climate damages that may occur for a given global mean temperature. It is important to understand that, for any given climate, there is a risk of a range of levels of loss and damage occurring, and that this range is large. Assessments of loss and damage must account for this fact if they are to be adequate.
36. People are exposed to climate risk even without climate change, that is to say that there is always a probability distribution over the range of possible levels of climate damage that climate events can cause due to uncertainty in forecasting regardless of whether the climate is changing. This uncertainty, manifested as climate variability, implies that individuals and society do not face just one scenario of loss and damage but instead loss and damage should be understood as having a range of possible magnitudes, each with an associated, although often unknown, chance of occurring. In figure 2, the range of possible climate damages without climate change is represented by the dotted and dashed probability distribution.

FCCC/TP/2013/2
10
37. Climate change exposes individuals and society to a different, most often higher, profile of risk, or probability distribution, of loss and damage. The potential risks of climate change are represented by the dotted probability distribution in figure 2. This profile can be reduced by mitigation, as this reduces the magnitude of climate change relative to ‘business
as usual’ (dashed curve). The profile of risks can be further reduced by adaptation, which reduces vulnerability to climate damages (solid curve). Note that the figure abstracts from the possibility that both climate change and climate policy may alter not just the position, but also the shape of, the probability distribution.
38. The remaining difference in the profile of risks between a situation with ‘no climate
change’ (dotted and dashed curve) and a situation with ‘climate change, plus mitigation and
adaptation’ (solid curve), is the risk of loss and damage attributable to climate change. A likely effect of climate will be to increase the probability of higher levels of loss and damage relative to ‘no climate change’, for example, through adverse slow onset events or an increase in the frequency and/or intensity of extreme events. This is represented by the solid curve shifting towards higher levels of loss and damage relative to the dotted and dashed curve. The dashed area between the solid curve and the dotted and dashed curve shows the levels of loss and damage that have a greater probability of occurring due to climate change. The diamond-hashed area, where the solid curve and the dotted and dashed curve overlap, describes the risk of damage from the climate that does not change between the situations of ‘no climate change’ and ‘climate change, plus mitigation and adaptation’.
The net change in the risk of loss and damage between a situation with no climate change and a situation with climate change will vary across regions and time.
Figure 2 Climate change affects the profile of risks of damage from the climate, which can in
turn be changed through mitigation and adaptation, with loss and damage
attributable to climate change as the residual change in risk
Probability
Probability distribution of
damage from the climate
without climate change
High total damageLow total damage
with climate change
plus mitigation
plus adaptation
increase,
attributable to
climate change, in
risk of high loss
and damage
Note: The shapes of the probability distributions are for illustration only. The change in distribution due to climate change, mitigation and adaptation is not limited to, or necessarily, a shift in the whole distribution. For more information on the possible changes in climate-related probability distributions see Intergovernmental Panel on Climate Change (2012, figure SPM.3).
2. The total cost of climate change
39. Loss and damage is not the only cost associated with climate change. Costs are also incurred in reducing the potential damages from climate change through mitigation and
FCCC/TP/2013/2
11
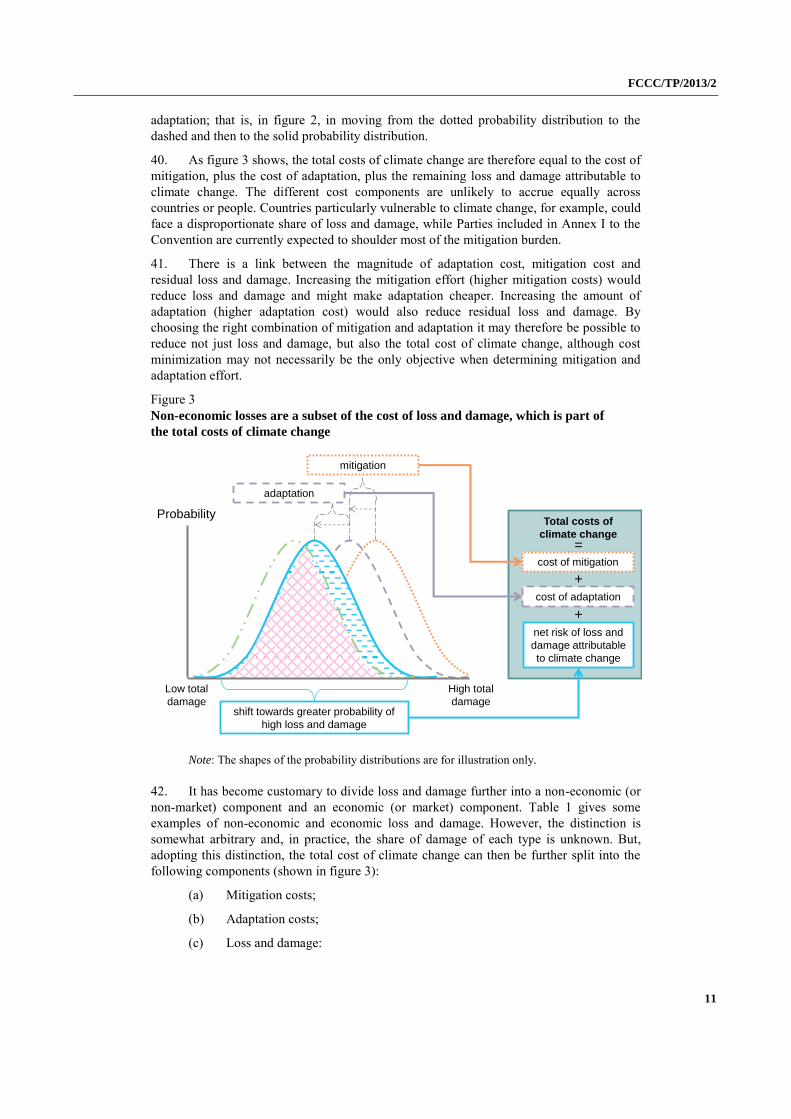
adaptation; that is, in figure 2, in moving from the dotted probability distribution to the dashed and then to the solid probability distribution.
40. As figure 3 shows, the total costs of climate change are therefore equal to the cost of mitigation, plus the cost of adaptation, plus the remaining loss and damage attributable to climate change. The different cost components are unlikely to accrue equally across countries or people. Countries particularly vulnerable to climate change, for example, could face a disproportionate share of loss and damage, while Parties included in Annex I to the Convention are currently expected to shoulder most of the mitigation burden.
41. There is a link between the magnitude of adaptation cost, mitigation cost and residual loss and damage. Increasing the mitigation effort (higher mitigation costs) would reduce loss and damage and might make adaptation cheaper. Increasing the amount of adaptation (higher adaptation cost) would also reduce residual loss and damage. By choosing the right combination of mitigation and adaptation it may therefore be possible to reduce not just loss and damage, but also the total cost of climate change, although cost minimization may not necessarily be the only objective when determining mitigation and adaptation effort.
Figure 3 Non-economic losses are a subset of the cost of loss and damage, which is part of
the total costs of climate change
Probability
shift towards greater probability of
high loss and damage
mitigation
adaptation
cost of mitigation
cost of adaptation
Total costs of
climate change=
+
+
net risk of loss and
damage attributable
to climate change
High total
damage
Low total
damage
Note: The shapes of the probability distributions are for illustration only.
42. It has become customary to divide loss and damage further into a non-economic (or non-market) component and an economic (or market) component. Table 1 gives some examples of non-economic and economic loss and damage. However, the distinction is somewhat arbitrary and, in practice, the share of damage of each type is unknown. But, adopting this distinction, the total cost of climate change can then be further split into the following components (shown in figure 3):
(a) Mitigation costs;
(b) Adaptation costs;
(c) Loss and damage:

FCCC/TP/2013/2
12
(i) Economic loss;
(ii) Non-economic loss.
43. The focus of this technical paper is on non-economic losses, which are a subset of the residual loss and damage attributable to climate change. Loss and damage due to climate change in turn is a subset of the total costs of climate change. In many developing countries, non-economic losses may well be more significant than economic losses, and perhaps the most significant aspect of climate change.
Table 1
Examples of economic and non-economic loss and damage
Economic losses Non-economic losses
Loss of wages Loss of life
Loss of crops Reduction in biodiversity
Reduction in tourism revenue Destruction of items of cultural significance
Loss of economic revenue from coastal activity due to inundation Loss of sovereignty due to inundation
3. Non-economic losses
44. Non-economic losses are best understood in relation to economic losses. Economic losses can be understood as the loss of resources, goods and services that are commonly traded in markets. As such, economic losses will be recorded by and manifest in the system of national accounts (although not for economic losses that are borne in the informal economy); that is to say that economic losses can affect gross domestic product. Market prices can be used to value economic losses.
45. Non-economic losses can be understood as the remainder of items that are not economic items; that is to say that non-economic items are those that are not commonly traded in markets. The absence of a market price is one of the main reasons why assessing non-economic loss and damage is challenging, but their effect on human welfare is no less important.
46. Non-economic losses can also be given a substantive, although incomplete, description. Non-economic losses can be understood as losses of or related to, among other things, life, health, displacement and human mobility, territory, biodiversity, ecosystem services, cultural heritage, indigenous/local knowledge and other social capital. These are explained in more detail in chapter III.C below. However, it should be recognized that this is not a complete list of non-economic losses.
47. Furthermore, items can have both economic and non-economic value, and so their destruction can lead to both economic and non-economic losses. For example, the salinization of agricultural land can cause a loss of crops, which have an economic value, and also the loss of indigenous knowledge connected with stewardship of that land, which is a non-economic loss. This technical paper, focusing on non-economic losses, does not consider coincident economic losses. However, when non-economic losses can lead to economic losses, this will be noted in chapter III.C below; for example, loss of biodiversity could lead to lower tourism revenues.
48. Non-economic losses, like economic losses, can be direct or indirect. Direct losses are those that are immediately attributable to a climate event. For example, loss of health or

FCCC/TP/2013/2
13
life due to an extreme weather event is a direct non-economic loss. Indirect losses are those resulting from changes in the system in response to a climate event. For example, a decrease in health due to malnutrition that is the result of higher food prices and food shortages is an indirect non-economic loss.
49. In summary:
(a) Losses can be categorized as non-economic or economic, where non-economic losses tend to be losses of items that are not often traded in markets. These items can have both economic and non-economic value and so there can be multiple types of losses from a destructive event;
(b) Losses can have spillover effects, which result in further losses, sometimes of a different type;
(c) Losses can be classified by their relation to a destructive event; that is to say the loss can be a direct or an indirect result of a destructive event.
B. Valuation, measurement and comparability of non-economic losses
50. As explained in chapter III.A.1 above, the impact of climate change that is of ultimate concern is the effect of physical impacts on individuals and society, rather than the physical impacts themselves. People are at the centre of any consideration of non-economic losses. So the way in which individuals and society perceive and value impacts must be understood. This first requires an understanding of what is valued and how, or if, value can be measured. If there are multiple sources of value a further issue, of comparability, must be explored. This issue is concerned with the possibility of aggregating and/or making trade-offs between different sources of value. These issues are now briefly explored.
51. Humans have many systems of value. These systems define valuable objectives that humans strive to achieve. There are three common frameworks for describing such systems:
(a) Welfare: in this utilitarian framework, maximizing welfare is the objective. Welfare is achieved through the consumption and experience of both tangible and non-tangible items. An important notion in this framework is that items can often be substituted for each other; for example, a loss in biodiversity can be made good by an increase in material consumption and as a result all value can be monetized. The concept of welfare is most useful when applied to economic sectors, as the value of trade-offs is determined by common consensus through prices;
(b) Well-being: in this framework, articulated in Sen (1999), well-being comes from a number of sources and cannot be achieved unless objectives in each of the determinants of well-being are achieved. A simple example is that, without good health, material wealth is unlikely to be fulfilling. There is no definitive description of the determinants of well-being, but the framework is broadly accepted and has influenced important programmes such as the United Nations Development Programme, Human Development Index and the Millennium Development Goals;
(c) Ethical frameworks: ethical objectives can be distinct from objectives that directly better humanity. For example, preserving other species may not be detrimental to welfare or well-being but it could be an ethical imperative. Rights-based ethical frameworks are also distinct from welfare and well-being frameworks as under a rights-based framework the betterment of humanity is achieved by observing rights, such as the right to life, rather than through any means possible. Welfare and well-being frameworks are also ethical, but they are also anthropocentric and have at least some concept of

FCCC/TP/2013/2
14
permissible substitution between items of value. Ethical frameworks are different because they need not centre on human needs and place firm boundaries on acceptable actions; for example, rights to life and freedom from hunger cannot be transgressed or must be positively supported at the expense of other actions.
52. These systems of value describe what is valued. Within these systems, items of value can also be described in terms of how they are valued. The following distinction is often made:
(a) Use value: an item can be valuable if it is used in a process that achieves a valuable objective. Items can have direct and indirect use values; for example, food is directly useful in maintaining health while trees are indirectly useful in maintaining health by, for example, reducing air pollution. Option value describes the difference in use value that an item may have in the future compared with the present;
(b) Non-use value: an item has non-use value if knowledge about it, rather than use of it, increases welfare or well-being. Bequest and existence value are important non-use values. Value arises because preserving an item for future or current generations can provide a sense of satisfaction.
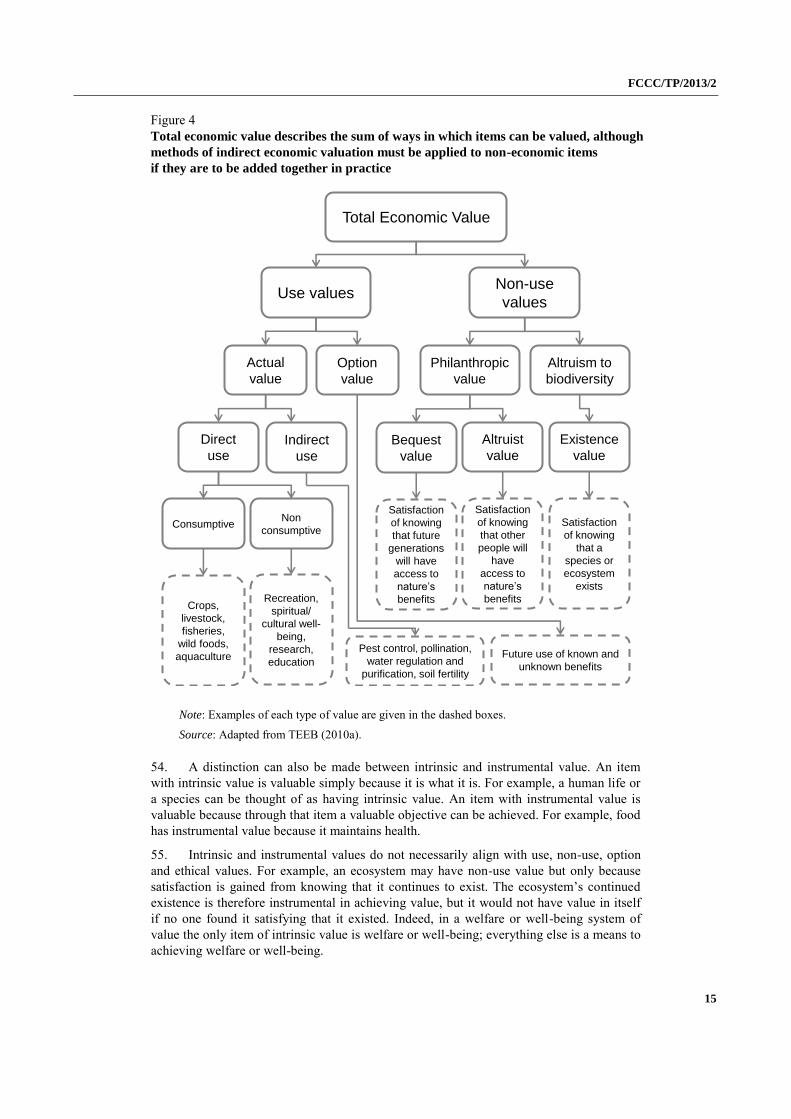
53. Use and non-use value can be considered as the two parts of the total economic value, which is the sum of all the ways in which an item can be valued, as illustrated in figure 4. The concept is called total economic value, even though it deals with items that have non-economic value, because all items of non-economic value in the framework are monetized using techniques described in chapter V.B below. That is to say that in an assessment of the total economic value all non-economic items are given an economic valuation. This concept is used in assessments of the value of ecosystems, such as the Economics of Ecosystems and Biodiversity (TEEB), a major global initiative to develop and use systems of measurement for ecosystems and biodiversity.
FCCC/TP/2013/2
15
Figure 4 Total economic value describes the sum of ways in which items can be valued, although
methods of indirect economic valuation must be applied to non-economic items
if they are to be added together in practice
Total Economic Value
Use valuesNon-use
values
Actual
value
Option
value
Indirect
use
Direct
use
ConsumptiveNon
consumptive
Philanthropic
value
Altruism to
biodiversity
Existence
value
Altruist
valueBequest
value
Crops,
livestock,
fisheries,
wild foods,
aquaculture
Recreation,
spiritual/
cultural well-
being,
research,
education
Pest control, pollination,
water regulation and
purification, soil fertility
Future use of known and
unknown benefits
Satisfaction
of knowing
that future
generations
will have
access to
nature’s
benefits
Satisfaction
of knowing
that other
people will
have
access to
nature’s
benefits
Satisfaction
of knowing
that a
species or
ecosystem
exists
Note: Examples of each type of value are given in the dashed boxes.
Source: Adapted from TEEB (2010a).
54. A distinction can also be made between intrinsic and instrumental value. An item with intrinsic value is valuable simply because it is what it is. For example, a human life or a species can be thought of as having intrinsic value. An item with instrumental value is valuable because through that item a valuable objective can be achieved. For example, food has instrumental value because it maintains health.
55. Intrinsic and instrumental values do not necessarily align with use, non-use, option and ethical values. For example, an ecosystem may have non-use value but only because satisfaction is gained from knowing that it continues to exist. The ecosystem’s continued
existence is therefore instrumental in achieving value, but it would not have value in itself if no one found it satisfying that it existed. Indeed, in a welfare or well-being system of value the only item of intrinsic value is welfare or well-being; everything else is a means to achieving welfare or well-being.
FCCC/TP/2013/2
16
56. Items of value may be incomparable, which means that the value of one item cannot be expressed in terms of the value of another item. For example, the value of a decrease in biodiversity may not be expressible in terms of years of good health lost. A consequence of incomparability is that loss and damage cannot be aggregated into a single number and trade-offs between mitigation, adaptation and residual damage can be difficult to make.
57. It is a matter of debate as to whether values are incomparable or not. In a welfare-based system of values, there are few issues of incomparability, and all items can in principle be expressed in money terms, although ascertaining monetary values for non-economic items can be difficult in practice, and not quantifying them may help decision makers (Spackman, 2013). However, in a well-being or ethical system of values, incomparability may be an issue. A simple difficulty in making comparisons of value, as may occur in the case of non-economic items in a welfare-based system of values, may make aggregation unwise, even if there are no issues of outright incomparability. This is because aggregation makes the comparison on behalf of others. The alternative, of leaving difficult to compare impacts disaggregated, allows others to make their own comparisons.
58. Non-economic items are often given economic valuations as a form of assessment. For example, loss of life can be monetized using a concept known as the value of a statistical life, which measures people’s attitude to a change in mortality risk. When this process occurs it does not mean that the non-economic item has become an economic item. Instead, a non-economic item has, through indirect methods, been given an economic value as a means of assessment. This should be contrasted with the direct method of economic valuation via market prices that is possible for economic items.
59. Items can have different values across time, space and possible states of the world. Difference in value across time refers to the fact that people often discount the value of an item in the future relative to the same item in the present. Both economic and non-economic items can be discounted, as both have value, although estimating the rate at which non-economic items are discounted can be challenging. Gollier (2012, p.248) provides an in-depth discussion on issues of discounting. Differences in valuation across space describe the fact that different people within a time period can value an item in a different way. For example, a poor person may value an extra unit of money more than a rich person. Difference in valuation across possible states of the world refers to the fact that the future is uncertain and in some states of the world an item will be valued differently than in another state of the world. For example, a particular colony of animals will be more valuable if they are the last of the species than if they are one colony among many.
60. Aggregating across time, space and states requires assumptions, such as the discount rate, that may be disputed and can hide important context. This implies that aggregation of loss and damage, if needed, must be done transparently and with care and the need for aggregation in many cases should be questioned. Issues of valuation, measurement and comparability can be summarized by the following questions:
(a) What is valued? Humans have many systems of value, of which three major types are welfare, well-being and ethical and rights-based frameworks;
(b) How is it valued? Items can have use and non-use values, from which finer distinctions can be made, such as existence non-use value or direct, consumptive, use value;
(c) Where does the value reside? Items can have instrumental value, as they provide a way to achieve a valuable objective, or intrinsic value if they are valuable in themselves;
(d) Is the value of different items comparable? It can be a matter of debate as to whether the value of one item can be expressed in terms of the value of another item. If

FCCC/TP/2013/2
17
there are difficulties in comparison it can be best to avoid aggregating values under one metric;
(e) How does the value of an item vary across time, space and possible states of the world? An item in the future can often be perceived to have less value than the same item in the present, which is known as discounting; an item may have a different value to different people (i.e. the value of an item can vary across space); and an item may have a different value across states of uncertainty.
C. Non-economic losses in the context of human activity
61. Climate change affects the system of human activity and so an impact to a part of the system must be understood in the context of the entire system. Non-economic losses occur in different parts of the system of human activity, and figure 5 provides a model of human activity that allows such loss and damage to be understood in the context of the entire system.
62. In figure 5, stocks of resources, some economic and some non-economic, provide flows of services, and are also themselves transformed into other types of resource or consumed. For example, the stock of human capital provides a flow of work; natural capital, such as a mineral deposit, may be transformed into a machine, a type of physical capital; or natural capital, such as oil, may be consumed. In figure 5, initial stocks of resources are represented on the left, with their flows of services in the dashed and dotted arrows. Final stocks of resources are on the right.
63. These services and resources are used by individuals and society to achieve valuable objectives. The objectives of individuals and society can be very broadly defined, and the implications of this for non-economic losses are explored in chapter III.B above. Services and resources can be used as inputs to economic activity to provide consumption items, or they can be used directly by individuals and society. In figure 5, this is shown in the central section of the diagram by the box for economic activity and for individuals and society. Non-economic goods and services are primarily used in the latter way, although economic sectors also use non-economic goods and services to produce consumption items.
64. Climate change affects human activity in a number of ways. Figure 6 highlights this by adding diagonally-hashed arrows to figure 5. These arrows illustrate the changes in activity that climate change induces. Climate change can require the diversion of resources for mitigation and adaptation. It can also inflict loss and damage in the form of reduced flows of services from stocks and reduced levels of stocks themselves. The reduction and diversion of resources reduces the ability of individuals and society to achieve valuable objectives. The degree to which climate change prevents valuable societal objectives being achieved is the true measure of the total damage of climate change. Climate change can also reduce the stock of resources available to achieve future objectives, which is one reason why the impacts of climate change need to be considered over time.
65. Ignoring non-economic loss results in a very limited understanding of the pathways along which total climate change damages occur. Figure 7 builds on figure 6 by highlighting, using a wave-hash background, the main areas of human activity in which non-economic losses occur.

FC
CC
/TP
/201
3/2
18
Figure 5 In this model of human activity, stocks of resources provide flows of services and are used themselves, in economic and non-economic ways, to achieve
objectives that have value to individuals and society; stocks persist and are used to achieve objectives in the future

FC
CC
/TP
/201
3/2
1
9
Figure 6 Total damage from climate change can divert and reduce the flows of services from stocks and the levels of stocks themselves, as well as disrupting
the economy; this is highlighted using a diagonal-hash background; this reduces the ability of individuals and society to achieve valuable objectives
and can reduce the stock of resources available to achieve future objectives

FC
CC
/TP
/201
3/2
20
Figure 7 Non-economic losses are a subset of the total damage from climate change, and tend to affect some resources more than others;
these are highlighted using a wave-hash background. Non-economic losses also tend to directly affect individuals and society rather than primarily
reducing economic activity, although this occurs to some extent

FCCC/TP/2013/2
21
66. Many resource stocks are at least in part non-economic, and so they are not accounted for in standard economic statistics. These include natural capital, such as biodiversity and ecosystems, social capital and cultural capital. Even standard economic inputs such as human capital and land can be affected by non-economic factors, such as loss of life and health and loss of territory, respectively.
67. When resource stocks are affected by climate change, the flow of both economic and non-economic services is reduced, although only the former will be recorded in the national accounts. Non-economic service flows (such as spiritual services from ecosystems) tend to be ignored.
68. Even if they were recorded, measures of economic welfare tend to focus on consumption rather than wider measures of individual and societal welfare.
IV. A typology and overview of non-economic losses
A. The incidence of non-economic losses
69. Non-economic losses can be described as occurring in three distinct areas: private individuals, social items such as public goods and networks (connections between people) and the environment. Impacts to these areas can also give rise to economic losses and non-economic losses in these areas can also result in losses in other areas; for example, damage to the environment can affect private individuals.
70. Many of the impacts of climate change on individuals will have direct economic effects. However, individuals may also suffer from non-economic losses in the form of loss of life and health, including mental health.
71. Non-economic losses occur in societies when non-economic public or cultural goods are damaged or when networks are damaged. A network is a set of connections between people. The main types of such losses are losses to cultural heritage and indigenous/local knowledge and other social capital. These items are shared across all individuals in a society and so, while it is ultimately individuals who will incur the loss as explained in chapter III.B above, the incidence of the damage is social.
Box 2 Chapter summary
Non-economic losses occur in three distinct areas: private individuals, society and the environment. More specifically, non-economic losses can be understood as losses of, inter alia, life, health, territory, cultural heritage, indigenous/local knowledge, biodiversity and ecosystem services.
Non-economic losses may occur through many channels. They may be related to both slow onset impacts (e.g. the loss of territory to sea level rise) and extreme events (e.g. loss of life in a cyclone). The loss may be directly linked to climate change (e.g. loss of ecosystems) or occur indirectly (e.g. malnutrition as a consequence of impacts in the agriculture sector).
The distinction between non-economic loss and economic loss will sometimes be blurred. For example, damage to natural ecosystems is primarily a non-economic loss, since ecosystem services are rarely traded on the market. However, there may be market impacts if the services the ecosystem provides are used as inputs to the market economy, such as food, fibre and water storage.

FCCC/TP/2013/2
22
72. The impacts of climate change on the environment will tend to be non-economic because environmental goods and services are often not formally part of the economy. The environment can be considered to have two main assets that are susceptible to climate change: biodiversity and ecosystems.
73. Figure 8 illustrates how types of non-economic losses discussed in chapter III.B above are directly linked to individuals, social items and the environment. There will be indirect effects, as discussed in chapter III.A.3 above, which implies that effects can influence one another; for example, a loss of biodiversity can affect elements of health. However, these indirect linkages are complex and therefore not presented in the figure for clarity.
Figure 8 Suggested types of non-economic loss can be categorized according to their direct
occurrence on individuals, society and the environment
Society
Individuals
Environment
Loss of life
Health
Territory
Biodiversity
Ecosystem services
Cultural heritage
Indigenous
knowledge
Incidence of direct
losses
Type of non-
economic loss
Human mobility
Note: Non-economic losses can have indirect impacts across individuals, society and environment. This figure displays the interlinkages of direct non-economic losses.
B. The main types of non-economic losses
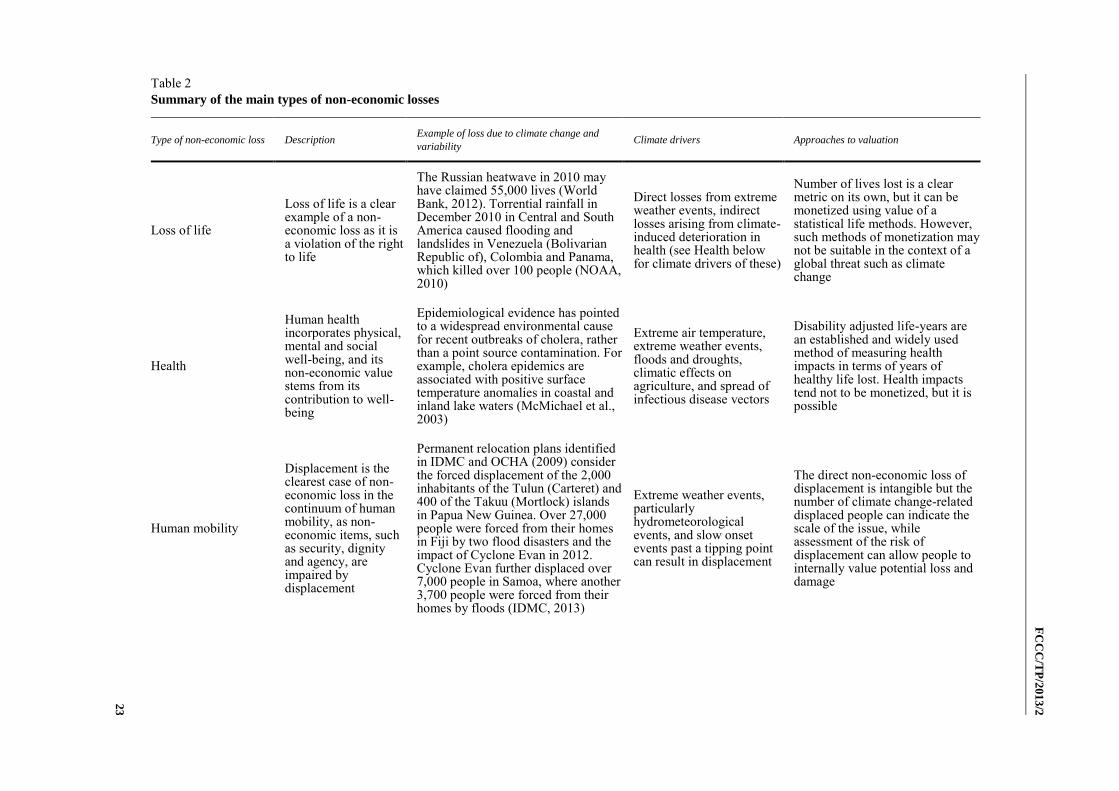
74. The main types of non-economic loss described in this chapter are summarized in table 2, which also provides examples of these non-economic losses due to climate change.
FC
CC
/TP
/201
3/2
2
3
Table 2 Summary of the main types of non-economic losses
Type of non-economic loss Description Example of loss due to climate change and
variability Climate drivers Approaches to valuation
Loss of life
Loss of life is a clear example of a non-economic loss as it is a violation of the right to life
The Russian heatwave in 2010 may have claimed 55,000 lives (World Bank, 2012). Torrential rainfall in December 2010 in Central and South America caused flooding and landslides in Venezuela (Bolivarian Republic of), Colombia and Panama, which killed over 100 people (NOAA, 2010)
Direct losses from extreme weather events, indirect losses arising from climate-induced deterioration in health (see Health below for climate drivers of these)
Number of lives lost is a clear metric on its own, but it can be monetized using value of a statistical life methods. However, such methods of monetization may not be suitable in the context of a global threat such as climate change
Health
Human health incorporates physical, mental and social well-being, and its non-economic value stems from its contribution to well-being
Epidemiological evidence has pointed to a widespread environmental cause for recent outbreaks of cholera, rather than a point source contamination. For example, cholera epidemics are associated with positive surface temperature anomalies in coastal and inland lake waters (McMichael et al., 2003)
Extreme air temperature, extreme weather events, floods and droughts, climatic effects on agriculture, and spread of infectious disease vectors
Disability adjusted life-years are an established and widely used method of measuring health impacts in terms of years of healthy life lost. Health impacts tend not to be monetized, but it is possible
Human mobility
Displacement is the clearest case of non-economic loss in the continuum of human mobility, as non-economic items, such as security, dignity and agency, are impaired by displacement
Permanent relocation plans identified in IDMC and OCHA (2009) consider the forced displacement of the 2,000 inhabitants of the Tulun (Carteret) and 400 of the Takuu (Mortlock) islands in Papua New Guinea. Over 27,000 people were forced from their homes in Fiji by two flood disasters and the impact of Cyclone Evan in 2012. Cyclone Evan further displaced over 7,000 people in Samoa, where another 3,700 people were forced from their homes by floods (IDMC, 2013)
Extreme weather events, particularly hydrometeorological events, and slow onset events past a tipping point can result in displacement
The direct non-economic loss of displacement is intangible but the number of climate change-related displaced people can indicate the scale of the issue, while assessment of the risk of displacement can allow people to internally value potential loss and damage
FC
CC
/TP
/201
3/2
24
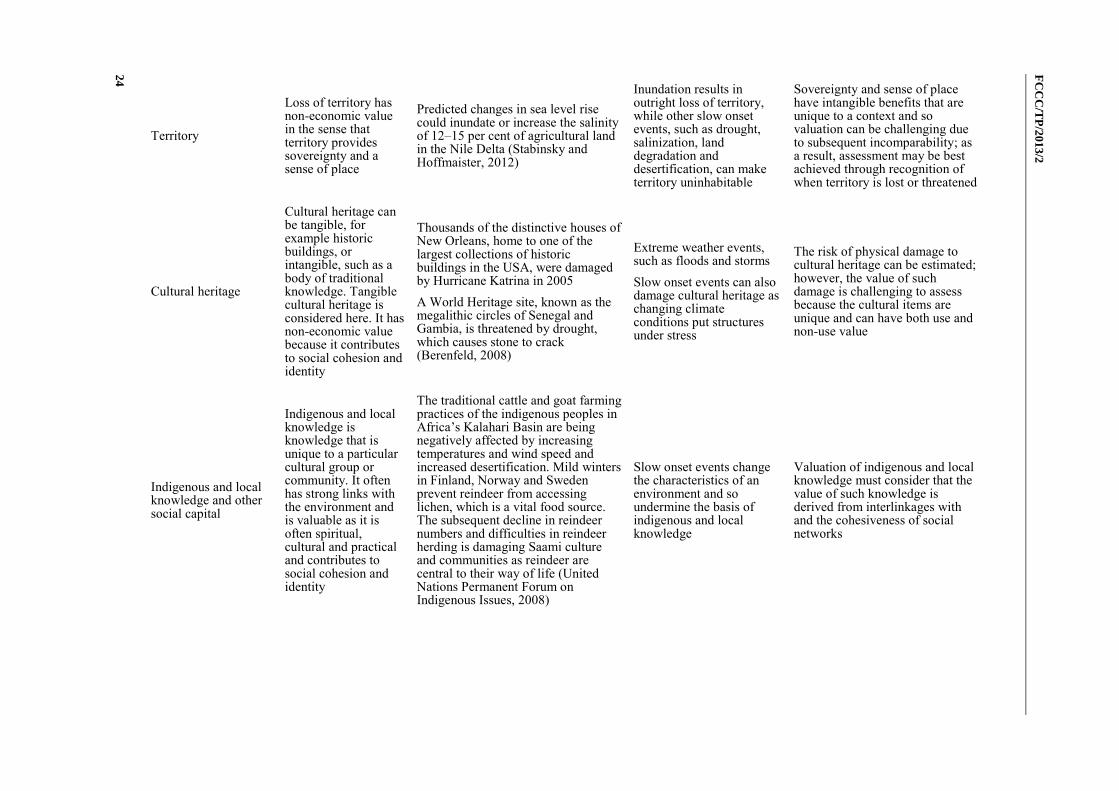
Territory
Loss of territory has non-economic value in the sense that territory provides sovereignty and a sense of place
Predicted changes in sea level rise could inundate or increase the salinity of 12–15 per cent of agricultural land in the Nile Delta (Stabinsky and Hoffmaister, 2012)
Inundation results in outright loss of territory, while other slow onset events, such as drought, salinization, land degradation and desertification, can make territory uninhabitable
Sovereignty and sense of place have intangible benefits that are unique to a context and so valuation can be challenging due to subsequent incomparability; as a result, assessment may be best achieved through recognition of when territory is lost or threatened
Cultural heritage
Cultural heritage can be tangible, for example historic buildings, or intangible, such as a body of traditional knowledge. Tangible cultural heritage is considered here. It has non-economic value because it contributes to social cohesion and identity
Thousands of the distinctive houses of New Orleans, home to one of the largest collections of historic buildings in the USA, were damaged by Hurricane Katrina in 2005 A World Heritage site, known as the megalithic circles of Senegal and Gambia, is threatened by drought, which causes stone to crack (Berenfeld, 2008)
Extreme weather events, such as floods and storms Slow onset events can also damage cultural heritage as changing climate conditions put structures under stress
The risk of physical damage to cultural heritage can be estimated; however, the value of such damage is challenging to assess because the cultural items are unique and can have both use and non-use value
Indigenous and local knowledge and other social capital
Indigenous and local knowledge is knowledge that is unique to a particular cultural group or community. It often has strong links with the environment and is valuable as it is often spiritual, cultural and practical and contributes to social cohesion and identity
The traditional cattle and goat farming practices of the indigenous peoples in Africa’s Kalahari Basin are being negatively affected by increasing temperatures and wind speed and increased desertification. Mild winters in Finland, Norway and Sweden prevent reindeer from accessing lichen, which is a vital food source. The subsequent decline in reindeer numbers and difficulties in reindeer herding is damaging Saami culture and communities as reindeer are central to their way of life (United Nations Permanent Forum on Indigenous Issues, 2008)
Slow onset events change the characteristics of an environment and so undermine the basis of indigenous and local knowledge
Valuation of indigenous and local knowledge must consider that the value of such knowledge is derived from interlinkages with and the cohesiveness of social networks
FC
CC
/TP
/201
3/2
2
5
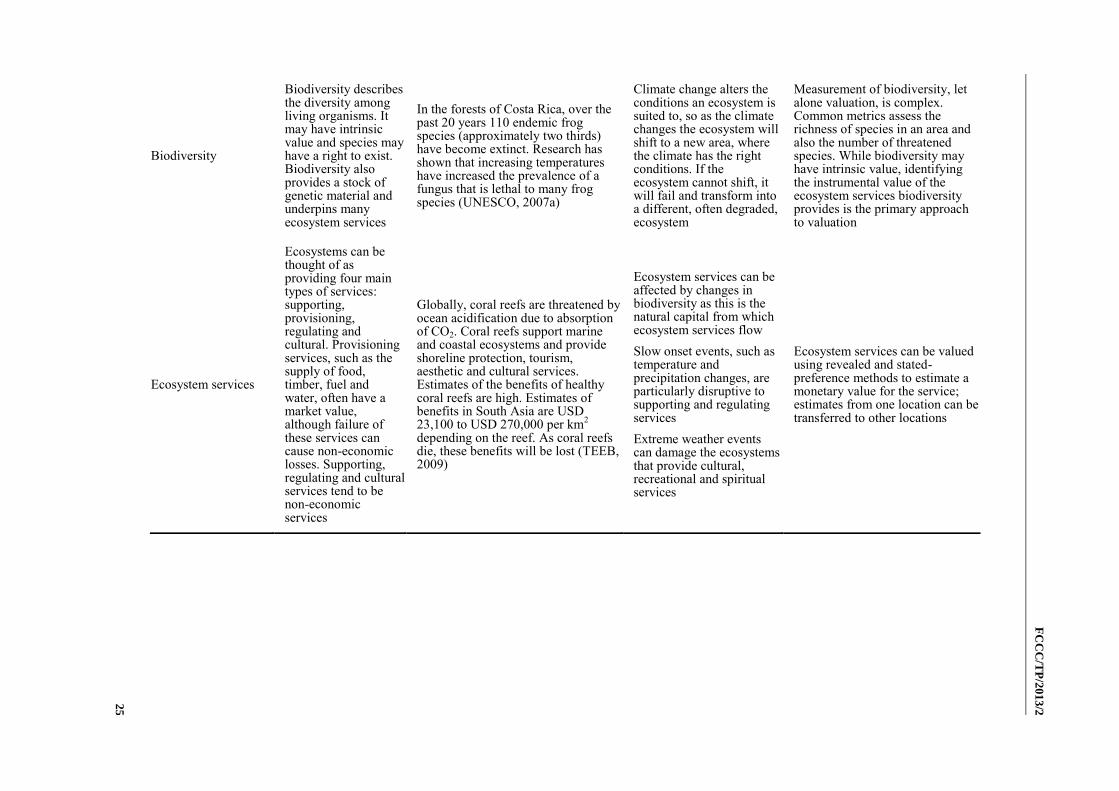
Biodiversity
Biodiversity describes the diversity among living organisms. It may have intrinsic value and species may have a right to exist. Biodiversity also provides a stock of genetic material and underpins many ecosystem services
In the forests of Costa Rica, over the past 20 years 110 endemic frog species (approximately two thirds) have become extinct. Research has shown that increasing temperatures have increased the prevalence of a fungus that is lethal to many frog species (UNESCO, 2007a)
Climate change alters the conditions an ecosystem is suited to, so as the climate changes the ecosystem will shift to a new area, where the climate has the right conditions. If the ecosystem cannot shift, it will fail and transform into a different, often degraded, ecosystem
Measurement of biodiversity, let alone valuation, is complex. Common metrics assess the richness of species in an area and also the number of threatened species. While biodiversity may have intrinsic value, identifying the instrumental value of the ecosystem services biodiversity provides is the primary approach to valuation
Ecosystem services
Ecosystems can be thought of as providing four main types of services: supporting, provisioning, regulating and cultural. Provisioning services, such as the supply of food, timber, fuel and water, often have a market value, although failure of these services can cause non-economic losses. Supporting, regulating and cultural services tend to be non-economic services
Globally, coral reefs are threatened by ocean acidification due to absorption of CO2. Coral reefs support marine and coastal ecosystems and provide shoreline protection, tourism, aesthetic and cultural services. Estimates of the benefits of healthy coral reefs are high. Estimates of benefits in South Asia are USD 23,100 to USD 270,000 per km2 depending on the reef. As coral reefs die, these benefits will be lost (TEEB, 2009)
Ecosystem services can be affected by changes in biodiversity as this is the natural capital from which ecosystem services flow Slow onset events, such as temperature and precipitation changes, are particularly disruptive to supporting and regulating services Extreme weather events can damage the ecosystems that provide cultural, recreational and spiritual services
Ecosystem services can be valued using revealed and stated-preference methods to estimate a monetary value for the service; estimates from one location can be transferred to other locations

FCCC/TP/2013/2
26
1. Loss of life
75. Loss of life is a clear example of a non-economic loss and has a simple and powerful unit of account. The right to life is widely recognized as a fundamental human right. As a result, loss of life is a clear damage, and accounting for loss of life by simply counting the number of lives lost is a powerful metric.
76. Climate change may result in loss of life in direct ways, for example due to extreme weather events, or indirectly, for example through malnutrition as a result of food shortages arising from declining agricultural productivity due to slow and incremental changes in climate. The attribution of loss of life to extreme weather events is relatively straightforward, although gaps in understanding remain. Attribution of loss of life due to slow onset events and/or indirect impacts is far more uncertain. This is because many more factors aside from the climate event may have contributed to the loss of life in the case of an indirect impact than in the case of a direct impact.
77. Loss of life can be valued in monetary terms based on observed choices in everyday life that people make to expose themselves to risks of fatality so as to gain material benefit. Such estimates are known as the value of a statistical life. These estimates may not be appropriate in the context of a global threat such as climate change as they depend, inter alia, on the income of the population from which the estimate is derived (Viscusi and Aldy, 2003). As incomes vary significantly across the world, this implies a variation in the value of a statistical life. This may be incompatible with the view that each person has an equal right to life and that therefore the loss of a life is of equal significance around the world.
2. Health
78. Human health has many facets. The World Health Organization (WHO) uses the following definition: “health is a state of complete physical, mental and social well-being and not merely the absence of disease or infirmity” (IHC, 1946). Despite its many aspects,
which are often of intangible value, there has been significant work on valuing health impacts in general, given its centrality to human life and the need to allocate scarce resources.
79. Climate change can affect health in a variety of ways. WHO has identified the following (WHO, 2011):
(a) Extreme air temperatures: heatwaves are a direct contributor to deaths from cardiovascular and respiratory disease; increased temperatures can also exacerbate pollution and aeroallergens, such as pollen;
(b) Extreme weather events: floods and storms can cause injury and loss of life and also damage property, health services and mental health. A lack of shelter and adequate care, especially in the aftermath of an extreme weather event, can damage health; displacement and forced migration to avoid extreme weather events can also increase stresses on health;
(c) Floods and droughts: aside from the risk of injury from extreme weather events, floods and droughts can reduce and degrade fresh water supplies, which are essential to health and hygiene; contaminated water can also transmit infectious diseases;
(d) Climatic effects on agriculture: decreasing crop yields can lead to malnutrition, especially among populations that rely on subsistence farming;
(e) Potential spread of infectious disease vectors: insects that carry infectious diseases are sensitive to climate and so, as the climate changes, their range may change, introducing infectious diseases to new areas;
FCCC/TP/2013/2
27
(f) Reduction in cold weather: some populations in higher latitudes of the northern hemisphere are expected to benefit from a reduction in cold-related illness and death as average temperatures increase.
80. The impact of climate change on human health is thought to have been low so far, claiming, in 2004, 0.2 per cent of global deaths and 0.4 per cent of global DALYs; almost all of these losses occurred in low and middle income countries (WHO, 2009). Future health impacts arising due to climate change will depend significantly on adaptation, as socioeconomic conditions, health-care systems and levels of disaster risk management heavily influence health outcomes. WHO estimates that 14–47 per cent of the annual cost of adaptation will be health related (WHO, 2011). If resources for adaptation are insufficient then loss and damage due to health impacts will occur.
81. Health impacts are often measured using DALYs. For example, this is the metric used in the WHO Global Burden of Disease study (World Health Organization, 2009). A DALY can be thought of as one lost year of ‘healthy’ life. A DALY is calculated as the
sum of the years of life lost and years lost due to disability. Years of life lost is a measure of premature mortality and is a count of the years before an ideal life expectancy in which death occurs. Years lost due to disability is a measure of the burden of disability due to disease on quality of life. It is calculated by multiplying the average duration of the disease until remission or death by a disability weight. DALYs are not without criticism, for example regarding the method of determining disability weights, but DALYs, or similar metrics, such as quality adjusted life years, are frequently used in health policy.
3. Human mobility
82. Human mobility can be viewed as a continuum from completely voluntary movements to completely forced migrations (IPCC, 2012). The Cancun Adaptation Framework recognizes displacement, migration and planned relocation as forms of human mobility that can be induced by climate change.2 While there is no definition under the Convention, migration tends to refer to voluntary movement, while displacement tends to refer to forced movement.
83. Displacement is the clearest case of loss and damage across the continuum of human mobility, although other forms of human mobility could be considered as a type of loss and damage.3 Loss and damage can result from displacement, for example displacement can cause distress and a loss of health or social networks. However, displacement also constitutes a unique type of loss and damage in itself and is not just a cause of other types of loss and damage. It is displacement as a (non-economic) type of loss and damage in itself that is the focus of this technical paper. Displacement can result in a loss of security (including legal rights) and agency (the ability to control one’s location and livelihood),
among other things.4 In the same way that a loss of health is a type of loss and damage because health is important to well-being, displacement is a type of loss and damage because security and agency, which are lost due to displacement, are important to well-being. Furthermore, such loss and damage of displacement is a non-economic loss as security and agency are non-economic items. The economic losses of displacement, such as the loss of possessions, and indirect non-economic losses, such as loss of health and social networks, should be understood as losses from displacement.
2 Decision 1/CP.16, paragraph 14(f). 3 For example, decision 3/CP.18, paragraph 7(a)(vi), recognizes migration, displacement and human
mobility as issues of loss and damage. 4 This is not a complete list of the losses that are a result of displacement and further research, and
consensus is required to expand this list.

FCCC/TP/2013/2
28
84. Displacement is described as the clearest case of mobility-related loss and damage for two main reasons. First, because it is clear that it directly harms security and agency, among other things. Second, displacement is also a clear example of the potential limits of adaptation and, as explained in chapter III.A.2 above, loss and damage can be understood as harm arising from the physical impacts of climate change that are not mitigated or adapted to. For other types of human mobility, such as voluntary migration and planned relocation, context is required to assess the extent to which the acts themselves are a form of loss and damage. Voluntary migration and planned relocation tend to be identified as adaptation measures, and therefore they reduce exposure to some types of loss and damage. However, that is not to say that they cannot be harmful in themselves in some contexts. For example, planned relocation may impair agency if it is against the will of the residents. As voluntary migration and planned relocation can be considered forms of adaptation, rather than responses to the limits of adaptation, their status as a type of loss and damage is further complicated. Trapped populations are also an unclear case. These are groups of people whose mobility is restricted, and so cannot migrate as a form of adaptation but nor can they be displaced (Warner et al., 2013), despite potentially suffering human mobility-related loss and damage. Overall, human mobility is a continuum, and loss and damage is not clearly defined, and so, while displacement is the clearest case of loss and damage in human mobility, it is not necessarily the only case.
85. Human mobility can be induced by both slow onset and extreme weather events. Extreme weather events can cause displacement while the risk of them can induce migration or planned relocation. Slow onset events can induce migration and planned relocation as forms of adaptation to the slow onset event and can also cause displacement when the stresses from a slow onset event reach a tipping point.5 Climate and weather-related disasters currently cause significant displacement, with an estimated 32 million people displaced by these hazards in 2012, mostly for short periods of time within their national borders (IDMC, 2013). However, it should be noted that there is currently a lack of clear evidence systematically linking climate variability and migration, although there are clear instances of extreme hydrometeorological events resulting in displacement (IPCC, 2012).
86. The non-economic losses of displacement are intangible, and therefore the value of the losses is hard to measure. However, the physical number of displaced people can be identified and this can provide a guide to the scale of the issue. That said, measurement of climate change related displacement suffers from a lack of standard concepts and methodologies as well as barriers to data collection. Assessment and presentation of the risk of displacement can also go some way to identifying the potential loss and damage due to displacement, even if this loss and damage is not explicitly valued. Indeed, full quantification is likely to be inaccurate if not impossible; instead, identifying and educating about the risk of displacement can allow people to determine their own valuations and bring this risk into their own decision-making.
4. Territory
87. Territory is an area of land, and associated exclusive economic zone (EEZ), that is under the jurisdiction of a State. Land provides economic benefits; for example, it can be cultivated or built on and provides resources, such as those in an EEZ. It also provides non-economic benefits; for example, it can host ecosystems or be an area of outstanding natural beauty. Territory can also have non-economic value simply because it is an area that belongs to a group and so forms part of that group’s identity. This sovereignty and sense of
5 Owing to the multicausal nature of human mobility generally, distinguishing such tipping points can
be very difficult. For further discussion on this topic in the context of climate change see Hugo (2010) and Warner et al. (2013).

FCCC/TP/2013/2
29
place are the non-economic benefits that are the focus of this chapter. Sovereignty describes the ability of the group in control of the territory to self-determination. In contrast to sovereignty, which is the characteristic of a society, a sense of place is felt by individuals. It describes the importance that an individual ascribes to an area, and the way in which the area forms part of their identity.
88. Slow onset events can result in a physical loss of territory through inundation due to sea level rise. Deltaic nations and small island developing States face the greatest risk of this, with atoll countries possibly facing a loss of sovereignty due to sea level rise (IPCC, 2007). Loss of territory could arguably also arise due to drought, salinization, land degradation and desertification. In these cases the ability to inhabit the territory is reduced even though the territory is still part of the land. The concept could have an even broader interpretation; for example, natural characteristics, such as flora and fauna, could change due to climate change and, as a result, the sense of place that some individuals have could also change if this sense is rooted in the flora and fauna of the area.
89. Sovereignty and sense of place are intangible benefits, and so assessment of the risk of loss and damage due to a loss of territory is challenging. However, loss of sovereignty can be seen as a violation of the right to self-determination, and so there is no need for a metric beyond the fact of the violation itself. Indeed, the loss of sovereignty of atoll countries has been suggested as a threshold beyond which climate change can be considered ‘dangerous’ (Barnett and Adger, 2003). Loss of a sense of place is not as clearly
defined as loss of sovereignty, nor can the costs of losing a sense of place be as clearly communicated, as each experience is unique. As a result, assessing the non-economic loss arising from the loss of a sense of place is very difficult and the most that may be achieved is to recognize that such a loss is likely to occur.
5. Cultural heritage
90. Tangible cultural heritage “refers to monuments, groups of buildings and sites with
historical, aesthetic, archaeological, scientific, ethnological or anthropological value”
(UNESCO, 2008). Cultural heritage can also include intangible heritage, considered to be a legacy of practices, expressions, knowledge and skills of a community (UNESCO, 2013). Physical cultural heritage is the focus of this chapter. Intangible heritage could be considered part of social capital, which is considered in chapter IV.B.6 below.
91. Climate change can threaten cultural heritage through extreme weather events, which may destroy artefacts and buildings, often through flooding and storms. Slow onset events can also damage cultural heritage, as changing climate conditions put structures under stress. For example, heritage buildings tend to be made of more porous materials and are not as sealed from the elements as modern buildings (UNESCO, 2007b). This means that they can be more susceptible to changes in temperature and humidity, effects that the Climate for Culture project in the European Union is investigating. The project is using computer simulations to assess the effect of such changes on the structure and stability of historic buildings and the collections of artefacts within them (Climate for Culture, 2012).
92. As described above, the risk of physical damage to cultural heritage can be estimated. However, assessing the loss of value from such physical damage is harder to gauge. Cultural heritage provides an intangible benefit with no clear unit of measurement. For example, UNESCO World Heritage Sites are those with ‘outstanding universal value’,
which is judged by experts according to a list of criteria developed by the World Heritage Committee (UNESCO, 2012). In addition to this, the non-economic loss from the destruction of cultural heritage is particularly hard to judge because cultural heritage may have non-use value. That is to say that value may often be derived by people simply from the continued existence of the cultural item and its contribution to their cultural identity rather than from visiting it. So assessing losses from visitor numbers may not be reliable.

FCCC/TP/2013/2
30
Furthermore, items of cultural heritage are unique and irreplaceable and therefore their value cannot be judged from assessments of similar items or through the cost of replacement.
6. Indigenous and local knowledge, and other social capital
93. Indigenous and local knowledge is knowledge that is unique to a particular cultural group or community. It is often knowledge of the environment or knowledge developed with close reference to the environment. Such knowledge is valuable as it is often spiritual, cultural and practical and contributes to social cohesion and identity. It can be considered as a part of social capital, which describes “networks together with shared norms, values
and understandings that facilitate co-operation within or among groups” (OECD, 2007).
94. A changing climate can affect indigenous and local knowledge as it changes the environment on which such knowledge is based. If climate change invalidates or prevents the development or transmission of knowledge, then this can affect the spiritual and cultural well-being of the community. It can also have economic impacts; for example, indigenous knowledge is often used to forecast weather and determine when to plant crops. Indigenous knowledge also benefits wider groups; for example, it is often used to preserve biodiversity6 or to identify medicines. Indigenous knowledge is also often valuable in adaptation planning, and so a loss of such knowledge can increase vulnerability to climate change, which may lead to other types of losses. Indigenous knowledge is particularly at threat from climate change as indigenous groups tend to live in climate-sensitive areas, such as the Arctic, margins of deserts, rainforests and at high-altitude regions. Climate change can also affect broader social capital by breaking or stressing social network, by, for example, displacement, forced migration or resource shortages.
95. While indigenous and local knowledge and other social capital can be considered to be at risk of loss and damage, it is hard to judge the magnitude of possible impacts. This is because these sources of social value are not countable. There are no units for the quantity of social capital and indeed it is a misconception to think of social capital as a discrete, countable resource. Instead, social capital should be understood to be a holistic resource, where value is derived from the interlinkages and cohesiveness of the network. Also, when judging the risk of loss and damage to social capital, vulnerability to climate change should be considered. Social capital can adapt to circumstances, and is continually evolving, and can also be transmitted. So, for some communities, social capital may be robust to the effects of climate change, or the basis of social capital could shift away from climate-sensitive sectors. Such robustness is unlikely to apply to indigenous communities due to an emphasis on preserving tradition and on the environment and due to difficulties in transmitting indigenous knowledge.
7. Biodiversity
96. Biodiversity means “the variability among living organisms from all sources, including, inter alia, terrestrial, marine and other aquatic ecosystems and the ecological complexes of which they are part; this includes diversity within species, between species and of ecosystems” (United Nations, 1992). Biodiversity has non-economic value because the simple existence of biodiversity can be of intrinsic value to people, and species may be considered to have a right to exist. Biodiversity also provides a stock of genetic material and underpins many ecosystem services (secretariat of the Convention on Biological Diversity, 2010, p.94).
6 The value of indigenous knowledge in the protection of biodiversity is recognized in article 8(j) of the
Convention on Biological Diversity <http://www.cbd.int/traditional/>.

FCCC/TP/2013/2
31
97. Before considering the impact of climate change on biodiversity it is important to consider the complexity of measuring any changes in biodiversity. The Streamlining European Biodiversity Indicators 2010 process agreed on 26 indicators of biodiversity (European Environment Agency, n.d.), chosen from about 200 possible indicators (Parliamentary Office of Science and Technology, 2008). The Organisation for Economic Co-operation and Development (OECD) Environmental Outlook considers four indicators: mean species abundance (MSA),7 threatened species, forest area and marine stocks (OECD, 2012). So understanding the impact of climate change on biodiversity requires assessment across a number of metrics.
98. Regardless of the metric, biodiversity is, in general, under threat, and climate change is likely to provide significant stress in addition to the strains already arising on biodiversity due to economic development and population growth. Climate change alters the conditions an ecosystem is suited. So as the climate changes the ecosystem will shift to a new area to which where the climate has the right conditions; or, if the ecosystem cannot shift, it will fail and transform into a different, often degraded, ecosystem. OECD estimated that “climate change is projected to become an increasingly important pressure in the baseline,8 driving just over 40 per cent of additional global MSA loss between 2010 and 2050”
(OECD, 2012). With regard to threatened species, the Intergovernmental Panel on Climate Change states that “approximately 20–30 per cent of plant and animal species assessed so far are likely to be at increased risk of extinction if increases in global average temperature exceed 1.5–2.5°C” (IPCC, 2007).
99. Valuation of changes in biodiversity is challenging, as its intrinsic value can be hard to articulate. A major global initiative on TEEB9 concluded that focusing on the instrumental value of biodiversity can be effective, stating that “an ecosystem service
perspective should inform economic valuations of biodiversity, focusing on how decision makers can include the benefits and costs of conserving or restoring nature in their considerations” (TEEB, 2010b). Valuation of ecosystem services is discussed in chapter
IV.B.8 below.
100. Valuation of changes in biodiversity is especially challenging and important in developing countries. Biodiversity hotspots tend to be in developing countries, as figure 9 shows, and so the greatest burden of valuation may occur in areas with a low capacity for such valuation. Not only is biodiversity often greatest in developing countries, but people tend to have a greater reliance on the ecosystem services that biodiversity supports. In addition, methods of valuation are often designed in developed countries and may not be appropriate in the developing country context, often for institutional reasons, such as the predominance of the informal economy over the formal, as well as cultural reasons. As a result, participatory methods of valuation, rather than economic methods, have been suggested in such contexts (TEEB, 2010a).
7 MSA represents the average response of the total set of species belonging to an ecosystem to a change
in their environment. As such it describes species richness; a biome achieving an MSA score of 1 is in a pristine state, with full species richness, while a biome scoring 0 is a biome devoid of original species. The abundance of species in a pristine state, that is a state with minimal human interference, is often established via modelling techniques.
8 The baseline is a scenario assuming no new policies for environmental issues, addressed in the OECD Environmental Outlook to 2050.
9 See <http://www.teebweb.org>.

FCCC/TP/2013/2
32
Figure 9 Many biodiversity hotspots are in developing countries and are at risk from
ecosystems shifting in response to climate change
Note: The map shows the overlap between biodiversity hotspots, regions with exceptional concentrations of endemic species undergoing exceptional loss of habitat (Myers et al., 2000) and the projected changes in terrestrial ecosystems by 2100 relative to the 2000, as presented by the Intergovernmental Panel on Climate Change in Fischlin et al., (2007), figure 4.3(a), p. 238. The changes should be taken as only indicative of the range of possible ecosystem changes and include gains or losses of forest cover, grassland, shrubland and woodland, herbaceous cover and desert amelioration.
Source: World Bank (2010) based on Myers et al. (2000) and Fischlin et al. (2007).
8. Ecosystem services
101. Marine and terrestrial ecosystems can be thought of as providing four main types of services: supporting, provisioning, regulating and cultural (Millennium Ecosystem Assessment, 2005). Provisioning services, such as the supply of food, timber, fuel and water, often have a market value. However, supporting, regulating and cultural services tend to be non-economic services. Supporting services describe the role of ecosystems in the various environmental cycles, such as the nutrient cycle and photosynthesis. Regulating services describe the role of ecosystems in regulating the climate, floods and other extremes of nature. Cultural services are the spiritual, aesthetic, educational and recreational uses that people derive from ecosystems.

FCCC/TP/2013/2
33
Figure 10 Ecosystem services can be mapped to constituents of human well-being
Source: Millennium Ecosystem Assessment (2005).
102. The value of ecosystem services has been the subject of major research programmes in recent years and conceptual frameworks and valuation methods have been developed. Ecosystem services can be linked to constituents of human well-being, as figure 10 illustrates. These services can also be described as having ecological, sociocultural and economic benefits and values (TEEB, 2010a). Ecological values describe the support that aspects of ecosystems provide to each other. For example, trees can control erosion and animals are part of food chains. Such support makes an ecosystem resilient and so enables the continued enjoyment of sociocultural and economic benefits. Sociocultural benefits reflect the contribution of ecosystems to people’s mental, cultural and spiritual well-being and to their sense of place and identity. The economic value of ecosystem services can come from a broad range of sources. It can come from the use of ecosystems, such as food and recreation, or from non-use, such as satisfaction in preservation, either for future generations or for the sake of preservation in its own right. The sum of these non-market sources of value is known as the total economic value, which is explained in more detail in chapter III.B above.
103. Climate change can result in non-economic losses from ecosystems in a number of ways. The biodiversity that underpins an ecosystem can be affected, as described in chapter IV.B.5 above. In the same way that destruction of physical capital can lead to a reduced flow of production, so can destruction of natural capital lead to a lower flow of ecosystem
FCCC/TP/2013/2
34
services. Ecosystem services can also be affected through other mechanisms. Slow onset events, such as temperature and precipitation changes, can disrupt supporting and regulating services, while extreme weather events can damage the ecosystems that provide cultural, recreational and spiritual services. Provisioning services will be affected, primarily in changes in fish catch, yields of crops and changes in growth patterns of forests. As previously mentioned, provisioning services often have economic value, for example the revenue from the sale of fish and agricultural produce, and so these losses are economic losses. However, for subsistence farmers and other vulnerable people, a reduction in provisioning services can threaten food security, and the impact this has on well-being is a non-economic loss.
104. There is a variety of ways for valuing changes in ecosystem services in monetary terms. These methods are described in more detail in chapter V.B.1 below. However, applying these techniques can be challenging, especially in developing countries. TEEB (2010b) suggests three steps that can be taken, noting that steps two and three may not be appropriate in contexts where there are capacity constraints, for example in developing countries, and that step one, simply identifying affected ecosystem services, may be sufficient. The three steps are the following:
(a) For each decision identify and assess the full range of ecosystem services affected and the implications for different groups in society;
(b) Estimate and demonstrate the value of ecosystem services;
(c) Capture the value of ecosystem services, and seek solutions.
V. Methods for assessing non-economic losses
Box 3
Chapter summary
There is a lot of experience worldwide with the assessment and valuation of non-
economic impacts of human development and natural phenomena, ranging from environmental impact assessment of local infrastructure projects, to climate change impacts, adaption and vulnerability assessment at the global scale.
However, assessment and valuation of non-economic impacts remains very difficult, owing to the many uncertainties involved and the essential role of value judgements. These difficulties are usually magnified where analytical capacity is limited.
The paper identifies four broad categories of valuation technique: economic valuation, multicriteria decision analysis (MCDA), composite risk indices and qualitative/semi-quantitative methods.
These methods differ in the extent to which they attempt to make non-economic effects commensurable with economic effects, for aggregation into an overall value for a course of action such as a policy. Economic valuation seeks to put money values on non-economic losses, while MCDA and composite risk indices use formal scoring and weighting. Qualitative/semi-quantitative methods do not attempt to aggregate to the same extent, so it is up to the users of the analysis to compare and evaluate the many effects of policy choices. There are advantages and disadvantages to all of these approaches.
FCCC/TP/2013/2
35
A. Frameworks for assessment and valuation of non-economic losses
105. This chapter presents a review of existing frameworks that have been used to assess and value the non-economic effects of human development and natural phenomena, with the aim of identifying lessons for assessing and valuing non-economic losses from climate change.
106. The assessment of non-economic losses associated with climate change faces many challenges, but it is by no means the first time that policymakers have confronted the question of how to take into account the non-economic effects of human development and natural phenomena. Rather, over several decades and in many countries, experience of assessment has been accumulated through the assessment of the environmental and social impacts (usually alongside the economic impacts) of new economic development, of existing economic activity and of natural environmental phenomena.
107. Many frameworks have been developed for these purposes, including the following:
(a) Environmental impact assessment;
(b) Strategic environmental assessment;
(c) Environmental risk assessment;
(d) Economic appraisal/CBA;
(e) Wealth/capital accounting;
(f) Vulnerability assessment;
(g) Disaster loss/damage assessment;
(h) Climate change impacts, adaptation and vulnerability assessment.
108. These frameworks are described in more detail in the annex. They have been developed for different purposes, and are summarized in table 3.

FCCC/TP/2013/2
36
Table 3 Relevant frameworks for the assessment of the non-economic effects of human development and
natural phenomena
Assessment framework What is its purpose? How does it incorporate non-economic effects?
Environmental impact assessment
Ex ante assessment of environmental impacts of local/regional development projects and of economic and social impacts as support to planning/zoning decisions
Development projects always have non-economic effects, which should be measured and valued alongside economic effects before making decisions on whether to permit development
Strategic environmental assessment
Ex ante assessment of environmental impacts of national/regional policies, plans and programmes, known as ‘strategic actions’ and of
economic and social impacts as support to strategic decision-making
Strategic actions always have non-economic effects, which should be measured and valued alongside economic effects before choosing a policy, plan or programme
Environmental risk assessment
Ex ante assessment of human and environmental effects of hazardous production processes and products as support to planning and permitting decisions
Hazardous production processes and products pose non-economic risks to the natural environment and human health, which environmental risk assessment aims to quantify as an input to planning and decision making
Cost–benefit analysis Assessment of monetary costs and benefits of policies, plans, programmes and/or projects, either ex ante to aid planning/strategic decision-making, or ex post to inform on performance of existing measures
Many of the benefits and costs of policies, plans, programmes and projects are non-economic; however, cost–benefit analysis aims to give them parity of esteem by putting a monetary value on them
Wealth/capital accounting
Comprehensive wealth/capital accounting seeks to understand how (typically) nations manage their asset bases, with a view to assessing whether they are developing sustainably
The national asset base includes not only economic capital, but also non-economic capital such as natural capital. Non-economic capital needs to be assigned a monetary value if the overall wealth/savings position is to be measured formally
Vulnerability assessment
Assessment of the vulnerability of societies, at multiple scales, to natural environmental pressures, alongside other stressors, often as an input to disaster risk reduction initiatives
Vulnerability is usually conceived to have multiple determinants, some of which are non-economic (e.g. nutrition levels, strength of social networks)
Disaster loss/damage assessment
Ex post assessment of the impacts of natural disasters, especially economic costs
Natural disasters have non-economic effects that could be quantified and even monetized, although in practice this is rarely done
Climate change impacts, adaptation and vulnerability assessment
Assessment of the impacts of climate change on societies at multiple scales, either to aid adaptation planning and decision making
Impacts of, and vulnerability to, climate change include non-economic dimensions
Source: Vivid Economics.

FCCC/TP/2013/2
37
109. EIA is one of the most widely used frameworks in this list. First developed in the United States of America in the late 1960s, it is now used as a means of systematic ex ante assessment of the impacts of development projects such as dams and roads in over 100 countries worldwide, including a number of least developed countries, as well as by various multilateral institutions. Given the large number of planning decisions where EIA is appropriate, the framework must be relatively quick and easy to use. In particular, the valuation stage of EIA is often based on simple qualitative or semi-quantitative methods, as explained in chapter V.B below.
110. SEA builds on the foundations of EIA but is applied to strategic actions, such as choices by public authorities over what policies, plans and/or programmes to choose. While newer and less widespread than EIA, it still aims to embed SEA in strategic decision-making by national, regional and local governments across the world. The nature of strategic actions, unlike that of local development projects, requires that SEA methodology place more emphasis on complex, indirect effects on the environment and society. Even more so than in EIA, assessment and valuation in SEA tends to be relatively simple and non-quantitative.
111. Environmental risk assessment has developed as a fairly specialized, science-based and engineering-based framework for the quantification of risks arising from hazardous production processes and products. It is the environment and human health that are subject to these risks, making them in large part non-economic. The environmental risk assessment framework offers a heavily quantitative, expert-driven model for the assessment of non-economic losses from climate change, which may or may not be appropriate, but is in any case very different from EIA/SEA. The framework also places uncertainty centre stage in contrast to most other frameworks included in table 3.
112. Economic appraisal, particularly the use of CBA therein, is widely used in some countries and international organizations to inform policy, plan, programme and project choice,10 or for ex post evaluation of measures taken. It has a history of application going back to the first half of the twentieth century. CBA involves the measurement and monetization of all the effects of development. Monetization of non-economic effects should therefore be a central element. Since market prices do not by definition exist for non-economic effects, these effects must be assigned ‘shadow prices’ using a variety of
techniques. Such techniques are complicated and costly to apply, so assessing the possibility of transferring estimates made in other contexts is important. Chapter V.B below discusses this in greater detail.
113. There is an increasing focus in many countries on expanded notions of national wealth and national accounts that do not just include narrow measures of economic output, savings and wealth, but also non-economic savings and sources of wealth, such as natural assets. The World Bank has been a prominent advocate of the approach and measures comprehensive wealth and adjusted net savings for many countries, while the United Nations System of Environmental-Economic Accounting (SEEA) contains internationally agreed standards for keeping account of natural resources alongside the economy, including, but not limited to, monetary accounting of natural resources.
114. Vulnerability assessment is a growing field, gaining importance owing to interest from development organizations involved in disaster risk reduction and to interest in analysing the impacts of global environmental change. Many different definitions of vulnerability exist, though most of them have in common a focus on three elements: exposure, sensitivity and adaptive capacity. Sensitivity and adaptive capacity, in particular, have non-economic elements. Vulnerability assessment, then, involves the measurement of
10 In principle, CBA, as a method or a tool, could be used as an element of, for instance, EIA or SEA,
but in practice this tends not to be the case. See also UNFCCC (2009).

FCCC/TP/2013/2
38
exposure, sensitivity and adaptive capacity. A range of techniques exist from quantitative global risk indices to more qualitative community-based self-assessment.
115. Disaster loss/damage assessment takes place after a natural disaster, and is intended to reveal the extent of losses, such as fatalities and economic losses, including insured and uninsured losses. It is often conducted as a rapid survey to inform responses such as humanitarian aid.
116. Recent years have witnessed an increase in the specific application of appraisal and assessment techniques to climate change impacts and adaptation planning, such as CCIAV, at multiple scales, from the global to the local. These come in a wide variety of forms, some of which are impact-based and build on quantitative simulation modelling (so-called integrated assessment), and some of which are closer in tradition to vulnerability assessment. The techniques that have been developed are not new in the sense that ideas have been imported from other areas such as environmental assessment or vulnerability assessment, but the specific focus is climate change.
B. Valuing and evaluating non-economic losses
117. This technical paper now turns to the specific issue of valuation, distilling the experience from diverse assessment settings in chapter A above into four different, broad valuation methods: (a) economic valuation, (b) MCDA, (c) risk indices and (d) qualitative/semi-quantitative approaches. These methods are compared and contrasted, with strengths and weaknesses identified.
118. While valuation in common parlance is associated with money and therefore economic methods, a brief but broad definition of the act of valuation is, in fact, simply “comparing objects” (Dasgupta, 2001). A wider range of approaches is thus relevant.
Evaluation is similarly just “comparing the relative merits of actions” (Dasgupta, 2001).
119. In the context of addressing non-economic losses associated with climate change impacts in developing countries that are particularly vulnerable to the adverse effects of climate change, (e)valuation is then the stage at which the significance of non-economic losses is defined and adaptation options can be compared on the basis of how much they reduce non-economic losses, and in how much their parameters, such as cost, diverge.
1. Economic valuation
120. Economic valuation for CBA or wealth/capital accounting involves valuing a change in the provision of a good or service or a change in the value of an asset, respectively, by multiplying the change in the quantity in its natural unit by the price per unit: price x quantity.
121. However, as discussed above, market prices only exist for a subset, sometimes a limited one, of all of the goods, services and capital stocks affected by development. They do not by definition exist for non-economic goods, services and capital stocks. Therefore, the task is to infer so-called ‘shadow’ prices where market prices do not exist, i.e. in non-market valuation. This is no small task; a sophisticated theoretical and practical framework has been developed for it, summarized in numerous textbooks, manuals and sets of official guidelines. The main methods of non-market valuation are (a) revealed preference methods and (b) stated preference methods. Given that (a) or (b) have already been used to generate values somewhere, it is also possible to use (c) benefits transfers in order to apply these values to new contexts without repeating the original valuation work.
122. Revealed preference methods exploit the fact that, while few environmental and social goods/services are traded explicitly on markets, some are traded implicitly and

FCCC/TP/2013/2
39
therefore their value can be estimated by analysing actual market purchases of linked and related goods. The four principal methods of revealed preference valuation are summarized in table 4.
Table 4 Revealed preference methods of economic valuation
Method Revealed behaviour Conceptual framework Applications
Hedonic pricing Land values; job choices
Demand for differentiated products
Land value and wage determinants
Travel cost Participation in recreation activity at chosen site
Household production; complementary goods
Recreational demand
Averting behaviour/defensive expenditure
Time costs; purchases to avoid harm
Household production; substitute goods
Health: morbidity and mortality
Costs of illness Expenditures to treat illness
Treatment costs Health: morbidity
Source: Vivid Economics adapted from Pearce et al. (2006).
123. It is evident that revealed preference methods can be used for non-economic effects, but only for those which can be linked to actual market behaviour in a tractable way, e.g. health effects and the contribution of environmental goods and services to land values. The strength of revealed preference methods usually held to be that they are based on actual, rather than hypothetical, market behaviour, thus avoiding various biases that may be present in making hypothetical purchases.
124. By contrast, hypothetical behaviour is the cornerstone of stated preference methods, which use questionnaire surveys (either contingent valuation or choice experiments) to analyse people’s future behaviour in a constructed market for a non-economic good/service. The constructed or ‘contingent’ market describes the good/service to be purchased and the
institutional context behind its provision, the latter of which can have a strong effect on stated values.
125. Stated preference methods are more flexible than revealed preference methods, in that they can be used to capture almost any aspect of the economic value of non-market goods/services. So there will be some non-economic effects that could only be priced, directly or via benefits transfer, using stated preference valuation. In other cases, stated preference methods provide a rival approach to revealed preference methods, such as in quantifying the value of a statistical life/value of a life-year.
126. However, the hypothetical nature of these methods is the major concern in judgements on whether the price estimates they yield are reliable and unbiased/valid. Much scepticism exists on this point, often well placed, but it is worth noting that the use of such values has been subject to official, expert scrutiny and endorsed in policy settings in many countries (famously in 1993 by NOAA in valuing the environmental costs of the Exxon

FCCC/TP/2013/2
40
Valdez oil spill with a view to informing compensation requirements in the United States courts). Furthermore, interest in developing the science has led to the publication of thousands of studies over the past 20–30 years, so these biases have been extremely thoroughly scrutinized relative to some weaknesses in other methods.
Box 4 Economic valuation in developing countries This box describes some prominent examples of economic valuation in developing countries. Reddy and Behera (2006) applied economic valuation to economic and non-economic losses associated with industrial water pollution in rural communities in India. They estimated costs associated with losses to agricultural production, human health and livestock through an analysis of household-level data, comparing an affected and a non-affected village in Andhra Pradesh, South India. The non-economic losses were found to be the more significant losses, with direct impact on human health and livelihood. They were measured in terms of sick days and medical treatment required as a result of the consumption of polluted water. The net impact of pollution was estimated to be USD 53 per household per annum. Quah and Chia (2013) studied the losses from increases in particulate matter in the air in Singapore. They estimate the health costs associated with a 15 μg/m3 change in concentration at roughly USD 3.75 billion, or about 2 per cent of the gross national product in 2009. They use a benefit transfer method, where the economic valuation of health effects is estimated based on other research into the willingness to pay for reducing risk of premature mortality, and a cost-of-illness approach to value changes in morbidity. The authors note that whereas health effects due to air pollution are relatively easy to identify, placing an economic value on mortality and morbidity using the benefit transfer approach is challenging. Firstly, research on this topic is comparatively scarce, and secondly, existing studies were carried out in a developed country context and it is thus necessary to assume that people in developed countries have preferences similar to those of the inhabitants of Singapore. Leiman (2013) documented the economic valuation of a series of cost–benefit analyses (CBAs) that were carried out to inform state decision-making on air quality by the South Africa National Economic Development and Labour Council. A total of 32 interventions were considered in the CBAs taking into account direct financial costs and benefits, direct economic costs and benefits, and indirect economic impacts. The distributional effects were also considered. The primary concern of the economic valuation was with the health costs associated with air pollution, so it was decided to use existing dose-response functions from other countries and focus on reductions in premature mortality and impacts on statistical life and disability-adjusted life-years. This was then valued using a benefit transfer methodology to convert estimates from studies in the United States into ones applicable to the South African case. The CBA was complemented by an analysis of impacts on stakeholders and on employment over time. These three examples show how non-economic losses are valued and taken into consideration in policy decisions in developing and emerging countries. CBA in these countries relies heavily on the benefits transfer methodology which may bias the results; however, these analyses have proved to be effective tools in policymaking in all three cases.

FCCC/TP/2013/2
41
127. The benefit transfer method is very important in practice given the time and resources needed to conduct original revealed and stated preference studies. The method is difficult to apply correctly; account must be taken of the quality of the original estimates to be transferred and of differences in context (e.g. income), which should be controlled for quantitatively. Therefore, inaccuracy is a major concern; it rises as the original study becomes more dissimilar to the ‘site’ to which estimates are to be transferred. Nonetheless, much effort has been expended in creating databases of valuation studies that can be used as an ‘off-the-shelf’ benefit transfer, such as the environmental valuation reference inventory.
128. Economic valuation can provide monetary estimates of non-economic losses from climate change. Since money is the numéraire, these are in principle fully comparable with economic losses and with an enormous variety of other effects of decisions, such as the costs of adaptation. Commensurability is thus one of the main attractions of the approach, especially given the importance of money values for decision makers. Those who identify with the normative foundations of welfare economics (essentially modern utilitarianism) will also find it convincing a priori, while opponents of these foundations, for example those who would place more emphasis on human rights, will see this as a disadvantage.
129. Concerns remain though about the reliability and validity of shadow prices of non-economic goods/services/assets obtained through these valuation techniques. Moreover, in some cases it may simply be practically infeasible to infer shadow prices where no primary studies exist that could be credibly used as a basis for the benefit transfer method. In reality, then, the best efforts to conduct holistic CBA or capital accounting may continue to disregard some non-economic effects. One could say that the presence of some non-monetized effects in CBA/capital accounting cannot be avoided, and that one should rather ask how significant such effects are relative to those that are included, and if they have the capacity to change the advice given.
130. In addition to uncertainty about shadow pricing, other aspects of the valuation process, notably the discounting of future monetary flows, are also subject to significant uncertainty and results of the analysis are often highly sensitive to these uncertainties. However, it is worth stressing that all valuation methods must deal in some way or another with issues such as weighing different effects in different time periods. These concerns are thus not unique to economic valuation; they are just more explicit.
131. A simple technique that has been suggested for understanding how large non-economic effects would have to be in order to change a decision is that of ‘switching
values’. For instance, if CBA tells us that a particular development action has positive net
present value and should be implemented despite concerns for non-economic losses such as damage to environmental/cultural assets that have not been monetized, one option is to ask how large the value of such damage would have to be in order to reverse the decision (yield negative net present value), and in turn to ask how likely it is that the value of this damage could be so high (Spackman, 2013). A good example of this approach is offered by Hahn and Passell (2010).
132. The use of economic valuation techniques in CBA, where the objective is to assess the merits of a particular project, has a corollary in national accounting, where the objective is to create aggregate indicators of economic performance and well-being. Green/wealth accounting techniques aim to broaden national accounting frameworks by incorporating the value of non-economic assets, such as social capital and environmental capital. Green accounts use the same economic valuation techniques as CBA to enrich macroeconomic decision-making and discuss notions such as economic performance and national wealth in terms broader than just economic output, savings and investment.

FCCC/TP/2013/2
42
2. Multicriteria decision analysis
133. The principal quantitative rival to economic valuation is MCDA, a technique developed in management science to aid coherent decision-making in the face of complexity. The notion of coherent decision-making comes from normative decision theory and is usually taken to be utility maximization, observing a set of simple and generally uncontroversial behavioural precepts or axioms. MCDA has been usefully defined as “a
Box 5 Botswana’s wealth/capital accounting system An example of wealth/capital accounting can be found in Botswana. Botswana has long been a pioneer in natural resource management and is now working with the Wealth Accounting and the Valuation of Ecosystem Services (WAVES) partnership to ensure that national accounts used to measure and plan for economic growth include the value of natural resources. WAVES, a broad coalition of United Nations agencies, governments, international institutes, non-governmental organizations and academics, has developed a workplan detailing activities for 2012–2016 in collaboration with the Government of Botswana. According to WAVES, Botswana’s natural capital is worth a third of its total wealth,
consisting of a combination of minerals, energy, protected areas, crops, pasture land and non-timber forest products. Since 1966, Botswana has prepared ten national development plans. The current priorities to generate economic growth reflect the importance of non-economic items. They include nature-based tourism, mining and agriculture and aim to diversify the economy away from diamond mining and to reduce poverty. To plan appropriately for these development goals, information about natural resource endowments must be gathered. The government has identified four strands of work that will help fill in key information gaps on non-economic items and thus improve decision-making. These strands are:
(a) Implement revised indicators that account for natural capital, including adjusted net national income and adjusted net savings, and build comprehensive wealth accounts to assess the prospects for long-term, sustainable growth;
(b) Build detailed accounts of Botswana’s energy resources and energy use to
assess the optimal energy mix for the future and examine the role of Botswana’s coal in a green economy;
(c) Create national and ecosystem-based tourism accounts to inform management of eco-tourism in four key ecosystems: Okavango, Chobe, Makgadikgadi Pans and Central Kalahari;
(d) Compile water accounts in order to manage scarce water supplies and contribute to the policy on a national water tariff, scheduled for 2013–2014.
The four strands are designed to run in parallel to, and feed into, other policy areas and programmes. Currently, the institutional arrangements that are needed to implement the workplan are being developed. The WAVES programme hopes to strengthen the process of development planning by ensuring a true consideration of natural resources and ecosystems and so enable better decisions.
FCCC/TP/2013/2
43
way of looking at complex problems that are characterized by any mixture of monetary and non-monetary objectives, of breaking the problem into more manageable pieces to allow data and judgements to be brought to bear on the pieces, and then of reassembling the pieces to present a coherent overall picture to decision makers” (DTLR, 2001, chapter 6).
134. At the heart of MCDA is the selection of a set of criteria against which various alternative actions are to be evaluated, the scoring of the performance of each action against each criterion using a consistent scoring scheme, and lastly and perhaps most importantly the weighting of the various criteria. In this way each alternative action can be given a single weighted score, which can be compared with the weighted scores of the other actions. Full commensurability is thus obtained, as in economic valuation, between the actions being explicitly evaluated, but, unlike economic valuation, not with other actions outside the scope of the analysis.
135. MCDA is used perhaps more sparingly in environmental, social and economic assessment than CBA and other (e)valuation methods. Again, done properly, it is resource- intensive, especially if it is carried out with a strong emphasis on deliberation and stakeholder involvement in the process. Nonetheless one can find many individual examples of its application, including controversial issues such as radioactive waste management. In the context of climate change policy, MCDA has found use in the preparation of virtually all national adaptation programmes of action (NAPAs) – see box 6.
136. The differences between economic valuation and MCDA are in some respects obvious (e.g. the former uses money as a numéraire while the latter uses an arbitrary scoring system), while in other respects they are subtle. In particular, the methods mainly differ in their approaches to weighting. CBA contains its own form of implicit weighting in the shape of market and shadow prices. The price level indicates the strength of preference and it is the preferences of people participating in markets as consumers or in revealed and stated preference studies as representative subjects that count. By contrast, in MCDA the weighting is done by a group of people involved in making the decision in question, e.g. policymakers and managers. MCDA does not usually aim for representation of the population, rather the whole point is to help decision makers structure the problems they face and come to coherent decisions, given their goals. Thus much of the emphasis is on the deliberative and procedural aspect of the approach, with respect to whoever is participating in the MCDA. On the other, hand there is clearly the risk that the process lacks legitimacy, especially since the results of MCDA can be very sensitive to the weights chosen.
137. The somewhat less information-intensive scoring and weighting system used by MCDA makes it easier to deal with highly intangible non-economic effects in MCDA than in CBA for which primary studies of shadow prices may not exist as discussed above. However, this does not necessarily imply that the resulting valuation is more reliable or valid.
3. Risk indices
138. The composite risk indices developed for some vulnerability assessments are worth mentioning at this point, e.g. the WorldRiskIndex introduced in box 7, because they share many similarities with MCDA. In particular, they are also constructed by scoring vulnerability on multiple criteria and then weighting the criteria to create a single index value. Hence such risk indices are subject to most of the same advantages and disadvantages identified in relation to MCDA.
139. Of course the nature of the task is different, in that MCDA is usually used to give structure to a particular decision between alternative courses of action (e.g. configuration of a NAPA), while risk indices are constructed to compare vulnerability in different places, with a more indirect connection between the analysis and the actions. Consequently risk

FCCC/TP/2013/2
44
indices tend to be created by expert organizations without necessarily having the strong procedural emphasis on a ‘best practice’ deliberative MCDA. Not all MCDAs, on the other hand, are deliberative in this way.
Box 6 Multicriteria decision analysis to design a national adaptation programme of action Multicriteria decision analysis (MCDA) has been applied by least developed countries, including Zambia and Bangladesh, to devise their national adaptation programmes of action (NAPAs) (Ministry of Environment and Forest Bangladesh, 2005; Ministry of Tourism Environment and Natural Resources Zambia, 2007). MCDA serves mainly as a tool for the teams developing NAPAs to rank the identified necessary adaptation actions by priority, thereby allowing decision makers to select projects that yield the highest benefits to society (economic and non-economic). Zambia’s dependency on natural resources makes the country highly vulnerable to the
effects of climate change. Sensitive sectors are agriculture and food security, wildlife, forestry, water and energy, and human health. Zambia developed its NAPA by evaluating the impacts of climate change on these sectors. It used MCDA to rank 39 identified adaptation actions in order of urgency, highlighting ten immediate priority adaptation interventions. The NAPA team applied the following rating and ranking approach: the three focus areas of sustainable development (economic, environmental and social) were rated as equally important. A total of 14 indicators for the three areas were selected, including contribution to economic growth, impact on Millennium Development Goals and impact on health, with each project scored 1–9, from weakly to extremely important, in contributing to the indicators. The top three priority projects identified were: strengthening of early warning systems across the country, promotion of alternative sources of livelihoods, and adaptation to the effects of drought. Bangladesh is particularly vulnerable to climate change-related disasters, including cyclones and flooding. Bangladesh applies MCDA in selecting a list of priority activities in its NAPA. The NAPA notes that there is a lack of concrete, quantifiable data in some places and areas, which implies that MCDA is more appropriate than cost–benefit or cost-effectiveness analysis. It cites community-led decision-making, stakeholder preference, expert judgment, national goals and strategies as key inputs in MCDA. More than 40 projects were identified, of which 15 were selected as priority actions through a national stakeholder consultation. The criteria used were:
(a) Impacts of climate change on the lives and livelihoods of the communities; (b) Poverty reduction and sustainable income generation of communities; (c) Enhancement of adaptive capacity in terms of capabilities at community and
national level; (d) Gender equality (as a cross-cutting criteria); (e) Enhancement of environmental sustainability; (f) Complementary and synergy with national and sectoral plans and programmes; (g) Cost effectiveness.
Among the priority projects selected are the reduction of climate change hazards through coastal afforestation with community participation and providing drinking water to coastal communities to combat enhanced salinity due to sea level rise.

FCCC/TP/2013/2
45
4. Qualitative and semi-quantitative approaches
140. It is tempting to think that appraisal and assessment must always include some sort of formal, quantitative (e)valuation, such as CBA or MCDA, but in fact the majority of it, embodied in routine EIA, SEA etc., does not. Rather, information on the multiple effects of development, existing economic activity or natural environmental phenomena is brought together in a more disaggregated form, and it is left to the decision makers in support of whom the analysis has been conducted to form their own views on the trade-offs suggested and their implications for the decision. There are many reasons for this, including institutional cultures and preferences, but one major factor is that doing so is less resource-intensive, as costly CBA/MCDA is avoided.
141. According to this approach, formal evaluation usually stops at the presentation of an impact matrix/summary table. An example is given in box 8, which is actually from CCIAV, in which various climate risks are scored on a simple, qualitative scale and brought
Box 7 The WorldRiskIndex The WorldRiskIndex, which has been developed by the United Nations University Institute for Environment and Human Security in cooperation with the Alliance Development Works, is an attempt to score on a single index the risk of becoming a victim of disasters resulting from extreme natural events. The index could be applied at multiple scales from the national to the local as a means of identifying risk hotspots and informing risk reduction strategies. The annual WorldRiskReport ranks 173 countries in its index. The concept underpinning the index is that the risk of becoming a victim of disasters resulting from extreme natural events depends on exposure to extreme natural events on the one hand, and vulnerability on the other hand. Vulnerability in turn depends on susceptibility, short-term coping capacities and long-term adaptive capacities, so that the WorldRiskIndex has four components overall:
1. Exposure to natural hazards; 2. Susceptibility; 3. Coping capacities; 4. Adaptive capacities. Within this framework, the index is constructed in hierarchical fashion. First, for each of the four categories above, a set of multiple indicators is chosen. These are standardised on a scale from 0 to 1 and then combined using a weighting scheme. Then the composite indices of 1–4 are themselves combined using another weighting scheme and rescaled into a percentage. The similarities between constructing such an index and carrying out MCDA are obvious. According to the methodology described for the construction of the WorldRiskIndex, the weighting scheme was chosen using a mix of expert opinion from a survey of mainly development cooperation specialists and statistical (factor) analysis. According to the 2012 version of the index, global hotspots for disaster risk can be found in Oceania, Southeast Asia, the southern Sahel and Central America. These are areas where exposure to natural hazards and climate change is combined with high vulnerability owing mainly to a low level of socioeconomic development. Moreover, 8 of the 15 highest risk countries are island states, which, owing to their proximity to the sea, are particularly exposed to cyclones, flooding and sea level rise.

FCCC/TP/2013/2
46
together, but are neither weighted nor combined. Who does the scoring is clearly important; typically, the assessment is carried out according to the expert subjective judgement of the team. It is not always the case that the various effects are transposed onto a common scoring scale, as in the example shown in box 8. Sometimes each effect is expressed in a different numéraire, usually according to the natural way of measuring it (e.g. costs in financial terms, employment effects in number of jobs created/lost, pollution effects in physical units, amenity/cultural effects on a qualitative scale or even simply by textual description).
Box 8 The United Kingdom’s climate change risk assessment There are many examples of the use of qualitative and semi-quantitative methods of impact (e)valuation in environmental impact assessment, strategic environmental assessment, climate change impacts, adaptation and vulnerability assessment (CCIAV) and elsewhere. A recent example from the sphere of CCIAV is the climate change risk assessment (CCRA) performed in the United Kingdom of Great Britain and Northern Ireland, which was tasked with collecting, comparing and summarizing, for the national government, the latest evidence on the risks and opportunities presented by climate change for the United Kingdom up to 2100. Many aspects of this CCRA will be of interest to those developing methods to assess non-economic losses from climate change elsewhere, for instance the use of scenarios and model-based climate predictions. At the same time, there have been criticisms of this CCRA that are also instructive, for example its failure to adequately incorporate risks to the United Kingdom from climate impacts occurring beyond the United Kingdom. Here the paper will focus, however, on how the various risks from climate change to the United Kingdom are valued and compared in evaluation. This CCRA involved an assessment of hundreds of different kinds of climate risk in different sectors. Some potential risks were quantified and costed in economic terms, others, such as areas of land affected or numbers of people harmed, were quantified in natural units but not monetized, while still other estimates were based on expert elicitation or simply qualitative reviews of the evidence. In order to compare risks, this CCRA used a common qualitative/semi-quantitative scale, rating each risk “low”, “medium” or “high”. This rating was based in part and
where possible on quantitative thresholds such as pounds of damage or lives affected, but expert judgement was required in most places, including where to set such thresholds. Because of significant uncertainty about the magnitude of climate risks, it is worth noting that what is classified as high risk depends further on the number of scenarios or confidence interval over which the magnitude of risk is judged to be high. In addition to assessing the magnitude of the risks, the CCRA incorporated a similar qualitative/semi-quantitative assessment of the degree of confidence in the risk estimates (from “low” to “very high”), an assessment of the perceived urgency of adaptation measures to manage them as a function of the speed of onset of high consequences, and a preliminary assessment of adaptive capacity. Figure 11 illustrates how some of this information and analysis is brought together in a combined assessment of the highest magnitude risks (positive and negative) and their associated confidence levels.
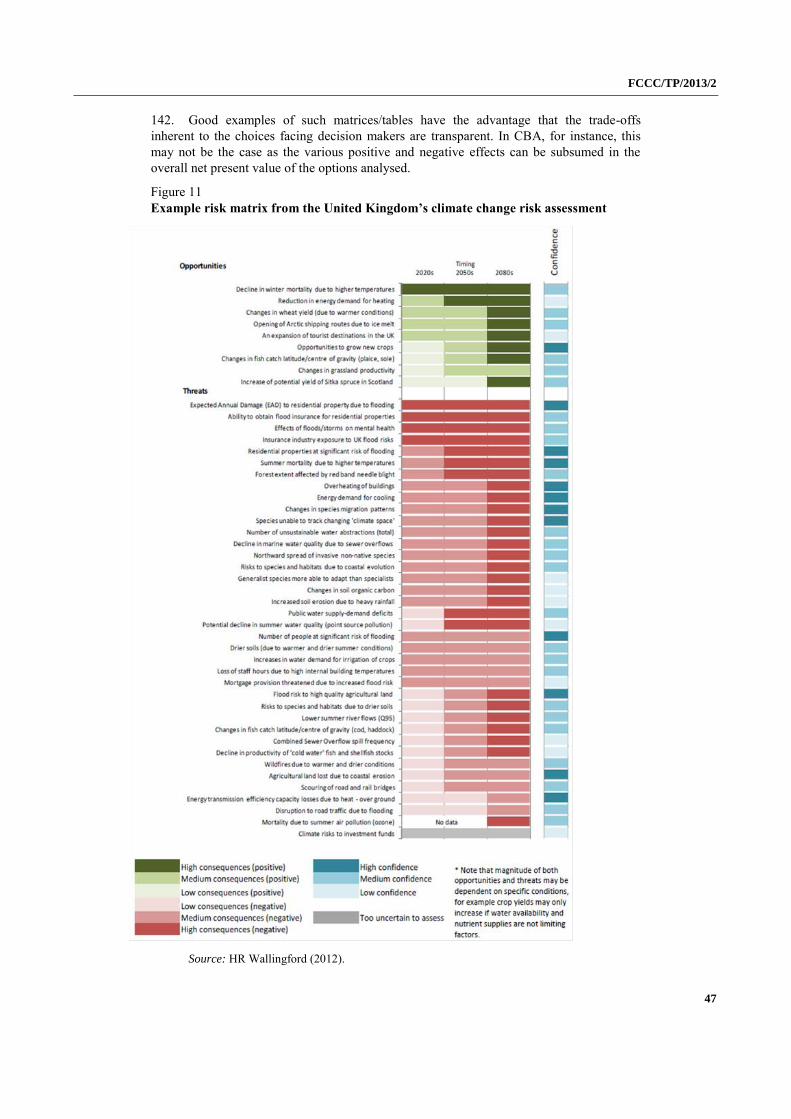
FCCC/TP/2013/2
47
142. Good examples of such matrices/tables have the advantage that the trade-offs inherent to the choices facing decision makers are transparent. In CBA, for instance, this may not be the case as the various positive and negative effects can be subsumed in the overall net present value of the options analysed.
Figure 11 Example risk matrix from the United Kingdom’s climate change risk assessment
Source: HR Wallingford (2012).

FCCC/TP/2013/2
48
143. A key feature of this approach is that it places the responsibility for making the trade-offs on the decision maker rather than the analyst. Views differ on whether this is advantageous, with some pointing to the benefits of decision makers having greater ‘ownership’ over the key trade-offs, and others pointing to the possible inconsistencies and biases introduced when decision makers do not have the help of formal analytical tools.
5. Synthesis
144. Table 5 is a synthesis of the advantages and disadvantages of the approaches discussed here, where, given the similarities, MCDA and composite risk indices are combined.
Table 5 Comparison of methods for valuating non-economic losses
Method Advantages Disadvantages
Economic valuation Structured, systematic approach to evaluation of non-economic and economic effects Facilitating economically efficient adaptation via full commensurability of non-economic effects, of measures with economic effects and with effects of policy in other domains Salience of economic values with decision makers may promote political prioritisation of adaptation
Unreliability of and uncertainty about monetary values and other aspects of economic appraisal such as discounting Economic efficiency may not be judged to be the appropriate decision criterion Resource-intensive Emphasis on expert input and summary values can leave decision makers disconnected from the process
Multicriteria decision analysis /composite risk indices
Structured, systematic approach to evaluation of non-economic and economic elements Full commensurability is possible between options evaluated Puts decision makers at the heart of the evaluation process Relatively easy to incorporate non-economic effects
Generally resource-intensive if method is employed comprehensively Generally lacking robustness in scoring and weighting choices, a problem more acute for non-economic elements where there is less evidence to inform scores and weights assigned Lacking transparency for those not involved Depending on who is involved in the evaluation process it can lack legitimacy
Qualitative and semi-quantitative approaches
Avoiding uncertainties inherent in explicit aggregation across effects Generally more transparent than methods involving scoring/weighting/pricing Relatively easy to incorporate non-economic effects Less resource-intensive
Putting onus on decision makers to implicitly perform comparisons, aggregation and make judgements based on reading of analysis. This opens up more risk of inconsistency and bias

FCCC/TP/2013/2
49
VI. Managing the risks of non-economic losses
A. Incorporating non-economic value into economic decision-making
145. The assessment methods and valuation techniques introduced in chapter V above contain a blueprint for how public and private decision makers can take into account the non-economic impacts of their actions. Many countries have adopted these techniques, both in the developed and the developing world. Yet significant institutional challenges remain. Accounting fully for non-economic factors in decision-making is still the exception rather than the rule.
146. Incorporating non-economic values into economic decision-making, for example through environmental impact assessments or cost–benefit analysis, would go a long way towards ensuring that non-economic systems are robust and healthy. There is evidence that well-maintained ecosystems are better able to deal with climate change-related stress than those subject to anthropogenic pressure (ASC, 2010). In some instances adaptation itself can add to pressure on ecosystems, for example if shoreline protection results in reduced coastal habitat. Again, the incorporation of non-economic impacts into decision-making would help to identify and manage the trade-offs. There are many more examples of how acknowledging non-economic values leads to better decisions that enhance the welfare of the societies concerned (e.g. TEEB, 2010a, 2010b).
147. A broader observation is that the future vulnerability of economic and non-economic systems is determined by large-scale trends and development decisions, such as patterns of migration, decisions on where to build, how to develop and what to produce, as much as by micro-level adaptation choices (Bowen, Cochrane and Fankhauser, 2011). Decisions on
Box 9 Chapter summary Incorporating non-economic values into economic decision-making would greatly
increase the likelihood that non-economic systems remain robust and healthy. However, using the techniques of chapter V as a matter of course requires
institutional adjustments and a change in appraisal mentality. Monitoring, assessing and managing non-economic impact is not standard practice yet in the way that financial and economic appraisal are.
Making good adaptation decisions may reduce the risk of economic and non-economic losses alike, as the two are often linked. For example, flood protection will help to avoid losses related to production interruptions, an economic loss, as well as distress and the outbreak of disease, which are non-economic losses.
A key adaptation challenge is to set the right priorities for the immediate future, with a focus on win-win measures that yield immediate benefits (e.g. flood protection, environmental protection) and measures that affect the long-term vulnerability profile of countries (e.g. planning and infrastructure decisions).
It is important to recognize the practical limits to adaptation. A second adaptation challenge is therefore to remove barriers to effective adaptation by both public and private decision makers. Problems may be institutional, policy-related, market-related, cognitive or related to insufficient funding, information and skills. The way non-economic impacts are treated – measured, valued and assessed – in adaptation decision-making is one such barrier and can affect the level of non-economic loss.

FCCC/TP/2013/2
50
economic diversification, for example away from agriculture or into different forms of agriculture, may affect the impact of future droughts and their social and humanitarian costs. Decisions on the development of coastlines can similarly affect vulnerability to future sea level rise. These decisions would be better informed if they were based on an understanding of economic prosperity broader than just economic output, e.g. a set of green national accounts.
148. A first step in managing non-economic losses from climate change is therefore to systematically adopt and employ non-economic evaluation and appraisal techniques. Non-economic value has to be recognized not just in environment ministries but also in finance, economics and planning ministries, where key economic decisions are often taken.
149. Doing so raises practical issues of institutional capacity and political culture. Setting up sound environmental and social appraisal procedures requires administrative depth, technical skill and the ability to enforce the rules. This is often lacking both at the national and subnational level. Governments need to create a legal basis that incorporates the need for non-economic assessments into the framework of government decision-making. Technical assistance may be required to roll out the methods across government departments and ensure their uniform application.
150. Assigning a truthful value to non-economic effects is analytically very complex. It requires a good understanding not just of valuation, but also of how non-economic systems function and how they react to stress. However, as chapter V above has shown, not all evaluation techniques are equally demanding, and there are ways of adjusting appraisal techniques to different institutional contexts. International standards, such as the SEEA, contain pragmatic guidelines that acknowledge analytical difficulties and allow countries to get started and learn by doing. In fact, some developing countries are at the forefront of environmental decision-making (see box 6 above).
B. Making good adaptation decisions in addressing non-economic losses
151. Making good adaptation decisions will reduce the risk of economic and non-economic losses alike, as the two are often linked. For example, flood protection will help to avoid loss related to production interruptions (economic loss), as well as distress and the outbreak of disease (non-economic loss).
152. A small body of literature has emerged on how to make good adaptation decisions and spend adaptation money wisely (e.g. Fankhauser and Burton (2011)). These studies emphasize the need for good project appraisal to avoid maladaptation, as outlined above. Another key theme is the need to set the right adaptation priorities for the immediate future.
153. While it is important not to delay action, not all adaptation has to be initiated at once. Adaptation is a long-term problem that will occupy policymakers for many decades to come. Even in high vulnerability areas some actions are more urgent than others. In general, there are three main situations where it is advisable to bring adaptation forward (Fankhauser et al., 1999, 2013; ASC, 2010). All three of them are of direct relevance to the avoidance of non-economic losses:
(a) Adaptations with early, robust benefits. Starting early is important if the proposed measures have immediate benefits that would otherwise be forgone. Disaster risk management falls into this category (UNISDR, 2013), as do adaptations with strong development co-benefits, such as better health and sanitation systems. Another intervention that can yield non-economic co-benefits early on is the protection of environmental assets. For instance, preserving coastal wetlands yields many economic and non-economic benefits in terms of ecosystem services, including protection against coastal flooding. A study of the

FCCC/TP/2013/2
51
Muthurajawela Marsh in Sri Lanka found that flood attenuation accounted for two thirds of the benefits that the wetland provides (Emerton and Kekulandala, 2003);
(b) ‘Low-regrets’ adaptations with long lead times. It makes sense to fast-track adaptation measures that are known to be crucial for the future, if they take time to ramp up. The development of new skills (e.g. in assessment and valuation techniques like CBA and MCDA) arguably falls into this category. Building adaptive capacity through knowledge systems, risk governance, institutional strengthening and training is another activity that can take time and should therefore start early;
(c) Areas where decisions today could ‘lock in’ vulnerability profiles for a long
time. Fast-tracking adaptation is desirable if a wrong decision today makes countries more vulnerable in the future and if those effects (e.g. in the case of environmental degradation) are costly to reverse. Many big development decisions fall into this category, including those on land use planning (e.g. the development of coastal zones) and long-term infrastructure (e.g. the design of new water and sanitation systems). Analysing lock-in is more complicated than the other two categories and requires more complex assessment techniques that deal adequately with climate uncertainty (e.g. Ranger et al. (2010)).
C. Addressing practical limits to adaptation in non-economic sectors
154. It is important to remember the practical limits to adaptation when considering loss and damage, for if it were feasible to adapt to the full range of adverse effects of climate change then there would be no loss and damage. However, there are constraints on achieving such adaptation; and identifying these constraints indicates when a loss and damage assessment may be necessary.
155. In the context of non-economic losses, the most important constraints to adaptation are likely to include (see Fankhauser and Soare (2012)):
(a) Institutional and financial constraints: perhaps the main institutional constraint to adaptation, particularly in developing countries, is a lack of adaptive capacity – including sufficient financial and technical resources. Even in developed countries, adaptation performance can be hampered by governance, policy and regulatory problems. A prominent example is the water sector, where poor regulation, under-investment and pricing subsidies often prevent effective adaptation. In other areas, such as environmental protection, adaptation may be held back by governance failures, corruption or strong vested interests. Institutional competition, layered bureaucracy and entrenched rules and traditions can hamper the ability of organizations to respond to changing circumstances;
(b) Market failures: market imperfections – some generic, others particular to adaptation – that may affect the effectiveness of adaptation include externalities, or more generally a lack of coordination, between adaptation agents (e.g. up-river and down-river communities), asymmetric information (e.g. about the risk profile of properties) or moral hazard (e.g. for people with insurance coverage or with at-risk communities holding out for government assistance). Path dependence may affect the choice between protection and relocation, for example, for highly vulnerable historic locations;
(c) Behavioural and information barriers: adaptation may suffer from a lack of awareness, information and skills which means that climate risks are under-managed. More profoundly, complex, long-term adaptation decisions may be affected by well-known cognitive barriers that lead to inertia, procrastination and, indirectly, high discount rates.
156. A priority role of national governments and the international community is to overcome these barriers where possible and provide an environment that is conducive to
FCCC/TP/2013/2
52
effective adaptation by individual decision makers: individuals, households, firms and local communities.
157. It should be recognized that there are ultimately also technological, biophysical or economic constraints to adaptation. If climate risks were severe, there may be cases where the protection of some natural or societal assets is no longer a realistic option. Prominent examples in the natural world include glaciers and coral reefs, which provide many ecosystem services but face clear limits to adaptation. Similarly, a small island nation may become inundated due to sea level rise and its population relocated. Even though the nation would persist, without its original geographical location the people of the nation would suffer a loss in terms of displacement, culture, belonging, history and sovereignty.
VII. Conclusions
158. This technical paper responds to a request by the Parties at COP 18 to carry out further activities under the work programme on loss and damage, including the preparation of a technical paper on non-economic losses (decision 3/CP.18, para. 10(b)).
159. This technical paper defines non-economic losses as losses that are not commonly traded in markets (either formal or informal) and are therefore not captured by the system of national accounts. This technical paper distinguishes among three main categories of non-economic losses: loss to private individuals (e.g. loss of life, health impacts, human mobility), loss to society (e.g. loss of territory, cultural heritage, indigenous knowledge) and environmental loss (e.g. biodiversity and ecosystem services). Losses may occur through many channels. They may be related to both slow onset impacts (e.g. the loss of territory to sea level rise) and extreme events (e.g. loss of life in a cyclone). The loss may be directly linked to climate change (e.g. loss of ecosystems) or occur indirectly (e.g. malnutrition as a consequence of impacts in the agriculture sector).
160. The absence of a market price makes the assessment of non-economic losses challenging, but their effect on human welfare is no less important. Non-economic loss is an important aspect of the total cost of climate change, alongside mitigation cost, adaptation costs and economic loss and damage. In many developing countries, non-economic losses may well be more significant than economic losses.
161. Recommendation: Recognizing, assessing and managing the risk of non-economic loss should be a central aspect of climate change policy.
162. This technical paper outlines the main techniques available to assess non-economic losses. Many of them are well known. This is not the first time that policymakers have confronted the question of how to take into account the non-economic effects of policy or investment decisions. There is experience in many countries in the assessment of environmental and social impacts of new economic development, of existing economic activity and of natural environmental phenomena (e.g. environmental impact assessment, cost–benefit analysis, disaster loss assessment and many more). This technical paper identifies four broad categories of valuation technique: economic valuation, MCDA, composite risk indices and qualitative/semi-quantitative methods. That is, valuation is interpreted not solely as assigning monetary values but more broadly as the act of ‘comparing the relative merits of actions or objects’. The different assessment and
evaluation methods all have their advantages and disadvantages.
163. Recommendation: Policymakers should make use of the full range of available assessment and evaluation techniques. The suitability of each depends on institutional contexts as well as the problem at hand.
FCCC/TP/2013/2
53
164. Whatever method is chosen, the assessment and valuation of non-economic impacts remains very difficult owing to the many uncertainties involved and to the essential role of value judgements. These difficulties are usually magnified where analytical capacity is limited. Because of this complexity, it is very difficult to express aggregate damage in a single number representing the ‘total non-economic loss’.
165. Recommendation: A detailed quantification of non-economic loss should rely on a number of different metrics, not just a single number representing the ‘total non-economic loss’.
166. This technical paper then outlines out the main implications for the design of practical adaptation actions. Two main challenges are highlighted. The first challenge is the identification and quantification of non-economic value and its inclusion in decision-making using the techniques introduced in this technical paper. Incorporating non-economic values into economic decision-making is an important first step towards ensuring that non-economic systems are properly managed and are robust and healthy. However, using non-economic evaluation techniques as a matter of course requires institutional adjustments and a change in appraisal mentality.
167. Recommendation: Policymakers should make the use of non-economic evaluation techniques a requirement in project appraisal. The Convention may aid this process by providing hands-on guidance that would ensure that non-economic impacts are addressed – measured, valued and assessed – appropriately in public decision making.
168. Another challenge is adaptation to climate change more broadly. Many of the issues faced by the adaptation community are the same whether the aim is to prevent economic or non-economic loss. Making good adaptation decisions will reduce the risk of economic and non-economic losses alike, as the two are often linked. In practice, however, there are many potential barriers to effective adaptation. Overcoming them is one of the main challenges of good adaptation in addition to the need to set appropriate priorities.
169. Recommendation: Policymakers and the international community should make the removal of adaptation barriers an immediate priority for adaptation assistance in developing countries, whether the barriers are institutional, funding-related, policy-related, market-related, cognitive or due to insufficient information and skills.
FCCC/TP/2013/2
54
References
ASC. 2010. How Well Prepared is the UK for Climate Change? London: ASC.
Barnett J and Adger WN. 2003. Climate dangers and atoll countries. Climatic Change. 61: pp.321–337.
Berenfeld ML. 2008. Climate change and cultural heritage: Local evidence, global responses. Climate
Change and Cultural Heritage. 25(2): 66–82.
Bowen A, Cochrane S and Fankhauser S. 2011. Climate change, adaptation and economic growth. Climatic Change. 113(2): 95–106.
Climate for Culture. 2012. Climate for Culture Project: First Results Available at <http://www.climateforculture.eu/index.php?inhalt=download&file=pages/user/downloads/publications/2012_HeritagePortal.pdf>.
Dasgupta P. 2001. Human Well-Being and the Natural Environment. Oxford: Oxford University Press.
Department for Transport, Local Government and the Regions, UK. 2001. Multi-Criteria Analysis. Available at <https://www.gov.uk/government/uploads/system/uploads/attachment_data/file/7612/1132618.pdf>.
Eduljee G. 1999. Risk assessment. In: J Petts (ed.). Handbook of Environmental Impact Assessment.
Volume 1 – Environmental Impact Assessment: Process, Methods and Potential. pp.374–404. Oxford: Blackwell Science.
Emerton L and Kekulandala LDC. 2003. Assessment of the economic value of Muthurajawela Wetland. Occasional Papers of IUCN Sri Lanka. 4: 1–28.
European Environment Agency. (n.d.). Assessing Biodiversity in Europe – the 2010 Report.
Fankhauser S and Burton I. 2011. Spending adaptation money wisely. Climate Policy. 11(3): 1037–1049.
Fankhauser S, Ranger N, Colmer J, Fisher,S, Surminski S, Stainforth D and Williamson A. 2013. An
Independent National Adaptation Programme for England. Policy brief. London: Grantham Research Institute on Climate Change and the Environment.
Fankhauser S and Soare R. 2012. Strategic adaptation to climate change in Europe: Vivid Economics report prepared for the European Investment Bank. Available at <http://www.vivideconomics.com/uploads/reports/strategic-adaptation-to-climate-change-in-europe/Strategic_Adaptation_to_Climate_Change_in_Europe.pdf>.
Fankhauser S, Smith JB and Tol R. 1999. Weathering climate change. Some simple rules to guide adaptation investments. Ecological Economics. 30(1): 67–78.
Fischlin A, Midgley GF, Price JT, Leemans R, Gopal B, Turley C, Rounsevell MDA, Dube OP, Tarazona J and Velichko AA. 2007. Ecosystems, their properties, goods and services. In: M Parry, OF Canziani, JP Palutikof, PJ van der Linden and CE Hanson (eds.). Climate Change 2007: Impacts, Adaptation and
Vulnerability. Contribution of Working Group II to the Fourth Assessment Report of the
Intergovernmental Panel on Climate Change. Cambridge: Cambridge University Press.
Füssel M. 2007. Vulnerability: A generally applicable conceptual framework for climate change research. Global Environmental Change. 17: 155–167.

FCCC/TP/2013/2
55
Füssel M and Klein R. 2006. Climate change vulnerability assessments: An evolution of conceptual thinking. Climatic Change. 75(3): 301–329.
Glasson J, Therivel R and Chadwick A. 2005. Introduction to Environmental Impact Assessment. London: Routledge.
Gollier C. 2012. Pricing the Planet’s Future: The Economics of Discounting in an Uncertain World. Princeton, New Jersey: Princeton University Press.
Hahn R and Passell P. 2010. The economics of allowing more US oil drilling. Energy Economics. 32(3): pp.638–650.
HR Wallingford. 2012. UK Climate Change Risk Assessment Evidence Report. Available at <http://ccra.hrwallingford.com/CCRAReports/reportviewer.html?sector=evidence&link=LinkTarget_2493>.
Hugo G. 2010. Climate change-induced mobility and the existing migration regime in Asia and the Pacific. Climate Change and Displacement: Multidisciplinary Perspectives. pp. 9–36. Oxford: Hart Publishing.
IDMC. 2013. People Displaced by Disasters. Available at <http://www.internal-displacement.org/publications/global-estimates-2012>.
IDMC and OCHA. 2009. Monitoring Disaster Displacement in the Context of Climate Change. Available at <http://www.internal-displacement.org/8025708F004BE3B1/%28httpInfoFiles%29/12E8C7224C2A6A9EC125763900315AD4/$file/monitoring-disaster-displacement.pdf>.
IHC. 1946. Preamble to the Constitution of the World Health Organization as adopted by the
International Health Conference, New York, 19-22 June, 1946; signed on 22 July 1946 by the
representatives of 61 States. Official Records of the World Health Organization. 2:100.
IIPCC. 2007. Climate Change 2007: Impacts, Adaptation and Vulnerability. Cambridge and New York: Cambridge University Press.
IPCC. 2012. Managing the Risks of Extreme Events and Disasters to Advance Climate Change
Adaptation. A Special Report of Working Groups I and II of the Intergovernmental Panel on Climate
Change. CB Field, V Barros, TF Stocker, D Qin, DJ Dokken, KL Ebi, MD Mastrandrea, KJ Mach, G-K Plattner, SK Allen, M Tignor and PM Midgley (eds.). Cambridge and New York: Cambridge University Press.
Leiman A. 2013. Health care costs of urban air pollution in South Africa.. In: MA Livermore and RL Revesz (eds.). The Globalization of Cost-Benefit Analysis in Environmental Policy. Oxford: Oxford University Press.
Livermore MA and Revesz RL (eds.). 2013. The Globalization of Cost-Benefit Analysis in Environmental
Policy. Oxford: Oxford University Press.
McMichael AJ, Campbell-Lendrum DH, Corvalan CF, Ebi KL, Githeko AK, Scheraga JD and Woodward A. 2003. Climate Change and Human Health: Risks and Responses. Available at: <http://www.who.int/globalchange/publications/cchhsummary/en/>.
Millennium Ecosystem Assessment. 2005. Ecosystems and Human Wellbeing: Biodiversity Synthesis. Washington, D.C.: Island Press.

FCCC/TP/2013/2
56
Ministry of Environment and Forest, Bangladesh. 2005. National Adaptation Programme of Action of
Bangladesh. Available at <http://unfccc.int/resource/docs/napa/ban01.pdf>.
Ministry of Tourism Environment and Natural Resources Zambia. 2007. National Adaptation Programme
of Action of Zambia. Available at <http://unfccc.int/resource/docs/napa/zmb01.pdf>.
Myers N, Mittermeier RA, Mittermeier CG, da Fonseca GAB and Kent, J. 2000. Biodiversity hotspots for conservation priorities. Nature. 403: 853–858.
National Research Council. 1983. Risk Assessment in the Federal Government: Managing the Process. Washington, D.C.: National Academy of Sciences.
NOAA. 2010. Global Hazards – December 2010. Available at <http://www.ncdc.noaa.gov/sotc/hazards/2010/12>.
OECD. 2007. Human Capital. Available at <www.oecd.org/insights/humancapital>.
OECD. 2012. OECD Environmental Outlook to 2050. Available at <https://community.oecd.org/servlet/JiveServlet/previewBody/40641-102-1-76036/OECD>.
Parliamentary Office of Science and Technology. 2008. Postnote: Biodiversity Indicators. Available at <http://www.parliament.uk/documents/post/postpn312.pdf>.
Quah E and Chia W-M. 2013. Economic Costs of Air Pollution in Singapore. In: MA Livermore and RL Revesz (eds.). The Globalization of Cost-Benefit Analysis in Environmental Policy. pp.198–207. Oxford: Oxford Scholarship.
Ranger N, Millner A, Dietz S, Fankhauser S, Lopez A and Ruta G. 2010. Adaptation in the UK: A
Decision-making Process. London: Grantham Research Institute on Climate Change and the Environment.
Reddy RV and Behera B. 2006. Impact of water pollution on rural communities: An economic analysis. Ecological Economics. 58(3): 520–537.
Sadler B and Verheem R. 1996. Strategic Environmental Assessment: Key Issues Emerging from Recent
Practice. The Hague: Spatial Planning and the Environment.
Secretariat of the Convention on Biological Diversity. 2010. Global Biodiversity Outlook 3. Available at <http://www.cbd.int/gbo3/>.
Sen A. 1999. Development as Freedom. New York: Knopf.
Spackman M. 2013. Handling Non-monetised Factors in Project, Programme and Policy Appraisal. Available at <http://www.cccep.ac.uk/Publications/Policy/docs/PP-non-monetised-factors-project-programme-policy.pdf>.
Stabinsky D and Hoffmaister JP. 2012. Loss and damage: Defining slow onset events. Briefing Paper on
Loss and Damage, 3. Available at <http://www.twnside.org.sg/title2/climate/briefings/bangkok04/Loss_and_damage_BP3.pdf>.
Stern N. 2007. The Economics of Climate Change: the Stern Review. Cambridge: Cambridge University Press.
TEEB. 2009. TEEB Climate Issues Update. Available at <http://www.teebweb.org/publication/climate-issues-update/#.Ui3wT3_hcYI>.
FCCC/TP/2013/2
57
TEEB. 2010a. The Economics of Ecosystems and Biodiversity: Ecological and Economic Foundations. P Kumar (ed.). London and Washington: Earthscan.
TEEB. 2010b. The Economics of Ecosystems and Biodiversity: Mainstreaming the Economics of Nature:
A Synthesis of the Approach, Conclusions and Recommendations of TEEB. Available at <http://www.teebweb.org/wp-content/uploads/Study%20and%20Reports/Reports/Synthesis%20report/TEEB%20Synthesis%20Report%202010.pdf>.
UNFCCC. 2009. Potential costs and benefits of adaptation options: A review of existing literature. Technical paper. Available at <http://unfccc.int/resource/docs/2009/tp/02.pdf>.
UNESCO. 2007a. Case Studies on Climate Change and World Heritage. Available at <http://whc.unesco.org/en/activities/473/>.
UNESCO. 2007b. Climate Change and World Heritage. Available at <http://whc.unesco.org/en/climatechange/>.
UNESCO. 2008. World Heritage Centre Mission Statement. Available at <http://whc.unesco.org/documents/publi_infokit_en.pdf>.
UNESCO. 2012. Operational Guidelines for the Implementation of the World Heritage Convention. Available at <http://whc.unesco.org/en/guidelines/>.
UNESCO. 2013. World Heritage Centre Glossary. Available at <http://whc.unesco.org/en/glossary>.
UNFCCC.2009. Potential costs and benefits of adaptation options: A review of existing literature. Available at < http://unfccc.int/resource/docs/2009/tp/02r01.pdf>.
UNFCCC. 2012. Current Knowledge on Relevant Methodologies and Data Requirements as well as
Lessons Learned and Gaps Identified at Different Levels, in Assessing the Risk of Loss and Damage
Associated with the Adverse Effects of Climate Change. Available at <http://unfccc.int/resource/docs/2012/tp/01.pdf>.
UNISDR. 2013. Global Assessment Report. Available at <http://www.unisdr.org/we/inform/gar>.
United Nations. 1992. Convention on Biological Diversity. Available at <http://www.cbd.int/doc/legal/cbd-en.pdf>.
United Nations Permanent Forum on Indigenous Issues. 2008. Climate Change and Indigenous Peoples. Available at <http://www.un.org/en/events/indigenousday/pdf/Backgrounder_ClimateChange_FINAL.pdf>.
Viscusi WK and Aldy JE. 2003. The value of a statistical life: A critical review of market estimates throughout the world. Journal of Risk and Uncertainty. 27(1): 5–76.
Warner K, Afifi T, Kalin W, Leckie S, Ferris B, Martin SF and Wrathall D. 2013. Changing climate, moving people: Framing migration, displacement and planned frelocation. Policy Brief. 8:pp.1–58.
WHO. 2009. Global Health Risks: Mortality and Burden of Disease Attributable to Selected Major Risks. Available at <http://www.who.int/healthinfo/global_burden_disease/GlobalHealthRisks_report_full.pdf>.
WHO. 2011. Health, Climate Change, and WHO. Available at <http://www.who.int/entity/globalchange/FinalDonorReport2011.pps>.

FCCC/TP/2013/2
58
World Bank. 2010. World Development Report 2010: Development and Climate Change. Washington, D.C.: World Bank.
World Bank. 2012. Turn Down the Heat - Why a 4 Degree Warmer World Must be Avoided. Available at <http://climatechange.worldbank.org/sites/default/files/Turn_Down_the_heat_Why_a_4_degree_centrigrade_warmer_world_must_be_avoided.pdf>.
World Health Organization. 2009. Global Burden of Disease: 2004 Update. Available at <http://www.who.int/healthinfo/global_burden_disease/2004_report_update/en/>.

FCCC/TP/2013/2
59
Annex
Frameworks for assessing non-economic losses
A. Environmental impact assessment
1. Environmental impact assessment (EIA) is generally defined as the systematic assessment of environmental impacts of any development action in advance of it being taken. EIA was first legislated in the United States of America in 1969 as a requirement to accompany proposals for “major Federal actions significantly affecting the quality of the
human environment”1 and has subsequently been rolled out in well over 100 countries, including many developing countries, as well as international organizations. Thus there is significant experience with EIA, and that is one reason why it is valuable to think about its relevance to the issues related to assessing non-economic losses.
2. EIA has several key features relevant to our discussion:
(a) It is predictive, in that it is intended to inform policymakers on the impacts of development ex ante;
(b) It requires the assessment of the effects of development to be done in an integrated, holistic and multi-disciplinary way, in principle bringing together and giving parity of esteem to economic, social and environmental effects, both quantitative and qualitative;
(c) Nevertheless, its origins are in environmental legislation, and it has often been regarded as strongest on environmental effects, alongside economic effects that are often easy to quantify and prominent in the context of development (e.g. jobs created) and weakest on social effects;
(d) In some countries there are separate arrangements for socioeconomic or social impact assessment, which focus on social and/or economic effects of development, whereas in others they are in principle integrated with EIA. There are, in some places, even more specific applications or proposed applications, such as the health impact assessment and the environmental justice impact assessment;
(e) Not owing to the original United States legislation or any general definition/understanding of the concept of EIA, EIA has come to be applied almost exclusively to geographically specific developments and projects such as major infrastructure works (as opposed to, for example, national policies). Therefore, the methods of impact prediction and valuation that have been developed are appropriate to this high degree of spatial resolution. In particular, it is common to see some form of quantitative impact prediction of environmental effects such as air and water pollution;
(f) On the other hand, in part because of its broad scope in terms of environmental, social and economic effects and, moreover, because of the need to apply it routinely in a local context, at the (e)valuation stage EIA is normally less quantitative and technical than some other assessment frameworks, such as cost–benefit analysis (CBA).
3. Figure 12 offers a schematic representation of the EIA process and singles out the steps of most relevance to this technical paper (circled by the dashed line). The prediction of impacts “aims to identify the magnitude and other dimensions of identified change in the
environment with a project/action, by comparison with a situation without that project/action” (Glasson, Therivel and Chadwick, 2005, page 5), while the evaluation and
1 US National Environmental Policy Act 102.2.C.

FCCC/TP/2013/2
60
assessment of significance “assesses the relative significance of the predicted impacts to
allow a focus on the main adverse impacts” (Glasson, Therivel and Chadwick, 2005). Note that “mitigating measures” in figure 12 should be understood to mean adaptation to climate
change in the context of this technical paper.
Figure 12 The environmental impact assessment process
Project screening (is an EIA needed?)
Scoping (which impacts and issues should be considered?)
Description of the project/development action and alternatives
Description of the environmental baseline
Identification of key impacts
Prediction of impacts
Evaluation and assessment of significance of impacts
Identification of mitigating measures
Presentation of findings in the EIA (including a non-technical
summary)
Review of the EIA
Decision-making
Post-decision monitoring
Audit of predictions and mitigation measures
Public consultation
and participation
Note: The most relevant step of environmental impact assessment for this technical paper is highlighted by the dashed line. Source: Glasson et al. (2005).
B. Strategic environmental assessment
4. Strategic environmental assessment (SEA) has many similarities with EIA. The steps of the process are broadly the same as in figure 12, for example. The main difference is that it has been designed to remedy the failure of most countries to apply EIA to higher-level development decisions made by governments in the form of new or amended policies, plans and programmes. Thus it has been defined as “a systematic process for evaluating the
environmental consequences of proposed policy, plan or programme initiatives in order to ensure they are fully included and appropriately addressed at the earliest appropriate stage of decision-making on par with economic and social considerations” (Sadler and Verheem,

FCCC/TP/2013/2
61
1996). SEA is newer and less widespread than EIA,2 but, nonetheless, several dozen countries have now legislated for it.
5. SEA has several key features relevant to our discussion, as distinct from those of EIA:
(a) With a focus on strategic actions that are usually larger in scope than the focused projects covered by EIA (e.g. greater geographical reach), SEA must concern itself much more with the indirect, cumulative and synergistic effects of development, including interactions between strategic actions in different domains. Given the greater scope of strategic actions, impact prediction techniques in SEA tend to be more informal and qualitative than in EIA, where they are based on expert judgement. As with EIA, (e)valuation tends to be informal and qualitative;
(b) The nature of policymaking in particular means that SEA is applied earlier in the decision-making process than EIA, which is typically triggered by a specific development proposal. Consequently effective SEA needs to be optimally integrated into the existing policymaking process, although that can mean different things in different places;
(c) There can in some cases be separate arrangements for the assessment of economic and social impacts of strategic actions.
C. Environmental risk assessment
6. While uncertainty is a pervasive feature of EIA, SEA and other assessment frameworks, environmental risk assessment (ERA) has developed as a distinct and relatively narrow field. Its origins are in the assessment of occupational and consumer risk from chemicals and in nuclear and major hazard assessments, both of which have been carried out for many decades. The focus on human health and hazardous products and activities is evident in a well-known definition of ERA by the United States National Research Council (1983) as “the characterization of the potential adverse health effects of
human exposures to environmental hazards”. Nowadays many countries are applying ERA legislation and guidelines to very specific sets of hazards.
7. There are many similarities between the steps of the ERA process and the steps of the EIA/SEA processes detailed above. Figure 13 sets this out in a diagram. Nonetheless, ERA, which draws on expert, technical input, focuses more strongly on quantitative estimation of the likelihood of a hazard and its consequence. Therefore, the key features of ERA for our discussion are:
(a) The focus on uncertainty, as opposed to best estimates (which has certainly been a feature of EIA), and the formal quantification of that uncertainty;
(b) On the other hand, it has more recently come to be understood that it is desirable to nest formal risk assessment within a broader risk management process that admits other considerations, such as social attitudes towards risks, which may be quite different from the technical valuation of those risks;
(c) A number of scholars have remarked on the potential for cross-fertilization between EIA and ERA based on the fact that, by and large, one is strong in areas where the other is weak.
2 The European Union, for example, first passed an SEA directive in 2004. It passed its original EIA
directive in 1985.

FCCC/TP/2013/2
62
Figure 13 Stages of risk assessment compared with environmental impact assessment/ strategic
environmental assessment (‘environmental assessment’)
Source: Adapted from Eduljee (1999).
D. Economic appraisal/cost–benefit analysis
8. CBA is the principal tool of economic appraisal of the effects of development actions, usually of a contained nature although CBA-style analysis has also been used to study systemic change. As its name suggests, it is a comparison of the social costs and benefits of a development action, in money units, where costs/benefits comprise all the negative/positive effects of the action on social welfare. If the social benefits of a development action exceed the costs, discounted appropriately to reflect their distribution over time and the preference for benefits earlier in time, then the action has positive net present value and it is assumed to increase social welfare as conceived by economists. Therefore, from an economic perspective, it should go ahead.
9. The key features of CBA for our discussion are:
(a) In order to be comparable, all costs and benefits must be monetized in CBA. Since market prices are usually only available for a subset of such effects, e.g. changes in the production of goods such as agricultural crops and timber, a significant amount of non-market valuation is required in order to ensure that the CBA is comprehensive. Hence non-market valuation is central to capturing the non-economic effects of development actions in CBA;
(b) CBA is both an assessment framework in its own right and a method/tool that can be used with other frameworks. In a small number of countries, there is a legislative requirement to undertake CBA of certain categories of government decisions such as new policies at the federal/national level (e.g. in the United Kingdom of Great Britain and Northern Ireland and the United States). Therefore, such legislation dictates both that

FCCC/TP/2013/2
63
assessment is required and which tool should be used. But, on the other hand, there is in principle no reason why CBA could not be used as an impact estimation and valuation tool within other assessment frameworks, such as EIA and SEA. That this is not the case in practice is due to many reasons, prominent among which are an institutional culture/preference for non-economic methods and the very significant cost in terms of resources, time and expertise required to do CBA well;
(c) Despite the resource-intensive and expertise-intensive nature of CBA, and while it is by no means as prevalent in developing countries as it is in developed countries, “the use of cost–benefit analysis as an aid to environmental decision-making has expanded in recent years in countries throughout Latin America, Asia, and Africa” (Livermore and Revesz, 2013).
E. Wealth/capital accounting
10. There is an increasing focus in many countries on expanded notions of national wealth and national accounts, which does not just include narrow measures of economic output, savings and wealth, but also non-economic savings and sources of wealth, such as natural assets. The World Bank has been a prominent advocate of the approach and measures comprehensive wealth and adjusted net savings for many countries, while the United Nations System of Environmental-Economic Accounting (SEEA) contains internationally agreed standards for keeping accounts of natural resources, including, but not limited to, monetary accounting of natural resources.
F. Vulnerability assessment
11. The past decade has seen a growing interest in vulnerability assessment from several quarters, including organizations involved in disaster risk reduction (such as multilateral agencies like the United Nations International Strategy for Disaster Reduction and national aid agencies), and in analysing the impacts of global environmental change (including of course climate change). Vulnerability is the sort of broad term that is susceptible to many different theories and interpretations. For example, in his 2006 review, Birkmann counts 25 different concepts, definitions and methods and 20 different manuals and guidebooks for its estimation. There is every chance these counts have subsequently risen. The issue has also been discussed at length by the Intergovernmental Panel on Climate Change (Contribution of Working Group II to the Fourth Assessment Report, chapter 19, Parry et al., 2007). Nonetheless, vulnerability is commonly understood to be a function of the following (see Füssel, 2007, and Füssel and Klein, 2006):
(a) Exposure;
(b) Sensitivity;
(c) Adaptive capacity.
12. This conceptual framework unites various intellectual traditions because it brings together considerations of the features of the natural hazard, on the one hand, and the social and economic determinants of the vulnerability of affected people and societies, on the other. Within (c) a distinction is sometimes further drawn between short-term coping and long-term adaptation.
13. Assessing vulnerability would seem to necessarily involve some form of measurement, and, in turn, measurement involves the use of one or more indicators/criteria. But because there are many different theories of vulnerability, and because going from theory to measurement brings added difficulties with it, many measures and systems of

FCCC/TP/2013/2
64
measures have been proposed involving different choices on dimensions such as the degree of quantification, complexity, whether to focus on single or multiple hazards, spatial scale, prominence given to local people and local knowledge, etc. Moreover, many of these measures have developed within separate traditions, with limited cross-fertilization (Romieu et al., 2010). Some are close to ERA, with the hazard in question being natural rather than industrial, while others are at the opposite end of the spectrum in terms of technical input.
14. Consequently it is inappropriate to attempt to characterize this broad field with a single idealized model. Instead, examples of the diversity of vulnerability assessment methods include:
(a) Global indices such as the Disaster Risk Index of the United Nations Development Programme, a univariate indicator that is constructed by dividing the number of people killed by a natural disaster by the number of people exposed, and the WorldRiskIndex of the United Nations University Institute for Environment and Human Security, which is a composite of measures of exposure, susceptibility, coping and adaptive capacities (see box 7);
(b) Catastrophe modelling using for example the CATSIM model of International Institute for Applied Systems Analysis, a process-based computer simulation model linking weather disasters with economic outcomes;
(c) Measures of sectoral vulnerability;
(d) Community-based disaster risk indices and community-based self-assessment.
G. Disaster loss/damage assessment
15. Closely related to vulnerability assessment is the narrower task of disaster loss/damage assessment. This takes place after a natural disaster occurs, and is intended to reveal the extent of losses, such as fatalities and economic losses, including insured and uninsured losses. In analysing economic losses, disaster loss/damage assessment potentially faces the same sorts of questions that concern ex ante CBA, such as how to include non-market effects, but in practice the scope of disaster loss/damage assessment has tended to focus more narrowly on market effects, even just insured losses. Damage assessment is often conducted as a rapid survey to inform responses such as humanitarian aid.
H. Climate change impacts, adaptation and vulnerability assessment
16. Recent years have witnessed the emergence of the specific application of appraisal and assessment techniques to climate change impacts and adaptation planning at multiple scales from the global to the local. Many of the examples of this are synthesized by Working Group II of the Intergovernmental Panel on Climate Change (e.g. in the Fourth Assessment Report). Like vulnerability assessment, there is a diversity of approaches within climate change impacts, adaptation and vulnerability assessment (CCIAV), the three main types being:
(a) Impact-based approaches, which evaluate the expected impacts of climate change and then identify adaptation options to reduce any resulting vulnerability;
(b) Adaptation-based and vulnerability-based approaches, which identify processes affecting vulnerability and adaptive capacity, normally independent of any

FCCC/TP/2013/2
65
specific future climate forecast. Therefore, such approaches can be understood as a specific application of vulnerability assessment as described above;
(c) Risk-management approaches, which focus directly on decision-making and offer a framework for incorporating all approaches as well as confronting uncertainty.
17. The impacts-based approach is a so-called ‘science-first’ or top-down framework, in that it takes a linear approach of from prediction to action. It begins by producing projections of changes in emissions and ends by exploring the economic and non-economic effects of a range of adaptation options. The use of integrated assessment models for CCIAV is therefore an example of such an approach.
18. Conversely, the adaptation-based, vulnerability-based and risk-management approaches are examples of ‘policy-first’ or bottom-up frameworks. A policy-first framework typically begins at the scale of the adaptation problem, specifying objectives and constraints, identifying viable adaptation strategies and only then assessing the desirability of these against a set of objectives and future projections.
19. While the conceptual differences between the approaches may not be so large, in practice it has been argued that policy-first approaches require much less information about the predicted impacts of climate change. In the end, some of this information turns out not to be of great significance for the vulnerability of the area under study (Ranger et al., 2010).