technical paper 10 u values and traditional buildings
TRANSCRIPT
Conservation Group
Technical Paper 10
U‐values and traditional buildings In situ measurements and their comparisons to calculated values
Dr. Paul Baker (Glasgow Caledonian University) January 2011
Historic Scotland Technical Paper 10
The views expressed in the research report(s), presented in this Historic Scotland Technical Paper, are those of the researchers, and do not necessarily represent those of Historic Scotland.
This paper is available as web publication on the Historic Scotland website:
www.historic‐scotland.gov.uk/technicalpapers
This paper should be quoted as ‘Historic Scotland Technical Paper 10’.
Acknowledgements We like to thank Crichton Development Company Ltd, The Great Stewart of Scotland’s Dumfries House Trust, Lister Housing Association, The National Trust for Scotland, Reidvale Housing Association, and all the private building owners for the opportunities to carry out measurements in their properties. We also like to thank the building occupiers who shared their homes for two weeks with measurement sensors and data loggers. We also like to thank Dr. Caroline Rye for her help in developing this research further.
Definitions U‐value (or thermal transmittance co‐efficient) is a measure of how much heat will pass through one square metre of a structure when the temperature on either side of the structure differs by 1 degree Celsius. The lower the U‐value, the better is the thermal performance of a structure. The U‐value is expressed in W/m2K.
Page I
Historic Scotland Technical Paper 10
U‐values and traditional buildings In situ measurements and their comparison to calculated values Contents Introduction by Historic Scotland …………………………………………………………………………… III Research report by Dr. Paul Baker, Glasgow Caledonian University ……………………………. VIII Executive summary Historic Scotland Technical Paper 10 provides the results of a thermal performance study of traditional building elements. The study focused on U‐values as an indicator of thermal performance, and involved their in situ measurements and the subsequent comparison with U‐values calculated with software programs, and with often used ‘default’ U‐values. The study was carried out from 2007 to 2010 by Dr. Paul Baker, Glasgow Caledonian University. U‐values are normally calculated with computer programs developed with present‐day non‐traditional construction in mind. Historic Scotland felt that the suitability of such programs when used to assess traditional buildings needed investigation, and therefore appointed GCU to carry out this study, the results of which will help construction professionals and assessors of energy building performance to make better informed and more balanced decisions when assessing and improving the energy performance of traditional buildings. For the study, 67 in situ U‐value measurements were carried out, mostly of uninsulated solid walls but, for comparison, some cavity walls, and building elements retrofitted with insulation, were also measured. The non‐invasive measurements were generally taken of building elements with their internal and external finishes intact. The study then compared the U‐values measured in situ with their calculated equivalents. A particular focus of the comparison was the impact of the lime‐and‐stone core of a traditional solid stonewall. The study found that software programs for U‐value calculations tend to overestimate U‐values of traditional building elements: traditional building elements tend to perform better thermally than would be expected from the U‐value calculations. The study suggests that the in situ measurement of U‐values is a useful tool which can aid in the assessment of the thermal performance of traditional building elements. The study recommends further research on the thermal properties of traditional building materials and construction components; improvement to U‐value calculations; and a standardised methodology for in situ measurements of U‐values.
Page II
Historic Scotland Technical Paper 10
Introduction Historic Scotland Technical Paper 10 provides the results of a thermal performance study of traditionally constructed building elements. The study focused on U‐values as an indicator of thermal performance, and involved their in situ measurements and the subsequent comparison with U‐values calculated with software programs, and with often used ‘default’ U‐values. The study was carried out from 2007 to 2010 by Dr. Paul Baker, Centre for Research on Indoor Climate & Health, Glasgow Caledonian University (GCU). U‐values are generally used to describe the thermal performance of building elements, and also form part of the base data used to assess the energy performance of whole buildings. U‐values are normally calculated with computer programs developed with present‐day non‐traditional construction in mind. Historic Scotland felt that the suitability of such programs when used to assess traditional buildings needed investigation, and therefore appointed GCU to carry out this study, the results of which will help construction professionals, and in particular assessors of energy building performance, to make better informed and more balanced decisions when assessing and improving the energy performance of traditional buildings. The study also provides recommendations on where further research is required. Some of the measurement results in this paper have already been presented in 2008 in Historic Scotland Technical Paper 2.1 Similar research has now also been carried out by Dr. Paul Baker, on behalf of English Heritage, assessing brick walls,2 and by Dr. Caroline Rye, on behalf of The Society for the Protection of Ancient Buildings (SPAB), measuring a variety of wall construction types.3 Historic Scotland has also published research on the thermal performance of windows.4 U‐values as heat flow indicators Protection from weather is a fundamental function of any building, and protection from wind and cold is of particular importance in a climate like Scotland’s. Heat is lost (and occasionally gained) through the building envelope, and heat flow (also referred to as heat transfer or thermal transmittance) occurs, to different degrees, in any structure. Heat flow can be measured, and subsequently expressed, as U‐value (or thermal transmittance co‐efficient) being the heat flow through one square metre of a structure when the temperature on either side of the structure differs by one degree Celsius. Therefore, the U‐value is dependent on the thermal conductivities of the building materials and their respective thicknesses. U‐values are commonly used to describe the thermal performance of building elements, and subsequently the overall energy performance of a building. Generally, U‐values are calculated with readily available software programs rather than measured in situ. Such calculations are normally carried out in order to show compliance with building standards requirements5 for new buildings, and for conversions of existing buildings, prior to construction or conversion.
Page III
Historic Scotland Technical Paper 10
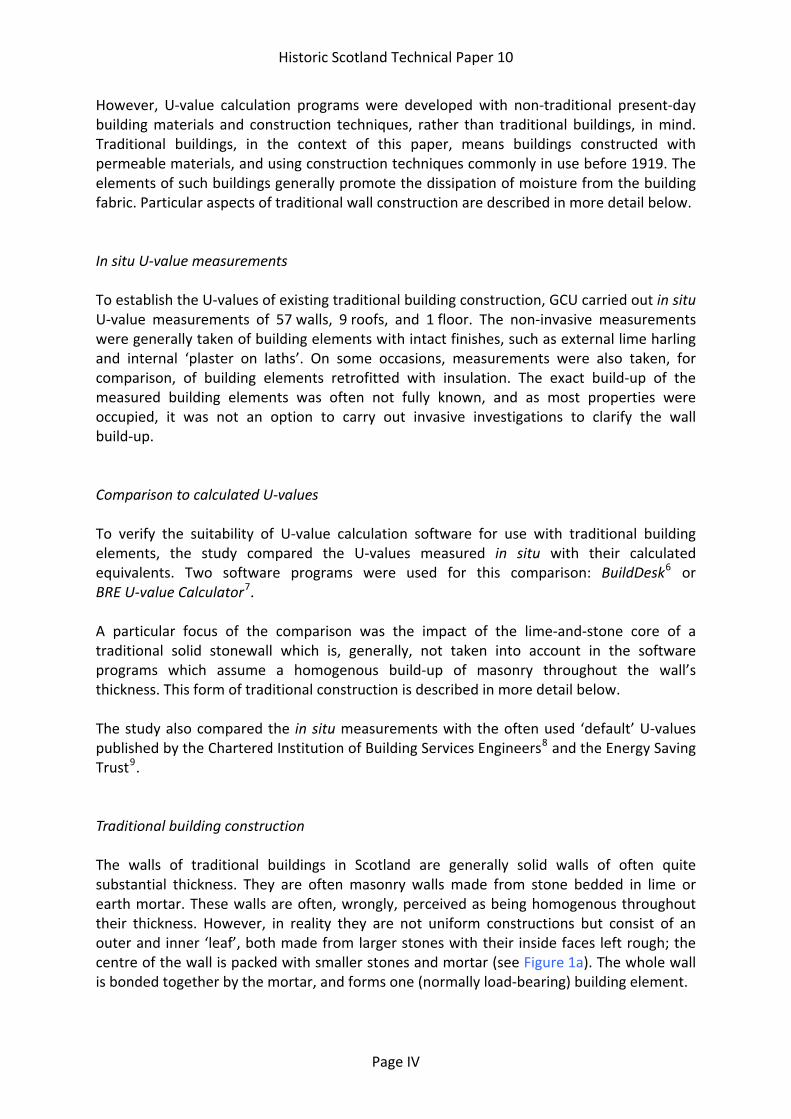
However, U‐value calculation programs were developed with non‐traditional present‐day building materials and construction techniques, rather than traditional buildings, in mind. Traditional buildings, in the context of this paper, means buildings constructed with permeable materials, and using construction techniques commonly in use before 1919. The elements of such buildings generally promote the dissipation of moisture from the building fabric. Particular aspects of traditional wall construction are described in more detail below. In situ U‐value measurements To establish the U‐values of existing traditional building construction, GCU carried out in situ U‐value measurements of 57 walls, 9 roofs, and 1 floor. The non‐invasive measurements were generally taken of building elements with intact finishes, such as external lime harling and internal ‘plaster on laths’. On some occasions, measurements were also taken, for comparison, of building elements retrofitted with insulation. The exact build‐up of the measured building elements was often not fully known, and as most properties were occupied, it was not an option to carry out invasive investigations to clarify the wall build‐up. Comparison to calculated U‐values To verify the suitability of U‐value calculation software for use with traditional building elements, the study compared the U‐values measured in situ with their calculated equivalents. Two software programs were used for this comparison: BuildDesk6 or BRE U‐value Calculator7. A particular focus of the comparison was the impact of the lime‐and‐stone core of a traditional solid stonewall which is, generally, not taken into account in the software programs which assume a homogenous build‐up of masonry throughout the wall’s thickness. This form of traditional construction is described in more detail below. The study also compared the in situ measurements with the often used ‘default’ U‐values published by the Chartered Institution of Building Services Engineers8 and the Energy Saving Trust9. Traditional building construction The walls of traditional buildings in Scotland are generally solid walls of often quite substantial thickness. They are often masonry walls made from stone bedded in lime or earth mortar. These walls are often, wrongly, perceived as being homogenous throughout their thickness. However, in reality they are not uniform constructions but consist of an outer and inner ‘leaf’, both made from larger stones with their inside faces left rough; the centre of the wall is packed with smaller stones and mortar (see Figure 1a). The whole wall is bonded together by the mortar, and forms one (normally load‐bearing) building element.
Page IV
Historic Scotland Technical Paper 10
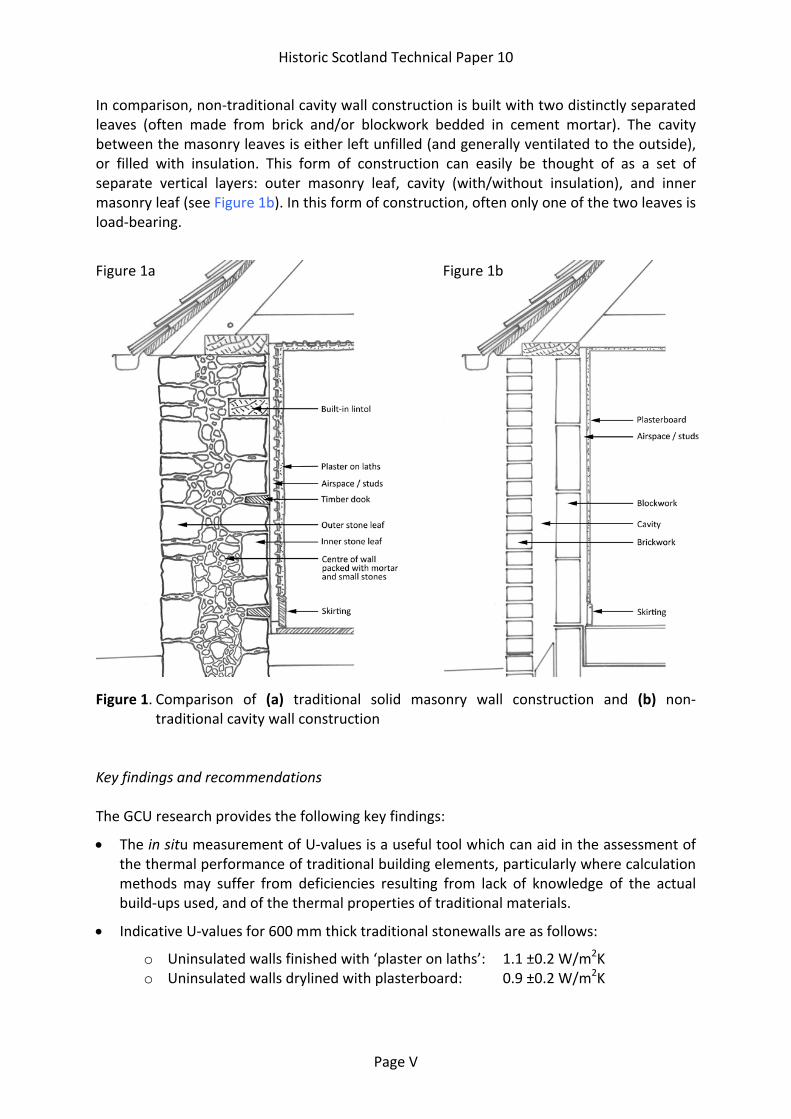
In comparison, non‐traditional cavity wall construction is built with two distinctly separated leaves (often made from brick and/or blockwork bedded in cement mortar). The cavity between the masonry leaves is either left unfilled (and generally ventilated to the outside), or filled with insulation. This form of construction can easily be thought of as a set of separate vertical layers: outer masonry leaf, cavity (with/without insulation), and inner masonry leaf (see Figure 1b). In this form of construction, often only one of the two leaves is load‐bearing.
Figure 1a Figure 1b Figure 1. Comparison of (a) traditional solid masonry wall construction and (b) non‐
traditional cavity wall construction Key findings and recommendations The GCU research provides the following key findings:
• The in situ measurement of U‐values is a useful tool which can aid in the assessment of the thermal performance of traditional building elements, particularly where calculation methods may suffer from deficiencies resulting from lack of knowledge of the actual build‐ups used, and of the thermal properties of traditional materials.
• Indicative U‐values for 600 mm thick traditional stonewalls are as follows:
o Uninsulated walls finished with ‘plaster on laths’: 1.1 ±0.2 W/m2K o Uninsulated walls drylined with plasterboard: 0.9 ±0.2 W/m2K
Page V
Historic Scotland Technical Paper 10
Page VI
• Generally, an increased wall thickness, and building materials of higher thermal resistance, results in a lower U‐value. However, careful consideration needs to be given to establish the actual build‐up of the building element as defective areas, building irregularities, ventilated cavities etc. can have a significant impact on the heat flux, at least locally.
• Walls with internal finishes which incorporate an (unventilated) air‐filled cavity, such as ‘plaster on laths’, drylining or timber lining, have lower U‐values than walls of the same thickness finished with ‘plaster on the hard’.
• Internal drylining and insulating of solid stonewalls can improve their thermal performance significantly.10 However, careful detailed and correct installation is essential, and issues of vapour transfer need to be taken into account.
• Software programs for U‐value calculations tend to overestimate U‐values of traditional building elements compared with the results from the in situ measurements. Traditional building elements tend to perform thermally better than would be expected from the U‐value calculations.
The GCU research provides the following key recommendations:
• Further research should be carried out to establish a better understanding of the thermal properties of traditional building materials and construction components.
• Baseline databases of U‐value calculation programs should be extended to include more data on traditional building materials, and allow for easier, and more user‐friendly, modelling of traditional construction techniques, such as solid stonewalls.
• A standardised methodology for in situ measurements of U‐values should be established to ensure that future measurement results are comparable.
1 Baker, P., 2008. In situ measurements in traditional buildings: preliminary results. (Historic Scotland Technical Paper 2) Edinburgh: Historic Scotland. Available at http://www.historic‐scotland.gov.uk/technicalpapers
2 The publication of Dr. Baker’s research report by English Heritage is expected in spring 2011.
3 Rye, C. (2010) The SPAB U‐value Report. London: The Society for the Protection of Ancient Buildings. Available at www.spab.org.uk
4 Historic Scotland has also tested the thermal performance of windows, and window glazing, and the results have been published as Historic Scotland Technical Papers 1 and 9:
Baker, P., 2008. Thermal performance of traditional windows. (Historic Scotland Technical Paper 1) Edinburgh: Historic Scotland. Available at www.historic‐scotland.gov.uk/technicalpapers
Heath, N., Baker, P. & Menzies, G. (2010) Slim‐profile double glazing: thermal performance and embodied energy. (Historic Scotland Technical Paper 9) Edinburgh: Historic Scotland. Available at www.historic‐scotland.gov.uk/technicalpapers
5 Guidance on U‐value requirements for new buildings, and for conversions of existing buildings, is available from the Building Standards Division of the Scottish Government, and from Historic Scotland:
Historic Scotland Technical Paper 10
Scottish Government, 2010. Building standards technical handbooks. Edinburgh: Scottish Government. Available at http://www.scotland.gov.uk/topics/built‐environment/building/building‐standards
Historic Scotland, 2007. Conversion of traditional buildings: application of the Scottish building standards. (Guide for Practitioners 6) Edinburgh: Historic Scotland. Available at http://www.historic‐scotland.gov.uk/conversionoftraditionalbuildings1and2.pdf
6 BuildDesk software by BuildDesk Ltd., Pencoed, Bridgend, CF35 6NY; more information about this program is available at http://www.builddesk.co.uk
7 BRE U‐value Calculator software by Building Research Establishment Ltd., Bucknalls Lane, Garston, Watford, WD25 9XX; more information about this program is available at http://projects.bre.co.uk/uvalues
8 Anderson, B., 2006. Thermal properties of building structures. In: The Chartered Institution of Building Services Engineers, 2006. CIBSE guide A: environmental design. 7th ed. London: CIBSE. Ch.3.
9 Energy Saving Trust, 2004. Scotland: assessing U‐values of existing housing. (Energy Efficiency Best Practice in Housing: CE84) London: Energy Saving Trust.
10 Historic Scotland is currently also researching options of internally retrofitted insulation which do not require the removal of existing wall finishes, such as ‘plaster on laths’.
Page VII
Historic Scotland Technical Paper 10
Page VIII
Research report
U‐values and traditional buildings In situ measurements and their comparison to calculated values
A research report by
Dr. Paul Baker Glasgow Caledonian University
January 2011

U‐values and traditional buildings In situ measurements and their comparison to calculated values Dr. Paul Baker
Centre for Research on Indoor Climate & Health School of the Built & Natural Environment Glasgow Caledonian University January 2011
Page 1
Contents
1. Introduction 3
2. Building descriptions 4
2.1 Buildings 4
2.2 Building elements 6
3. Monitoring and analysis procedures 9
3.1 Principles 9
3.2 Procedures 9
4. U‐value calculations 10
4.1 Assumptions for the U‐value calculations 10
5. Results and discussion 13
5.1 Uncertainties 13
5.2 Graphic presentation of measurement and calculation results 15
5.3 Discussion of in situ measurement results 20
5.4 Laboratory measurement on a Locharbriggs sandstone wall 23
5.5 Comparison of results from in‐situ measurements and calculated U‐values 24
5.6 Comparison to often quoted used U‐values 27
6. Conclusions 30
Appendix A Monitoring and analysis methodology 35
A.1 Monitoring 35
A.2 Data anaylsis 38
A.3 Error analysis 39
Appendix B References 41
Appendix C Building Datasheets 42
Acknowledgements
I thank Dr. Caroline Rye for her help in developing this research further, Carsten Hermann of Historic Scotland for fruitful technical discussions and his rigorous editing of this report, and Duncan McCormick and David Nicol for their assistance in carrying out the in situ measurements of the cavity walls as part of their undergraduate dissertations at GCU.
Page 2
1. Introduction This report summarises the results of a thermal performance study of traditionally constructed building elements. The study focused on U‐values as an indicator of thermal performance, and involved the in situ measurements of U‐values and their subsequent comparison with calculated U‐values1. The study was carried out from 2007 to 2010 by Dr. Paul Baker, Centre for Research on Indoor Climate & Health, Glasgow Caledonian University (GCU). The main objective of the study was to assess the actual thermal performance of traditional building elements in order to provide guidance for energy performance assessments. For the study, 70 in situ U‐value measurements of walls, roofs and a floor were carried out at 15 properties over three heating seasons between November 2007 and March 2010.2 The sample of properties used for the measurements mostly represents Scottish traditional construction techniques (e.g. solid wall construction). However, for comparison, some measurements of buildings with non‐traditional construction, namely cavity walls, have also been included in this study. Additional measurements were also made on a traditionally constructed sandstone wall in an environmental chamber at GCU, with and without a drylining. This report also presents the measurement and analysis procedures used to determine the in situ U‐values. Measurements were made of the heat flow directly through the building element using heat flux sensors mounted on internal surfaces, and of room and outdoor temperatures. Most measurements were taken in occupied properties, and therefore included external and internal wall finishes (in some occasions also including cavities behind such finishes). The U‐values, measured for the study, were subsequently compared with calculated U‐values using two standard software programs, BuildDesk and BRE U‐value Calculator, to assess the applicability of such programs when used for assessing traditional building construction. Both programs are commonly used as assessment tools for new buildings and conversions of existing building, to ensure compliance with the U‐value requirements of building standards. 1 Where the expressions ‘calculated U‐value’ and ‘U‐value calculation’ are used in this report, they refer to calculating U‐values ‐with software programs‐ using standardised assumptions for material characteristics. Results from actual in situ heat flux measurements are normally not used in such calculations. These calculations are, generally, carried out in accordance with the calculation methods set out in British Standard BS EN ISO 6946:1997 and the BRE publication Convention for U‐value calculations (Anderson, 2006a). The analysis of the in situ heat flux measurements for this study also require some ‘calculation’ to convert the measured heat flux results into U‐values. However, the term ‘calculation’ has been avoided in this context in order to not confuse such conversions with the U‐value calculation carried out with the standard software programs.
2 Some of these measurement results have already been published in Historic Scotland Technical Paper 2 (Baker, 2008).
Page 3
Furthermore, the measured U‐values were also compared with often used default U‐values and with the requirements of current building standards for new buildings, and for conversions of existing buildings. This report firstly describes the measured buildings and building elements. It then outlines the procedures for in situ heat flux measurements and their analysis and conversion into U‐values. These procedures are described in more detail in Appendix A. The report continues with listing the assumptions used for the U‐value calculations carried out with software programs. The report closes with a discussion of the results of the in situ measurements, and a comparison with calculated U‐value, and to the U‐value requirements of the building standards. Specific details of the buildings, building elements, measurement locations, and measurement results are presented in the form of datasheets in Appendix B. 2. Building descriptions In situ U‐value measurements were made of different building elements in a variety of buildings. The main focus of the measurements was on walls constructed with a range of materials and techniques. Some measurements were also made of roofs and floors. The building elements were measured including existing surface finishes.
Page 4
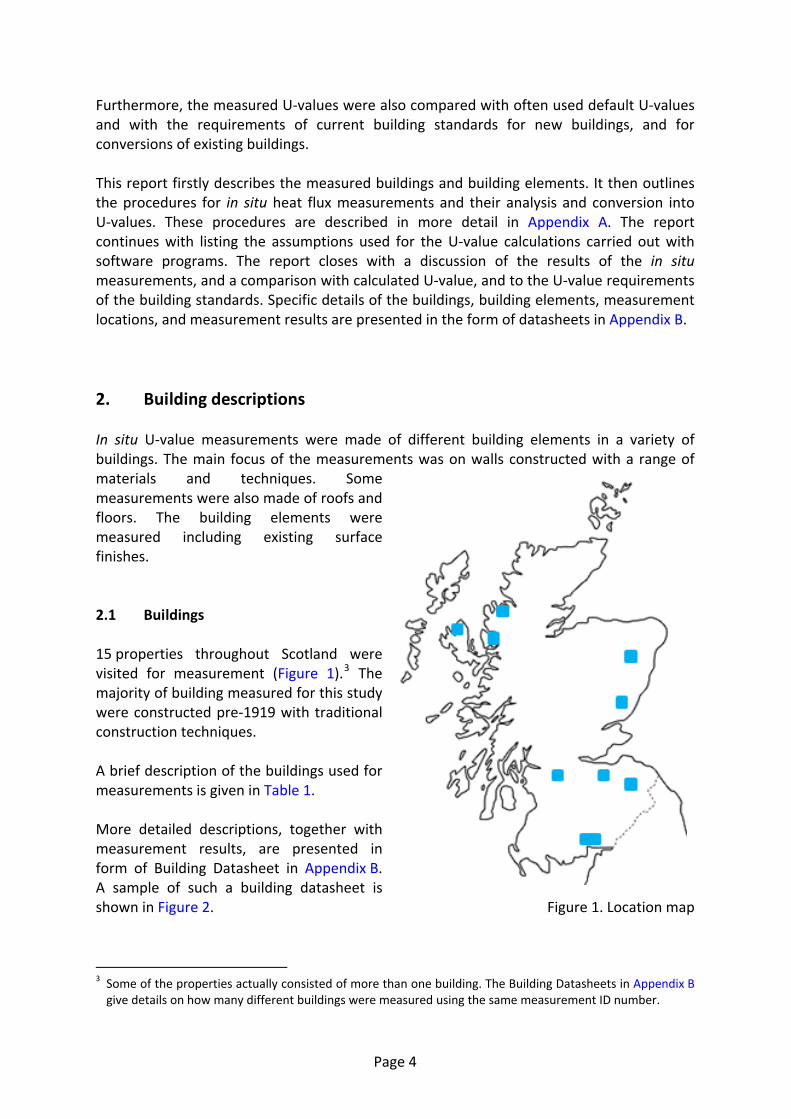
2.1 Buildings 15 properties throughout Scotland were visited for measurement (Figure 1).3 The majority of building measured for this study were constructed pre‐1919 with traditional construction techniques. A brief description of the buildings used for measurements is given in Table 1. More detailed descriptions, together with measurement results, are presented in form of Building Datasheet in Appendix B. A sample of such a building datasheet is shown in Figure 2. Figure 1. Location map
3 Some of the properties actually consisted of more than one building. The Building Datasheets in Appendix B give details on how many different buildings were measured using the same measurement ID number.
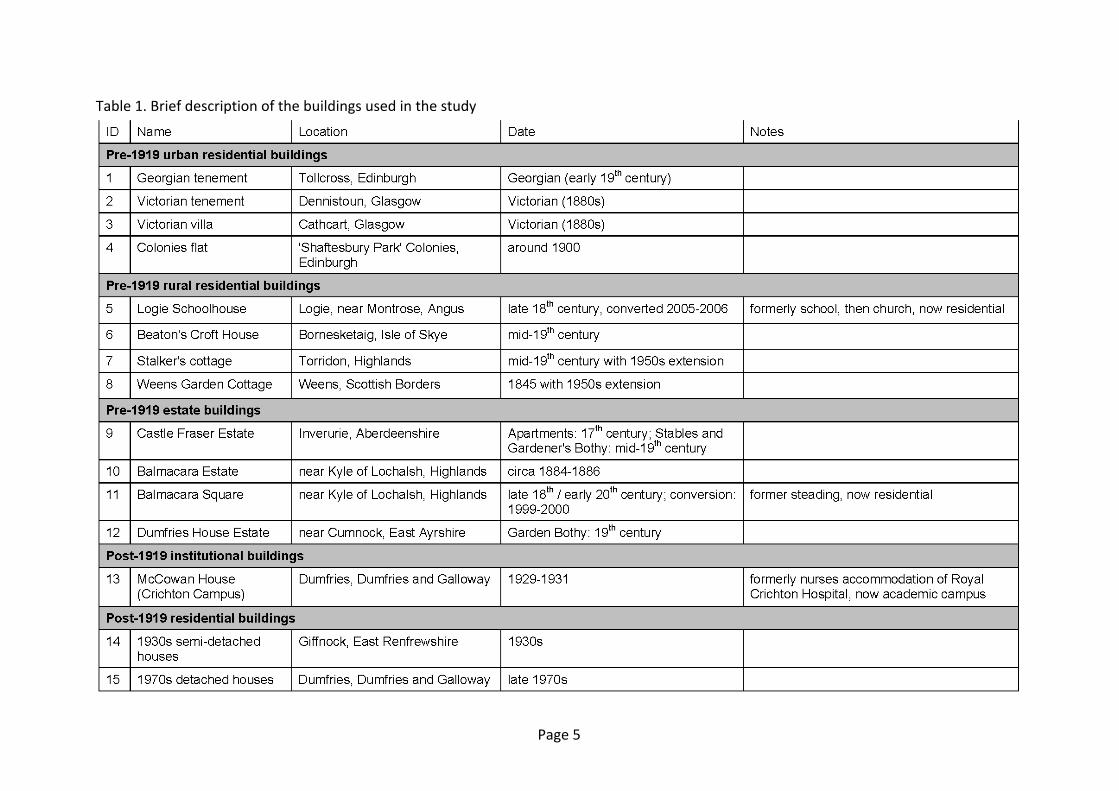
Table 1. Brief description of the buildings used in the study
Page 5
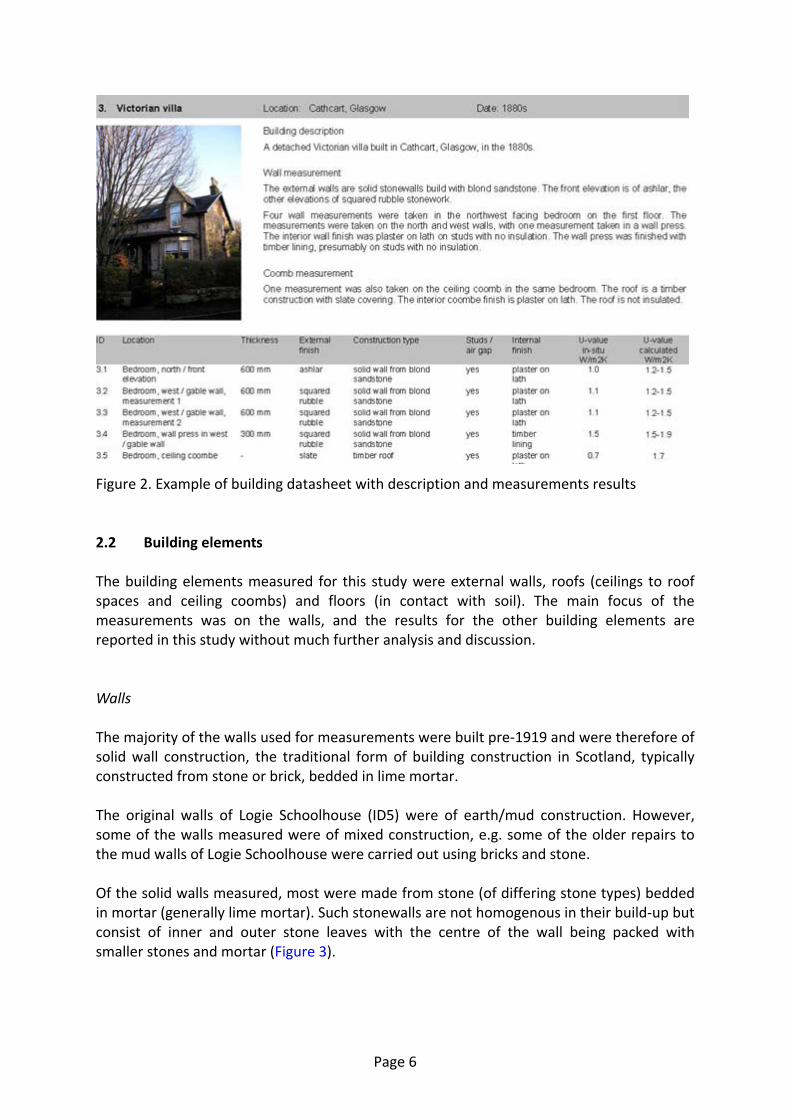
Figure 2. Example of building datasheet with description and measurements results 2.2 Building elements The building elements measured for this study were external walls, roofs (ceilings to roof spaces and ceiling coombs) and floors (in contact with soil). The main focus of the measurements was on the walls, and the results for the other building elements are reported in this study without much further analysis and discussion. Walls The majority of the walls used for measurements were built pre‐1919 and were therefore of solid wall construction, the traditional form of building construction in Scotland, typically constructed from stone or brick, bedded in lime mortar. The original walls of Logie Schoolhouse (ID5) were of earth/mud construction. However, some of the walls measured were of mixed construction, e.g. some of the older repairs to the mud walls of Logie Schoolhouse were carried out using bricks and stone. Of the solid walls measured, most were made from stone (of differing stone types) bedded in mortar (generally lime mortar). Such stonewalls are not homogenous in their build‐up but consist of inner and outer stone leaves with the centre of the wall being packed with smaller stones and mortar (Figure 3).
Page 6
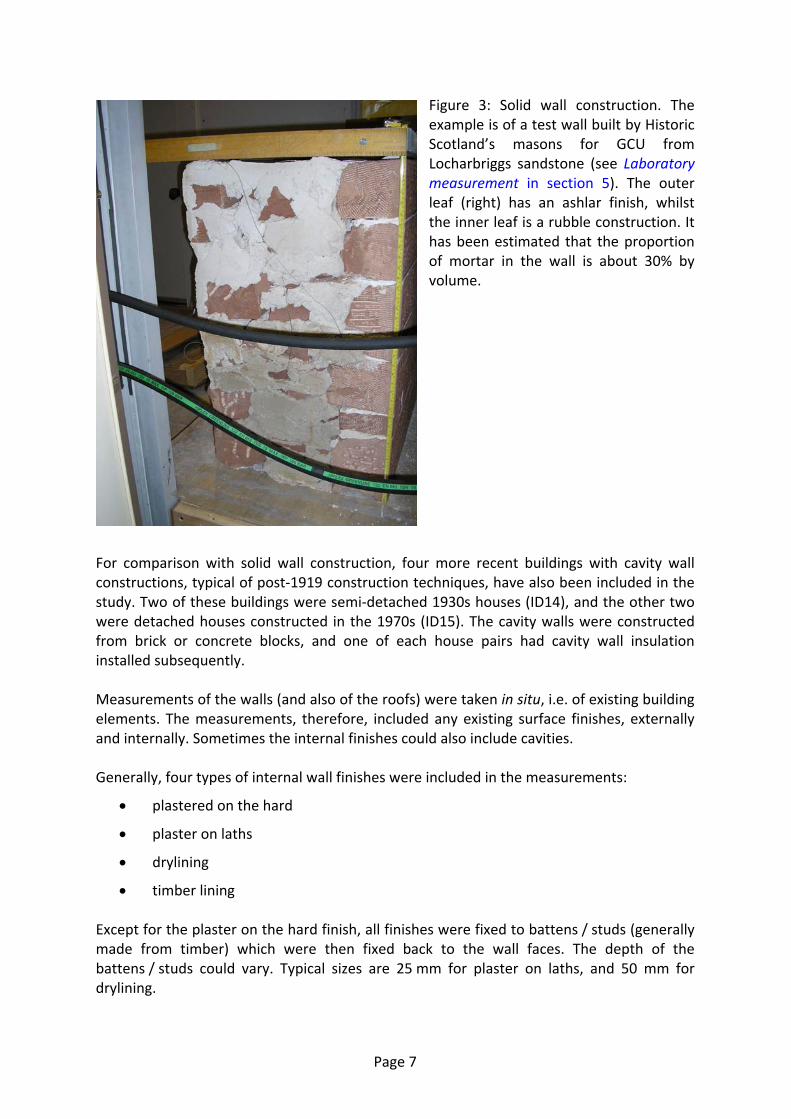
Figure 3: Solid wall construction. The example is of a test wall built by Historic Scotland’s masons for GCU from Locharbriggs sandstone (see Laboratory measurement in section 5). The outer leaf (right) has an ashlar finish, whilst the inner leaf is a rubble construction. It has been estimated that the proportion of mortar in the wall is about 30% by volume.
For comparison with solid wall construction, four more recent buildings with cavity wall constructions, typical of post‐1919 construction techniques, have also been included in the study. Two of these buildings were semi‐detached 1930s houses (ID14), and the other two were detached houses constructed in the 1970s (ID15). The cavity walls were constructed from brick or concrete blocks, and one of each house pairs had cavity wall insulation installed subsequently. Measurements of the walls (and also of the roofs) were taken in situ, i.e. of existing building elements. The measurements, therefore, included any existing surface finishes, externally and internally. Sometimes the internal finishes could also include cavities. Generally, four types of internal wall finishes were included in the measurements:
• plastered on the hard
• plaster on laths
• drylining
• timber lining Except for the plaster on the hard finish, all finishes were fixed to battens / studs (generally made from timber) which were then fixed back to the wall faces. The depth of the battens / studs could vary. Typical sizes are 25 mm for plaster on laths, and 50 mm for drylining.
Page 7
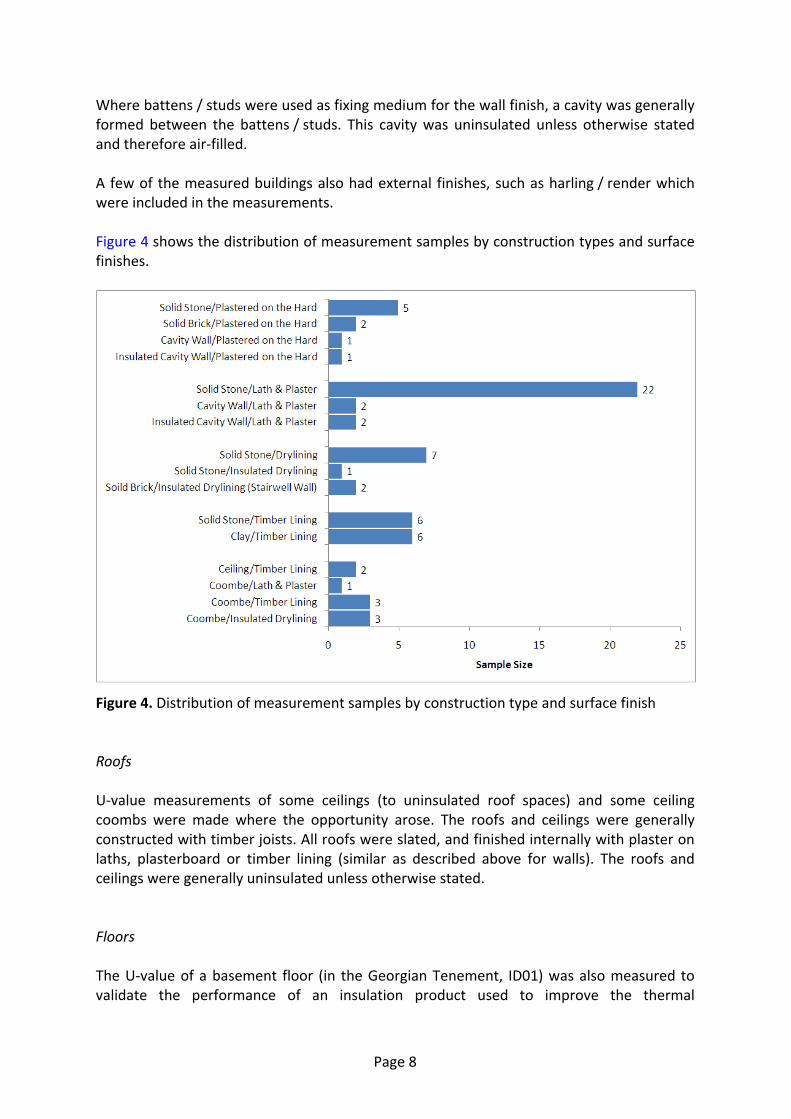
Where battens / studs were used as fixing medium for the wall finish, a cavity was generally formed between the battens / studs. This cavity was uninsulated unless otherwise stated and therefore air‐filled. A few of the measured buildings also had external finishes, such as harling / render which were included in the measurements. Figure 4 shows the distribution of measurement samples by construction types and surface finishes.
Figure 4. Distribution of measurement samples by construction type and surface finish Roofs U‐value measurements of some ceilings (to uninsulated roof spaces) and some ceiling coombs were made where the opportunity arose. The roofs and ceilings were generally constructed with timber joists. All roofs were slated, and finished internally with plaster on laths, plasterboard or timber lining (similar as described above for walls). The roofs and ceilings were generally uninsulated unless otherwise stated. Floors The U‐value of a basement floor (in the Georgian Tenement, ID01) was also measured to validate the performance of an insulation product used to improve the thermal
Page 8
performance in basement flats in the building as part of a refurbishment project (Changeworks, 2008). The flats had had their original solid floors removed in the 1970s as part of a previous refurbishment and replaced with concrete laid over aggregate. The in situ U‐value of the floor was measured before and after the addition of a sample of insulation. 3. Monitoring and analysis procedures 3.1 Principles The monitoring and analysis procedures have been developed during the first phase of the project (Baker, 2008) and similar projects with other organisations. The procedures are based on the principles of prEN 12494:1996 which are summarised below. The U‐value, or thermal transmittance, of a building element is defined in BS EN ISO 7345:1987 as the “heat flow rate in the steady state divided by the area and the temperature difference between the surroundings on each side of a system.” In the laboratory suitable steady state conditions can be achieved to determine the U‐value of a building element for standardised boundary conditions. However, during in situ measurements, the boundary conditions (temperature, wind velocity and solar radiation) change with time. It is therefore recommended that the surface‐to‐surface thermal resistance of the element is obtained by measuring the heat flow rate through the element and the surface temperatures on both sides of the element for a sufficiently long period of time to give a good estimate of the steady state from the mean values of the heat flow rate and temperatures. The U‐value can then be calculated by applying standardised surface heat transfer coefficients. This averaging approach is valid if the following conditions apply:
• the thermal properties of the materials in the element are constant over the range of temperature fluctuations;
• the change in the internal energy of the element is negligible if compared to the amount of heat going through the element.
An alternative is to use a dynamic method to account for the fluctuations in the heat flow and temperature in the recorded data. It is assumed that the element is sufficiently homogeneous or made of sufficiently homogeneous layers to use a heat flow meter. 3.2 Procedures The test and analysis procedures are summarised as follows and explained in greater detail in Appendix A.
Page 9
Actual measurements, recorded using one or more data loggers, were made over a period of at least two weeks of the heat flow through the internal surface of each wall, and of the internal and external temperatures. The measurement period was found to give a stable average U‐value (Baker, 2008) which takes into account the thermal inertia of the wall. Sensor locations were chosen to avoid probable thermal bridge locations near to windows and corners, with the heat flow sensor ideally located about half‐way between window and corner, and floor and ceiling. Where possible a North‐facing or sheltered elevation was selected to reduce the influence of solar radiation on the wall. If possible, both external air and surface temperatures were measured. 4. U‐value calculations The U‐values of building elements are estimated as part of any new‐build construction project by using software programs to show compliance with the U‐value requirements of building standards prior to start of construction. In this study the objective was to assess the suitability of such software to estimate the U‐values of traditional construction build‐ups. Such calculations may be used as part of a thermal performance assessment of a traditional building, for example, to aid in the choice of refurbishment options. BuildDesk U 3.44 and BRE U‐value Calculator5 software programs were used to calculate the U‐values of the building elements measured for this study. The software programs calculate U‐values in accordance with the Convention for U‐value calculations (Anderson 2006a) published by the Building Research Establishment (BRE). 4.1 Assumptions for the U‐value calculations The main assumptions made in order to model the build‐ups used for the calculations, allowing for the restrictions in the program’s database, are outlined below.
Masonry
The BuildDesk database provides only two options for stone types (sandstone and granite) which were used for the calculations. The software has the ability to calculate the effect of mortar joints in brick and block constructions, in accordance with Anderson (2006a), using the joint thickness and brick or block dimensions.
4 BuildDesk software by BuildDesk Ltd., Pencoed, Bridgend, CF35 6NY; more information about this program is available online at http://www.builddesk.co.uk
5 BRE U‐value Calculator software by Building Research Establishment Ltd., Bucknalls Lane, Garston, Watford, WD25 9XX; more information about this software is available online at http://projects.bre.co.uk/uvalues
Page 10
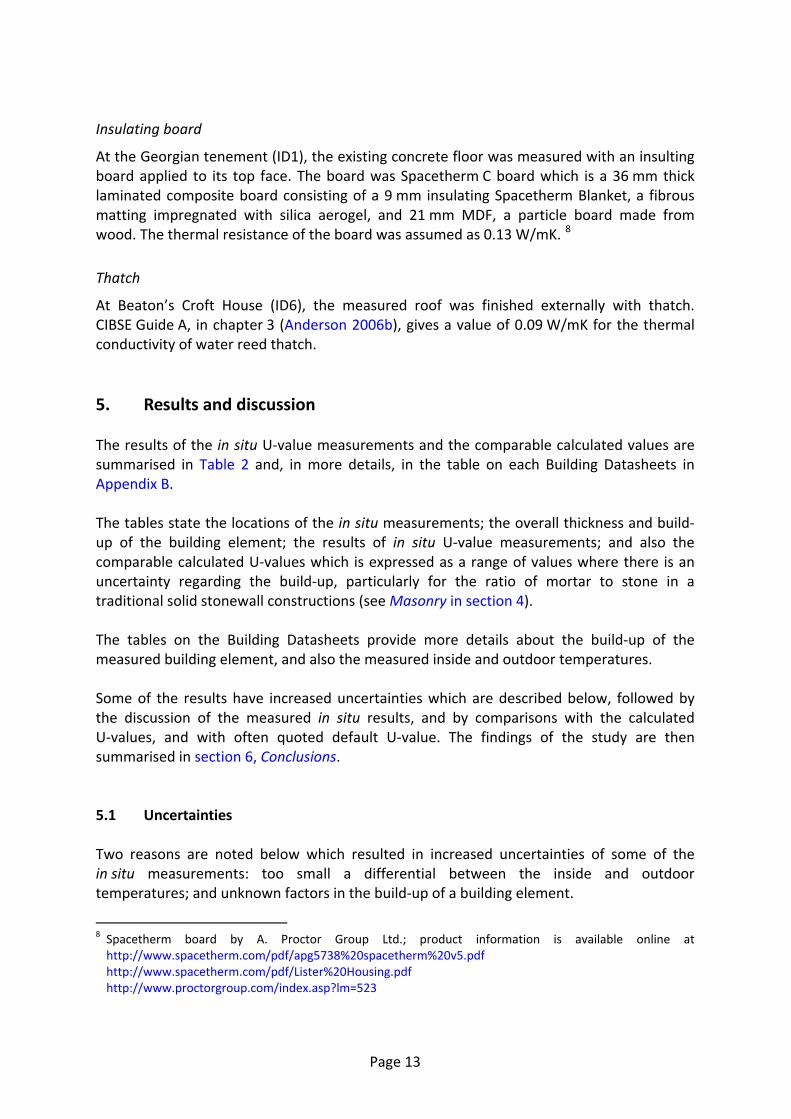
A rubble wall is somewhat different, since the wall is not a uniform construction with regular mortar joints. If the proportions of the constituents of the wall (stone, mortar and voids) are known or assumed from prior knowledge, the wall may be simply modelled as a multi‐layer build‐up. For example, Figure 5 represents a rubble wall with 60% stone and 40% mortar which can be modelled as two layers representing the correct proportions of the materials. However, it is likely that the proportions of stone, mortar and voids are unknown, without intervention, which is the case for the buildings in this study. The sandstone test wall (Figure 3) described in Baker et al. (2007) was inspected and found to consist of about 70% sandstone and 30% mortar. For calculation purposes a lower stone/mortar ratio of 60/40 was considered to be realistic with an upper limit of 100% stone assumed for the worst case. Figure 6 shows the effect of various assumed stone/mortar ratios on the calculated U‐value of a sandstone wall of an overall thickness of 600 mm including a 25 mm plaster on the hard finish. The difference between the U‐value calculated assuming 40% mortar and that assuming only sandstone is 30%.
Earth / mud walls
At Logie Schoolhouse (ID05) solid walls from earth / mud were measured. The East Anglia Earth Buildings Group suggests a thermal conductivity of 0.6 to 0.8 W/mK for this material.6
Plaster on laths
Plaster on laths was modelled as 25 mm layer of lime plaster with two widths of air cavity: 7 mm or 25 mm.
Timber linings
Timber linings were assumed to be 12.5 mm thick and modelled with two widths of air cavity behind, 7 mm and 25 mm, assuming that studs were used to fit the linings to the surface of the stonewall.
Multi‐foil insulations
At the Colonies Flat (ID4), a multi‐foil insulation had been used in an earlier roof refurbishment. The thermal resistance, or R‐value, of the layer was assumed to be 1.9 m2K/W as stated in a typical manufacturer’s datasheet which is equivalent to a thermal conductivity of 0.034 W/mK. 7
6 East Anglia Earth Buildings Group. Tech spec: clay lump wattle and daub. Available online at www.eartha.org.uk/Eartha‐TechSpec.pdf
7 Kontrol R1.9 multi‐foil insulation by Kontrol Building Insulation; the manufacturer’s information sheet is available online at www.kontrol‐insulation.com/uploads/resources/Kontrol_R19_4pp.pdf
Page 11
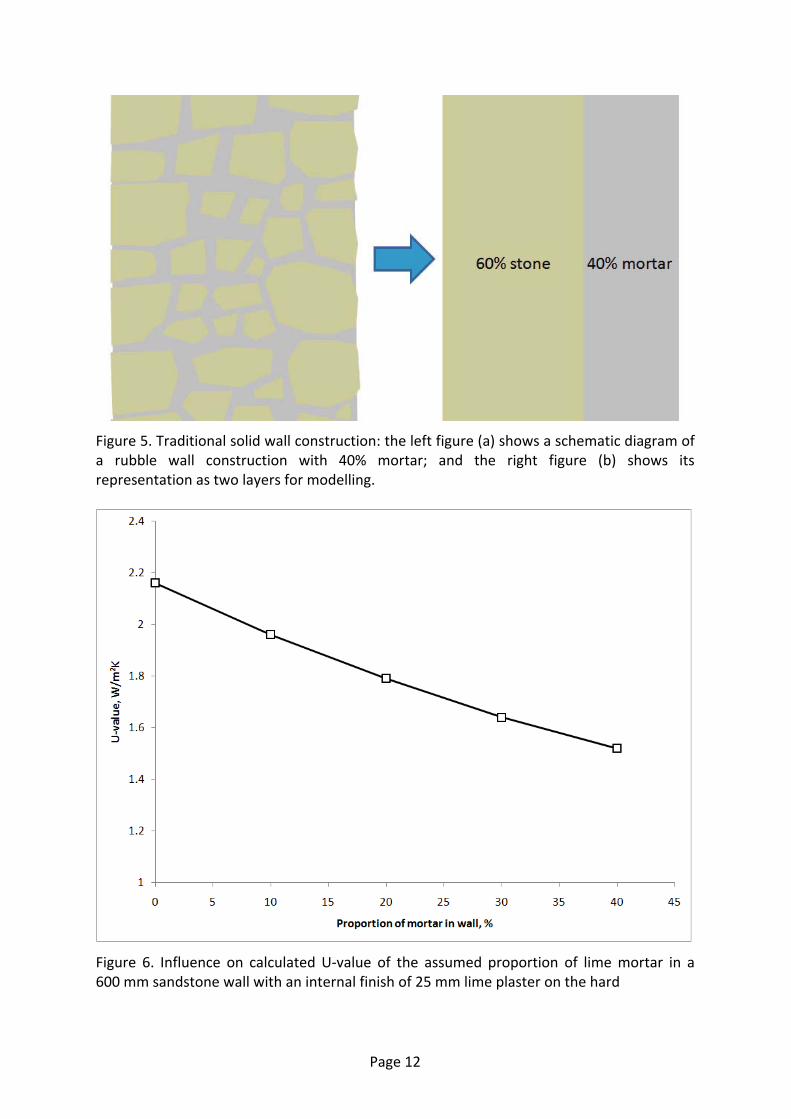
Figure 5. Traditional solid wall construction: the left figure (a) shows a schematic diagram of a rubble wall construction with 40% mortar; and the right figure (b) shows its representation as two layers for modelling.
Figure 6. Influence on calculated U‐value of the assumed proportion of lime mortar in a 600 mm sandstone wall with an internal finish of 25 mm lime plaster on the hard
Page 12
Insulating board
At the Georgian tenement (ID1), the existing concrete floor was measured with an insulting board applied to its top face. The board was Spacetherm C board which is a 36 mm thick laminated composite board consisting of a 9 mm insulating Spacetherm Blanket, a fibrous matting impregnated with silica aerogel, and 21 mm MDF, a particle board made from wood. The thermal resistance of the board was assumed as 0.13 W/mK. 8
Thatch
At Beaton’s Croft House (ID6), the measured roof was finished externally with thatch. CIBSE Guide A, in chapter 3 (Anderson 2006b), gives a value of 0.09 W/mK for the thermal conductivity of water reed thatch. 5. Results and discussion The results of the in situ U‐value measurements and the comparable calculated values are summarised in Table 2 and, in more details, in the table on each Building Datasheets in Appendix B. The tables state the locations of the in situ measurements; the overall thickness and build‐up of the building element; the results of in situ U‐value measurements; and also the comparable calculated U‐values which is expressed as a range of values where there is an uncertainty regarding the build‐up, particularly for the ratio of mortar to stone in a traditional solid stonewall constructions (see Masonry in section 4). The tables on the Building Datasheets provide more details about the build‐up of the measured building element, and also the measured inside and outdoor temperatures. Some of the results have increased uncertainties which are described below, followed by the discussion of the measured in situ results, and by comparisons with the calculated U‐values, and with often quoted default U‐value. The findings of the study are then summarised in section 6, Conclusions. 5.1 Uncertainties Two reasons are noted below which resulted in increased uncertainties of some of the in situ measurements: too small a differential between the inside and outdoor temperatures; and unknown factors in the build‐up of a building element.
8 Spacetherm board by A. Proctor Group Ltd.; product information is available online at http://www.spacetherm.com/pdf/apg5738%20spacetherm%20v5.pdf http://www.spacetherm.com/pdf/Lister%20Housing.pdf http://www.proctorgroup.com/index.asp?lm=523
Page 13
Uncertainty due to small temperature differential The following results have increased uncertainty due to the small temperature difference between the room and exterior:
• Georgian Tenement (ID01), uninsulated floor slab (However, for the measurement with insulation, a daily heating cycle was applied which gave sufficient variation in temperatures to produce a significant result.)
• Victorian Tenement (ID02), stairwell walls (The temperatures in the close / stairwell were similar to the room temperatures.)
• Logie Schoolhouse (ID05) (The building had been recently refurbished and was awaiting occupation by the new tenant, and was therefore not fully heated.)
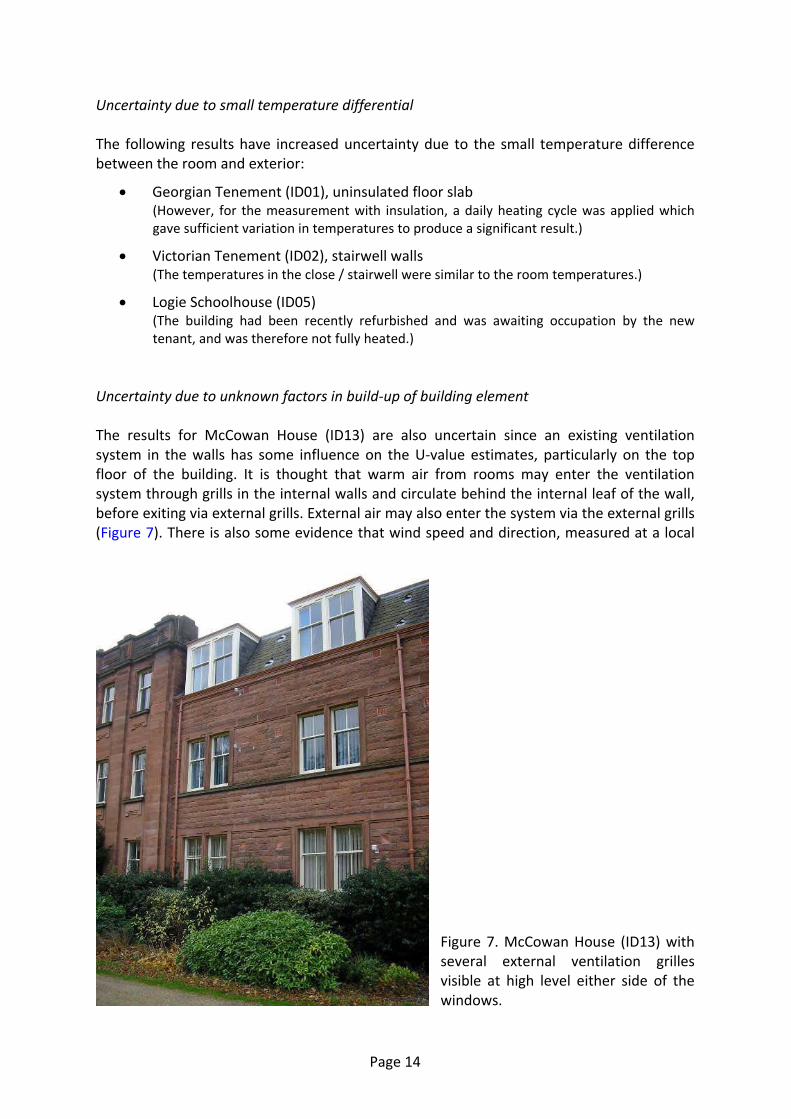
Uncertainty due to unknown factors in build‐up of building element The results for McCowan House (ID13) are also uncertain since an existing ventilation system in the walls has some influence on the U‐value estimates, particularly on the top floor of the building. It is thought that warm air from rooms may enter the ventilation system through grills in the internal walls and circulate behind the internal leaf of the wall, before exiting via external grills. External air may also enter the system via the external grills (Figure 7). There is also some evidence that wind speed and direction, measured at a local
Figure 7. McCowan House (ID13) with several external ventilation grilles visible at high level either side of the windows.
Page 14
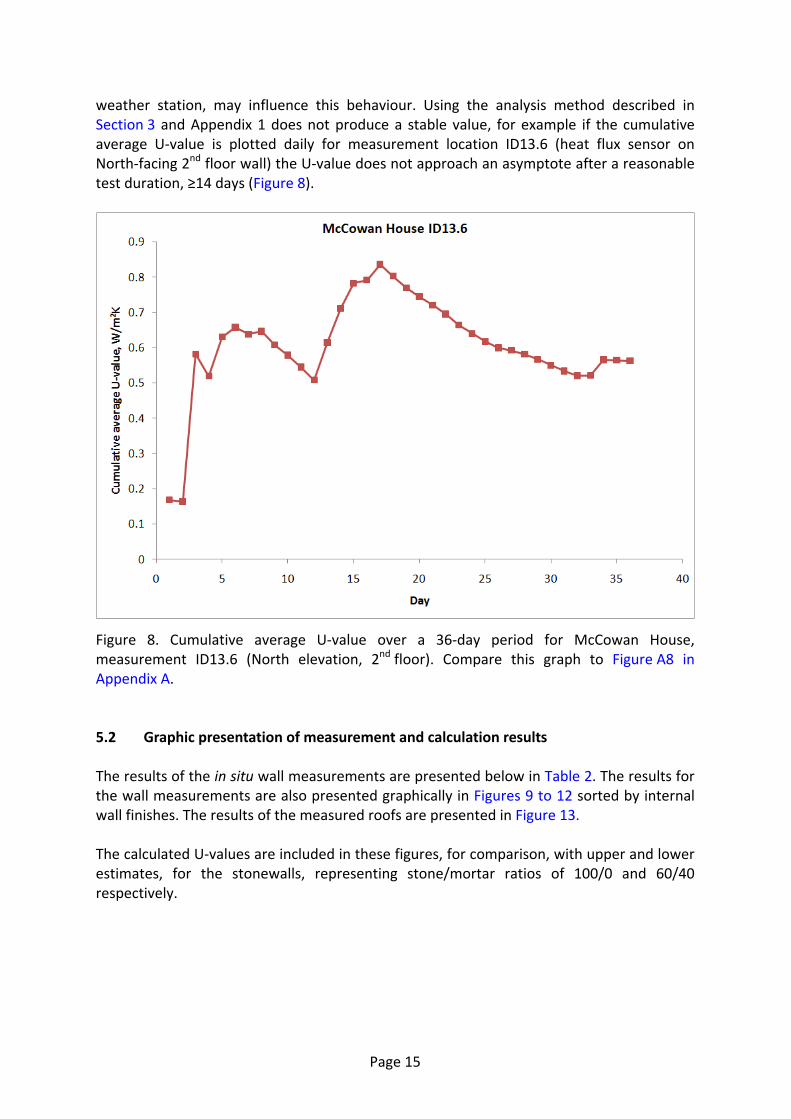
weather station, may influence this behaviour. Using the analysis method described in Section 3 and Appendix 1 does not produce a stable value, for example if the cumulative average U‐value is plotted daily for measurement location ID13.6 (heat flux sensor on North‐facing 2nd floor wall) the U‐value does not approach an asymptote after a reasonable test duration, ≥14 days (Figure 8).
Figure 8. Cumulative average U‐value over a 36‐day period for McCowan House, measurement ID13.6 (North elevation, 2nd floor). Compare this graph to Figure A8 in Appendix A. 5.2 Graphic presentation of measurement and calculation results The results of the in situ wall measurements are presented below in Table 2. The results for the wall measurements are also presented graphically in Figures 9 to 12 sorted by internal wall finishes. The results of the measured roofs are presented in Figure 13. The calculated U‐values are included in these figures, for comparison, with upper and lower estimates, for the stonewalls, representing stone/mortar ratios of 100/0 and 60/40 respectively.
Page 15
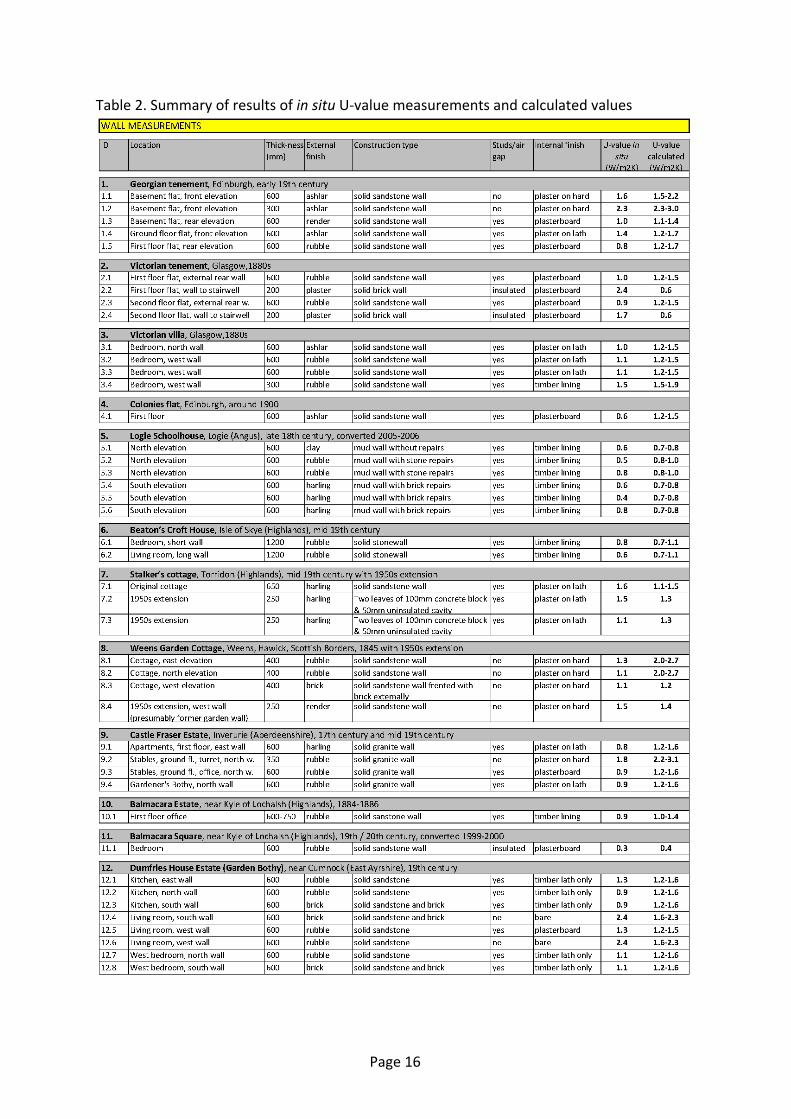
Table 2. Summary of results of in situ U‐value measurements and calculated values
Page 16
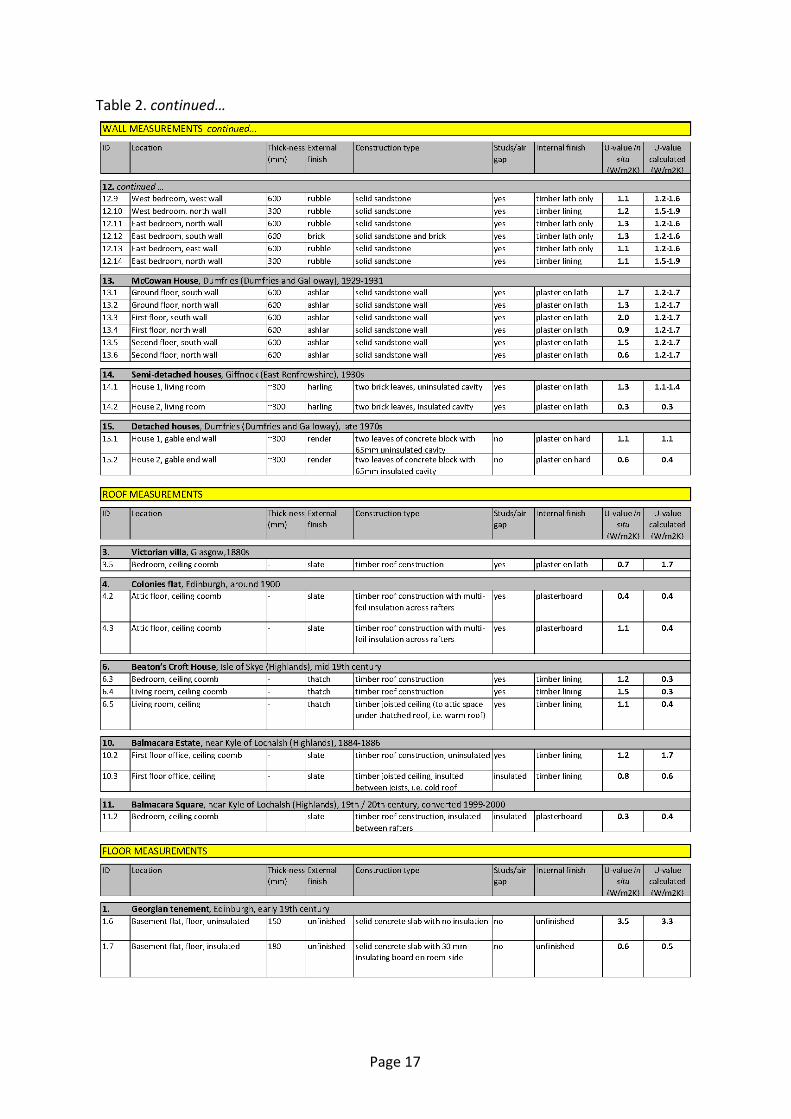
Table 2. continued…
Page 17
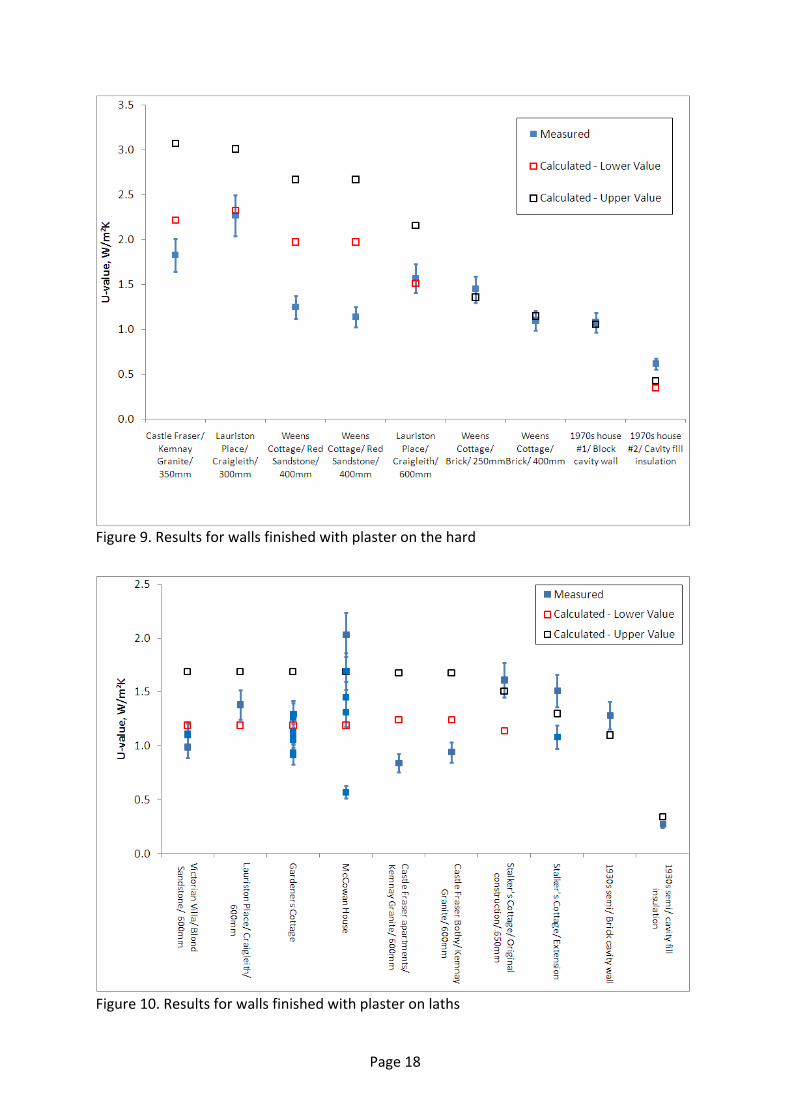
Figure 9. Results for walls finished with plaster on the hard
Figure 10. Results for walls finished with plaster on laths
Page 18
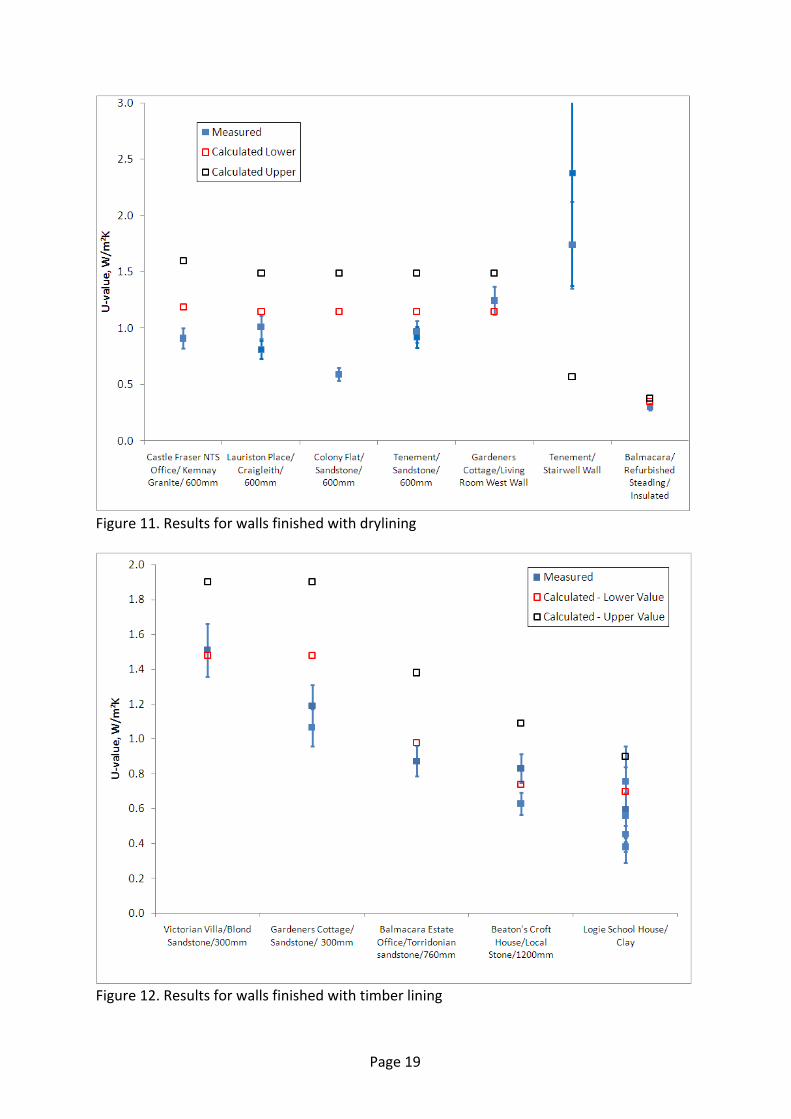
Figure 11. Results for walls finished with drylining
Figure 12. Results for walls finished with timber lining
Page 19
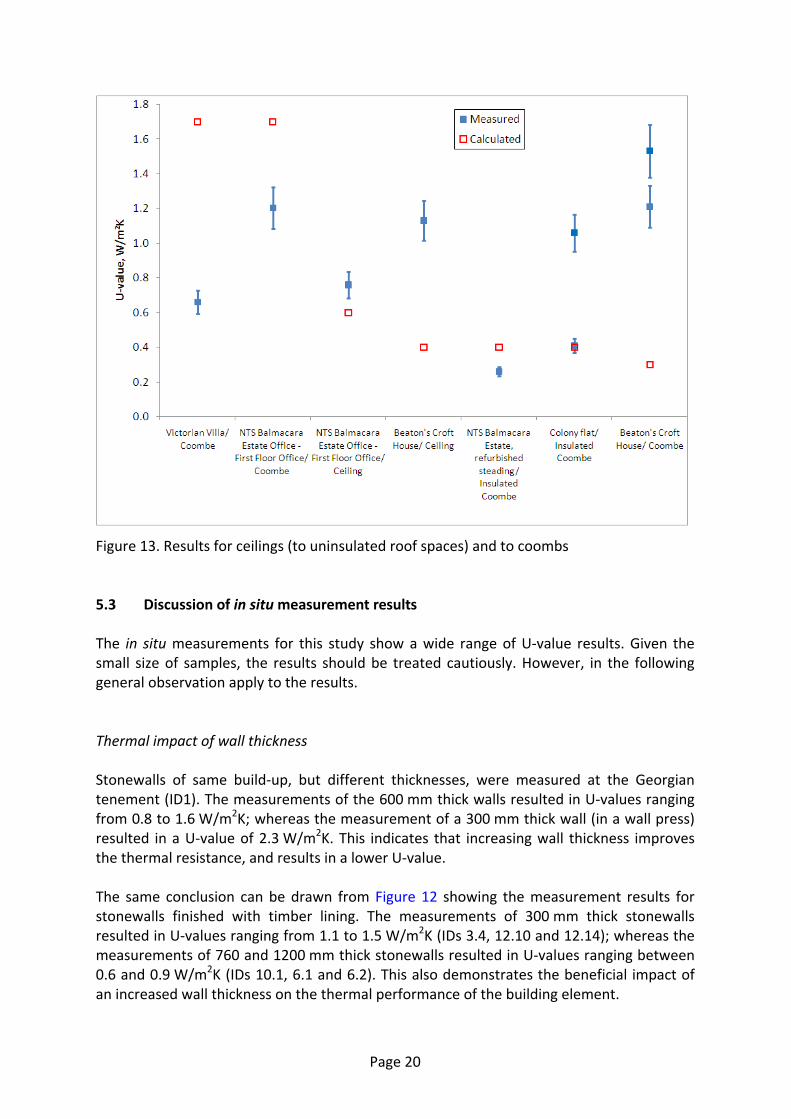
Figure 13. Results for ceilings (to uninsulated roof spaces) and to coombs 5.3 Discussion of in situ measurement results The in situ measurements for this study show a wide range of U‐value results. Given the small size of samples, the results should be treated cautiously. However, in the following general observation apply to the results. Thermal impact of wall thickness Stonewalls of same build‐up, but different thicknesses, were measured at the Georgian tenement (ID1). The measurements of the 600 mm thick walls resulted in U‐values ranging from 0.8 to 1.6 W/m2K; whereas the measurement of a 300 mm thick wall (in a wall press) resulted in a U‐value of 2.3 W/m2K. This indicates that increasing wall thickness improves the thermal resistance, and results in a lower U‐value. The same conclusion can be drawn from Figure 12 showing the measurement results for stonewalls finished with timber lining. The measurements of 300 mm thick stonewalls resulted in U‐values ranging from 1.1 to 1.5 W/m2K (IDs 3.4, 12.10 and 12.14); whereas the measurements of 760 and 1200 mm thick stonewalls resulted in U‐values ranging between 0.6 and 0.9 W/m2K (IDs 10.1, 6.1 and 6.2). This also demonstrates the beneficial impact of an increased wall thickness on the thermal performance of the building element.
Page 20
Thermal impact of wall finishes with air‐filled cavities At the Georgian tenement (ID1), measurements were carried out of solid stonewalls of similar build‐up and thickness (600 mm) but with different internal wall finishes. The measurement of the wall finished with plaster on the hard resulted in a U‐value of 1.6 W/m2K; the measurement of the wall finished with plaster on laths was 1.4 W/m2K; and the measurements of two walls finished with drylining (plasterboard) were 0.8 and 1.0 W/m2K. This demonstrates the insulating effect of an air cavity behind a plaster on laths and a drylined wall finish. Similarly the measurement results for the Garden Bothy of the Dumfries House Estate (ID12) show a range of values depending on internal surface finish. Here 600 mm thick solid stonewalls finished with plaster on laths, in nine locations, and drylining in one measurement location resulted in U‐values ranging between 0.9 and 1.3 W/m2K; whereas the measurement of the same wall without any finishes, i.e. with a bare wall face, resulted in a U‐value of 2.4 W/m2K. In two locations, a thinner wall section (300 mm) was measured which included a timber‐lined finish: this resulted in U‐values of 1.1 and 1.2 W/m2K which is similar to the results for walls finished with plaster on laths with greater thickness (600 mm), possibly due to the higher thermal resistance of timber compared to lime plaster. Other walls finished internally with timber lining also produced results in the lower range of U‐values found in the study: Balmacara Estate office (ID10) with 600 to 750 mm thick solid stonewall 0.9 W/m2K; Beaton’s Croft House (ID6) with 1200 mm thick stonewalls 0.6‐0.8 W/m2K; and Logie School House (ID5) with 600 mm mud walls an average value of 0.6 W/m2K. In these cases either the benefits of greater wall thickness (ID6 and ID10) or lower material thermal conductivity (ID5) combine with those of the timber lining. Indicative U‐values for stonewalls finished with plaster on laths or drylining Given the range of wall materials, thicknesses and finishes measured, the two categories of wall which showed some general consistency were 600 mm thick traditional stonewalls which were (a) finished with plaster on laths (excluding the McCowan House results, ID13), and (b) drylined with plasterboard (without insulation). These two categories resulted in U‐values as follows.
• Walls finished with plaster on laths: 1.1 ±0.2 W/m2K
• Walls finished with drylining: 0.9 ±0.2 W/m2K Thermal impact of cavity wall insulation Cavity walls with and without insulation were measured at the pairs of 1930s semi‐detached houses (ID14), and of 1970s detached houses (ID15). In both pairs, one building still had the cavity unfilled, whereas in the other building the cavity had been retrofitted with blown‐in cavity fill insulation. For ID14, the measurements of the retrofitted wall resulted in a U‐value of 0.3 W/m2K (compared to 1.3 W/m2K when uninsulated); and for
Page 21
ID15, the U‐value of the retrofitted wall was 0.6 W/m2K (compared to 1.1 W/m2K). This is equivalent to U‐value reductions by 76% and 45% respectively. Thermal impact of internal drylining and insulating of walls A solid stonewall drylined internally with insulation was measured at the Balmacara Square steading conversion (ID11). The walls were 600 mm thick, and had, when the conversion was being carried out, been drylined with plasterboard and insulation fitted between the studs. The measurement of the insulated wall resulted in a U‐value of 0.3 W/m2K. Unfortunately, there was no opportunity to measure the same wall build‐up either in its bare state or without insulation. But the result could be compared to the above‐stated indicative U‐values of 0.9 and 1.1 W/m2K (for walls with plaster on laths and drylining respectively). Thermal impact of walling material At Logie Schoolhouse (ID5), measurements were taken of 600 mm thick solid walls constructed from earth/mud. (However, only one measurement, ID5.1, was actually of a pure earth/mud construction; in all other measurement locations, the external wall face had been repaired with either brick or stone.) The wall measurements, which included internal timber‐lined finishes, resulted in U‐values ranging between 0.4 and 0.8 W/m2K. This is significantly better than solid walls of similar thickness but constructed from stone (e.g. Georgian tenement (ID1) with U‐values between 0.8 to 1.6 W/m2K; Victorian tenement (ID2) with U‐values of 0.9 and 1.0 W/m2K; or the Garden Bothy of the Dumfries House Estate (ID12) with U‐values between 0.9 and 1.3 W/m2K). However, none of these comparative values were of wall with a timber‐lined wall finish, but all were of wall finished internally either with drylining or plaster on laths. Nonetheless, all three types of internal finishes incorporate air‐filled cavities, although of potentially different thicknesses. The very low U‐value results for Logie Schoolhouse indicate the higher thermal resistance of a (at least partial) earth/mud wall compared to walls constructed from other walling materials. This obviously relates to the higher thermal resistance of 0.6 to 0.8 W/mK for earth/mud (see Earth/mud walls in section 4) compared to 1.8 W/mK for sandstone (Anderson (2006a), table 3.47). Results of roof measurements The measurement results of roofs, i.e. ceilings to uninsulated attic spaces and ceiling coombs, show a range of U‐values depending on the construction type and build‐up of the building element. The results in the refurbished loft in the Colony Flat (ID4) show a significant difference between the two measurement locations: 0.4 and 1.1 W/m2K. (A thermal imaging survey is recommended to assess the integrity of the insulation in the coomb of the loft.)
Page 22
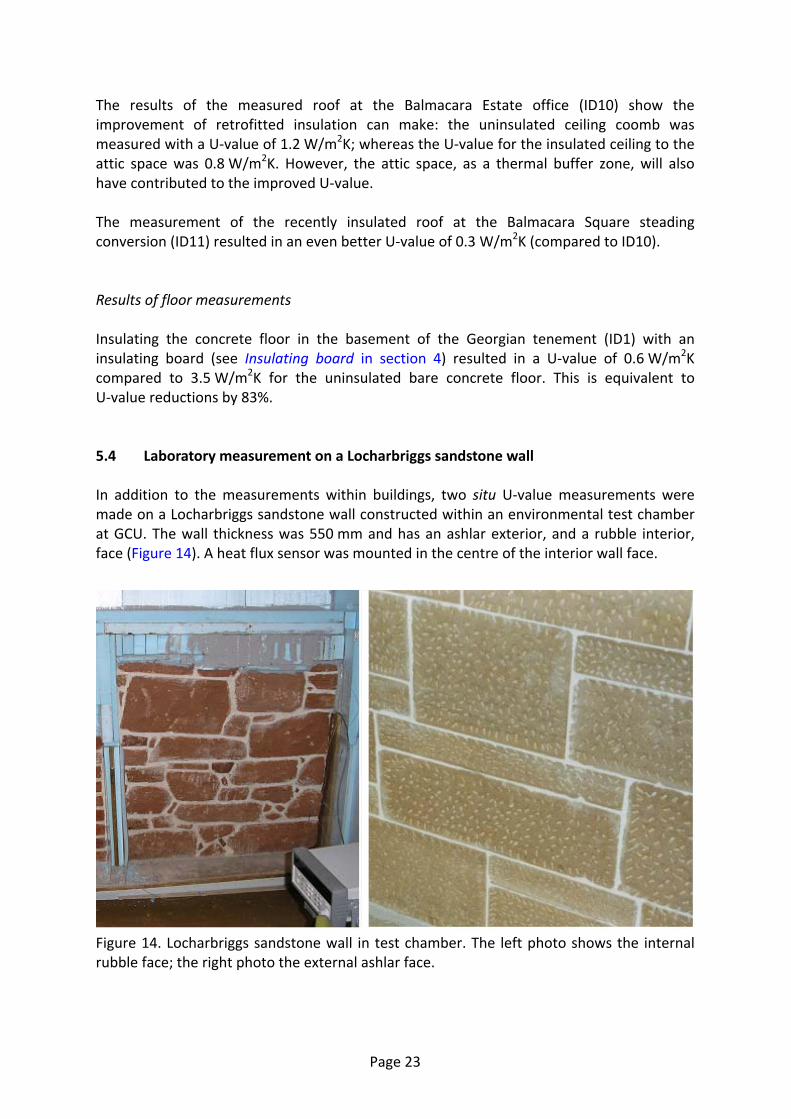
The results of the measured roof at the Balmacara Estate office (ID10) show the improvement of retrofitted insulation can make: the uninsulated ceiling coomb was measured with a U‐value of 1.2 W/m2K; whereas the U‐value for the insulated ceiling to the attic space was 0.8 W/m2K. However, the attic space, as a thermal buffer zone, will also have contributed to the improved U‐value. The measurement of the recently insulated roof at the Balmacara Square steading conversion (ID11) resulted in an even better U‐value of 0.3 W/m2K (compared to ID10). Results of floor measurements Insulating the concrete floor in the basement of the Georgian tenement (ID1) with an insulating board (see Insulating board in section 4) resulted in a U‐value of 0.6 W/m2K compared to 3.5 W/m2K for the uninsulated bare concrete floor. This is equivalent to U‐value reductions by 83%. 5.4 Laboratory measurement on a Locharbriggs sandstone wall In addition to the measurements within buildings, two situ U‐value measurements were made on a Locharbriggs sandstone wall constructed within an environmental test chamber at GCU. The wall thickness was 550 mm and has an ashlar exterior, and a rubble interior, face (Figure 14). A heat flux sensor was mounted in the centre of the interior wall face. Figure 14. Locharbriggs sandstone wall in test chamber. The left photo shows the internal rubble face; the right photo the external ashlar face.
Page 23
Temperatures of 23°C on the warm side and 8°C on the cold side of the wall were maintained. The U‐value was determined from 10 days data which are sufficient under steady conditions. Following the test on the solid wall, timber studs were fixed to the sides of the wall and a sheet of plasterboard added. The cavity formed was sealed off. A second heat flux sensor was mounted on the plasterboard. The U‐value of the wall was re‐measured with the plasterboard finish. The results of the wall measurements were as follows:
• bare 550 mm thick sandstone wall 1.4 ±0.1 W/m2K
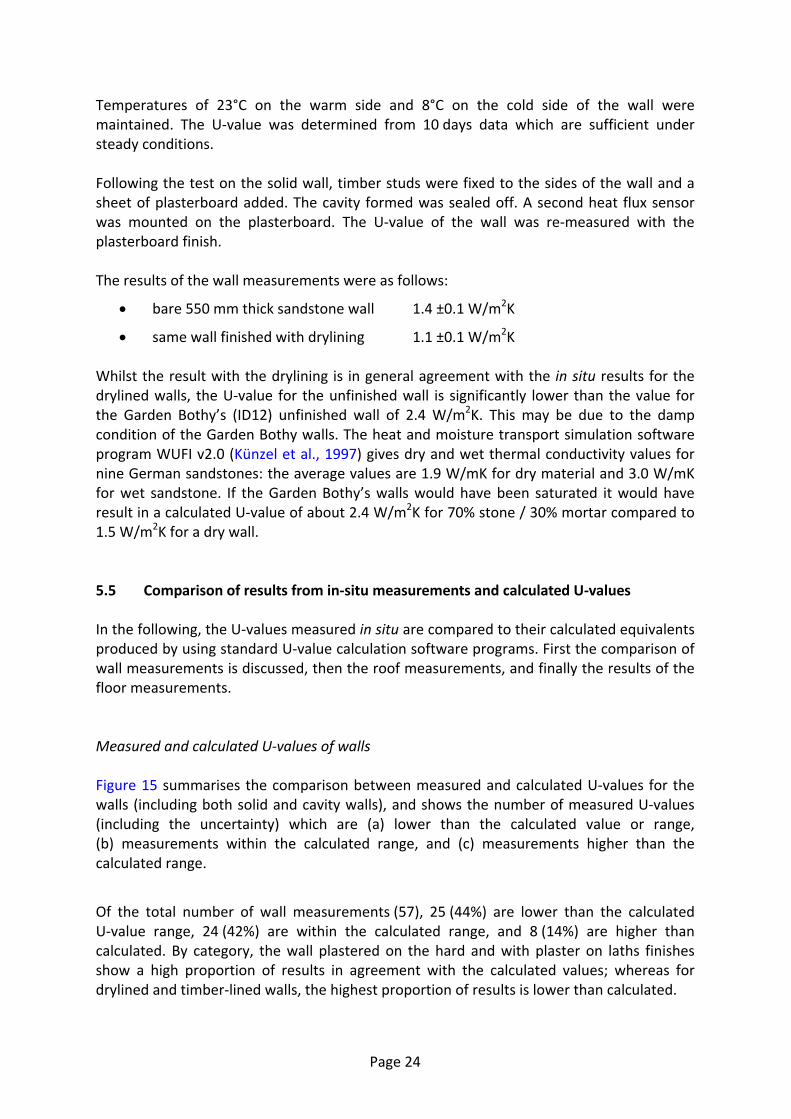
• same wall finished with drylining 1.1 ±0.1 W/m2K Whilst the result with the drylining is in general agreement with the in situ results for the drylined walls, the U‐value for the unfinished wall is significantly lower than the value for the Garden Bothy’s (ID12) unfinished wall of 2.4 W/m2K. This may be due to the damp condition of the Garden Bothy walls. The heat and moisture transport simulation software program WUFI v2.0 (Künzel et al., 1997) gives dry and wet thermal conductivity values for nine German sandstones: the average values are 1.9 W/mK for dry material and 3.0 W/mK for wet sandstone. If the Garden Bothy’s walls would have been saturated it would have result in a calculated U‐value of about 2.4 W/m2K for 70% stone / 30% mortar compared to 1.5 W/m2K for a dry wall. 5.5 Comparison of results from in‐situ measurements and calculated U‐values In the following, the U‐values measured in situ are compared to their calculated equivalents produced by using standard U‐value calculation software programs. First the comparison of wall measurements is discussed, then the roof measurements, and finally the results of the floor measurements. Measured and calculated U‐values of walls Figure 15 summarises the comparison between measured and calculated U‐values for the walls (including both solid and cavity walls), and shows the number of measured U‐values (including the uncertainty) which are (a) lower than the calculated value or range, (b) measurements within the calculated range, and (c) measurements higher than the calculated range.
Of the total number of wall measurements (57), 25 (44%) are lower than the calculated U‐value range, 24 (42%) are within the calculated range, and 8 (14%) are higher than calculated. By category, the wall plastered on the hard and with plaster on laths finishes show a high proportion of results in agreement with the calculated values; whereas for drylined and timber‐lined walls, the highest proportion of results is lower than calculated.
Page 24
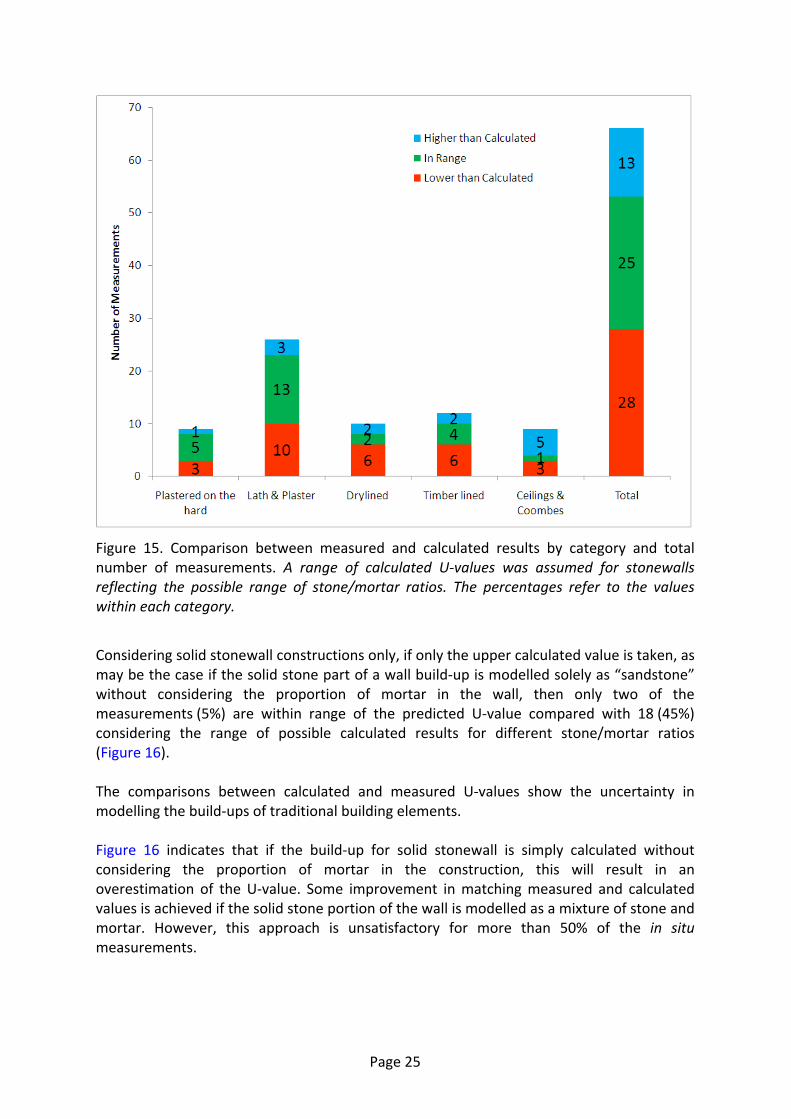
Figure 15. Comparison between measured and calculated results by category and total number of measurements. A range of calculated U‐values was assumed for stonewalls reflecting the possible range of stone/mortar ratios. The percentages refer to the values within each category.
Considering solid stonewall constructions only, if only the upper calculated value is taken, as may be the case if the solid stone part of a wall build‐up is modelled solely as “sandstone” without considering the proportion of mortar in the wall, then only two of the measurements (5%) are within range of the predicted U‐value compared with 18 (45%) considering the range of possible calculated results for different stone/mortar ratios (Figure 16). The comparisons between calculated and measured U‐values show the uncertainty in modelling the build‐ups of traditional building elements. Figure 16 indicates that if the build‐up for solid stonewall is simply calculated without considering the proportion of mortar in the construction, this will result in an overestimation of the U‐value. Some improvement in matching measured and calculated values is achieved if the solid stone portion of the wall is modelled as a mixture of stone and mortar. However, this approach is unsatisfactory for more than 50% of the in situ measurements.
Page 25
Figure 16. Comparison between measured and calculated results by category and total number of measurements for solid stonewall constructions only. ”Upper limit” categories represent the calculated U‐values for stonewalls modelled as internal finish and stone without allowance for mortar. ”Range” categories represent the possible range of calculated values for stone/mortar ratios between 60/40 to 100/0.
In order to better model the wall build‐ups, more information about the construction details are required, for example as follows:
• Thickness of layers
• Status of cavities (such as insulated/uninsulated and ventilated/unventilated)
• Ratio and types of stone and mortar (and voids) in solid stonewalls
• Thermal properties of materials used in traditional construction (such as local stone types, historic brick, earth/mud walls, traditional plasters and mortars)
It is recommended that further research is carried out to establish more accurate U‐values for the above listed materials / construction components to allow more accurate thermal assessment of traditional building elements.
Page 26
Measured and calculated U‐values of roofs The comparison of measured and calculated U‐values present a mixed picture. Ceilings and coombs (Figure 16) showed a high proportion of calculated U‐values indicating that the build‐up should perform better than the in situ result. Ceilings and coombs were perhaps the most difficult build‐ups to model, since it was not easy to identify the actual construction details on site, particularly for combed ceilings, where only the internal lining and the outer roof material were observable. On the other hand, the in situ U‐values of the thatched roof at Beaton’s Croft House (ID6) are significantly higher than the estimate by the U‐value calculation: 1.1 to 1.5 W/m2K compared to 0.3 to 0.4 W/m2K. Again the actual construction details are unknown, for example, the space behind the internal timber lining may be ventilated which would increase the U‐value. However, because of the small samples size (one roof only) the results should not be taken as indicative. It is recommended that further measurements are carried out in other thatched buildings. Measured and calculated U‐values of floors The measured and calculated U‐values of floors are in very good agreement. U‐values were measured as 3.5 W/m2K uninsulated and 0.6 W/m2K insulated, compared to calculated U‐values of 3.3 W/m2K and 0.5 W/m2K respectively. However, this should not be taken as indicative as the sample size was small (one floor only), and the floor was of non‐traditional construction (concrete slab), for which accurate U‐value calculations could be expected. 5.6 Comparison to often quoted used U‐values In the absence of in situ U‐value measurements of traditionally constructed elements, U‐values are often estimated or calculated using less appropriate assumptions and simplifications. In the following the U‐values of the in situ measurements for this study are compared to often used default U‐values. For this comparison U‐values have been used from the following two publications: CIBSE Guide A: Environmental Design (Anderson, 2006a, chapter 3); and Scotland: Assessing U‐values for Existing Housing (Energy Saving Trust, 2004). The measured values of retrofitted insulation are also compared to current U‐value requirements by building standards (Scottish Government, 2010).
Page 27
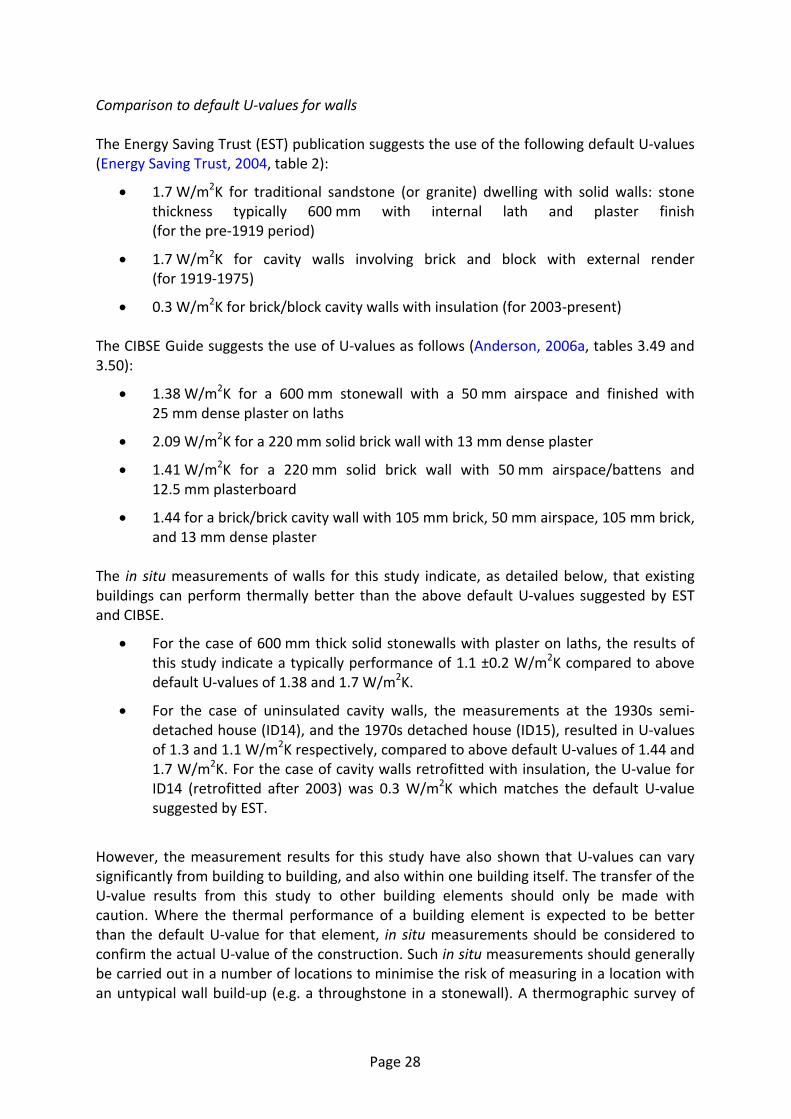
Comparison to default U‐values for walls The Energy Saving Trust (EST) publication suggests the use of the following default U‐values (Energy Saving Trust, 2004, table 2):
• 1.7 W/m2K for traditional sandstone (or granite) dwelling with solid walls: stone thickness typically 600 mm with internal lath and plaster finish (for the pre‐1919 period)
• 1.7 W/m2K for cavity walls involving brick and block with external render (for 1919‐1975)
• 0.3 W/m2K for brick/block cavity walls with insulation (for 2003‐present) The CIBSE Guide suggests the use of U‐values as follows (Anderson, 2006a, tables 3.49 and 3.50):
• 1.38 W/m2K for a 600 mm stonewall with a 50 mm airspace and finished with 25 mm dense plaster on laths
• 2.09 W/m2K for a 220 mm solid brick wall with 13 mm dense plaster
• 1.41 W/m2K for a 220 mm solid brick wall with 50 mm airspace/battens and 12.5 mm plasterboard
• 1.44 for a brick/brick cavity wall with 105 mm brick, 50 mm airspace, 105 mm brick, and 13 mm dense plaster
The in situ measurements of walls for this study indicate, as detailed below, that existing buildings can perform thermally better than the above default U‐values suggested by EST and CIBSE.
• For the case of 600 mm thick solid stonewalls with plaster on laths, the results of this study indicate a typically performance of 1.1 ±0.2 W/m2K compared to above default U‐values of 1.38 and 1.7 W/m2K.
• For the case of uninsulated cavity walls, the measurements at the 1930s semi‐detached house (ID14), and the 1970s detached house (ID15), resulted in U‐values of 1.3 and 1.1 W/m2K respectively, compared to above default U‐values of 1.44 and 1.7 W/m2K. For the case of cavity walls retrofitted with insulation, the U‐value for ID14 (retrofitted after 2003) was 0.3 W/m2K which matches the default U‐value suggested by EST.
However, the measurement results for this study have also shown that U‐values can vary significantly from building to building, and also within one building itself. The transfer of the U‐value results from this study to other building elements should only be made with caution. Where the thermal performance of a building element is expected to be better than the default U‐value for that element, in situ measurements should be considered to confirm the actual U‐value of the construction. Such in situ measurements should generally be carried out in a number of locations to minimise the risk of measuring in a location with an untypical wall build‐up (e.g. a throughstone in a stonewall). A thermographic survey of
Page 28
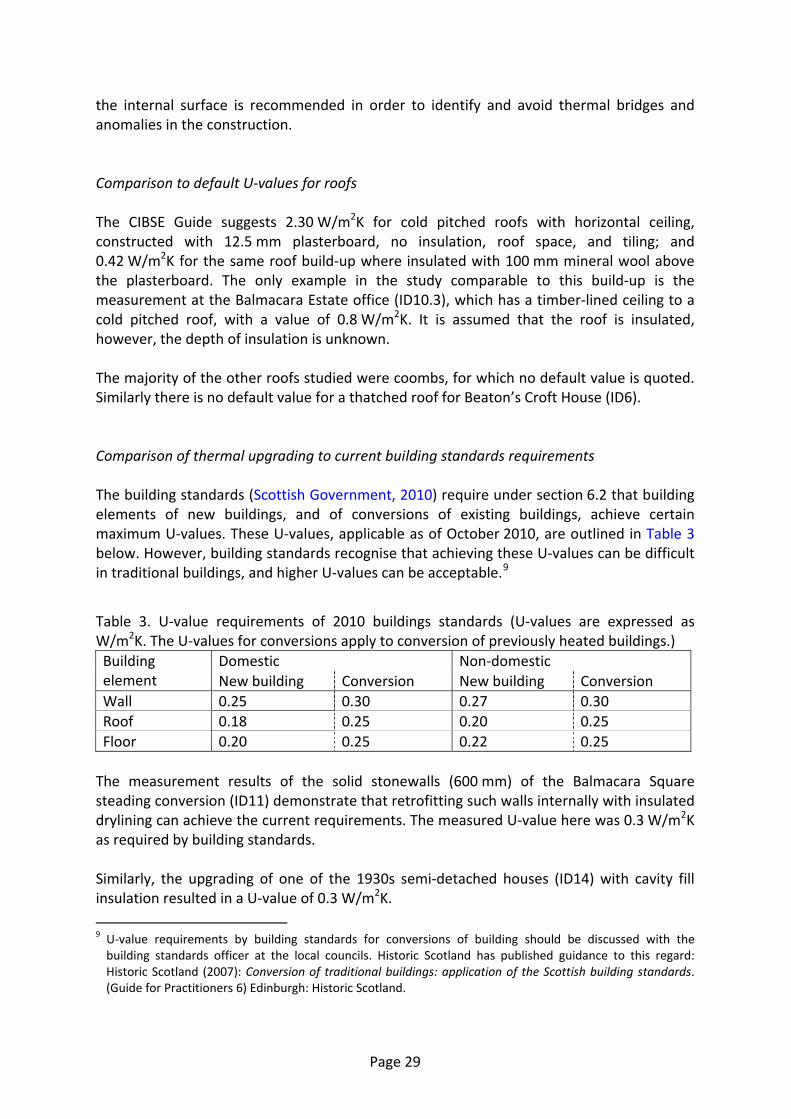
the internal surface is recommended in order to identify and avoid thermal bridges and anomalies in the construction. Comparison to default U‐values for roofs The CIBSE Guide suggests 2.30 W/m2K for cold pitched roofs with horizontal ceiling, constructed with 12.5 mm plasterboard, no insulation, roof space, and tiling; and 0.42 W/m2K for the same roof build‐up where insulated with 100 mm mineral wool above the plasterboard. The only example in the study comparable to this build‐up is the measurement at the Balmacara Estate office (ID10.3), which has a timber‐lined ceiling to a cold pitched roof, with a value of 0.8 W/m2K. It is assumed that the roof is insulated, however, the depth of insulation is unknown. The majority of the other roofs studied were coombs, for which no default value is quoted. Similarly there is no default value for a thatched roof for Beaton’s Croft House (ID6). Comparison of thermal upgrading to current building standards requirements The building standards (Scottish Government, 2010) require under section 6.2 that building elements of new buildings, and of conversions of existing buildings, achieve certain maximum U‐values. These U‐values, applicable as of October 2010, are outlined in Table 3 below. However, building standards recognise that achieving these U‐values can be difficult in traditional buildings, and higher U‐values can be acceptable.9
Table 3. U‐value requirements of 2010 buildings standards (U‐values are expressed as W/m2K. The U‐values for conversions apply to conversion of previously heated buildings.)
Domestic Non‐domestic Building element New building Conversion New building Conversion Wall 0.25 0.30 0.27 0.30 Roof 0.18 0.25 0.20 0.25 Floor 0.20 0.25 0.22 0.25 The measurement results of the solid stonewalls (600 mm) of the Balmacara Square steading conversion (ID11) demonstrate that retrofitting such walls internally with insulated drylining can achieve the current requirements. The measured U‐value here was 0.3 W/m2K as required by building standards. Similarly, the upgrading of one of the 1930s semi‐detached houses (ID14) with cavity fill insulation resulted in a U‐value of 0.3 W/m2K.
9 U‐value requirements by building standards for conversions of building should be discussed with the building standards officer at the local councils. Historic Scotland has published guidance to this regard: Historic Scotland (2007): Conversion of traditional buildings: application of the Scottish building standards. (Guide for Practitioners 6) Edinburgh: Historic Scotland.
Page 29
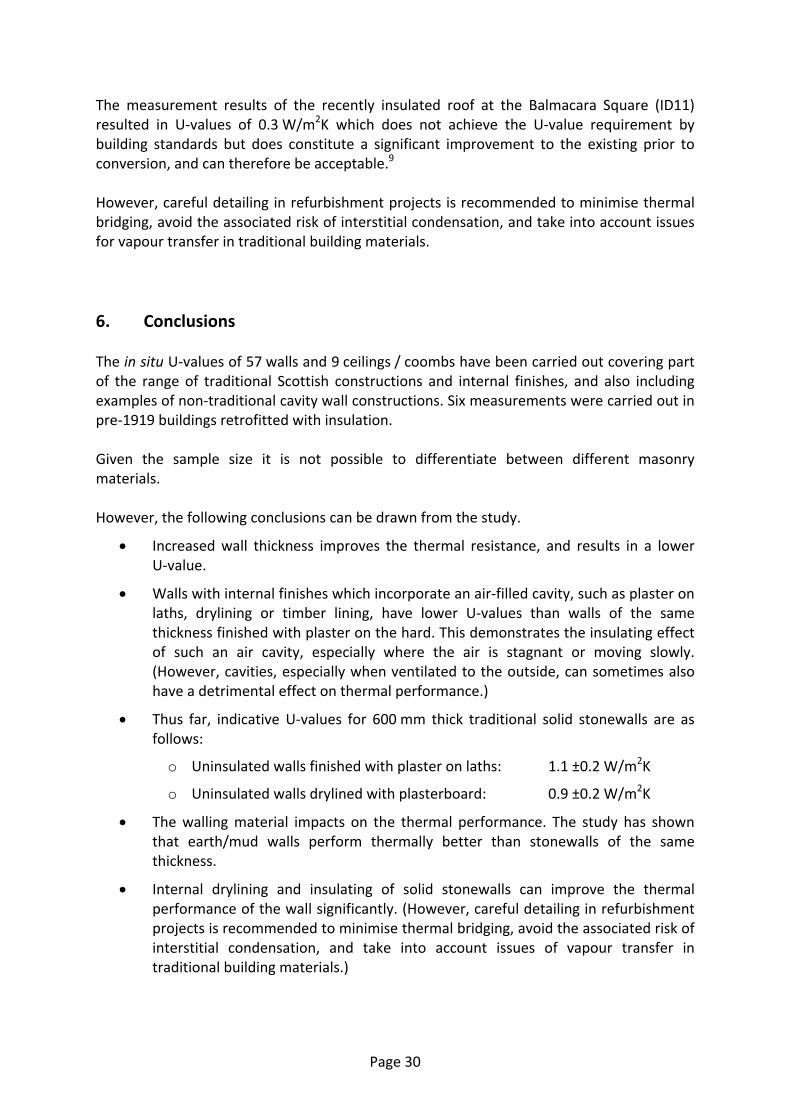
The measurement results of the recently insulated roof at the Balmacara Square (ID11) resulted in U‐values of 0.3 W/m2K which does not achieve the U‐value requirement by building standards but does constitute a significant improvement to the existing prior to conversion, and can therefore be acceptable.9 However, careful detailing in refurbishment projects is recommended to minimise thermal bridging, avoid the associated risk of interstitial condensation, and take into account issues for vapour transfer in traditional building materials. 6. Conclusions The in situ U‐values of 57 walls and 9 ceilings / coombs have been carried out covering part of the range of traditional Scottish constructions and internal finishes, and also including examples of non‐traditional cavity wall constructions. Six measurements were carried out in pre‐1919 buildings retrofitted with insulation. Given the sample size it is not possible to differentiate between different masonry materials. However, the following conclusions can be drawn from the study.
• Increased wall thickness improves the thermal resistance, and results in a lower U‐value.
• Walls with internal finishes which incorporate an air‐filled cavity, such as plaster on laths, drylining or timber lining, have lower U‐values than walls of the same thickness finished with plaster on the hard. This demonstrates the insulating effect of such an air cavity, especially where the air is stagnant or moving slowly. (However, cavities, especially when ventilated to the outside, can sometimes also have a detrimental effect on thermal performance.)
• Thus far, indicative U‐values for 600 mm thick traditional solid stonewalls are as follows:
o Uninsulated walls finished with plaster on laths: 1.1 ±0.2 W/m2K
o Uninsulated walls drylined with plasterboard: 0.9 ±0.2 W/m2K
• The walling material impacts on the thermal performance. The study has shown that earth/mud walls perform thermally better than stonewalls of the same thickness.
• Internal drylining and insulating of solid stonewalls can improve the thermal performance of the wall significantly. (However, careful detailing in refurbishment projects is recommended to minimise thermal bridging, avoid the associated risk of interstitial condensation, and take into account issues of vapour transfer in traditional building materials.)
Page 30
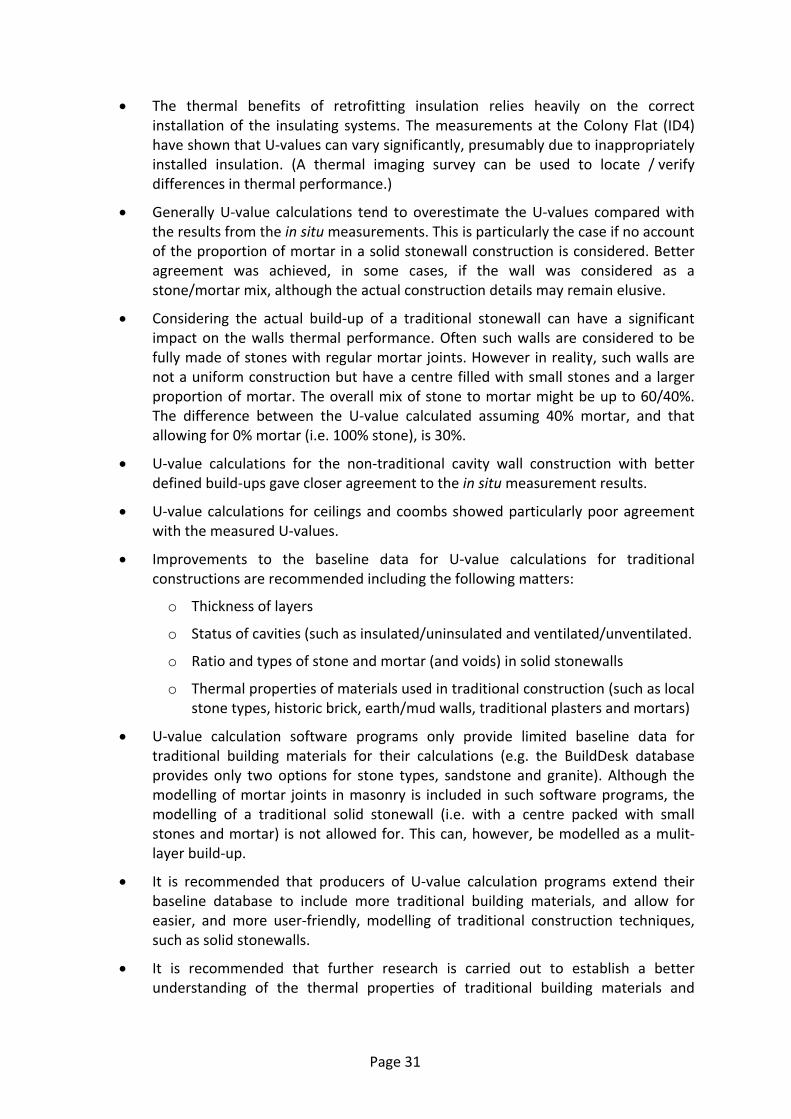
• The thermal benefits of retrofitting insulation relies heavily on the correct installation of the insulating systems. The measurements at the Colony Flat (ID4) have shown that U‐values can vary significantly, presumably due to inappropriately installed insulation. (A thermal imaging survey can be used to locate / verify differences in thermal performance.)
• Generally U‐value calculations tend to overestimate the U‐values compared with the results from the in situ measurements. This is particularly the case if no account of the proportion of mortar in a solid stonewall construction is considered. Better agreement was achieved, in some cases, if the wall was considered as a stone/mortar mix, although the actual construction details may remain elusive.
• Considering the actual build‐up of a traditional stonewall can have a significant impact on the walls thermal performance. Often such walls are considered to be fully made of stones with regular mortar joints. However in reality, such walls are not a uniform construction but have a centre filled with small stones and a larger proportion of mortar. The overall mix of stone to mortar might be up to 60/40%. The difference between the U‐value calculated assuming 40% mortar, and that allowing for 0% mortar (i.e. 100% stone), is 30%.
• U‐value calculations for the non‐traditional cavity wall construction with better defined build‐ups gave closer agreement to the in situ measurement results.
• U‐value calculations for ceilings and coombs showed particularly poor agreement with the measured U‐values.
• Improvements to the baseline data for U‐value calculations for traditional constructions are recommended including the following matters:
o Thickness of layers
o Status of cavities (such as insulated/uninsulated and ventilated/unventilated.
o Ratio and types of stone and mortar (and voids) in solid stonewalls
o Thermal properties of materials used in traditional construction (such as local stone types, historic brick, earth/mud walls, traditional plasters and mortars)
• U‐value calculation software programs only provide limited baseline data for traditional building materials for their calculations (e.g. the BuildDesk database provides only two options for stone types, sandstone and granite). Although the modelling of mortar joints in masonry is included in such software programs, the modelling of a traditional solid stonewall (i.e. with a centre packed with small stones and mortar) is not allowed for. This can, however, be modelled as a mulit‐layer build‐up.
• It is recommended that producers of U‐value calculation programs extend their baseline database to include more traditional building materials, and allow for easier, and more user‐friendly, modelling of traditional construction techniques, such as solid stonewalls.
• It is recommended that further research is carried out to establish a better understanding of the thermal properties of traditional building materials and
Page 31
Page 32
construction components (e.g. different stone types, different mortar types, plaster on laths, vented/unvented air‐filled cavities behind internal finishes).
• It is recommended to establish a standardised methodology for in situ measurements of U‐value to ensure that future measurement results are comparable.
The in situ measurement of U‐values is useful tool which can aid in the assessment of the thermal performance of traditional building elements, particularly where calculation methods may suffer from deficiencies resulting from lack of knowledge of the actual build‐ups used, and of the thermal properties of traditional materials.
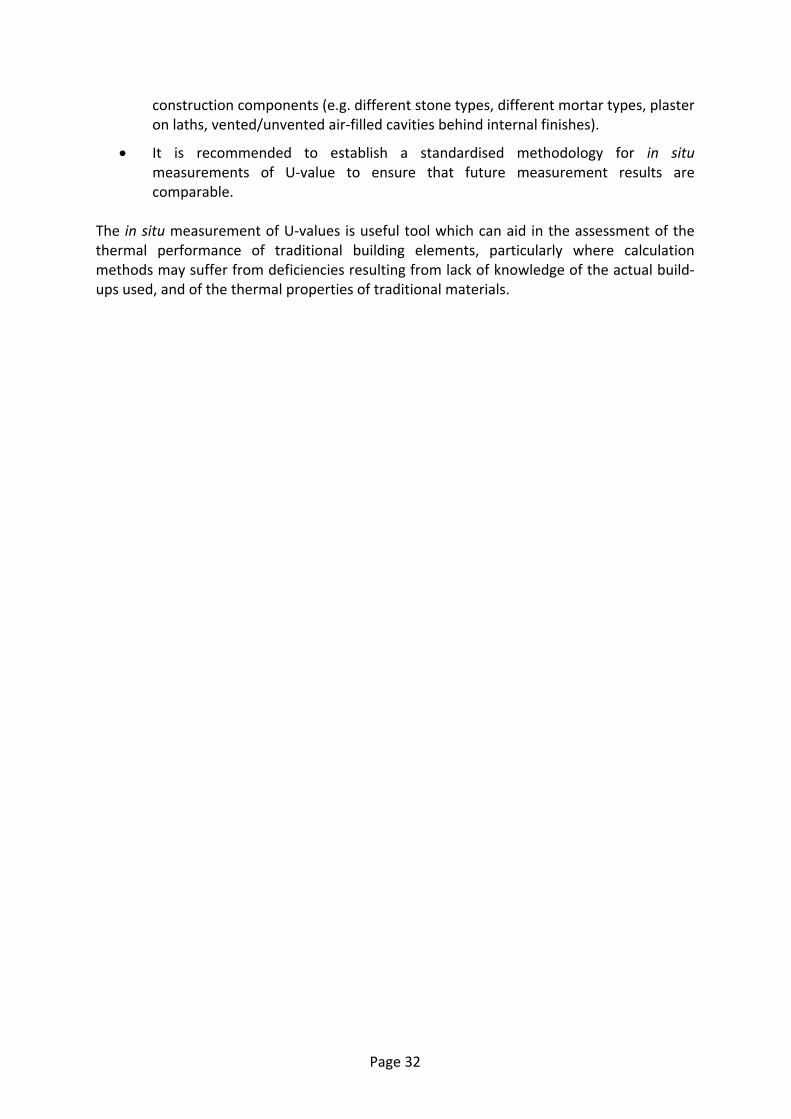
Appendix A Monitoring and analysis methodology This appendix describes the procedures used in this study for the monitoring and analysis of the thermal heat flow through building elements. The procedures have been developed during the first phase of this project (Baker, 2008) and projects for other organisations. This appendix first describes the monitoring equipment used for the measurements, and its set‐up; and then the analysis of the collected data including two methods of error analyses. A1. Monitoring For this study, the heat flow (thermal conductivity) through a building element, and the associated indoor and outdoor temperatures were measured. Ideally the temperature measurements would be of both air and surface temperatures, with surface temperature being the preferred option where only one such measurement would be possible. Campbell Scientific CR1000 data loggers equipped with heat flux and temperature sensors were generally used, however some external measurements were made with Tinytag Plus 2 loggers in locations were access was restricted. Hukseflux HFP01 heat flux sensors were used to measure heat flows through the selected walls (Figure A1). The sensors are 80 mm in diameter and 5 mm thick. The sensors were mounted by firstly applying a layer of double sided adhesive tape to the back of the sensor. Secondly, low tack masking tape was applied to the wall. Finally, the heat flux sensor was applied firmly to the masked area. This arrangement was generally satisfactory for two or more weeks monitoring on painted surfaces. Wallpapered surfaces were not generally used in case of damage. Sensor locations were chosen to avoid probable thermal bridge locations near to windows and corners, with the sensor ideally located about half‐way between window and corner, and floor and ceiling (Figure A2). Where possible a North‐facing or sheltered elevation was selected to reduce the influence of solar radiation on the wall.
Figure A1. Heat flux sensor
Page 33
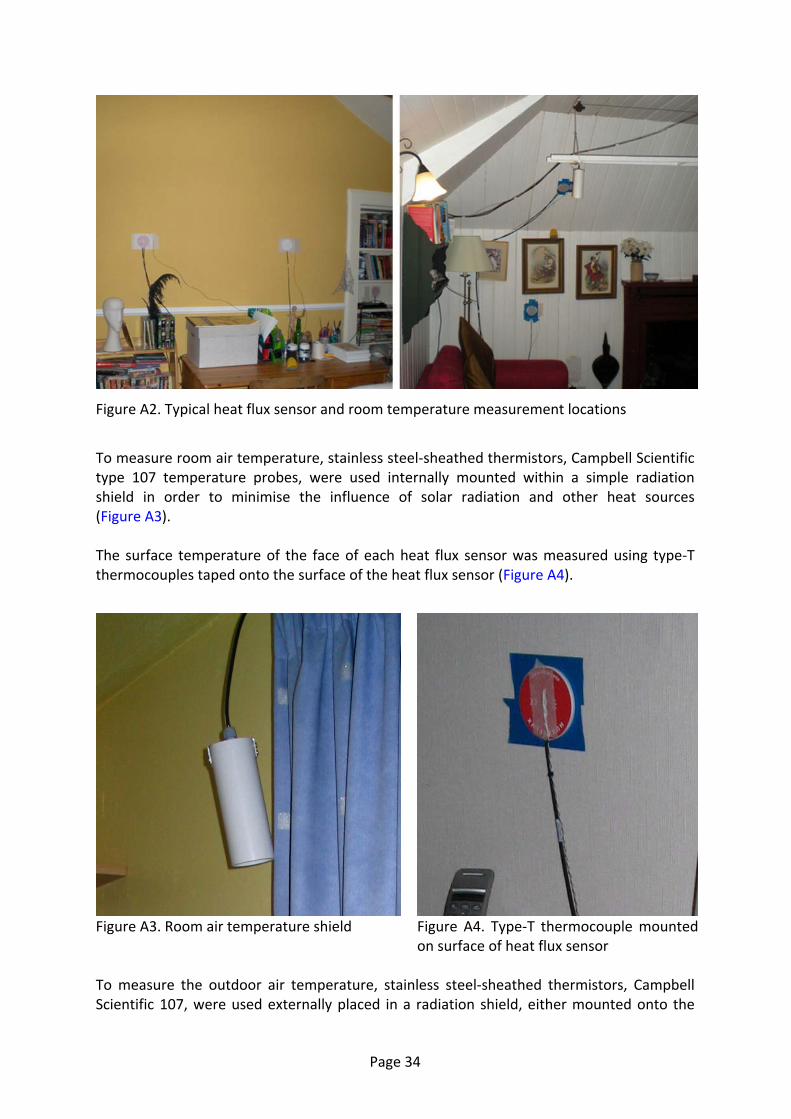
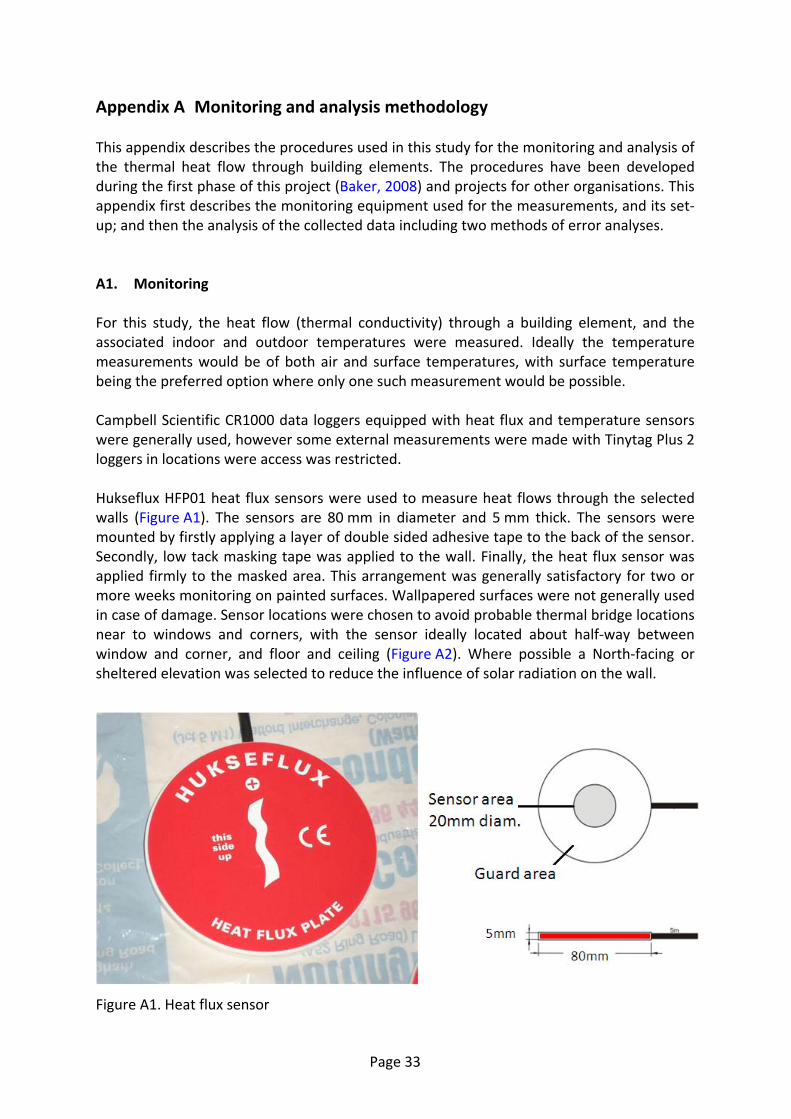
Figure A2. Typical heat flux sensor and room temperature measurement locations
To measure room air temperature, stainless steel‐sheathed thermistors, Campbell Scientific type 107 temperature probes, were used internally mounted within a simple radiation shield in order to minimise the influence of solar radiation and other heat sources (Figure A3). The surface temperature of the face of each heat flux sensor was measured using type‐T thermocouples taped onto the surface of the heat flux sensor (Figure A4).
Figure A3. Room air temperature shield Figure A4. Type‐T thermocouple mounted
on surface of heat flux sensor To measure the outdoor air temperature, stainless steel‐sheathed thermistors, Campbell Scientific 107, were used externally placed in a radiation shield, either mounted onto the
Page 34
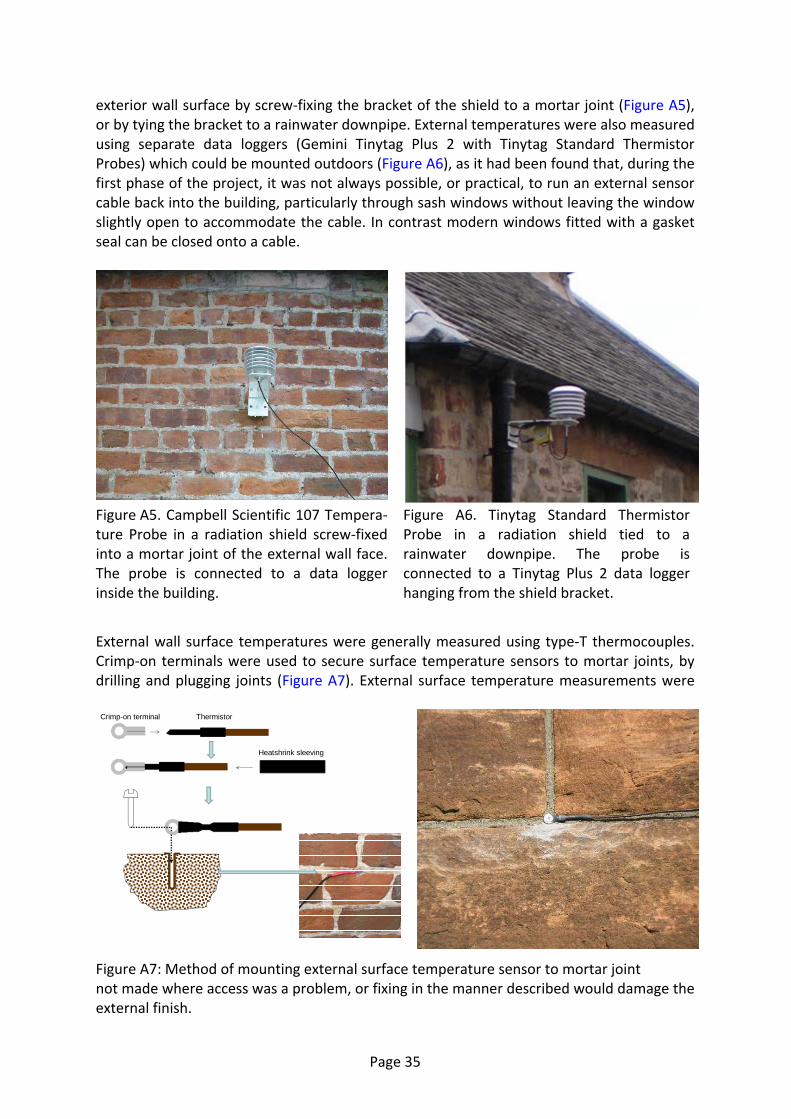
exterior wall surface by screw‐fixing the bracket of the shield to a mortar joint (Figure A5), or by tying the bracket to a rainwater downpipe. External temperatures were also measured using separate data loggers (Gemini Tinytag Plus 2 with Tinytag Standard Thermistor Probes) which could be mounted outdoors (Figure A6), as it had been found that, during the first phase of the project, it was not always possible, or practical, to run an external sensor cable back into the building, particularly through sash windows without leaving the window slightly open to accommodate the cable. In contrast modern windows fitted with a gasket seal can be closed onto a cable.
Figure A5. Campbell Scientific 107 Tempera‐ture Probe in a radiation shield screw‐fixed into a mortar joint of the external wall face. The probe is connected to a data logger inside the building.
Figure A6. Tinytag Standard Thermistor Probe in a radiation shield tied to a rainwater downpipe. The probe is connected to a Tinytag Plus 2 data logger hanging from the shield bracket.
External wall surface temperatures were generally measured using type‐T thermocouples. Crimp‐on terminals were used to secure surface temperature sensors to mortar joints, by drilling and plugging joints (Figure A7). External surface temperature measurements were
ThermistorCrimp-on terminal
Heatshrink sleeving
Figure A7: Method of mounting external surface temperature sensor to mortar joint not made where access was a problem, or fixing in the manner described would damage the external finish.
Page 35
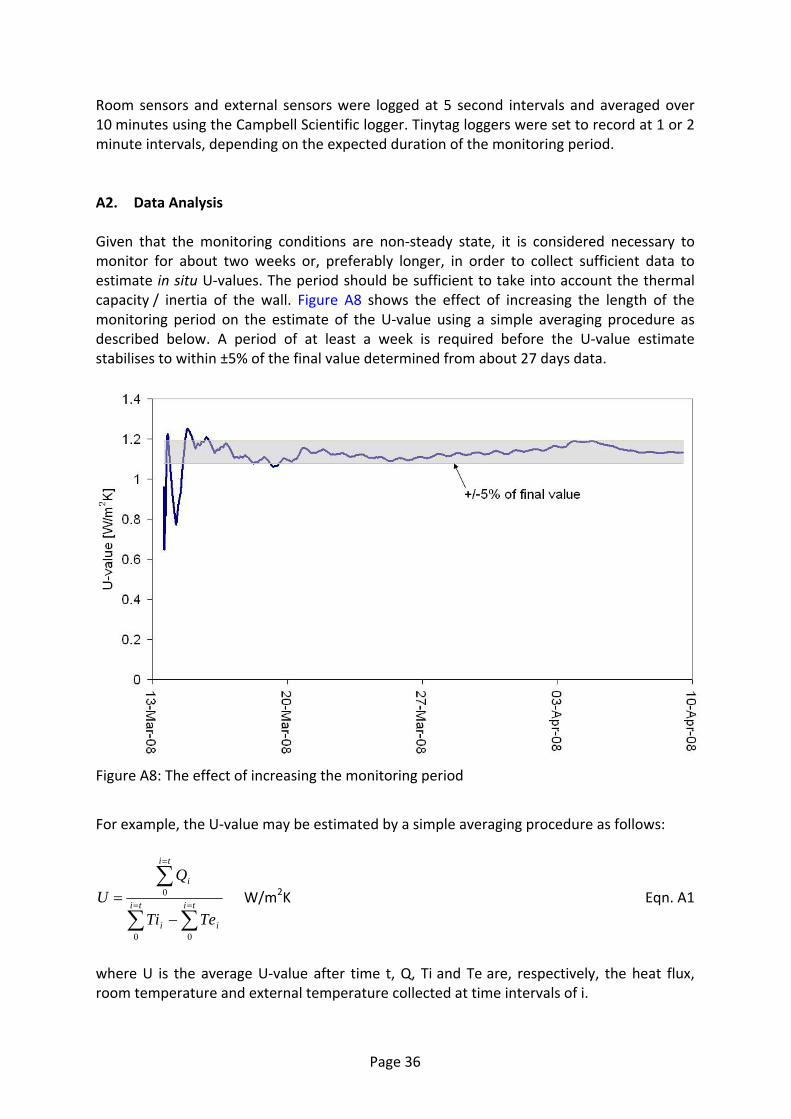
Room sensors and external sensors were logged at 5 second intervals and averaged over 10 minutes using the Campbell Scientific logger. Tinytag loggers were set to record at 1 or 2 minute intervals, depending on the expected duration of the monitoring period. A2. Data Analysis Given that the monitoring conditions are non‐steady state, it is considered necessary to monitor for about two weeks or, preferably longer, in order to collect sufficient data to estimate in situ U‐values. The period should be sufficient to take into account the thermal capacity / inertia of the wall. Figure A8 shows the effect of increasing the length of the monitoring period on the estimate of the U‐value using a simple averaging procedure as described below. A period of at least a week is required before the U‐value estimate stabilises to within ±5% of the final value determined from about 27 days data.
Figure A8: The effect of increasing the monitoring period
For example, the U‐value may be estimated by a simple averaging procedure as follows:
∑ ∑
∑= =
=
−= ti ti
ii
ti
i
TeTi
QU
0 0
0 W/m2K Eqn. A1
where U is the average U‐value after time t, Q, Ti and Te are, respectively, the heat flux, room temperature and external temperature collected at time intervals of i.
Page 36
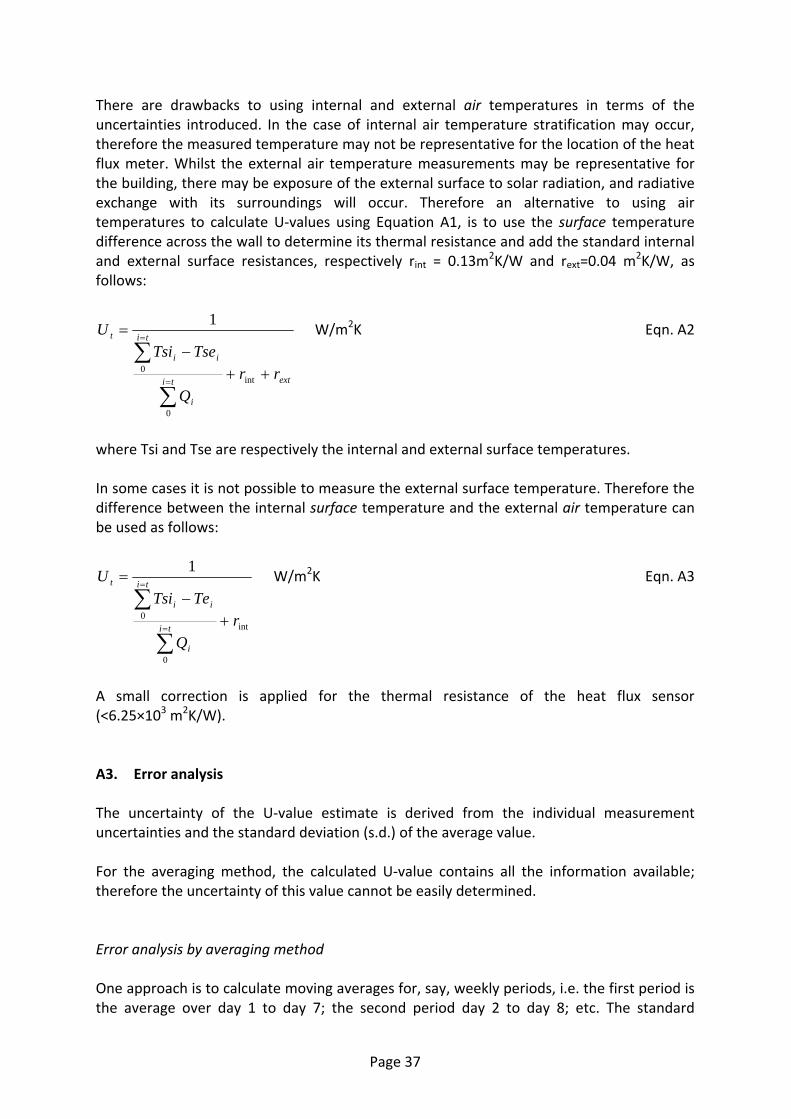
There are drawbacks to using internal and external air temperatures in terms of the uncertainties introduced. In the case of internal air temperature stratification may occur, therefore the measured temperature may not be representative for the location of the heat flux meter. Whilst the external air temperature measurements may be representative for the building, there may be exposure of the external surface to solar radiation, and radiative exchange with its surroundings will occur. Therefore an alternative to using air temperatures to calculate U‐values using Equation A1, is to use the surface temperature difference across the wall to determine its thermal resistance and add the standard internal and external surface resistances, respectively rint = 0.13m
2K/W and rext=0.04 m2K/W, as
follows:
extti
i
ti
ii
t
rrQ
TseTsiU
++−
=
∑
∑=
=
int
0
0
1 W/m2K Eqn. A2
where Tsi and Tse are respectively the internal and external surface temperatures. In some cases it is not possible to measure the external surface temperature. Therefore the difference between the internal surface temperature and the external air temperature can be used as follows:
int
0
0
1
rQ
TeTsiU
ti
i
ti
ii
t
+−
=
∑
∑=
= W/m2K Eqn. A3
A small correction is applied for the thermal resistance of the heat flux sensor (<6.25×10³ m2K/W). A3. Error analysis The uncertainty of the U‐value estimate is derived from the individual measurement uncertainties and the standard deviation (s.d.) of the average value. For the averaging method, the calculated U‐value contains all the information available; therefore the uncertainty of this value cannot be easily determined. Error analysis by averaging method One approach is to calculate moving averages for, say, weekly periods, i.e. the first period is the average over day 1 to day 7; the second period day 2 to day 8; etc. The standard
Page 37
deviation (s.d.) of these N averages can then be calculated, which will give some indication of the uncertainty of the estimated U‐value. This approach is justified since a week is the minimum period which may be expected to give a result. Each of the measured parameters (heat flux, and internal and external temperature) has an associated uncertainty due to the sensor itself (ES) and the logging system (EL). These are combined as follows:
EE LS22 + Eqn. A4
In order to determine the error each measurement will have on the U‐value estimate, the U‐value calculation is repeated with each measured parameter perturbed by its error in turn. For example, the error on internal surface temperature (δTsi) measurement is applied (Equation A5) to calculate Uerr_Tsi:
[ ]extti
i
ti
iii
Tsierr
rrQ
TseTsiTsiU
++−+
=
∑
∑=
=
int
0
0
_1
δ Equ.A5
The overall uncertainty on the U‐value estimate, δU, is calculated as the root mean square value (RMS) of the deviations of each error case from the base case (i.e. the value determined from Eqn. A2 or Eqn. A3) and the standard deviation of U as follows:
( ) ( ) ( ) ([ ])2222 ..dsUUUUUUU errTeerrTierrQ +−+−+−=δ Eqn.A6
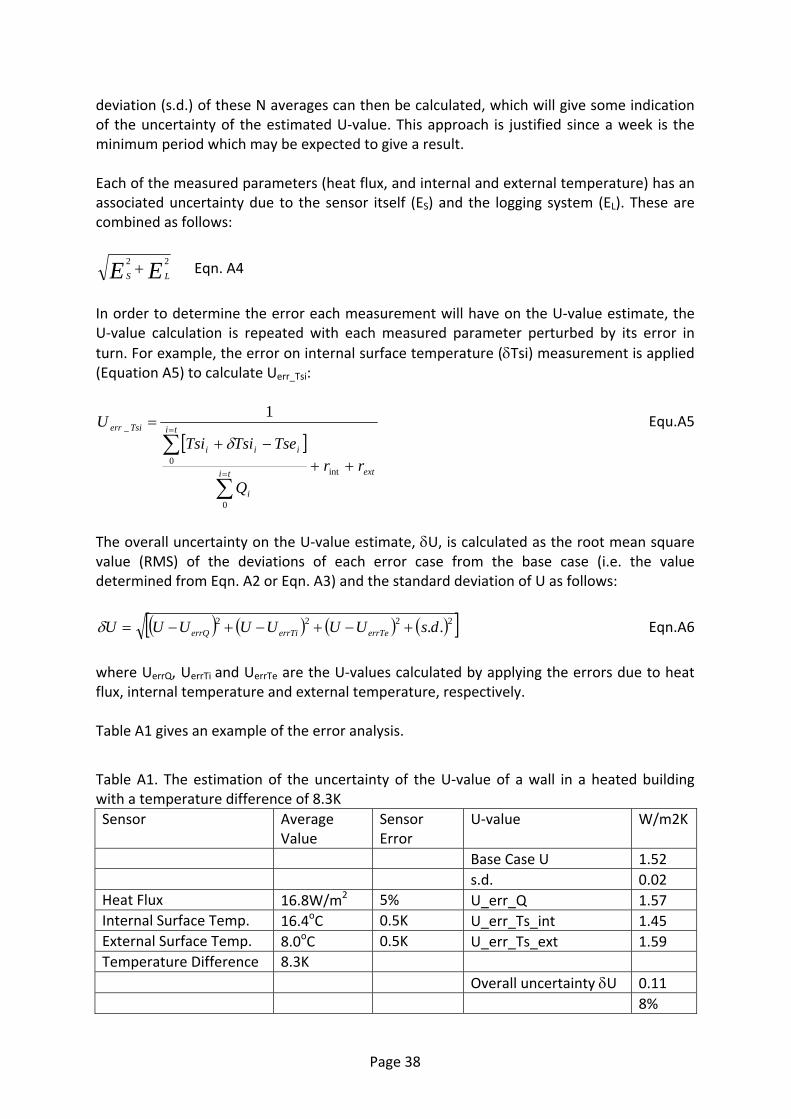
where UerrQ, UerrTi and UerrTe are the U‐values calculated by applying the errors due to heat flux, internal temperature and external temperature, respectively. Table A1 gives an example of the error analysis.
Table A1. The estimation of the uncertainty of the U‐value of a wall in a heated building with a temperature difference of 8.3K Sensor Average
Value Sensor Error
U‐value W/m2K
Base Case U 1.52 s.d. 0.02 Heat Flux 16.8W/m2 5% U_err_Q 1.57 Internal Surface Temp. 16.4oC 0.5K U_err_Ts_int 1.45 External Surface Temp. 8.0oC 0.5K U_err_Ts_ext 1.59 Temperature Difference 8.3K Overall uncertainty δU 0.11 8%
Page 38
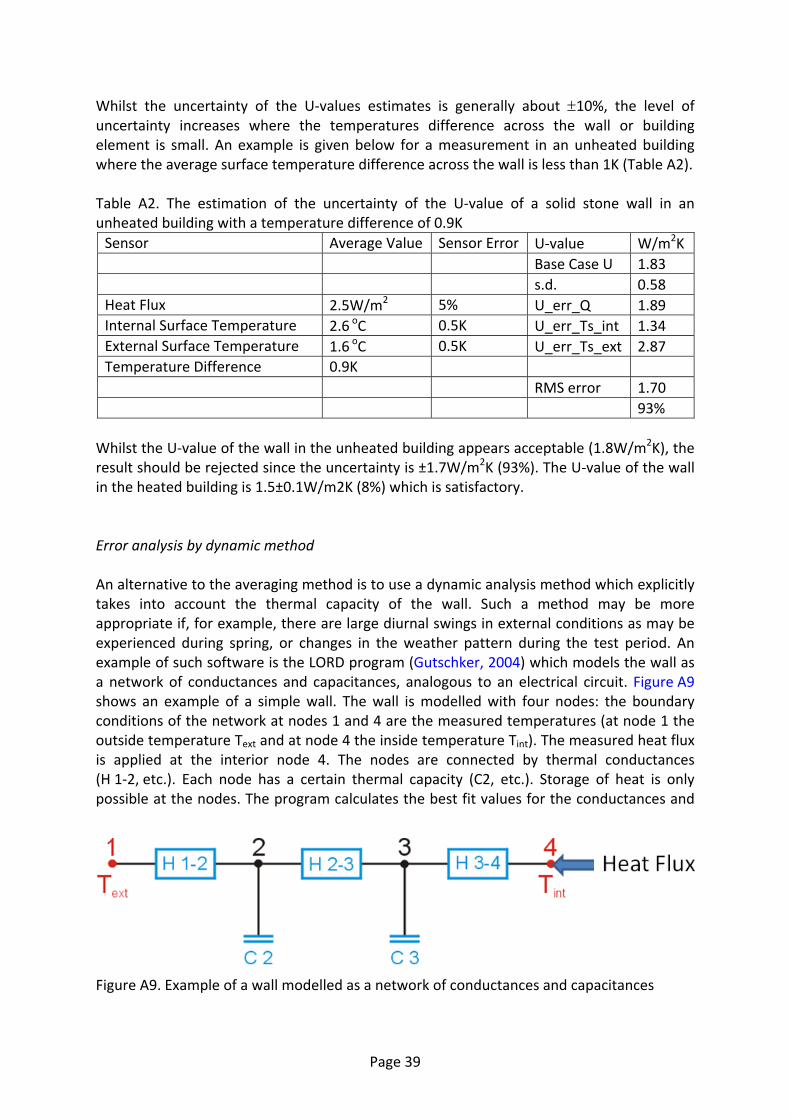
Whilst the uncertainty of the U‐values estimates is generally about ±10%, the level of uncertainty increases where the temperatures difference across the wall or building element is small. An example is given below for a measurement in an unheated building where the average surface temperature difference across the wall is less than 1K (Table A2). Table A2. The estimation of the uncertainty of the U‐value of a solid stone wall in an unheated building with a temperature difference of 0.9K Sensor Average Value Sensor Error U‐value W/m2K Base Case U 1.83 s.d. 0.58 Heat Flux 2.5W/m2 5% U_err_Q 1.89 Internal Surface Temperature 2.6 oC 0.5K U_err_Ts_int 1.34 External Surface Temperature 1.6 oC 0.5K U_err_Ts_ext 2.87 Temperature Difference 0.9K RMS error 1.70 93%
Whilst the U‐value of the wall in the unheated building appears acceptable (1.8W/m2K), the result should be rejected since the uncertainty is ±1.7W/m2K (93%). The U‐value of the wall in the heated building is 1.5±0.1W/m2K (8%) which is satisfactory. Error analysis by dynamic method An alternative to the averaging method is to use a dynamic analysis method which explicitly takes into account the thermal capacity of the wall. Such a method may be more appropriate if, for example, there are large diurnal swings in external conditions as may be experienced during spring, or changes in the weather pattern during the test period. An example of such software is the LORD program (Gutschker, 2004) which models the wall as a network of conductances and capacitances, analogous to an electrical circuit. Figure A9 shows an example of a simple wall. The wall is modelled with four nodes: the boundary conditions of the network at nodes 1 and 4 are the measured temperatures (at node 1 the outside temperature Text and at node 4 the inside temperature Tint). The measured heat flux is applied at the interior node 4. The nodes are connected by thermal conductances (H 1‐2, etc.). Each node has a certain thermal capacity (C2, etc.). Storage of heat is only possible at the nodes. The program calculates the best fit values for the conductances and
Figure A9. Example of a wall modelled as a network of conductances and capacitances
Page 39

thermal capacitances. The number of nodes used to model the wall depends on its thermal mass. However the selection of the optimum number of nodes may require a process of trial and error and can be somewhat dependent on the user’s experience of interpreting the output of the program.
Page 40
Appendix B References Anderson, B., 2006a. Conventions for U‐value calculations. (BR 443:2006) Bracknell, Berkshire: BRE Press. Anderson, B., 2006b. Thermal properties of building structures. In: The Chartered Institution of Building Services Engineers, 2006. CIBSE guide A: environmental design. 7th ed. London: CIBSE. Ch.3. Baker, P. H., Sanders, C., Galbraith, G. H. & McLean. R. C., 2007. Investigation of wetting and drying behaviour of replica historic wall constructions. In: Cassar, M. & Hawkings, C., ed., 2007. Engineering historic futures: stakeholders dissemination and scientific research report. London: Centre for Sustainable Heritage, University College London. Available at http://www.ucl.ac.uk/sustainableheritage/ehf_report_web.pdf Baker, P., 2008. In situ U‐value measurements in traditional buildings: preliminary results. (Historic Scotland Technical Paper 2) Edinburgh: Historic Scotland. Available at http://www.historic‐scotland.gov.uk/technicalpapers BS EN ISO 7345:1987. Thermal insulation: physical quantities and definitions. London: BSI. BS EN ISO 6946:1997. Building components and building elements: thermal resistance and thermal transmittance: calculation methods. London: BSI. Changeworks, 2008. Energy heritage: a guide to improving energy efficiency in traditional and historic homes. Edinburgh: Changeworks. Available at http://www.changeworks.org.uk/uploads/83096‐EnergyHeritage_online1.pdf Energy Saving Trust, 2004. Scotland: assessing U‐values of existing housing. (Energy Efficiency Best Practice in Housing: CE84) London: Energy Saving Trust. Available at http://www.energysavingtrust.org.uk/business/content/download/180012/ 441763/version/4/file/ce84.pdf Gutschker, O., 2004. LORD: modelling and identification software for thermal system: user manual. Cottbus, Germany: Brandenburg Technical University. Künzel, H. M., Radon, J., & Schmidt, T., 1997. WUFI v2.0: simulation of heat and moisture transport in building components. Holzkirchen, Germany: Fraunhofer Institute for Building Physics. prEN 12494:1996. Building components and elements: in situ measurement of the surface to surface thermal resistance. London: BSI. Scottish Government, 2010. Building Standards Technical Handbooks. Edinburgh: Scottish Government. Available at http://www.scotland.gov.uk/Topics/Built‐Environment/Building/Building‐standards/publications/pubtech
Page 41
Page 42
Appendix C Building Datasheets
1. Georgian tenement, Edinburgh
2. Victorian tenement, Glasgow
3. Victorian villa, Glasgow
4. Colonies flat, Edinburgh
5. Logie Schoolhouse, Angus
6. Beaton’s Croft House, Highlands
7. Stalker’s cottage, Highlands
8. Weens Garden Cottage, Scottish Borders
9. Castle Fraser Estate, Aberdeenshire
10. Balmacara Estate, Highlands
11. Balmacara Square, Highlands
12. Dumfries House Estate, East Ayrshire
13. McCowan house, Dumfries and Galloway
14. 1930s semi‐detached houses, East Renfrewshire
15. 1970s detached houses, Dumfries and Galloway
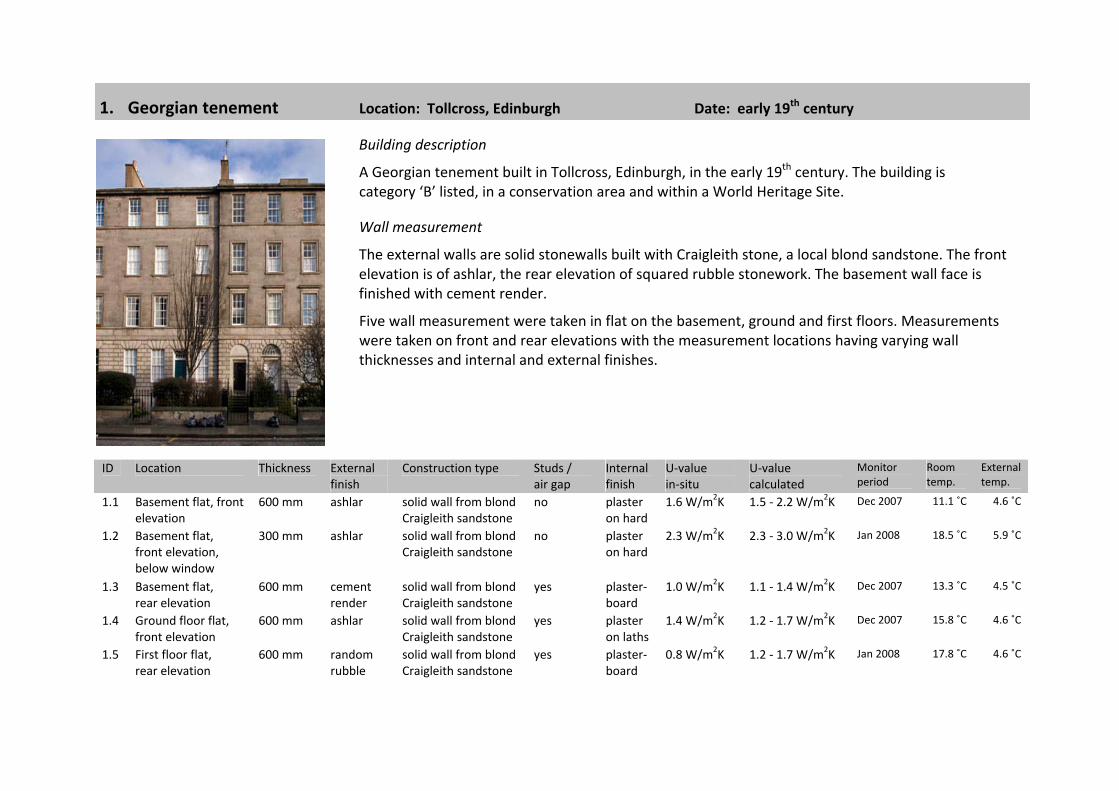
1. Georgian tenement Location: Tollcross, Edinburgh Date: early 19th century
Building description
A Georgian tenement built in Tollcross, Edinburgh, in the early 19th century. The building is category ‘B’ listed, in a conservation area and within a World Heritage Site.
Wall measurement
The external walls are solid stonewalls built with Craigleith stone, a local blond sandstone. The front elevation is of ashlar, the rear elevation of squared rubble stonework. The basement wall face is finished with cement render.
Five wall measurement were taken in flat on the basement, ground and first floors. Measurements were taken on front and rear elevations with the measurement locations having varying wall thicknesses and internal and external finishes.
ID Location Thickness External finish
Construction type Studs / air gap
Internal finish
U‐value in‐situ
U‐value calculated
Monitor period
Room temp.
External temp.
1.1 Basement flat, front elevation
600 mm ashlar solid wall from blond Craigleith sandstone
no plaster on hard
1.6 W/m2K 1.5 ‐ 2.2 W/m2K Dec 2007 11.1 ˚C 4.6 ˚C
1.2 Basement flat, front elevation, below window
300 mm ashlar solid wall from blond Craigleith sandstone
no plaster on hard
2.3 W/m2K 2.3 ‐ 3.0 W/m2K Jan 2008 18.5 ˚C 5.9 ˚C
1.3 Basement flat, rear elevation
600 mm cement render
solid wall from blond Craigleith sandstone
yes plaster‐board
1.0 W/m2K 1.1 ‐ 1.4 W/m2K Dec 2007 13.3 ˚C 4.5 ˚C
1.4 Ground floor flat, front elevation
600 mm ashlar solid wall from blond Craigleith sandstone
yes plaster on laths
1.4 W/m2K 1.2 ‐ 1.7 W/m2K Dec 2007 15.8 ˚C 4.6 ˚C
1.5 First floor flat, rear elevation
600 mm random rubble
solid wall from blond Craigleith sandstone
yes plaster‐board
0.8 W/m2K 1.2 ‐ 1.7 W/m2K Jan 2008 17.8 ˚C 4.6 ˚C
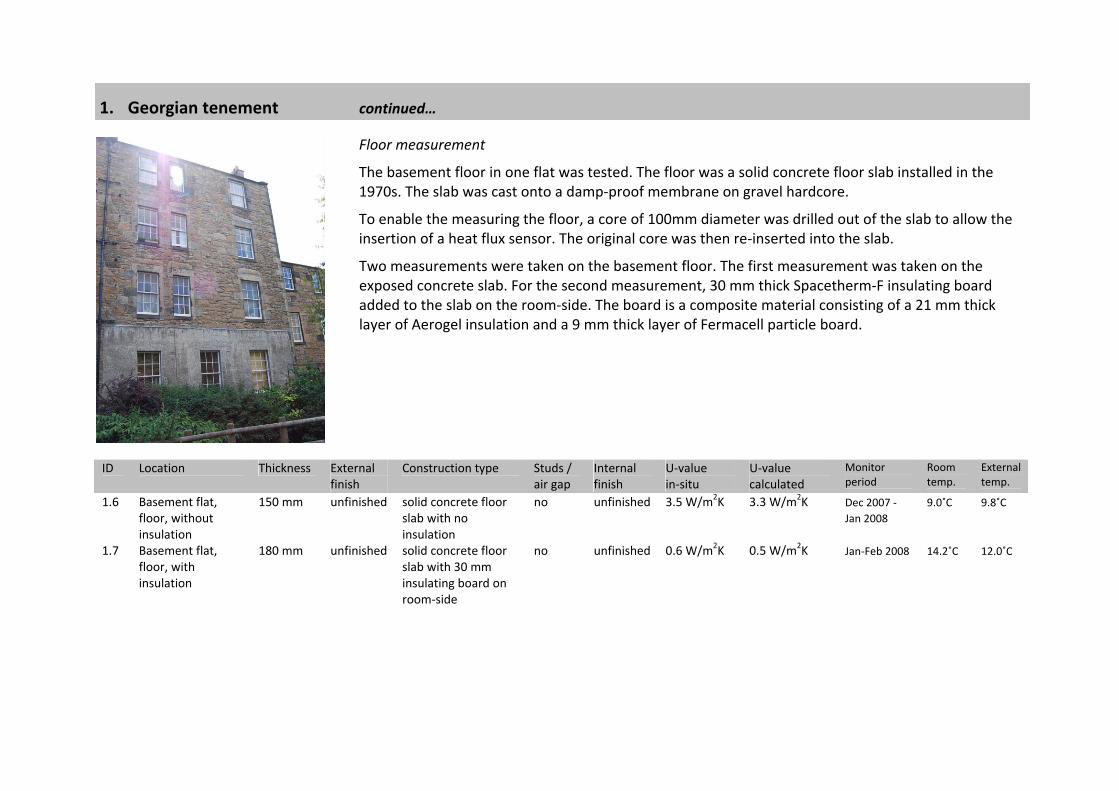
1. Georgian tenement continued…
Floor measurement
The basement floor in one flat was tested. The floor was a solid concrete floor slab installed in the 1970s. The slab was cast onto a damp‐proof membrane on gravel hardcore.
To enable the measuring the floor, a core of 100mm diameter was drilled out of the slab to allow the insertion of a heat flux sensor. The original core was then re‐inserted into the slab.
Two measurements were taken on the basement floor. The first measurement was taken on the exposed concrete slab. For the second measurement, 30 mm thick Spacetherm‐F insulating board added to the slab on the room‐side. The board is a composite material consisting of a 21 mm thick layer of Aerogel insulation and a 9 mm thick layer of Fermacell particle board.
ID Location Thickness External finish
Construction type Studs / air gap
Internal finish
U‐value in‐situ
U‐value calculated
Monitor period
Room temp.
External temp.
1.6 Basement flat, floor, without insulation
150 mm unfinished solid concrete floor slab with no insulation
no unfinished 3.5 W/m2K 3.3 W/m2K Dec 2007 ‐ Jan 2008
9.0˚C 9.8˚C
1.7 Basement flat, floor, with insulation
180 mm unfinished solid concrete floor slab with 30 mm insulating board on room‐side
no unfinished 0.6 W/m2K 0.5 W/m2K Jan‐Feb 2008 14.2˚C 12.0˚C
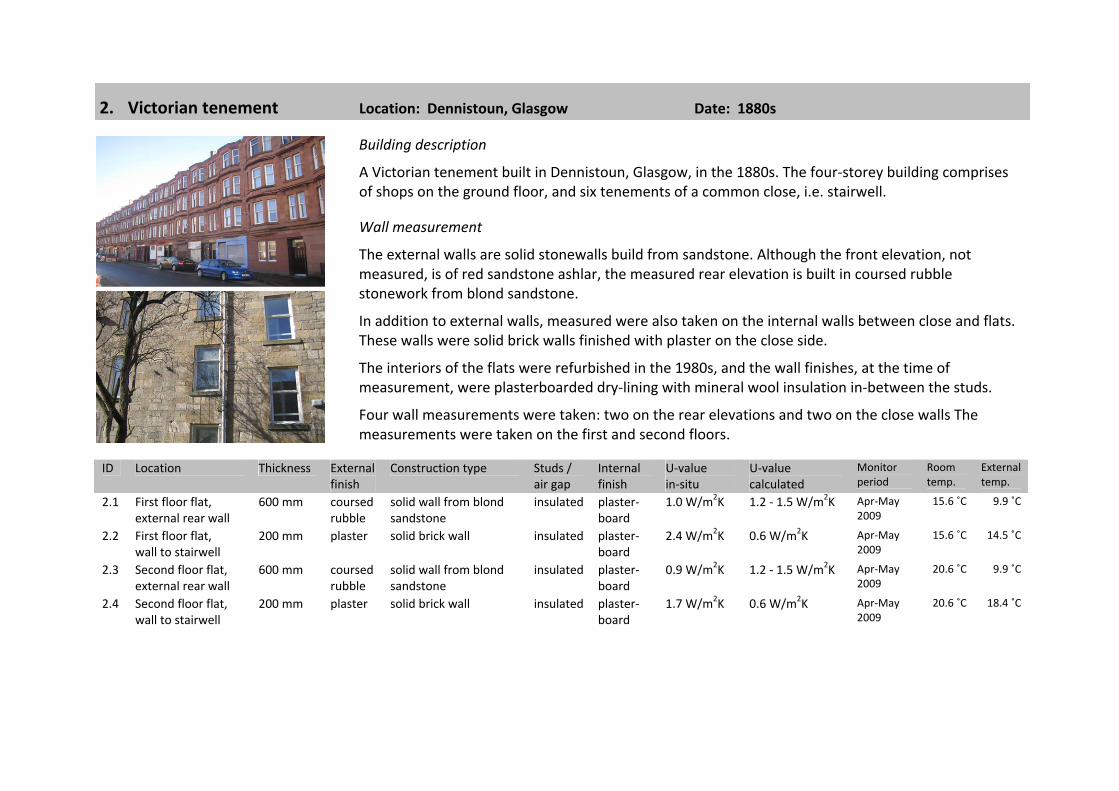
2. Victorian tenement Location: Dennistoun, Glasgow Date: 1880s
Building description
A Victorian tenement built in Dennistoun, Glasgow, in the 1880s. The four‐storey building comprises of shops on the ground floor, and six tenements of a common close, i.e. stairwell.
Wall measurement
The external walls are solid stonewalls build from sandstone. Although the front elevation, not measured, is of red sandstone ashlar, the measured rear elevation is built in coursed rubble stonework from blond sandstone.
In addition to external walls, measured were also taken on the internal walls between close and flats. These walls were solid brick walls finished with plaster on the close side.
The interiors of the flats were refurbished in the 1980s, and the wall finishes, at the time of measurement, were plasterboarded dry‐lining with mineral wool insulation in‐between the studs.
Four wall measurements were taken: two on the rear elevations and two on the close walls The measurements were taken on the first and second floors.
ID Location Thickness External finish
Construction type Studs / air gap
Internal finish
U‐value in‐situ
U‐value calculated
Monitor period
Room temp.
External temp.
2.1 First floor flat, external rear wall
600 mm coursed rubble
solid wall from blond sandstone
insulated plaster‐board
1.0 W/m2K 1.2 ‐ 1.5 W/m2K Apr‐May 2009
15.6 ˚C 9.9 ˚C
2.2 First floor flat, wall to stairwell
200 mm plaster solid brick wall insulated plaster‐board
2.4 W/m2K 0.6 W/m2K Apr‐May 2009
15.6 ˚C 14.5 ˚C
2.3 Second floor flat, external rear wall
600 mm coursed rubble
solid wall from blond sandstone
insulated plaster‐board
0.9 W/m2K 1.2 ‐ 1.5 W/m2K Apr‐May 2009
20.6 ˚C 9.9 ˚C
2.4 Second floor flat, wall to stairwell
200 mm plaster solid brick wall insulated plaster‐board
1.7 W/m2K 0.6 W/m2K Apr‐May 2009
20.6 ˚C 18.4 ˚C
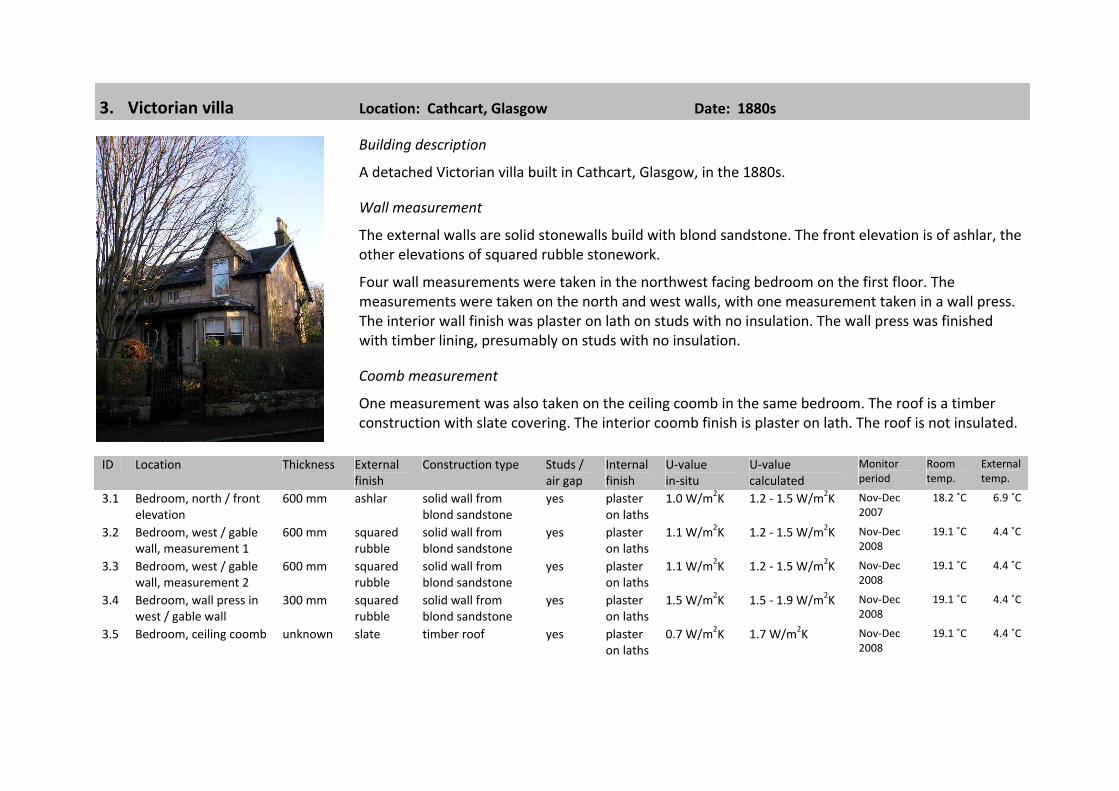
3. Victorian villa Location: Cathcart, Glasgow Date: 1880s
Building description
A detached Victorian villa built in Cathcart, Glasgow, in the 1880s.
Wall measurement
The external walls are solid stonewalls build with blond sandstone. The front elevation is of ashlar, the other elevations of squared rubble stonework.
Four wall measurements were taken in the northwest facing bedroom on the first floor. The measurements were taken on the north and west walls, with one measurement taken in a wall press. The interior wall finish was plaster on lath on studs with no insulation. The wall press was finished with timber lining, presumably on studs with no insulation.
Coomb measurement
One measurement was also taken on the ceiling coomb in the same bedroom. The roof is a timber construction with slate covering. The interior coomb finish is plaster on lath. The roof is not insulated.
ID Location Thickness External finish
Construction type Studs / air gap
Internal finish
U‐value in‐situ
U‐value calculated
Monitor period
Room temp.
External temp.
3.1 Bedroom, north / front elevation
600 mm ashlar solid wall from blond sandstone
yes plaster on laths
1.0 W/m2K 1.2 ‐ 1.5 W/m2K Nov‐Dec 2007
18.2 ˚C 6.9 ˚C
3.2 Bedroom, west / gable wall, measurement 1
600 mm squared rubble
solid wall from blond sandstone
yes plaster on laths
1.1 W/m2K 1.2 ‐ 1.5 W/m2K Nov‐Dec 2008
19.1 ˚C 4.4 ˚C
3.3 Bedroom, west / gable wall, measurement 2
600 mm squared rubble
solid wall from blond sandstone
yes plaster on laths
1.1 W/m2K 1.2 ‐ 1.5 W/m2K Nov‐Dec 2008
19.1 ˚C 4.4 ˚C
3.4 Bedroom, wall press in west / gable wall
300 mm squared rubble
solid wall from blond sandstone
yes plaster on laths
1.5 W/m2K 1.5 ‐ 1.9 W/m2K Nov‐Dec 2008
19.1 ˚C 4.4 ˚C
3.5 Bedroom, ceiling coomb unknown slate timber roof yes plaster on laths
0.7 W/m2K 1.7 W/m2K Nov‐Dec 2008
19.1 ˚C 4.4 ˚C
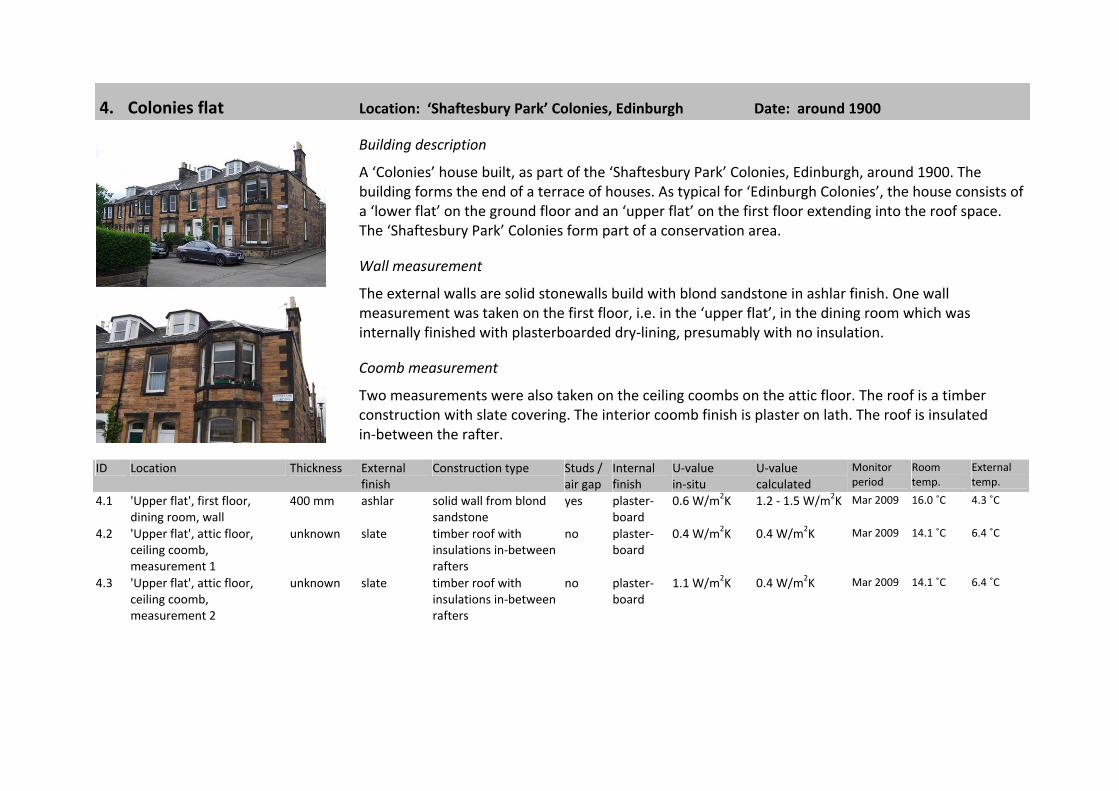
4. Colonies flat Location: ‘Shaftesbury Park’ Colonies, Edinburgh Date: around 1900
Building description
A ‘Colonies’ house built, as part of the ‘Shaftesbury Park’ Colonies, Edinburgh, around 1900. The building forms the end of a terrace of houses. As typical for ‘Edinburgh Colonies’, the house consists of a ‘lower flat’ on the ground floor and an ‘upper flat’ on the first floor extending into the roof space. The ‘Shaftesbury Park’ Colonies form part of a conservation area.
Wall measurement
The external walls are solid stonewalls build with blond sandstone in ashlar finish. One wall measurement was taken on the first floor, i.e. in the ‘upper flat’, in the dining room which was internally finished with plasterboarded dry‐lining, presumably with no insulation.
Coomb measurement
Two measurements were also taken on the ceiling coombs on the attic floor. The roof is a timber construction with slate covering. The interior coomb finish is plaster on lath. The roof is insulated in‐between the rafter.
ID Location Thickness External finish
Construction type Studs / air gap
Internal finish
U‐value in‐situ
U‐value calculated
Monitor period
Room temp.
External temp.
4.1 'Upper flat', first floor, dining room, wall
400 mm ashlar solid wall from blond sandstone
yes plaster‐board
0.6 W/m2K 1.2 ‐ 1.5 W/m2K Mar 2009 16.0 ˚C 4.3 ˚C
4.2 'Upper flat', attic floor, ceiling coomb, measurement 1
unknown slate timber roof with insulations in‐between rafters
no plaster‐board
0.4 W/m2K 0.4 W/m2K Mar 2009 14.1 ˚C 6.4 ˚C
4.3 'Upper flat', attic floor, ceiling coomb, measurement 2
unknown slate timber roof with insulations in‐between rafters
no plaster‐board
1.1 W/m2K 0.4 W/m2K Mar 2009 14.1 ˚C 6.4 ˚C
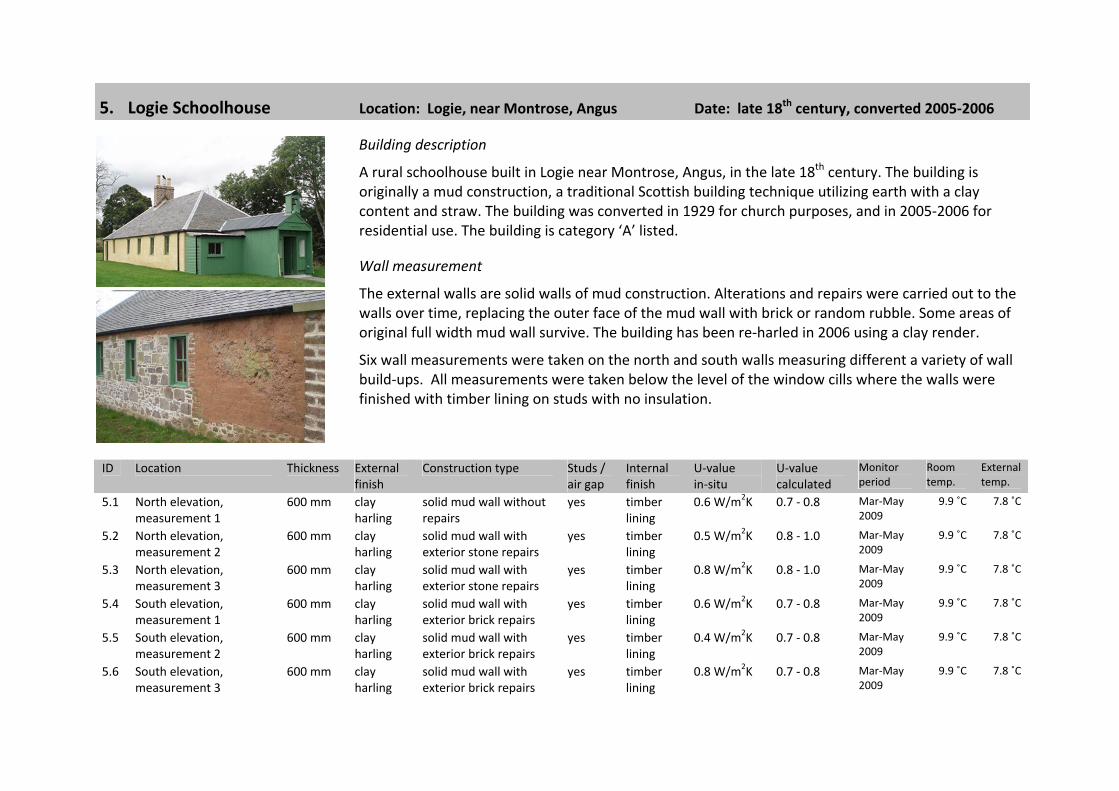
5. Logie Schoolhouse Location: Logie, near Montrose, Angus Date: late 18th century, converted 2005‐2006
Building description
A rural schoolhouse built in Logie near Montrose, Angus, in the late 18th century. The building is originally a mud construction, a traditional Scottish building technique utilizing earth with a clay content and straw. The building was converted in 1929 for church purposes, and in 2005‐2006 for residential use. The building is category ‘A’ listed.
Wall measurement
The external walls are solid walls of mud construction. Alterations and repairs were carried out to the walls over time, replacing the outer face of the mud wall with brick or random rubble. Some areas of original full width mud wall survive. The building has been re‐harled in 2006 using a clay render.
Six wall measurements were taken on the north and south walls measuring different a variety of wall build‐ups. All measurements were taken below the level of the window cills where the walls were finished with timber lining on studs with no insulation.
ID Location Thickness External finish
Construction type Studs / air gap
Internal finish
U‐value in‐situ
U‐value calculated
Monitor period
Room temp.
External temp.
5.1 North elevation, measurement 1
600 mm clay harling
solid mud wall without repairs
yes timber lining
0.6 W/m2K 0.7 ‐ 0.8 Mar‐May 2009
9.9 ˚C 7.8 ˚C
5.2 North elevation, measurement 2
600 mm clay harling
solid mud wall with exterior stone repairs
yes timber lining
0.5 W/m2K 0.8 ‐ 1.0 Mar‐May 2009
9.9 ˚C 7.8 ˚C
5.3 North elevation, measurement 3
600 mm clay harling
solid mud wall with exterior stone repairs
yes timber lining
0.8 W/m2K 0.8 ‐ 1.0 Mar‐May 2009
9.9 ˚C 7.8 ˚C
5.4 South elevation, measurement 1
600 mm clay harling
solid mud wall with exterior brick repairs
yes timber lining
0.6 W/m2K 0.7 ‐ 0.8 Mar‐May 2009
9.9 ˚C 7.8 ˚C
5.5 South elevation, measurement 2
600 mm clay harling
solid mud wall with exterior brick repairs
yes timber lining
0.4 W/m2K 0.7 ‐ 0.8 Mar‐May 2009
9.9 ˚C 7.8 ˚C
5.6 South elevation, measurement 3
600 mm clay harling
solid mud wall with exterior brick repairs
yes timber lining
0.8 W/m2K 0.7 ‐ 0.8 Mar‐May 2009
9.9 ˚C 7.8 ˚C
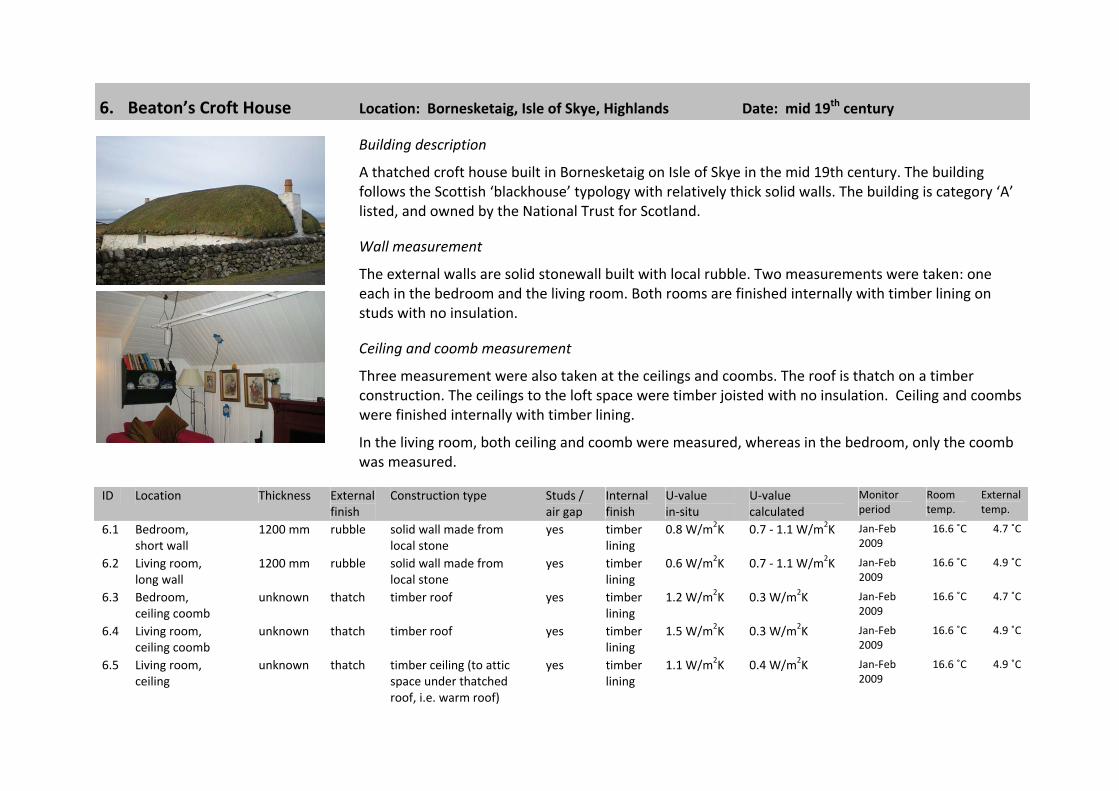
6. Beaton’s Croft House Location: Bornesketaig, Isle of Skye, Highlands Date: mid 19th century
Building description
A thatched croft house built in Bornesketaig on Isle of Skye in the mid 19th century. The building follows the Scottish ‘blackhouse’ typology with relatively thick solid walls. The building is category ‘A’ listed, and owned by the National Trust for Scotland.
Wall measurement
The external walls are solid stonewall built with local rubble. Two measurements were taken: one each in the bedroom and the living room. Both rooms are finished internally with timber lining on studs with no insulation.
Ceiling and coomb measurement
Three measurement were also taken at the ceilings and coombs. The roof is thatch on a timber construction. The ceilings to the loft space were timber joisted with no insulation. Ceiling and coombs were finished internally with timber lining.
In the living room, both ceiling and coomb were measured, whereas in the bedroom, only the coomb was measured.
ID Location Thickness External finish
Construction type Studs / air gap
Internal finish
U‐value in‐situ
U‐value calculated
Monitor period
Room temp.
External temp.
6.1 Bedroom, short wall
1200 mm rubble solid wall made from local stone
yes timber lining
0.8 W/m2K 0.7 ‐ 1.1 W/m2K Jan‐Feb 2009
16.6 ˚C 4.7 ˚C
6.2 Living room, long wall
1200 mm rubble solid wall made from local stone
yes timber lining
0.6 W/m2K 0.7 ‐ 1.1 W/m2K Jan‐Feb 2009
16.6 ˚C 4.9 ˚C
6.3 Bedroom, ceiling coomb
unknown thatch timber roof yes timber lining
1.2 W/m2K 0.3 W/m2K Jan‐Feb 2009
16.6 ˚C 4.7 ˚C
6.4 Living room, ceiling coomb
unknown thatch timber roof yes timber lining
1.5 W/m2K 0.3 W/m2K Jan‐Feb 2009
16.6 ˚C 4.9 ˚C
6.5 Living room, ceiling
unknown thatch timber ceiling (to attic space under thatched roof, i.e. warm roof)
yes timber lining
1.1 W/m2K 0.4 W/m2K Jan‐Feb 2009
16.6 ˚C 4.9 ˚C
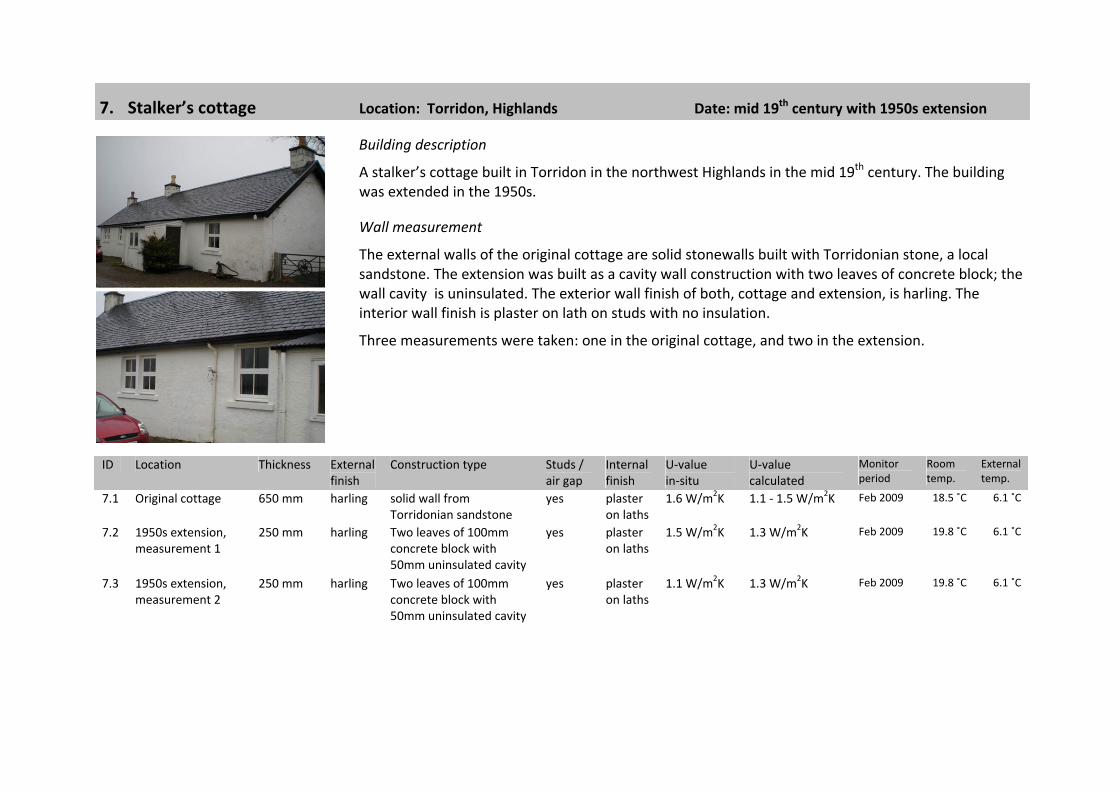
7. Stalker’s cottage Location: Torridon, Highlands Date: mid 19th century with 1950s extension
Building description
A stalker’s cottage built in Torridon in the northwest Highlands in the mid 19th century. The building was extended in the 1950s.
Wall measurement
The external walls of the original cottage are solid stonewalls built with Torridonian stone, a local sandstone. The extension was built as a cavity wall construction with two leaves of concrete block; the wall cavity is uninsulated. The exterior wall finish of both, cottage and extension, is harling. The interior wall finish is plaster on lath on studs with no insulation.
Three measurements were taken: one in the original cottage, and two in the extension.
ID Location Thickness External finish
Construction type Studs / air gap
Internal finish
U‐value in‐situ
U‐value calculated
Monitor period
Room temp.
External temp.
7.1 Original cottage 650 mm harling solid wall from Torridonian sandstone
yes plaster on laths
1.6 W/m2K 1.1 ‐ 1.5 W/m2K Feb 2009 18.5 ˚C 6.1 ˚C
7.2 1950s extension, measurement 1
250 mm harling Two leaves of 100mm concrete block with 50mm uninsulated cavity
yes plaster on laths
1.5 W/m2K 1.3 W/m2K Feb 2009 19.8 ˚C 6.1 ˚C
7.3 1950s extension, measurement 2
250 mm harling Two leaves of 100mm concrete block with 50mm uninsulated cavity
yes plaster on laths
1.1 W/m2K 1.3 W/m2K Feb 2009 19.8 ˚C 6.1 ˚C
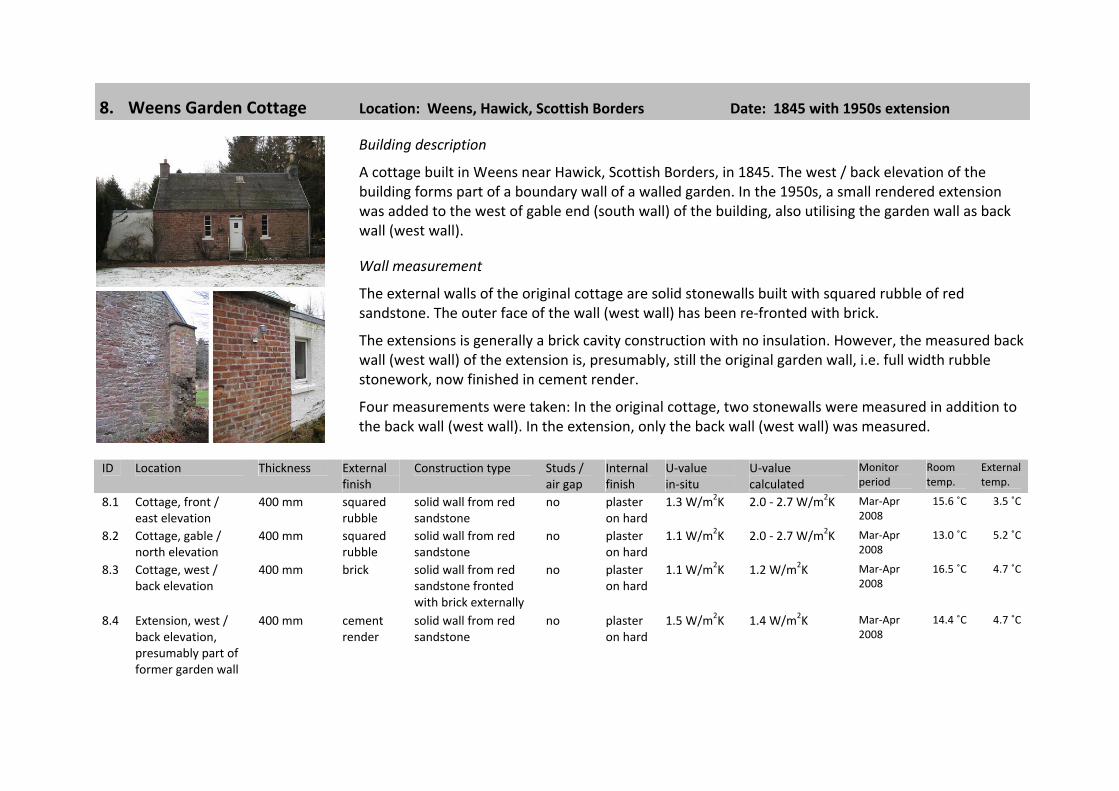
8. Weens Garden Cottage Location: Weens, Hawick, Scottish Borders Date: 1845 with 1950s extension
Building description
A cottage built in Weens near Hawick, Scottish Borders, in 1845. The west / back elevation of the building forms part of a boundary wall of a walled garden. In the 1950s, a small rendered extension was added to the west of gable end (south wall) of the building, also utilising the garden wall as back wall (west wall).
Wall measurement
The external walls of the original cottage are solid stonewalls built with squared rubble of red sandstone. The outer face of the wall (west wall) has been re‐fronted with brick.
The extensions is generally a brick cavity construction with no insulation. However, the measured back wall (west wall) of the extension is, presumably, still the original garden wall, i.e. full width rubble stonework, now finished in cement render.
Four measurements were taken: In the original cottage, two stonewalls were measured in addition to the back wall (west wall). In the extension, only the back wall (west wall) was measured.
ID Location Thickness External finish
Construction type Studs / air gap
Internal finish
U‐value in‐situ
U‐value calculated
Monitor period
Room temp.
External temp.
8.1 Cottage, front / east elevation
400 mm squared rubble
solid wall from red sandstone
no plaster on hard
1.3 W/m2K 2.0 ‐ 2.7 W/m2K Mar‐Apr 2008
15.6 ˚C 3.5 ˚C
8.2 Cottage, gable / north elevation
400 mm squared rubble
solid wall from red sandstone
no plaster on hard
1.1 W/m2K 2.0 ‐ 2.7 W/m2K Mar‐Apr 2008
13.0 ˚C 5.2 ˚C
8.3 Cottage, west / back elevation
400 mm brick solid wall from red sandstone fronted with brick externally
no plaster on hard
1.1 W/m2K 1.2 W/m2K Mar‐Apr 2008
16.5 ˚C 4.7 ˚C
8.4 Extension, west / back elevation, presumably part of former garden wall
400 mm cement render
solid wall from red sandstone
no plaster on hard
1.5 W/m2K 1.4 W/m2K Mar‐Apr 2008
14.4 ˚C 4.7 ˚C
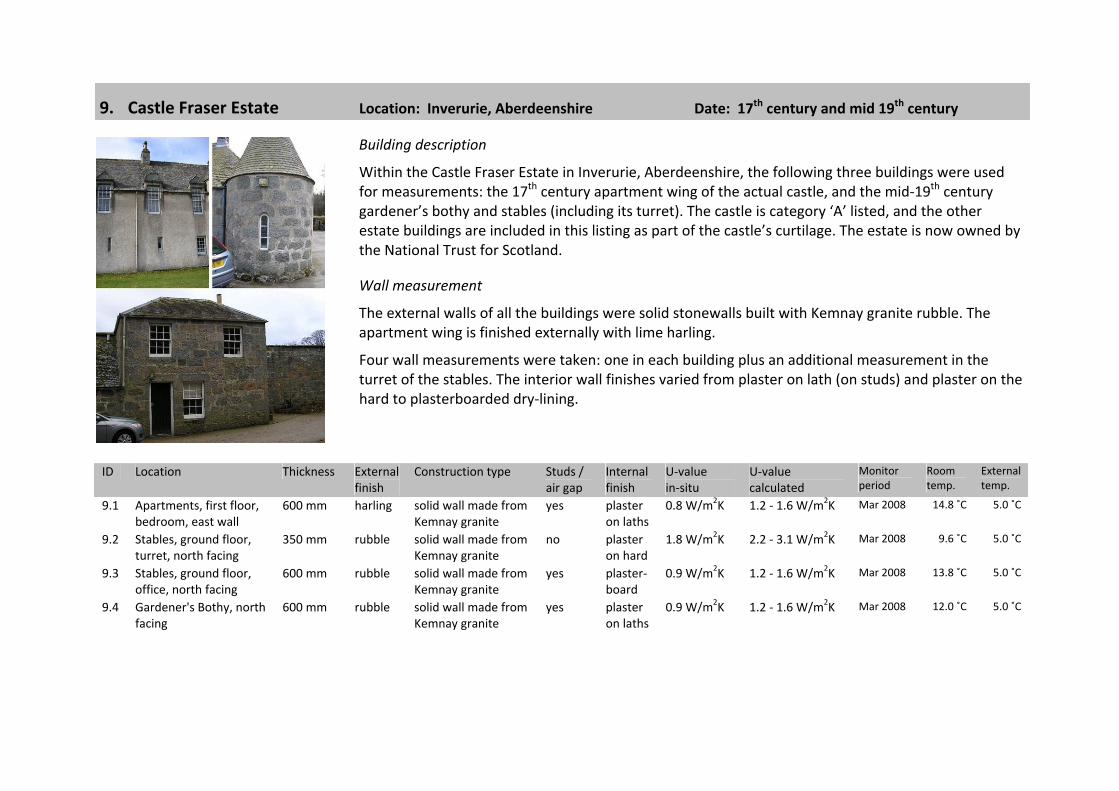
9. Castle Fraser Estate Location: Inverurie, Aberdeenshire Date: 17th century and mid 19th century
Building description
Within the Castle Fraser Estate in Inverurie, Aberdeenshire, the following three buildings were used for measurements: the 17th century apartment wing of the actual castle, and the mid‐19th century gardener’s bothy and stables (including its turret). The castle is category ‘A’ listed, and the other estate buildings are included in this listing as part of the castle’s curtilage. The estate is now owned by the National Trust for Scotland.
Wall measurement
The external walls of all the buildings were solid stonewalls built with Kemnay granite rubble. The apartment wing is finished externally with lime harling.
Four wall measurements were taken: one in each building plus an additional measurement in the turret of the stables. The interior wall finishes varied from plaster on lath (on studs) and plaster on the hard to plasterboarded dry‐lining.
ID Location Thickness External finish
Construction type Studs / air gap
Internal finish
U‐value in‐situ
U‐value calculated
Monitor period
Room temp.
External temp.
9.1 Apartments, first floor, bedroom, east wall
600 mm harling solid wall made from Kemnay granite
yes plaster on laths
0.8 W/m2K 1.2 ‐ 1.6 W/m2K Mar 2008 14.8 ˚C 5.0 ˚C
9.2 Stables, ground floor, turret, north facing
350 mm rubble solid wall made from Kemnay granite
no plaster on hard
1.8 W/m2K 2.2 ‐ 3.1 W/m2K Mar 2008 9.6 ˚C 5.0 ˚C
9.3 Stables, ground floor, office, north facing
600 mm rubble solid wall made from Kemnay granite
yes plaster‐board
0.9 W/m2K 1.2 ‐ 1.6 W/m2K Mar 2008 13.8 ˚C 5.0 ˚C
9.4 Gardener's Bothy, north facing
600 mm rubble solid wall made from Kemnay granite
yes plaster on laths
0.9 W/m2K 1.2 ‐ 1.6 W/m2K Mar 2008 12.0 ˚C 5.0 ˚C
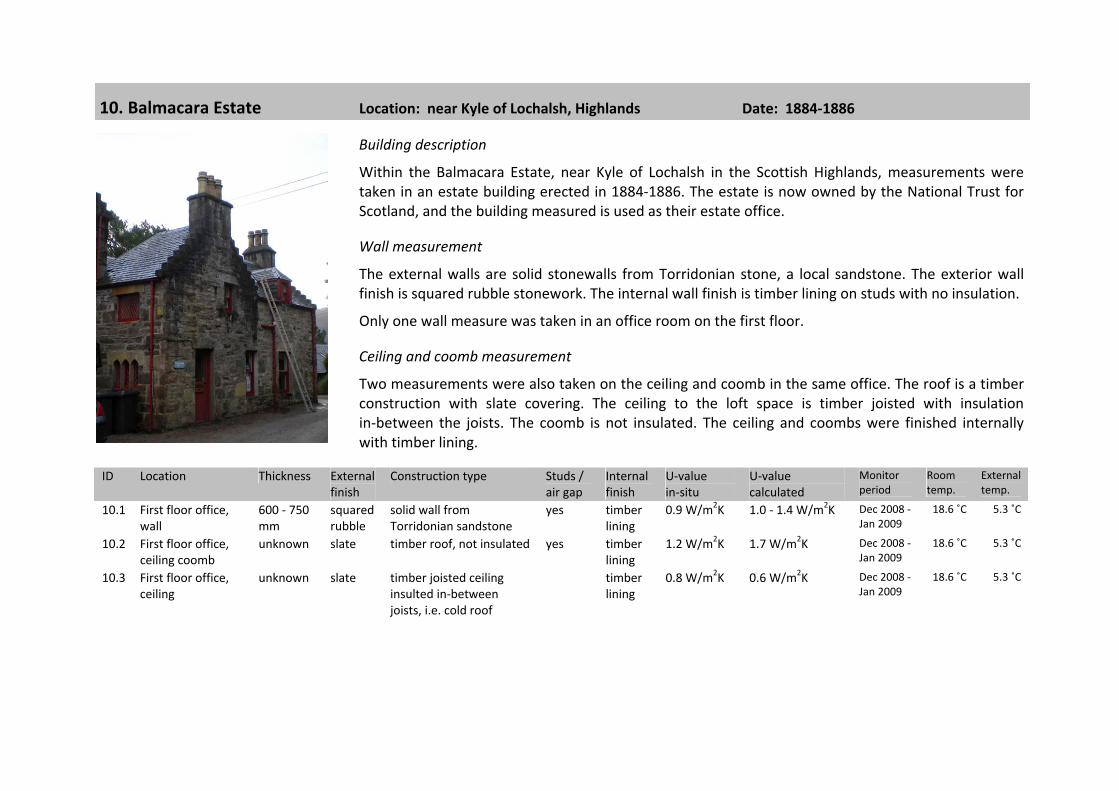
10. Balmacara Estate Location: near Kyle of Lochalsh, Highlands Date: 1884‐1886
Building description
Within the Balmacara Estate, near Kyle of Lochalsh in the Scottish Highlands, measurements were taken in an estate building erected in 1884‐1886. The estate is now owned by the National Trust for Scotland, and the building measured is used as their estate office.
Wall measurement
The external walls are solid stonewalls from Torridonian stone, a local sandstone. The exterior wall finish is squared rubble stonework. The internal wall finish is timber lining on studs with no insulation.
Only one wall measure was taken in an office room on the first floor.
Ceiling and coomb measurement
Two measurements were also taken on the ceiling and coomb in the same office. The roof is a timber construction with slate covering. The ceiling to the loft space is timber joisted with insulation in‐between the joists. The coomb is not insulated. The ceiling and coombs were finished internally with timber lining.
ID Location Thickness External finish
Construction type Studs / air gap
Internal finish
U‐value in‐situ
U‐value calculated
Monitor period
Room temp.
External temp.
10.1 First floor office, wall
600 ‐ 750 mm
squared rubble
solid wall from Torridonian sandstone
yes timber lining
0.9 W/m2K 1.0 ‐ 1.4 W/m2K Dec 2008 ‐Jan 2009
18.6 ˚C 5.3 ˚C
10.2 First floor office, ceiling coomb
unknown slate timber roof, not insulated yes timber lining
1.2 W/m2K 1.7 W/m2K Dec 2008 ‐Jan 2009
18.6 ˚C 5.3 ˚C
10.3 First floor office, ceiling
unknown slate timber joisted ceiling insulted in‐between joists, i.e. cold roof
timber lining
0.8 W/m2K 0.6 W/m2K Dec 2008 ‐Jan 2009
18.6 ˚C 5.3 ˚C
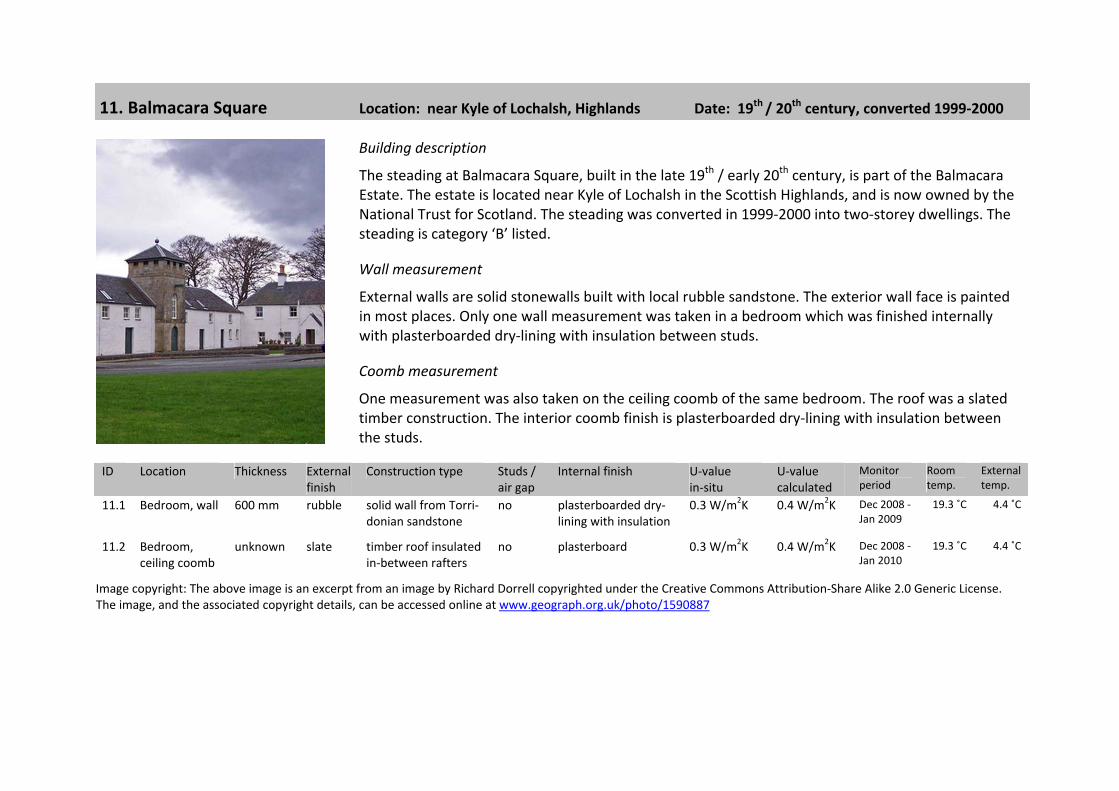
11. Balmacara Square Location: near Kyle of Lochalsh, Highlands Date: 19th / 20th century, converted 1999‐2000
Building description
The steading at Balmacara Square, built in the late 19th / early 20th century, is part of the Balmacara Estate. The estate is located near Kyle of Lochalsh in the Scottish Highlands, and is now owned by the National Trust for Scotland. The steading was converted in 1999‐2000 into two‐storey dwellings. The steading is category ‘B’ listed.
Wall measurement
External walls are solid stonewalls built with local rubble sandstone. The exterior wall face is painted in most places. Only one wall measurement was taken in a bedroom which was finished internally with plasterboarded dry‐lining with insulation between studs.
Coomb measurement
One measurement was also taken on the ceiling coomb of the same bedroom. The roof was a slated timber construction. The interior coomb finish is plasterboarded dry‐lining with insulation between the studs.
ID Location Thickness External finish
Construction type Studs / air gap
Internal finish U‐value in‐situ
U‐value calculated
Monitor period
Room temp.
External temp.
11.1 Bedroom, wall 600 mm rubble solid wall from Torri‐donian sandstone
no plasterboarded dry‐lining with insulation
0.3 W/m2K 0.4 W/m2K Dec 2008 ‐Jan 2009
19.3 ˚C 4.4 ˚C
11.2 Bedroom, ceiling coomb
unknown slate timber roof insulated in‐between rafters
no plasterboard 0.3 W/m2K 0.4 W/m2K Dec 2008 ‐Jan 2010
19.3 ˚C 4.4 ˚C
Image copyright: The above image is an excerpt from an image by Richard Dorrell copyrighted under the Creative Commons Attribution‐Share Alike 2.0 Generic License. The image, and the associated copyright details, can be accessed online at www.geograph.org.uk/photo/1590887
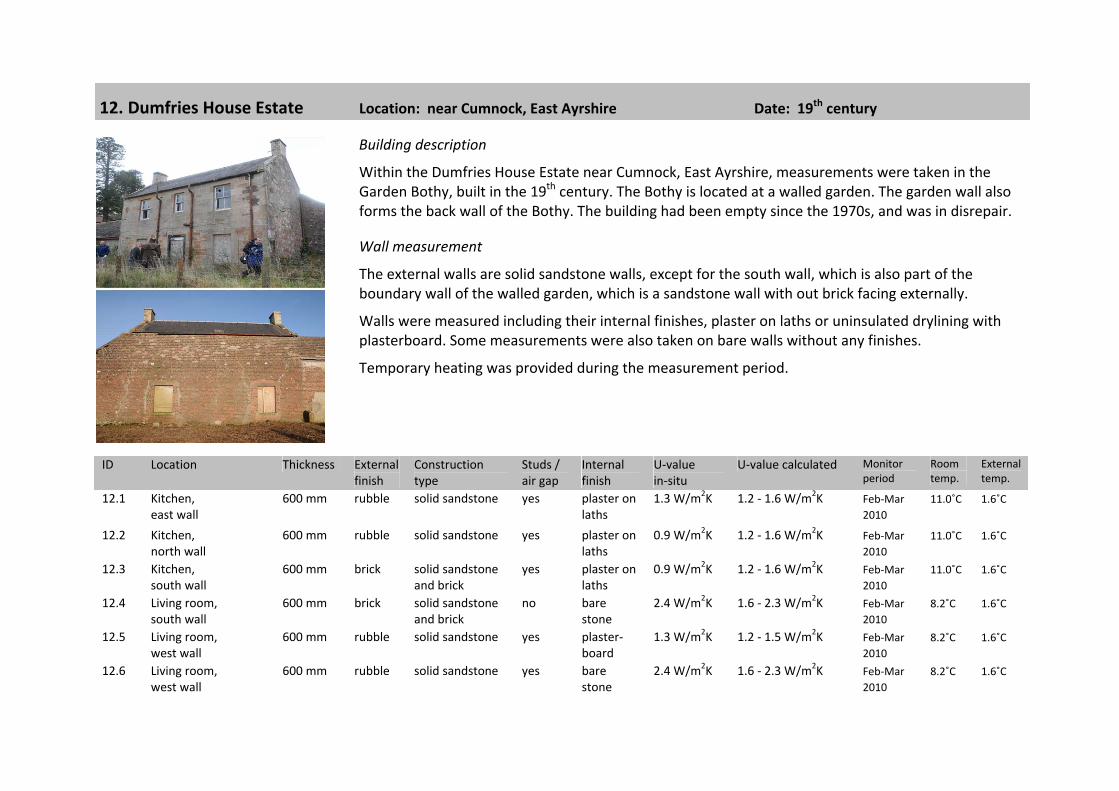
12. Dumfries House Estate Location: near Cumnock, East Ayrshire Date: 19th century
Building description
Within the Dumfries House Estate near Cumnock, East Ayrshire, measurements were taken in the Garden Bothy, built in the 19th century. The Bothy is located at a walled garden. The garden wall also forms the back wall of the Bothy. The building had been empty since the 1970s, and was in disrepair.
Wall measurement
The external walls are solid sandstone walls, except for the south wall, which is also part of the boundary wall of the walled garden, which is a sandstone wall with out brick facing externally.
Walls were measured including their internal finishes, plaster on laths or uninsulated drylining with plasterboard. Some measurements were also taken on bare walls without any finishes.
Temporary heating was provided during the measurement period.
ID Location Thickness External finish
Construction type
Studs / air gap
Internal finish
U‐value in‐situ
U‐value calculated Monitor period
Room temp.
External temp.
12.1 Kitchen, east wall
600 mm rubble solid sandstone yes plaster on laths
1.3 W/m2K 1.2 ‐ 1.6 W/m2K Feb‐Mar 2010
11.0˚C 1.6˚C
12.2 Kitchen, north wall
600 mm rubble solid sandstone yes plaster on laths
0.9 W/m2K 1.2 ‐ 1.6 W/m2K Feb‐Mar 2010
11.0˚C 1.6˚C
12.3 Kitchen, south wall
600 mm brick solid sandstone and brick
yes plaster on laths
0.9 W/m2K 1.2 ‐ 1.6 W/m2K Feb‐Mar 2010
11.0˚C 1.6˚C
12.4 Living room, south wall
600 mm brick solid sandstone and brick
no bare stone
2.4 W/m2K 1.6 ‐ 2.3 W/m2K Feb‐Mar 2010
8.2˚C 1.6˚C
12.5 Living room, west wall
600 mm rubble solid sandstone yes plaster‐board
1.3 W/m2K 1.2 ‐ 1.5 W/m2K Feb‐Mar 2010
8.2˚C 1.6˚C
12.6 Living room, west wall
600 mm rubble solid sandstone yes bare stone
2.4 W/m2K 1.6 ‐ 2.3 W/m2K Feb‐Mar 2010
8.2˚C 1.6˚C
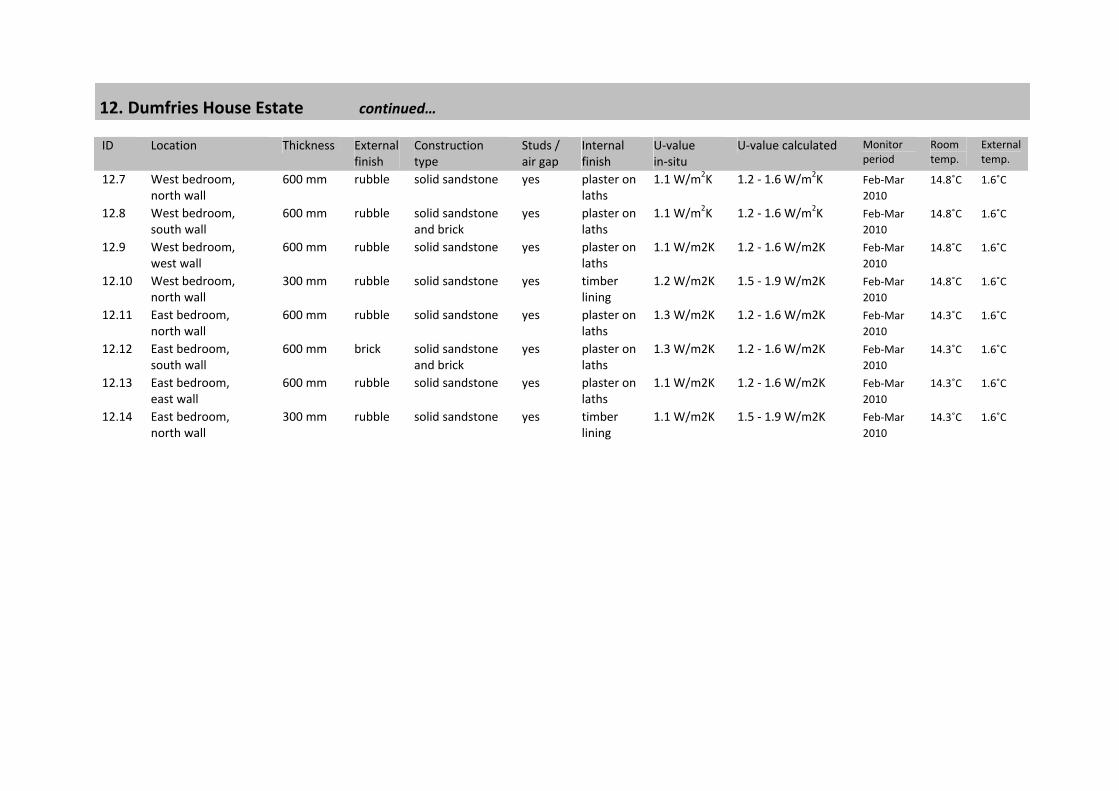
12. Dumfries House Estate continued… ID Location Thickness External
finish Construction type
Studs / air gap
Internal finish
U‐value in‐situ
U‐value calculated Monitor period
Room temp.
External temp.
12.7 West bedroom, north wall
600 mm rubble solid sandstone yes plaster on laths
1.1 W/m2K 1.2 ‐ 1.6 W/m2K Feb‐Mar 2010
14.8˚C 1.6˚C
12.8 West bedroom, south wall
600 mm rubble solid sandstone and brick
yes plaster on laths
1.1 W/m2K 1.2 ‐ 1.6 W/m2K Feb‐Mar 2010
14.8˚C 1.6˚C
12.9 West bedroom, west wall
600 mm rubble solid sandstone yes plaster on laths
1.1 W/m2K 1.2 ‐ 1.6 W/m2K Feb‐Mar 2010
14.8˚C 1.6˚C
12.10 West bedroom, north wall
300 mm rubble solid sandstone yes timber lining
1.2 W/m2K 1.5 ‐ 1.9 W/m2K Feb‐Mar 2010
14.8˚C 1.6˚C
12.11 East bedroom, north wall
600 mm rubble solid sandstone yes plaster on laths
1.3 W/m2K 1.2 ‐ 1.6 W/m2K Feb‐Mar 2010
14.3˚C 1.6˚C
12.12 East bedroom, south wall
600 mm brick solid sandstone and brick
yes plaster on laths
1.3 W/m2K 1.2 ‐ 1.6 W/m2K Feb‐Mar 2010
14.3˚C 1.6˚C
12.13 East bedroom, east wall
600 mm rubble solid sandstone yes plaster on laths
1.1 W/m2K 1.2 ‐ 1.6 W/m2K Feb‐Mar 2010
14.3˚C 1.6˚C
12.14 East bedroom, north wall
300 mm rubble solid sandstone yes timber lining
1.1 W/m2K 1.5 ‐ 1.9 W/m2K Feb‐Mar 2010
14.3˚C 1.6˚C
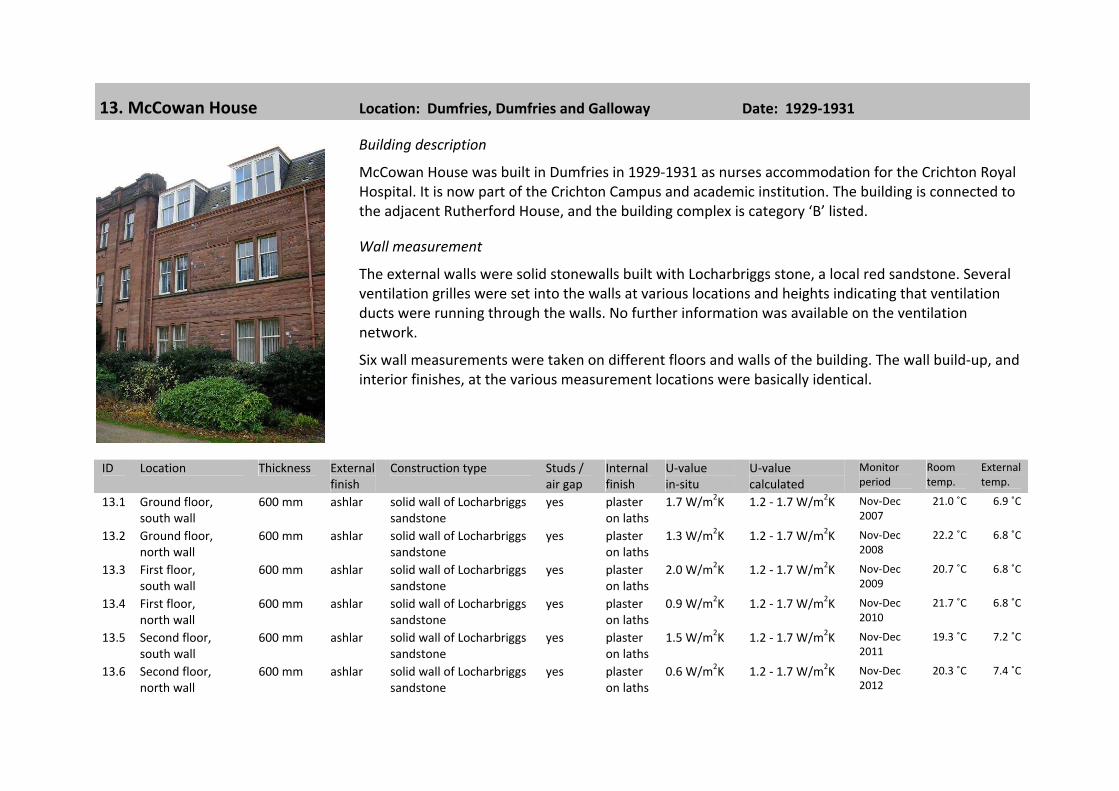
13. McCowan House Location: Dumfries, Dumfries and Galloway Date: 1929‐1931
Building description
McCowan House was built in Dumfries in 1929‐1931 as nurses accommodation for the Crichton Royal Hospital. It is now part of the Crichton Campus and academic institution. The building is connected to the adjacent Rutherford House, and the building complex is category ‘B’ listed.
Wall measurement
The external walls were solid stonewalls built with Locharbriggs stone, a local red sandstone. Several ventilation grilles were set into the walls at various locations and heights indicating that ventilation ducts were running through the walls. No further information was available on the ventilation network.
Six wall measurements were taken on different floors and walls of the building. The wall build‐up, and interior finishes, at the various measurement locations were basically identical.
ID Location Thickness External finish
Construction type Studs / air gap
Internal finish
U‐value in‐situ
U‐value calculated
Monitor period
Room temp.
External temp.
13.1 Ground floor, south wall
600 mm ashlar solid wall of Locharbriggs sandstone
yes plaster on laths
1.7 W/m2K 1.2 ‐ 1.7 W/m2K Nov‐Dec 2007
21.0 ˚C 6.9 ˚C
13.2 Ground floor, north wall
600 mm ashlar solid wall of Locharbriggs sandstone
yes plaster on laths
1.3 W/m2K 1.2 ‐ 1.7 W/m2K Nov‐Dec 2008
22.2 ˚C 6.8 ˚C
13.3 First floor, south wall
600 mm ashlar solid wall of Locharbriggs sandstone
yes plaster on laths
2.0 W/m2K 1.2 ‐ 1.7 W/m2K Nov‐Dec 2009
20.7 ˚C 6.8 ˚C
13.4 First floor, north wall
600 mm ashlar solid wall of Locharbriggs sandstone
yes plaster on laths
0.9 W/m2K 1.2 ‐ 1.7 W/m2K Nov‐Dec 2010
21.7 ˚C 6.8 ˚C
13.5 Second floor, south wall
600 mm ashlar solid wall of Locharbriggs sandstone
yes plaster on laths
1.5 W/m2K 1.2 ‐ 1.7 W/m2K Nov‐Dec 2011
19.3 ˚C 7.2 ˚C
13.6 Second floor, north wall
600 mm ashlar solid wall of Locharbriggs sandstone
yes plaster on laths
0.6 W/m2K 1.2 ‐ 1.7 W/m2K Nov‐Dec 2012
20.3 ˚C 7.4 ˚C
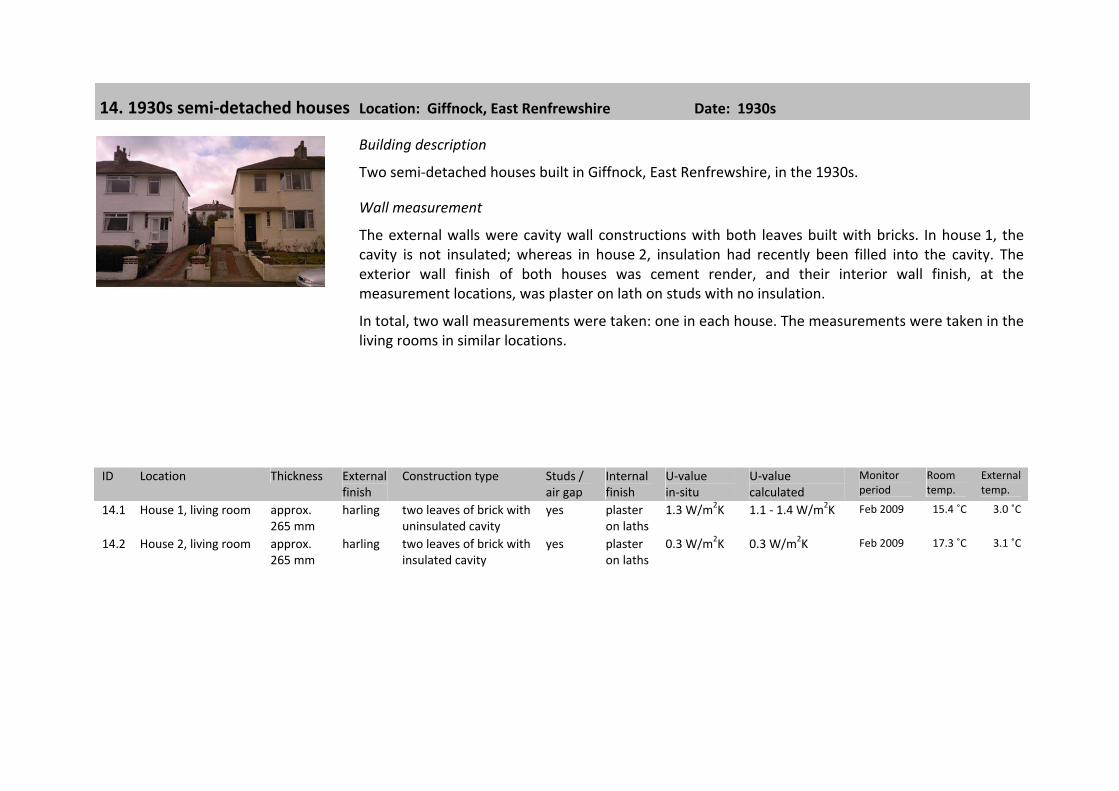
14. 1930s semi‐detached houses Location: Giffnock, East Renfrewshire Date: 1930s
Building description
Two semi‐detached houses built in Giffnock, East Renfrewshire, in the 1930s.
Wall measurement
The external walls were cavity wall constructions with both leaves built with bricks. In house 1, the cavity is not insulated; whereas in house 2, insulation had recently been filled into the cavity. The exterior wall finish of both houses was cement render, and their interior wall finish, at the measurement locations, was plaster on lath on studs with no insulation.
In total, two wall measurements were taken: one in each house. The measurements were taken in the living rooms in similar locations.
ID Location Thickness External finish
Construction type Studs / air gap
Internal finish
U‐value in‐situ
U‐value calculated
Monitor period
Room temp.
External temp.
14.1 House 1, living room approx. 265 mm
harling two leaves of brick with uninsulated cavity
yes plaster on laths
1.3 W/m2K 1.1 ‐ 1.4 W/m2K Feb 2009 15.4 ˚C 3.0 ˚C
14.2 House 2, living room approx. 265 mm
harling two leaves of brick with insulated cavity
yes plaster on laths
0.3 W/m2K 0.3 W/m2K Feb 2009 17.3 ˚C 3.1 ˚C
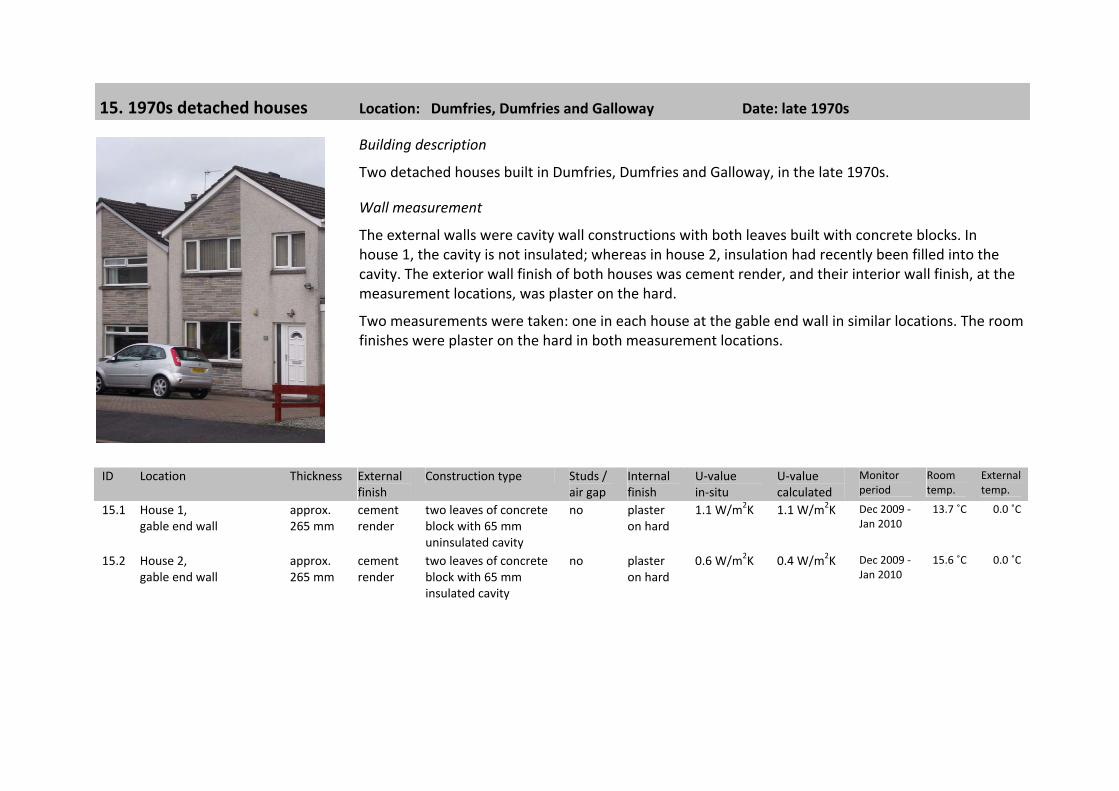
15. 1970s detached houses Location: Dumfries, Dumfries and Galloway Date: late 1970s
Building description
Two detached houses built in Dumfries, Dumfries and Galloway, in the late 1970s.
Wall measurement
The external walls were cavity wall constructions with both leaves built with concrete blocks. In house 1, the cavity is not insulated; whereas in house 2, insulation had recently been filled into the cavity. The exterior wall finish of both houses was cement render, and their interior wall finish, at the measurement locations, was plaster on the hard.
Two measurements were taken: one in each house at the gable end wall in similar locations. The room finishes were plaster on the hard in both measurement locations.
ID Location Thickness External finish
Construction type Studs / air gap
Internal finish
U‐value in‐situ
U‐value calculated
Monitor period
Room temp.
External temp.
15.1 House 1, gable end wall
approx. 265 mm
cement render
two leaves of concrete block with 65 mm uninsulated cavity
no plaster on hard
1.1 W/m2K 1.1 W/m2K Dec 2009 ‐ Jan 2010
13.7 ˚C 0.0 ˚C
15.2 House 2, gable end wall
approx. 265 mm
cement render
two leaves of concrete block with 65 mm insulated cavity
no plaster on hard
0.6 W/m2K 0.4 W/m2K Dec 2009 ‐ Jan 2010
15.6 ˚C 0.0 ˚C
Published by Historic Scotland
Conservation Group
January 2011
Historic Scotland, Longmore House, Salisbury Place, Edinburgh, EH9 1SH
Telephone: 0131 668 8600 Website: www.historic‐scotland.gov.uk
Email: [email protected]
© Crown copyright