technical meeting aeso’s 2015 forecasts, own costs budget stakeholder meeting october 6 and 8,...
TRANSCRIPT

Technical MeetingAESO’s 2015 Forecasts, Own Costs Budget
Stakeholder Meeting
October 6 and 8, 2014

2
Purpose
• Purpose of this presentation is to:
– Provide stakeholders with an overview of:
• AESO’s 2015 Pool Price, Ancillary Services and Transmission Line Losses Costs Forecasts
• AESO’s 2015 draft Own Costs budget
• Update on the Market Systems Replacement project
• Update on the Energy Management System project
• Obtain preliminary feedback
– Provide stakeholders with a BRP status update and discuss next steps

3
2015 BRP - StepsStatus Update
Step Activity
1.0 Invitation to Stakeholders
Initiate annual consultation process
2.0 AESO Business Initiatives
Present preliminary list of business initiatives and solicit stakeholder feedback
3.0 Develop Own, Ancillary Service and Line Loss Forecasts
Develop Own Costs (G&A/Capital/Other Industry) budget, Ancillary Services and Line Loss Cost forecasts
4.0 Technical Review Meeting
Present and solicit feedback on Own Costs budget, Ancillary Services and Transmission Line Loss Cost forecasts
5.0 AESO Board Decision
Draft AESO Board Decision DocumentAESO Board meets with stakeholders to discuss issues AESO Board issues final decision
6.0 Dispute Process Available for instances where stakeholder disagrees with the AESO Board Decision

4
2015 BRP - Steps Calendar (revised)
3.0 Develop AESO Own Costs,Ancillary Service and Line Loss
Forecasts (internal)June - September
4.0 Technical ReviewMeetings with Stakeholders
September 22 - Business Initiatives October 6 (Calgary) and October 8 (Edmonton) - Ancillary Service, Transmission Line Losses Costs
Forecast and Own Costs
AESO BoardDecision
5.0 AESO Board DecisionNovember 14 – Stakeholder presentations
1.0 Notice to Stakeholders2.0 Updated Business Initiatives
5.0 AESO Board Decision(continued) - finalize

2015 Pool Price Forecast
October 2014

6
The information contained in this document is published in accordance with the AESO’s legislative obligations and is for information purposes only. As such, the AESO makes no warranties or representations as to the accuracy, completeness or fitness for any particular purpose with respect to the information contained herein, whether express or implied. While the AESO has made every attempt to ensure the information contained herein represents a reasonable forecast, the AESO is not responsible for any errors or omissions. Consequently, any reliance placed on the information contained herein is at the reader’s sole risk.

7
Purpose of AESO Price Forecast
• Hourly Price Forecast is Required for the Budget Review Process
– Forecast feeds cost calculations for Ancillary Services and Transmission Losses
• Third year of the AESO providing a Forecast
– Price Forecasts from EDC were used prior to the 2013 BRP

8
Forecast Methodology
• Created Using the AURORAxmp Power Market Model
– Model reflects the Alberta Market Fundamentals
• Random Variables are Used to Generate Price Volatility
– Forced Outages – random times and duration
– Demand – accounts for weather impact
– Gas Prices – lognormal distribution of monthly gas prices
– potential long-term forced outages, congestion, unanticipated load growth, wind output, and high/low hydro years are currently not modeled using random variables
• Price Simulation
– Ran 1001 separate price simulations
– Price distributions reflect volatility seen in the Alberta Market

9
Load Forecast

10
Supply Additions

11
2015 Simulation Results
Results from 1001 Price Simulations
Results from the P95 Simulation and Comparables
Mean Min P5 P25 Median P75 P95 MaxOn-Peak $43.31 $36.07 $39.39 $41.36 $43.12 $44.89 $47.85 $56.72 Off-Peak $26.68 $24.06 $25.28 $26.17 $26.67 $27.21 $28.76 $29.90 Flat $37.77 $32.20 $34.66 $36.29 $37.64 $38.97 $41.49 $47.78
Pool Price ($/MWh)
AESO
On-Peak $47.85 $62.37 Off-Peak $28.76 $19.90 Flat $41.49 $48.21
Period Forward Market(as of Sep. 15, 2014)

12
Actual/Forecast Price Comparison
• 2015 forecast is based on the P95 iteration

13
2014 Daily Price Duration Curve

2015 Ancillary Services Cost Forecast
October 2014

15
Cost of Ancillary ServicesAnnual ComparisonAll costs in $-millions
2013Forecast
2013Actual
2014Forecast
2014Projected
2015Forecast
Operating Reserve *
$181.2 $362.1 $193.7 $219.7 $130.5
TMR * $2.0 $2.6 - - -
Blackstart $5.0 $1.0 $2.8 $1.0 $5.0
LSS/LSSi $68.7 $21.2 $25.4 $22.5 $25.0
Other $2.3 $2.5 $2.5 $2.7 $2.5
Total $259.2 $389.4 $224.5 $245.9 $163.0
2013 Forecast
2013Actual
2014Forecast
2014Projected
2015Forecast
Pool Price $60.47 $80.19 $48.48 $59.39 $41.49
Gas Price $3.03 $3.01 $3.28 $4.37 $3.99
* Conscripted TMR and Operating Reserves not included in the table above

16
Forecast Methodology Operating Reserves
• Annual cost of OR is estimated by the sum of forecasted hourly OR volumes (governed by WECC requirements) multiplied by the forecasted hourly price of OR
• Forecasted cost of OR is evaluated once for each of the 1001 pool price simulations
All costs in $-millions
2013 Forecast
2014Forecast
2015Forecast
P95 $181.2 $193.7 $130.5
Max $271.1 $366.4 $261.5

17
Forecast Methodology Contracted TMR and Other Ancillary Services
• Annual TMR cost forecast based on historical contract costs
• Annual LSSi cost forecast based on current monthly averages and expected costs for 2015
• Annual blackstart cost forecast based on contract terms governing compensation and expected new contracts in 2015
All costs in $-millions 2015 Forecast
Transmission Must Run -
Blackstart $5.0
LSS/LSSi $25.0
Other $2.5

2015 Transmission Line LossesCost Forecast
18

19
Cost of Transmission Line LossesAnnual Comparison
2011 Actual
2012Actual
2013 Actual
2014 Projected
2015 Forecast
Cost($-millions)
$183.3 $150.5 $181.7 $145.1 $105.3
Volume (GWh)
2,384 2,255 2,321 2,361 2,472
2011 Actual
2012Actual
2013 Actual
2014 Projected
2015 Forecast
Pool Price($-millions)
$76.22 $64.32 $80.19 $59.39 $41.49

20
Forecast MethodologyLine Losses
• Annual cost of transmission line losses is estimated by the sum of forecasted hourly volumes multiplied by the forecasted pool price
• Forecasted cost of line losses is evaluated once for each of the 1001 pool price simulations
All costs in $-millions
2013 Forecast
2014Forecast
2015Forecast
P95 $136.9 $117.3 $105.3
Max $168.9 $139.0 $120.6

Draft 2015 Own Costs Budget

22
2015 Budget Overview
• 2015 G&A budget
• 2015 capital budget excluding major projects
2012 2013 2014 201590
92
94
96
98
100
93.1
98.3
96.0
94.0
$ M
illio
n
2012 2013 2014 20150
5
10
15
20
25
30 27.5 27.0
19.916.0
$ M
illio
n

23
General & Administrative CostsYTD August 2014
$ MillionYTD Aug
Actual*YTD Aug Budget*
YTD Aug Variance
Forecast Year End Variance
2014 Budget*
Staff Costs 41.1 41.2 (0.1) 61.8
Contract Services and Consultants
8.2 8.5 (0.3) 12.6
Administration 3.3 3.6 (0.4) 5.5
Facilities 4.0 4.2 (0.2) 6.3
Computer Services and Maintenance
5.8 5.5 0.3 8.3
Telecommunications 0.9 1.0 0.0 1.5
Total Costs 63.2 64.0 (0.8) 0.0 96.0
* Excludes the Market Systems Replacement Validation Project approved for $2.0 million
Differences are due to rounding
Market Systems Replacement (MSR) Project 1.2 1.3 (0.1) (0.1) 2.0

24
2015 Budget Overview
• Continued delivery for AESO and industry required initiatives
– Refer to business initiative presentation
– Most 2015 initiatives began in 2014 or prior years
• Reflects efficiencies and corporate focus
• Leverage existing work to reduce ongoing effort
• Capital development focus on major system projects
– Limited system enhancements in 2015
• Limited flexibility to incorporate unanticipated initiatives
– Consistent with prior budgets, significant changes will require additional review and approval

25
General & Administrative Costs2015 Preliminary Budget
$ Million2014
Forecast2014
Budget2015
Budget
Staff Costs 61.8 61.4
Contract Services and Consultants 12.6 9.8
Administration 5.5 4.9
Facilities 6.3 7.9
Computer Services and Maintenance 8.3 8.6
Telecommunications 1.5 1.4
Total Costs 96.0 96.0 94.0
Differences are due to rounding
Market Systems Replacement (G&A) 1.9 2.0 0.5

26
Notable Changes in 2015
• Progression of Competitive Process
– Integration of Fort McMurray West transmission line
– Begin Fort McMurray East transmission line process
• 3.5% salary adjustment to maintain market-based compensation
• Rent and operating cost changes on existing leased facilities
• Assignment of existing staff to major project work
– Day-to-day operational requirements for these positions reduced during the project which eliminates need to back-fill
– Energy Management System upgrade, Market Systems Replacement
• Net new maintenance and support costs associated with annual capital investments

27
$ Million
2014 Approved Budget * 96.0
Staff Costs (0.4)
Annual salary adjustment (3.5%) 2.0
Capital business resources on major projects (7 FTE ) (1.2)
Staff retention plan (last phase ends Dec 2014) (0.7)
General staff costs (0.6)
Contract Services (2.9)
Administration (0.5)
Facilities 1.5
Computer Services 0.3 (2.0)
2015 Preliminary Budget * 94.0
2015 Preliminary Budget
* Excludes Market System Replacement project

28
Competitive Process Initiative
$ Million2013
Plan2013
Actual2014
Plan2015
Plan
Development of Tendering and Commercial Documents
0.9 2.7 1.4 0.6
Evaluation Teams & Fairness Advisor
1.2 1.4 1.0 0.4
Route Development & Owner’s Engineer
1.7 0.7 1.2 0.4
Integration Costs (AESO internal staff)
1.0 1.0 1.0 1.0
Communications 0.8 0.4 0.3 0.2
Issues Based Outreach - 0.2 0.4 0.3
Total G&A Costs 5.6 6.2 5.4 2.8
Differences are due to rounding

29
Transmission Cost Monitoring and Oversight Initiative
Transmission Cost Monitoringand Oversight
2013 Plan
2014 Plan
2015 Plan
Staff (number of staff resources) 4 3 3
Contract resources ($ million) 0.5 0.1 0.1
Capital investment ($ million) 0.3 0.2 -
30
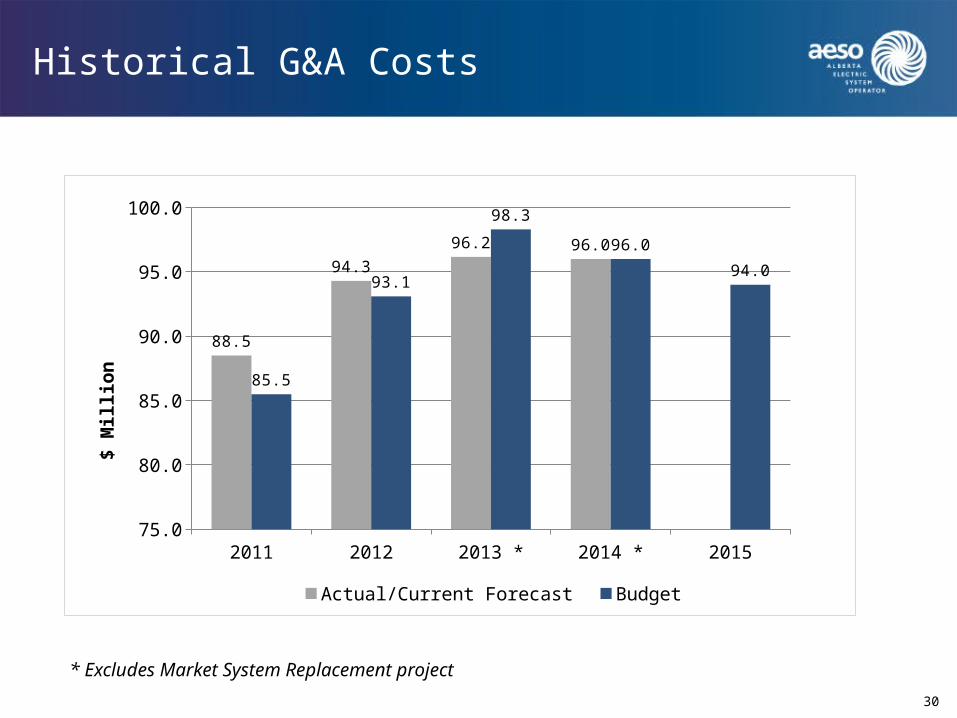
Historical G&A Costs
2011 2012 2013 * 2014 * 201575.0
80.0
85.0
90.0
95.0
100.0
88.5
94.3
96.2 96.0
85.5
93.1
98.3
96.0
94.0
Actual/Current Forecast Budget
$ M
illio
n
* Excludes Market System Replacement project

31
Interest and Amortization
$ MillionYTD Aug
ActualYTD Aug
BudgetYTD Aug Variance
2014 Budget
2015 Budget
Interest 0.1 0.3 (0.2) 0.5 0.5
Amortization 17.3 18.2 (0.9) 27.3 In Progress

32
Other Industry Costs
$ MillionYTD Aug
ActualYTD Aug
BudgetYTD Aug Variance
2014 Budget
2015 Budget
AUC Fees – Transmission 8.7 9.1 (0.3) 13.6 14.0
AUC Fees – Energy Market 4.6 4.8 (0.2) 7.2 7.2
Regulatory Process Costs 0.7 1.2 (0.5) 1.8 In Progress
WECC/NWPP* Costs 0.7 0.9 (0.2) 1.3 1.0
Total Costs 14.8 15.9 (1.1) 23.9
* Western Electricity Coordinating Council / Northwest Power Pool

33
Activity-based Cost Reporting
• A transparent presentation of the AESO’s operating costs
• Operations of the AESO described using five key processes
– Key processes are unchanged from 2014
• Activity reporting allows for more detailed understanding of the resources required for process delivery
• Multi-year comparisons will identify shift in priorities/ focus
– No significant shift has occurred in 2015

34
not actual data
Summary of AESO G&A Costs
Budget of $94 million
Computer Services and Telecomm ($10 million)
Facilities ($8 million)
Staff and Contract Services ($61 million)
Administration ($5 million)
Information Technology Services ~ Resources ($11 million)
2. Electric System Development
1. Electric System Operations
4. Market Development
3. Customer Access Services
5. Corporate Services
2. Electric System
1. Electric System Operations
4. Market Development
3. Customer Access Services
5. Corporate Services
2014 Budget by Key Process
• Proportion of 2015 costs associated with the five key processes is similar to 2014 ~ no material shift
• Details provided in the final document will include IT costs associated with the five key processes

Capital Budget

36
Capital Budget - Historical
Definitions:
Key Capital Initiatives – Most critical projects that the AESO believes must be completed within the timeframe identified
Other Capital Initiatives – Other projects that have more flexibility in planning or delivery so timing is not as critical
Life Cycle Funding – Hardware replacements (end of useful life) and recurring software upgrades and leasehold improvements
Capital Expenditures ($ million)
2015 2014 2014 2013 2012Budget Forecast Budget Actual Actual
Key Capital Initiatives 7.1 5.4 8.4 8.4 7.7
Other Capital Initiatives 3.3 6.1 5.3 7.4 9.6
Life Cycle Funding 5.6 7.0 6.2 6.2 8.2
Sub total 16.0 18.5 19.9 22.0 25.5
Special - MSR 5.8
Total 21.8
Special - EMS Upgrade Implementation 2.3Business case review expected Q2/3 2015

37
Capital Budget – Key Messages for 2014
• 2014 forecast is $18.5M
– Decrease of $1.4M from 2014 budget of $19.9M
• Factors include– Deferred capital requirements for Business Initiatives - Energy
Management System (EMS) deferred to 2015
– Continued improvements resulting from Portfolio Management Process – roadmaps, change control and resource management

38
Capital Budget - 2015 draft
Capital Expenditures ($ million)2015 2014 1 2014 2013 2012
Budget Forecast Budget Actual ActualKey Capital Initiatives
1. Reliability (EMS2 elements) 3.6 1.4 3.2 0.5 1.2
Reliability (primarily HVDC3 elements) 0.3 1.6 2.0 1.5 - 2. Critical Infrastructure Protection 0.4 - - - - 3. Cyber Security 1.2 0.2 - - - 4. Wind Integration - 0.8 0.9 0.0 0.3
5. FEOC4 Regulation Implementation - - - 0.2 1.0
6. Market Evolution (Incorporates TCM5) 1.2 0.2 0.2 0.6 0.0 7. Demand Response - 0.4 0.6 0.1 0.0 8. Intertie Framework 0.4 0.3 0.6 2.3 3.4 9. Operating Reserve - 0.3 0.5 0.2 -10. Cost Accountability 0.0 0.2 0.3 - -
11. BUCC6 Replacement - - - 2.4 0.4
Total Key Capital Initiatives 7 7.1 5.4 8.4 8.4 7.7
Other Capital Initiatives 3.3 6.1 5.3 7.4 9.6
Life Cycle Funding 5.6 7.0 6.2 6.2 8.2
SubTotal Capital 16.0 18.5 19.9 22.0 25.5
Special - MSR 5.8
Total Capital 21.8
Special - EMS Upgrade Implementation 2.3
Business case review expected Q2/3 2015
1 August 31, 2014. Spent plus estimate to complete for current year. 4 Fair Eff icient Open Competition2 Energy Management System 5 Transmission Constraints Management3 High Voltage Direct Current 6 Back-up Control Centre
7 ISO Tariff /Info Mgt Reclassif ied - Other

39
Capital Budget - Key Messages for 2015
• Initial assessment is that a $21.8M capital budget is required
– Increase of $1.9M from 2014 budget and increase of $3.3M from 2014 forecast
• Factors include– Critical Infrastructure Protection and Cyber Security
requirements (facilities and information technology)
– Planning considerations related to foundational systems
• Market System Replacement project (business applications and supporting infrastructure – $5.8M)
• Energy Management System Upgrade project (advanced applications and supporting infrastructure - $3.6M)
– Reduction in enhancement requirements as a result of foundational system projects

40
Capital Budget - Trend
2012 Actual 2013 Actual 2014 Forecast 2015 BRP0
5
10
15
20
25
30
25.5
22.0
18.5
16.0
Key Other Lifecycle Total Special
$ m
illi
on
s
5.8
TotalCapital Budget
21.8

41
Capital Budget – “Other Capital Initiatives” for 2015 - Summary
• Other application or infrastructure upgrades
– PI Software Upgrade
– System Enhancements
– AESO website tools and content
– Human Resources Management Tool

42
Capital Budget – “Life Cycle Initiatives” for 2015 - Summary
• Investment in general infrastructure
– Communications
– Database
– End User Computing
– Enterprise Services
– Monitoring
– Network
– Non-project Capital
– Servers
– Storage

43
Special Projects
Market Systems Replacement (MSR) Project - Update

MSR Project - Background
Phase I –
Validation/RFI
(2013)
Phase II –
Sourcing/RFP
(2014)
Phase III – Implement
ation (2015 - 2017
tentative)
44
• On December 11, 2013, the AESO Board approved Phase II of the Market System Replacement and Reengineering (MSR) project to address the long term lifecycle needs of our market systems
Business case, plan, and decision to
proceed to Phase II
Business case, plan, cost effective
solution(s) identified, and decision to
proceed to Phase III
In progress

MSR Project - Overview of Phase II Sourcing / RFP
• Implementation strategy– Phase I research indicates that available end-to-end solutions do
not have broad flexibility to mitigate the uncertainty of future market scenarios
– Hence, implementation strategy is to incrementally/iteratively address highest priorities with a minimum amount of change until we gain more certainty regarding future market scenarios
• Phase II objectives align with this strategy:– Refine target state including clear priorities and further defined
business requirements (sufficient for RFP)
– Determine candidate vendors, execute and evaluate RFP(s)
– Establish sequencing and implementation plan for Phase III
45

MSR Project - Phase III RoadmapPhase I – Validation
/RFI
(2013)
Phase II – Sourcing/
RFP
(2014)
Phase III – Implementation (2015 -
2017 tentative)
46
Phase III
Iteration 1 Future Iterations
Design Build
SOW (Contract for Design)Term: Jan 1 to Sept 30, 2015
Note: Future iterations are likely to overlap and run in parallel at certain times
System Integrator (SI) proposal covers entire roadmap(Evaluation criteria considers entire proposal)
Indicative BallparkDetailed/Certain
Level of accuracy of estimates and other aspects of a proposal

MSR Project – Phase III Preliminary Estimates
• MSR Phase III (Implementation) expected to begin in Q1 2015 upon Board approval
• Preliminary estimates are $5.8M capital, $500K G&A in 2015
• Estimates based on following assumptions
• Able to leverage existing infrastructure
• Additional infrastructure requirements are fulfilled via the technology lifecycle program
• Estimates include SI, internal labor and product related costs
47

48
Special Projects
Energy Management System (EMS) Upgrade Project - Update

49
EMS Upgrade Project - Background
• Energy Management System (EMS)
– Mission critical control system used by AESO system controllers to manage and operate the Alberta Interconnected Electric System
• Project Justification
– EMS components at end-of-life
– Risk avoidance, Regulatory Requirements, Vendor Support/Costs
• Project Scope
– Includes EMS network, infrastructure and application suite

50
EMS Upgrade Project - Program Approach
• Execute in three phases
– Validation:
–Assessment of long term requirements (business/technology); Evaluation of option risks/opportunities (replace reengineer); Peer Reviews
– Definition:
–Define detailed business, design & implementation requirements; Greater degree of confidence in timing and cost estimates (given the scale of the project)
–Similar approach BCHydro (EMS 3.0 upgrade)
– Implementation
–Development/deployment of design requirements into production
–Data conversion, skills development, commissioning, warranty and decommissioning

51
EMS Upgrade Project – Preliminary Estimates and Timing
Validation (2011 - 2014)
Definition
(2014 - 2015)
Implementation (2015 -
2017+)
Plan & Estimate for the Implementation Phase
Current - Decision to proceed Definition Phase recommendation approved
Q3 2014 Q2 2015 Q3 2015 Q1 2017 Q4 2017
Implementation Phase Warranty & Close Out
• Preliminary Estimates
• Definition Phase is approximately $5.1million
• Implementation Phase range is $11M - $15million
In progress

Thank you