technical guide no. 100 high performance drives -- speed ... · pdf filehigh performance...
TRANSCRIPT
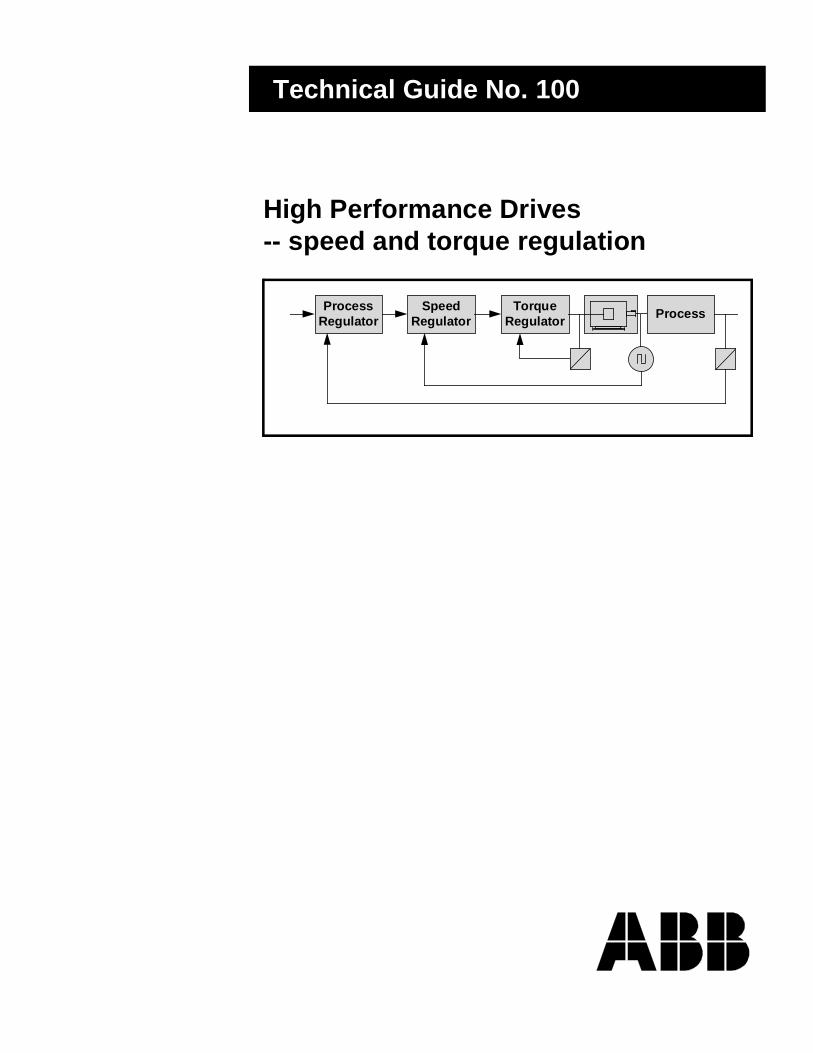
High Performance Drives-- speed and torque regulation
Technical Guide No. 100
ProcessRegulator
SpeedRegulator
TorqueRegulator
Process

Technical Guide:
The illustrations, charts and examples given in this article are intended solely toillustrate the theory and application of drive technology. Because of the manyvariables and requirements of applications, ABB Industrial Systems, Inc. cannotassume responsibility or liability for actual use based on the content of this article.
Reproduction of any information in this article is prohibited without permissionfrom ABB Industrial Systems, Inc.
ii
© 1996 ABB Industrial Systems, Inc. All Rights Reserved
1
Speed and Torque RegulationAdjusting and regulating the operating speed of a driven machine is usually theprimary reason for using any adjustable speed drive. This technical guide explainsthe relationship between speed and torque and discusses various aspects of speedand torque regulation.
Using This GuideThis guide has been designed to provide an understanding of the principles ofspeed and torque regulation as they relate to high performance adjustable speeddrives. The background discussion leads to information regarding applyingadjustable speed drives in high performance applications.
Readers wanting to gain an understanding of the principles of speed and torqueregulation should start at Section 2, (page 2).
For information regarding high performance applications, please go straight toSection 7 (page 9).
1.0 Introduction

2
The terminology used in discussing adjustable speed drives is not always usedclearly and consistently. This guide attempts to clearly define the essential termsusing the definitions that appear to be most commonly recognized in the UnitedStates.
In this guide, the term Adjustable Speed Drive means the combination of anAdjustable Speed Motor Controller and a motor. The adjustable speed motor con-troller provides electrical power that is controlled in a way that regulates the oper-ation of the motor. The motor converts the electrical power to mechanical powerin the form of speed and torque.
It is important to remember that many of the characteristics of a drive are the resultof a particular motor and a particular controller working together as a coordinatedsystem. The drive will not provide the expected performance unless both themotor and the controller have the necessary characteristics and capabilities.
An Adjustable Frequency Drive or AF Drive combines an AC motor with anAdjustable Frequency Controller that regulates the frequency of the AC powerapplied to the motor. In addition to regulating the frequency, the AF controllerregulates the voltage and other characteristics of the power.
A DC Drive combines a DC motor with a DC Controller or Converter that regu-lates the DC voltage and current applied to the motor armature and shunt field.
2.0 Adjustable Speed Drive Terminology
3
Speed and torque are the fundamental quantities used to describe the operation ofrotating machinery. Speed is usually expressed in shaft revolutions per minute orRPM. In adjustable speed drive applications, performance is usually discussed interms of the speed, torque and other parameters that apply to the shaft of the motor.If performance parameters are defined for some location other than the shaft of themotor, it is usually necessary to determine equivalent parameter values as theyapply to the motor shaft. Process or machine quantities such as surface feet perminute must be converted to the equivalent motor shaft RPM. To distinguish thelocation at which a parameter such as speed is measured it is sometimes written as“speed at the motor shaft” or “speed referred to motor shaft.”
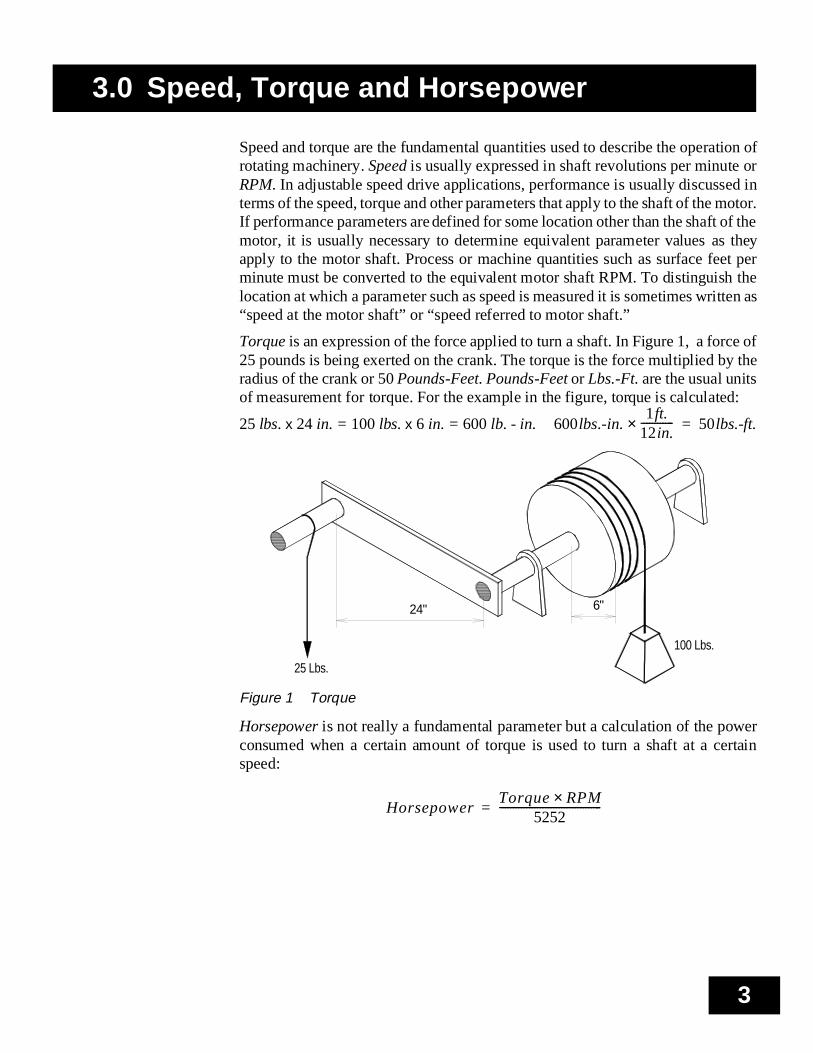
Torque is an expression of the force applied to turn a shaft. In Figure 1, a force of25 pounds is being exerted on the crank. The torque is the force multiplied by theradius of the crank or 50 Pounds-Feet. Pounds-Feet or Lbs.-Ft. are the usual unitsof measurement for torque. For the example in the figure, torque is calculated:
25 lbs. x 24 in. = 100 lbs. x 6 in. = 600 lb. - in.
Figure 1 Torque
Horsepower is not really a fundamental parameter but a calculation of the powerconsumed when a certain amount of torque is used to turn a shaft at a certainspeed:
3.0 Speed, Torque and Hor sepower
600lbs.-in.1ft.
12in.------------× 50lbs.-ft.=
24"
25 Lbs.
6"
100 Lbs.
HorsepowerTorque RPM×
5252--------------------------------------=

4
Each motor has its own individual torque vs. speed curve. Figure 2, curve A is atorque vs. speed curve for a typical 4 pole, NEMA B, squirrel cage inductionmotor powered from a 3 phase, 60 Hz power line. This curve indicates the operat-ing speed for a particular motor when loaded to any particular torque or the torqueproduced by the motor when operating at any particular speed. Although this is aconstant speed motor, a torque - speed curve is useful in defining the torque pro-duced as the motor comes up to speed when it is started. The curve also shows thesmall change in speed that results from changing the load at the operating point.Additional terms and definitions and further discussion of AC motor torque canbe found in the ABB AC Drives Reference Manual, publication ST-10.
Figure 2, curve B is a torque vs. speed curve for a conveyor used to carry coal froma railroad car to a coal pile. This curve indicates the torque required to operate thisconveyor at any given speed. The point at which the motor curve intersects theconveyor curve is the steady state operating point. This point indicates the oper-ating speed of the conveyor when driven by this particular motor and the torquethat will be produced by the motor when driving this conveyor.
Figure 2 Torque vs. Speed for Standard AC Motor and Load
The 1800 RPM, no load point on the AC motor’s torque-speed curve is themotor’s Synchronous Speed. This is the speed at which the motor would theoreti-cally operate if the load was zero, there was no load due to bearing friction and therotor had no electrical losses. An AC motor’s synchronous speed is determined bythe operating frequency (f) and the number of poles (p) in the stator winding:
For 60 Hz operation, the synchronous speed is 3600 RPM for a 2 pole motor, 1800RPM for 4 pole motor, 1200 RPM for a 6 pole motor and so on. As indicated inFigure 2, the difference between the synchronous speed and the operating speedis the Slip.
4.0 Operating Speed and Speed Regulation
0%
100%
0 1800 Speed (RPM)
Tor
que
Motor (Curve A)
Conveyor (Curve B)
OperatingPoint
Slip
Locked RotorTorque Pull-out or
BreakdownTorque

5
Figure 3 shows an enlarged view of the same motor torque-speed curve as shownin Figure 2 along with two torque-speed curves for the conveyor. The lower con-veyor curve represents an empty conveyor and the upper curve represents a con-veyor fully loaded with coal. At every operating speed, more torque is required todrive the conveyor when it is loaded with coal. If the conveyor is operating withno load at 1790 RPM and then coal is loaded onto the conveyor, the conveyor willslow down until it is operating at 1765 RPM. This small change in speed resultingfrom increasing the load shows the effect of the motor’s speed regulating capabil-ity.
Figure 3 Speed Regulation -- Standard AC Motor
Speed Regulation is generally defined as the percentage speed change that resultsfrom a given load change. In this example, the speed decreased by 25 RPM orabout 1.4% when the load increased from about 33% torque to about 83% torque.
The speed regulating capability of any constant speed motor or adjustable speeddrive is defined as the maximum speed change as a percentage of base speed thatresults from increasing the load from 5% of rated load (essentially no load) to fullload while holding constant all other variables that might cause a speed change.
The Base Speed of a motor is the rated operating speed at which the motor willdevelop rated horsepower. For the motor in the example, the base speed is thesame as the full load speed, 1755 RPM.
Synchronous Speed RPM( ) 120 f×p
----------------=
0%
100%
0
Speed (RPM)
Torque
Conveyor, Full Load
1790 RPM
1765 RPM
1755 RPM
Conveyor, No Load
Rated Motor Load
1700
Percent RegulationNo Load Speed Full Load Speed–
Base Speed----------------------------------------------------------------------------------------- 100×=

6
The speed regulating capability of the motor in the example is:
1800 1755–1755
------------------------------ 100× 2.5%=

7
Adjustable speed motor controllers allow motors to operate on an infinite numberof speed-torque curves. There is a speed-torque curve associated with every pos-sible speed command setpoint. Figure 4 shows torque-speed curves at several set-points for a basic adjustable frequency drive. These are simply AC motor torque-speed curves for several operating frequencies.
An adjustable frequency drive normally uses only the solid portion of the torque-speed curve. The drive’s protective circuitry prevents operation on the dotted por-tion of the curve. The AF controller rating selected for a given motor determinesthe maximum available torque for adjustable speed operation (solid portion ofcurve). The controller’s current limit circuitry sets the maximum current that themotor is allowed to draw. For any given motor, the maximum point on the solidportion of the curve represents the torque that the motor will produce at the max-imum current permitted by the controller.
For constant torque applications, AF controllers are usually selected so that suffi-cient current is available for the motor to produce 150% of rated torque. If the con-troller is selected to provide more than the usual maximum current for a givenmotor, it might be termed an “oversized” controller. If an “oversized” controlleris selected, the motor will produce more than 150% torque. As the motor operatingpoint moves up the curve, each incremental increase in torque requires a largerincrease in current. As operation approaches the peak of the curve (pull-outtorque), the “torque per amp” is reduced significantly. For this reason, drives arenot usually sized for operation above 70% of the pull-out torque capability of themotor.
Figure 4 Adjustable Frequency Drive Torque -- Speed Curves
5.0 Adjustable Speed Drive Speed vs. Torque
0%
100%
0 200 400 600 800 1000 1200 1400 1600 1800
Speed (RPM)
Tor
que
8
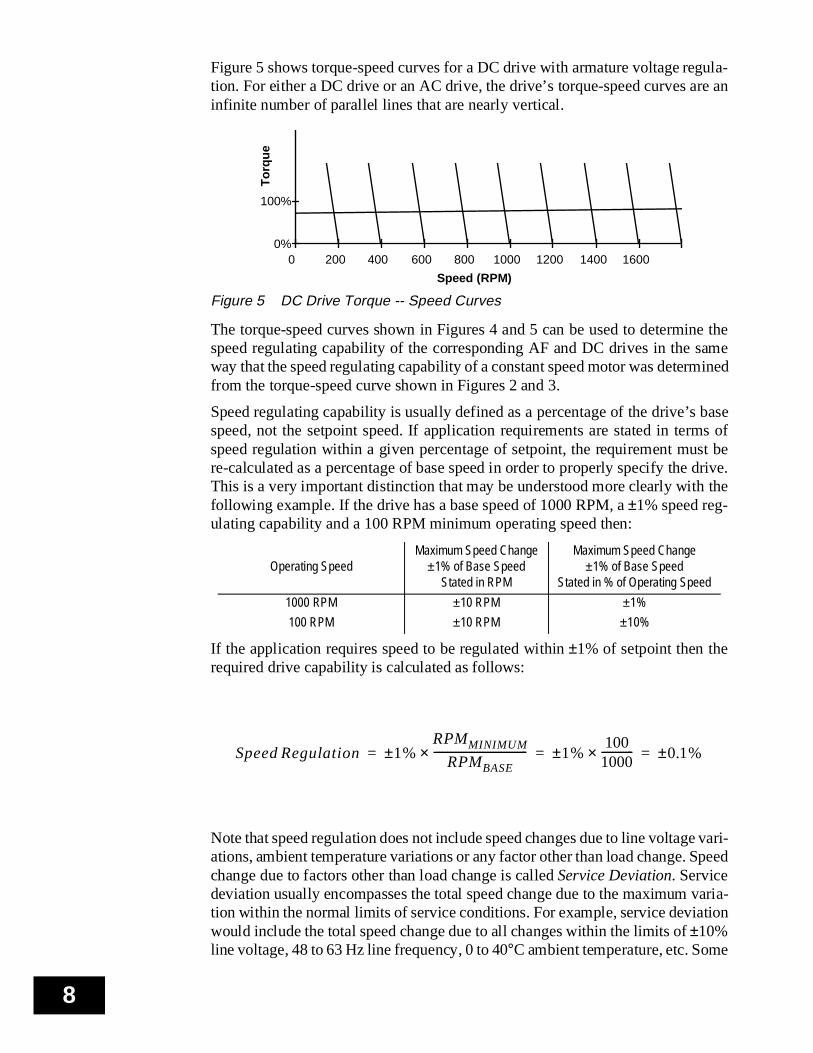
Figure 5 shows torque-speed curves for a DC drive with armature voltage regula-tion. For either a DC drive or an AC drive, the drive’s torque-speed curves are aninfinite number of parallel lines that are nearly vertical.
Figure 5 DC Drive Torque -- Speed Curves
The torque-speed curves shown in Figures 4 and 5 can be used to determine thespeed regulating capability of the corresponding AF and DC drives in the sameway that the speed regulating capability of a constant speed motor was determinedfrom the torque-speed curve shown in Figures 2 and 3.
Speed regulating capability is usually defined as a percentage of the drive’s basespeed, not the setpoint speed. If application requirements are stated in terms ofspeed regulation within a given percentage of setpoint, the requirement must bere-calculated as a percentage of base speed in order to properly specify the drive.This is a very important distinction that may be understood more clearly with thefollowing example. If the drive has a base speed of 1000 RPM, a ±1% speed reg-ulating capability and a 100 RPM minimum operating speed then:
If the application requires speed to be regulated within ±1% of setpoint then therequired drive capability is calculated as follows:
Note that speed regulation does not include speed changes due to line voltage vari-ations, ambient temperature variations or any factor other than load change. Speedchange due to factors other than load change is called Service Deviation. Servicedeviation usually encompasses the total speed change due to the maximum varia-tion within the normal limits of service conditions. For example, service deviationwould include the total speed change due to all changes within the limits of ±10%line voltage, 48 to 63 Hz line frequency, 0 to 40°C ambient temperature, etc. Some
Operating SpeedMaximum Speed Change
±1% of Base SpeedStated in RPM
Maximum Speed Change±1% of Base Speed
Stated in % of Operating Speed
1000 RPM ±10 RPM ±1%
100 RPM ±10 RPM ±10%
0%
100%
0 200 400 600 800 1000 1200 1400 1600
Speed (RPM)T
orqu
e
Speed Regulation 1± %RPMMINIMUM
RPMBASE-----------------------------------× 1± %
1001000------------× 0.1± %= = =

9
manufacturers may apply the term Speed Regulation to all causes of speed change.When this is done, the specified speed regulation usually includes two numberssuch as 1/3%. The first number (1%) is the Operating Deviation, the percentagespeed change due to a load change. The second number (3%) is the Service Devi-ation, the percentage speed change due to other factors.
10
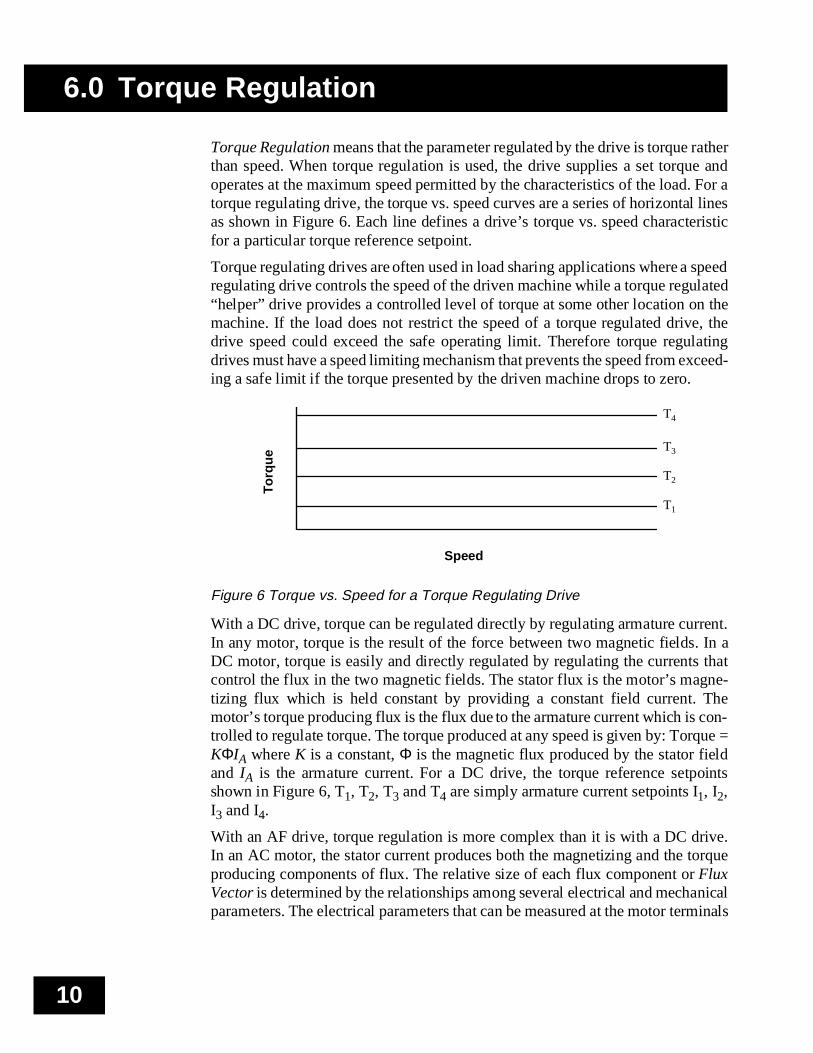
Torque Regulation means that the parameter regulated by the drive is torque ratherthan speed. When torque regulation is used, the drive supplies a set torque andoperates at the maximum speed permitted by the characteristics of the load. For atorque regulating drive, the torque vs. speed curves are a series of horizontal linesas shown in Figure 6. Each line defines a drive’s torque vs. speed characteristicfor a particular torque reference setpoint.
Torque regulating drives are often used in load sharing applications where a speedregulating drive controls the speed of the driven machine while a torque regulated“helper” drive provides a controlled level of torque at some other location on themachine. If the load does not restrict the speed of a torque regulated drive, thedrive speed could exceed the safe operating limit. Therefore torque regulatingdrives must have a speed limiting mechanism that prevents the speed from exceed-ing a safe limit if the torque presented by the driven machine drops to zero.
Figure 6 Torque vs. Speed for a Torque Regulating Drive
With a DC drive, torque can be regulated directly by regulating armature current.In any motor, torque is the result of the force between two magnetic fields. In aDC motor, torque is easily and directly regulated by regulating the currents thatcontrol the flux in the two magnetic fields. The stator flux is the motor’s magne-tizing flux which is held constant by providing a constant field current. Themotor’s torque producing flux is the flux due to the armature current which is con-trolled to regulate torque. The torque produced at any speed is given by: Torque =KΦIA where K is a constant, Φ is the magnetic flux produced by the stator fieldand IA is the armature current. For a DC drive, the torque reference setpointsshown in Figure 6, T1, T2, T3 and T4 are simply armature current setpoints I1, I2,I3 and I4.
With an AF drive, torque regulation is more complex than it is with a DC drive.In an AC motor, the stator current produces both the magnetizing and the torqueproducing components of flux. The relative size of each flux component or FluxVector is determined by the relationships among several electrical and mechanicalparameters. The electrical parameters that can be measured at the motor terminals
6.0 Torque Regulation
Speed
Torq
ue
T4
T3
T2
T1

11
are stator voltage, frequency and current and the phase relationship between thevoltage and current. The primary mechanical parameters are motor shaft speed,position and torque.
AC motor torque can be regulated by controlling the relationships among the var-ious electrical and mechanical parameters that affect the flux vectors. Flux VectorDrives use a torque control strategy that is very effective but requires mounting anencoder on the motor to provide motor shaft speed and relative position informa-tion. ABB’s Direct Torque Control technology provides excellent torque controldown to zero speed without an encoder. With both flux vector control and directtorque control, mathematical techniques are used to break down the stator currentinto individual vector components. This allows motor torque to be accurately cal-culated and regulated. ABB’s direct torque control technology uses more power-ful mathematical techniques that eliminate the need for an encoder. More detailedinformation on this subject can be found in other ABB literature.
There are a number of techniques for improving speed regulation. For DC drives,field current regulation is used to prevent the torque vs. speed curves from chang-ing due to magnetic field changes caused by line voltage variations, temperaturevariations and other factors. IR compensation is used to adjust the armature volt-age to compensate for the change in voltage drop across the resistance (RA) of thearmature caused by the armature current(IA).
The speed of a DC motor is proportional to the counter EMF voltage (VEMF) gen-erated by the armature. VEMF and thus speed is related to motor terminal voltage(VT) by the equation, VEMF = VT - IA x RA - BD. The IR voltage drop and the volt-age drop across the comutator brushes (BD) cause the difference between VEMFand VT to increase as the load increases. This voltage difference causes SpeedDroop. Speed droop causes the DC motor torque-speed curves to “droop” fromthe ideal vertical line as shown in figure 5. IR compensation increases VT as theload increases in order to compensate for the voltage drops and make the torque-speed curves more nearly vertical.
AF Drive speed regulation can be improved by compensating for the changes inmotor slip that are caused by load changes. The speed change due to the slip of anAC motor is like the speed change due to the speed droop of a DC motor. Withoutslip compensation, the speed setpoint sets a fixed operating frequency that deter-mines the motor’s synchronous speed. The motor’s operating speed is determinedby the motor’s slip which varies with load. (See Figure 2.) With slip compensa-tion, the speed setpoint sets a fixed operating speed. The controller electronicallymeasures the load on the motor, calculates the motor slip at that particular load andsets the operating frequency so that the motor’s synchronous speed is above thedesired operating speed by the amount of the calculated slip. With slip compensa-tion, the operating speed remains constant and the synchronous speed increasesand decreases as the load changes.
7.0 Improving Speed Regulation (Open Loop)

12
In an AC motor, there is a change in the voltage drop across the stator resistance(R) caused by the change in stator current (I) in proportion to a load change. Thisvoltage drop change causes a change in the magnetic flux in the motor’s air gapand leads to variations in the torque-speed curves at low operating frequencies ascompared to the torque-speed curve for 60 Hz operation. IR compensationincreases the motor terminal voltage as the load increases to compensate for thisvoltage drop (I x R). This provides a more uniform set of torque vs. speed curvesup and down the speed range. This ensures that the motor can produce the requiredtorque at low operating speeds without drawing excessive current. A more uni-form set of torque speed curves also allows the controller to more accurately cal-culate the motor’s slip and thus more accurately regulate speed using slipcompensation.
The speed regulation of either a DC drive or an AF drive can be improved by usingclosed loop speed regulation or tachometer feedback as described in the followingsection.
With closed loop regulation, a transducer is used to continuously monitor an oper-ating parameter. The measured value of the parameter provides a Feedback signalthat is compared with the desired value called the Setpoint or Reference. Any mea-sured Error is used to increase or decrease the output to match the setpoint. Figure7 is a diagram of a closed loop regulating system. With a closed loop regulatingsystem, the steady state regulation accuracy is primarily determined by the mea-surement and comparison accuracy. The input vs. output characteristics of the pro-cess become less important.
Figure 7 Closed Loop Regulating System
8.0 Closed Loop Regulation or Feedback
Basic Principles of Closed Loop Regulation
Process Load
Feedback Signal
Output
External Influencing Factors
PowerAmbientTemp. Etc.Reference
orSetpointSignal
Regulator
ErrorSignal
Transducer
13
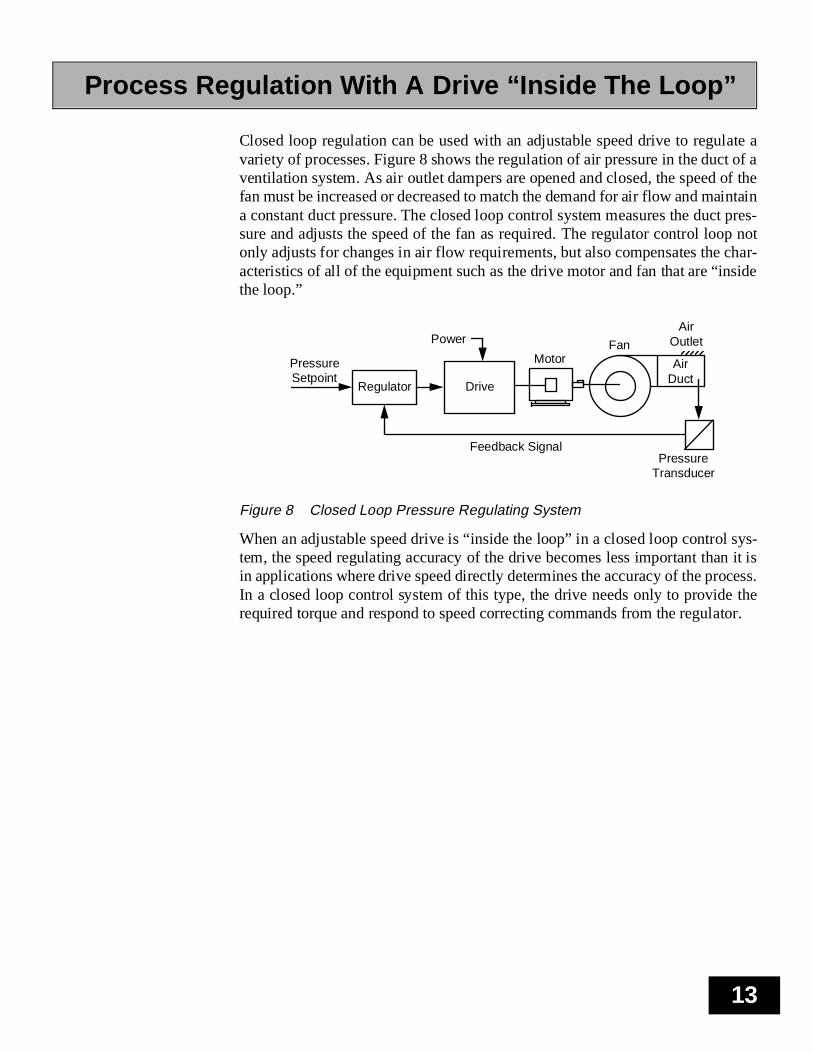
Closed loop regulation can be used with an adjustable speed drive to regulate avariety of processes. Figure 8 shows the regulation of air pressure in the duct of aventilation system. As air outlet dampers are opened and closed, the speed of thefan must be increased or decreased to match the demand for air flow and maintaina constant duct pressure. The closed loop control system measures the duct pres-sure and adjusts the speed of the fan as required. The regulator control loop notonly adjusts for changes in air flow requirements, but also compensates the char-acteristics of all of the equipment such as the drive motor and fan that are “insidethe loop.”
Figure 8 Closed Loop Pressure Regulating System
When an adjustable speed drive is “inside the loop” in a closed loop control sys-tem, the speed regulating accuracy of the drive becomes less important than it isin applications where drive speed directly determines the accuracy of the process.In a closed loop control system of this type, the drive needs only to provide therequired torque and respond to speed correcting commands from the regulator.
Process Regulation With A Drive “Inside The Loop”
Drive
Feedback Signal
Power
PressureSetpoint
Regulator
PressureTransducer
AirDuct
Motor
AirOutletFan

14
If motor speed is of primary concern rather than some process variable such aspressure, speed can be measured with a transducer and regulated with a closedloop regulator as shown if Figure 9. The transducer in this case is a tachometergenerator. A Tachometer Generator or Tach is a small generator that produces anoutput voltage that is very accurately determined by its operating speed. There arealso Pulse Tachs that provide a train of voltage pulses at an average frequency thatis exactly proportional to average speed.
Figure 9 Closed Loop Speed Regulation
The closed loop speed regulator compensates for any changes in the characteris-tics of the drive caused by changes in load or by outside influences such as linevoltage and ambient temperature. With a closed loop speed regulator, the mostimportant characteristic of the drive is its ability to rapidly respond to changes inrequirements for torque. The relationship between torque regulation and speedregulation in a standard DC drive configuration illustrates the importance oftorque response. Since the armature current in a DC motor directly determinestorque, the DC controller is configured as a closed loop current regulator. Thespeed regulator then commands the current regulator to produce whatever torqueis required to maintain the desired speed.
Closed Loop Speed Regulation
Drive
Feedback Signal
Power
SpeedSetpoint
Regulator
Motor
Tachometer

15
The preceding sections of this technical guide deal only with Steady State or Staticperformance. Static operation is operation with unchanging operating conditions.Figure 10 shows a drive’s static and dynamic speed regulating performance. Thefigure shows static operating conditions before and after a load change with a tran-sition period of dynamic performance immediately after the change. Static SpeedRegulation is the change in steady state speed that is caused by a load change.
Static Performance measures the difference between two operating points withoutconsidering the performance during the transition from one operating point to theother. At each point, operation is measured only after the system has been operat-ing at that point for some length of time. Sufficient time is allowed so that therewill be no further change in operation related to the transition from one point toanother.
Dynamic Performance describes the operation during the transition from oneoperating point to another. The dynamic performance capability of a systemdefines the system’s ability to respond to a load change or a reference change.
Figure 10 Static vs. Dynamic Performance
Figure 11 is an enlarged view of Figure 10 showing the parameters that quantifyboth the static response and the dynamic response to a step change in load. TheTransient Deviation is the maximum deviation from setpoint immediately follow-ing the load change. The Transient Response Time is time required for the outputto return to the steady state regulation band after going through a period of damped
9.0 Dynamic Performance
Static vs. Dynamic Performance
LoadChange
Static Speed Regulation
Transition (Dynamic
Performance)
Time
StaticOperation
StaticOperation
Speed
Torque
Steady StateOperating Point Steady State
Operating Point
Measuring Dynamic Performance
16
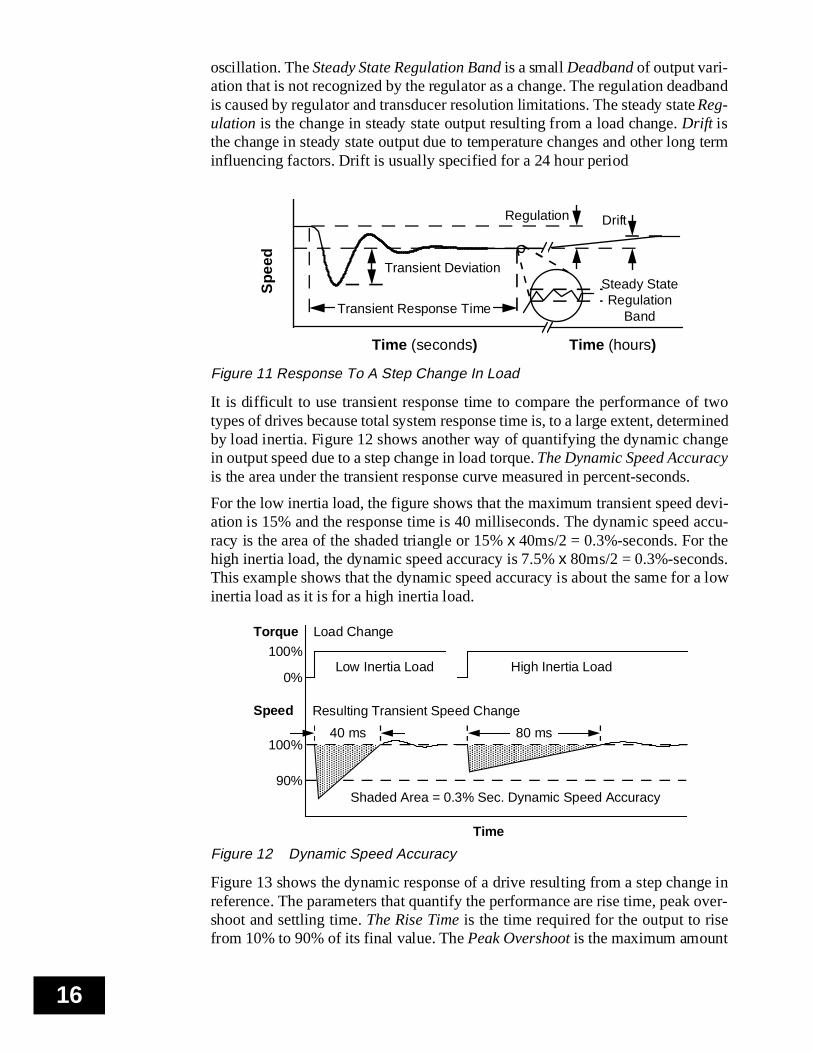
oscillation. The Steady State Regulation Band is a small Deadband of output vari-ation that is not recognized by the regulator as a change. The regulation deadbandis caused by regulator and transducer resolution limitations. The steady state Reg-ulation is the change in steady state output resulting from a load change. Drift isthe change in steady state output due to temperature changes and other long terminfluencing factors. Drift is usually specified for a 24 hour period
Figure 11 Response To A Step Change In Load
It is difficult to use transient response time to compare the performance of twotypes of drives because total system response time is, to a large extent, determinedby load inertia. Figure 12 shows another way of quantifying the dynamic changein output speed due to a step change in load torque. The Dynamic Speed Accuracyis the area under the transient response curve measured in percent-seconds.
For the low inertia load, the figure shows that the maximum transient speed devi-ation is 15% and the response time is 40 milliseconds. The dynamic speed accu-racy is the area of the shaded triangle or 15% x 40ms/2 = 0.3%-seconds. For thehigh inertia load, the dynamic speed accuracy is 7.5% x 80ms/2 = 0.3%-seconds.This example shows that the dynamic speed accuracy is about the same for a lowinertia load as it is for a high inertia load.
Figure 12 Dynamic Speed Accuracy
Figure 13 shows the dynamic response of a drive resulting from a step change inreference. The parameters that quantify the performance are rise time, peak over-shoot and settling time. The Rise Time is the time required for the output to risefrom 10% to 90% of its final value. The Peak Overshoot is the maximum amount
Transient Deviation
Time (seconds)
Regulation
Transient Response Time
Time (hours)
Drift
Steady StateRegulation
Band
Spe
ed
100%
0%
Load Change
Resulting Transient Speed Change
Shaded Area = 0.3% Sec. Dynamic Speed Accuracy
Time
Speed
Torque
100%
90%AAAAAAAAAAAAAAAAAAAAAAAAAAAAAAAAAAAAAAAAAAAAAAAA
AAAAAAAAAAAAAAAAAAAAAAAAAAAAAAAAAAAAAAAAAAAAAAAA
AAAAAAAAAAAAAAAAAAAAAAAAAAAAAAAAAAAAAAAAAAAAAAAA
AAAAAAAAAAAA
AAAAAAAAAAAAAAAAAAAAAAAAAAAA
AAAAAAAAAAAAAAAAAAAAAAAAAAAA
AAAAAAAAAAAAAAAAAAAAAAAAAAAA
AAAAAAAAAAAAAAAAAAAAAAAAAAAA
AAAAAAAAAAAAAAAAAAAAAAAAAAAA
AAAAAAAAAAAAAAAAAAAAAAAAAAAA
AAAAAAAAAAAAAAAAAAAAAAAAAAAA
Low Inertia Load High Inertia Load
40 ms 80 ms
17
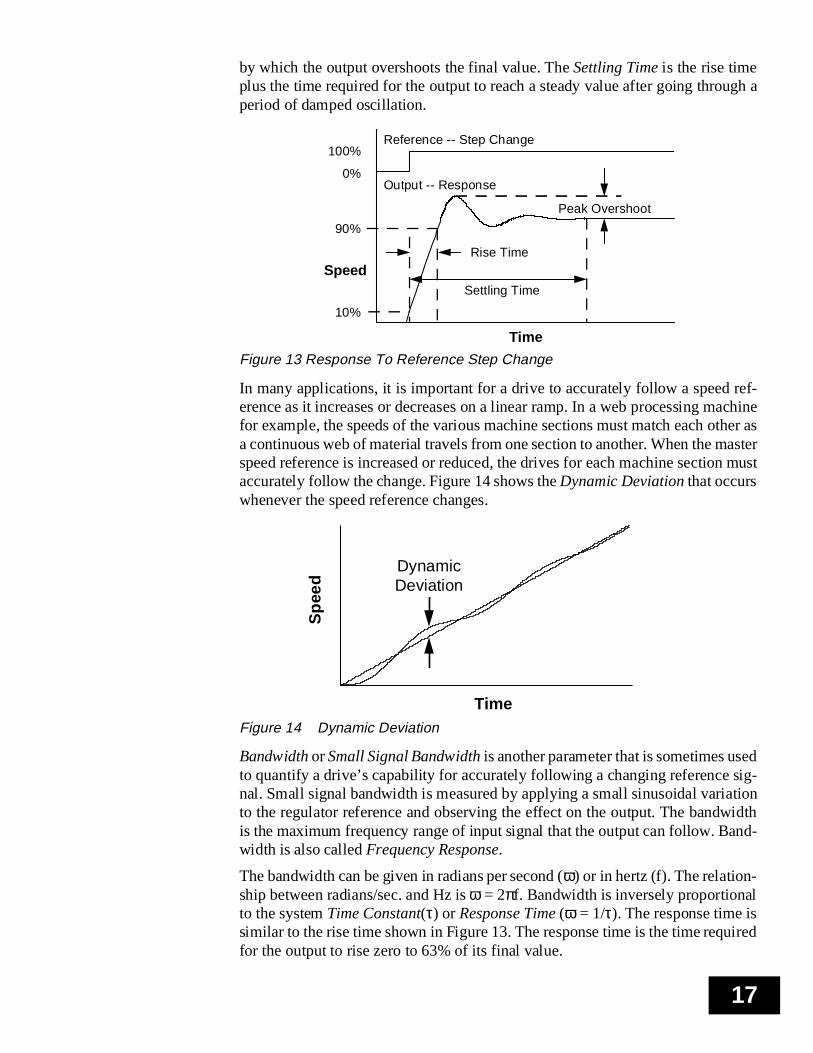
by which the output overshoots the final value. The Settling Time is the rise timeplus the time required for the output to reach a steady value after going through aperiod of damped oscillation.
Figure 13 Response To Reference Step Change
In many applications, it is important for a drive to accurately follow a speed ref-erence as it increases or decreases on a linear ramp. In a web processing machinefor example, the speeds of the various machine sections must match each other asa continuous web of material travels from one section to another. When the masterspeed reference is increased or reduced, the drives for each machine section mustaccurately follow the change. Figure 14 shows the Dynamic Deviation that occurswhenever the speed reference changes.
Figure 14 Dynamic Deviation
Bandwidth or Small Signal Bandwidth is another parameter that is sometimes usedto quantify a drive’s capability for accurately following a changing reference sig-nal. Small signal bandwidth is measured by applying a small sinusoidal variationto the regulator reference and observing the effect on the output. The bandwidthis the maximum frequency range of input signal that the output can follow. Band-width is also called Frequency Response.
The bandwidth can be given in radians per second (ω) or in hertz (f). The relation-ship between radians/sec. and Hz is ω = 2πf. Bandwidth is inversely proportionalto the system Time Constant(τ) or Response Time (ω = 1/τ). The response time issimilar to the rise time shown in Figure 13. The response time is the time requiredfor the output to rise zero to 63% of its final value.
Rise Time
Peak Overshoot
Settling Time
Output -- Response
Reference -- Step Change
90%
10%
Time
Speed
0%
100%
Time
DynamicDeviation
Spe
ed

18
The bandwidth of a drive defines the maximum capability of the controller/motorcombination with nothing connected to the motor shaft. The bandwidth of a con-troller defines the maximum electrical output capability of the controller withouta motor connected to the output terminals. The bandwidth of a system is the actualoperating performance of the drive and load when the drive is adjusted for opti-mum performance with that specific load.
High performance control systems often have multiple control loops as shown inFigure 15. The outermost control loop regulates the process variable. This is oftena position control loop as it is in servo drive systems. A general purpose drive sys-tem might have a dancer position regulator that ultimately controls the tension ofa web or filament. The speed regulator loop is inside the process regulating loopand the torque regulator loop is the innermost loop.
In order to provide stable performance, each inner regulator loop must be three toten times faster than the next outer loop. That is, ω2 = 3 to 10 times ω1 and ω3 =3 to 10 times ω2. If the process is subject to fast changes (ω1 is large) then a highperformance drive is required (ω2 and ω3 must be large). Conversely, if the drivenmachine has a high inertia or other characteristics that dictate that its final outputcan change only slowly, then the drive does not need to have wide speed andtorque regulator bandwidths.
Figure 15 Control Loop Bandwidth Relationships
ProcessRegulator
SpeedRegulator
TorqueRegulator
Process
Process Control Loop (for servo drives, position loop)Bandwidth = ω1
Speed LoopBandwidth = ω2
Torque LoopBandwidth = ω3
19
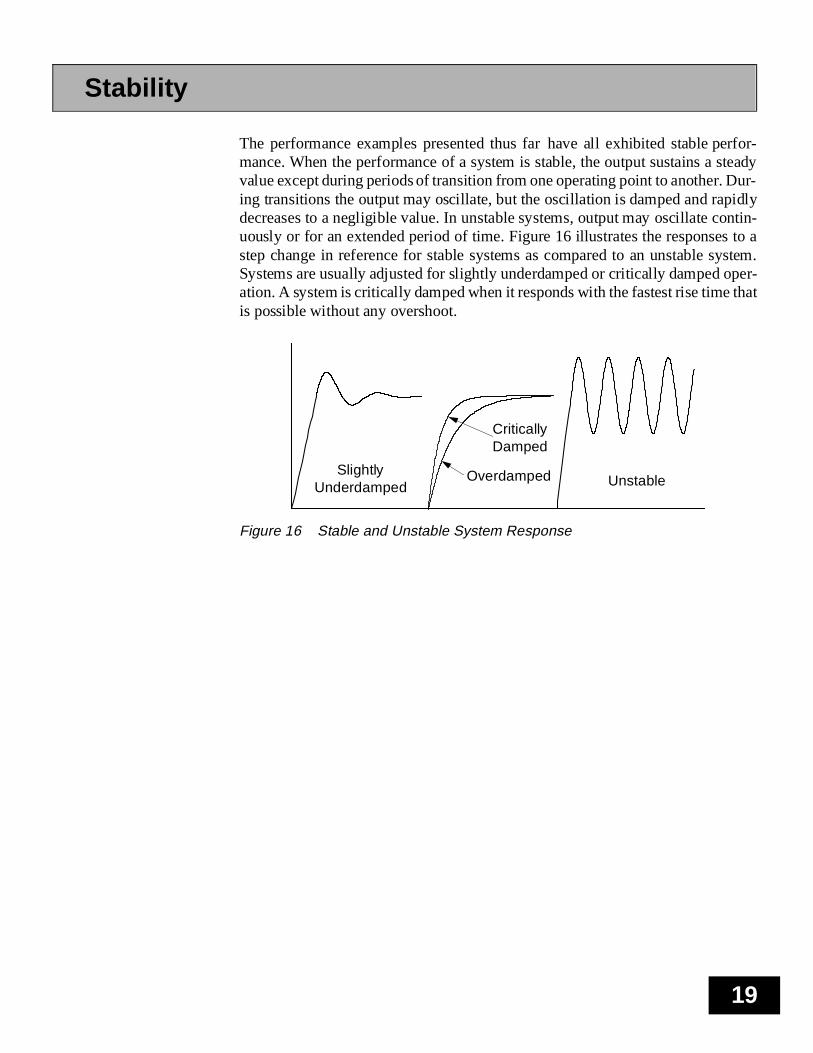
The performance examples presented thus far have all exhibited stable perfor-mance. When the performance of a system is stable, the output sustains a steadyvalue except during periods of transition from one operating point to another. Dur-ing transitions the output may oscillate, but the oscillation is damped and rapidlydecreases to a negligible value. In unstable systems, output may oscillate contin-uously or for an extended period of time. Figure 16 illustrates the responses to astep change in reference for stable systems as compared to an unstable system.Systems are usually adjusted for slightly underdamped or critically damped oper-ation. A system is critically damped when it responds with the fastest rise time thatis possible without any overshoot.
Figure 16 Stable and Unstable System Response
Stability
UnstableSlightly
UnderdampedOverdamped
CriticallyDamped

20
System performance is determined by the interaction among all of the componentsof the system. The components of a control system include both the controllingsystem and the controlled system. An adjustable speed drive system includes theadjustable speed controller, the motor, all feedback and accessory devices and thedriven machine. The characteristics of the driven machine or load are an essentialfactor in determining the dynamic performance of an adjustable speed drive sys-tem.
Figure 17 shows the load torque vs. speed for a driven machine in comparison tothe torque capability of a drive. The difference between the load torque and theintermittent torque capability of the drive is the torque available to accelerate ordecelerate inertia.
Figure 17 Accelerating and Decelerating Torque
The load inertia reflected to the motor shaft plus the motor inertia and the torqueavailable for acceleration or deceleration determine the acceleration and deceler-ation time. The acceleration and deceleration time are the main components of thedrive’s response to a step change in speed reference.
Acceleration or deceleration time is given by:
If the load inertia is expressed as WK2 (Lbs.-Ft. Squared), speed change is givenin RPM and torque is given in Lbs. Ft., then the constant K is 308 for calculatingtime in seconds.
10.0 Predicting System Performance
Intermittent TorqueCapability of Drive
Continuous TorqueCapability of Drive
Load
Torque Available For Accelerating Inertia
Torque Available For Decelerating Inertia
Speed
100%
0%
Tor
que
100%
TimeLoad Inertia Motor Inertia+( ) Speed Change×
K Torque×------------------------------------------------------------------------------------------------------------------------------=

21
The drive’s torque response is a very important factor in determining the drive’sdynamic performance. When the load torque increases suddenly or when thespeed setpoint is suddenly changed, the drive is asked to instantaneously changethe level of torque that the motor is providing. The drive’s Torque Response is theresponse time (typically milliseconds) required for the drive to respond to a stepincrease of zero to 100% torque demand.
Accurately predicting the complete performance of a drive system and a drivenmachine requires detailed information about both the drive and the machine. Toachieve optimum performance, the drive must be adjusted or Tuned to the charac-teristics of the driven machine. One aspect of tuning is to set the speed regulatorgain adjustments for the best regulation that can be achieved without getting tooclose to unstable operation. The system bandwidth must be tuned to a frequencythat is below any mechanical resonance frequencies of the driven machine.
For existing machine designs, drives can be selected based on comparing the capa-bilities of available drives with the capabilities of drives that have been success-fully used in the past. For new machines, the keys to success include experiencewith similar machines and close cooperation between the machine design engi-neers and the drive manufacturer.
22
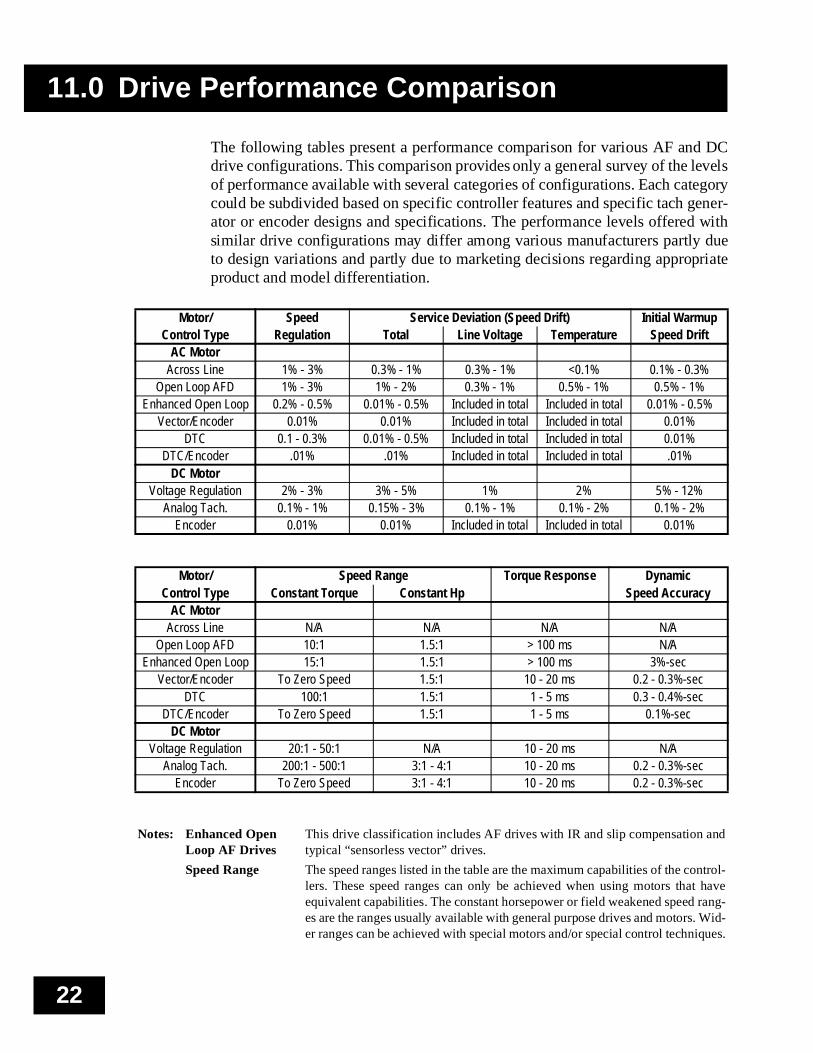
The following tables present a performance comparison for various AF and DCdrive configurations. This comparison provides only a general survey of the levelsof performance available with several categories of configurations. Each categorycould be subdivided based on specific controller features and specific tach gener-ator or encoder designs and specifications. The performance levels offered withsimilar drive configurations may differ among various manufacturers partly dueto design variations and partly due to marketing decisions regarding appropriateproduct and model differentiation.
11.0 Drive Performance Comparison
Motor/ Speed Service Deviation (Speed Drift) Initial WarmupControl Type Regulation Total Line Voltage Temperature Speed Drift
AC MotorAcross Line 1% - 3% 0.3% - 1% 0.3% - 1% <0.1% 0.1% - 0.3%
Open Loop AFD 1% - 3% 1% - 2% 0.3% - 1% 0.5% - 1% 0.5% - 1%Enhanced Open Loop 0.2% - 0.5% 0.01% - 0.5% Included in total Included in total 0.01% - 0.5%
Vector/Encoder 0.01% 0.01% Included in total Included in total 0.01%DTC 0.1 - 0.3% 0.01% - 0.5% Included in total Included in total 0.01%
DTC/Encoder .01% .01% Included in total Included in total .01%DC Motor
Voltage Regulation 2% - 3% 3% - 5% 1% 2% 5% - 12%Analog Tach. 0.1% - 1% 0.15% - 3% 0.1% - 1% 0.1% - 2% 0.1% - 2%
Encoder 0.01% 0.01% Included in total Included in total 0.01%
Motor/ Speed Range Torque Response DynamicControl Type Constant Torque Constant Hp Speed Accuracy
AC MotorAcross Line N/A N/A N/A N/A
Open Loop AFD 10:1 1.5:1 > 100 ms N/AEnhanced Open Loop 15:1 1.5:1 > 100 ms 3%-sec
Vector/Encoder To Zero Speed 1.5:1 10 - 20 ms 0.2 - 0.3%-secDTC 100:1 1.5:1 1 - 5 ms 0.3 - 0.4%-sec
DTC/Encoder To Zero Speed 1.5:1 1 - 5 ms 0.1%-secDC Motor
Voltage Regulation 20:1 - 50:1 N/A 10 - 20 ms N/AAnalog Tach. 200:1 - 500:1 3:1 - 4:1 10 - 20 ms 0.2 - 0.3%-sec
Encoder To Zero Speed 3:1 - 4:1 10 - 20 ms 0.2 - 0.3%-sec
Notes: Enhanced Open Loop AF Drives
This drive classification includes AF drives with IR and slip compensation andtypical “sensorless vector” drives.
Speed Range The speed ranges listed in the table are the maximum capabilities of the control-lers. These speed ranges can only be achieved when using motors that haveequivalent capabilities. The constant horsepower or field weakened speed rang-es are the ranges usually available with general purpose drives and motors. Wid-er ranges can be achieved with special motors and/or special control techniques.
This technical guide has defined and illustrated the terminology used to describeand quantify the speed and torque regulating performance of adjustable speeddrives. The following are some important points to remember:
n Consistent application of well-defined terminology provides the essentialfoundation for describing, quantifying and comparing drive performance. It isparticularly important to verify definitions of terms when combining or com-paring information from several sources.
n Many of the characteristics of a drive are the result of a particular motor and aparticular controller working together as a coordinated system. The drive willnot provide the expected performance unless both the motor and the controllerhave the necessary characteristics and capabilities.
n Performance is usually discussed in terms of the speed, torque and other param-eters that apply to the shaft of the motor. If performance parameters are definedfor some location other than the shaft of the motor, it is usually necessary todetermine equivalent parameter values as they apply to the motor shaft.
n Performance is determined by the interaction among all of the components ofa drive system including the adjustable speed controller, the motor, all feed-back and accessory devices and the driven machine. The characteristics of thedriven machine or load are an essential factor in determining the dynamic per-formance of an adjustable speed drive system.
n For existing machine designs, drives can be selected based on comparing thecapabilities of available drives with the capabilities of drives that have beensuccessfully used in the past. For new machines, the keys to success include ex-perience with similar machines and close cooperation between the machine de-sign engineers and the drive manufacturer.
12.0 Summary
iii

24
Notes

25

ABB Industrial Systems Inc.16250 W. Glendale DriveNew Berlin, WI 53151USATelephone:(414) 785-3416
(800) 752-0696Fax: (414) 785-0397
Printed In USA
ST
-352
-100
3AU
A 4
890
02B
225
5 R
0101
Rev
. 1E
FF
EC
TIV
E: J
anu
ary
1996
SU
PE
RC
ED
ES
: NO
NE