technical efficiency of state owned enterprises in china
TRANSCRIPT

University of ConnecticutOpenCommons@UConn
Economics Working Papers Department of Economics
October 2001
Technical Efficiency of State Owned Enterprises inChina (1980-1989): An Assessment of theEconomic ReformsSubhash C. RayUniversity of Connecticut
Zhang Ping
Follow this and additional works at: https://opencommons.uconn.edu/econ_wpapers
Recommended CitationRay, Subhash C. and Ping, Zhang, "Technical Efficiency of State Owned Enterprises in China (1980-1989): An Assessment of theEconomic Reforms" (2001). Economics Working Papers. 200105.https://opencommons.uconn.edu/econ_wpapers/200105

Department of Economics Working Paper Series
Technical Efficiency of State Owned Enterprises in China (1980-1989): An Assessment of the Economic Reforms
Subhash C. RayUniversity of Connecticut
Zhang Ping
Working Paper 2001-05
October 2001
341 Mansfield Road, Unit 1063Storrs, CT 06269–1063Phone: (860) 486–3022Fax: (860) 486–4463http://www.econ.uconn.edu/

AbstractThis paper uses Data Envelopment Analysis to examine changes in levels of
technical efficiency over time in China’s state-owned enterprises (SOEs) during1980-1989. Our paper adds to the growing body of literature in this area by ob-taining measures of technical efficiency of individual SOEs over years and byidentifying how different aspects of the reforms have affected efficiency. We esti-mate a Tobit regression model, using the technical efficiency score as the depen-dent variable and a set of reform variables and firm attributes as regressors. Wefind that specific aspects of the reforms were very effective in improving technicalefficiency.

2
Technical Efficiency of State Owned Enterprises in China (1980-1989):An Assessment of the Economic Reforms
1. Introduction
The economic reforms launched by the post-Mao leadership in China mark the formal closure of a
turbulent era in the history of the Peoples' Republic that started with the outbreak of the Cultural
Revolution and ended in the eventual arrest and overthrow of the Gang of Four a decade later. Introduced
gradually and phased in over years, the industrial reforms drastically relaxed the rigid bureaucratic control
over the various state-owned enterprises (SOEs). Under the new regime, the enterprises were granted
significantly greater autonomy allowing them to retain a share of profits and to sell above-plan output
directly to buyers in an emerging market. The reforms increased the share of bonuses in the total
compensation paid to employees. These reforms also permitted the SOEs to make appropriate use of
material incentives in order to increase technical efficiency and productivity.
In this paper, we use Data Envelopment Analysis (DEA) to examine changes in levels of
technical efficiency over time in a sample of SOEs during 1980-1989. The data set comes from a survey of
activities of 769 SOEs in four provinces during 1980-1989, containing 321quantitive variables and a
questionnaire answered by the managers of these enterprises. It is a comprehensive firm-level data set at on
the Chinese SOEs and has been used previously to analyze different aspects of the SOEs applying different
techniques., Li (1997) estimates a nonlinear production function; Liu and Liu (1996) estimate a stochastic
production function; Groves et al. (1994, 1995) analyze the managerial incentives of the SOEs; and Shirley
and Xu (1998) analyze the effectiveness of managerial contract system
Our paper adds to the literature in this area by obtaining measures of technical efficiency of
individual SOEs over years and by identifying how different aspects of the reforms have affected
efficiency. We find that technical efficiency, as a whole, improved in the 1980s in these SOEs, a result
that is consistent with recent studies. Improvement in efficiency was not steady over years, however.
During the years 1980-1986, when the economy grew at a fast pace, technical efficiency tended to be low.
This matches the general impression about the Chinese practice of resource utilization during that period.
That is, in the first half of the 1980s, China utilized resources extensively rather than intensively. A
structural change occurred in 1987 in the state-owned industrial sector. As noted in Hay et al. (1994), the
SOEs stepped up cost-cutting efforts in the late 1980s. Thus, in 1988,even though the economy grew at a
fast pace, technical efficiency not only did not decline, but actually improved. Our results show a large
increase in technical efficiency in 1989 as well, a result at odds with many studies that show a decline in
TFP in 1989.
Further, we find evidence that fluctuation in technical efficiency in various industries is closely
related to the level of competition and entry by new firms. In the 1980s, China gradually lifted the barriers

3
to entry for non-state-owned enterprises into sectors that were previously monopolized by the SOEs.
Industries like textile, metallurgy, and food, which were more competitive and experienced entry by many
new firms, exhibit greater fluctuation in technical efficiency when compared to other industries. Technical
efficiency in textile dropped dramatically in 1985 when competition intensified. In metallurgy, technical
efficiency peaked in 1983, then declined steadily and never recovered during this period. Food industry
saw ups and downs over the whole period.
In order to measure the effect of the reforms on technical efficiency, we estimate a Tobit
regression model, using the technical efficiency score as the dependent variable and a set of reform
variables and firm attributes as regressors. We find that specific aspects of the reforms were very effective
in improving technical efficiency.
The rest of this paper is organized as follows. Section 2 notes the main highlights of the reforms.
The nonparametric methodology of DEA is briefly explained in section 3. Section 4 describes the data and
construction of variables and reports the empirical findings – first the technical efficiency measures
obtained from DEA and subsequently the second stage Tobit regression results. Section 5 concludes.
2. The Reforms:
Two key components of the Marxian “Materialistic Conception of History” are the forces of
production and the relations of production. The forces of production correspond to the available productive
resources along with technical knowledge and productivity. The relations of production, on the other hand,
are defined by the ownership distribution of property and determine how the output is distributed. In the
Maoist strategy of development, the primary emphasis was on the relations of production. The underlying
assumption is that once private property rights are eliminated through socialization of industry and
collectivization of agriculture, productivity would automatically rise to higher levels. In the economic
policy debate that took place during the Great Leap Forward, opponents of this Maoist point of view, who
were accused of “economism”, argued that the basic contradiction faced by the nation was one of
economic backwardness and low levels of productivity and efficiency associated with underdevelopment of
the forces of production. In fact, they proposed numerous reforms that emphasized division of labor,
specialization, greater individual responsibility, and material incentives. In many ways, they anticipated the
post-Mao economic reforms. In that sense, introduction of these reforms represents a shift of emphasis
from the relations to the forces of production within Marxian dialectics.
Prior to the reforms, SOEs in China were trapped in a cobweb of regulation and control enforced
by several layers of government. An important aspect of the reforms was to simplify the bureaucracy by
eliminating most of direct government control and transferring considerable decision-making authority to
the managers of the enterprise. Economic management in a Soviet-style command system is material
balance planning that involves an output plan for individual producers, a supply plan for transfer of

4
resources between producers, and a schedule of material use that earmarks inputs for outputs. Clearly, this
implies detailed micro management by a central authority far removed from the actual production facilities.
At the enterprise level, the party secretary outranked the factory manager. Even when the party boss did not
issue direct orders, the manager had to seek his agreement in matters of management of production and
administrative work.
China kicked off the economic reforms with a fundamental change in development strategy in
1978, shifting away from a heavy industry oriented strategy. Development of agriculture and light industry
gained much higher priority. Investment in agriculture and light industry was increased while investment in
heavy industry was cut. Meanwhile, advanced equipment were imported to upgrade the technology at the
SOEs
In the early1980s, the Chinese government further consolidated the control of the SOEs through
devolution of proprietary rights to municipal governments continuing a trend started during the Cultural
Revolution. In 1985, many SOEs were administered by municipal governments. The functionary
departments of both the central government and local governments gave up direct control over most SOEs.
Under the fiscal contract system effective since 1980, the responsibilities of municipal governments to their
superiors mainly were to hand over a portion of fiscal revenue fixed in the fiscal contracts. Thus, municipal
governments became the de facto owners of most SOEsIn fact, each local government became a
conglomerate and an active player in the market. Thus, market competition intensified dramatically.
To manage numerous SOEs in various industries, municipal governments tried various methods.
One of them was the managerial contract system where SOEs and government negotiate and sign three- to
five-year contracts. Under such contracts, the firms must deliver the contracted profit regardless of
performance. The director had responsibility for decision-making. Firms retained profits only when the
target was exceeded. The success of the household land contract system in agriculture inspired and
popularized this system. Not long after its inception in 1985, the managerial contract system was widely
accepted and became the dominant relationship between government and SOEs during 1986-19931.
An alternative to the contract management system is the director responsibility system where the
director is of the firm controls business operations while the party committee provides the political
education of the employees. This system provided for substantially higher remuneration for the director
compared to the workers.
Inside the SOEs, the government reformed the rigid wage system, allowing the SOEs to pay
bonus to the workers. During 1978-1985, the SOEs were allowed to pay a portion of retained profit as
bonus according to certain rules set by the government. Under the managerial contract system starting in
1986, the bonus was linked to the performance of the firm, and was stipulated by their firm’s contract with
the government. Studies suggest that the bonus system was the most effective component of the reform.
1 Several studies evaluate the effectiveness of the managerial contract system in improving productivity(Groves 1994, 1995, Zhuang and Xu 1996, Shirley and Xu 1998).

5
The success of agricultural reform not only freed a great number of farmers from land, but also
generated initial capital funds for the rural enterprises for industrialization. With no support from the state,
these town and village enterprises (TVEs) circumvented the plan system to purchase raw materials and
equipment, and to market their products. The government finally reformed the price system after the
emergence of TVEs which broke the monopoly of the SOEs in the second half of 1980s. The market
mechanism played an increasingly important role within the system of planning. Every planned good had a
plan price and a market price. Meanwhile, the SOEs sold their output beyond quota at market price.
Initially, a large gap between the high and volatile market price and a suppressed planned price led to
severe corruption. To address this problem, the government adjusted the plan prices upwards in 1987,
thereby narrowing the gap. At the same time, intense competition and abundant supply also helped to close
the gap. By 1993, the dual price system was eliminated ending the economy of shortage.
Together these reforms drastically altered the operating environment of the SOEs, creating new
opportunities for improving productivity and efficiency and allowing a greater role for individual
initiatives.We employ the nonparametric method of Data Envelopment Analysis explained in the next
section to examine if, and to what extent, the reforms helped to raise productivity.
3. The Methodology of Data Envelopment Analysis
Technical efficiency of a firm can be measured by the ratio of its actual output to the maximum
output producible from its observed input bundle defined by the frontier production function. In parametric
models, one specifies an explicit functional form for the frontier and econometrically estimates the
parameters using sample data for inputs and output. Hence the validity of the derived technical efficiency
measures depends critically on the appropriateness of the functional form specified. The method of DEA
introduced by Charnes, Cooper and Rhodes (CCR) (1978) and further generalized by Banker, Charnes, and
Cooper (BCC) (1984) provides a nonparametric alternative to parametric frontier production function
analysis. In DEA, one makes only a few fairly weak assumptions about the underlying production
technology. In particular, no functional specification is necessary. Based on these assumptions a production
frontier is empirically constructed using mathematical programming methods from observed input-output
data of sample firms.
Consider an industry producing a scalar output, y, from bundles of m inputs, x=(x1,x2,…,xm). Let
(xj, yj) be the observed input-output bundle of firm j (j= 1,2,…, n). The technology is defined by the
production possibility set
T={( x, y ): y can be produced from x }.
An input-output combination (x0, y0) is feasible if and only if (x0, y0) ∈ T.
We make the following assumptions about the technology:

6
(1) All observed input-output combinations are feasible. Thus, (xj, yj) ∈ T (j = 1,2,…,n).
(2) The production possibility set, T, is convex. Hence, if (x1, y1) ∈ T and (x2, y2) ∈T, then
(λx1+(1-λ)x2, λy1+(1-λ)y2)∈T, 0≤ λ 1≤ .
In other words, weighted averages of feasible input-output combinations are also feasible.
(3) Inputs are freely disposable. Hence, if (x0, y0)∈T and x1≥ x0, then (x1, y0)∈T. This rules out negative
marginal productivity of inputs.
(4) Output is freely disposable. Hence, if (x0, y0)∈T and y1≤ y0, then (x0, y1)∈T
Varian (1984) pointed out that the smallest set satisfying assumptions (1)-(4) is;
S = {(x, y) : x njyyx j
n
jj
jn
jj
jn
jj ,...,2,1;0;1;;
111=≥=≤≥ ∑∑∑
===
λλλλ }.
Let ∑∑∑===
≥===n
jjj
n
j
jj
jn
jj yyxx
111.0;1;, λλλλ By virtue of convexity ),{ yx is feasible.
Then, for any ),(, yxxx ≥ is feasible. Finally, for any ),(, yxyy ≤ is also feasible.
Technical efficiency of any firm producing output y0 from input x0 is *1 ϕ , where
*ϕ = max .),(: 00 Syx ∈ϕϕNote that this is an output-oriented measure of efficiency. Alternatively, one could use an input-oriented
approach, where efficiency lies in conserving inputs while producing the observed output quantity. In the
present study, like Zheng et al. (1998), we select an output-oriented efficiency measure, because the
Chinese SOEs during the 1980s were more inclined towards expanding output than towards cutting cost2.
Thus, for any observed firm t, we solve the following linear programming problem:
Max tφ ),...,1( Nt ∈ (1)
s.t tjnj
N
nn xx ≤∑
=1λ Jj ,...,1= Nn ,...,1= (2)
ttn
N
nn yy φλ ≥∑
=1(3)
11
=∑=
N
nnλ (4)
0≥nλ . (5)
2 Hay et al. (1994) find that in late 1980s, the SOEs paid closer attention to cost reduction.

7
This BCC model allows increasing, constant, or diminishing returns to scale along the frontier of the
production possibility set at different levels of inputs.
4. The Empirical Analysis
A. Data Construction
Our panel data come from a survey of activities of 769 SOEs in four provinces (Jiangsu, Jilin,
Shanxi,, and Sichuan) that was carried out by the Chinese Academy of Social Science in 1990. For each
SOE, there are 10 annual observations for 321 quantitative variables over 1980-1989 and a questionnaire
completed by managers of these firms. In essence, the survey consists of a set of accounting statements
including profit statements, production and sales statements, personal and wage statements, and balance
sheets, in which each element can be checked against others.
We consider a single-output, 4-input technology for the firms under investigation. The inputs
included are: (a) labor, (b) capital, (c) materials, and (d) energy. The input-output variables are defined as
follows.
We use gross industrial output in constant 1989 price, rather than value added. The firm-specific
deflator comes from the variable “output in 1980 constant price”. Productive labor includes production
workers and apprentices, and purchasing and marketing personnel. Management and technical personnel
were regarded as non-production workers and were excluded. Gross capital-in-use measures productive
capital. Though the data are available, we do not use net capital-in-use, because the depreciation rates
applied were arbitrary and would not accurately reflect the extent of capital consumption. Because our
efficiency measures are based on yearly cross- section data, if the rate of capacity utilization within any one
year is assumed to be equal across all firms in any particular industry, use of gross capital in-use would not
affect relative efficiency measures. Raw materials are measured by deflating the expenditure on materials
by a material input price index. We construct the firm-specific composite price index for raw materials,
using quantity and price information of two main input materials available in the survey. The energy input
quantity equals the expenditure on energy divided by an energy price index The survey does not give price
information for energy. We use the energy price information available in China Statistical Yearbook 1998.
Because during 1980-1989, the central government still set price for energy across the country, firm-
specific prices of energy were not needed.
Our construction of key variables takes into account the existence of a “dual track” price system.
Coexistence of a “plan price” side by side with a “market price” for planned goods required careful
construction of a composite price index for each firm, because the portion of materials purchased from
market and the portion of output sold to market varied from firm to firm. Availability of detailed price
information of materials in the survey enabled us to construct the composite firm-specific price indexes for
both output and raw materials. Following Li (1997), we measure both output and raw materials in constant
1989 composite prices. In order to calculate the deflator for capital, we use the information in the
questionnaire about inflation rates for equipment estimated by the managers. The deflator, thus, is firm
specific rather than aggregate like the one used in Li (1997). This is justified on two grounds. First, because

8
almost all the firms in the survey were established before 1980, their capacity was mainly expanded by
upgrading their equipment, rather than constructing new buildings. Changes in buildings prices had little
effect on the value of their capital. Second, prices of building materials and wages of construction workers
varied greatly across regions, mainly because of great variation in prices of locally produced building
materials. A single aggregate price for all firms in each year is a rough approximation and would be
inappropriate.
B. DEA Results
For measurement of technical efficiency, the observations were cross classified by year and
industry group. A BCC DEA model was solved for each firm in any year with reference to the relevant
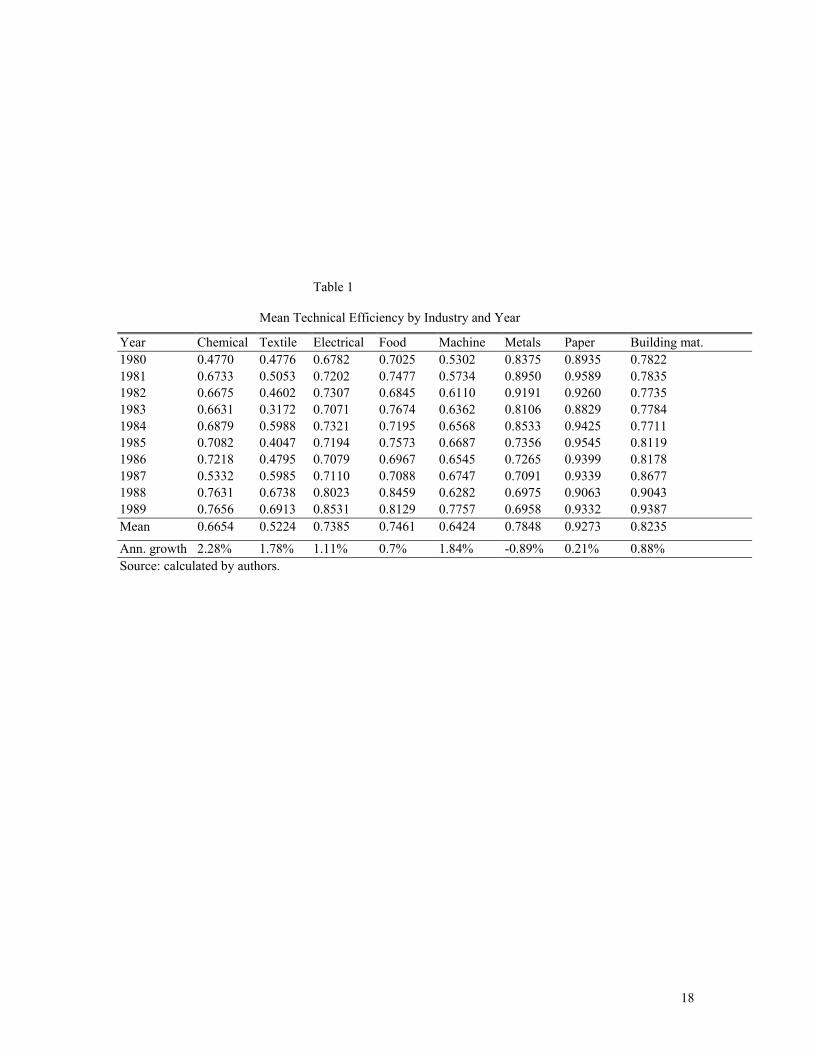
cross section data for that specific industry. Table 1 reports the technical efficiency for each of eight
industries3 averaged over firms. Overall, the paper industry ranks highest with a mean efficiency of 92
percent, followed by an average efficiency of 82 percent in the building material industry, while the textile
industry scored the lowest with a mean of 52 percent. Both electrical equipment and food industries have
average technical efficiency of about 74 percent.
Considerable variation exists in annual rates of growth in technical efficiency across industries.
Chemicals had the lowest average efficiency in 1980, and experienced the highest average annual growth
rate of 2.3 percent. Textiles and machine manufacturing had annual growth rates of over 1.75 per cent
while electrical equipment also improved in efficiency at an annual rate of over 1 per cent. Food paper, and
building materials experienced only marginal growth in technical efficiency. Metal industry is the only one
that experienced decline. The industries with lower efficiency in 1980 generally gained more than those
with higher efficiency in the1980. There is, thus, some evidence of convergence in technical efficiency
across industries over the 1980s.
Figure 1 shows the trends in technical efficiency for each of the eight industries over the sample
years. A notable feature is the large fluctuation in technical efficiency in the textile industry during 1982-
1987. The textile industry is relatively labor-intensive and requires less capital compared to the other
industries. After 1978, the central government encouraged local governments to build new textile
enterprises in order to increase employment4. Several years later, township governments began to found
town and village enterprises (TVEs) in textiles and metal processing. The SOEs in the textile industry
3 We regroup the firms from the 24 three digit industries into 8 categories. Food industry includes food,beverage, and feed manufacture. Textile industry includes textile, apparel and leather, fur and otherclothing manufacture. Paper industry includes paper and its product, cultural and teaching productmanufacture, printing, and crafts. Chemical industry includes chemicals, pharmaceuticals, synthetic fibers,and rubber and plastic industry. Building material industry includes building material and other non-metalproducts industry. Metal industry includes nonferrous metals and other non-metal minerals. Machineryindustry includes machine and transport equipment manufacturing. Electric equipment industry includeselectronic equipment, communication equipment, and meteorological equipment manufacturing.4 There were two major sources of employment pressure. One was from the millions of people ready to jointhe labor force; the other was from the millions who were sent to countryside under Mao’s re-educationpolicy and were returning back to city.

9
negatively affected by the new competition and only gradually restructured and recovered. Similarly, a
downward trend is found in the technical efficiency in metallurgy that fluctuated during 1983-1985. The
food industry also experienced ups and downs over most years.
Competition from TVEs had an effect on the efficiency of SOEs. Because the textile industry has
lower barriers to entry, it was the first to witness entry by TVEs. Faced with this new competition, the
SOEs in this industry went through some initial adjustment, which lowered their technical efficiency. They
improved their technical efficiency only gradually. On the other hand, in the metal industry, the SOEs did
not recover from the negative effects of competition during the survey period.
The two studies most directly comparable with ours are Liu and Liu (1996) and Zheng, Liu, and
Bigsten (1998). Liu and Liu measured technical efficiency from an estimated.stochastic frontier production
function using the same survey data set. Except for food and chemicals, their measures of technical
efficiency are generally lower than ours. Moreover, they find evidence of productivity decline in textiles
and productivity growth in metals, directly contrasting our findings. Also, their results show quite different
patterns of the changes in technical efficiency over years.
Several possible factors may explain these differences. First, their reference technology is
specified as a stochastic Cobb Douglas production frontier while we use a nonparametric frontier. In
gener,al DEA measures of efficiency are higher than stochastic frontier measures obtained from the same
data. Second, they use value added rather than gross output. Also, their measure of capital differs from
ours. Nevertheless, despite specific differences in results both studies conclude that technical efficiency
was higher in most industries in the later half of the 1980s.
Zheng, Liu, and Bigsten use DEA to examine difference in technical efficiency of firms by
ownership structure. They pool SOEs, collectively owned enterprises (COEs), and TVEs and analyze the
data for 1986-90. Their measure of average technical efficiency for SOEs across all industries covered and
over their entire sample period is 0.77, comparable to what would be obtained from our DEA results for the
same time period. Their coverage of industries is somewhat different from ours, however. When we look
into specific industries, results do differ. For textiles, their average of 82 percent efficiency is
understandably higher than our comparable average of about 62 percent because they include the COEs and
TVEs, which are more efficient than the SOEs. Similar differences emerge for metals. For electricals and
chemicals the two studies obtain comparable levels of mean efficiency. For paper, their overall measure of
82 per cent for all types of firms is lower than our average of over 90 per cent for the comparable period
(1986-89) for SOEs alone.
Findings from the Tobit Regression
In nonparametric studies of efficiency using DEA, it is common practice to estimate a second
stage regression model explaining variation in the measured efficiency scores in terms of a number of
relevant environmental variables that affect the performance of a firm. Given that the technical efficiency

10
measures are bounded from above at unity, we estimate a Tobit regression for limited dependent variables
instead of the usual regression.
We specify a regression model including a number of explanatory variables pertaining to different
aspects of the economic reforms along with a number of other relevant variables. Our objective is to
determine whether the economic reform led to any improvement in the level of technical efficiency in the
SOEs, as expected, and, if so, which specific aspects of the reforms had a significant effect on efficiency.
We treat the technical efficiency score as the dependent variable and a number of SOEs’ attributes
and reform policy variables as regressors. The explanatory variables can be broadly categorized as those
related to (a) different aspects of the reforms directly or indirectly, (b technology, (c) attributes of the firm,
and (d) fixed effects related to time and geographical location.
The variables directly related to the reforms included: (i) the bonus-wage ratio, (ii) the type of
management control, and (iii) the tax ratio. Variables indirectly related to the reforms include: (i) the level
of government owning the enterprise and (ii) the ratio of output and input prices. The technology variables
include (i) capital per worker and (ii) ratio of non-production to production workers. The attributes
included are (i) firm size and (ii) its industrial classification.
The bonus to wage ratio (BWR), measured by the ratio of bonus to the fixed wage paid to workers,
is often regarded as the most crucial of the reform variables and captures the incentive effect directly. We
also include a squared term to capture possibly nonlinear effects.
The SOEs in the sample can be broadly grouped into four different categories according to the
type of management control: (a) director-responsibility, (b) contract responsibility, (c) a combined
category of share, leasing, or asset-management responsibility, and (d) old style bureaucratic control. We
include three dummy variables for different types of management control : DC-Contract for contract
responsibility, DC-nochange for old style management, and DC-Combined for the mixed category. The
director-responsibility system was treated as the reference category.
The tax ratio (TRATIO), defined as a ratio of total tax liability over value-added, captures the
effect of taxes on technical efficiency. Total tax liability includes turnover tax and income tax. We treat
profit remittance to the government before 1984 as a tax liability of firms, because, no enterprise income
tax existed across China before 1984. Comparison over years would be misleading if we consider only the
income tax that came into existence after the 1984 reform. Furthermore, the contract system implemented
gradually after 1986 also contracts the overall tax liability including income tax and turnover tax.
The SOEs are by definition government owned. Ownership of individual enterprises is, however,
vested at different levels of government in the political hierarchy . These range from a ministry of the
central government at the national level down to a local county government within a city. McAffee and
McMillan (1991) argue that informational distortions increase as information moves up a hierarchy. Also,
the closer is the ultimate decision-maker to the production floor the more effective are the incentives to the
workers. But, at the same time, in the case of a firm that is owned by the local government, there may be
political considerations against downsizing or closing an inefficient enterprise. We treat the county

11
government as the reference category and include specific dummy variables for the central government
(DG-Central), the provincial government (DG-Provincial), and the city government (DG-City).
The market power of a firm is usually measured by its mark-up ratio, (i.e., the ratio of price to
marginal cost). Unfortunately, in our case, the marginal cost is not observable. We, therefore, following Li
(1997), use the ratio of output price to input price (ROPIP) as a proxy measure of market power. Given that
the reforms allowed the market to play a significant role in the operating environment of a firm, we include
this variable in the model explaining changes in technical efficiency.
Among the technology variables, the capital-labor ratio (RKL) is included for several reasons.
First, the degree of automation of the production process closely relates to the technical efficiency of a
firm, because production lines determine the pace of production. Higher automation usually requires a
higher capital-labor ratio. Second, workers with more capital usually work more efficiently because they
can perform simpler and repeated job. We also include a quadratic term to allow nonlinearity.
The other technology variable is the proportion of non-productive workers in total employment
(PNPW). Conventional wisdom suggests that a greater proportion of non-productive workers reflects a
more unwieldy bureaucracy. Hence, it may be expected to have a negative effect on efficiency. At the same
time, over the years, the SOEs have provided a range of social services to their employees and many
employees work to provide these services. In defining total employment, we include only production
workers and marketing personnel and exclude management and technical personnel, because it is difficult
to estimate how many management and technical personnel in the SOEs work on non-production activity.
The survey groups the SOEs into three different size categories: small, medium, and large. We
include two dummy variables – DS-Large and DS-Medium – for large and medium sized firms. The
smallest size group is treated as the reference group.
The SOEs represent 8 different industry groups as explained earlier. We treat the electrical
equipment industry as the base category and include 7 dummy variables for the other industries.
Apart from these explanatory variables, we include year dummy variables (with the year 1989 as
base) and three region dummy variables for the provinces of Jiangsu, Jilin, and Shanxi, respectively, with
Sichuan treated as the base.
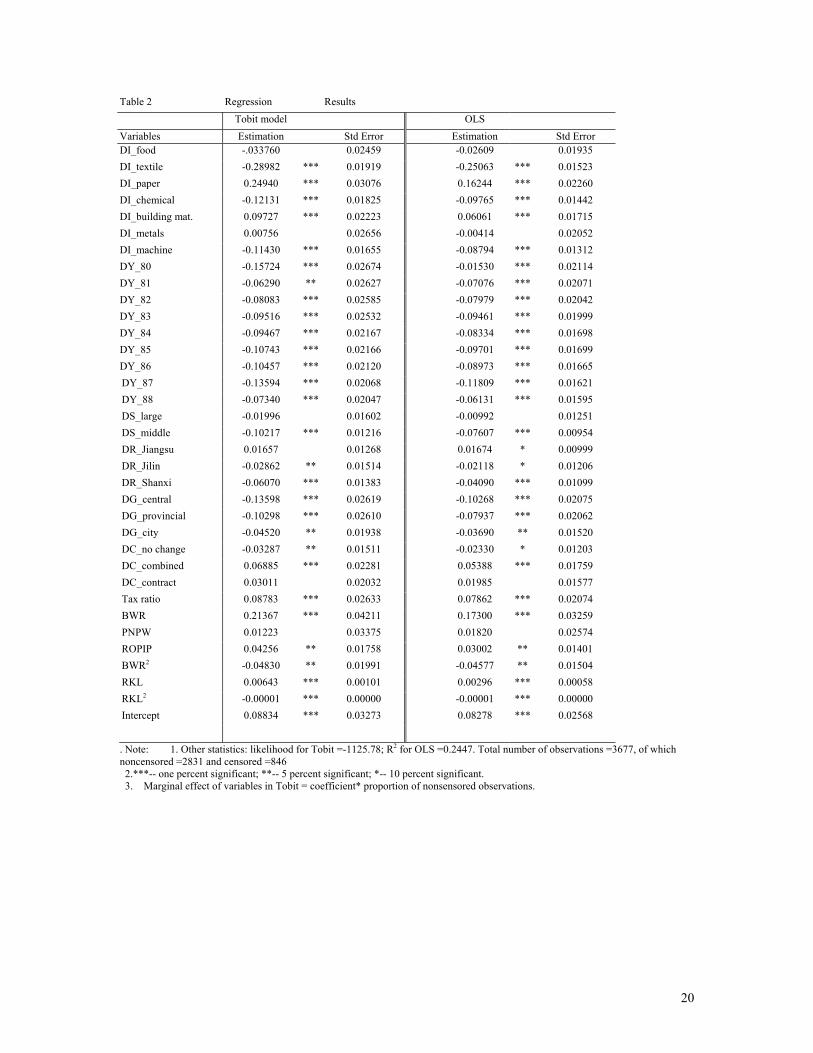
Table 2 reports the estimated coefficients from Tobit and OLS regressions for comparison.
Coefficients of the industry dummies show considerable variation. The difference in average technical
efficiency between the paper industry and textile industry is 0.4152, over 40%5 holding all other factors
constant. The paper industry has the highest average efficiency, followed by construction material, electric
equipment and metallurgy, machinery, chemical and textile in descending order. The difference in average
levels of technical efficiency in metallurgy and machinery industries is not statistically significant.
The bonus-wage ratio (BWR) has the largest and positive effect on technical efficiency. This
confirms Groves et al. (1994) and Liu and Liu (1996). Marginally, the bonus ratio at unity can promote
5 Marginal effect is calculated by the formula: coefficients*(number of noncensored observations / totalnumber of observations).

12
technical efficiency about 13 percent. A negative sign of the quadratic term indicates a diminishing
marginal effect of bonus. When the bonus ratio is at about 2.21, the effect of bonus reaches its peak.
Overall, the result indicates that the bonus system provided strong incentives to workers in the 1980s.
The capital-labor ratio (RKL) makes large positive contributions to technical efficiency. On
average, a 10,000 yuan increase in capital for each production worker can induce a 0.5 percent increase in
technical efficiency. The negative sign and small value of squared capital labor ratio indicates a slowly
diminishing effect. Technical efficiency continues to increase with the capital-labor ratio up to the level of
321,000 yuan of capital per worker.
The ratio of non-production workers to production workers (RNPW) has no significant impact on
technical efficiency. This possibly implies that the positive effects of the social services provided by the
non-production workers neutralize any detrimental effects of a large bureaucracy.
The tax ratio has a large and positive effect on technical efficiency. On average, a 10 percent
increase in average tax rate promotes a 0.68 percent increase in technical efficiency. This is at odds with
conventional wisdom in a market economy. SOEs with lower tax burdens, however, generally have more
restricted access to resources under government control such as cheaper loans, planned material supplies,
and foreign currency. In contrast, the government offers more resources to SOEs with a higher tax burden.
Until 1984, the government took most of the profits and offered SOEs grants for financing investment. Our
result implies that the tax rate may be highly correlated with preferential treatment received by SOEs from
the government. This, we must acknowledge, is only a speculation.
The levels of government administration of the SOEs have a great effecton technical efficiency.
Coefficients of the relevant dummy variables are all statistically significant. The result shows that county
government is 10.47 percent more efficient than the central government that scores lowest. Efficiency of an
SOE owned by a provincial government is only 2.5 percent higher than that of one owned by the central
government but about 4.4 percent worse than one owned by a city government. This lends support to the
conclusion of McAfee-McMillan (1991). Our results strongly suggest that decentralization improved
efficiency in the 1980s in China.
The output-material price ratio (ROPIP) contributes positively to technical efficiency as expected.
A 10 percent increase in the ratio on average can raise technical efficiency by 0.33 percent. A higher
output-material price ratio not only means higher profit margin for the enterprises, more bonuses, and better
welfare for workers, but also means higher demand for goods produced by the SOEs. In 1980s, output price
grew slower than material price in manufacture sector. Thus the output-material price ratio actually reduces
technical efficiency.
The coefficient of the dummy variable is negative and statistically significant for the middle size
but not significant for the large size class. Thus, small and large SOEs do not differ in technical efficiency
but the middle sized enterprises are less efficient. There are several possible explanations. The government
adopted discriminatory tax and credit policies toward different sizes of firms. China’s industrial policy
emphasized development of large firms. Large firms, in general, paid more taxes and had easy access to

13
credit. In contrast, small firms paid fewer taxes and had less access to credits. At the same time, large firms
were under tighter government control and suffered more interference from government bureaucrats. Small
firms were subject to harder budget constraints and had stronger incentives to operate efficiently.
Moreover, they faced much less bureaucratic interference compared to large firms. Overall their specific
advantages and disadvantages must have put the large and the small enterprises on a par. The middle-sized
SOEs had much less protection than the large firms and the same time less autonomy than small firms Even
though smaller than large firms, they are large enough to cause harm to the regional economy if a medium
sized firm is closed. In that sense, they are too large to fail. As a result, they had only limited freedom to
enforce cost cutting measures by downsizing.
The location of the enterprises also makes a little difference on technical efficiency. The survey
was carried out in four provinces, Jiangsu, Jilin, Shanxi and Sichuan. We set Sichuan as the base. The
result contradicts the general perception that the coastal province Jiangsu performs better than inland
province Sichuan. There are two possible causes. First the coastal province Jiangsu, next to the largest
industrial city Shanghai, was a dynamic region in the 1980s. But this general perception ignores the
unbalanced nature of development within Jiangsu. South Jiangsu has been one of fastest developing
regions, while North Jiangsu languishes at the same development level as many inland provinces. Because
the survey samples SOEs from various districts of a province, it shows the performance of the whole of
Jiangsu, not merely the southern region. Second, the survey includes a high proportion of large SOEs and
Sichuan has the greatest number of large SOEs in the country. This may cause over-estimation of the
average technical efficiency in Sichuan. SOEs in Jilin and Shanxi are 2.16 percent and 4.7 percent less
efficient than in Jiangsu and Sichuan respectively. A note of caution is in order here. Shanxi is the home of
coal mining industry. However, we exclude mining from our analysis due to numerous missing values. This
may lead to lower estimated average technical efficiency in the province.
The coefficients of the year dummy variables trace the fluctuation in technical efficiency over
years. The difference between the coefficients for adjacent years shows the change in average efficiency
between those years. The year 1981 shows the greatest annual increase in technical efficiency in the 1980s,
at a rate of more than 6.93 percent, while the following two years, 1982 and 1983 show a slight decline.
1984 sees almost no gain while 1985 experiences a loss of one percent. There is a tiny increase in 1986 and
a more than 2.3 percent decrease in 1987. The technical efficiency improves significantly in 1988 and 1989
at a rate of 4.77 percent and 5.62 percent, respectively. The annual average rate of improvement in
technical efficiency is about 1.21 percent, which is slightly lower than the 1.6 percent estimated by Liu and
Liu (1996).
This pattern is consistent with China’s gradualist reform in the 1980s. Rawski (1996, p. 190) noted
that in China “reform unfolds as a process replete with interactions among governments, enterprises,
workers and consumers rather than a sequence of events in which the state makes decisions to which
businesses and individuals react”. When the economy overheated and technical efficiency fell, the
government responded with new initiatives of reform so as to maintain macroeconomic stability and

14
improve efficiency. At the beginning, in the early 1980s, the bonus system had impressive and quick
effects as observed in Liu and Liu (1996) and Zhuang and Xu (1996), but gradually lost its effectiveness.
Equalization of bonus payments to all workers unlinked to workers’ productivity was the major cause.
Other reform measures also seem to be ineffective in the middle 1980s. Reforms in taxation and investment
in 1984 did show some effect. But in 1985, there was a 1.2 percent decline in technical efficiency. The
government then introduced the management contract system in 1986. That seemed to be working in 1986.
A dip in technical efficiency in 1987 pushed the government to popularize the contract system. The
contract system seems to have been effective in 1988 and 19896. Of course, we do not attribute all
improvements in technical efficiency to the contract system, because various reform measures had
penetrated into every facet of SOEs by the late 1980s. Nonetheless, the reforms eventually led to significant
gains in technical efficiency of SOEs.
A comparison with the trend of the whole state industry sector reveals more interesting results.
Graph 2 shows a negative relation between the output growth in the whole state industrial sector and the
technical efficiency during 1981-1987. When the output grows at a rapid pace, technical efficiency
declines. There appears to be a structural change, however, in 1987. In 1988 when output grows, technical
efficiency increases as well, while in 1989 output decreases sharply, technical efficiency almost still
increases. The divergence of output growth rates for the SOEs in the survey from overall mean of growth
rate in state industrial sector may be associated with the fact that the survey over-represents large- and
middle-sized SOEs and that the selected SOEs do not represent proportionally all industries.
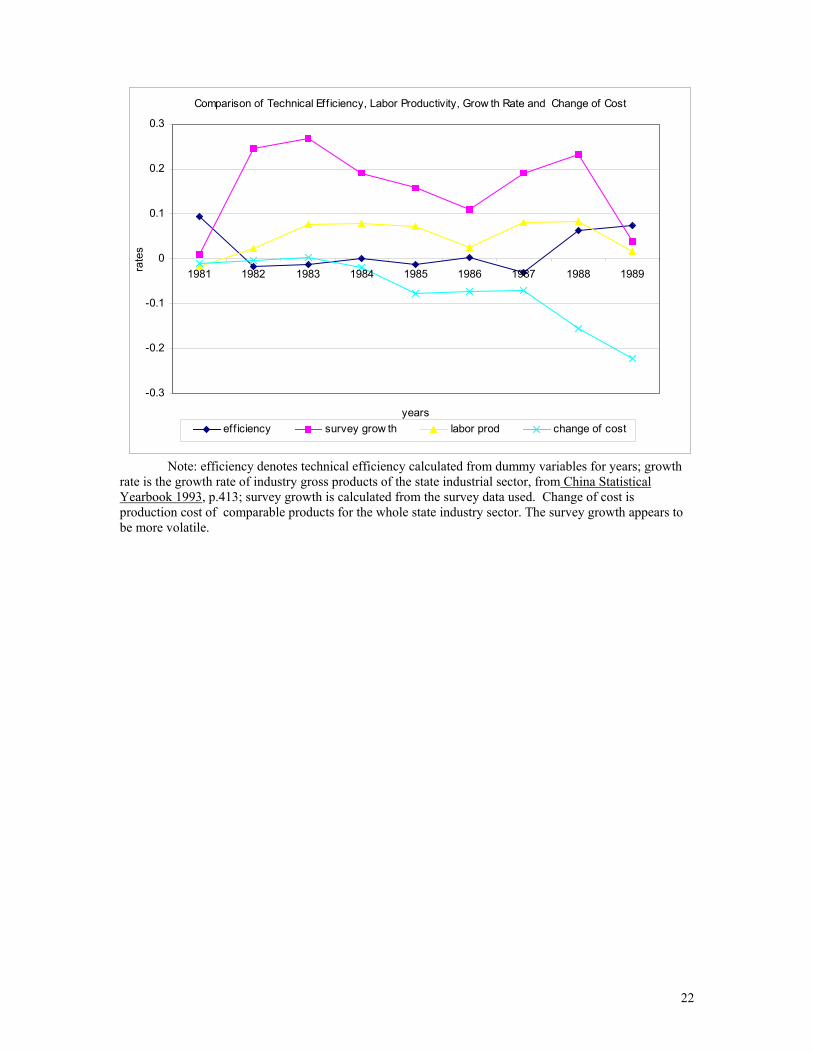
Graph 3 includes four different series showing (a) labor productivity, (b) production cost of
comparable products for the whole state industry sector ,(c) technical efficiency, and (d) growth of output
of the sample firms. It shows that the labor productivity is positively and closely related to output growth.
A comparison of the two series, technical efficiency and the cost of comparable products for the state
sector, reveals that technical efficiency is closely and negatively related to cost reduction by the SOEs.
When SOEs reduce cost more, their technical efficiency improves more. This relation is even more obvious
in 1988 and 1989 when SOEs stepped up their cost cutting efforts.
The contract system (DC) has been quite effective in promoting technical efficiency. Firms under
the contract system achieved at least 2.53 percent higher technical efficiency. Furthermore, different
contract system has different effect on technical efficiency. As expected, firms under the lease, stock,and
capital management responsibility system perform better than firms under contract responsibility system.
Their difference in technical efficiency is about 3 percent. The contract responsibility system is statistically
indifferent from factory director responsibility system. Our result is at odds with Huang and Kalirajan
(1998). They find that contract system did not work. They acknowledged, however, that this might be due
to their small sample size (only 67 firms).
6 The contract system was abolished in 1994 in favor of formal and stable relationship between thegovernment and the SOEs.

15
Our results have general implications for reforms of a state industrial sector in a transition
economy. First, piecemeal reform such as the introduction of the bonus system by itself can be effective
over a short period, but cannot result in any sustainable improvement in technical efficiency. Second,
substantial gains in technical efficiency come only after partial reforms accumulate to a critical mass.
Reform measures do require certain time to take effect. Thus, we need to take a long-term view.
6. Conclusions
In this paper, we apply DEA to examine the technical efficiency of a sample of SOEs in the 1980s.
We find that technical efficiency in SOEs as a whole improved in the 1980s, but not steadily over years.
The fluctuation in technical efficiency in various industries over years is closely related to competition and
entry of new firms. Textile, food and metallurgy were more competitive and had entry by more new firms.
These industries experienced greater fluctuation in technical efficiency than the other industries.
The Tobit regression analysis reveals how different aspects of the reforms affected levels of
technical efficiency of the SOEs. The bonus system made the greatest positive contribution to improving
technical efficiency. Second, various managerial contract systems made different degrees of positive
contribution to technical efficiency. Among the various systems, the lease, stock, and asset management
system contributed the most, while the contract management system and the factory director responsibility
system are equally effective. This result confirms the serious concern about soft-budget constraint. Third,
firms under the administration of a lower level government had higher technical efficiency. Fourth, middle-
sized SOEs had lower technical efficiency than small- and large-sized SOEs, but the latter two size classes
had the same average efficiency.
Our findings indicate that it is possible to improve technical efficiency without privatization on a
large scale and appropriate reforms can successfully improve technical efficiency of SOEs. Our study also
shows that the market mechanism can function side by side with predominant state ownership of industries
at least in the short run. One can only speculate if the SOEs would have functioned even more efficiently if
they were privatized altogether. But, at least, the Chinese experience shows the viability of a middle ground
between the chaotic reforms in the former Soviet Union and old style business-as-usual under a socialist
bureaucracy.
Bibliography
Banker, R.D., A. Charnes, and W.W. Cooper 1984. "Some Models for Estimating Technical and ScaleInefficiencies in Data Envelopment Analysis." Management Science, 30: 9, 1984, pp 1078-1092.
Charnes, A., W.W. Cooper and E. Rhodes 1978, “Measuring the Efficiency of Decision-Making Units.”European Journal of Operation Research, 2:6, 429-44.
Charnes, A., W. Cooper, A.Y. Lewin and L. M. Seiford, “Introduction.” In Charnes, A., W. Cooper, A.Y.Lewin, and Lawrence M. Seiford, eds., Data Envelopment Analysis: Theory, Methodology and Application.Boston / Dordrecht /London, Kluwer Academic, 1994. 3-22.

16
Chen, Derong, Chinese Firms between Hierarchy and Market: The Contract Management ResponsibilitySystem in China. St. Martin Press, 1998.
Chen, K.W., Hongchang, Z. Yuxin, B.Jefferson, &T. Rawski, “Productivity Change in Chinese industry:1953-1985.” Journal of Comparative Economics, December, 12(4), 1988, 570-591.
Granick, David, Chinese State Enterprises: A Regional Property Rights Analysis. Chicago and London:The University of Chicago Press, 1990.
Grove, Theodore, Yongmiao Hong, John McMillian and Barry Naughton, “Autonomy and Incentives inChinese State Enterprises.” Quarterly Journal of Economics, February 1994, 109(1), 183-209.
____, “China’s Evolving Managerial Labor Market.” Journal of Political Economy, August 1995, 103 (4),873-92.
Hay, Donald, Derek Morris, Guy Liu, and Shujie Yao, Economic Reform and State Owned Enterprises inChina, 1979-1987. Oxford University Press, 1994.
Hussein, Athar and Zhuang, Juzhong, “Pattern and Causes of Loss-Making in Chinese State Enterprises.”Working paper, Economic and Social Research Council, London School of Economics, 1996.
Jefferson, Gary H., “China’s State Enterprises: Public Goods, Externalities, and Coase.” AmericanEconomic Review, Vol. 88, No. 2, May, 1998, 428-432.
____., “China’s iron and steel industry: sources of enterprise efficiency and the impact of reform.” Journalof Development Economics 33: Oct. 1990, 329-55.
Jefferson, G. H., T. G. Rawski, & Y. Zheng, “Growth, Efficiency, and Convergence in China’s State andCollective industry.” Economic Development and Cultural Change, 40(2), 1992, 239-266.
Jefferson, G.H., & T. G. Rawski, “Enterprise Reform in Chinese industry.” Journal of EconomicPerspectives, Spring 1994, 47-70.
Li, Wei. “The Impact of Economic Reform on the Performance of Chinese State Enterprises, 1980-1989.”Journal of Political Economy, Vol. 105., No. 5, 1997, 1080-1106.
Liu Zinan and Guy Shaojia Liu. “The Efficiency Impact of the Chinese Industrial Reforms in the 1980’s.”Journal of Comparative Economics, 23, 237-255, 1996.
McAfee, R. Preston, and McMillan, John, “ Organizational Diseconomies of Scale.” mineo, University ofCalifornia, San Diego, 1991.
Naughton, Barry. Growing Out of the Plan: Chinese Economic Reform, 1978-1993. Cambridge UniversityPress, 1995.
Rawski, Thomas G. “An Overview of Chinese Industry in the 1980s.” In Gary H. Jefferson and InderjitSingh, eds. Reform, Ownership, and Performance in Chinese Industry, 1998.
____,. “Chinese Industrial Reform: Accomplishment, Prospects, and Implications.” American EconomicReview, Papers and Proceedings, Vol. 84, No. 2, 1994.
Shirley Mary and Lixin Colin Xu. “Empirical Effects of Performance Contracts: Evidence from China.”Working Paper, The World Bank, THE World Bank.

17
State Statistical Bureau, China Statistical Yearbook. China Statistical Publishing Press, issues 1990-1998.
Huang Yiping and Kalirajan K. P.. “Enterprise Reform and Technical Efficiency of China’s State OwnedEnterprises.” Applied Economcs 30, 585-592, 1998.
Zheng Jinghai, Xiaoxuan Liu and Arne Bigsten, “Ownership Structure and Determinants of TechnicalEfficiency: An Application of Data Envelopment Analysis to Chinese Enterprises (1986-1990).” Journal ofComparative Economics, 26, 1998, 465-484.
Zhuang Ju Zhong and Chenggang Xu. “Profit-Sharing and Financial Performance in the Chinese StateEnterprises: Evidence from Panel Data.” Economics of Planning, 29(3), 205-22, 1996.
18
Table 1
Mean Technical Efficiency by Industry and Year
Year Chemical Textile Electrical Food Machine Metals Paper Building mat.1980 0.4770 0.4776 0.6782 0.7025 0.5302 0.8375 0.8935 0.78221981 0.6733 0.5053 0.7202 0.7477 0.5734 0.8950 0.9589 0.78351982 0.6675 0.4602 0.7307 0.6845 0.6110 0.9191 0.9260 0.77351983 0.6631 0.3172 0.7071 0.7674 0.6362 0.8106 0.8829 0.77841984 0.6879 0.5988 0.7321 0.7195 0.6568 0.8533 0.9425 0.77111985 0.7082 0.4047 0.7194 0.7573 0.6687 0.7356 0.9545 0.81191986 0.7218 0.4795 0.7079 0.6967 0.6545 0.7265 0.9399 0.81781987 0.5332 0.5985 0.7110 0.7088 0.6747 0.7091 0.9339 0.86771988 0.7631 0.6738 0.8023 0.8459 0.6282 0.6975 0.9063 0.90431989 0.7656 0.6913 0.8531 0.8129 0.7757 0.6958 0.9332 0.9387Mean 0.6654 0.5224 0.7385 0.7461 0.6424 0.7848 0.9273 0.8235
Ann. growth 2.28% 1.78% 1.11% 0.7% 1.84% -0.89% 0.21% 0.88%Source: calculated by authors.

19
Source: based on Table1.
Graph 1 Technical Eff iciency 1980-1989
0.30
0.40
0.50
0.60
0.70
0.80
0.90
1.00
1980 1981 1982 1983 1984 1985 1986 1987 1988 1989
effic
ienc
y
Chemical Textile Electrical Food Machine Metals Paper Building mat.
20
Table 2 Regression ResultsTobit model OLS
Variables Estimation Std Error Estimation Std ErrorDI_food -.033760 0.02459 -0.02609 0.01935DI_textile -0.28982 *** 0.01919 -0.25063 *** 0.01523DI_paper 0.24940 *** 0.03076 0.16244 *** 0.02260DI_chemical -0.12131 *** 0.01825 -0.09765 *** 0.01442DI_building mat. 0.09727 *** 0.02223 0.06061 *** 0.01715DI_metals 0.00756 0.02656 -0.00414 0.02052DI_machine -0.11430 *** 0.01655 -0.08794 *** 0.01312DY_80 -0.15724 *** 0.02674 -0.01530 *** 0.02114DY_81 -0.06290 ** 0.02627 -0.07076 *** 0.02071DY_82 -0.08083 *** 0.02585 -0.07979 *** 0.02042DY_83 -0.09516 *** 0.02532 -0.09461 *** 0.01999DY_84 -0.09467 *** 0.02167 -0.08334 *** 0.01698DY_85 -0.10743 *** 0.02166 -0.09701 *** 0.01699DY_86 -0.10457 *** 0.02120 -0.08973 *** 0.01665DY_87 -0.13594 *** 0.02068 -0.11809 *** 0.01621DY_88 -0.07340 *** 0.02047 -0.06131 *** 0.01595DS_large -0.01996 0.01602 -0.00992 0.01251DS_middle -0.10217 *** 0.01216 -0.07607 *** 0.00954DR_Jiangsu 0.01657 0.01268 0.01674 * 0.00999DR_Jilin -0.02862 ** 0.01514 -0.02118 * 0.01206DR_Shanxi -0.06070 *** 0.01383 -0.04090 *** 0.01099DG_central -0.13598 *** 0.02619 -0.10268 *** 0.02075DG_provincial -0.10298 *** 0.02610 -0.07937 *** 0.02062DG_city -0.04520 ** 0.01938 -0.03690 ** 0.01520DC_no change -0.03287 ** 0.01511 -0.02330 * 0.01203DC_combined 0.06885 *** 0.02281 0.05388 *** 0.01759DC_contract 0.03011 0.02032 0.01985 0.01577Tax ratio 0.08783 *** 0.02633 0.07862 *** 0.02074BWR 0.21367 *** 0.04211 0.17300 *** 0.03259PNPW 0.01223 0.03375 0.01820 0.02574ROPIP 0.04256 ** 0.01758 0.03002 ** 0.01401BWR2 -0.04830 ** 0.01991 -0.04577 ** 0.01504RKL 0.00643 *** 0.00101 0.00296 *** 0.00058RKL2 -0.00001 *** 0.00000 -0.00001 *** 0.00000Intercept 0.08834 *** 0.03273 0.08278 *** 0.02568
. Note: 1. Other statistics: likelihood for Tobit =-1125.78; R2 for OLS =0.2447. Total number of observations =3677, of whichnoncensored =2831 and censored =846 2.***-- one percent significant; **-- 5 percent significant; *-- 10 percent significant. 3. Marginal effect of variables in Tobit = coefficient* proportion of nonsensored observations.

21
Note: efficiency –technical efficiency of sample SOEs; growth rate – growth rate of the whole state industrial sector; survey growth – growth rate of the sample SOEs.
Graph 2 Grow th Rate and Technical Eff iciency
-0.05
0
0.05
0.1
0.15
0.2
0.25
0.3
1981 1982 1983 1984 1985 1986 1987 1988 1989
year
rate
s
ef f iciency grow th rate survey grow th
22
Note: efficiency denotes technical efficiency calculated from dummy variables for years; growthrate is the growth rate of industry gross products of the state industrial sector, from China StatisticalYearbook 1993, p.413; survey growth is calculated from the survey data used. Change of cost isproduction cost of comparable products for the whole state industry sector. The survey growth appears tobe more volatile.
Comparison of Technical Eff iciency, Labor Productivity, Grow th Rate and Change of Cost
-0.3
-0.2
-0.1
0
0.1
0.2
0.3
1981 1982 1983 1984 1985 1986 1987 1988 1989
years
rate
s
ef f iciency survey grow th labor prod change of cost

23